120
2016 Annual Report

2016
AnnualReport

Poweringdigitalpayments
2016 in brief
Business performance
Business strategy
Risk management
Governance
Financial statements
3
18
26
30
37
51
2016 IN BRIEFLetter to shareholders 3About Nets 6Our business model 9Financial summary 11Performance highlights 2016 13
BUSINESS PERFORMANCEMerchant Services 19Financial & Network Services 22Corporate Services 24
BUSINESS STRATEGY 26
RISK MANAGEMENT 30
GOVERNANCE Corporate governance 38Corporate Social Responsibility 44Shareholder information 49
FINANCIAL STATEMENTSStatement by the Board of Directors and Executive Management 52Independent auditor’s report 53Financial statements – Group 57Financial statements – Parent Company 113Group chart 117Glossary 118
Table of contents
A stronger Nets
Inge K. Hansen and Bo Nilsson
Letter to shareholders
Nets has undergone a significant transformation over the past few years. As a result of the transformation we are significantly more customer-focused and innovation-driven today than before. This enables us to onboard new customers faster, and to enter new markets and launch new solutions at a much faster pace within areas such as mobile payments, anti-fraud solutions and contactless payments. In 2016, Nets was also listed on Nasdaq Copenhagen. Through the capital raised from the listing, our financial position has been significantly improved, and our capability to pursue future growth and value creation has been further strengthened. Last but not least, Nets delivered strong financial results in 2016. We had strong organic growth of 7%, an EBITDA b.s.i. margin expansion of 260 basis points and significantly reduced leverage, ending the year at 3.2x NIBD/EBITDA b.s.i.
Nets Annual Report 2016 2016 in brief 3
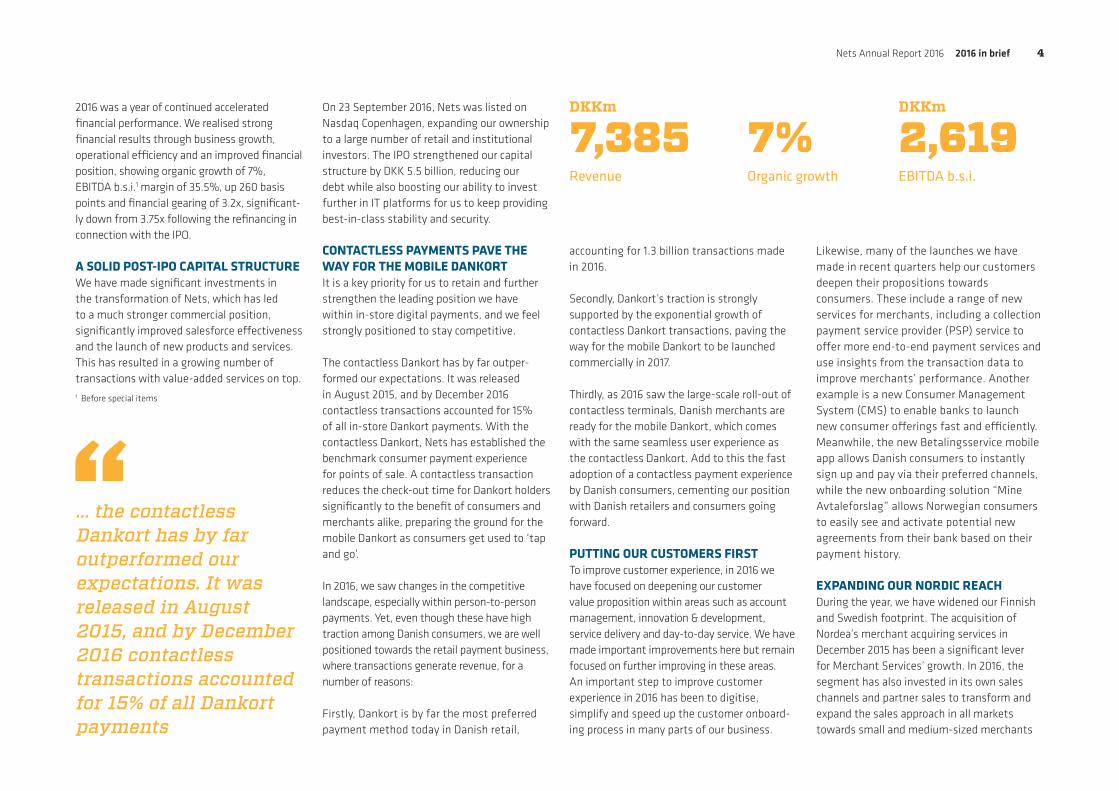
2016 was a year of continued accelerated financial performance. We realised strong financial results through business growth, operational efficiency and an improved financial position, showing organic growth of 7%, EBITDA b.s.i.1 margin of 35.5%, up 260 basis points and financial gearing of 3.2x, significant-ly down from 3.75x following the refinancing in connection with the IPO.
A SOLID POST-IPO CAPITAL STRUCTURE We have made significant investments in the transformation of Nets, which has led to a much stronger commercial position, significantly improved salesforce effectiveness and the launch of new products and services. This has resulted in a growing number of transactions with value-added services on top.
On 23 September 2016, Nets was listed on Nasdaq Copenhagen, expanding our ownership to a large number of retail and institutional investors. The IPO strengthened our capital structure by DKK 5.5 billion, reducing our debt while also boosting our ability to invest further in IT platforms for us to keep providing best-in-class stability and security.
CONTACTLESS PAYMENTS PAVE THE WAY FOR THE MOBILE DANKORTIt is a key priority for us to retain and further strengthen the leading position we have within in-store digital payments, and we feel strongly positioned to stay competitive.
The contactless Dankort has by far outper-formed our expectations. It was released in August 2015, and by December 2016 contactless transactions accounted for 15% of all in-store Dankort payments. With the contactless Dankort, Nets has established the benchmark consumer payment experience for points of sale. A contactless transaction reduces the check-out time for Dankort holders significantly to the benefit of consumers and merchants alike, preparing the ground for the mobile Dankort as consumers get used to ‘tap and go’.
In 2016, we saw changes in the competitive landscape, especially within person-to-person payments. Yet, even though these have high traction among Danish consumers, we are well positioned towards the retail payment business, where transactions generate revenue, for a number of reasons:
Firstly, Dankort is by far the most preferred payment method today in Danish retail,
accounting for 1.3 billion transactions made in 2016.
Secondly, Dankort’s traction is strongly supported by the exponential growth of contactless Dankort transactions, paving the way for the mobile Dankort to be launched commercially in 2017.
Thirdly, as 2016 saw the large-scale roll-out of contactless terminals, Danish merchants are ready for the mobile Dankort, which comes with the same seamless user experience as the contactless Dankort. Add to this the fast adoption of a contactless payment experience by Danish consumers, cementing our position with Danish retailers and consumers going forward.
PUTTING OUR CUSTOMERS FIRSTTo improve customer experience, in 2016 we have focused on deepening our customer value proposition within areas such as account management, innovation & development, service delivery and day-to-day service. We have made important improvements here but remain focused on further improving in these areas. An important step to improve customer experience in 2016 has been to digitise, simplify and speed up the customer onboard-ing process in many parts of our business.
Likewise, many of the launches we have made in recent quarters help our customers deepen their propositions towards consumers. These include a range of new services for merchants, including a collection payment service provider (PSP) service to offer more end-to-end payment services and use insights from the transaction data to improve merchants’ performance. Another example is a new Consumer Management System (CMS) to enable banks to launch new consumer offerings fast and efficiently. Meanwhile, the new Betalingsservice mobile app allows Danish consumers to instantly sign up and pay via their preferred channels, while the new onboarding solution “Mine Avtaleforslag” allows Norwegian consumers to easily see and activate potential new agreements from their bank based on their payment history.
EXPANDING OUR NORDIC REACH During the year, we have widened our Finnish and Swedish footprint. The acquisition of Nordea’s merchant acquiring services in December 2015 has been a significant lever for Merchant Services’ growth. In 2016, the segment has also invested in its own sales channels and partner sales to transform and expand the sales approach in all markets towards small and medium-sized merchants
Revenue
DKKm DKKm
EBITDA b.s.i.Organic growth
7,385 2,6197%
… the contactless Dankort has by far outperformed our expectations. It was released in August 2015, and by December 2016 contactless transactions accounted for 15% of all Dankort payments
1 Before special items
Nets Annual Report 2016 2016 in brief 4

and partners. This was helped along by a new onboarding process allowing merchants to become our customers within a matter of minutes or hours, and has led to strong results within cross-selling across our business.
Another example is the strong growth currently seen in online acquiring with merchants looking for ways to cut down on check-out time to avoid abandoned baskets. Our new card storage functionality, which was launched in October 2016, allows consumers to complete their purchase swiftly across more than 25,000 merchants. Consumers will be able to shop without compromising on security, using only three digits instead
of having to enter all card details at each purchase.
During the year, we also rolled out new card products and services within areas such as risk-based authentication in processing on behalf of credit card issuers, the launch of mobile wallets for banks and a Nordic HCE/tokenisation infrastructure, which is the backbone of NFC-based mobile payments. At the same time, our real-time fraud prevention solution received solid traction in the market. With online fraud on the rise, we are able to stop suspicious transactions prior to processing. This significantly limits the impact of card fraud on banks while creating a safer consumer experience.
Such developments underline our continued Nordic focus along with our commitment to digital innovation and value-chain expansion.
STAYING ON COURSEOperating efficiency and cost optimisation remain central to our performance. During 2016, driving the automation in customer services through the use of intelligent computer systems saw good progress, as did continuously identifying new productivity gains through end-to-end process excellence.
Competent people and leaders who promote a working culture of empowerment and customer orientation are prerequisites for a successful execution of our strategy. Thus a new leadership model was rolled out in late 2016, defining great leadership behaviour at all levels to role model our values, drive
Inge K. HansenChairman of the Board
Bo Nilsson Group CEO
DKKm
Adjusted net income
NIBD/EBITDA b.s.i.
997
3.2x
results and develop teams, while our corporate values Accountable, Customer Driven and Together (ACT) were revitalised to guide our daily decision-making, helping us manage with care.
All of this has ensured a stronger Nets that continously aims at creating value for customers, investors, partners and employees.
LOOKING AHEAD The performance of Nets in 2016 and our ability to deliver on our promises in 2017 are not least due to the hard work and dedication of our colleagues. On behalf of the Board and the Executive Management, we would like to thank our customers, shareholders and business partners for their continued collaboration, and everyone at Nets for their invaluable contribution to our 2016 results.
Our journey of continued transformation has led to increased commercialisation, improved sales force effectiveness and consequently a growing number of transactions with value-added services on top
Nets Annual Report 2016 2016 in brief 5
Nets Holding A/S Annual Report 2016 2016 in brief 6Nets Annual Report 2016 2016 in brief 6
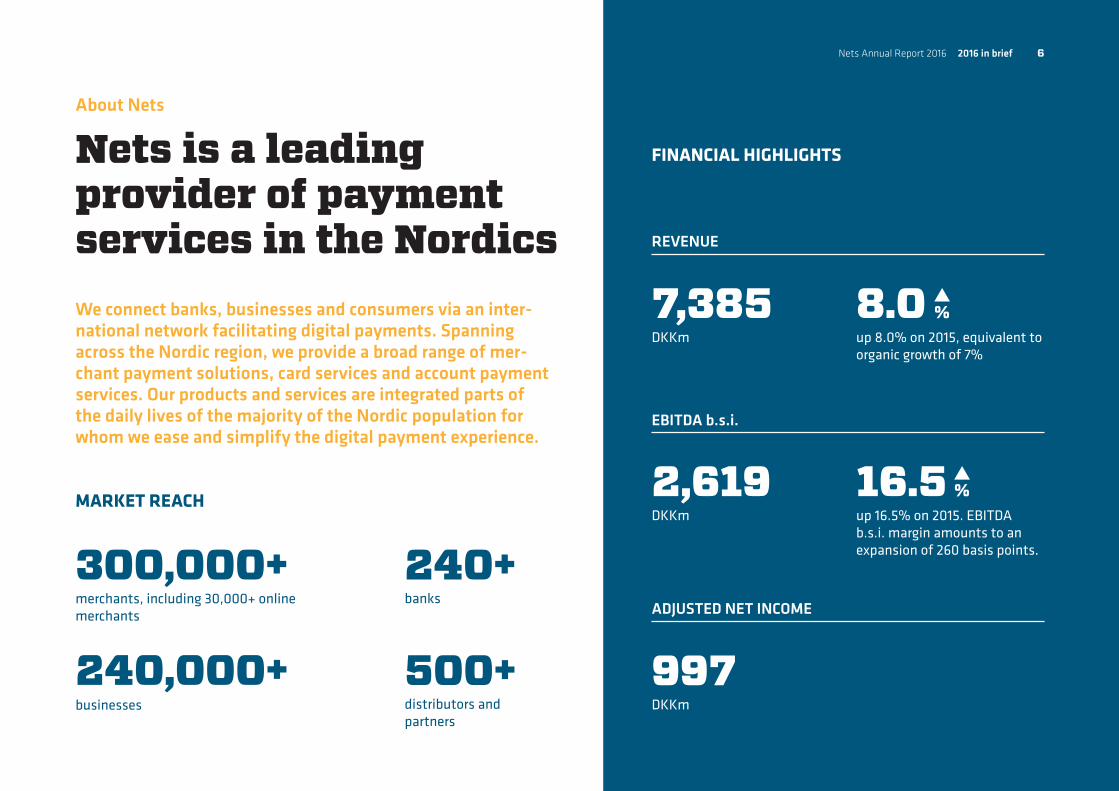
Nets is a leading provider of payment services in the Nordics
About Nets
FINANCIAL HIGHLIGHTS
merchants, including 30,000+ online merchants
businesses
banks
distributors and partners
300,000+
240,000+
240+
500+
We connect banks, businesses and consumers via an inter-national network facilitating digital payments. Spanning across the Nordic region, we provide a broad range of mer-chant payment solutions, card services and account payment services. Our products and services are integrated parts of the daily lives of the majority of the Nordic population for whom we ease and simplify the digital payment experience.
up 8.0% on 2015, equivalent to organic growth of 7%
up 16.5% on 2015. EBITDA b.s.i. margin amounts to an expansion of 260 basis points.
DKKm
DKKm
DKKm
8.0
16.5
%
%
REVENUE
EBITDA b.s.i.
ADJUSTED NET INCOME
7,385
2,619
997
MARKET REACH

37.8%
30.8%
31.4%
Corporate Services
Merchant Services
Financial & Network Services
provides our merchant customers with payment acceptance solutions across channels (in-store, online and mobile) and with the broadest range of payment methods in the Nordic region.
comprises a.o. Betalingsser-vice and NemID in Denmark, eFaktura, AvtaleGiro and BankID in Norway as well as national clearing services.
operates the domestic debit card schemes Dankort and BankAxept and provides outsourced processing services, consumer management services, fraud & dispute services, etc. to banks in the Nordics.
DKKm
up 24.2% on 2015, equivalent to organic growth of 13%
2,317
EBITDA b.s.i.:
DKKm
EBITDA b.s.i. margin amounts to 34.2%, up 420 basis points on 2015.
792
DKKm
up 1.1% on 2015, equivalent to organic growth of 2%
2,795
DKKm
Up 3.0% on 2015, equivalent to organic growth of 10%
2,273
EBITDA b.s.i.:
DKKm
EBITDA b.s.i. margin amounts to 33.4%, up 160 basis points.
934
EBITDA b.s.i.:
DKKm
EBITDA b.s.i. margin amounts to 39.3%, up 260 basis points.
893REVENUE:
REVENUE: REVENUE:
Nets Annual Report 2016 2016 in brief 7

3,576DKKm
542DKKm
885DKKm
68DKKm
2,314DKKm
Net revenue per geographical area 2016
Nets Annual Report 2016 2016 in brief 8
Grea
t pay
ments
Great idea
sGreat network
Great people
corporates
240,000
banks240+
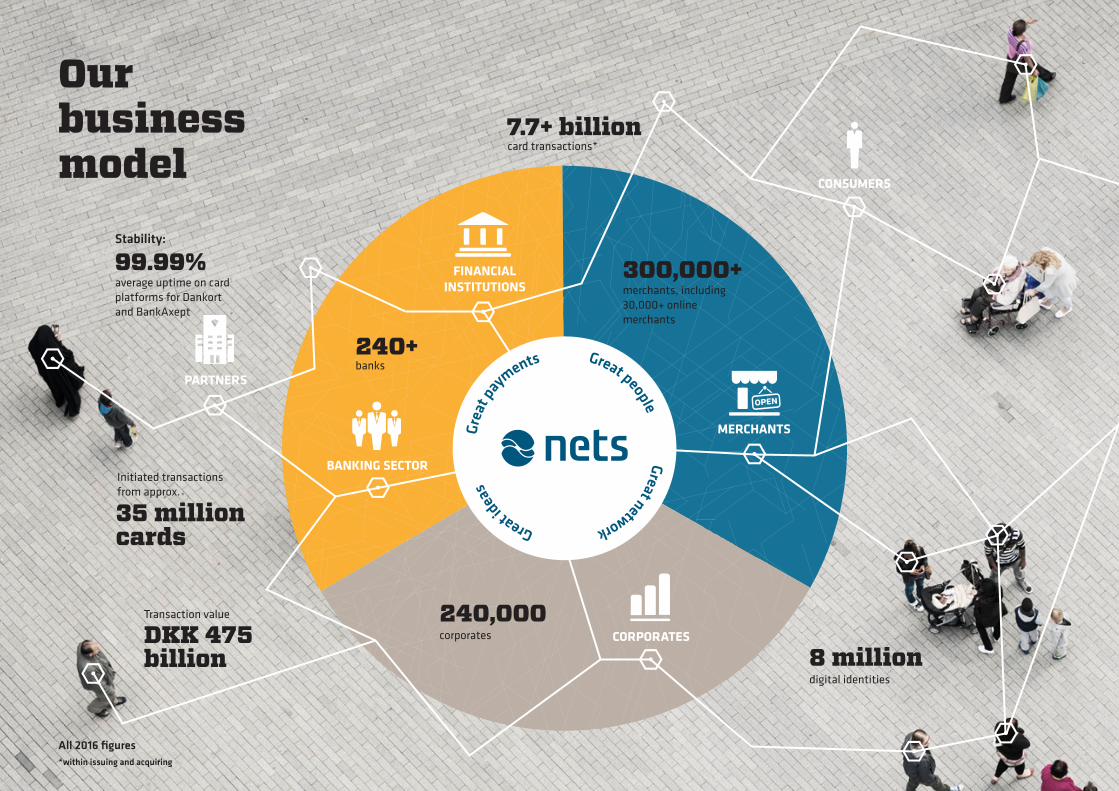
card transactions*7.7+ billion
digital identities
8 million
Transaction value
Stability:
DKK 475 billion
average uptime on card platforms for Dankortand BankAxept
99.99%merchants, including 30,000+ online merchants
300,000+
Initiated transactions from approx.
35 million cards
FINANCIAL INSTITUTIONS
BANKING SECTOR
PARTNERS
CORPORATES
CONSUMERS
MERCHANTS
Our business model
All 2016 figures*within issuing and acquiring

“Providing access to interoperability, scale, compliance, expertise, and innovation”
“Embedded payment partner to jointly drive the competi-tiveness of each of our customers”
“Providing payment solutions that optimise sales and customer retention”
“Making life easier, guaranteeing a secure experience across channels and technologies”
“Offering value-adding and efficient collection and payment-related solutions”
“Being the preferred partner for the Nor-dic digital payments ecosystem”
FOCUS AREAS / WINNING PROPOSITION
Great payments
- Secure and reliable- Simple and fast- Efficient and low-cost
Great network - Universal access in the Nordics- Frictionless entry points- All consumers, corporates, merchants and banks
Great ideas - Innovative thought partner- Co-creation with customers- Integrated with third parties
Great people - Strong expertise and know-how- Attracting, developing and exciting the best talent
As we invest in, maintain and operate a considerable number of critical large-scale national platforms, security, stability and high performance remain our top priorities.
As a leading provider of digital payment services and related technology solutions across the Nordic region, Nets sits at the centre of the digital payments ecosystem, and we operate a deeply entrenched network which connects merchants, financial institu-tions, corporate customers and consumers, enabling them to make and receive payments as well as, increasingly, utilise value-added services to help them improve their respective activities. Nets operates across the entire payment value chain from payment capture and authorisation through to processing, clearing and settlement.
BANKING SECTOR CONSUMERS
FINANCIAL INSTITUTIONS CORPORATES
MERCHANTS PARTNERS
We create value for shareholders by delivering payments and digital services that are used by thousands of merchants, hundreds of financial institutions, thousands of corporates and millions of consumers across the Nordic and Baltic re-gions, and that benefit communities and society as a whole.
Nets enables digital payments across all major channels – in person, online, and via a mobile device – and a large number of our services are used by a majority of consumers in Denmark and Norway, such as direct debit payments, card payments, digital authentication and invoice solutions. While we offer merchant acquiring solutions, point-of-sale terminals and e-commerce directly to the merchants, services delivered to the corporates, such as direct debit and invoice solutions, are offered in close co-operation with the financial institutions. Other solutions, e.g. card payments and the national identity schemes NemID and BankID, are also offered in close co-operation with the financial institutions. In Denmark, we own some of our key services, such as Dankort and Betalingsservice, while we in Norway operate similar services, including invoice solutions, direct debit payments and BankAxept card payments, on behalf of and in close co-operation with our customers.
Our business model
Nets Annual Report 2016 2016 in brief 10

7,385Revenue, net
2,619EBITDA b.s.i.
997Adjusted net income
DKKm
DKKm
DKKm
Nets A/S Group Nets Holding A/S Group
DKKm 2016 2015 2014* 2014 2013 2012
INCOME STATEMENT
Revenue, net 7,385 6,836 3,267 6,546 6,727 5,962
EBITDA before special items 2,619 2,248 1,000 1,663 1,525 **
EBITDA 2,013 1,710 714 1,252 1,324 1,077
Special items -345 -538 -286 -411 -201 -
Special items - IPO-related costs -261 - - - - -
Adjusted EBIT 2,203 1,977 912 1,365 1,194 **
EBIT 943 812 297 844 876 741
Net profit -584 119 63 652 613 698
Adjusted net profit 997 778 364 1,083 935 **
FINANCIAL POSITION
Total assets 28,299 29,558 26,699 11,102 11,729 12,380
Goodwill 14,720 14,646 13,423 1,318 719 934
Clearing-related balances, net -658 -778 190 190 -1,374 -1,045
Own cash 703 1,532 1,926 1,919 506 **
Net interest-bearing debt*** 8,503 13,319 12,526 ** ** **
Equity 9,806 4,980 4,946 2,366 2,307 2,334
CASH FLOW
Net cash from operating activities excl. clearing-related balances -686 1,105 650 1,088 1,056 **
Change in clearing-related balances -120 989 -1,563 -1,564 6 **
Net cash from investing activities 67 -2,081 -14,949 120 -150 -1,332
Net cash from financing activities 212 582 17,615 205 -498 483
Net cash flow for the year -527 595 1,753 -151 414 -244
Net change in own cash -829 -394 3,316 1,413 408 ***
Operating free cash flow 1,434 1,235 591 1,022 942 1,051
* Covering the period 1 July to 31 December 2014** Information not available.*** Net interest-bearing debt for 2015 and 2014 includes Payment in Kind loan
Nets Annual Report 2016 2016 in brief 11
Financial summary1/2

7%Organic growth
3.2xNIBD/EBITDA b.s.i.
Nets A/S Group Nets Holding A/S Group
DKKm 2016 2015 2014* 2014 2013 2012
GROWTH IN REVENUE, NET
Reported 8.0% 4.4% ** -3% 13% 7%
Organic 7% 6% ** ** ** **
CAPITAL STRUCTURE
EBITDA before special items 2,619 2,248 1,000 1,663 1,525 **
Net interest-bearing debt/EBITDA before special items*** 3.2x 4.2x ** ** ** **
OTHER RATIOS
EBITDA before special items margin 35.5% 32.9% 30.6% 25.4% 22.7% **
EBITDA margin 27.3% 25.0% 21.9% 19.1% 19.7% 18.1%
Capital expenditure/revenue 9.0% 7.9% ** ** ** **
Capitalised development costs (EBITDA before special items impact)/revenue 3.9% 3.9% ** ** ** **
Cash conversion ratio 78% 79% ** ** ** **
Equity ratio 34.7% 16.8% 18.5% 21% 20% 19%
SHARE INFORMATION
Number of shares ('000) 200,411 567 567 ** ** **
Earnings per share, basic, DKK -3.0 171.1 118.0 ** ** **
Earnings per share, diluted, DKK -3.0 171.1 118.0 ** ** **
Share price at the end of the year, DKK 123.6 ** ** ** ** **
FTE 2,427 2,413 2,618 2,618 2,578 2,861
* Covering the period 1 July to 31 December 2014** Information not available*** Net interest-bearing debt/EBITDA before special items excluding Payment in Kind loan
Nets A/S was formed on 5 February 2016 for the purpose of acquiring Nassa Topco AS (the former ultimate holding company of Nets Holding A/S). Nassa Topco AS acquired Nets Holding A/S in early July 2014. The consolidated
financial statements of Nets A/S therefore only covers the activities for the period 1 July 2014 and until 31 December 2016. Therefore, in order to present financial information that reflects the operations of the business con-
ducted by the Company, selected consolidated financial information for Nets Holding A/S for the years 2013 and 2014 has been included in the financial summary.
Nets Annual Report 2016 2016 in brief 12
Financial summary2/2
Performance highlights 2016
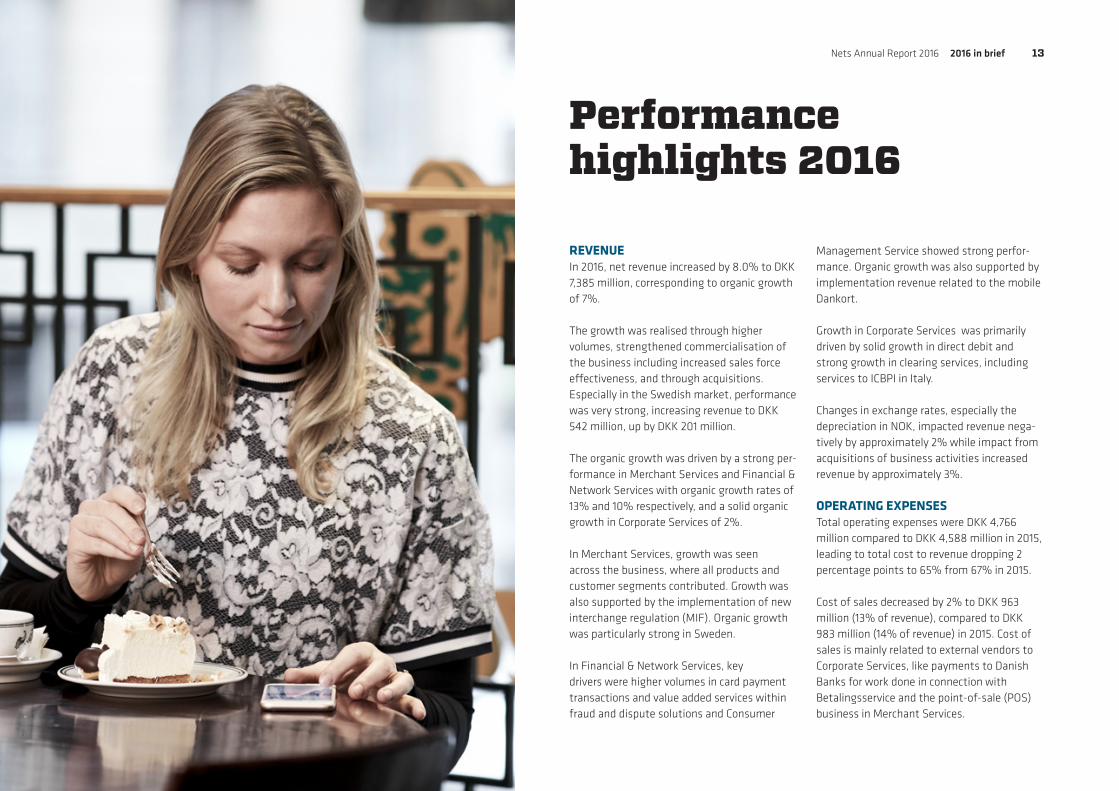
REVENUE In 2016, net revenue increased by 8.0% to DKK 7,385 million, corresponding to organic growth of 7%.
The growth was realised through higher volumes, strengthened commercialisation of the business including increased sales force effectiveness, and through acquisitions. Especially in the Swedish market, performance was very strong, increasing revenue to DKK 542 million, up by DKK 201 million.
The organic growth was driven by a strong per-formance in Merchant Services and Financial & Network Services with organic growth rates of 13% and 10% respectively, and a solid organic growth in Corporate Services of 2%.
In Merchant Services, growth was seen across the business, where all products and customer segments contributed. Growth was also supported by the implementation of new interchange regulation (MIF). Organic growth was particularly strong in Sweden.
In Financial & Network Services, key drivers were higher volumes in card payment transactions and value added services within fraud and dispute solutions and Consumer
Management Service showed strong perfor-mance. Organic growth was also supported by implementation revenue related to the mobile Dankort.
Growth in Corporate Services was primarily driven by solid growth in direct debit and strong growth in clearing services, including services to ICBPI in Italy.
Changes in exchange rates, especially the depreciation in NOK, impacted revenue nega-tively by approximately 2% while impact from acquisitions of business activities increased revenue by approximately 3%.
OPERATING EXPENSESTotal operating expenses were DKK 4,766 million compared to DKK 4,588 million in 2015, leading to total cost to revenue dropping 2 percentage points to 65% from 67% in 2015.
Cost of sales decreased by 2% to DKK 963 million (13% of revenue), compared to DKK 983 million (14% of revenue) in 2015. Cost of sales is mainly related to external vendors to Corporate Services, like payments to Danish Banks for work done in connection with Betalingsservice and the point-of-sale (POS) business in Merchant Services.
Nets Annual Report 2016 2016 in brief 13

External expenses increased by 2% to DKK 1,769 million (24% of revenue), compared to DKK 1,732 million (25% of revenue) in 2015. External expenses include, for example, consulting fees related to IT and costs driven by sourcing partnership related to technology development. The increase in external expenses was driven by sourcing partnership related to technology development and increased marketing activities while continued optimisation of the IT sourcing mix and operational processes and improved procurement impacted external expenses positively.
Staff costs increased by 9% to DKK 2,034 million (28% of revenue), compared to DKK 1,873 million (27% of revenue) in 2015. The increase in staff costs was primarily driven by full year impact from acquired companies (primarily Kortaccept AB acquired in December 2015), new incentive programmes put in place after the IPO and lower capitalisation levels compared to 2015.
Capitalised development costsCapitalised development costs impacting EBITDA b.s.i. for 2016 were 3.9% of revenue, in line with the level for 2015.
EBITDA B.S.I.In 2016, EBITDA b.s.i. grew by 16.5% to DKK 2,619 million, compared to DKK 2,248 million in 2015.
The improvement in EBITDA before special items was primarily driven by operating leverage from the revenue growth contribution as well as improved efficiency related to the continued implementation of the transforma-tion programme.
The improvement has resulted in an EBITDA before special items margin expansion of 260 basis points to 35.5% in 2016 from 32.9% in 2015.
SPECIAL ITEMS AND IPO-RELATED COSTS Special items amounted to DKK 606 million, of which DKK 261 million were IPO-related costs. Total IPO costs amounted to DKK 431 million including IPO-related costs recognised directly into equity of DKK 170 million.
Non-IPO-related special items were DKK 345 million, a decrease of DKK 193 million compared to 2015. Special items were mainly related to the transformation programme and severance costs following restructuring of the organisation within areas such as Technology, Customer Services and the CFO area.
EBITDAThe improved operating performance and strong control on special items resulted in an improvement of EBITDA by DKK 303 million to DKK 2,013 million.
DEPRECIATION AND AMORTISATIONIn 2016, underlying depreciation and amor-tisation were DKK 416 million, up from DKK 271 million in 2015. The increase was primarily due to an increased investment level in recent years, whereas revised useful lifetime on cer-tain development assets, and fully amortised at year-end, impacted underlying depreciation and amortisation by approx. DKK 60 million.
Amortisation of business combination amounted to DKK 654 million compared to DKK 627 million in 2015. The increase was
primarily due to the full year impact of the ac-quisition of Kortaccept AB (Nordea’s acquiring business) in December 2015. Amortisation on intangibles recognised as part of the sale of the Nets Group to private equity funds in 2014 amounted to DKK 438 million in 2016, which will decrease to DKK 383 million in 2019, and will further decrease in subsequent years.
ADJUSTED EBITAdjusted EBIT calculated as EBITDA b.s.i. minus underlying depreciation and amorti-sation was DKK 2,203 million, showing an improvement of DKK 226 million compared to 2015.
NET FINANCIALSNet financials were minus DKK 1,639 million compared to a minus of DKK 289 million in 2015.
Net financials were exceptionally impacted by refinancing costs in connection with the IPO of DKK 738 million and net positive fair value adjustments from Visa Shares totalling DKK150 million.
Net financial expenses were DKK 1,055 million compared to DKK 801 million in 2015. Foreign exchange adjustments negatively impacted net financial expenses by DKK 147 million in 2016, whereas impact from foreign exchange adjustments was positive at DKK 166 million in 2015. Foreign exchange adjustments were primarily driven by borrowings in NOK. Net financial expenses in Q4 2016 were DKK 46 million due to full effect from the refinancing completed at the end of Q3 2016.
The Visa transactionOn 2 November 2015, Visa Inc. and Visa Europe Ltd. (Visa Europe) announced that they had reached an agreement for Visa Inc. to acquire Visa Europe, and the deal closed on 21 June 2016. As part of Nets’ acquisition of Luottokunta Oy (now Nets Oy) in 2012 and as part of the sale of the Nets Group in 2014, certain agreements were entered into about the future distribution of the proceeds, given that a sale of Visa Europe would take place.
In 2016, the fair value adjustment of Visa shares to be passed through amounted to DKK 413 million (in 2015 DKK 2,428 million) and value adjustments related to contingent liabilities amounted to DKK 448 million (in 2015 DKK 1,913 million). Within the value adjustments of the liability, DKK 115 million consisted of reclassification of tax expenses recognised in 2015 due to a tax ruling obtained in Finland on deductibility of payments to be passed through.
Value adjustments of Visa shares in Teller Branch Norway, consisting of proceeds belonging to the Nets Group, amounted to DKK 185 million.
TAXIn 2016 taxes amounted to an income of DKK 112 million (an expense of DKK 404 million in 2015), or an effective tax rate of 16.1% (77.3% in 2015).
In 2016, the effective tax rate was positively influenced by the tax impact on Visa proceeds, (mainly obtained binding ruling in Finland on deductibility of pass through expenses) of 10%, negatively impacted by non-deductible
Nets Annual Report 2016 2016 in brief 14

IPO expenses of 9%, and tax losses derived from financing expenses until IPO and refinancing of 7%. Adjusted for these items, the effective tax rate was 22%.
NET PROFIT Net profit in 2016 was a minus of DKK 584 million (DKK 119 million in 2015) which, as ex-pected, was significantly impacted by special items and refinancing expenses totalling DKK 1,344 million. ADJUSTED NET PROFIT In 2016, adjusted net profit increased by DKK 219 million to DKK 997 million or by 28.1% compared to 2015.
BALANCE SHEET AND CASH FLOW
Tangible and intangible assets At 31 December 2016, total assets amounted to DKK 28,299 million, compared to DKK 29,558 million at year-end 2015.
Total non-current assets amounted to DKK 19,935 million compared to DKK 20,063 million at year-end 2015.
Total current assets amounted to DKK 8,364 million, compared to DKK 9,495 million at year-end 2015, a decrease of DKK 1,131 million primarily due to a decrease in other financial assets of DKK 1,471 million. Other financial assets at year-end 2015 consisted of fair value of Visa Europe shares. In 2016, shares in Visa Europe were converted into cash, preferred shares in Visa Inc. and deferred considerations, where received cash has been partly passed through to the previous owners of Nets Holding A/S (the Danish and Norwegian banks) and
Nets Annual Report 2016 2016 in brief 15
Nets Oy and partly used for tax payments related to the gain on the Visa transaction.
CLEARING WORKING CAPITAL At 31 December 2016, clearing-related assets (clearing debtors) amounted to DKK 4,477 million and clearing-related liabilities amounted to DKK 5,135 million, leading to a clearing working capital (CWC) of minus DKK 658 million (positive funding), representing a reduction of DKK 120 million compared with CWC of minus DKK 778 million at the end of 2015, driven by day of month-end and normal seasonality.
EQUITY Total equity amounted to DKK 9,806 million compared to DKK 4,980 million at the begin-ning of the year. Total equity was impacted by the new issuance of shares in relation to the IPO-generated proceeds of DKK 5,500 million, offset by IPO-related costs directly recognised in equity of DKK 170 million.
NET INTEREST-BEARING DEBT As of 31 December 2016, net interest-bearing debt amounted to DKK 8,503 million, or 3.2x LTM EBITDA before special items.
Net interest-bearing debt includes DKK 703 million of own cash, but excludes the deferred consideration of DKK 284 million, which is related to future earn-out payments in relation to past acquisitions, since this amount is non-interest-bearing. The net interest-bear-ing debt to LTM EBITDA, before special items ratio, was 3.4x if the deferred consideration of DKK 284 million is included.
CAPITAL EXPENDITUREIn 2016, capital expenditure amounted to DKK 668 million compared to DKK 539 million in 2015, equivalent to a capital expenditure/revenue ratio of 9.0% and 7.9% respectively. The higher ratio was primarily driven by the ongoing network segregation and the estab-lishment of a third data centre in Norway.
CASH FLOWIn 2016, net cash flow from operating activi-ties, excluding clearing working capital, was minus DKK 686 million, significantly impacted by IPO-related interest payments, including the early settlement of the payment in kind of DKK 1,616 million and payment of taxes related to the Visa transaction of DKK 452 million. Adjusted for these elements, net cash flow from operating activities amounted to DKK 1,383 compared to DKK 1,105 million in 2015.
Cash flow from investing activities amounted to positive DKK 67 million in 2016 including net proceeds from the Visa transaction of DKK 783 million. Adjusted for Visa proceeds, cash flow from investing activities amounted to minus DKK 716 million compared to DKK 2,081 million in 2015, which included the acquisition of Nordea’s acquiring business of DKK 1,570 million.
Net cash flow from financing activities in 2016 was positive at DKK 212 million compared to positive DKK 582 million in 2015. Key components in 2016 were proceeds from the IPO of DKK 5,430 million net of fees, proceeds from new borrowings of DKK 9,040 million offset by repayment of existing borrowings
and settlement of interest swaps of DKK 14,481 million. In 2015, key components were proceeds from new borrowings of DKK 1,636 million offset by the repayment of existing borrowings of DKK 1,079 million.
Operating free cash flow in 2016 was DKK 2,015 million, up 13% compared to 2015. The improvement was primarily driven by higher EBITDA before special items.
Own cash at 31 December 2016 amounted to DKK 703 million, as expected down by DKK 829 million from year-end 2015. The decrease was primarily driven by negative cash flow from operating activities, excluding clearing-related balances of DKK 664 million, mainly due to extraordinary payments of interest and similar items of DKK 2,053 million.
CASH CONVERSION RATIOThe cash conversion ratio was 77% in 2016 compared to 79% in 2015, primarily due to higher capital expenditures.
EVENTS AFTER THE BALANCE SHEET DATE On 31 January, Nets purchased the remaining 42.3% of the shares in EDIGard AS for a cash consideration of DKK 37 million. The share purchase was funded by Nets' own cash and existing credit facilities and in accordance with Nets' capital allocation principles, where investments in organic growth and add-on acquisitions are prioritised.
Nets Annual Report 2016 2016 in brief 16

Outlook 2017 and medium-term guidance
GUIDANCE FOR 2017
Organic revenue growthThe expected organic growth of 5-6% is based on an assumed structural growth in both value and number of transactions across all three segments.
In addition, organic growth is expected to be fuelled by further growth from the four strategic growth areas: mobile, outsourcing, value-chain-expansion and Nordic growth. We expect to continue expanding our position in Sweden in 2017 and to continue the up- and cross-selling of value-added services supported
by the strengthening of our sales force implemented during 2016.
Revenue growth will not be as positively impacted by the changed regulation on interchange fees compared to the effect reflected in the 2016 growth. The guidance also reflects a lower expected implementation revenue in Financial & Network Services.
EBITDA b.s.i. marginEBITDA margin b.s.i. is expected to be above 36.0%, driven by a continued positive impact from operating leverage and benefits from the transformation programme.
Special itemsAs previously communicated, special items are expected to be around DKK 150 million, whereof DKK 120 million relates to the transformation programme and approximately DKK 30 million relates to IPO retention costs.
Capital expenditureCapital expenditure is expected to be impacted by the completion of investments initiated in 2016, primarily related to the data centre in Norway and network segregation. In addition, investments are expected related to PSD2 within mobile and product innovation and within Corporate Services.
Net interest-bearing debt / EBITDA b.s.i.Expected net interest-bearing debt / EBITDA b.s.i. is based on an assumption of no M&A activities other than the acquisition of the remaining shares in EDIGard AS for a total consideration of DKK 37 million, which was completed in January 2017.
The expectations include the effect of a share buyback programme, which is expected to be initiated to cover the obligations under the long-term incentive programme to be issued in March of 2017, amounting to approximately DKK 150 million.
MEDIUM-TERM FINANCIAL TARGETS The medium-term targets remain unchanged compared to the expected levels communicat-ed in connection with the IPO. As previously communicated, the assumptions on which the targets are based, include that: • We are able to achieve revenue growth at a
level slightly above the expected growth of digital payments in the Nordic region and through the execution of our strategy
• We will continue to execute on the transfor-mation programme
• We are able to further develop the current margins as a result of revenue growth, the positive effect of operational leverage and the ongoing implementation of the transformation programme
• In preparing our medium-term financial targets, we have assumed that no major adverse effects shall be forthcoming with significant changes, including without limitation larger changes in the competitive landscape or our ability to continue to successfully deliver services.
Targets Guidance for 2017 Medium-term (unchanged)
Organic revenue growth 5-6 % 5-6% p.a.
EBITDA b.s.i. margin Above 36.0% High 30s
Special items (including IPO-relat-ed expenses)
DKK 150 million, of which approx. DKK 30 million is IPO-related
IPO-related retention costs ex-pected at DKK 30 million for 2018
Capital expenditure incurred (% of revenue)
Around 8% excluding M&A activities
6-8% excluding M&A activities
Net interest-bearing debt / EBITDA b.s.i.
Around 2.5x including effect of share buyback of approx. DKK 150 million to cover long-term incen-tive programme and assuming no additional M&A activities
2.0x-2.5x assuming no M&A activities
Nets A/S Annual Report 2016 2016 in brief 17

Business performance
The 7% organic growth in 2016 was realised through higher volumes and a strenghtened commercialisation of our business, including sales force effectiveness. Especially in the Swedish market, performance was very strong.
Nets Annual Report 2016 Business performance 18

Launched new onboarding process allowing merchants to apply for acquiring services and become our customers in a matter of minutes.
Enhanced customer self-service through an improved settlement portal with an intuitive user-interface that allows merchants to get a quick and detailed overview of the latest settlement along with historical settlement cycles.
Merchant Services
Merchant Services provides our merchant customers with payment acceptance solutions across channels (in-store, online and mobile) and with the broadest range of payment methods in the Nordic region, including Visa, MasterCard, JCB, and local payment brands. Merchant Services is present across Nordic and Baltic countries and works with a broad set of value-adding partners across the region.
Merchant Services manages and simplifies merchants’ payments flow. We enable merchants to accept payments, easily and without friction regardless of channels,
receive the settlement in their bank account and get detailed reconciliation information and statistics, all in different currencies and frequencies depending on merchant needs and consumer preferences.
The acquiring revenue is primarily driven by a value-based fee per transaction with monthly subscription fees for additional services, while the terminal sales revenue is primarily driven by monthly subscription fees on terminals from rental fees, software fees and value-added services such as special support and/or payments from customers buying their terminals.
FINANCIAL PERFORMANCEIn 2016, Merchant Services’ revenue amounted to DKK 2,317 million, up 24.2%. This corre-sponds to strong organic growth of 13%. The growth was seen across the business, where all products and customer segments have contributed to the significant growth. In Sweden, Merchant Services had strong organic growth of 30% in 2016.
Two thirds of Merchant Services’ revenue related to the value of card transactions in acquiring and the number of transactions in e-commerce.
During the year, Merchant Services acquired approximately 1.8 billion card transactions from international branded cards equalling card spending values of around DKK 475
billion, which is equivalent to growth of 45% and 55% respectively. The growth was significantly impacted by the acquisition of Nordea’s merchant acquiring business.
The remaining part of the revenue relates to point-of-sale (POS) solutions and value -added services. POS and related solutions saw good growth, supported by a continued push towards a higher proportion of rented terminals.
Revenue was further positively impacted by provisions on interchange fees for card-based transactions that form part of EU regulations for card-based transactions. In Denmark, Finland and Sweden, these provisions came into effect on 9 December 2015, whereas the provisions came into effect in Norway as of 1 September 2016.
Nets Annual Report 2016 Business performance 19
DKK
DKKmYear ended
31 Dec 2016Year ended
31 Dec 2015Year over
year change
Total transaction value (bn) 475 306 55%
Revenue 2,317 1,866 24.2%
Organic growth 13% 7% -
EBITDA b.s.i. 792 559 41.7%
EBITDA b.s.i. margin 34.2% 30.0% -
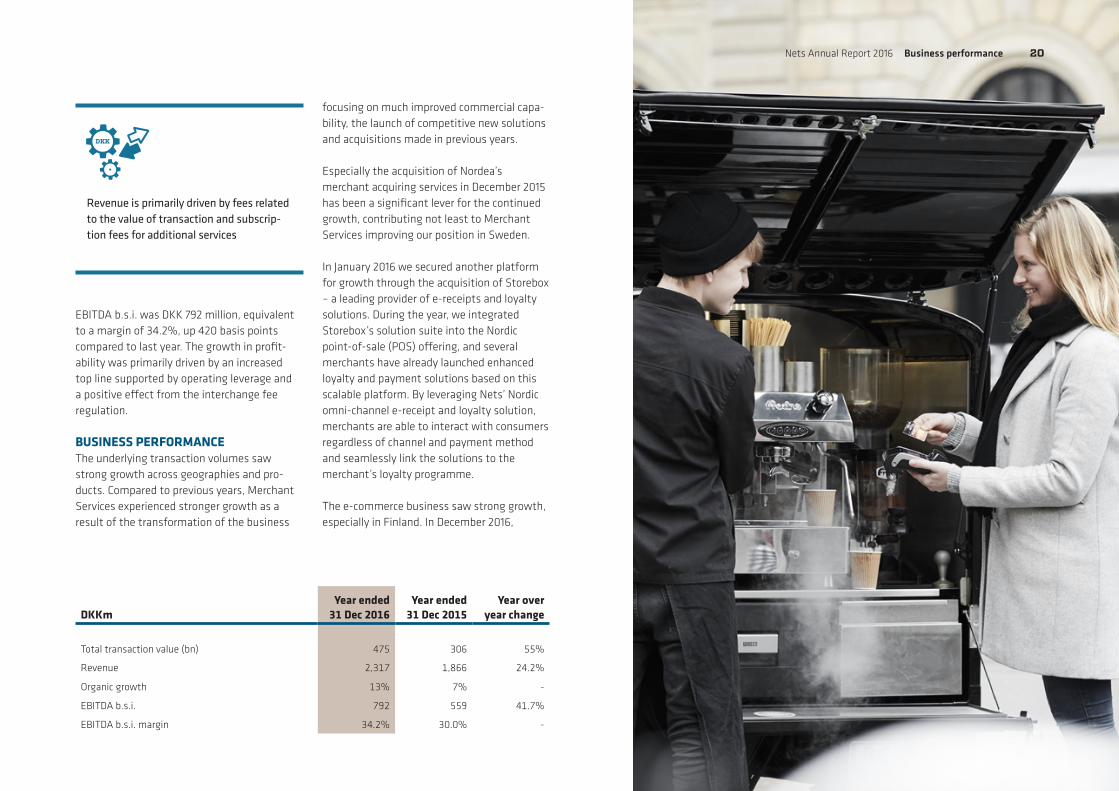
Revenue is primarily driven by fees related to the value of transaction and subscrip-tion fees for additional services
EBITDA b.s.i. was DKK 792 million, equivalent to a margin of 34.2%, up 420 basis points compared to last year. The growth in profit-ability was primarily driven by an increased top line supported by operating leverage and a positive effect from the interchange fee regulation.
BUSINESS PERFORMANCEThe underlying transaction volumes saw strong growth across geographies and pro-ducts. Compared to previous years, Merchant Services experienced stronger growth as a result of the transformation of the business
focusing on much improved commercial capa-bility, the launch of competitive new solutions and acquisitions made in previous years. Especially the acquisition of Nordea’s merchant acquiring services in December 2015 has been a significant lever for the continued growth, contributing not least to Merchant Services improving our position in Sweden.
In January 2016 we secured another platform for growth through the acquisition of Storebox – a leading provider of e-receipts and loyalty solutions. During the year, we integrated Storebox’s solution suite into the Nordic point-of-sale (POS) offering, and several merchants have already launched enhanced loyalty and payment solutions based on this scalable platform. By leveraging Nets’ Nordic omni-channel e-receipt and loyalty solution, merchants are able to interact with consumers regardless of channel and payment method and seamlessly link the solutions to the merchant’s loyalty programme.
The e-commerce business saw strong growth, especially in Finland. In December 2016,
Nets Annual Report 2016 Business performance 20
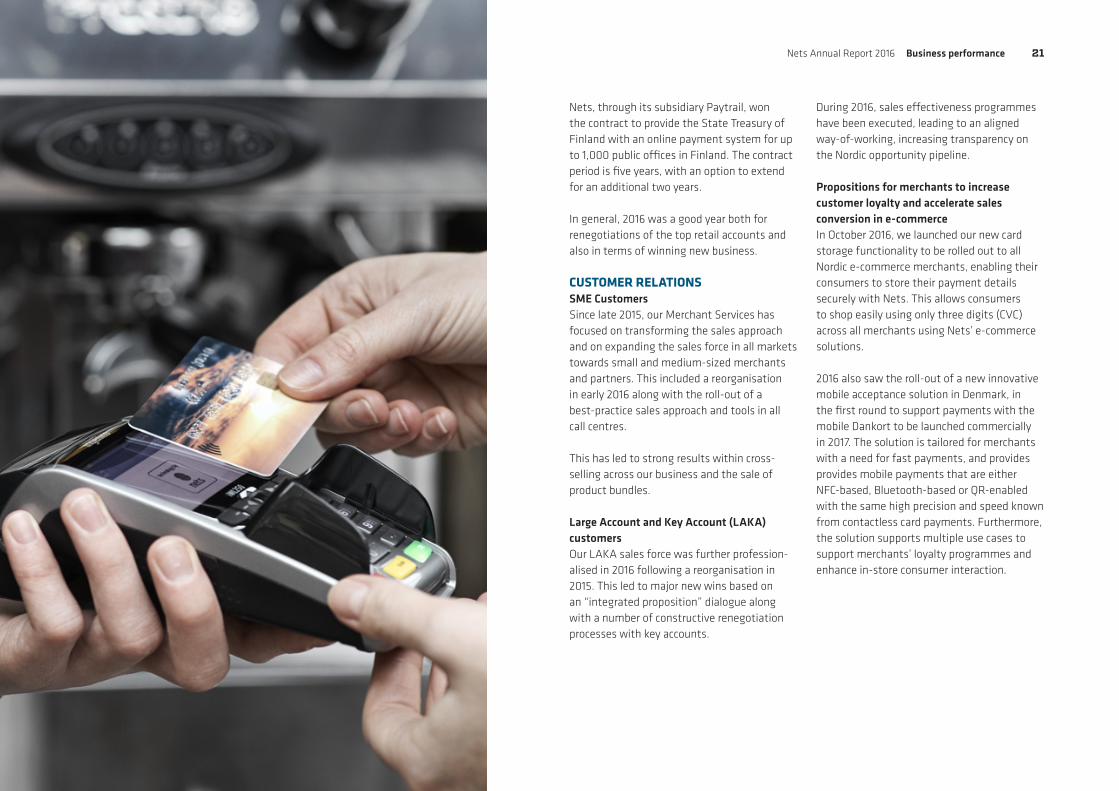
Nets, through its subsidiary Paytrail, won the contract to provide the State Treasury of Finland with an online payment system for up to 1,000 public offices in Finland. The contract period is five years, with an option to extend for an additional two years.
In general, 2016 was a good year both for renegotiations of the top retail accounts and also in terms of winning new business.
CUSTOMER RELATIONSSME CustomersSince late 2015, our Merchant Services has focused on transforming the sales approach and on expanding the sales force in all markets towards small and medium-sized merchants and partners. This included a reorganisation in early 2016 along with the roll-out of a best-practice sales approach and tools in all call centres.
This has led to strong results within cross- selling across our business and the sale of product bundles.
Large Account and Key Account (LAKA) customersOur LAKA sales force was further profession-alised in 2016 following a reorganisation in 2015. This led to major new wins based on an “integrated proposition” dialogue along with a number of constructive renegotiation processes with key accounts.
During 2016, sales effectiveness programmes have been executed, leading to an aligned way-of-working, increasing transparency on the Nordic opportunity pipeline.
Propositions for merchants to increase customer loyalty and accelerate sales conversion in e-commerceIn October 2016, we launched our new card storage functionality to be rolled out to all Nordic e-commerce merchants, enabling their consumers to store their payment details securely with Nets. This allows consumers to shop easily using only three digits (CVC) across all merchants using Nets’ e-commerce solutions.
2016 also saw the roll-out of a new innovative mobile acceptance solution in Denmark, in the first round to support payments with the mobile Dankort to be launched commercially in 2017. The solution is tailored for merchants with a need for fast payments, and provides provides mobile payments that are either NFC-based, Bluetooth-based or QR-enabled with the same high precision and speed known from contactless card payments. Furthermore, the solution supports multiple use cases to support merchants’ loyalty programmes and enhance in-store consumer interaction.
Nets Annual Report 2016 Business performance 21
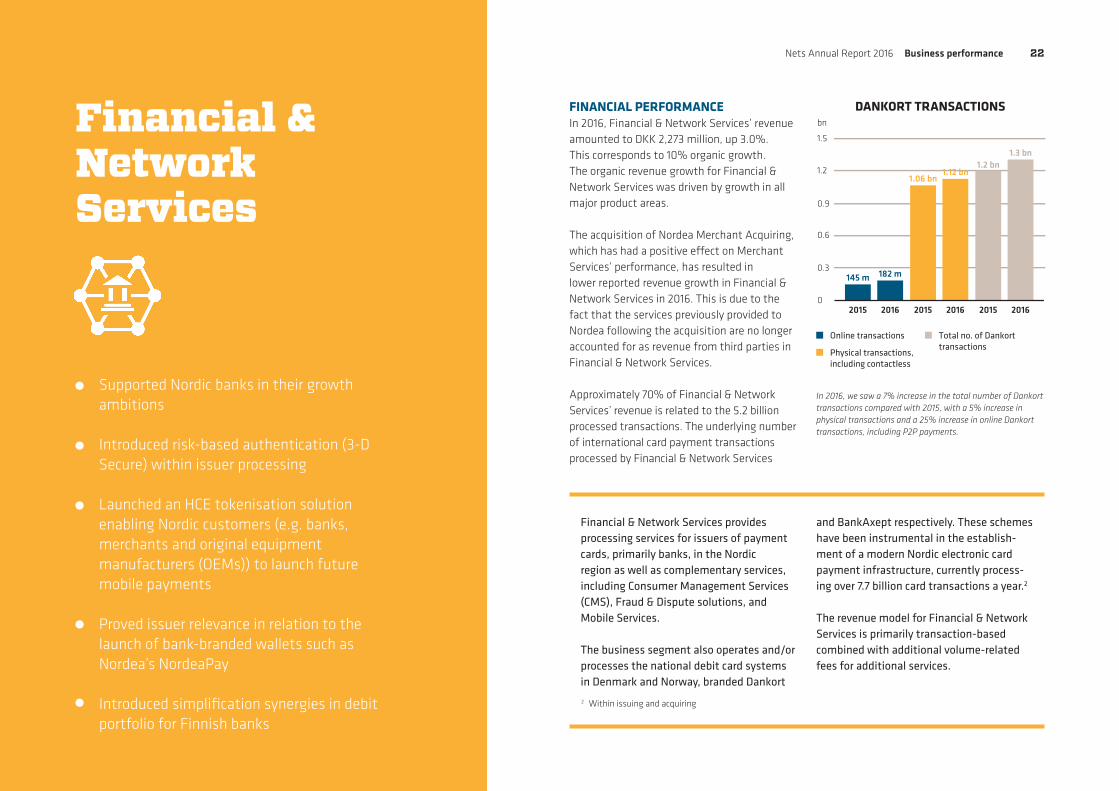
DANKORT TRANSACTIONS
145 m
20150
0.3
0.6
0.9
1.2
1.5
bn
2016 2015 2016 2015 2016
182 m
1.06 bn1.12 bn
1.2 bn1.3 bn
Online transactions
Physical transactions,including contactless
Total no. of Dankort transactions
Supported Nordic banks in their growth ambitions
Introduced risk-based authentication (3-D Secure) within issuer processing
Launched an HCE tokenisation solution enabling Nordic customers (e.g. banks, merchants and original equipment manufacturers (OEMs)) to launch future mobile payments
Proved issuer relevance in relation to the launch of bank-branded wallets such as Nordea’s NordeaPay
Introduced simplification synergies in debit portfolio for Finnish banks
Financial &Network Services
Financial & Network Services provides processing services for issuers of payment cards, primarily banks, in the Nordic region as well as complementary services, including Consumer Management Services (CMS), Fraud & Dispute solutions, and Mobile Services.
The business segment also operates and/or processes the national debit card systems in Denmark and Norway, branded Dankort
and BankAxept respectively. These schemes have been instrumental in the establish-ment of a modern Nordic electronic card payment infrastructure, currently process-ing over 7.7 billion card transactions a year.2
The revenue model for Financial & Network Services is primarily transaction-based combined with additional volume-related fees for additional services.
FINANCIAL PERFORMANCEIn 2016, Financial & Network Services’ revenue amounted to DKK 2,273 million, up 3.0%. This corresponds to 10% organic growth. The organic revenue growth for Financial & Network Services was driven by growth in all major product areas.
The acquisition of Nordea Merchant Acquiring, which has had a positive effect on Merchant Services’ performance, has resulted in lower reported revenue growth in Financial & Network Services in 2016. This is due to the fact that the services previously provided to Nordea following the acquisition are no longer accounted for as revenue from third parties in Financial & Network Services.
Approximately 70% of Financial & Network Services’ revenue is related to the 5.2 billion processed transactions. The underlying number of international card payment transactions processed by Financial & Network Services
2 Within issuing and acquiring
In 2016, we saw a 7% increase in the total number of Dankort transactions compared with 2015, with a 5% increase in physical transactions and a 25% increase in online Dankort transactions, including P2P payments.
Nets Annual Report 2016 Business performance 22
DKK
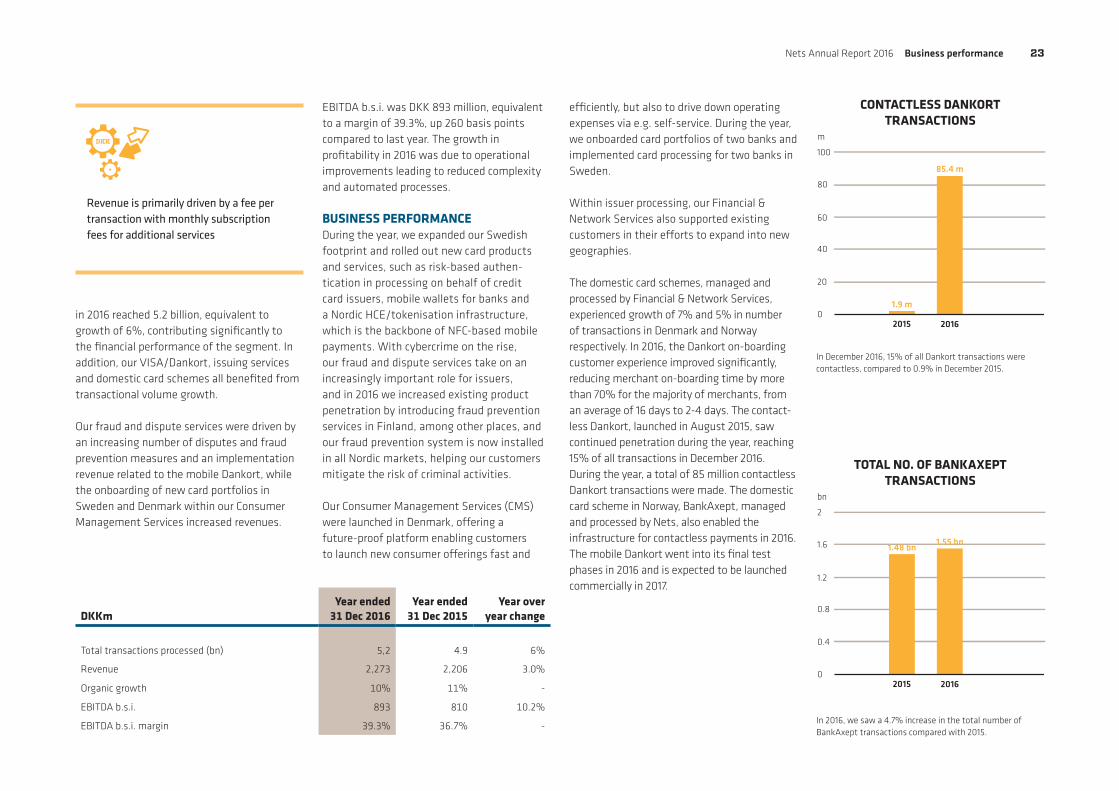
TOTAL NO. OF BANKAXEPT TRANSACTIONS
2015 2016
1.48 bn1.55 bn
0
0.4
0.8
1.2
1.6
2
bn
CONTACTLESS DANKORT TRANSACTIONS
2015 2016
1.9 m
85.4 m
0
20
40
60
80
100
m
DKKmYear ended
31 Dec 2016Year ended
31 Dec 2015Year over
year change
Total transactions processed (bn) 5,2 4.9 6%
Revenue 2,273 2,206 3.0%
Organic growth 10% 11% -
EBITDA b.s.i. 893 810 10.2%
EBITDA b.s.i. margin 39.3% 36.7% -
Revenue is primarily driven by a fee per transaction with monthly subscription fees for additional services
in 2016 reached 5.2 billion, equivalent to growth of 6%, contributing significantly to the financial performance of the segment. In addition, our VISA/Dankort, issuing services and domestic card schemes all benefited from transactional volume growth.
Our fraud and dispute services were driven by an increasing number of disputes and fraud prevention measures and an implementation revenue related to the mobile Dankort, while the onboarding of new card portfolios in Sweden and Denmark within our Consumer Management Services increased revenues.
EBITDA b.s.i. was DKK 893 million, equivalent to a margin of 39.3%, up 260 basis points compared to last year. The growth in profitability in 2016 was due to operational improvements leading to reduced complexity and automated processes.
BUSINESS PERFORMANCEDuring the year, we expanded our Swedish footprint and rolled out new card products and services, such as risk-based authen-tication in processing on behalf of credit card issuers, mobile wallets for banks and a Nordic HCE/tokenisation infrastructure, which is the backbone of NFC-based mobile payments. With cybercrime on the rise, our fraud and dispute services take on an increasingly important role for issuers, and in 2016 we increased existing product penetration by introducing fraud prevention services in Finland, among other places, and our fraud prevention system is now installed in all Nordic markets, helping our customers mitigate the risk of criminal activities.
Our Consumer Management Services (CMS) were launched in Denmark, offering a future-proof platform enabling customers to launch new consumer offerings fast and
efficiently, but also to drive down operating expenses via e.g. self-service. During the year, we onboarded card portfolios of two banks and implemented card processing for two banks in Sweden.
Within issuer processing, our Financial & Network Services also supported existing customers in their efforts to expand into new geographies.
The domestic card schemes, managed and processed by Financial & Network Services, experienced growth of 7% and 5% in number of transactions in Denmark and Norway respectively. In 2016, the Dankort on-boarding customer experience improved significantly, reducing merchant on-boarding time by more than 70% for the majority of merchants, from an average of 16 days to 2-4 days. The contact-less Dankort, launched in August 2015, saw continued penetration during the year, reaching 15% of all transactions in December 2016. During the year, a total of 85 million contactless Dankort transactions were made. The domestic card scheme in Norway, BankAxept, managed and processed by Nets, also enabled the infrastructure for contactless payments in 2016. The mobile Dankort went into its final test phases in 2016 and is expected to be launched commercially in 2017.
In December 2016, 15% of all Dankort transactions were contactless, compared to 0.9% in December 2015.
In 2016, we saw a 4.7% increase in the total number of BankAxept transactions compared with 2015.
Nets Annual Report 2016 Business performance 23

Signed 5-year agreement for the operation and administration of AvtaleGiro on behalf of the Norwegian banking sector
Introduced a self-service corporate agreement registration for banks and their partners, moving the process closer to the customer and reducing delivery time by more than 50%
Delivery of new clearing and settlement system for central bank, to go into production in Q2 2017
Closed our contract with ICBPI in Italy on delivering real-time clearing as a managed service from the end of Q1 2017
Average onboarding time for Betalingsservice cut down to 4 hours
Signed a four-year agreement with Norwegian banks, for delivering and operating a modernised version of eFaktura (Norwegian e-billing service)
CorporateServices
Corporate Services offers integrated e-bill services to corporates, enabling them to invoice their consumers electronically and automatically receive payments at due time, with the benefit of low churn. Consumers are provided with an overview of the invoices paid directly from their online bank. More than 90% of Danish households use the direct debit service to pay utility bills and other bills.
Corporate Services also offers national e-identity solutions in Denmark and
Norway, used by 95% of Danes and 80% of Norwegians respectively.
For the majority of its revenue, Corporate Services’ revenue model is transaction- based and built upon a strong network of payees and payers featuring recurring payments as the core value proposition. In Norway, the services are sold to the banks, which sell them to their business custom-ers, while in Denmark the services are sold directly to corporates.
FINANCIAL PERFORMANCEIn 2016, Corporate Services’ revenue amounted to DKK 2,795 million, up 1.1%. This corresponds to 2% organic growth. The growth was largely driven by solid growth within direct debit ser-vices. Our clearing activities saw strong growth due to increased implementation revenues driven by the contract with ICBPI in Italy, while our e-security services declined slightly due to lower revenues from its cost plus model.
EBITDA b.s.i. was DKK 934 million, equivalent to a margin of 33.4%, up 160 basis points com-pared to last year. The growth in profitability was primarily driven by continued positive effects from the transformation programme.
BUSINESS PERFORMANCEWithin direct debit, the conversion from a quarterly to a monthly invoicing frequency was a growth driver in 2016 in both Denmark and Nor-way. In Denmark, a Betalingsservice mobile app
was launched, allowing consumers to instantly sign up and pay via their preferred channels. Similarly, invoices are now sent directly from the app. Much attention has been given to investing in our IT platforms for higher flexibility and more efficient operations. Likewise, improving customer experience has been a major focus area throughout 2016, and several projects – some still ongoing – address easier on-boarding and improved customer service.
The number of direct debit customers onboarded through digital channels is steadily increasing, whilst the volumes of the tradi-tional paper-based channels are decreasing. The new onboarding solution in Norway "Mine Avtaleforslag” (“Proposed agreements”) which allows customers to easily see and activate potential new agreements from their bank based on their payment history, is an import-ant contributor to this.
Nets Annual Report 2016 Business performance 24

DKK
DKKmYear ended
31 Dec 2016Year ended
31 Dec 2015Year over
year change
Total transaction volume (bn) 0.87 0.83 5%
Revenue 2,795 2,764 1.1%
Organic growth 2% 2% -
EBITDA b.s.i. 934 879 6.3%
EBITDA b.s.i. margin 33.4% 31.8% -
In Denmark, 2015 growth in our clearing services continued throughout 2016, mainly driven by high growth within real-time clearing to support, a.o., mobile peer-to-peer (P2P) services. 2016 transaction volume continued to grow and exceeded 10 million transactions per month, up by more than 40% compared with 2015. In Norway, we saw continuous growth in volumes comparable with previous years. Dedi-cated initiatives in close cooperation with the financial sector and data centres in Denmark and Norway led to very good operational stability within clearing in 2016.
Within digital identity solutions, our Danish solution, NemID, experienced transactional growth among private service providers and the public sector, while its Norwegian counterpart, BankID, saw very high transac-tional growth throughout the year driven by BankID on Mobile, underlining the need for user-friendly solutions in the mobile space.
NemID processed 746 million transactions in 2016, up 1.6% on 2015
BankID processed 513 million transactions in 2016, up 21.1% on 2015
issued in Denmark (NemID)
issued in Norway (BankID)
Digital identity:
NemID usage rates up
BankID usage rates up
1.6%
21.2%
4.7 m3.6 m
Revenue is primarily driven by a fee per transaction as well as monthly or annual fees
Nets Annual Report 2016 Business performance 25

Nets is well positioned to take advantage of the expected structural annual growth of 4% in the Nordic payments industry.
Business strategy
Nets Annual Report 2016 Business strategy 26
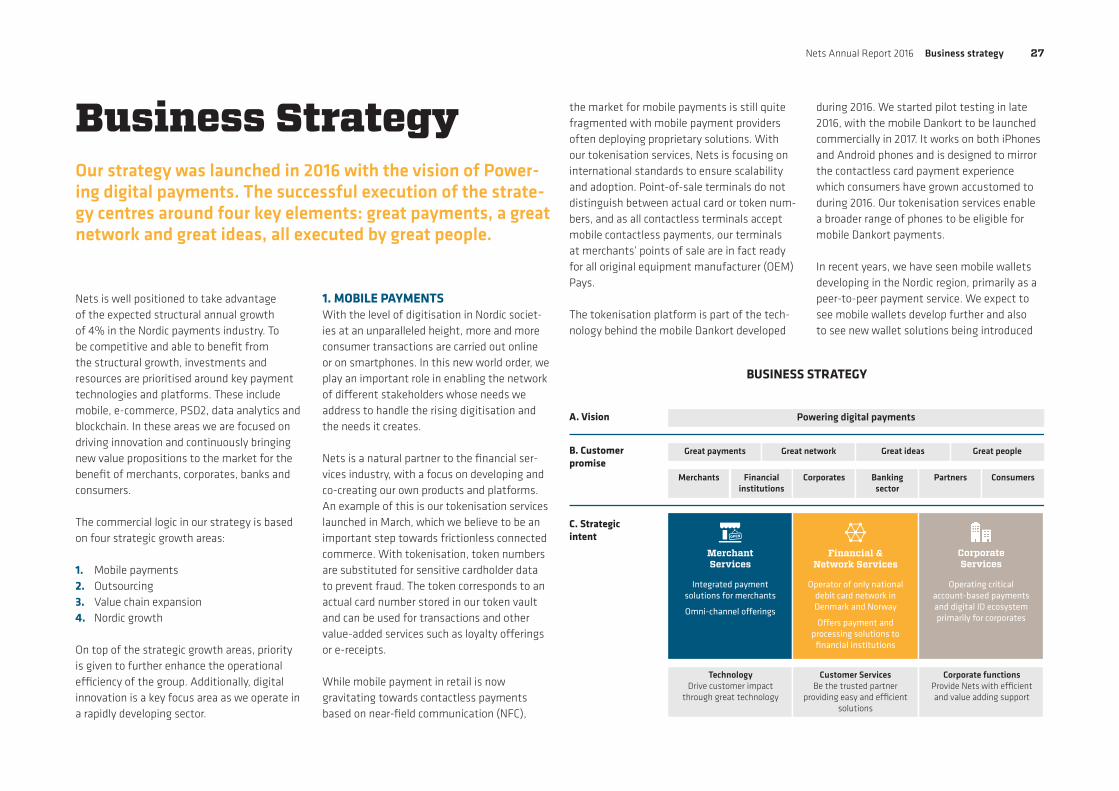
BUSINESS STRATEGY
Powering digital payments
Great payments
A. Vision
B. Customer promise
C. Strategic intent
Merchants Financial institutions
Integrated payment solutions for merchants
Omni-channel oerings
Operator of only national debit card network in Denmark and Norway
Oers payment and processing solutions to
financial institutions
Operating critical account-based payments and digital ID ecosystem primarily for corporates
Merchant Services
CorporateServices
Financial &Network Services
Corporates
Customer ServicesBe the trusted partner
providing easy and e�cient solutions
TechnologyDrive customer impact
through great technology
Corporate functionsProvide Nets with e�cient and value adding support
Banking sector
Partners Consumers
Great network Great ideas Great people
Business StrategyOur strategy was launched in 2016 with the vision of Power-ing digital payments. The successful execution of the strate-gy centres around four key elements: great payments, a great network and great ideas, all executed by great people.
Nets is well positioned to take advantage of the expected structural annual growth of 4% in the Nordic payments industry. To be competitive and able to benefit from the structural growth, investments and resources are prioritised around key payment technologies and platforms. These include mobile, e-commerce, PSD2, data analytics and blockchain. In these areas we are focused on driving innovation and continuously bringing new value propositions to the market for the benefit of merchants, corporates, banks and consumers.
The commercial logic in our strategy is based on four strategic growth areas:
1. Mobile payments2. Outsourcing3. Value chain expansion 4. Nordic growth
On top of the strategic growth areas, priority is given to further enhance the operational efficiency of the group. Additionally, digital innovation is a key focus area as we operate in a rapidly developing sector.
1. MOBILE PAYMENTSWith the level of digitisation in Nordic societ-ies at an unparalleled height, more and more consumer transactions are carried out online or on smartphones. In this new world order, we play an important role in enabling the network of different stakeholders whose needs we address to handle the rising digitisation and the needs it creates.
Nets is a natural partner to the financial ser-vices industry, with a focus on developing and co-creating our own products and platforms. An example of this is our tokenisation services launched in March, which we believe to be an important step towards frictionless connected commerce. With tokenisation, token numbers are substituted for sensitive cardholder data to prevent fraud. The token corresponds to an actual card number stored in our token vault and can be used for transactions and other value-added services such as loyalty offerings or e-receipts. While mobile payment in retail is now gravitating towards contactless payments based on near-field communication (NFC),
the market for mobile payments is still quite fragmented with mobile payment providers often deploying proprietary solutions. With our tokenisation services, Nets is focusing on international standards to ensure scalability and adoption. Point-of-sale terminals do not distinguish between actual card or token num-bers, and as all contactless terminals accept mobile contactless payments, our terminals at merchants’ points of sale are in fact ready for all original equipment manufacturer (OEM) Pays.
The tokenisation platform is part of the tech-nology behind the mobile Dankort developed
during 2016. We started pilot testing in late 2016, with the mobile Dankort to be launched commercially in 2017. It works on both iPhones and Android phones and is designed to mirror the contactless card payment experience which consumers have grown accustomed to during 2016. Our tokenisation services enable a broader range of phones to be eligible for mobile Dankort payments.
In recent years, we have seen mobile wallets developing in the Nordic region, primarily as a peer-to-peer payment service. We expect to see mobile wallets develop further and also to see new wallet solutions being introduced
Nets Annual Report 2016 Business strategy 27

to the Nordic market in the coming years. We believe we are well positioned to deliver the underlying payment infrastructure needed to run these wallets, not least by utilising the mobile Dankort. We seek to partner with local mobile ecosystems across the Nordics as well as with mobile phone OEMs to facilitate the roll-out of their wallet solutions in the Nordic region. To support our customers, we have developed an API-based open platform mobile wallet solution that includes HCE tokenisation. It provides technological solutions and digital content libraries which enable banks to offer their customers mobile wallet payments.
2. OUTSOURCING We see a growing trend in banks outsourcing non-core processes, and we are able to assist them with payment-related processes. To this end we have delivered a platform for Consumer Management Services (CMS) which has already gained strong traction across card issuers. In 2016, Nets had 2.3 million accounts managed on our CMS platform. As we process transactions initiated by approximately 35 million cards, increasing the penetration of CMS represents a potentially significant opportunity for Nets given the number of cards already handled by us in the region.
3. VALUE CHAIN EXPANSION Nets has an extensive distribution network in the Nordic region, which will allow us to lever-age the roll-out of new products and solutions commercially. In addition, we are driving new opportunities by up-selling and cross-selling products and services across the group. Towards merchants, we see a continued de-
mand for distributing omni-channel solutions that enable merchants to accept payments from their customers via a wide range of payment solutions. Merchants increasingly demand a “one stop” payment provider for all popular payment instruments such as card, mobile, invoice, e-wallets, etc. Our payment platform for merchants already supports most payment methods, and currently we are in the process of adding new solutions such as the mobile Dankort.
We are constantly innovating to offer additional value-added services such as data analytics, including e-receipts, loyalty programmes, portal services and dynamic currency conversion.
Within data analytics, we have made invest-ments during 2016. New advanced technology and competences have been onboarded to grow capabilities within advanced analytics and data visualisation. We are actively running projects to turn data insights into business value for merchants, banks, corporates and consumers. Nets is well positioned to explore future commercial opportunities and meet a growing demand for clarity. We will do this by combining our deep understanding of the financial industry in the Nordics with the data insights.
Towards banks we delivered a fraud prevention system which has already gained strong traction across card-issuers. Our enhanced fraud and dispute solutions support predictive fraud-prevention analytics. Highly advanced and automated card fraud is growing rapidly, resulting in high administrative and liability-related costs. We offer a high-quality combination of experienced fraud analysts and
a state-of-the-art system that enables pre-vention of fraud in real time. We can thereby potentially reduce gross fraud significantly, lowering the cost burden for issuers. In 2016, Nets onboarded several new customers to the system in Norway and Finland.
Within real-time clearing and settlement services, Nets is one of only two ISO 20022-compliant systems in Europe in production and actively marketed. Our real-time clearing system has the potential for use in other European countries and we will target expansion outside the Nordic region on a selective basis using the same approach as with the recent agreement with ICBPI in Italy.
4. NORDIC GROWTHThe Nordic payments market is characterised by continued growth in transactions both in terms of number and total value of transac-tions. Our acquisition of Nordea’s acquiring business (Kortaccept) in December 2015 added a large customer base, sales force and referral network with the largest bank in the Nordic region. Consequently, we have seen transac-tion volumes increase significantly in 2016.
We expect to secure further growth going into 2017 by increasing our customer portfolios in Sweden, partly through leveraging the existing Kortaccept customer base but also through investments made in our presence in Sweden, not least in stronger outbound sales capabilities.
We also expect to benefit from a growing trend of outsourcing of processes by card issuers, with the biggest potential in Sweden. In 2016, two Swedish banks outsourced their issuer processing to Nets.
As part of our growth strategy we continue to focus on increasing customer retention through pro-active retention measures.
ENHANCING OPERATING EFFICIENCIESOur focus on operating efficiency and cost optimisation remains a persistent part of the strategy. In 2014, we initiated our transfor-mation programme, part of which is aimed at improving operating efficiencies across the group.
We have an ongoing programme in which we identify and implement opportunities for productivity improvements through process redesign, capacity optimisation automation, overhead optimisation and technology ratio-nalisation. To improve customer deliveries, 28 robots have been implemented to automate processes in Customer Services, and more robots will be implemented in the coming year. As part of our end-to-end process optimisa-tion, we managed to reduce the onboarding time for new customers in Betalingsservice from 30 days to an average of 3-4 hours, while for new acquiring customers it was reduced from a little over 20 days to 2-3 days.
We also continue strengthening the current off- and near-shoring programmes as well as our partnering with select third parties to further improve quality and productivity. The externally sourced capability volume increased to 438 FTEs which is 30% higher compared to 2015.
DIGITAL INNOVATIONAt Nets, we drive innovation by developing solutions internally. In addition, we partner with other technology innovators and also
Nets Annual Report 2016 Business strategy 28

pursue capability-enhancing acquisitions. During 2016, our Digital Innovation Lab was scaled to further strengthen our in-house dig-ital innovation, playing a key role in delivering the Betalingsservice app for consumers and in establishing our Blockchain Lab. In August 2016 the Blockchain Lab delivered its first proof of concept: a digital mortgage service.
During 2016, The Digital Innovation Lab also organised a series of hackatons and launched an incentive programme to nurture ideas suggested by employees. An important mission for the Digital Lab is to understand and act on emerging technologies through prototyping and co-creation with customers. In 2017, the Digital Lab will seek to harvest good ideas both within Nets and through open innovation, community initiatives, customer insights and partnerships with fintechs. Several of these ideas are expected to move into production in 2017.
PSD2The revised Directive on Payment Services (PSD2) is to be implemented in all EU member states by 13 January 2018. It will require banks to grant third-party payment providers access to customers’ bank accounts and could thus lead to increased competition and opportu-nities for both traditional and non-traditional payment providers. This could potentially shift some payments from cash and card to account-to-account-based payments.
While PSD2 opens up the payments and bank-ing services to new actors, we believe that it also presents new opportunities for Nets, as we have traditionally played key roles within both card and account-based services. At Nets, a cross-organisational programme is in place
to deliver tangible propositions that help our customers ensure compliance with PSD2. The programme will also provide commercial ser-vices for banks, merchants and corporates, as well as for third-party service providers (TPPs), account-information-service-providers (AISPs) and payment-initiation-service-providers (PISPs) in the emerging account-to-account (A2A) ecosystem.
As an example, Nets is developing new inte-grated account-to-account (A2A) instruments for merchants, enabling them to handle all popular payment types (so-called omni-accep-tance). The new service offerings will also help banks comply with complex PSD2 requirements and securely manage payment requests from TPPs. Last but not least, our offerings will enable banks to monetise from PSD2 by helping them act as third-party payment providers themselves. Our merchant and corporate client base can enable a broad acceptance of payment types, making us a partner of choice for third-party payment providers (TPPs).
Investing in infrastructure securityOur ability to remain the partner of choice to our customers depends on the stability and security of our payment infrastructure. Ensuring the highest levels of trust, availabil-ity and security in all our services is critical as they are used by millions of consumers, hundreds of banks and hundreds of thousands of merchants and corporates.
We are on a continuous journey to ensure operational excellence and have come a long way in 2016.
We have had no critical incidents and a significantly lower number of service level breaches compared to 2015. When incidents do occur, our time to restore after failure is considerably improved compared to 2015; all of this bearing witness to an overall level of improved robustness in our IT infrastructure.
In 2016, special attention was paid to a technology refresh, reducing complexity and time-to-market to prepare for the future. We have invested substantially in security enhancements, reaching a higher maturity level and robustness. Our security posture has thus increased significantly, and we have passed the Payment Card Industry (PCI) certifications in all Nordic countries.
A fully redesigned network has been prepared during 2016 and is to be implemented in 2017 in a new tier 3 data centre location, providing Nets with a resilient, scalable and agile infra-structure. We will continue to invest in security and additional capabilities going forward to prevent, detect and react to security incidents and attacks, and keep up with the continuous-ly evolving threat landscape.
Nets Annual Report 2016 Business strategy 29

Risk management is regarded as a needed core competency for executive management, business leaders and employees at all levels.
Risk management
Nets Annual Report 2016 Risk management 30
Risk Management
Risk management is an important discipline for executive management, business leaders and employees at all levels and has evolved as a discipline throughout 2016 to provide a clear and, to the best of our knowledge, complete overview of risks in the Group.
Nets’ policy framework consists of a risk management policy, a security policy, a business continuity policy, a merchant acquiring risk policy and a treasury policy. The policy framework sets out the activities and risk assessment methodology used to ensure that all material risks are identified and that a consistent approach to risks is integrated into business management and decision-making across the Nets Group. At Nets, we define risk as “the effect of uncertainty on business objectives”.
This section describes Nets’ key risks and corporate social responsibility (CSR) risks. Financial risks, including foreign exchange risks, interest rate risks and liquidity risks, are described under Financial statement, sections 2 and 5.
RISK GOVERNANCEThe Board of Directors is responsible for the overall governance of Nets and oversees our risk landscape and approves strategies and policies within the areas of risk management, security, business continuity, merchant acquiring and treasury risk.
The Board has appointed an Audit Committee which, among other tasks, monitors risk management strategies, policies, processes and methodology.
The Group Executive Committee is responsible for allocating sufficient resources and budget to risk management. Risk Management provides the domain expertise, policies, standards and procedures to enable the risk management process, and also facilitates risk identification, assessment and treatment plans.
A “three lines of defence” model is imple-mented throughout the organisation and forms the basis for risk decision-making within Nets. The model is used to structure roles, responsibility and accountability for decision-making concerning risk and internal controls, and to ensure good collaboration between the three lines.
Risk management is an integral part of our way of doing business at Nets and helps us understand and manage the uncertainties inherent in our strategy and the daily running of our business.
Nets Annual Report 2016 Risk management 31
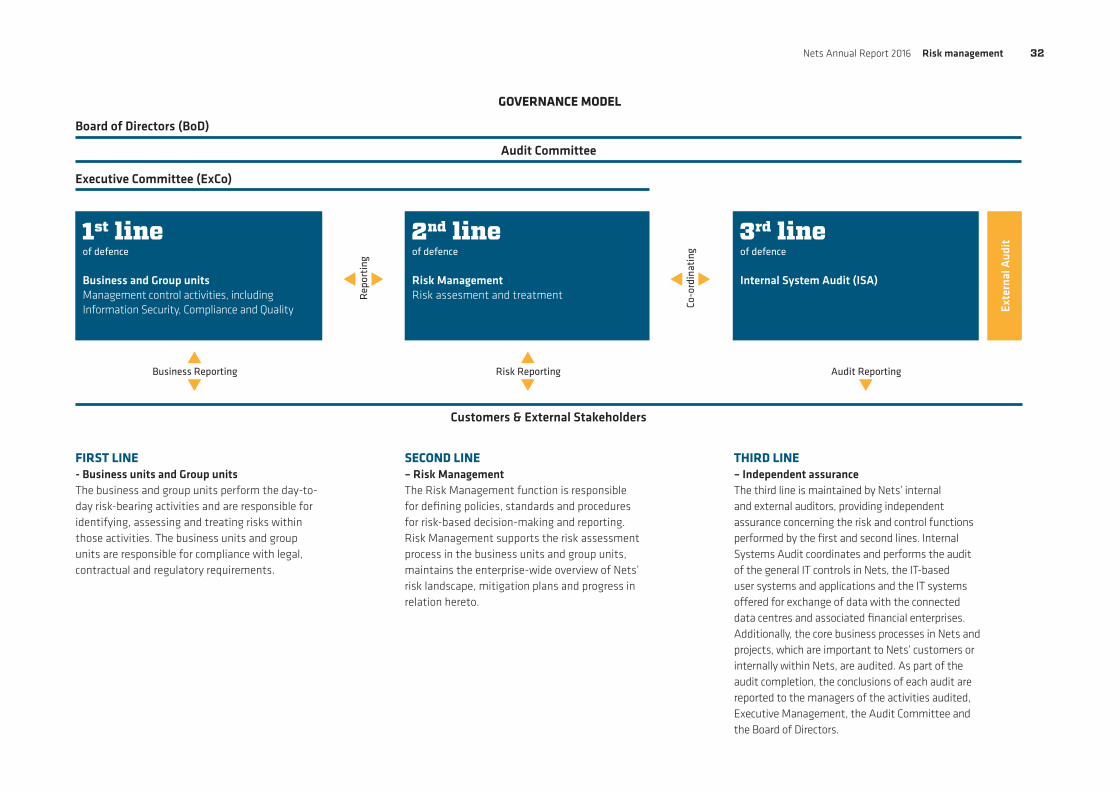
GOVERNANCE MODEL
Board of Directors (BoD)
Executive Committee (ExCo)
Audit Committee
Customers & External Stakeholders
1st lineof defence
Business and Group unitsManagement control activities, including Information Security, Compliance and Quality
2nd lineof defence
Risk ManagementRisk assesment and treatment
3rd lineof defence
Internal System Audit (ISA)
Exte
rnal
Aud
it
Co-o
rdin
atin
g
Rep
orti
ngBusiness Reporting Risk Reporting Audit Reporting
FIRST LINE - Business units and Group unitsThe business and group units perform the day-to-day risk-bearing activities and are responsible for identifying, assessing and treating risks within those activities. The business units and group units are responsible for compliance with legal, contractual and regulatory requirements.
SECOND LINE – Risk ManagementThe Risk Management function is responsible for defining policies, standards and procedures for risk-based decision-making and reporting. Risk Management supports the risk assessment process in the business units and group units, maintains the enterprise-wide overview of Nets’ risk landscape, mitigation plans and progress in relation hereto.
THIRD LINE – Independent assuranceThe third line is maintained by Nets’ internal and external auditors, providing independent assurance concerning the risk and control functions performed by the first and second lines. Internal Systems Audit coordinates and performs the audit of the general IT controls in Nets, the IT-based user systems and applications and the IT systems offered for exchange of data with the connected data centres and associated financial enterprises. Additionally, the core business processes in Nets and projects, which are important to Nets’ customers or internally within Nets, are audited. As part of the audit completion, the conclusions of each audit are reported to the managers of the activities audited, Executive Management, the Audit Committee and the Board of Directors.
Nets Annual Report 2016 Risk management 32

The risks are the result of risk assessments and workshops within the different business units and group units in Nets. Top manage-ment review the risks and prioritise, approve and follow up on mitigation actions. The mitigants to the risks set out below are exam-ples described in summary form to further the understanding of the risk in question and how it may be mitigated.
The risks described below are not listed in any particular order of priority as to significance or probability.
TECHNOLOGY INNOVATIONDescription:Global technology trends such as artificial intelligence, biometrics, blockchain, Internet of Things (IoT), Open APIs and the use of cloud technologies accelerate the development and implementation of new products, services and business models. These new products, services and business models could create new opportunities but also potentially challenge the Group’s business.
Potential impact:These risks could result in a loss of customers and market share and/or challenge Nets’
Key risks
business model and expose merchant and creditor relationships to intensified competi-tive pressures. The corporate brand could also be weakened.
Actions in 2016:1. Increased focus on agile software
development and business agility in all business areas
2. Set up a customer co-creation team with focus on mobile technologies and Open APIs
3. Established a Digital Innovation Lab to rapidly test out innovative concepts/products and create an entrepreneurial spirit at Nets
4. Arranged internal hackatons to strengthen prototyping and concept development
5. Participated in external fintech events6. Created a Group user experience team (UX)7. Established a Blockchain Lab and a proof
of concept (PoC) for banks/merchants, as well as a partnership with a blockchain payment company (Coinify).
Mitigants:1. Investment and development within a
number of emerging technologies, such as • Mobility, tokenisation, e-commerce and
digital identity• Blockchain, payments and asset
management
• PSD2 services, account-to-account, data aggregating
• Artificial intelligence (AI), fraud prevention, robotics and data analytics
• See also ‘Actions 2’ under ‘Industry & market transformation’
2. Continued investment in Digital Innovation Lab, proofs of concepts, etc.
3. Revitalisation of company values, and strategic emphasis on “great ideas”.
INDUSTRY & MARKET TRANSFORMATIONDescription: New technologies (as described above), market entrants and regulation (as described below) drive structural changes in the industry. Traditional payment methods are supplemented by methods represented by both new players and incumbents, positioning themselves towards a developing payments market. E-commerce, mobile commerce and digital products (app stores, streaming, in-app) are expected to drive a higher pace and growth rates, but could also be easier for competitors to capture when compared with in-store products and services due a to lack of new hardware. Further, consumers, merchants and corporates expect transparent, digitised and readily available services. Increased competition could also result in an increased price pressure on services delivered by Nets.
Potential impact:If Nets fails to adapt to new technologies and structural changes it may lead to loss of business. Failure to deliver would also have
The risks described below are those currently considered the most material to our business.
an impact on our reputation as a leading payments company in the Nordics.
Actions in 2016:1. Innnovative e-commerce and in-store
product developments, card-linked services and launches (new card storage functionality, Storebox)
2. Betalingsservice app launched in Denmark3. See also mitigants 1 and 2 under ‘Technol-
ogy innovation’ above.
Mitigants:1. Mobile strategy with focus on application
launch and development2. Customer service transformation pro-
gramme3. Mergers, acquisitions and joint ventures
with leading innovators.
REGULATORY ENVIRONMENTDescription (general): The Group is subject to a wide array of laws and regulations in the jurisdictions in which it operates. Further, regulatory bodies across Europe, including the Nordic region, are placing the financial industry, payment institutions and providers of digital products and services under increased regulatory scrutiny. Privacy and financial crime prevention require significant resources while local regulators adapt and define clear requirements for market participants. Anti-Money Laundering (AML) is one example where Nets must ensure that the requirements are being adhered to. As data processor and/or data controller, Nets must comply with strict data protection laws in the jurisdictions in which it operates. The
Nets Annual Report 2016 Risk management 33
General Data Protection Regulation (GDPR) is an area in which Nets as a data processor must implement appropriate technical and organisational measures in order to meet the requirements of the GDPR and ensure the protection of the rights of the data subject.
Potential impact:The increased regulatory focus may result in regulatory enforcement orders and/or fines, and ultimately loss of licence in one or more jurisdictions. Failure to comply may also have an impact on Nets’ reputation and corporate brand. Finally, changes in laws and regulations may have a material adverse effect on the Group’s business and results.
Actions in 2016:1. Nets has mapped the regulatory require-
ments in the Group in order to make sure that Nets in all material aspects complies with the requirements.
Mitigants:1. A regular monitoring of the regulatory
landscape and an ongoing analysis of new legislation
2. Executive management attention3. Internal projects have been established to
implement new requirements.
PSD2Description:Currently, banks do not grant access to information stored in their customers’ accounts. However, with PSD2, banks must allow third-party access if the third party has a licence to provide payment services. This may result in increased competition and opportu-nities for both traditional and new payment providers. For example, peer-to-peer payment platforms could shift from mostly card-based payments to account-based payments. PSD2 may also enable new business models.
Potential impact:The new financial infrastructure based on PSD2 may result in loss of market share in traditional products, as PSD2 could facilitate a shift from card-based payments to ac-count-based payments.
Actions in 2016:1. A dedicated, executive-sponsored PSD2
steering committee has been established to drive the Group strategy.
Mitigants:1. A fully operational programme designing
products and go-to-market strategies for account-based payment products.
INFORMATION SECURITYDescription: Relevant security risk events include social en-gineering such as phishing and spear-phishing, malware and ransomware monitored during the year. In addition, malicious insider data breach has been a focus area for mitigation, including increased logging and monitoring. Potential impact:In the worst case, the above-mentioned events could lead to a compromise of critical IT systems and a potential breach of confidential information. Similarly, the loss, or otherwise unauthorised or accidental disclosure, of customer or other sensitive information could result in regulatory or legal sanctions and/or fines. This may also result in a weakening of our corporate brand.
In the long run, security incidents could also lead to customers leaving Nets.
Actions in 2016:1. Improved process to continuously risk
assess all critical IT services2. Mandatory security nano-learning lessons
for employees3. Maintained Nets’ PCI DSS compliance in
the Nordic region4. Improved logging and monitoring
programme to enable Nets to rapidly identify and respond to security incidents to reduce the impact of a cyber-attack
5. Strengthened Security Incident Response Team (SIRT) and improved security inci-dent process. Nets SIRT is now officially a certified Computer Emergency Readiness Team (CERT), approved by Carnegie Mellon University.
Mitigants1. I ncreased threat intelligence capabilities
within information security, both in-house and in cooperation with external parties
2. Focus on security awareness training and a new initiative in 2017 to expand coverage and approach
3. A new IT Service model clarifying roles and responsibilities. Model approved and communicated, and implementation started.
STABILITY AND OPERATIONSDescription: Nets operates a number of services critical to the national financial infrastructures in the Nordic countries, such as domestic debit card schemes, clearing systems, e-identity schemes and payment platforms. As these systems are critical for our customers, government organisations and authorities, stability has a high priority at Nets. Any unscheduled system downtime would impact our services, causing Service Level Agreement (SLA) breaches, reputational damage and/or financial loss. Common risk events include change implementation issues and errors, network malfunction and Distributed Denial of
Nets Annual Report 2016 Risk management 34
Service (DDoS) attacks. Operational stability has been a critical strategic priority during 2016 to mitigate this risk both in the short and long term. If Nets fails to attract, manage and retain qualified personnel or key employees this could result in lack of critical resources and competence to maintain stable operations.
Potential impact:Any disruption of the availability of Nets’ services could result in SLA breaches, loss of business and significant additional costs by way of lost revenue and/or operating expenses. In addition, Nets may also suffer reputational damage.
Actions in 2016:1. Set up new data centre in Oslo and
established network connectivity to existing data centres. First IT Service currently being installed
2. Implementing new network infrastructure. Phase one completed in December 2016, with full project completion in May 2017
3. Improvements to key IT processes such as change management, incident manage-ment and problem management
4. Established a Centre of Excellence to pro-vide IT business support to ensure a single point of contact 24/7, providing system surveillance and alert handling, a single point of contact (SPOC) for customers, banks and data centres, request handling and incident handling
5. Significantly improved our monitoring capabilities of IT Services
6. Established multi-layered anti-DDOS protection to protect infrastructure, web-servers and DNS.
Mitigants:1. Focus on infrastructure through network
segmentation and a new data centre2. Ensuring the right hardware through a
technology refresh3. Improved monitoring of critical systems4. Strengthened Technical Design Authority
(TDA) to ensure designs are robust and aligned with the Enterprise Architecture (EA) principles, security requirements and operations standards and to guide projects and the line organisation.
MERCHANT ACQUIRING
A) FRAUD RISKDescription: Nets has a potential financial liability and could also suffer reputational damage for fraudulent digital payment transactions (fraudulent sales of goods and services, or customers that get defrauded). Failure to effectively manage this risk could increase Nets’ chargeback liability and lead to fees from international card schemes. A chargeback normally occurs when a dispute between the merchant and the cardholder is not resolved in favour of the merchant, so the transaction is “charged back” to the merchant and the pur-chase price is credited or otherwise refunded to the cardholder. If Nets is unable to collect such amounts from the merchant’s account, or if the merchant refuses or is unable to e.g. due to bankruptcy, then Nets will bear the losses. The risk of fraud-related chargebacks is greater in certain industries and especially within e-commerce.
Potential impact:Fraudulent activities may result in both fines and high chargebacks. Fraud gets high attention in the press and may result in reputational damage.
Actions in 2016:1. Strong focus on Merchant risk exposure2. New merchant acquiring risk policy
approved by BoD.
Mitigants:1. Comprehensive screening and fraud
detection monitoring systems.
B) CREDIT RISK EXPOSUREDescription: The Group is exposed to the risk of unpaid merchant service charges where a customer ceases to trade. To manage this risk, the Group maintains credit risk exposure in line with approved appetite for risk whilst achieving appropriate risk versus reward performance and ensuring that customers will be able to meet their obligations to the Group.
Potential impact:Nets could have to re-compensate the card scheme or the issuing bank, resulting in financial loss. Rejection of potential high credit risk could expose merchants due to failed credit risk assessment.
Actions in 2016:1. New merchant credit risk policy approved
by the Board of Directors (BoD) 2. Merchant credit risk insurance programme
to cover possible chargeback claims.
Mitigants1. Continuous monitoring and review of
merchants with high credit risk exposure, by both Nets and insurance company.
THIRD PARTIESDescription: Outsourcing and use of third parties to carry out core business activities represent a risk, while contacts and relationships with critical suppliers must also be monitored. Nets may also be exposed to stability issues with third-party systems operated by other parties in the digital payments ecosystem.
The Group has entered into licence agreements with major card scheme operators relevant for the merchant acquiring activities. Potential impact:Suppliers critical to Nets are unable to deliver as agreed. Security breaches at a third party may affect and harm Nets. Non-compliance at third parties could result in Nets becoming non-compliant.
If the Group’s licence agreements are termi-nated or not extended upon expiration, the Group’s business, financial condition, results of operations and prospects may be materially adversely affected.
Actions in 2016:1. A Vendor Security Management function
has been established2. A Vendor Management & Sourcing
function has been established
Nets Annual Report 2016 Risk management 35
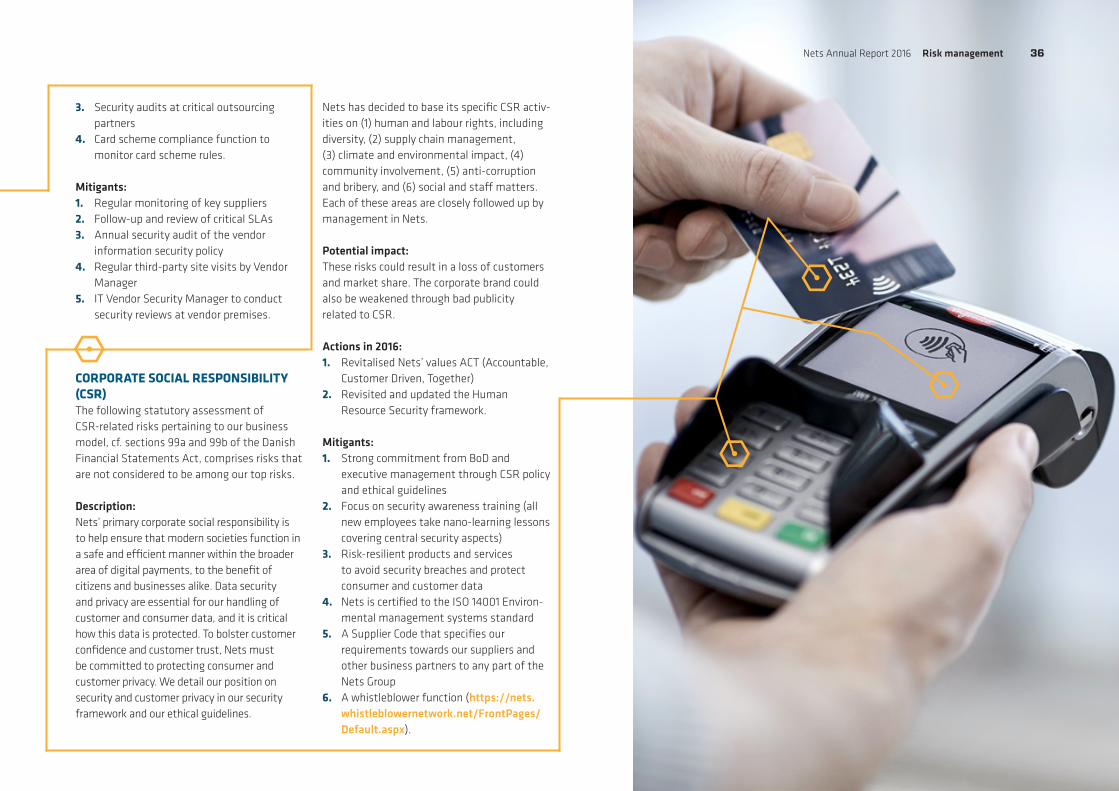
3. Security audits at critical outsourcing partners
4. Card scheme compliance function to monitor card scheme rules.
Mitigants:1. Regular monitoring of key suppliers2. Follow-up and review of critical SLAs3. Annual security audit of the vendor
information security policy4. Regular third-party site visits by Vendor
Manager5. IT Vendor Security Manager to conduct
security reviews at vendor premises.
CORPORATE SOCIAL RESPONSIBILITY (CSR)The following statutory assessment of CSR-related risks pertaining to our business model, cf. sections 99a and 99b of the Danish Financial Statements Act, comprises risks that are not considered to be among our top risks.
Description:Nets’ primary corporate social responsibility is to help ensure that modern societies function in a safe and efficient manner within the broader area of digital payments, to the benefit of citizens and businesses alike. Data security and privacy are essential for our handling of customer and consumer data, and it is critical how this data is protected. To bolster customer confidence and customer trust, Nets must be committed to protecting consumer and customer privacy. We detail our position on security and customer privacy in our security framework and our ethical guidelines.
Nets has decided to base its specific CSR activ-ities on (1) human and labour rights, including diversity, (2) supply chain management, (3) climate and environmental impact, (4) community involvement, (5) anti-corruption and bribery, and (6) social and staff matters. Each of these areas are closely followed up by management in Nets.
Potential impact:These risks could result in a loss of customers and market share. The corporate brand could also be weakened through bad publicity related to CSR.
Actions in 2016:1. Revitalised Nets’ values ACT (Accountable,
Customer Driven, Together) 2. Revisited and updated the Human
Resource Security framework.
Mitigants:1. Strong commitment from BoD and
executive management through CSR policy and ethical guidelines
2. Focus on security awareness training (all new employees take nano-learning lessons covering central security aspects)
3. Risk-resilient products and services to avoid security breaches and protect consumer and customer data
4. Nets is certified to the ISO 14001 Environ-mental management systems standard
5. A Supplier Code that specifies our requirements towards our suppliers and other business partners to any part of the Nets Group
6. A whistleblower function (https://nets.whistleblowernetwork.net/FrontPages/Default.aspx).
Nets Annual Report 2016 Risk management 36
The management of Nets is comprised by the Board of Directors and the Executive Management.
GovernanceNets Annual Report 2016 Governance 37

Corporate GovernanceOn 31 August 2016, shortly before the release of the intention to float announcement, Toscana Company ApS was transformed into a public limited company and changed its name to Nets A/S.
As a consequence of the public offering, Nets A/S became the parent company of the Nets Group on 23 September 2016 as part of the reorganisation described in the IPO prospectus.
MANAGEMENT STRUCTUREThe management of Nets is comprised of the Board of Directors and the Executive Manage-ment. The division of responsibility between the Board of Directors and the Executive Management is set out in the applicable rules of procedure.
The members of the Board of Directors are elect-ed by the shareholders at general meetings. The Board of Directors decides on the overall visions, strategies and objectives for the development of the Nets Group’s business.
The Executive Management, consisting of the CEO and CFO, is responsible for the day-to-day management of the Nets Group, including the implementation and execution of the strategies and objectives laid out by the Board of Directors.
BOARD OF DIRECTORS AND EXECUTIVE MANAGEMENTThe Board of Directors of Nets A/S consists of six members, who were appointed at the
formation of the company on 5 February 2016 or subsequently elected at extraordinary general meetings on 26 August 2016 and 23 September 2016, respectively.
According to the Articles of Association, the Board of Directors must consist of at least three and not more than eight members elect-ed at the general meeting. Each member is elected for a one-year term, and members may be re-elected. The composition of the Board of Directors is intended to ensure that the Board of Directors has a diverse competency profile enabling the Board of Directors to perform its duties in the best possible manner.
Four of the six members of the Board of Directors are considered independent under the Recommendations on Corporate Governance (please see below under Recommendations on Corporate Governance for further information on the Recommendations on Corporate Gover-nance). James Brocklebank and Robin Marshall, representatives of Advent and Bain Capital, respectively, are not considered independent.
It is the intention to have employee elected members of the Board of Directors in Nets A/S as of the annual general meeting of the company to be held on 22 March 2017.
Nets Annual Report 2016 Governance 38
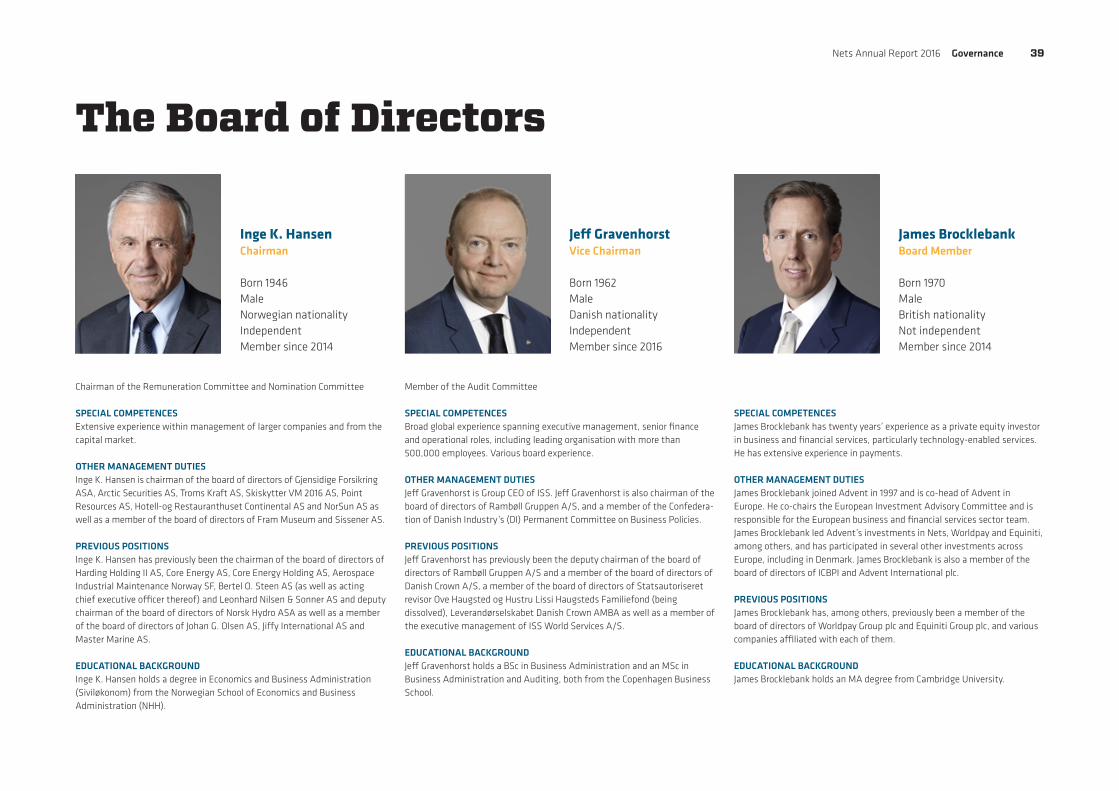
The Board of Directors
Inge K. HansenChairman
Born 1946MaleNorwegian nationalityIndependentMember since 2014
Jeff GravenhorstVice Chairman
Born 1962MaleDanish nationalityIndependentMember since 2016
James BrocklebankBoard Member
Born 1970MaleBritish nationalityNot independentMember since 2014
Chairman of the Remuneration Committee and Nomination Committee
SPECIAL COMPETENCESExtensive experience within management of larger companies and from the capital market.
OTHER MANAGEMENT DUTIESInge K. Hansen is chairman of the board of directors of Gjensidige Forsikring ASA, Arctic Securities AS, Troms Kraft AS, Skiskytter VM 2016 AS, Point Resources AS, Hotell-og Restauranthuset Continental AS and NorSun AS as well as a member of the board of directors of Fram Museum and Sissener AS.
PREVIOUS POSITIONSInge K. Hansen has previously been the chairman of the board of directors of Harding Holding II AS, Core Energy AS, Core Energy Holding AS, Aerospace Industrial Maintenance Norway SF, Bertel O. Steen AS (as well as acting chief executive officer thereof) and Leonhard Nilsen & Sonner AS and deputy chairman of the board of directors of Norsk Hydro ASA as well as a member of the board of directors of Johan G. Olsen AS, Jiffy International AS and Master Marine AS.
EDUCATIONAL BACKGROUNDInge K. Hansen holds a degree in Economics and Business Administration (Siviløkonom) from the Norwegian School of Economics and Business Administration (NHH).
Member of the Audit Committee
SPECIAL COMPETENCESBroad global experience spanning executive management, senior finance and operational roles, including leading organisation with more than 500,000 employees. Various board experience.
OTHER MANAGEMENT DUTIESJeff Gravenhorst is Group CEO of ISS. Jeff Gravenhorst is also chairman of the board of directors of Rambøll Gruppen A/S, and a member of the Confedera-tion of Danish Industry’s (DI) Permanent Committee on Business Policies.
PREVIOUS POSITIONSJeff Gravenhorst has previously been the deputy chairman of the board of directors of Rambøll Gruppen A/S and a member of the board of directors of Danish Crown A/S, a member of the board of directors of Statsautoriseret revisor Ove Haugsted og Hustru Lissi Haugsteds Familiefond (being dissolved), Leverandørselskabet Danish Crown AMBA as well as a member of the executive management of ISS World Services A/S.
EDUCATIONAL BACKGROUNDJeff Gravenhorst holds a BSc in Business Administration and an MSc in Business Administration and Auditing, both from the Copenhagen Business School.
SPECIAL COMPETENCESJames Brocklebank has twenty years’ experience as a private equity investor in business and financial services, particularly technology-enabled services. He has extensive experience in payments.
OTHER MANAGEMENT DUTIESJames Brocklebank joined Advent in 1997 and is co-head of Advent in Europe. He co-chairs the European Investment Advisory Committee and is responsible for the European business and financial services sector team. James Brocklebank led Advent’s investments in Nets, Worldpay and Equiniti, among others, and has participated in several other investments across Europe, including in Denmark. James Brocklebank is also a member of the board of directors of ICBPI and Advent International plc.
PREVIOUS POSITIONSJames Brocklebank has, among others, previously been a member of the board of directors of Worldpay Group plc and Equiniti Group plc, and various companies affiliated with each of them.
EDUCATIONAL BACKGROUNDJames Brocklebank holds an MA degree from Cambridge University.
Nets Annual Report 2016 Governance 39

The Board of Directors
Monica CanemanBoard Member
Born 1954FemaleSwedish nationalityIndependentMember since 2016
Per-Kristian HalvorsenBoard Member
Born 1951MaleNorwegian nationalityIndependentMember since 2015
Robin MarshallBoard Member
Born 1970MaleBritish nationalityNot independentMember since 2014
Chairman of the Audit Committee, Member of the Remuneration Committee and Nomination Committee
SPECIAL COMPETENCESDeep understanding of banking, card and payment operations.
OTHER MANAGEMENT DUTIESMonica Caneman is also the chairman of the board of directors of Bravida Holding AB, BIG BAG Group AB and Arion Bank hf as well as a member of the board of directors of Com Hem Holding AB and SAS AB.
PREVIOUS POSITIONSMonica Caneman has previously been the chairman of the board of directors of VIVA Media AB, VIVA Media Group AB, Frösunda Omsorg AB, Allenex AB and SOS International AS as well as a member of the board of directors of Intermail A/S, mySafety AB, Schibsted Sverige AB, Storebrand ASA, Poolia AB, Schibsted ASA, Electronic Transaction Group Nordic AB, Electronic Trans-action Group Nordic Holding AB, Investment AB Öresund, SPP Livförsäkring AB and SPP Pension & Försäkring AB. In addition, Monica Caneman has been the chairman of AP4 (The Fourth Swedish National Pension Fund).
EDUCATIONAL BACKGROUNDMonica Caneman holds a bachelor degree in Business Administration from the Stockholm School of Economics.
Member of the Audit Committee, Remuneration Committee and Nomination Committee
SPECIAL COMPETENCESPer-Kristian Halvorsen has extensive knowledge of technology having had a long career at leading technology centres such as MIT, the Xerox Palo Alto Research Center (PARC) and HP Laboratories. He is experienced in implementing system-level change to improve innovation capacity, having led the innovation and transformational change organisation at Intuit, a company widely recognised for its innovation capabilities. His work to establish research centres for both Xerox Corp. and HP in Europe, India and China has given him an international perspective on technology change.
OTHER MANAGEMENT DUTIESPer-Kristian Halvorsen is also senior vice president and senior fellow of Intuit Corp. as well as a member of the board of directors of Iron Mountain Inc.
PREVIOUS POSITIONSPer-Kristian Halvorsen has previously been chief innovation officer (and prior to that chief technology officer) of Intuit Corp. as well as a member of the board of directors of Autodesk Inc. and finn.no AS and Symantec Corp.
EDUCATIONAL BACKGROUNDPer-Kristian Halvorsen pursued undergraduate studies at Oslo University and holds a masters and a Ph.D. in Linguistics from the University of Texas at Austin.
SPECIAL COMPETENCESExecutive experience within private equity.
OTHER MANAGEMENT DUTIESRobin Marshall joined Bain Capital in 2009 and is Co-Head of Bain Capital in Europe. Robin led Bain Capital’s investments in Nets, Worldpay, ICBPI, Securitas Direct, amongst several others. In addition to Nets, he is currently a member of the board of directors of ICBPI and a member of the partner-ship Bain Capital Private Equity (Europe) LLP.
PREVIOUS POSITIONSRobin Marshall has previously been a member of the board of directors of Worldpay Group plc, Ship Investors S.à r.l., Ship Luxco Holding S.à r.l., Ship Holdco Limited, Ship Midco Limited, NAGA UK Bidco Limited, NAGA UK Topco Limited, NAGA 1 (BC) S.à r.l., NAGA 2 (BC) S.à r.l., Bain Capital Ship S.à r.l. and Verisure Topholding AB and Quintiles.
EDUCATIONAL BACKGROUNDRobin Marshall holds an MA degree from the University of Glasgow.
Nets Annual Report 2016 Governance 40
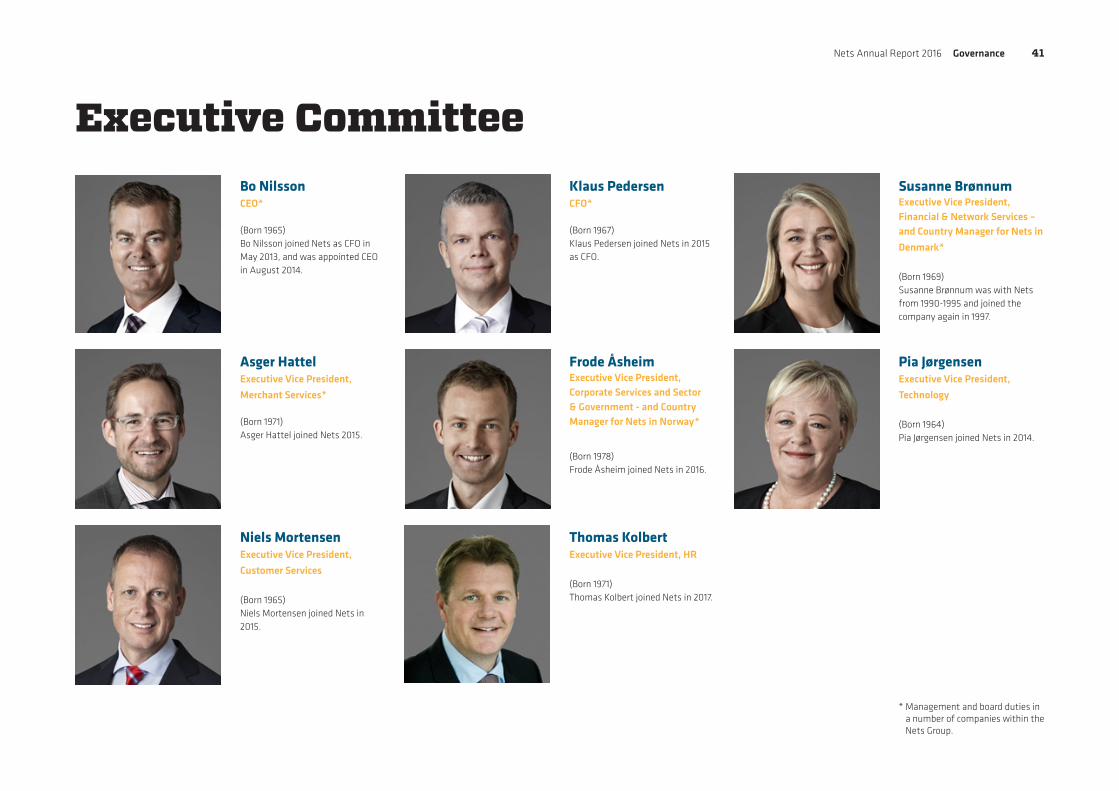
Executive CommitteeBo NilssonCEO*
(Born 1965)Bo Nilsson joined Nets as CFO in May 2013, and was appointed CEO in August 2014.
Klaus PedersenCFO*
(Born 1967)Klaus Pedersen joined Nets in 2015 as CFO.
Susanne BrønnumExecutive Vice President, Financial & Network Services – and Country Manager for Nets in
Denmark*
(Born 1969)Susanne Brønnum was with Nets from 1990-1995 and joined the company again in 1997.
Asger HattelExecutive Vice President,
Merchant Services*
(Born 1971)Asger Hattel joined Nets 2015.
Frode ÅsheimExecutive Vice President, Corporate Services and Sector & Government - and Country Manager for Nets in Norway*
(Born 1978)Frode Åsheim joined Nets in 2016.
Pia JørgensenExecutive Vice President,
Technology
(Born 1964)Pia Jørgensen joined Nets in 2014.
* Management and board duties in a number of companies within the Nets Group.
Niels MortensenExecutive Vice President,
Customer Services
(Born 1965)Niels Mortensen joined Nets in 2015.
Thomas KolbertExecutive Vice President, HR
(Born 1971)Thomas Kolbert joined Nets in 2017.
Nets Annual Report 2016 Governance 41

BOARD COMMITTEESIn order to support the Board of Directors and advise it on its responsibilities to shareholders, employees and other company stakeholders, the following three board committees have been established: Audit Committee, Remuneration Committee and Nomination Committee. The committees perform preparatory tasks and make recommendations to the Board of Directors, but the final decisions are made by the Board of Directors. The main tasks, responsibilities and duties of each committee are set out in a separate charter for each committee. Each charter is reviewed, and if deemed appropriate updated, and approved annually by the Board of Directors.
The committee members, including the chairman, are appointed by the Board of Directors amongst the members of the Board of Directors. All members of the committees are independent, and the committees therefore meet the independence requirement set out in the “Recommendations on Corpo-rate Governance” (please see below under Recommendations on Corporate Governance for further information on the Recommenda-tions on Corporate Governance).
AUDIT COMMITTEEThe Audit Committee consists of three members of the Board of Directors, Monica Caneman (chairman), Jeff Gravenhorst and Per-Kristian Halvorsen. Its purpose is to review accounting and audit matters and assess the internal control and risk management system of the Nets Group. The Audit Committee’s duties also include
the supervision of the Nets Group’s external auditors and review of the audit process as well as the supervision of the Nets Group’s internal systems audit.
The Audit Committee meets at least four times a year.
REMUNERATION COMMITTEEThe Remuneration Committee consists of three members of the Board of Directors, Inge K. Hansen (chairman), Monica Caneman and Per-Kristian Halvorsen. Its purpose is to ensure that Nets maintains a remuneration policy for the members of the Board of Directors and the Executive Management, including incentive guidelines, and to evaluate and make recommendations for the remuneration of the members of the Board of Directors and the Executive Management.
The remuneration of both the Board of Directors and the Executive Management shall contribute to the creation of value and support both the short- and long-term objectives of Nets. The remuneration of the Board of Directors and the Executive Management is assessed annually.
The Remuneration Committee meets at least four times a year.
NOMINATION COMMITTEEThe Nomination Committee consists of three members of the Board of Directors, Inge K. Hansen (chairman), Monica Caneman and Per-Kristian Halvorsen. Its purpose is to assist the Board of Directors in ensuring that appropriate plans and processes are in place for the nomination of candidates to the Board
of Directors, the Executive Management and the board committees.
Moreover, the Nomination Committee shall evaluate the composition of the Board of Directors and the Executive Management. This includes making recommendations for the nomination or appointment of members of (a) the Board of Directors, (b) the Executive Management and (c) the board committees established by the Board of Directors. As the company was dormant until immediately prior to being listed on Nasdaq Copenhagen, the Board of Directors has decided not to conduct the annual evaluation of the Board of Directors during the financial year 2016. The evaluation will instead be conducted in 2017 and thereaf-ter annually.
The Nomination Committee shall also monitor the composition of the management in the Nets Group’s subsidiaries and ensure that proposed members of management in subsidiaries, where management is subject to statutory “fit and proper” requirements, are appointed in accordance herewith.
The Nomination Committee meets at least once a year.
1. Corporate Governance Guidelines
The corporate governance guidelines provide the overall direction for the Board of Directors and Executive Management when defining their working procedures and principles as well as contributing to ensuring reliable informa-tion, transparency and insight for stakeholders into Nets’ business.
RECOMMENDATIONS ON CORPORATE GOVERNANCEAs a listed company, Nets observes the “Recommendations on Corporate Governance” implemented by NASDAQ Copenhagen in its “Rules for issuers of shares” (issued in May 2013 and updated in November 2014). The “Recommendations on Corporate Governance” contain 47 recommendations and are based on the comply-or-explain principle, which makes it legitimate for a company to explain why it does not comply with them. Nets fully complies with 46 of the 47 recommendations, and therefore complies with the “Recom-mendations on Corporate Governance” in all material respects.
Nets has opted not to comply with the recom-mendation that if share-based remuneration is provided, such programmes be established as roll-over programmes (recommendation no. 4.1.4 of the “Recommendations on Corporate Governance”).
The background for not complying with this recommendation is that Nets has implement-ed a share-based retention programme for the Executive Management and certain other employees, where the participant may be granted Nets shares 720 days after the Ad-mission (the “Vesting Period”) for an amount equal to 24 months’ base salary (based on the salary in the last calendar month prior to Admission), provided, among other things, that the participant in question has retained a specific minimum holding of Nets shares at the end of the Vesting Period. Accordingly, the shares capable of vesting under the retention programme may be awarded earlier than three years after the programme was introduced.
Nets Annual Report 2016 Governance 42

The retention programme has been estab-lished as a one-time programme with a view to bridge the intermediate period between the initial public offering and the first three-year vesting period under Nets’ long-term incentive programme.
Further, Nets has established a Post-IPO Long-Term-Incentive-Programme (LTIP) for the Executive Management and certain other employees. Under the Post-IPO LTIP, the participants are granted share options which will vest based on achievement of certain financial targets during the three financial years subsequent to grant (the first being the financial year in which the grant occurs). Upon vesting, the holder may exercise vested share options during open trading windows following publication of the annual report for the third financial year following grant and quarterly financial reports over a two-year exercise period. As the first grant of share options was completed in connection with the initial public offering, the share options comprised by the first grant may vest in the first quarter of 2019 after publication of the annual report for 2018. Consequently, the share options comprised by the first grant may vest earlier than three years after grant. All subsequent grants under the Post-IPO LTIP are expected to have a vesting period of three years.
WHISTLEBLOWERThe whistleblower scheme of the Nets Group continues to be in effect, allowing employees, the Executive Management, the Board of Directors and external stakeholders to report serious violations or misconduct, or suspicions thereof. The whistleblower scheme is an independent and autonomous channel, and any submitted reports will be received directly by an external law firm. A reported concern is forwarded to the Audit Committee, who will look into the matter promptly and thoroughly take appropriate action.
2. Report
The Danish Financial Statements Act Section 107b requires that a statement on corporate governance for the financial year is prepared. This statement forms part of the Manage-ment's Review and can be viewed at: https://investor.nets.eu/corporate-gover-nance
Nets Annual Report 2016 Governance 43

Statutory statement on Corporate Social ResponsibilityThis statutory statement on corporate social responsibility, cf. sections 99a and 99b of the Danish Financial Statements Act, forms part of the Management’s Review in our 2016 annual report and covers the financial period 1 January – 31 December. During the financial year, Nets has become a listed company, and thus a class D company cf. the Danish Financial Statements Act, as of 23 September 2016, i.e. for a period of 3 months and 8 days within the financial year 2016.
Due to our presence throughout the Nordic payments ecosystem and through our services within digital identity and information services, our company plays a central role in the digitisation of the Nordic societies and the appertaining need for security and stability that is fundamental for the payments infrastructure. Our products and services are integrated parts of the daily lives of the majority of the Nordic population, not least in Denmark and Norway. To our customers – corporates, merchants and banks – and end-users, we provide a frictionless payment experience, a.o., while the reality behind this seemingly simple exchange of services is a complex web of processes initiated by a digital transaction such as a payment, an authentica-tion or a digital login.
As a corporate citizen, we strive to support and enable the further digitisation of the Nordic societies through the application of our core competences. We fully recognise and respect the social and environmental impact we have
on the communities in which we operate and work continuously to earn the trust of our many stakeholders, aiming to make social responsibility an integral part of the daily running of our business.
CONDUCTING OUR BUSINESS IN A RESPONSIBLE MANNERFor CSR-related risks pertaining to our business model, please refer to Risk Management, on p 30. Our business model is described on p 10.
Nets’ CSR approach is based on the ten principles set out in the UN Global Compact and consists of the following themes: a) human rightsb) climate and environmentc) workplace responsibilityd) anti-corruption and briberye) community involvementf) equal opportunities for both women
and men, cf. section 99b of the Danish Financial Statements Act on the under- represented gender.
Nets is currently not a member of the UN Global Compact but we respect and adhere to its principles. During 2017, we will revisit our corporate social responsibility approach with an ambition to work strategically within the area in the years to come
Our CSR approach is based on a foundation of ethical guidelines that are mandatory to comply with for all employees across the Nets Group, publicly available on our website nets.eu and on our intranet.
As a company, we are very conscious of our obligation to act diligently in every way and therefore carefully review, assess and conduct our business and recruitment of employees.
A) HUMAN RIGHTS
PoliciesNets’ approach to human rights is firmly based on our core values ACT, mentioned below, and our ethical guidelines. Our Human & Labour Rights policy is guided by the United Nations’ Declaration of Human Rights and the ILO Declaration on Fundamental Principles and Rights at Work. The policy covers key issues of importance to the Nets Group and our employees. Nets’ policy on Human and Labour Rights applies to all wholly-owned subsidiaries, including all employees in those companies.
As a Nordic employer operating in a highly regulated private sector labour market, we naturally comply with the rules and regulations of the countries in which we operate. Nets respects the rights of all workers to form and join a trade union of their choice without any fear of intimidation or reprisal, in accordance with national law. In Denmark, Norway,
Nets Annual Report 2016 Governance 44
Finland and Sweden, Nets cooperates with different employers’ organisations and trade unions. Employees are covered by collective agreements in the respective countries with additional local agreements for employees in Denmark and Norway.
Our Nets Policy on Human and Labour Rights covers items such as non-discrimination, forced compulsory labour, the freedom of as-sociation and the right to collective bargaining as well as harassment and minimum wage and working hours, many of which are also covered in the Nets Ethical Guidelines. For the Nets Diversity Policy, please refer to section f) under the heading: “Equal opportunities for both women and men cf. section 99b of the Danish Financial Statements Act on the underrepresented gender.” In addition to these and national legislation, our HR Handbook includes local language items such as a Dignity Policy (listed under the heading ‘Respect and Equality’).
At Nets, we recognise a diverse workforce as a prerequisite for a sound and sustainable company, able to tap into the entire talent pool. We aspire to be an attractive workplace for all current and future employees, and we aim to offer employment on an equal basis, ensuring that all our colleagues have equal opportunities for furthering their careers and securing management roles in the company, regardless of their national or ethnic origin, disability, age, gender, sexual orientation, or religion/belief.
Operating in an international context, Nets is fully committed to complying with legislation and recognised international business stan-
dards that apply to our field of work. Moreover, we consider it our responsibility to ensure sound business practices throughout our value chain. In the light of that commitment, we have introduced a Supplier Code that specifies our requirements towards our suppliers and other business partners for any part of the Nets Group.
Actions Towards our employees, we follow national legislation and Nets’ Ethical Guidelines concerning anti-discrimination and anti- harassment and received no complaints within these areas in 2016.
When initiating discussions with potential suppliers and subcontractors, we are focused on their past track records, production facilities, working environment, use of materials, etc. Compliance with our Supplier Code is a prerequisite for initiating or continu-ing a business relationship with Nets, and we select suppliers not only based on economic criteria and the ability to deliver the required services in a professional manner, but also on the ability to meet the principles laid out in said Code. Our Supplier Code is included in all agreements between suppliers and Nets, and in cases where specific issues arise that require documentation, we work closely with our suppliers to handle these.
ResultsAt year-end, Nets employed nine different nationalities, with an ambition to attract more non-locals and thus access the global talent pool within areas such as information technology and software development.
In terms of supply chain management, we have a list of preferred suppliers with whom we have close business relationships. The list is divided into several categories such as human resources, marketing, travel, professional services, hardware, network and telecoms and terminals.
B) CLIMATE AND ENVIRONMENT
PoliciesAt Nets, we aim to run our operations in an environmentally conscious way. We support a preventative approach to environmental challenges and we are committed to being an environmentally conscious service provider and business partner, working strategically and systematically based on the requirements of the ISO14001 standard towards minimising our environmental impact at every level of our organisation.
The Nets Group Environmental Policy is available on our group intranet and on nets.eu.
Actions and due diligence In 2016, we continued to raise awareness of our environmental policy throughout the organisation. We focused on integrating the ISO14001 standard in our daily work and have adjusted several processes and work flows to efficiently support our daily activities. This has led to significant reductions in CO
2 emissions,
paper consumption, waste and electricity – for more details, please see the tables below.
ResultsAll our locations passed the internal and external audit 2016 for ISO14001, with minor remarks, and we have introduced awareness
campaigns and implemented several improve-ments and specifications at all the locations.
In Norway, for instance, we have made the environmental aspect, including an e-learning course, part of the induction course for new colleagues, and our intranets feature environ-mental sites as well.
Overall, we continuously improve our processes for registration of consumption, legislation, non-conformities and suggestions for improvements, both locally and globally.
Nets’ environmental focus areas and targets for 2012 – 2020:
1) Reducing CO2 emissions from travel
between locations by 50%
The implemented measures gave good results in 2016. The reduction has, as expected, flattened out somewhat compared to previous years, but is still in line with our long-term target of a 50% reduction by 2020.
2015 2016
2,584 tonnes CO2
saved – a 57% decrease compared to 2014
2,917 tonnes CO2
saved – A 13% decrease compared to 2015
In 2017 we will continue our work to reduce CO
2 emissions, and we are considering setting
new, annual targets.
Reducing energy consumption for building operations by 15%
Nets Annual Report 2016 Governance 45
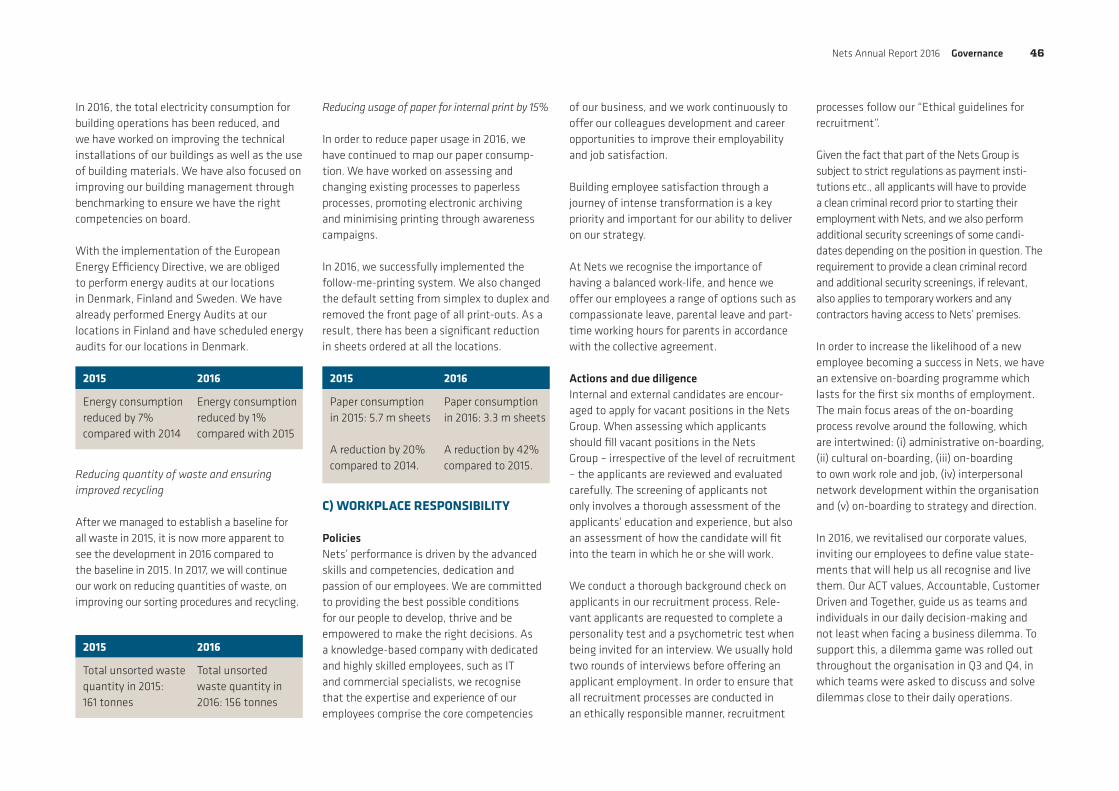
In 2016, the total electricity consumption for building operations has been reduced, and we have worked on improving the technical installations of our buildings as well as the use of building materials. We have also focused on improving our building management through benchmarking to ensure we have the right competencies on board.
With the implementation of the European Energy Efficiency Directive, we are obliged to perform energy audits at our locations in Denmark, Finland and Sweden. We have already performed Energy Audits at our locations in Finland and have scheduled energy audits for our locations in Denmark.
Reducing quantity of waste and ensuring improved recycling
After we managed to establish a baseline for all waste in 2015, it is now more apparent to see the development in 2016 compared to the baseline in 2015. In 2017, we will continue our work on reducing quantities of waste, on improving our sorting procedures and recycling.
Reducing usage of paper for internal print by 15%
In order to reduce paper usage in 2016, we have continued to map our paper consump-tion. We have worked on assessing and changing existing processes to paperless processes, promoting electronic archiving and minimising printing through awareness campaigns.
In 2016, we successfully implemented the follow-me-printing system. We also changed the default setting from simplex to duplex and removed the front page of all print-outs. As a result, there has been a significant reduction in sheets ordered at all the locations.
C) WORKPLACE RESPONSIBILITY
PoliciesNets’ performance is driven by the advanced skills and competencies, dedication and passion of our employees. We are committed to providing the best possible conditions for our people to develop, thrive and be empowered to make the right decisions. As a knowledge-based company with dedicated and highly skilled employees, such as IT and commercial specialists, we recognise that the expertise and experience of our employees comprise the core competencies
of our business, and we work continuously to offer our colleagues development and career opportunities to improve their employability and job satisfaction.
Building employee satisfaction through a journey of intense transformation is a key priority and important for our ability to deliver on our strategy.
At Nets we recognise the importance of having a balanced work-life, and hence we offer our employees a range of options such as compassionate leave, parental leave and part-time working hours for parents in accordance with the collective agreement.
Actions and due diligenceInternal and external candidates are encour-aged to apply for vacant positions in the Nets Group. When assessing which applicants should fill vacant positions in the Nets Group – irrespective of the level of recruitment – the applicants are reviewed and evaluated carefully. The screening of applicants not only involves a thorough assessment of the applicants’ education and experience, but also an assessment of how the candidate will fit into the team in which he or she will work.
We conduct a thorough background check on applicants in our recruitment process. Rele-vant applicants are requested to complete a personality test and a psychometric test when being invited for an interview. We usually hold two rounds of interviews before offering an applicant employment. In order to ensure that all recruitment processes are conducted in an ethically responsible manner, recruitment
processes follow our “Ethical guidelines for recruitment”.
Given the fact that part of the Nets Group is subject to strict regulations as payment insti-tutions etc., all applicants will have to provide a clean criminal record prior to starting their employment with Nets, and we also perform additional security screenings of some candi-dates depending on the position in question. The requirement to provide a clean criminal record and additional security screenings, if relevant, also applies to temporary workers and any contractors having access to Nets’ premises.
In order to increase the likelihood of a new employee becoming a success in Nets, we have an extensive on-boarding programme which lasts for the first six months of employment. The main focus areas of the on-boarding process revolve around the following, which are intertwined: (i) administrative on-boarding, (ii) cultural on-boarding, (iii) on-boarding to own work role and job, (iv) interpersonal network development within the organisation and (v) on-boarding to strategy and direction.
In 2016, we revitalised our corporate values, inviting our employees to define value state-ments that will help us all recognise and live them. Our ACT values, Accountable, Customer Driven and Together, guide us as teams and individuals in our daily decision-making and not least when facing a business dilemma. To support this, a dilemma game was rolled out throughout the organisation in Q3 and Q4, in which teams were asked to discuss and solve dilemmas close to their daily operations.
2015 2016
Energy consumption reduced by 7% compared with 2014
Energy consumption reduced by 1% compared with 2015
2015 2016
Paper consumption in 2015: 5.7 m sheets A reduction by 20% compared to 2014.
Paper consumption in 2016: 3.3 m sheets
A reduction by 42% compared to 2015.
2015 2016
Total unsorted waste quantity in 2015: 161 tonnes
Total unsorted waste quantity in 2016: 156 tonnes
Nets Annual Report 2016 Governance 46
ResultsThe dilemma game was played by 50% of all employees at all levels, including the Executive Committee, in 2016. The remaining part of the organisation will have played the game by the end of Q1 2017.
D) ANTI-CORRUPTION AND BRIBERY
PoliciesNets is fully committed to complying with regulations and conventions to prevent corruption and bribery. We recognise in-ternational business standards that apply to the industries in which we operate, and we advocate for sound business practices throughout our value chain, with a zero-toler-ance stance on corruption. Operating mainly in the Nordic region characterised by an advanced level of regulation and which, according to Transparency International, is the least corrupt region globally,3 we estimate that we are covered well by local legislation, supplemented by our anti-bribery policy which conveys our strict stance on corruption.
Nets implemented a whistleblower scheme in 2014, in which employees, management and community stakeholders may report serious vio-lations or misconduct, or suspicion thereof, that may impact the Nets Group as a whole or the life or health of an individual. Reports are received and investigated by an external law firm, and reports may be submitted anonymously.
Actions and due diligenceIn 2016, our colleagues were reminded of our whistleblower scheme by means of a news
article on our group intranet, which also features a subsite informing about the scheme and links on how to submit a report under the whistleblower scheme.
Customers, vendors, consultants and other external parties are able to report under the whistleblower scheme through our website. Any reports received are investigated by an external law firm.
ResultsIn 2016, the number of reports through our whistleblower function was zero.
E) COMMUNITY INVOLVEMENT
As a corporate citizen with activities spanning across the Nordic region and part of the Baltics, we support causes that are close to our business and will have a positive impact on people and communities in general.
Progress in 2016During the year, we have supported a number of organisations and causes. Save The Children Denmark have received donations from our customer satisfaction survey, where we donate DKK 100 per respondent, along with the proceeds we get from the sale of second-hand hardware through our broker. At the national fundraising campaigns ’Danmarks Indsamling’ and ‘The Danish Cancer Society’, we made donations to each cause, and Nets Finland Oy made a monthly donation to Plan International Child monthly. As our corporate headquarters are located in Ballerup, Greater Copenhagen, we also support local top-level sport through a donation to Team Ballerup.
3 http://www.transparency.org/cpi2015#results-table
In addition, we have continued and expanded our partnership with ISOBRO, the Danish Fundraising Association, to support more effective collection methods as well as by contributing to the training of organisational staff.
F) EQUAL OPPORTUNITIES FOR BOTH GENDERS
This statutory corporate social responsibility statement, cf. section 99b of the Danish Finan-cial Statements Act, forms part of the Manage-ment’s Review in our 2016 annual report. This section addresses the reporting require-ments on the underrepresented gender under section 99b of the Danish Financial State-ments Act. The reporting requirement under the Danish Financial Statements Act requires a status on the set target to increase gender diversity on the board of directors, cf. section 99b (1), and a description of the development and initiatives to achieve a gender balance amongst other executives, cf. section 99b (2).
Further, this section only describes the development in the Nets Group as a whole and in Nets Group companies which, due to their size and geographical location, are subject to the requirements, i.e. Nets Denmark A/S and Teller A/S.
As we have set a target figure on a corporate level, the companies within the Nets Group need not set company-specific target figures for gender balance on a board level.
3. Board of Directors
PolicyNets A/S has set a target of one female member of the Board of Directors, consisting of a total of six members elected at the general meeting, to be achieved by 2017.
Nets Denmark A/S has set a target of one female member of the Board of Directors, consisting of a total of four members elected at the general meeting, to be achieved by 2017.
Teller A/S has set a target of one female member of the Board of Directors, consisting of a total of three members elected at the general meeting, to be achieved by 2017.
Continuing effort to maintain gender balanceIn the Nomination Committee’s continuous work to attract competent and diverse members to the Board of Directors of Nets A/S it will maintain its focus on gender balance on the Board of Directors.
In regard to Nets Denmark A/S and Teller A/S, the members of the Board of Directors are employees of the Nets Group. The Nets Group focuses on increasing the qualifications of both female and male employees and has implemented a number of procedures to accomplish this, which are described in further detail under “2. Other executives” below.
Nets Annual Report 2016 Governance 47
Current statusBy the end of 2016, the Board of Directors of Nets A/S consisted of one female director and five male directors. The objective with regard to gender diversity on the Board of Directors was met in March 2016 when we had the opportunity to include Monica Caneman on the Board of Directors.
In Nets Denmark A/S, one out of four members of the board of directors elected at the general meeting is female, and hence the target of one female board member on Nets Denmark A/S’ board of directors has already been achieved. Nets aims to retain this gender balance for the next year.
In Teller A/S, one of four members of the board of directors elected at the general meeting is female, and hence the target of one female board member on Teller A/S’ board of directors has been achieved. Teller A/S aims to retain this gender balance for the next year.
4. Other executives
PolicyNets continues to strive for a gender balance (40/60) of capable female and male execu-tives. In order to achieve this goal we have set out a range of initiatives in our Diversity Policy.
Continuing efforts to achieve gender balanceIt is important for Nets to attract many skilled candidates of both genders to choose from when filling management positions, and we therefore strive to broaden the field of candidates as much as possible. Further, the employment procedures are designed to give
men and women equal opportunities to apply for and obtain management positions.
In 2017, we will continue our focus on increas-ing gender balance at board and management level through, i.a.:
• a boilerplate text in all job ads encour-aging all interested and qualified parties to apply irrespective of gender, age, race, religion or ethnicity;
• a tool to weed out gender-biased language in job ads, allowing us access to all talent regardless of gender;
• discussing managerial aspirations and ambitions in regular annual employee development dialogues;
• a sensible work/life balance being offered to reconcile the demands of working life and family life;
• when conducting job interviews, we endeavour to ensure that both genders are represented on the list of relevant candidates
Current statusThe Executive Committee consists of the registered Executive Management (consisting of the CEO and CFO) as well as the top management of the business units and group functions of the Nets Group, and the Executive Committee therefore functions across the Nets Group as a whole. The Executive Com-mittee consists of eight members of which two are female. The percentage of women in the Executive Committee has remained unchanged during the course of 2016.
In other managerial positions (management levels three to six) as of 31st December 2016, the number of women in management positions accounted to 32% which is a decline from 2015 (34%) and below our target of 40%. The representation of women at management levels three to six corresponds in overall terms to the gender distribution of our entire workforce. This again reflects the gender distribution among graduates within areas such as information technology and software development, which are profiles we typically employ.
Nets Annual Report 2016 Governance 48
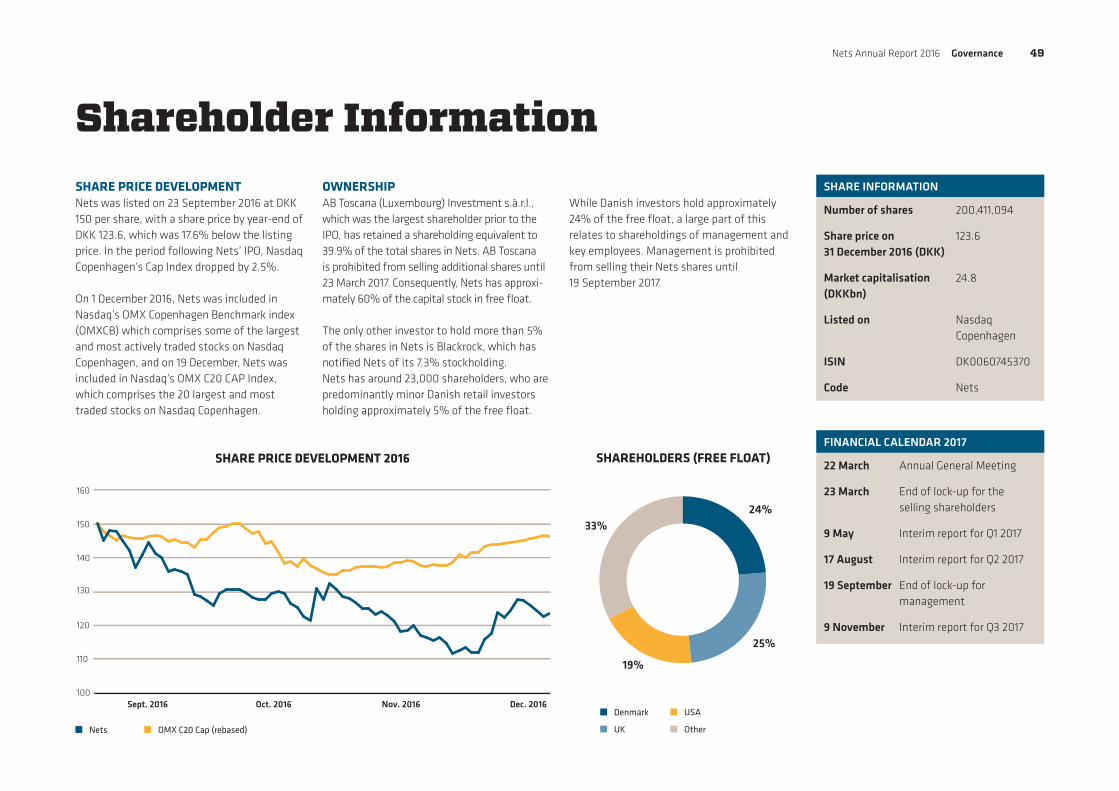
Shareholder InformationSHARE PRICE DEVELOPMENTNets was listed on 23 September 2016 at DKK 150 per share, with a share price by year-end of DKK 123.6, which was 17.6% below the listing price. In the period following Nets’ IPO, Nasdaq Copenhagen’s Cap Index dropped by 2.5%.
On 1 December 2016, Nets was included in Nasdaq’s OMX Copenhagen Benchmark index (OMXCB) which comprises some of the largest and most actively traded stocks on Nasdaq Copenhagen, and on 19 December, Nets was included in Nasdaq’s OMX C20 CAP Index, which comprises the 20 largest and most traded stocks on Nasdaq Copenhagen.
OWNERSHIPAB Toscana (Luxembourg) Investment s.à.r.l., which was the largest shareholder prior to the IPO, has retained a shareholding equivalent to 39.9% of the total shares in Nets. AB Toscana is prohibited from selling additional shares until 23 March 2017. Consequently, Nets has approxi-mately 60% of the capital stock in free float.
The only other investor to hold more than 5% of the shares in Nets is Blackrock, which has notified Nets of its 7.3% stockholding. Nets has around 23,000 shareholders, who are predominantly minor Danish retail investors holding approximately 5% of the free float.
19%
33%24%
25%
Denmark
UK
USA
Other
SHAREHOLDERS (FREE FLOAT)
SHARE INFORMATION
Number of shares 200,411,094
Share price on 31 December 2016 (DKK)
123.6
Market capitalisation (DKKbn)
24.8
Listed on Nasdaq Copenhagen
ISIN DK0060745370
Code Nets
FINANCIAL CALENDAR 2017
22 March Annual General Meeting
23 March End of lock-up for the selling shareholders
9 May Interim report for Q1 2017
17 August Interim report for Q2 2017
19 September End of lock-up for management
9 November Interim report for Q3 2017
While Danish investors hold approximately 24% of the free float, a large part of this relates to shareholdings of management and key employees. Management is prohibited from selling their Nets shares until 19 September 2017.
100
110
120
130
140
150
160
SHARE PRICE DEVELOPMENT 2016
Sept. 2016 Oct. 2016 Nov. 2016 Dec. 2016
Nets OMX C20 Cap (rebased)
Nets Annual Report 2016 Governance 49

DIVIDENDNets’ leverage by year-end 2016 was 3.2x net interest-bearing debt to EBITDA b.s.i. Nets aims at a medium-term leverage target of 2.0x-2.5x and has consequently decided to postpone dividend payments until the target is reached. The first dividend payment is expected to take place in 2018 on the basis of the 2017 annual report, assuming there are no major M&A activities.
From 2018, Nets expects to pay out 20-30% of the annual net profit. The actual dividend pay-ment will be subject to the capital allocation principles whereby Nets will primarily invest in organic growth and secondly in bolt-on M&A opportunities. Any additional cash available after payment of the ordinary dividend can be distributed either via share buybacks and/or extraordinary dividends.
In 2017, Nets will grant a share-based Long-Term Incentive Programme (LTIP) in which the Executive Management, Group Management and a few other employees will receive a number of share options as determined by the Board of Directors in their sole discretion. The grant will follow the same principles on grant size, performance and vesting criteria etc. as the Long-Term Incentive Programme granted in connection with the public offering in September 2016. I.e. a maximum 0.75% of Nets’ share capital shall be granted. During 2017, Nets plans to buy back shares to cover the obligations under this grant.
ANNUAL GENERAL MEETINGThe annual general meeting will be held at 4 pm CET on 22 March 2017 at the Tivoli Hotel & Congress Center, Arni Magnussons Gade 2-4, 1577 Copenhagen V, Denmark.
Nets distributes all material relating to the annual general meeting electronically. Shareholders wishing to receive the material by mail may log in to our shareholder portal and register their e-mail address: https://nets.eu/shareholderportal.
INVESTOR RELATIONSThe overall objective of our investor relations is to ensure timely, equal and adequate access to relevant information by communicating to the financial markets as a basis for regular trading and fair pricing of the Company’s shares. This is done through a continuous dialogue with investors and analysts to make sure that these have a good understanding of our business activities and strategic and commercial development.
All investor-related material is available on the company’s website, including financial reports, presentations and corporate announcements. Current and potential investors may also sign up for e-mail alerts on the website: https://investor.nets.eu/email-alerts.
During the IPO process and following our listing, we have held meetings with investors and analysts as well as attended several confer-ences. The majority of the investor meetings were held in Denmark, the UK and the US, but we have also travelled to a number of European countries to meet investors and analysts.
Nets is currently covered by 15 analysts who regularly publish their research. The majority of them provide an expected price target on a 12-month basis as well as a recommendation. All analysts are listed on our website: https://investor.nets.eu
Nets Annual Report 2016 Governance 50

Nets is a leading provider of payment services and related technology solutions across the Nordic region. We operate a centre for the payment ecosystem and a secure, reliable and deeply entrenched network, which connects merchants, corporations, financial institutions and consumers, enabling them to make and receive payments as well as, increasingly, utilise value added services to help them improve their respective activities. Our primary focus is on the Nordic region.
Financialstatements
Nets Annual Report 2016 Financial statements 51

Statement by the Board of Directors and Executive Management
Bo NilssonCEO
Klaus PedersenCFO
Inge K. HansenChairman
Robin MarshallMonica Caneman
Jeff GravenhorstVice Chairman
James Brocklebank
Per-Kristian Halvorsen
Nets Annual Report 2016 Financial statements 52
In our opinion, the Management Review includes a true and fair account of the devel-opment in the Group’s and the parent compa-ny’s operations and financial conditions, the results for the year, cash flows and financial position as well as a description of the most significant risks and uncertainty factors that the Group and the parent company face.
We recommend that the annual report be approved at the annual general meeting.
Ballerup, 28 February 2017
The consolidated financial statements have been prepared in accordance with International Financial Reporting Standards as adopted by the European Union and further requirements according to the Danish Financial Statements Act. The financial statements of the parent company have been prepared in accordance with the Danish Financial Statements Act.
It is our opinion that the consolidated financial statements and the parent company financial statements give a true and fair view of the Group’s and the parent company’s financial position at 31 December 2016, the results of the Group and parent company’s operations and consolidated cash flows for the financial year 1 January – 31 December 2016.
EXECUTIVE MANAGEMENT
BOARD OF DIRECTORS
The Board of Directors and the Executive Management have today discussed and approved the annual report of Nets A/S for the financial year 2016.
Nets Annual Report 2016 Financial statements 53
Independent auditor’s report
OUR OPINIONIn our opinion, the consolidated financial state-ments give a true and fair view of the Group’s financial position at 31 December 2016 and of the results of the Group’s and operations and cash flows for the financial year 1 January to 31 December 2016 in accordance with International Financial Reporting Standards as adopted by the EU and further requirements in the Danish Financial Statements Act.
Moreover, in our opinion, the financial statements of the parent company give a true and fair view of the parent company’s financial position at 31 December 2016 and of the results of the parent company’s operations for the financial year 1 Janu-ary to 31 December 2016 in accordance with the Danish Financial Statements Act.
What we have auditedNets’ consolidated financial statements and the financial statements of the parent com-pany for the financial year 1 January to 31 December 2016 comprise income statement, balance sheet, statement of changes in equity and notes to the financial statements, includ-ing summary of significant accounting policies for the Group as well as for the parent com-pany and statement of comprehensive income and cash flow statement for the Group.
Collectively referred to as the “financial state-ments”.
BASIS FOR OPINIONWe conducted our audit in accordance with International Standards on Auditing (ISAs) and additional requirements applicable in Denmark. Our responsibilities under those standards and requirements are further described in the Audi-tor’s Responsibilities for the Audit of the Finan-cial Statements section of our report.
We believe that the audit evidence we have obtained is sufficient and appropriate to pro-vide a basis for our opinion.
IndependenceWe are independent of the Group in accor-dance with International Ethics Standards Board for Accountants’ Code of Ethics for Pro-fessional Accountants (IESBA Code) and the ethical requirements that are relevant to our audit of financial statements in Denmark. We have also fulfilled our other ethical responsibil-ities in accordance with the IESBA Code.
KEY AUDIT MATTERSKey audit matters are those matters that, in our professional judgment, were of most sig-nificance in our audit of the financial state-ments for 2016. These matters were addressed in the context of our audit of the financial statements as a whole, and in forming our opinion thereon, and we do not provide a sepa-rate opinion on these matters.
Key Audit MatterHow our Audit Addressed the Key Audit Matter
Accuracy, cut-off and classification of transaction-based revenue and settlement balances
Nets are highly dependent upon high availabil-ity of IT systems and multiple, complex plat-forms as basis for the business activities, espe-cially in relation to the processing of payments, i.e. payment solutions for merchants and card processing services as well as other transac-tion-based revenue, i.e. from the operation of platforms for recurrent bill payments and national ID systems
Recognition of transaction-based revenue and settlement balances arising in the payment processing cycle may be misstated or not pre-sented in the correct financial period. Further-more, the settlement balances may be inappro-priately classified within the balance sheet.
The complexity of the IT system infrastruc-ture and the need for partly manual processing of certain revenue streams introduce a risk of incomplete and inaccurate recognition of reve-nues from the processing of payments and other transaction-based revenue.
The significant number of transactions pro-cessed in the year requires a correct IT outcome.
The clearing/settlement activities are highly dependent on the configuration of IT systems and manual controls to ensure com-plete and accurate reconciliation of transactions forming the settlement balances and creditors.
We focused on this area because of the complexity and dependency of the systems used and the high number of transactions.
Refer to note 2.1 Revenue and note 3.2 Clearing-related balances.
The nature of systems, processes and con-trols vary between the segments and there-fore different audit procedures are applied. Our audit procedures include, amongst oth-ers, understanding and test of general IT con-trols and relevant automated system controls for systems that provide data to SAP for financial reporting. Our audit included trans-action-based revenues and clearing/settle-ment receivables and liabilities.
IT audit experts were used throughout the audit process.
We tested general IT controls related to access to programs and data, program change and development in order to address the risk of unauthorised changes being made to the operation of IT application controls. We assessed the design, implementation and operating effectiveness of relevant IT appli-cation controls and tested that the systems are configured appropriately.
We have identified and tested relevant internal controls and underlying reconcilia-tions.
We also tested the manual and auto-mated controls for reconciliation of settle-ment accounts to underlying documentation.
Substantive testing of contracts and ana-lytical procedures were performed where appropriate to identify incomplete capture of revenue.
To the shareholders of Nets A/S
Nets Annual Report 2016 Financial statements 54
Key Audit MatterHow our Audit Addressed the Key Audit Matter
Goodwill and other intangibles
In accordance with IAS 36, the Group moni-tors the carrying value of goodwill and other intangibles if indications of impairment. The Group performs annual impairment reviews for goodwill, other intangibles where there are indicators of impairment.
Impairment reviews require significant judgement from the Management and are inherently based on assumptions in respect of future profitability.
If the carrying value of these assets exceed their recoverable amount there is a risk of material misstatement in the carrying value of these assets.
We focused on this area because the impairment assessments of these assets are dependent on complex and subjective judge-ments by Management.
Refer to note 4.2 Intangible assets and note 4.4 Impairment test.
We considered whether there were any indi-cations of impairment in respect of intangible assets.
We challenged the appropriateness of the key assumptions used in the discounted cash flow models prepared by Management and applied sensitivities to assess the potential impairment of goodwill. No indications of impairment were identified for other intangi-bles.
Special focus was given to key drivers of the future cash flows, including growth in net revenues, efficiency improvements, capital expenditure and working capital, as well as the discount rates and long-term growth rates applied. In addition hereto test of data quality and quality of estimates was per-formed.
We considered the appropriateness of the related disclosure provided in the consoli-dated financial statements.
Key Audit MatterHow our Audit Addressed the Key Audit Matter
Development costs
Developments cost are capitalised when the criteria in IAS 38 are met.
Capitalisation of development costs requires strong internal procedures and involves significant judgement and estimates to be made which increases the inherent risk of misstatements.
In accordance with IAS 36, the Group monitors the expected carrying value for development projects in progress and per-forms regular impairment reviews.
Assessing whether all capitalisation crite-ria are met requires significant judgement from the Management and are inherently based on assumptions in respect of future events to occur.
We focused on this area because the assessment of whether the capitalisation cri-teria are met and impairment reviews require significant judgement from Management and are inherently based on assumptions in respect of future profitability.
Refer to note 4.2 Intangible assets.
We considered whether all criteria are met as basis for the capitalisation of development projects in progress. We evaluated proce-dures and relevant internal controls to ensure correct accounting for development projects and performed substantive audit procedures to verify capitalised amounts.
We challenged the appropriateness of the key assumptions applied and the probability for that key future events will occur. Our work was based on our understanding of the com-mercial prospects of the developments proj-ects in progress.
IAS 36 also requires Management to test development projects in progress for impair-ment. We selected a sample of projects not yet launched at the balance sheet date and challenged whether there remains a future intent to launch and that they will generate probable future economic benefit exceeding the expected carrying value for the com-pleted development projects.
We considered the appropriateness of the related disclosure provided in the consoli-dated financial statements.
Nets Annual Report 2016 Financial statements 55
STATEMENT ON MANAGEMENT’S REVIEWManagement is responsible for the Manage-ment’s Review.
Our opinion on the financial statements does not cover the Management Review, and we do not express any form of assurance conclusion thereon.
In connection with our audit of the financial statements, our responsibility is to read the Management’s Review and, in doing so, con-sider whether the Management’s Review is materially inconsistent with the financial statements or our knowledge obtained in the audit, or otherwise appears to be materially misstated.
Moreover, we considered whether the Manage-ment’s Review includes the disclosures required by the Danish Financial Statements Act.
Based on the work we have performed, in our view, Management’s Review is in accordance with the consolidated financial statements and financial statements of the parent com-pany and has been prepared in accordance with the requirements of the Danish Financial Statements Act. We did not identify any material misstatements in Management’s Review.
MANAGEMENT’S RESPONSIBILITY FOR THE FINANCIAL STATEMENTSManagement is responsible for the prepara-tion of consolidated financial statements that give a true and fair view in accordance with International Financial Reporting Standards as adopted by the EU and further requirements in the Danish Financial Statements and for the preparation of the financial statements of the parent company that give a true and fair view in accordance with the Danish Financial State-ments Act, and for such internal control as Management determines is necessary to enable the preparation of financial statements that are free from material misstatement, whether due to fraud or error.
In preparing the financial statements, the Man-agement is responsible for assessing the Group’s and parent company’s ability to con-tinue as a going concern, disclosing, as applica-ble, matters related to going concern and using the going concern basis of accounting unless Management either intends to liquidate the Group or parent company or to cease opera-tions, or has no realistic alternative but to do so.
AUDITOR’S RESPONSIBILITIES FOR THE AUDIT OF THE FINANCIAL STATEMENTSOur objectives are to obtain reasonable assur-ance about whether the financial statements as a whole are free from material misstate-ment, whether due to fraud or error, and to issue an auditor’s report that includes our opinion. Reasonable assurance is a high level of assurance, but is not a guarantee that an audit conducted in accordance with ISAs and additional requirements applicable in Denmark will always detect a material misstatement when it exists. Misstatements can arise from fraud or error and are considered material if, individually or in the aggregate, they could rea-sonably be expected to influence the economic decisions of users taken based on these finan-cial statements.
As part of an audit in accordance with ISAs and additional requirements applicable in Den-mark, we exercise professional judgment and maintain professional scepticism throughout the audit. We also:
• Identify and assess the risks of material misstatement of the financial statements, whether due to fraud or error, design and perform audit procedures responsive to those risks, and obtain audit evidence that is sufficient and appropriate to provide a basis for our opinion. The risk of not detecting a material misstatement resulting from fraud is higher than for one resulting from error, as fraud may involve collusion, forgery, intentional omissions, misrepresentations, or the override of internal control.
• Obtain an understanding of internal control relevant to the audit in order to design audit procedures that are appropriate in the circumstances, but not for the purpose of expressing an opinion on the effectiveness of the Group’s and the Company’s internal control.
• Evaluate the appropriateness of accounting policies used and the reasonableness of accounting estimates and related disclosures made by Management.
• Conclude on the appropriateness of Management’s use of the going concern basis of accounting and based on the audit evidence obtained, whether a material uncertainty exists related to events or conditions that may cast significant doubt on the Group’s and the parent company’s ability to continue as a going concern. If we conclude that a material uncertainty exists, we are required to draw attention in our auditor’s report to the related disclosures in the financial statements or, if such disclosures are inadequate, to modify our opinion. Our conclusions are based on the audit evidence obtained up to the date of our auditor’s report. However, future events or conditions may cause the Group or the parent company to cease to continue as a going concern.
• Evaluate the overall presentation, structure and content of the financial statements, including the disclosures, and whether the financial statements represent the underlying transactions and events in a manner that achieves fair presentation.
Mikkel SthyrState Authorised Public Accountant
Rasmus Friis JørgensenState Authorised Public Accountant
Nets Annual Report 2016 Financial statements 56
• Obtain sufficient appropriate audit evidence regarding the financial information of the entities or business activities within the Group to express an opinion on the consolidated financial statements. We are responsible for the direction, supervision and performance of the group audit. We remain solely responsible for our audit opinion.
We communicate with those charged with governance regarding, among other matters, the planned scope and timing of the audit and significant audit findings, including any signifi-cant deficiencies in internal control that we identify during our audit.
We also provide those charged with gover-nance with a statement that we have com-plied with relevant ethical requirements regarding independence, and to communicate with them all relationships and other matters that may reasonably be thought to bear on our independence, and where applicable, related safeguards.
From the matters communicated with those charged with governance, we determine those matters that were of most significance in the audit of the financial statements of the cur-rent period and are therefore the key audit matters. We describe these matters in our auditor’s report unless law or regulation pre-cludes public disclosure about the matter or when, in extremely rare circumstances, we determine that a matter should not be com-municated in our report because the adverse consequences of doing so would reasonably be expected to outweigh the public interest ben-efits of such communication.
Hellerup, 28 February 2017PricewaterhouseCoopersStatsautoriseret RevisionspartnerselskabCVR no 3377 1231

Nets Annual Report 2016 Financial statements 57
Consolidated income statement
DKKm Note 2016 2015
Revenue, gross 2.1 10,084 9,040
Interchange fees and processing fees -2,699 -2,204
Revenue, net of interchange fees and processing fees 2.1 7,385 6,836
Cost of sales -963 -983
External expenses -1,769 -1,732
Staff costs 2.4 -2,034 -1,873
Operating profit before depreciation and amortisation (EBITDA) before special items 2,619 2,248
Special items -345 -538
Special items - IPO-related costs 2.3 -261 -
Operating profit before depreciation and amortisation (EBITDA) 2,013 1,710
Amortisation of business combination intangibles & impairment losses 4.2 & 4.3 -654 -627
Underlying depreciation and amortisation 4.2 & 4.3 -416 -271
Operating profit (EBIT) 943 812
Profit from associates after tax 4.5 4 -3
Fair value adjustment of Visa Shares 7.2 413 2,428
Fair value adjustment on liability related to Visa Shares 7.2 -448 -1,913 Fair value adjustment of Visa Shares related to Teller Branch Norway 7.2 185
Financial income and expenses, net 5.3 -1,055 -801
Financial expenses - refinancing costs 5.3 -738 -
Net financials -1,639 -289
Profit before tax -696 523
Income taxes 6.1 112 -404
Net profit for the year -584 119
DKKm Note 2016 2015
Profit is attributable to:
Owners of Nets A/S -601 97
Non-controlling interests 17 22
-584 119
Earnings per share for profit attributable to the owners of Nets A/S (DKK)
Basic and diluted earnings per share 5.1 -3.0 171.1
NON-GAAP PERFORMANCE MEASURES
Operating profit before depreciation and amortisation (EBITDA) before special items 2,619 2,248
Underlying depreciation and amortisation -416 -271
Adjusted EBIT 2,203 1,977
Adjusted net financials -908 -967
Adjusted tax, 23% -298 -232
Adjusted net profit for the year 997 778
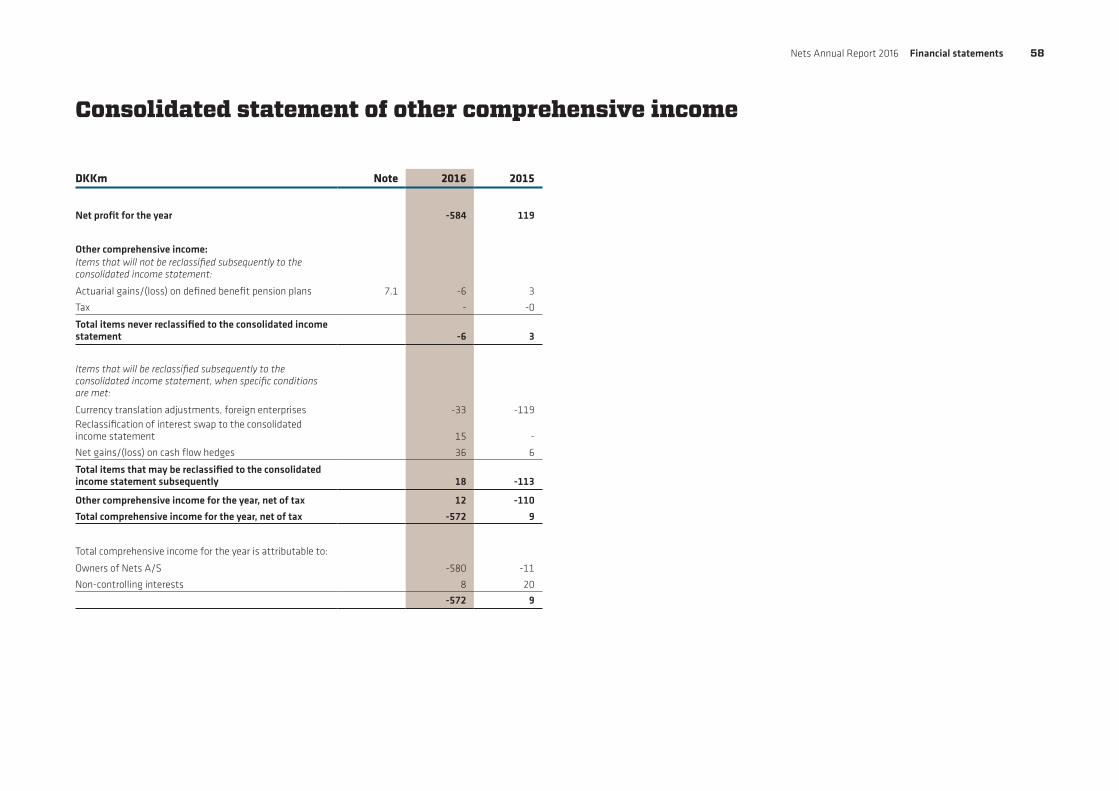
Nets Annual Report 2016 Financial statements 58
Consolidated statement of other comprehensive income
DKKm Note 2016 2015
Net profit for the year -584 119
Other comprehensive income:Items that will not be reclassified subsequently to the consolidated income statement:
Actuarial gains/(loss) on defined benefit pension plans 7.1 -6 3
Tax - -0
Total items never reclassified to the consolidated income statement -6 3
Items that will be reclassified subsequently to the consolidated income statement, when specific conditions are met:
Currency translation adjustments, foreign enterprises -33 -119 Reclassification of interest swap to the consolidated income statement 15 -
Net gains/(loss) on cash flow hedges 36 6
Total items that may be reclassified to the consolidated income statement subsequently 18 -113
Other comprehensive income for the year, net of tax 12 -110
Total comprehensive income for the year, net of tax -572 9
Total comprehensive income for the year is attributable to:
Owners of Nets A/S -580 -11
Non-controlling interests 8 20
-572 9

Nets Annual Report 2016 Financial statements 59
Consolidated balance sheet as at 31 December
DKKm Note 2016 2015
EQUITY AND LIABILITIES
Equity
Share capital 5.1 200 50
Reserves 9,405 4,266
Equity, owners of Nets A/S 9,605 4,316
Non-controlling interests 201 664
Total equity 9,806 4,980
Non-current liabilities
Borrowings 5.2 9,106 14,573
Pension liabilities, net 7.1 66 59
Deferred consideration for business combinations 284 163
Derivative financial instruments - 24
Deferred tax liabilities 6.1 851 1,480
Total non-current liabilities 10,307 16,299
Current liabilities
Borrowings 5.2 223 -
Bank overdraft 5.2 91 -
Trade and other payables 3.1.3 1,614 1,863
Clearing-related liabilities 3.2 5,135 4,483
Other financial liabilities 7.2 1,064 1,913
Current tax liabilities 59 20
Total current liabilities 8,186 8,279
Total liabilities 18,493 24,578
Total equity and liabilities 28,299 29,558
DKKm Note 2016 2015
ASSETS
Non-current assets
Goodwill 4.2 14,720 14,646
Other intangible assets 4.2 4,198 4,722
Plant and equipment 4.3 383 263
Investment in associates 4.5 231 227
Derivative financial instruments 27 -
Deferred tax asset 6.1 376 205
Total non-current assets 19,935 20,063
Current assets
Inventories 3.1.1 66 67
Trade and other receivables 3.1.2 801 832
Clearing-related assets 3.2 4,477 3,705
Prepayments 194 153
Other financial assets 7.2 957 2,428
Cash and cash equivalent 3.3 1,869 2,310
Total current assets 8,364 9,495
Total assets 28,299 29,558

Nets Annual Report 2016 Financial statements 60
Consolidated statement of cash flows for the year
DKKm Note 2016 2015
Operating profit (EBIT) 943 812
Depreciation, Amortisation & Impairment losses 4.2 & 4.3 1,070 898
Other non-cash items 6 -21
Change in narrow working capital 3.1 67 64
Interest and similar items, net -2,119 -568
Tax paid 6.1 -653 -80
Net cash flow from operating activities excluding clearing-related balances -686 1,105
Change in clearing-related balances 3.2.1 -120 989
Net cash from operating activities -806 2,094
Purchase of intangible assets 4.2 -391 -394
Purchase of plant and equipment 4.3 -255 -145
Proceeds from sale of plant and equipment - -
Proceeds from sale of investments - 18
Purchase of investments 4.1 -70 -1,570
Proceeds from Visa Shares 7.2 2,070 -
Payment of proceeds from Visa Shares 7.2 -1,287 -
Dividends received 4.5 - 10
Net cash from investing activities 67 -2,081
Proceeds from capital increase - 25
Proceeds from primary 5,500 -
Base fee in connection with primary -70 -
Proceeds from borrowings 9,040 1,636
Repayment of borrowings -14,466 1,079
Settlement of interest swap -15 -
Net cash flows from financing activities exclusive of clearing-related activities -11 582
Borrowings (clearing-related) 223 -
Net cash flows from financing activities 212 582
DKKm Note 2016 2015
Net cash flow for the year -527 595
Cash and cash equivalents as at 1 January 2,310 1,730
Exchange gains/(loss) on cash and cash equivalents -5 -15
Net cash and cash equivalents as at 31 December 1,778 2,310
Bank overdraft (clearing-related balances ) 91 -
Bank overdraft (own cash) - -
Cash and cash equivalents at at 31 December 3.3 1,869 2,310
NON-GAAP PERFORMANCE MEASURES
Net cash and cash equivalents as at 31 December 1,778 2,310
Clearing-related assets as at 31 December 4,477 3,705
Clearing-related liabilities as at 31 December -5,135 -4,483
Cash related to pass through Visa proceeds 7.2 -194 -
Borrowings (Clearing-related) -223 -
Own cash as at 31 December 703 1,532
Own cash as at 1 January 1,532 1,926 Net cash flow from operating activities, excluding clearing-related balances -686 1,105
Net cash from investing activities in the year 67 -2,081 Net cash flows from financing activities, excluding clearing-related activities -11 582
Net cash flow from pass through Visa proceeds 7.2 -194 -
Exchange gains/(loss) on cash and cash equivalents -5 -
Own cash as at 31 December 703 1,532
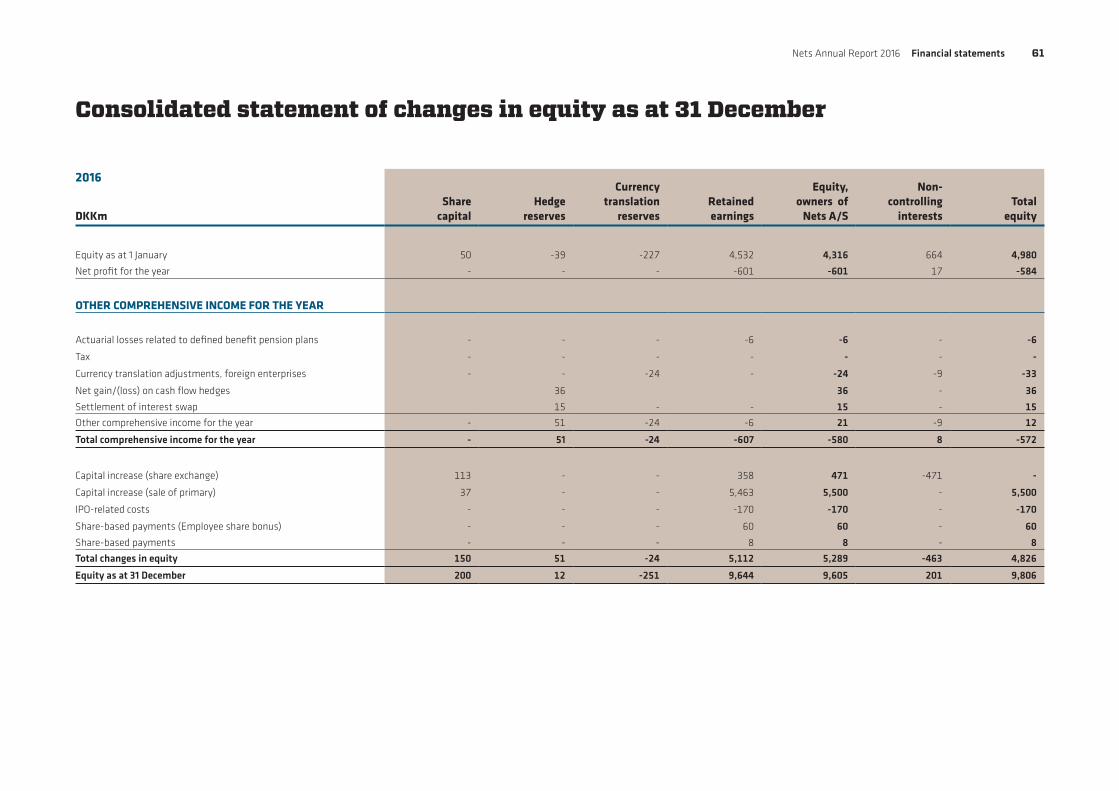
Nets Annual Report 2016 Financial statements 61
Consolidated statement of changes in equity as at 31 December
DKKmShare
capitalHedge
reserves
Currency translation
reservesRetained earnings
Equity, owners of
Nets A/S
Non-controlling
interestsTotal
equity
Equity as at 1 January 50 -39 -227 4,532 4,316 664 4,980
Net profit for the year - - - -601 -601 17 -584
OTHER COMPREHENSIVE INCOME FOR THE YEAR
Actuarial losses related to defined benefit pension plans - - - -6 -6 - -6
Tax - - - - - - -
Currency translation adjustments, foreign enterprises - - -24 - -24 -9 -33
Net gain/(loss) on cash flow hedges 36 36 - 36
Settlement of interest swap 15 - - 15 - 15
Other comprehensive income for the year - 51 -24 -6 21 -9 12
Total comprehensive income for the year - 51 -24 -607 -580 8 -572
Capital increase (share exchange) 113 - - 358 471 -471 -
Capital increase (sale of primary) 37 - - 5,463 5,500 - 5,500
IPO-related costs - - - -170 -170 - -170
Share-based payments (Employee share bonus) - - - 60 60 - 60
Share-based payments - - - 8 8 - 8
Total changes in equity 150 51 -24 5,112 5,289 -463 4,826
Equity as at 31 December 200 12 -251 9,644 9,605 201 9,806
2016
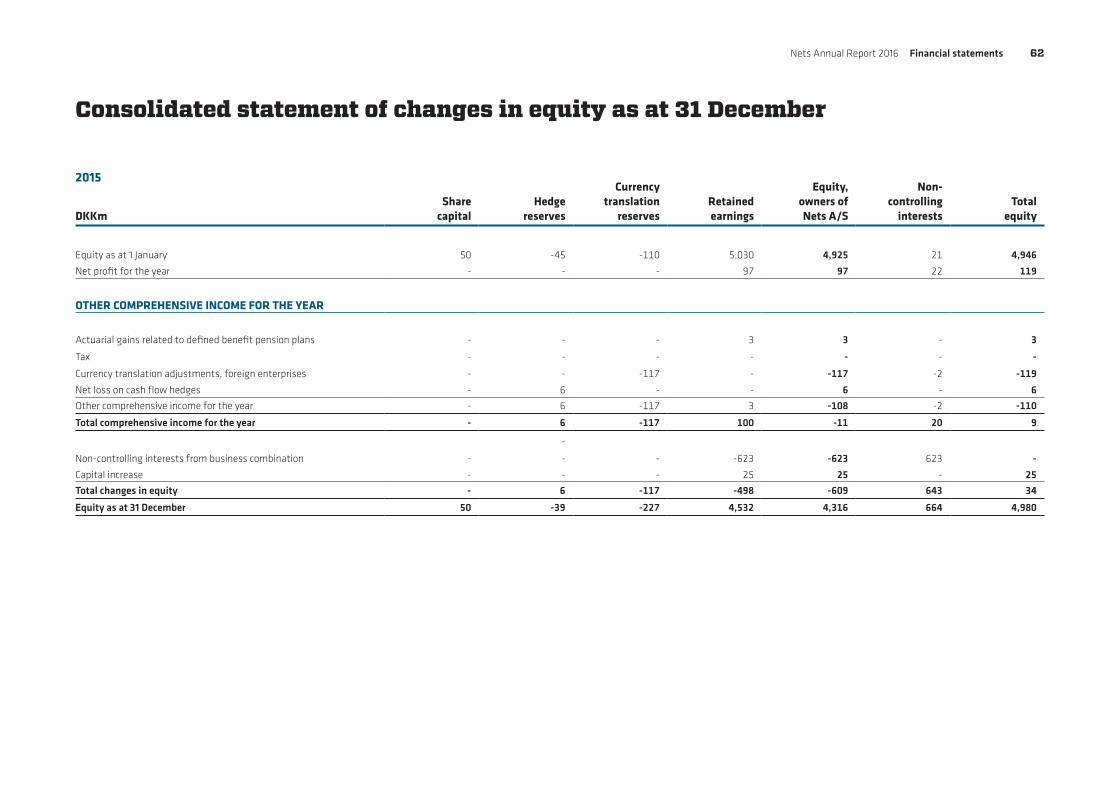
Nets Annual Report 2016 Financial statements 62
Consolidated statement of changes in equity as at 31 December
DKKmShare
capitalHedge
reserves
Currency translation
reservesRetained earnings
Equity, owners of Nets A/S
Non-controlling
interestsTotal
equity
Equity as at 1 January 50 -45 -110 5,030 4,925 21 4,946
Net profit for the year - - - 97 97 22 119
OTHER COMPREHENSIVE INCOME FOR THE YEAR
Actuarial gains related to defined benefit pension plans - - - 3 3 - 3
Tax - - - - - - -
Currency translation adjustments, foreign enterprises - - -117 - -117 -2 -119
Net loss on cash flow hedges - 6 - - 6 - 6
Other comprehensive income for the year - 6 -117 3 -108 -2 -110
Total comprehensive income for the year - 6 -117 100 -11 20 9
-
Non-controlling interests from business combination - - - -623 -623 623 -
Capital increase - - - 25 25 - 25
Total changes in equity - 6 -117 -498 -609 643 34
Equity as at 31 December 50 -39 -227 4,532 4,316 664 4,980
2015
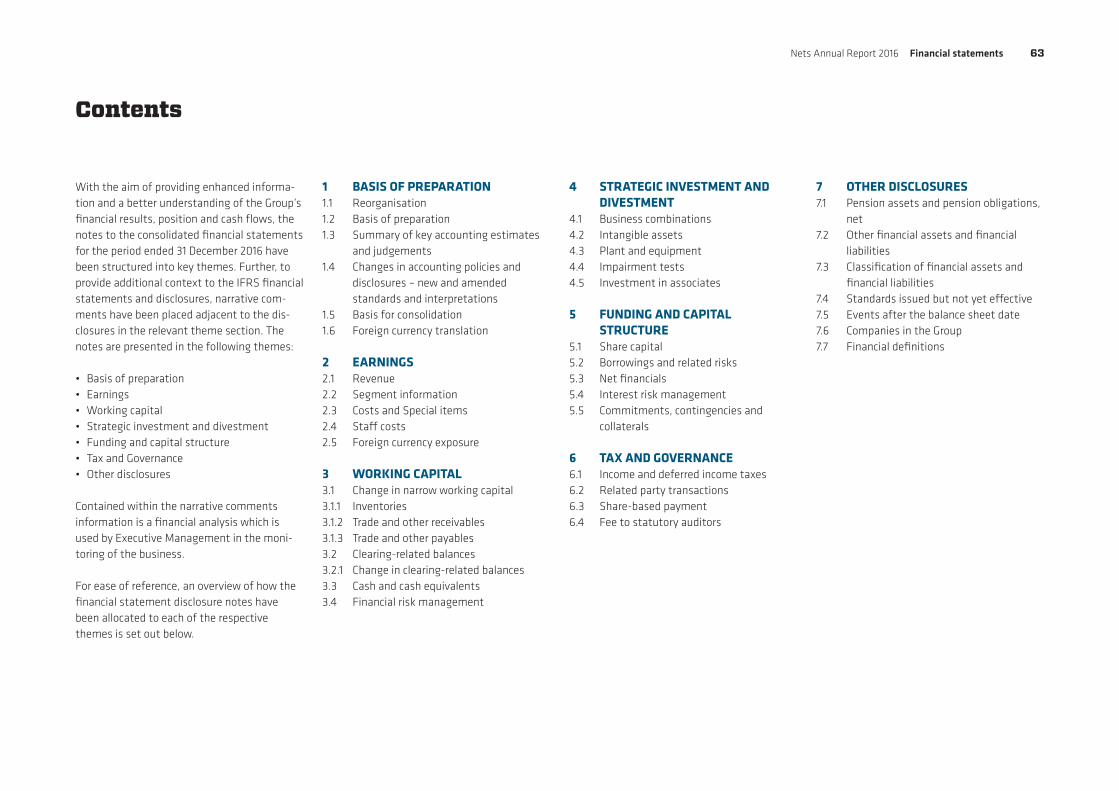
Nets Annual Report 2016 Financial statements 63
Contents
7 OTHER DISCLOSURES7.1 Pension assets and pension obligations, net7.2 Other financial assets and financial liabilities7.3 Classification of financial assets and financial liabilities7.4 Standards issued but not yet effective7.5 Events after the balance sheet date7.6 Companies in the Group 7.7 Financial definitions
4 STRATEGIC INVESTMENT AND DIVESTMENT4.1 Business combinations4.2 Intangible assets4.3 Plant and equipment4.4 Impairment tests4.5 Investment in associates 5 FUNDING AND CAPITAL STRUCTURE5.1 Share capital5.2 Borrowings and related risks5.3 Net financials5.4 Interest risk management5.5 Commitments, contingencies and collaterals 6 TAX AND GOVERNANCE6.1 Income and deferred income taxes6.2 Related party transactions6.3 Share-based payment6.4 Fee to statutory auditors
1 BASIS OF PREPARATION1.1 Reorganisation1.2 Basis of preparation1.3 Summary of key accounting estimates and judgements1.4 Changes in accounting policies and disclosures – new and amended standards and interpretations1.5 Basis for consolidation1.6 Foreign currency translation 2 EARNINGS2.1 Revenue 2.2 Segment information2.3 Costs and Special items2.4 Staff costs2.5 Foreign currency exposure 3 WORKING CAPITAL3.1 Change in narrow working capital3.1.1 Inventories3.1.2 Trade and other receivables3.1.3 Trade and other payables3.2 Clearing-related balances3.2.1 Change in clearing-related balances3.3 Cash and cash equivalents3.4 Financial risk management
With the aim of providing enhanced informa-tion and a better understanding of the Group’s financial results, position and cash flows, the notes to the consolidated financial statements for the period ended 31 December 2016 have been structured into key themes. Further, to provide additional context to the IFRS financial statements and disclosures, narrative com-ments have been placed adjacent to the dis-closures in the relevant theme section. The notes are presented in the following themes:
• Basis of preparation• Earnings• Working capital• Strategic investment and divestment• Funding and capital structure• Tax and Governance• Other disclosures
Contained within the narrative comments information is a financial analysis which is used by Executive Management in the moni-toring of the business.
For ease of reference, an overview of how the financial statement disclosure notes have been allocated to each of the respective themes is set out below.
Nets Annual Report 2016 Financial statements 64
The consolidated financial statements have been prepared on a historical cost basis, except for certain financial assets and liabilities mea-sured at fair value.
1.3 SUMMARY OF KEY ACCOUNTING ESTIMATES AND JUDGEMENTSThe preparation of the Group’s consolidated financial statements requires Executive Man-agement to make assumptions that affect the reported amount of assets and liabilities at the balance sheet date and the reported amounts of revenue and expenses during the financial period.
Estimates and judgements used in the deter-mination of reported results are continuously evaluated, and are based on historical experi-ence and on various other factors that are believed to be reasonable under the circum-stances. Actual results may differ from these estimates under different assumptions or con-ditions.
Executive Management considers the follow-ing estimates and related judgements mate-rial to the assets and liabilities recognised in the consolidated financial statements; these are described in further detail adjacent to the relevant disclosure note.• Business combinations (Note 4.1)• Useful life of customer agreements
(Note 4.2)• Recoverable amount of goodwill and
capitalised development projects (Note 4.4)• Tax (Note 6.1)• Value of Visa shares and related contingent
consideration liability (Note 7.2)
1.1 REORGANISATIONThe shareholders of Nassa Topco AS have, prior to the IPO, exchanged all shares in Nassa Topco AS for new shares in Nets A/S via a share-for-share exchange. Nets A/S is hereaf-ter the new parent of the Group. Comparative figures in the Group annual report correspond to the Nassa Topco AS annual report 2015.
1.2 BASIS OF PREPARATIONThe basis of preparation relates to the account-ing framework which Executive Management has applied in the preparation of the consoli-dated financial statements of Nets A/S.
International Financial Reporting Standards (IFRS), as adopted by the European Union, and further requirements in the Danish Financial Statements Act have been applied in the preparation of these consolidated financial statements. Included within these financial statements are the following disclosures which are non-IFRS:• Adjusted EBIT• Adjusted net profit• Own cash
The Company is incorporated and registered in Denmark, and the functional currency of the parent company and the presentational cur-rency of the Group is Danish kroner (DKK). All values are rounded to the nearest million, except when otherwise indicated.
The accounting policies described in the finan-cial statements have been applied consistently in each of the periods presented.
Section 1:
Basis of preparation

Nets Annual Report 2016 Financial statements 65
Section 1: Basis of preparation(continued)
1.4 CHANGES IN ACCOUNTING POLICIES AND DISCLOSURES – NEW AND AMENDED STANDARDS AND INTERPRETATIONSThe Group applied for the first time certain standards and amendments, which are effec-tive for annual periods beginning on or after 1 January 2016. None of these amendments have had any material impact on the Group. A summary of standards issued but not yet effective is included in Note 7.4.
Accounting policies pervasive to the consoli-dated financial statements
1.5 BASIS FOR CONSOLIDATIONThe consolidated financial information incor-porates the financial information of the Group and entities controlled by the Company (its subsidiaries). Control is achieved where the Group is exposed, or has rights, to variable returns from its involvement with an entity and has the ability to affect those returns through its power over the entity. Potential voting rights are included in the assessment of whether the Group has power over an entity. Income and expenses of subsidiaries acquired or disposed of during the year are included in the consolidated statement of comprehensive income from the date on which the Group obtains control or up to the date on which the Group ceases to have control, as appropriate. Total comprehensive income of subsidiaries is attributed to the owners of the Group and to
the non-controlling interests, even if this results in the non-controlling interests having a deficit balance.
When necessary, adjustments are made to the financial information of subsidiaries to bring their accounting policies into line with those used by the Group.
All intra-group transactions, balances, income and expenses are eliminated in full on consoli-dation.
1.6 FOREIGN CURRENCY TRANSLATION
Functional and presentational currencyItems included in the financial information of each of the Group’s entities are measured using the currency of the primary economic environment in which the entity operates (functional currency). The consolidated finan-cial information is presented in Danish kroner (DKK), which is also the functional and presen-tational currency of the parent company.
On recognition of foreign branches which are integrated entities, monetary items are trans-lated at the exchange rates at the balance sheet date. Non-monetary items are translated at the exchange rates at the acquisition date or at the date of any subsequent revaluation or impair-ment of the asset. Items in the consolidated income statements are translated at the exchange rates at the transaction date,
although items derived from non-monetary items are translated at the historical exchange rates applying to the non-monetary items.
Translation of transactions and balancesForeign currency transactions are translated into the functional currency using the exchange rates prevailing at the dates of the transactions. Foreign exchange gains and losses resulting from the settlement of such transactions and from the translation at year-end exchange rates of monetary assets and liabilities denominated in foreign currencies are recognised in the consolidated income statement.
Translation of Group companiesFinancial information of foreign subsidiaries is translated into Danish kroner at the exchange rates prevailing at the end of the reporting period for assets and liabilities, and at average exchange rates for consolidated income state-ment and other comprehensive income items.
All effects of exchange rate adjustment are recognised in the consolidated income state-ment, with the exception of exchange rate adjustments of investments in subsidiaries arising from:• the translation of foreign subsidiaries’ net
assets including goodwill recognised at acquisition date, at the beginning of the year at the exchange rates at the end of the reporting period;
• the translation of foreign subsidiaries’ income statements using average exchange rates, whereas balance sheet items are translated using the exchange rates prevailing at the end of the reporting period;
The above exchange rate adjustments are rec-ognised in other comprehensive income.
Nets Annual Report 2016 Financial statements 66
This section contains disclosure information related to the revenue, staff costs and earnings development of the Group. This section also discloses information regarding foreign currency exposure.
Section 2:
EarningsSIGNIFICANT ACCOUNTING POLICIES
Revenue recognitionThe Group earns revenue from its customers predominantly on a transactional basis and on a non-transactional basis:
Transaction-based revenue – includes reve-nue generated through a combination of (a) a fee per transaction processed (which rep-resents the primary revenue model in the Cor-porate Services and the Financial & Network Services segments) and (b) an ad valorem fee based on the value of transactions acquired (which represents the primary revenue model of the Merchant Services segment).
Non-transaction-based revenue – includes revenue generated through provision of sub-scription-based fees related to the sale and rental of point-of-sale (POS) and related solutions and fees related to the sale of value-added services and revenue from development projects across all three business segments.
Revenue from transaction service charges, transaction processing and similar services is recognised as revenue when services are per-formed.
Revenue from the sale of products is rec-ognised when the significant risks and
rewards of ownership of the goods have passed to the buyer, usually on delivery of the goods. Revenue from the sale of prod-ucts is measured at the fair value of the con-sideration received or receivable, net of returns and allowances.
Rental income arising from leases of termi-nals is accounted for on a straight-line basis over the lease terms and is included in reve-nue due to its operating nature.
Revenues from services obligations to be provided over a period of time are initially deferred and then recognised on a straight-line basis over the period during which the services are provided.
Revenue is recognised as the gross amount excluding VAT, taxes and duties and dis-counts in relation to the sale. Revenue is measured at the fair value of the consider-ation received or receivable.
Interchange fees and processing feesInterchange fees and processing fees are the accumulated total of all fees directly related to creating a transaction service charge and sales of other services. This represents inter-change fees, processing fees, sales commis-sion, network fees and handling fees.
Note 2.1 – Revenue
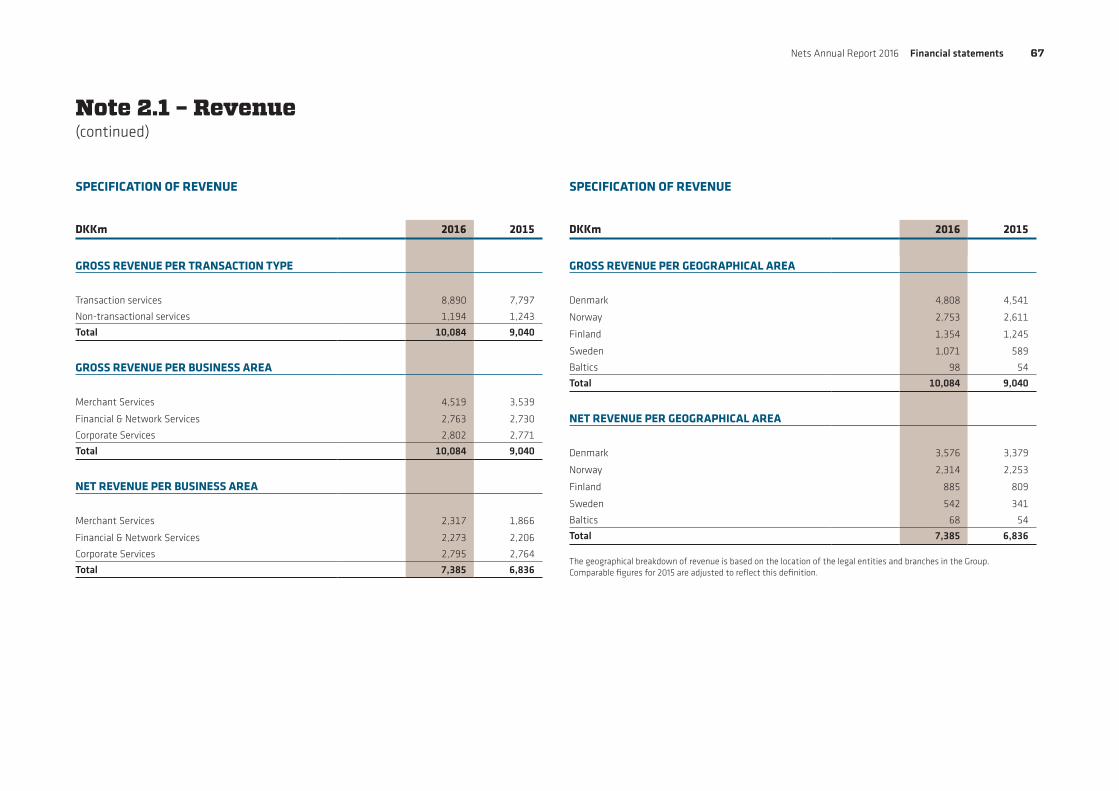
Nets Annual Report 2016 Financial statements 67
SPECIFICATION OF REVENUE SPECIFICATION OF REVENUE
DKKm 2016 2015
GROSS REVENUE PER TRANSACTION TYPE
Transaction services 8,890 7,797
Non-transactional services 1,194 1,243
Total 10,084 9,040
GROSS REVENUE PER BUSINESS AREA
Merchant Services 4,519 3,539
Financial & Network Services 2,763 2,730
Corporate Services 2,802 2,771
Total 10,084 9,040
NET REVENUE PER BUSINESS AREA
Merchant Services 2,317 1,866
Financial & Network Services 2,273 2,206
Corporate Services 2,795 2,764
Total 7,385 6,836
Note 2.1 – Revenue (continued)
DKKm 2016 2015
GROSS REVENUE PER GEOGRAPHICAL AREA
Denmark 4,808 4,541
Norway 2,753 2,611
Finland 1,354 1,245
Sweden 1,071 589
Baltics 98 54
Total 10,084 9,040
NET REVENUE PER GEOGRAPHICAL AREA
Denmark 3,576 3,379
Norway 2,314 2,253
Finland 885 809
Sweden 542 341
Baltics 68 54
Total 7,385 6,836 The geographical breakdown of revenue is based on the location of the legal entities and branches in the Group. Comparable figures for 2015 are adjusted to reflect this definition.

Nets Annual Report 2016 Financial statements 68
Note 2.2 – Segment information
DESCRIPTION OF SEGMENTS Nets is a leading provider of payment services and related technology solutions across the Nordic region. We operate in the centre of the payment ecosystem and operate a secure, reli-able and deeply entrenched network, which connects merchants, corporations, financial institutions and consumers, enabling them to make and receive payments as well as, increasingly, utilise value added services to help them improve their respective activities. Our primary focus is on the Nordic region.
The Executive Management considers the business from a business unit perspective and has identified three reportable segments:
Merchant Services provides in-store, online and mobile payment acceptance solutions to more than 300,000 merchants across the Nordic region, from large corporate chains to small and medium-sized enterprises (SMEs) and micro-merchants. We serve our merchants through a broad set of distribution channels, including indirect partnership relationships such as bank referrals, value-added resellers and web developers as well as through our direct sales force. Our breadth of service, pay-ment type and geographic coverage allows us to be a one-stop shop for merchants in the countries in which we operate.
Financial & Network Services provides out-sourced processing services to more than 240 issuers of payment cards, primarily banks across the Nordic region as well as comple-mentary services, including card management systems (CMS), fraud and dispute solutions and mobile wallet technology. This business area also operates and processes the national debit card schemes in Denmark and Norway, branded Dankort and BankAxept, respectively.
Corporate Services provides the payment plat-form for recurrent bill payments and credit transfer transactions for more than 240,000 corporations, primarily in Denmark and Nor-way. At the centre of this business is the abil-ity to provide a seamless and integrated solu-tion for recurring bill payments to corporations and consumers (e.g. Leverandørservice and Betalingsservice). It also includes solutions for real-time clearing providing instant payments across bank accounts as well as the national digital ID systems in Denmark and Norway.
Segment information provided to the Executive Management The segment information provided to the Executive Management for the reportable seg-ments for the year 2016 is as follows:
DKKmMerchant
Services
Financial & Network
ServicesCorporate
Services Group
Income statement
Revenue 2,317 2,273 2,795 7,385
Reported growth 24.2% 3.0% 1.1% 8.0%
Organic growth 13% 10% 2% 7%
EBITDA before special items 792 893 934 2,619
EBITDA before special items margin 34.2% 39.3% 33.4% 35.5%
Reconciliation of EBITDA before special items to profit before tax:
Special items -606
Amortisation, depreciation and impairment losses -1,070
Finance items - net -1,639
Profit before tax -696
DKKmMerchant
Services
Financial & Network
ServicesCorporate
Services Group
Income statement
Revenue 1,866 2,206 2,764 6,836
EBITDA before special items 559 810 879 2,248
EBITDA before special items margin 30.0% 36.7% 31.8% 32.9%
Reconciliation of EBITDA before special items to profit before tax:
Special items -538
Amortisation, depreciation and impairment losses -898
Finance items - net -289
Profit before tax 523
2016
2015

Nets Annual Report 2016 Financial statements 69
Note 2.3 – Costs and Special items
SIGNIFICANT ACCOUNTING POLICIES
Cost of salesCost of sales is the accumulated total of all costs related to products and services which have been sold. This represents mainly the cost of terminals sold and decentralised pro-duction costs.
External expensesExternal expenses incurred in generating the revenue for the year comprise IT operation, operating leases for software, maintenance and development costs that do not qualify for capitalisation, lease expenses and other marketing, sales and distribution costs, loss and card fraud.
Immaterial other gains and losses of a nature secondary to the main activities of the Group are recognised within external expenses.
Special itemsSpecial items are costs or income that are recognised in the income statement which cannot be attributed directly to the Group’s ordinary activities. Such costs and income include the cost of extensive restructuring or processes and fundamental structural adjustment and IPO-related costs. They are therefore separately disclosed to allow a more comparable view of underlying trading performance.
KEY ACCOUNTING ESTIMATES AND JUDGEMENTS
The use of special items entails Management judgement in the separation from other items in the income statement. Manage-ment carefully considers such changes in order to ensure the correct distinction
between the operating activities and restruc-turing of the Group carried out to enhance the future earnings potential.

Nets Annual Report 2016 Financial statements 70
Note 2.3 – Costs and Special items (continued)
COSTS ASSOCIATED WITH BUSINESS SET-UPS, ACQUISITIONS AND DISPOSALSCosts associated with business set-ups, acqui-sitions and disposals amounted to DKK 14 million (2015: DKK 44 million) and include costs related to external advisors in connection with acquisitions.
REORGANISATION AND RESTRUCTURING COSTSCosts of reorganisation and restructuring amounted to DKK 113 million (2015: DKK 159 million) and mainly include costs related to termination of employees as part of making Nets more cost-efficient and competitive in meeting the strategy of being operationally excellent.
TRANSFORMATION PROGRAMMECosts related to the transformation pro-gramme amounted to DKK 219 million (2015: DKK 353 million) and included costs related to the launch and execution of the transforma-tion programme. These costs related to the development of a target operating model, and investments in security and stability pro-grammes as well as the implementation of cost optimisation programmes related to tech-nology, operations and procurement. The cost of third-party consultants represents the majority of the costs relating to the transfor-mation programme.
IPO-RELATED COSTSIPO-related costs amounted to DKK 431 million of which DKK 261 million affecting the income statement and DKK 170 million affecting Equity and comprised costs for external advisors – mainly fees to bookrunners, law-yers, auditors and other advisors, as well as transaction bonuses, employee share bonus and retention bonus of total DKK 78 million. Advent Funds and the Bain Capital Funds and ATP Investment Vehicles have invoiced the Group for consulting and other advisory service fees of DKK 82 million in connection with the IPO.
2016 2015
DKKmExternal
expenses Staff costs External
expenses Staff costs
Reorganisation and restructuring costs - 113 113 8 151 159 Costs associated with business set-ups, acquisitions and disposals 14 - 14 44 - 44
Transformation programme 202 17 219 315 38 353
IPO-related costs 183 78 261 - - -
Other costs and income, net -1 - -1 -18 - -18
Total special items, income statement 398 208 606 349 189 538
IPO-related costs 170 - 170 - - -
Total special items, equity 170 - 170 - - -
Total special items 568 208 776 349 189 538
SPECIAL ITEMS
Special items in the year amounted to DKK 776 million (2015: DKK 538 million) and included the following costs:
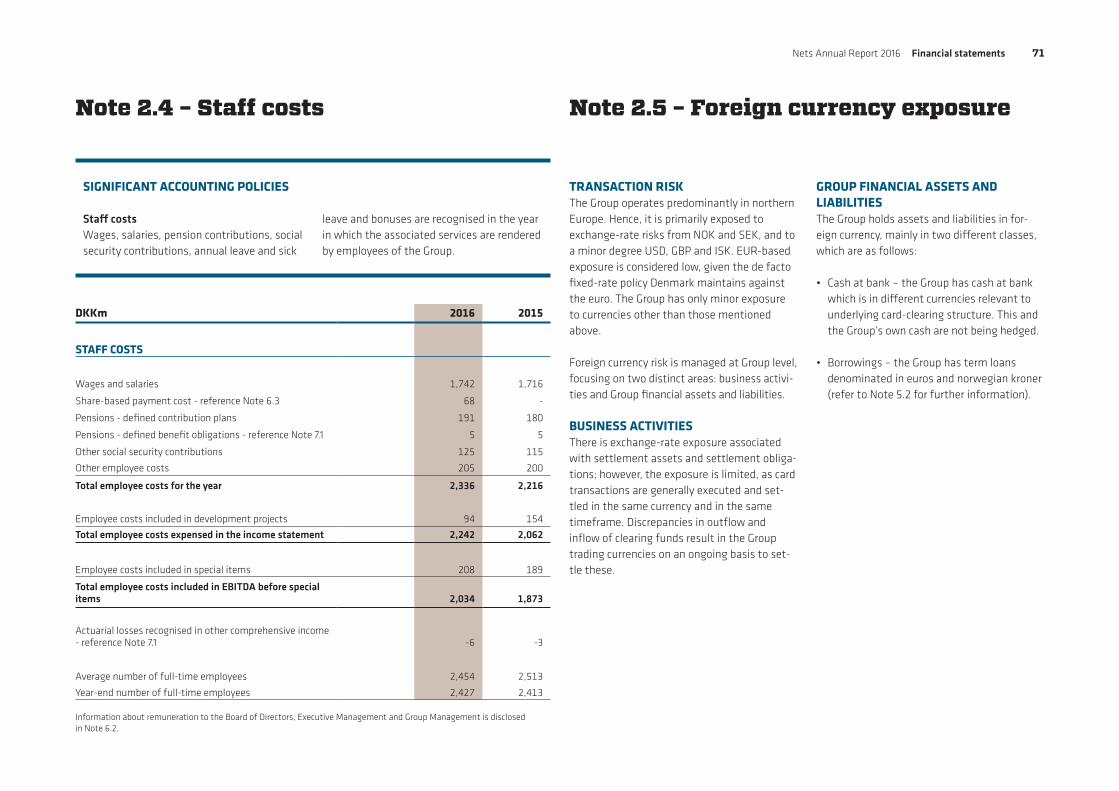
Nets Annual Report 2016 Financial statements 71
Note 2.4 – Staff costs Note 2.5 – Foreign currency exposure
TRANSACTION RISKThe Group operates predominantly in northern Europe. Hence, it is primarily exposed to exchange-rate risks from NOK and SEK, and to a minor degree USD, GBP and ISK. EUR-based exposure is considered low, given the de facto fixed-rate policy Denmark maintains against the euro. The Group has only minor exposure to currencies other than those mentioned above.
Foreign currency risk is managed at Group level, focusing on two distinct areas: business activi-ties and Group financial assets and liabilities.
BUSINESS ACTIVITIESThere is exchange-rate exposure associated with settlement assets and settlement obliga-tions; however, the exposure is limited, as card transactions are generally executed and set-tled in the same currency and in the same timeframe. Discrepancies in outflow and inflow of clearing funds result in the Group trading currencies on an ongoing basis to set-tle these.
GROUP FINANCIAL ASSETS AND LIABILITIESThe Group holds assets and liabilities in for-eign currency, mainly in two different classes, which are as follows:
• Cash at bank – the Group has cash at bank which is in different currencies relevant to underlying card-clearing structure. This and the Group’s own cash are not being hedged.
• Borrowings – the Group has term loans denominated in euros and norwegian kroner (refer to Note 5.2 for further information).
SIGNIFICANT ACCOUNTING POLICIES
Staff costsWages, salaries, pension contributions, social security contributions, annual leave and sick
leave and bonuses are recognised in the year in which the associated services are rendered by employees of the Group.
DKKm 2016 2015
STAFF COSTS
Wages and salaries 1,742 1,716
Share-based payment cost - reference Note 6.3 68 -
Pensions - defined contribution plans 191 180
Pensions - defined benefit obligations - reference Note 7.1 5 5
Other social security contributions 125 115
Other employee costs 205 200
Total employee costs for the year 2,336 2,216
Employee costs included in development projects 94 154
Total employee costs expensed in the income statement 2,242 2,062
Employee costs included in special items 208 189
Total employee costs included in EBITDA before special items 2,034 1,873
Actuarial losses recognised in other comprehensive income - reference Note 7.1 -6 -3
Average number of full-time employees 2,454 2,513
Year-end number of full-time employees 2,427 2,413 Information about remuneration to the Board of Directors, Executive Management and Group Management is disclosed in Note 6.2.
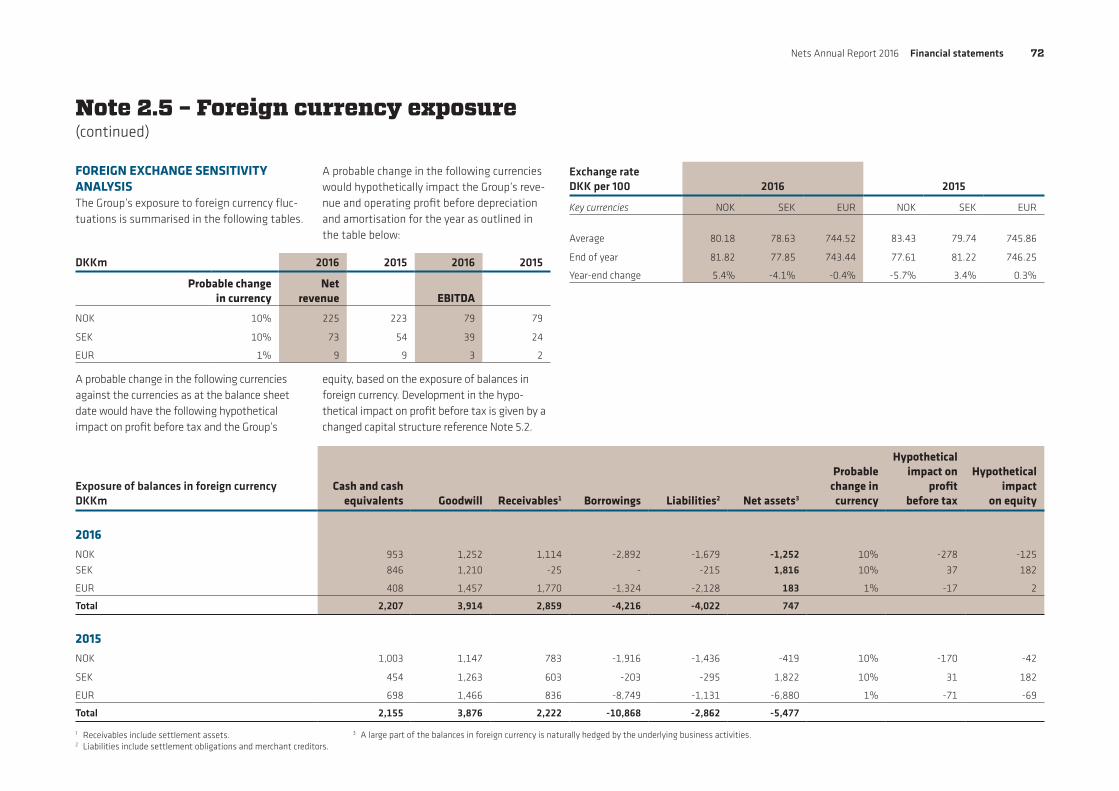
Nets Annual Report 2016 Financial statements 72
Exposure of balances in foreign currencyDKKm
Cash and cash equivalents Goodwill Receivables1 Borrowings Liabilities2 Net assets3
Probable change in currency
Hypothetical impact on
profit before tax
Hypothetical impact
on equity
2016
NOK 953 1,252 1,114 -2,892 -1,679 -1,252 10% -278 -125
SEK 846 1,210 -25 - -215 1,816 10% 37 182
EUR 408 1,457 1,770 -1,324 -2,128 183 1% -17 2
Total 2,207 3,914 2,859 -4,216 -4,022 747
2015
NOK 1,003 1,147 783 -1,916 -1,436 -419 10% -170 -42
SEK 454 1,263 603 -203 -295 1,822 10% 31 182
EUR 698 1,466 836 -8,749 -1,131 -6,880 1% -71 -69
Total 2,155 3,876 2,222 -10,868 -2,862 -5,477
Note 2.5 – Foreign currency exposure (continued)
FOREIGN EXCHANGE SENSITIVITY ANALYSISThe Group’s exposure to foreign currency fluc-tuations is summarised in the following tables.
A probable change in the following currencies against the currencies as at the balance sheet date would have the following hypothetical impact on profit before tax and the Group’s
A probable change in the following currencies would hypothetically impact the Group’s reve-nue and operating profit before depreciation and amortisation for the year as outlined in the table below:
DKKm 2016 2015 2016 2015
Probable change in currency
Net revenue EBITDA
NOK 10% 225 223 79 79
SEK 10% 73 54 39 24
EUR 1% 9 9 3 2
equity, based on the exposure of balances in foreign currency. Development in the hypo-thetical impact on profit before tax is given by a changed capital structure reference Note 5.2.
Exchange rate DKK per 100 2016 2015
Key currencies NOK SEK EUR NOK SEK EUR
Average 80.18 78.63 744.52 83.43 79.74 745.86
End of year 81.82 77.85 743.44 77.61 81.22 746.25
Year-end change 5.4% -4.1% -0.4% -5.7% 3.4% 0.3%
1 Receivables include settlement assets.2 Liabilities include settlement obligations and merchant creditors.
3 A large part of the balances in foreign currency is naturally hedged by the underlying business activities.

Nets Annual Report 2016 Financial statements 73
Section 3:
Working capital
The working capital of the Group comprises narrow working capital and clearing-related balances.
Narrow working capital comprises inventory (primarily termi-nals, spare parts, etc.), trade receivables, prepayments and other receivables and trade and other payables. Management actively focuses on optimising the narrow working capital requirements of the Group’s operations.
Clearing-related balances comprises the aggregate of settle-ment assets less the aggregate of merchant creditors and set-tlement obligations, as these balances have a tendency to off-set each other.
However, Management has limited ability to influence the working capital of clearing-related balances on a day-to-day basis, as these are principally driven by the volume of transac-tions and the time elapsed since the last clearing of financial issuers/card schemes, which is why these balances fluctuate from reporting date to reporting date. A description of the com-ponents in the clearing-related balances and the key drivers behind their respective amounts is described in Note 3.2.
Separate credit lines have been established to cover day-to-day fluctuations ref. Note 5.2.
SIGNIFICANT ACCOUNTING POLICIES
Financial assetsFinancial assets are classified, at initial rec-ognition, as financial assets at fair value through profit or loss, loans and receivables, held-to-maturity investments, available-for-sale financial assets, or as derivatives desig-nated as hedging instruments in an effective hedge, as appropriate. All financial assets are recognised initially at fair value plus, in the case of financial assets not recorded at fair value through profit or loss, transaction costs that are attributable to the acquisition of the financial asset.
Subsequent measurementLoans and receivablesThis category is the most relevant to the Group and applies to trade and other receiv-ables and clearing-related assets.
Loans and receivables are subsequently mea-sured at amortised cost using the effective interest rate (EIR) method, less impairment.
Interest income arising under the EIR method is recognised in financial income in the income statement. Losses arising from impairment are recognised in the income statement in external expenses.
Financial assets at fair value through profit or lossListed securities are classified as held for trading and are measured at fair value through profit or loss.
Impairment of financial assetsDisclosures relating to impairment of financial assets are provided in the following notes:
• Trade receivables – Note 3.1.2• Clearing-related assets – Note 3.2
InventoriesInventories are measured at cost in accor-dance with the FIFO method. Where the expected net realisable value is lower than cost, inventories are written down to this lower value.
Trade and other payablesAmounts are initially recognised at fair value.Subsequently, these items are measured atamortised cost.
The allowances are deducted from the carry-ing amount of Trade receivables and theamount of the loss is recognised in the income statement under External expenses.
Trade and other receivablesAmounts are initially recognised at fair value and subsequently measured at amortised cost, less allowances for doubtfull trade receivables.
The allowances are deducted from the carry-ing amount of Trade receivables and the amount of the loss is recognised in the income statement under External expenses.
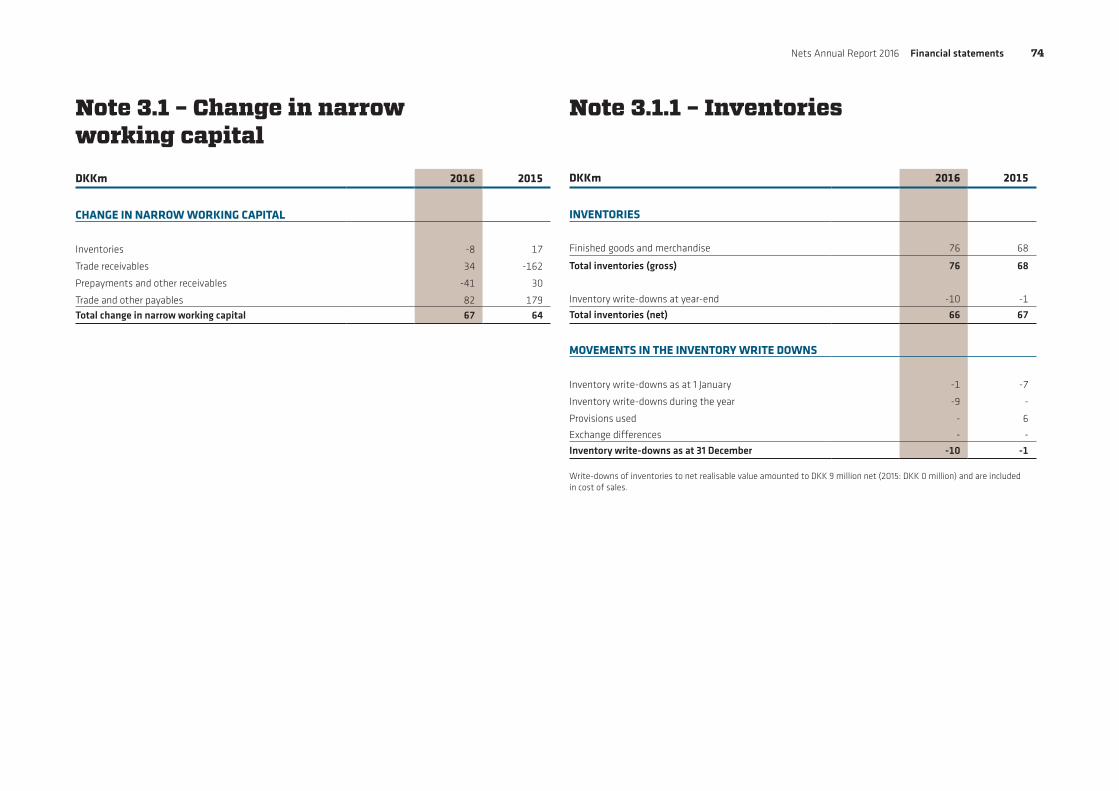
Nets Annual Report 2016 Financial statements 74
Note 3.1 – Change in narrow working capital
Note 3.1.1 – Inventories
DKKm 2016 2015
CHANGE IN NARROW WORKING CAPITAL
Inventories -8 17
Trade receivables 34 -162
Prepayments and other receivables -41 30
Trade and other payables 82 179
Total change in narrow working capital 67 64
DKKm 2016 2015
INVENTORIES
Finished goods and merchandise 76 68
Total inventories (gross) 76 68
Inventory write-downs at year-end -10 -1
Total inventories (net) 66 67
MOVEMENTS IN THE INVENTORY WRITE DOWNS
Inventory write-downs as at 1 January -1 -7
Inventory write-downs during the year -9 -
Provisions used - 6
Exchange differences - -
Inventory write-downs as at 31 December -10 -1 Write-downs of inventories to net realisable value amounted to DKK 9 million net (2015: DKK 0 million) and are included in cost of sales.
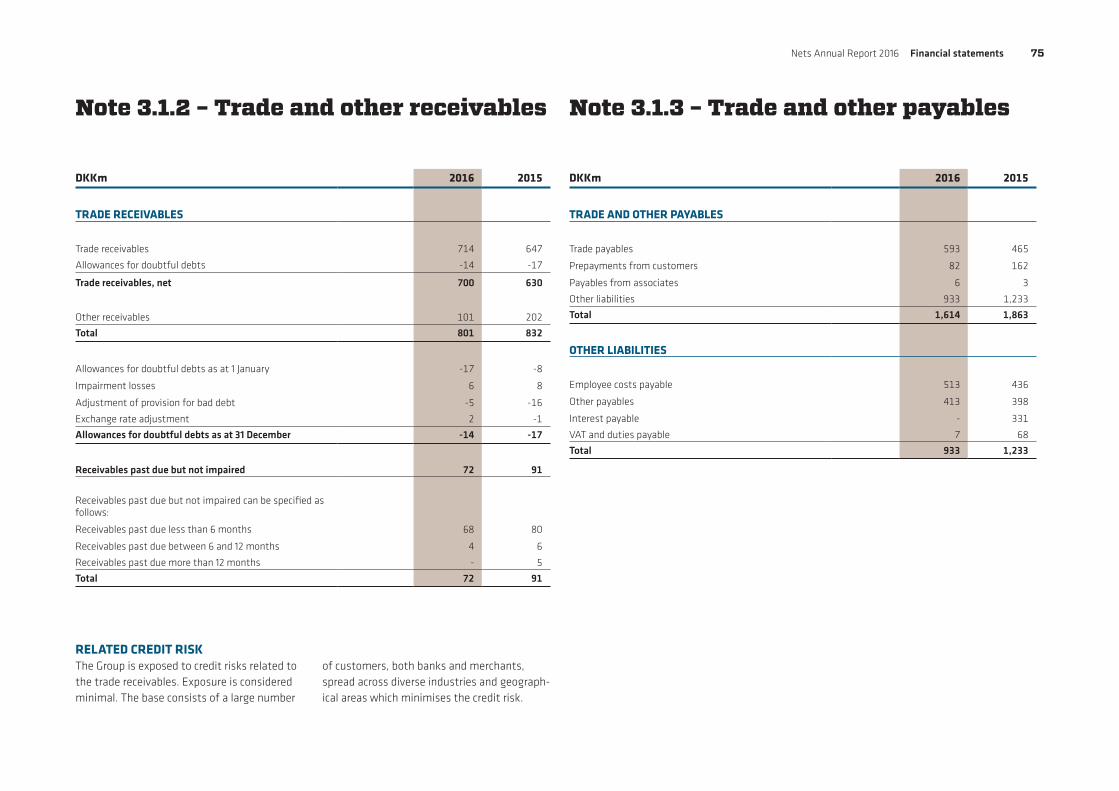
Nets Annual Report 2016 Financial statements 75
Note 3.1.2 – Trade and other receivables Note 3.1.3 – Trade and other payables
RELATED CREDIT RISKThe Group is exposed to credit risks related to the trade receivables. Exposure is considered minimal. The base consists of a large number
of customers, both banks and merchants, spread across diverse industries and geograph-ical areas which minimises the credit risk.
DKKm 2016 2015
TRADE RECEIVABLES
Trade receivables 714 647
Allowances for doubtful debts -14 -17
Trade receivables, net 700 630
Other receivables 101 202
Total 801 832
Allowances for doubtful debts as at 1 January -17 -8
Impairment losses 6 8
Adjustment of provision for bad debt -5 -16
Exchange rate adjustment 2 -1
Allowances for doubtful debts as at 31 December -14 -17
Receivables past due but not impaired 72 91
Receivables past due but not impaired can be specified as follows:
Receivables past due less than 6 months 68 80
Receivables past due between 6 and 12 months 4 6
Receivables past due more than 12 months - 5
Total 72 91
DKKm 2016 2015
TRADE AND OTHER PAYABLES
Trade payables 593 465
Prepayments from customers 82 162
Payables from associates 6 3
Other liabilities 933 1,233
Total 1,614 1,863
OTHER LIABILITIES
Employee costs payable 513 436
Other payables 413 398
Interest payable - 331
VAT and duties payable 7 68
Total 933 1,233

Nets Annual Report 2016 Financial statements 76
Note 3.2 – Change in clearing-related balances
Settlement assets consist primarily of the Group’s receivables from the card schemes/networks/banks for transactions processed on behalf of merchants or card issuing banks.
Merchant creditors consists primarily of the Group’s liability to merchants for transactions that have been processed but not yet settled. Certain settlement terms towards merchants exceed settlement terms towards the remit-tance from card scheme/banks, thus creating negative working capital.
Settlement obligations consist primarily of the Group’s obligations to the card schemes/networks for transactions made by cardholders who are customers in issuing banks for whom the Group processes transaction. The settle-ment assets and settlement obligations are primarily clearing transactions and fees that are cleared at the beginning of the following month with card issuers and card acquirers respectively.
DKKm 2016 2015
CLEARING-RELATED ASSETS
Settlement assets 4,477 3,705
Total 4,477 3,705
CLEARING-RELATED LIABILITIES
Merchant creditors 2,622 2,066
Settlement obligations 2,513 2,417
Total 5,135 4,483 The carrying amount of clearing-related balances is in general, driven by a combination of card turnover, average settlement days and timing of settlement.
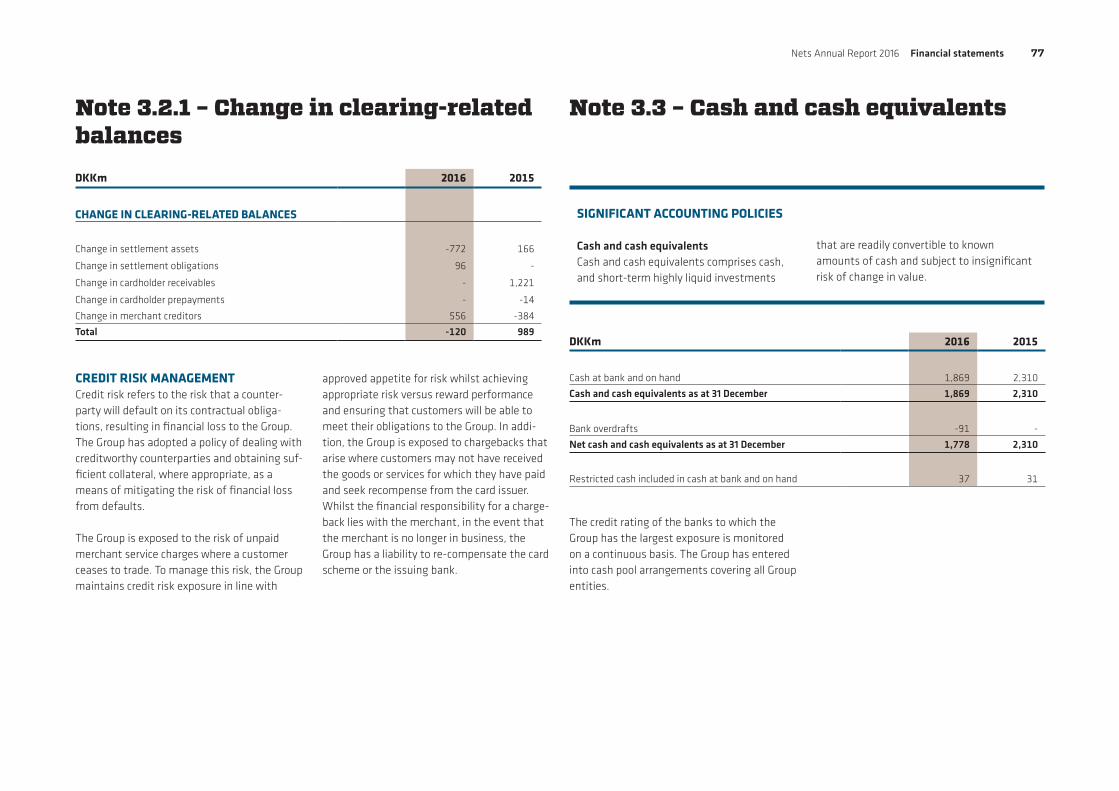
Nets Annual Report 2016 Financial statements 77
Note 3.2.1 – Change in clearing-related balances
Note 3.3 – Cash and cash equivalents
CREDIT RISK MANAGEMENTCredit risk refers to the risk that a counter-party will default on its contractual obliga-tions, resulting in financial loss to the Group. The Group has adopted a policy of dealing with creditworthy counterparties and obtaining suf-ficient collateral, where appropriate, as a means of mitigating the risk of financial loss from defaults.
The Group is exposed to the risk of unpaid merchant service charges where a customer ceases to trade. To manage this risk, the Group maintains credit risk exposure in line with
The credit rating of the banks to which the Group has the largest exposure is monitored on a continuous basis. The Group has entered into cash pool arrangements covering all Group entities.
approved appetite for risk whilst achieving appropriate risk versus reward performance and ensuring that customers will be able to meet their obligations to the Group. In addi-tion, the Group is exposed to chargebacks that arise where customers may not have received the goods or services for which they have paid and seek recompense from the card issuer. Whilst the financial responsibility for a charge-back lies with the merchant, in the event that the merchant is no longer in business, the Group has a liability to re-compensate the card scheme or the issuing bank.
SIGNIFICANT ACCOUNTING POLICIES
Cash and cash equivalentsCash and cash equivalents comprises cash, and short-term highly liquid investments
that are readily convertible to known amounts of cash and subject to insignificant risk of change in value.
DKKm 2016 2015
CHANGE IN CLEARING-RELATED BALANCES
Change in settlement assets -772 166
Change in settlement obligations 96 -
Change in cardholder receivables - 1,221
Change in cardholder prepayments - -14
Change in merchant creditors 556 -384
Total -120 989 DKKm 2016 2015
Cash at bank and on hand 1,869 2,310
Cash and cash equivalents as at 31 December 1,869 2,310
Bank overdrafts -91 -
Net cash and cash equivalents as at 31 December 1,778 2,310
Restricted cash included in cash at bank and on hand 37 31

Nets Annual Report 2016 Financial statements 78
Note 3.4 – Financial risk management
LIQUIDITY AND FINANCING RISK MANAGEMENTLiquidity management is executed on an ongoing daily basis, ensuring availability of required liquidity of the Group by appropriate cash management, and maintaining adequate liquidity reserves at any time through a combi-nation of readily available cash, liquid invest-ment portfolios and uncommitted as well as committed credit facilities.
The Group has established cash pooling arrangements to ensure cost-efficient and secure cash management. The Group continu-ously monitors actual and future cash flows to match the maturity profiles of financial assets and liabilities.
A part of the Group’s liquidity position relates to its settlement activities (settlement cash). The Group ensures that it has sufficient liquid-ity at any time to meet its settlement pay-ment obligations as they fall due. This is achieved by holding significant cash balances and maintaining sufficient credit lines.
Settlement cashThe Group’s acquiring business has a short-term settlement cycle where card schemes (predominantly Visa/MasterCard) remit cash and the Group pays merchants from these remittances.
The settlement activities can result in a significant increase in cash balances or a significant decrease in cash balances. Liquidity is needed only when merchants are remitted prior to funds being received; however, the settle-ments are normally performed within a few days.
The Group’s issuing business has also a short-term settlement cycle where the network (local banks) remits cash and the Group pays the card acquirer or card schemes. The settlements can result in a significant increase in cash balances or a significant decrease in cash balances. Liquidity risks occur when card acquirers are paid prior to funds being received from the net-work (local banks); however, settlements are normally performed within a few days.
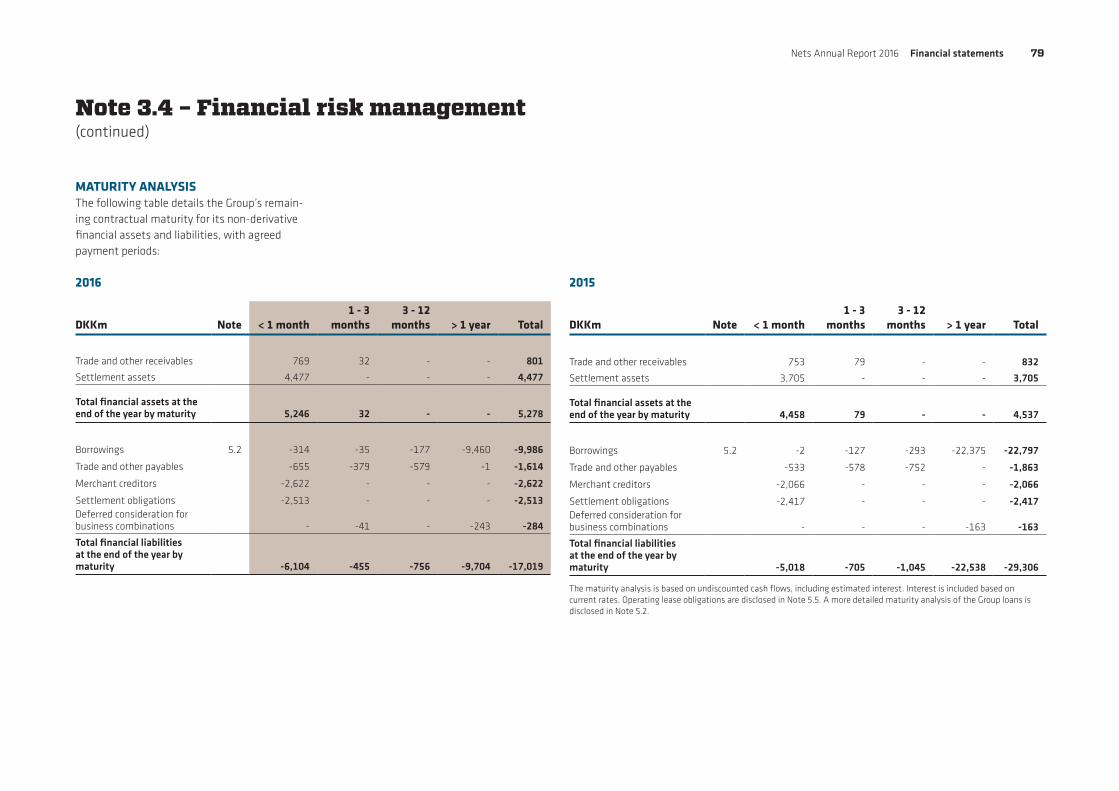
Nets Annual Report 2016 Financial statements 79
Note 3.4 – Financial risk management (continued)
MATURITY ANALYSISThe following table details the Group’s remain-ing contractual maturity for its non-derivative financial assets and liabilities, with agreed payment periods:
DKKm Note < 1 month1 - 3
months3 - 12
months > 1 year Total
Trade and other receivables 753 79 - - 832
Settlement assets 3,705 - - - 3,705
Total financial assets at the end of the year by maturity 4,458 79 - - 4,537
Borrowings 5.2 -2 -127 -293 -22,375 -22,797
Trade and other payables -533 -578 -752 - -1,863
Merchant creditors -2,066 - - - -2,066
Settlement obligations -2,417 - - - -2,417 Deferred consideration for business combinations - - - -163 -163
Total financial liabilities at the end of the year by maturity -5,018 -705 -1,045 -22,538 -29,306
The maturity analysis is based on undiscounted cash flows, including estimated interest. Interest is included based on current rates. Operating lease obligations are disclosed in Note 5.5. A more detailed maturity analysis of the Group loans is disclosed in Note 5.2.
DKKm Note < 1 month1 - 3
months3 - 12
months > 1 year Total
Trade and other receivables 769 32 - - 801
Settlement assets 4,477 - - - 4,477
Total financial assets at the end of the year by maturity 5,246 32 - - 5,278
Borrowings 5.2 -314 -35 -177 -9,460 -9,986
Trade and other payables -655 -379 -579 -1 -1,614
Merchant creditors -2,622 - - - -2,622
Settlement obligations -2,513 - - - -2,513 Deferred consideration for business combinations - -41 - -243 -284
Total financial liabilities at the end of the year by maturity -6,104 -455 -756 -9,704 -17,019
2016 2015
Nets Annual Report 2016 Financial statements 80
Section 4:
Strategic investment and divestment
This section includes disclosure information related to how the Group executed its growth strategy related to:
• Expansion of geographic and service offering footprint through acquisitions
• Development of innovative product and service offerings
STRATEGIC ACQUISITIONSThe Group is actively committed to renewing and supplement-ing the portfolio of services offered and to strengthening our geographic footprint.
This section provides information on the consideration paid by the Group for acquiring these entities and shows how these businesses have impacted the Group’s balance sheet at their respective acquisition dates, including details on goodwill and other intangible assets acquired.
INVESTMENTS IN DEVELOPMENT PROJECTSNets’ vision is “Powering digital payments”. The Group continu-ously innovates to bring to market products and services rele-vant to our focus areas in new payment instruments, analytics and authentication.
This section includes financial information related to expendi-ture on development projects.
Note 4.1 – Business combinations
SIGNIFICANT ACCOUNTING POLICIES
Business combinationsAcquisitions of businesses are accounted for using the acquisition method. The cost of an acquisition is measured as the aggregate of the consideration transferred measured at acquisition date fair value and the amount of any non-controlling interests in the acquiree. The Group recognises any non-controlling interest in the acquiree on an acquisition- by-acquisition basis, at either at fair value (full goodwill) or at the non-controlling interest’s proportionate share of the recognised amounts of the acquiree’s identifiable assets.
Any contingent consideration to be trans-ferred is measured at fair value at the acqui-sition date. Acquisition-related costs are expensed as and when incurred within exter-nal expenses and staff costs (special items).
At the acquisition date, the identifiable assets acquired and the liabilities, including contin-gent liabilities assumed, are recognised at their fair value at the acquisition date. Good-will is initially measured at cost, being the excess of the aggregate of the consideration transferred and the amount of any non-con-trolling interest in the acquiree over the fair value of the identifiable net assets acquired.
If the initial accounting for a business combi-nation is incomplete by the end of the reporting year in which the combination
occurs, the Group reports provisional amounts for the items for which the accounting is incomplete.
Those provisional amounts are adjusted during the following 12 months from the acquisition date, if additional assets or liabilities are rec-ognised, to reflect new information obtained about facts and circumstances that existed at the acquisition date that, if known, would have affected the amounts recognised at that date. The effect of the adjustment is recognised in the opening balance and the comparative fig-ures are restated accordingly.
When the Group ceases to have control of any retained interest in the entity it is re-measured to its fair value at the date when control is lost, with the change in carrying amount recognised in the consolidated income statement.
The fair value is the initial carrying amount for the purposes of subsequently accounting for the retained interest as an associate, joint ven-ture or financial asset. In addition, any amounts previously recognised in other com-prehensive income in respect of that entity are accounted for as if the Group had directly dis-posed of the related assets or liabilities. This may mean that amounts previously recognised in other comprehensive income are reclassified to the consolidated income statement.

Nets Annual Report 2016 Financial statements 81
Note 4.1 – Business combinations (continued)
ACQUISITION OF BUSINESSESThe Group made one acquisition in 2016 (2015: two). The acquisitions had the following effect on the Group’s consolidated financial state-ments as at the reporting date:
2016
Storebox ApS
Total acquisitions
(Opening balance)DKKm
Book value on
acquisition date
Opening balance
Goodwill - 125 125
Development projects - 17 17
Cash and cash equivalent 11 11 11
Deferred tax - -3 -3
Trade and other payables -2 -2 -2
Total payment regarding acquisitions of business transferred
148 148
Cash and cash equivalent in aquisition of business 11 11
Total cash consideration 137 137
Contingent and deferred consideration 67 67
Cash consideration transferred 70 70
2015
Kortaccept Nordic AB Signaturgruppen A/S
DKKm
Book value on
acquisition date
Opening balance
Book value on
acquisition date
Opening balance
Total acquisitions
(Opening balance)
Goodwill - 1,073 - 204 1,277
Customer agreements - 440 - - 440
Plant and equipment - - 0 0 0
Trade and other receivables - - 9 9 9
Prepayment - - 1 1 1
Cash and cash equivalent 299 299 16 16 315
Deferred tax - -97 -0 -0 -97
Trade and other payables - - -13 -13 -13
Non-controlling interests - - - -125 -125
Consideration transferred 1,715 92 1,807
Cash and cash equivalent in aquisition of business 299 16 315
Cash consideration transferred 1,416 76 1,492
Contingent and deferred consideration - 125 125
Total payment regarding acquisitions of business 1,416 201 1,617
KEY ACCOUNTING ESTIMATES AND JUDGEMENTS
The most significant assets acquired gener-ally comprise goodwill, customer agreements and development projects. As no active mar-ket exists for the majority of acquired assets, liabilities and contingent liabilities, in partic-ular in respect of acquired intangible assets, management makes estimates of the fair value. The methods applied are based on the present value of future cash flows, churn rates or other expected cash flows related to the specific asset.
The fair value of development projects and customer contracts acquired in business combinations is based on an evaluation of the conditions relating to the acquired port-folio and related customer relationships. Measurement is based on a discounted cash flow model on key assumptions about the estimated split of the acquired and expected revenue, the related churn rates and profit-ability of the revenue at the time of the acquisition.
Nets Annual Report 2016 Financial statements 82
Note 4.1 – Business combinations (continued)
STOREBOX APSAn agreement to acquire 70% of the share capital of Storebox ApS was signed in Decem-ber 2015 with closing date in January 2016 for the total consideration of DKK 81 million with a put/call option to acquire the remaining 30% at an exercise price, based on a number of ele-ments, including growth and EBITDA in the following years.
The acquisition of Storebox ApS has strength-ened the Group’s total product and service offering towards Nordic merchants and con-sumers and there is a strong strategic match between the core business and competences of Storebox ApS and the Merchant Services business in the Group.
Goodwill represents the value of the current workforce and know-how and also the opera-tional synergies expected from integration within the Group.
In the period from the acquisition date to 31 December 2016, Storebox ApS contributed rev-enue of DKK 8 million and operating loss of DKK 3 million to the Group. Acquisition costs relating to the purchase of Storebox ApS amounted to DKK 2 million.
In connection with the acquisition of Storebox ApS, the Group made a capital increase of DKK 10 million, increasing the Group’s ownership to 72.7%.
KORTACCEPT NORDIC ABOn 10 December 2015, the Group acquired 100% of the share capital of Kortaccept Nordic AB (Nordea Merchant Acquiring) for the total consideration of DKK 1,715 million.
The acquisition of Nordea Merchant Acquiring has strengthened the Group’s total product and service offering towards Nordic and Baltic merchants and there is a strong strategic match between the core business and compe-tences of Nordea Merchant Acquiring and the Merchant Services business in the Group.
Goodwill represents the value of the current workforce and know-how and also the opera-tional synergies expected from integration within the Group.
In the period from the acquisition date to 31 December 2015, Kortaccept Nordic AB contrib-uted revenue of DKK 19 million and operating profit of DKK 17 million to the Group. Acquisi-tion costs relating to the purchase of Kortac-cept Nordic AB amounted to DKK 30 million.
SIGNATURGRUPPEN A/SOn 2 July 2015, the Group acquired 51% of the share capital of Signaturgruppen A/S for a total consideration of DKK 92 million. At the same date the Group entered into a put-and-call option to acquire the remaining 49% of the shares, at an exercise price based on a number of elements including growth in EBITDA.
The acquisition of Signaturgruppen A/S added a strong partner for online digital identity in Denmark.
Goodwill represents the value of the current workforce and potential synergies expected when integrated in the Group.
Signaturgruppen A/S contributed revenue of DKK 18 million and operating profit of DKK 8 million to the Group. Total annual revenue of Signaturgruppen for 2015 was DKK 33 million. Acquisition costs relating to the purchase of Signaturgruppen A/S amounted to DKK 1 mil-lion.

Nets Annual Report 2016 Financial statements 83
Note 4.2 – Intangible assets
SIGNIFICANT ACCOUNTING POLICIES
Development projectsDevelopment costs that are directly attribut-able to the design and testing of identifiable and unique projects including software prod-ucts controlled by the Group are recognised as intangible assets when the following cri-teria are met:
• It is technically feasible to complete the asset so that it will be available for use
• Management intends to complete the asset and there is an ability to use or sell it
• The asset will generate probable future economic benefits
• Expenditure attributable to the asset during its development can be reliably measured.
Costs associated with maintaining the assets are recognised as an expense as and when incurred.
Directly attributable costs that are capital-ised as part of the assets include employee costs.
Capitalised assets including computer soft-ware development costs are amortised over their estimated useful lives of 3–7 years.Development projects in progress are tested for impairment at least annually.
Customer agreements and rightsCustomer agreements and rights are carried at historical cost less accumulated amortisa-tion and any impairment loss. Amortisation is calculated using the straight-line method to allocate the cost over estimated useful life, which does not exceed:• Customer agreements up to 15 years• Rights 3–10 years.
GoodwillGoodwill arising from an acquisition of a business is carried at cost as established at the date of acquisition of the business less accumulated impairment losses, if any. Goodwill is not amortised. The carrying amount of goodwill is tested annually and if events or changes in circumstances indicate impairment.
KEY ACCOUNTING ESTIMATES AND JUDGEMENTS
Customer agreementsThe useful life of customer agreements is determined based on periodic assessments of customer churn or actual useful life and the intended use for those assets. Such studies are completed or updated when new events occur that have the potential to impact the determination of the useful life of the asset, i.e. when events or circum-stances occur that indicate the carrying amount of the asset may not be recoverable and should therefore be tested for impair-ment.
Development projectsFor development projects in progress, Execu-tive Management estimates on an ongoing basis whether each project is likely to gener-ate future economic benefits for the Group in order to qualify for recognition. The develop-ment projects are evaluated on technical as well as commercial criteria.
The useful life of development projects is determined based on periodic assessments of or actual useful life and the intended use for those assets. Such studies are completed or updated when new events occur that have the potential to impact the determination of the useful life of the asset, i.e. when events or circumstances occur that indicate the car-rying amount of the asset may not be recov-erable and should therefore be tested for impairment.

Nets Annual Report 2016 Financial statements 84
Note 4.2 – Intangible assets (continued)
Other intangible assets
DKKm Goodwill
Customeragree-ments
Develop- ment
projects
Develop- ment
projects in progress
Other intangible
assets
Total intangible
assets
Accumulated cost as at 1 January 14,615 2,070 3,123 513 5,706 20,321
Adjustment to opening 41 - - - - 41 Additions through business combinations 125 - 17 - 17 142
Additions - - 28 363 391 391 Transfer between asset groups - - 683 -683 - - Assets disposed of or fully amortised - - -39 - -39 -39Currency translation adjustment -61 5 -14 4 -5 -66
Accumulated cost as at 31 December 14,720 2,075 3,798 197 6,070 20,790
Accumulated amortisation and write-downs for impairment as at 1 January 31 -291 -693 - -984 -953
Amortisation - -300 -617 -917 -917 Write-downs for impairment* - - -11 - -11 -11 Assets disposed of or fully amortised - - 39 - 39 39Currency translation adjustment -31 -1 2 - 1 -30
Accumulated amortisation and write-downs for impair-ment as at 31 December 0 -592 -1,280 - -1,872 -1,872
Carrying amount as at 31 December 14,720 1,483 2,518 197 4,198 18,918
Other intangible assets
DKKm Goodwill
Customeragree-ments
Develop- ment
projects
Develop- ment
projects in progress
Other intangible
assets
Total intangible
assets
Accumulated cost as at 1 January 13,408 1,475 3,044 185 4,704 18,112 Additions through business combinations 1,233 605 19 - 624 1,857
Additions - - 57 337 394 394 Disposals through sale of business - - - - - - Assets disposed of or fully amortised - - - - - - Currency translation adjustment -26 -10 3 -9 -16 -42
Accumulated cost as at 31 December 14,615 2,070 3,123 513 5,706 20,321
Accumulated amortisation and write-downs for impairment as at 1 January 15 -53 -182 - -235 -220
Transfers assets held for sale - -
Amortisation - -243 -468 - -711 -711 Write-downs for impairment* - - -43 - -43 -43 Currency translation adjustment 16 5 - - 5 21
Accumulated amortisation and write-downs for impair-ment as at 31 December 31 -291 -693 - -984 -953
Carrying amount as at 31 December 14,646 1,779 2,430 513 4,722 19,368
* Consists of write-downs for impairment for development projects due to a negative development in forecasted revenue and earnings.
DKKm 2016 2015
Development costs recognised in the consolidated income statement 422 337
2016 2015
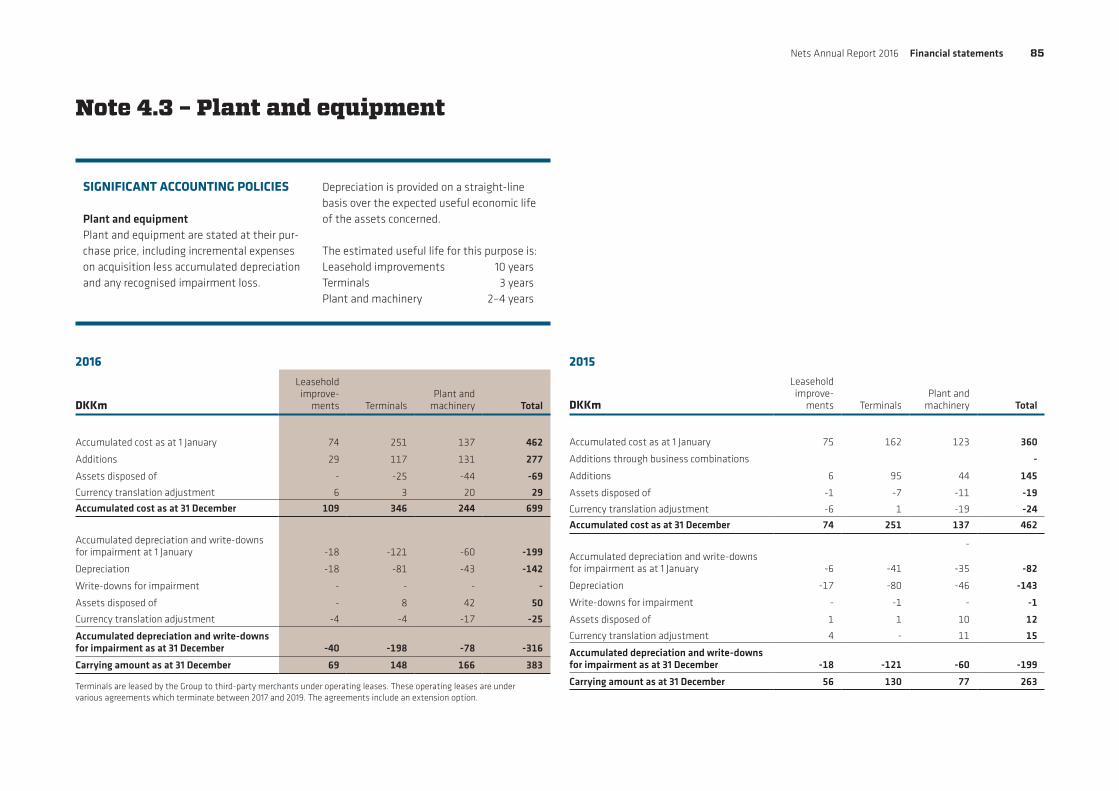
Nets Annual Report 2016 Financial statements 85
Note 4.3 – Plant and equipment
SIGNIFICANT ACCOUNTING POLICIES
Plant and equipmentPlant and equipment are stated at their pur-chase price, including incremental expenses on acquisition less accumulated depreciation and any recognised impairment loss.
Depreciation is provided on a straight-line basis over the expected useful economic life of the assets concerned.
The estimated useful life for this purpose is:Leasehold improvements 10 yearsTerminals 3 yearsPlant and machinery 2–4 years
DKKm
Leasehold improve-
ments TerminalsPlant and
machinery Total
Accumulated cost as at 1 January 74 251 137 462
Additions 29 117 131 277
Assets disposed of - -25 -44 -69
Currency translation adjustment 6 3 20 29
Accumulated cost as at 31 December 109 346 244 699
Accumulated depreciation and write-downs for impairment at 1 January -18 -121 -60 -199
Depreciation -18 -81 -43 -142
Write-downs for impairment - - - -
Assets disposed of - 8 42 50
Currency translation adjustment -4 -4 -17 -25
Accumulated depreciation and write-downs for impairment as at 31 December -40 -198 -78 -316
Carrying amount as at 31 December 69 148 166 383
Terminals are leased by the Group to third-party merchants under operating leases. These operating leases are under various agreements which terminate between 2017 and 2019. The agreements include an extension option.
DKKm
Leasehold improve-
ments TerminalsPlant and
machinery Total
Accumulated cost as at 1 January 75 162 123 360
Additions through business combinations -
Additions 6 95 44 145
Assets disposed of -1 -7 -11 -19
Currency translation adjustment -6 1 -19 -24
Accumulated cost as at 31 December 74 251 137 462
- Accumulated depreciation and write-downs for impairment as at 1 January -6 -41 -35 -82
Depreciation -17 -80 -46 -143
Write-downs for impairment - -1 - -1
Assets disposed of 1 1 10 12
Currency translation adjustment 4 - 11 15
Accumulated depreciation and write-downs for impairment as at 31 December -18 -121 -60 -199
Carrying amount as at 31 December 56 130 77 263
2016 2015

Nets Annual Report 2016 Financial statements 86
Note 4.4 – Impairment tests
SIGNIFICANT ACCOUNTING POLICIES
Impairment of goodwillFor the purposes of impairment testing, goodwill is allocated to each of the Group’s cash-generating units that are expected to benefit from the synergies of the combina-tion.
A cash-generating unit to which goodwill has been allocated is tested for impairment annually, or more frequently when there is any indication that the unit may be impaired.
If the recoverable amount of the cash-gener-ating unit is less than its carrying amount, the impairment loss is allocated first to reduce the carrying amount of any goodwill allocated to the unit and then to the other assets of the unit pro rata based on the car-rying amount of each asset in the unit.
Any impairment loss for goodwill is rec-ognised directly in the income statements and cannot be reversed in subsequent peri-ods.
On disposal of the relevant cash-generating unit, the attributable amount of goodwill is included in the determination of the profit or loss on disposal.
Impairment of other intangible assets and plant and equipmentAt each reporting date, the Group assesses whether there is any indication that its other intangible assets, or plant and equipment are impaired. If any such indication exists, the Group estimates the recoverable amount of the asset and the impairment loss (if any). If an asset does not generate cash flows that are independent from those of other assets or groups of assets, the recoverable amount is determined for the cash-generating unit to which the asset belongs.
The recoverable amount of an asset is the higher of its fair value less cost to sell and its value in use. If the recoverable amount of an intangible asset or plant and equipment is less than its carrying value, an impairment loss is recognised immediately in the consoli-dated income statement.
A reversal of an impairment loss on other intangible assets or plant and equipment is recognised as and when it arises only to the extent that the carrying amount does not exceed the carrying amount (adjusted for depreciation and amortisation), had no impairment loss been recognised.
IMPAIRMENT TESTS OF GOODWILLThe carrying amount of goodwill is tested for impairment annually and if events or changes in circumstances indicate impairment. The tests were carried out towards the end of 2016.
The tests performed did not identify any impairment.
The carrying amount of goodwill allocated to cash-generating units is as follows:
KEY ACCOUNTING ESTIMATES AND JUDGEMENTS
Recoverable amount of goodwill and capi-talised development projectsThe assessment of whether goodwill and/or capitalised developments projects are sub-ject to impairment requires significant Man-agement judgement in determining various assumptions, such as cash-flow projections, discount rate and terminal growth rates.
The sensitivity of the estimated measure-ment to these assumptions, combined or individually, can be significant. Furthermore, the use of different estimates or assump-tions when determining the fair value of such assets may result in different values and could result in impairment charges in future periods.
DKKm 2016 2015
Cash-generating unit
Merchant Services 6,030 5,936
Financial & Network Services 2,319 2,331
Corporate Services 6,371 6,379
Total 14,720 14,646
Nets Annual Report 2016 Financial statements 87
The recoverable amount of goodwill recognised is determined based on value in use calcula-tions, which use cash flow projections incorpo-rating the assumptions used in financial bud-gets, including expected impact from changes in business models, approved by Executive Management. Cash flows beyond the financial budget period have been extrapolated using a steady 2% per annum growth rate. Executive Management believes that the growth rates are reasonable based on the services/products being developed, the continued digital conver-sion of cash, and any reasonably possible change in the key assumptions on which the recoverable amount is based would not cause the carrying amount to exceed its recoverable amount. Key growth drivers per business are described below.
In 2016, discount rates used for impairment calculations pre-tax were around 7% for the individual cash-generating units to reflect the business and related risk. Discount rates have been updated compared to last year to reflect external analyst input. Key factors that could trigger an impairment test include the follow-ing:
• New technology changing the way we cur-rently handle payments
• Macro economy down-scaling• Regulatory matters.
MERCHANT SERVICESMerchant Services consists of goodwill rec-ognised as part of the sale of the Nets Group to private equity funds in 2014, and from acquisition of activities the following years in Sweden (Payzone AB, DIBS Payment Services AB and Kortaccept Nordic AB), Denmark (Storebox ApS), Finland (Paytrail Oyj). Entities are not evaluated separately, as value-added processes are generated across the Group, including synergies from combining opera-tions, economies of scale and future growth potential.
Growth for Merchant Services assumes contin-ued underlying growth in Nets’ core market from card based transactions, associated transactions value (including a continuation of cash to digital conversion) and cross selling opportunities from financial acquiring, POS- and e/mCommerce solutions. In addition, growth expectations includes continued focus in the Swedish market as well as the launch of improved solutions related to e-commerce and mobile acceptance.
FINANCIAL & NETWORK SERVICESFinancial & Network Services consists of good-will recognised as part of the sale of the Nets Group to private equity funds in 2014. Goodwill has been tested at aggregated level as Finan-cial & Network Services is considered as one CGU. Entities are not evaluated separately, as value-added processes are generated across the Group, including synergies from combining operations, economies of scale and future growth potential.
Growth for Financial & Network Services assumes a continued underlying growth in processing volumes (including a continuation of cash to digital conversion in the Nordic core markets). In addition, growth expectations include continued focus on upselling Value Added Services to existing (and new custom-ers) from e.g. Fraud prevention, Card Manage-ment and Mobile solutions. Further growth assumes the continued processing of a majority of existing contracts (including BankAxept processing volumes).
CORPORATE SERVICES Corporate Services consists of goodwill rec-ognised as part of the sale of the Nets Group to private equity funds in 2014, and from the acquisition of activities the following year in Denmark (Signaturgruppen A/S). Entities are not evaluated separately, as value-added pro-cesses are generated across the Group, includ-ing synergies from combining operations, economies of scale and future growth poten-tial.
Growth for Corporate Services assumes a con-tinued underlying growth in account-based payments in cores markets Norway and Den-mark (including a continuation of paper to dig-ital conversion). Further, growth assumes some impact from the successful implementa-tion of new “Instant Payments Solutions”.
Note 4.4 – Impairment tests (continued)

Nets Annual Report 2016 Financial statements 88
DKKm
2016 Nets’ share
Company name Share Currency RevenueProfit for the year
Net assets Equity
Profit for the year
e-Boks A/S 50% DKK 179 14 30 15 7
Total 179 14 30 15 7
2015 Nets’ share
Company name Share Currency RevenueProfit for the year
Net assets Equity
Profit for the year
e-Boks A/S 50% DKK 170 4 22 11 2
Total 170 4 22 11 2
DKKm 2016 2015
INVESTMENT IN ASSOCIATES
Accumulated cost as at 1 January 238 238
Addition during the year - -
Disposals during the year - -
Accumulated cost as at 31 December 238 238
Revaluation at 1 January -11 2
Adjustment for previous year -3 -6
Share of profit after tax 7 2
Exchange differences - 1
Dividends distributed - -10
Revaluation as at 31 December -7 -11
Carrying amount as at 31 December 231 227
Fair value recognition from business combinations 216 216
Carrying amount excluding fair value recognition from business combinations as at 31 December 15 11
SIGNIFICANT ACCOUNTING POLICIES
AssociatesAn associate is an entity over which the Group has significant influence. Investments in associates are recognised under the equity method.
Investments in associates are recognised in the balance sheet at the proportional share of the entity’s equity value calculated in accordance with Group accounting policies with the addition of rights.
Associates with negative equity value are measured at zero, and any receivables from these enterprises are written down, if required, based on an individual assessment. If a legal or constructive obligation exists to cover the associate’s negative balance, a lia-bility is recognised.
The income statement reflects the Group’s share of the results of operations of the associate.
Any change in other comprehensive income of the associate is presented as part of the Group’s other comprehensive income. In addition, when a change has been recognised directly in the equity of the associate, the Group recognises its share of any changes, when applicable, in the statement of changes in equity.
The proportionate share of the net profit/loss in associates after tax and elimination of the proportionate share of intra-group gains/losses is recognised in the Group’s consoli-dated income statement.
Note 4.5 – Investment in associates

Nets Annual Report 2016 Financial statements 89
Section 5:
Funding and capital structure
This section includes disclosure information related to the equity and borrowings of the Group. In addition, the section includes financial risk management information related to the borrowings in the form of interest rate and funding risk.
5.1 – Share capital
SIGNIFICANT ACCOUNTING POLICIES
EquityDividendsDividends expected to be distributed for the year are recognised under a separate item in equity. Dividends and interim dividends are recognised as a liability at the time of adop-tion by the annual general meeting and the meeting of the Board of Directors, respec-tively.
Foreign currency translation reserveForeign currency translation reserve com-prises exchange rate differences arising from translation of the functional currency of for-eign enterprises’ financial information into Danish kroner.
Translation adjustments are recognised in the consolidated income statements when the net investment is realised.
Hedge reserveThe hedge reserve comprises fair value of hedging instruments qualifying for hedge accounting. Hedge accounting ceases when the hedging instrument matures or is no lon-ger effective. When the hedged item is the cost of a non-financial asset or non-financial liability, the amounts recognised as other comprehensive income are transferred to the income statement in the same period that the non-financial asset or liability affect the income statement.
CAPITAL MANAGEMENTThe Group manages its capital base to ensure entities in the Group are able to continue as a going concern, and seeks to maximise the return to shareholders through adequate share of debt and equity on its balance sheet.
Within the Group, certain subsidiaries are reg-istered as payment institutions in Denmark (Nets Denmark A/S and Teller A/S), in Finland (Nets Oy and Paytrail Oyj) and in Sweden (Kortaccept Nordic AB and DIBS Payment Ser-vices AB), and therefore such subsidiaries are subject to minimum capital requirements by local authorities.

Nets Annual Report 2016 Financial statements 90
5.1 – Share capital (continued)
5.2 – Borrowings and related risks
SIGNIFICANT ACCOUNTING POLICIES
Financial liabilitiesAll financial liabilities are recognised initially at fair value and, in the case of loans and borrowings and payables, net of directly attributable transaction costs.
The Group’s financial liabilities include trade and other payables, clearing-related liabili-ties, loans and borrowings including bank overdrafts, financial guarantee contracts and derivative financial instruments.
Loans and borrowingsThis is the category most relevant to the Group.
After initial recognition, interest-bearing loans and borrowings are subsequently mea-sured at amortised cost using the effective interest rate method. Gains and losses are recognised in profit or loss when the liabili-ties are derecognised as well as through the EIR amortisation process. This category generally applies to inter-est-bearing loans and borrowings.
DerecognitionA financial liability is derecognised when the obligation under the liability is discharged or cancelled or expires. When an existing finan-cial liability is replaced by another from the
same lender on substantially different terms, or the terms of an existing liability are sub-stantially modified, such an exchange or modification is treated as the derecognition of the original liability and the recognition of a new liability. The difference in the respec-tive carrying amounts is recognised in the income statement.
Derivative financial instruments and hedge accountingDerivative financial instruments are initially recognised at fair value on the date on which a derivative contract is entered into and are subsequently remeasured at fair value. Deriv-atives are carried as financial assets when the fair value is positive and as financial lia-bilities when the fair value is negative.
Any gains or losses arising from changes in the fair value of derivatives are taken directly to profit or loss, except for the effective portion of cash flow hedges, which is recognised in OCI in the cash flow hedge reserve, while any ineffec-tive portion is recognised immediately in the statement of profit or loss as financial items.
Amounts recognised as OCI are transferred to the income statement when the hedged inter-est expense is recognised in the income state-ment.
DKKm 2016 2015
Shares ('000)
Nominal value
(DKKm)Shares ('000)
Nominal value
(DKKm)
Nets A/S at 5 February (2015: Nassa Topco AS) 567 50 567 50
Additions 199,844 150 - -
Nets A/S as at 31 December 200,411 200 567 50
The share capital of Nets A/S was established on 5 February 2016. In 2016 capital increases were conducted in connection with the IPO to a total number of shares of 200,411,094 with each share of a nominal value of DKK 1, giving a share capital of DKK 200 million.
2016 2015
Profit (DKKm)
Total profit for the year -601 97
Number of shares (‘000)*
Basic 200,411 567
Basic earnings per share (DKK)
Total basic and diluted earnings per share -3.0 171.1
EARNINGS PER SHAREBasic earnings/(loss) per share amounts are cal-culated by dividing the profit/(loss) attributable to owners of the parent by the weighted aver-age number of Ordinary Shares in issue during the financial period. Diluted earnings/(loss) per share amounts are calculated by dividing the profit/(loss) attributable to owners of the par-ent by the weighted average number of Ordi-nary Shares in issue during the financial period adjusted for the effects of potentially dilutive options. The dilutive effect is calculated on the full exercise of all potentially dilutive Ordinary Share options granted by the Group, including
performance-based options, which the Group considers to have been earned. When a loss is recognised during a financial period, a basic loss per share rather than a basic earnings per share will be recognised. The dilutive effects will not be considered in calculating the diluted loss per share as this would reduce the loss per share. The weighted average number of shares used to determine earnings per share has been calcu-lated in accordance with the principle of reverse acquisition accounting. Underlying basic and diluted earnings per share are included, as the Directors believe this provides a better reflec-tion of the Group’s performance.
SHARE CAPITAL
* Number of shares and calculation of EPS are based on the number of shares following the completion of the IPO
Nets Annual Report 2016 Financial statements 91
5.2 – Borrowings and related risks (continued)
LOANS AND BORROWINGS Following the completion of the IPO on 27 September 2016, the IPO proceeds, together with existing cash and new bank facilities, were used to refinance the existing debt and pay fees, costs and expenses associated with the IPO.
REFINANCING The new bank facilities are senior and unse-cured, and replace the existing senior secured facility (EUR 910 million Term Loan and NOK 2,546 million Term Loan), the additional facili-ties (EUR 150 million, SEK 250 million, and EUR 73 million) and the Payment in Kind facil-ity (DKK 4,308 million). As a consequence hereof, the previous pledges and guarantees in favour of the senior secured facilities have been cancelled.
NEW LOANS AND BORROWINGS The new senior facilities are unsecured, but benefit from cross-guarantees provided by Nassa Topco AS, Nassa A/S, Nets A/S, Nets Holding A/S, Nets Denmark A/S, Teller A/S and Nets Oy. They consist of a combination of three-year term loans (DKK 2,028 million, NOK 1,797 million and EUR 19 million) and five-year term loans (DKK 2,034 million, NOK 1,797 mil-lion and EUR 19 million) as well as a five-year multi-currency, revolving credit facility (‘RCF’). The RCF amounts to EUR 475 million (DKK 3,531 million), of which EUR 75 million (DKK 558 million) are carved out in an overdraft facility (‘Overdraft Facility’). Together, the RCF and the Overdraft Facility are available for general corporate purposes of the Group. As of 31 December 2016, the RCF was drawn EUR 266 million (DKK 1,980 million, DKK 1,936 mil-lion netted of unamortised debt cost), leaving EUR 134 million (DKK 996 million) un-drawn. The Overdraft Facility was un-drawn leaving the whole EUR 75 million (DKK 558 million) available. All of the three-year and five-year term loans in DKK and NOK have been swapped to fixed interest rates until maturity, leaving only the EUR denominated term loans, the RCF and the Overdraft Facility at variable interest rate.
CLEARING WORKING CAPITAL FACILITIESIn addition to the new bank facilities, the Group has separate bank lines available for clearing working capital purposes: EUR 175 mil-lion (DKK 1,303 million) on a committed basis and an additional EUR 40 million (DKK 298 million) on an uncommitted basis. On 31 December 2016, the overdraft facilities for clearing working capital were drawn by EUR 12 million (DKK 91 million), leaving EUR 203 mil-lion (DKK 1,510 million) un-drawn. In addition, the Group also has a number of intra-day facil-ities available.
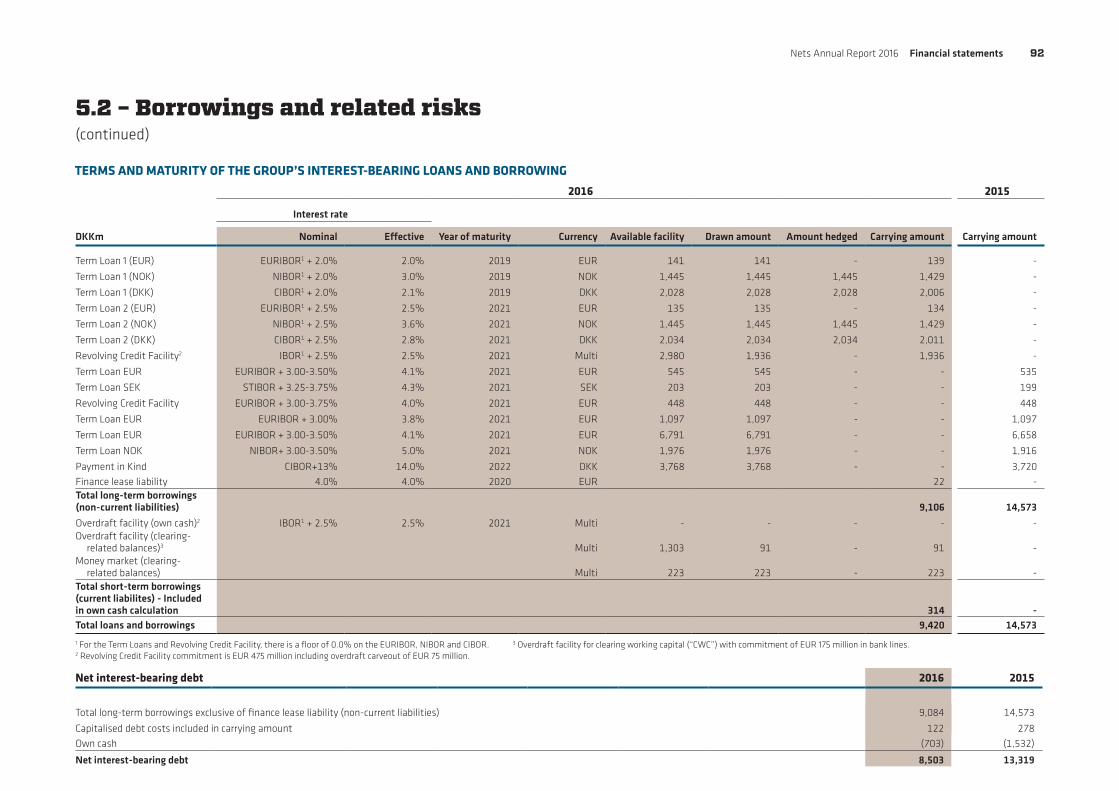
Nets Annual Report 2016 Financial statements 92
5.2 – Borrowings and related risks (continued)
Net interest-bearing debt 2016 2015
Total long-term borrowings exclusive of finance lease liability (non-current liabilities) 9,084 14,573
Capitalised debt costs included in carrying amount 122 278
Own cash (703) (1,532)
Net interest-bearing debt 8,503 13,319
2016 2015
Interest rate
Carrying amountDKKm Nominal Effective Year of maturity Currency Available facility Drawn amount Amount hedged Carrying amount
Term Loan 1 (EUR) EURIBOR1 + 2.0% 2.0% 2019 EUR 141 141 - 139 -
Term Loan 1 (NOK) NIBOR1 + 2.0% 3.0% 2019 NOK 1,445 1,445 1,445 1,429 -
Term Loan 1 (DKK) CIBOR1 + 2.0% 2.1% 2019 DKK 2,028 2,028 2,028 2,006 -
Term Loan 2 (EUR) EURIBOR1 + 2.5% 2.5% 2021 EUR 135 135 - 134 -
Term Loan 2 (NOK) NIBOR1 + 2.5% 3.6% 2021 NOK 1,445 1,445 1,445 1,429 -
Term Loan 2 (DKK) CIBOR1 + 2.5% 2.8% 2021 DKK 2,034 2,034 2,034 2,011 -
Revolving Credit Facility2 IBOR1 + 2.5% 2.5% 2021 Multi 2,980 1,936 - 1,936 -
Term Loan EUR EURIBOR + 3.00-3.50% 4.1% 2021 EUR 545 545 - - 535
Term Loan SEK STIBOR + 3.25-3.75% 4.3% 2021 SEK 203 203 - - 199
Revolving Credit Facility EURIBOR + 3.00-3.75% 4.0% 2021 EUR 448 448 - - 448
Term Loan EUR EURIBOR + 3.00% 3.8% 2021 EUR 1,097 1,097 - - 1,097
Term Loan EUR EURIBOR + 3.00-3.50% 4.1% 2021 EUR 6,791 6,791 - - 6,658
Term Loan NOK NIBOR+ 3.00-3.50% 5.0% 2021 NOK 1,976 1,976 - - 1,916
Payment in Kind CIBOR+13% 14.0% 2022 DKK 3,768 3,768 - - 3,720
Finance lease liability 4.0% 4.0% 2020 EUR 22 - Total long-term borrowings (non-current liabilities) 9,106 14,573
Overdraft facility (own cash)2 IBOR1 + 2.5% 2.5% 2021 Multi - - - - - Overdraft facility (clearing- related balances)3 Multi 1,303 91 - 91 - Money market (clearing- related balances) Multi 223 223 - 223 - Total short-term borrowings (current liabilites) - Included in own cash calculation 314 - Total loans and borrowings 9,420 14,573
TERMS AND MATURITY OF THE GROUP’S INTEREST-BEARING LOANS AND BORROWING
1 For the Term Loans and Revolving Credit Facility, there is a floor of 0.0% on the EURIBOR, NIBOR and CIBOR. 2 Revolving Credit Facility commitment is EUR 475 million including overdraft carveout of EUR 75 million.
3 Overdraft facility for clearing working capital (“CWC”) with commitment of EUR 175 million in bank lines.
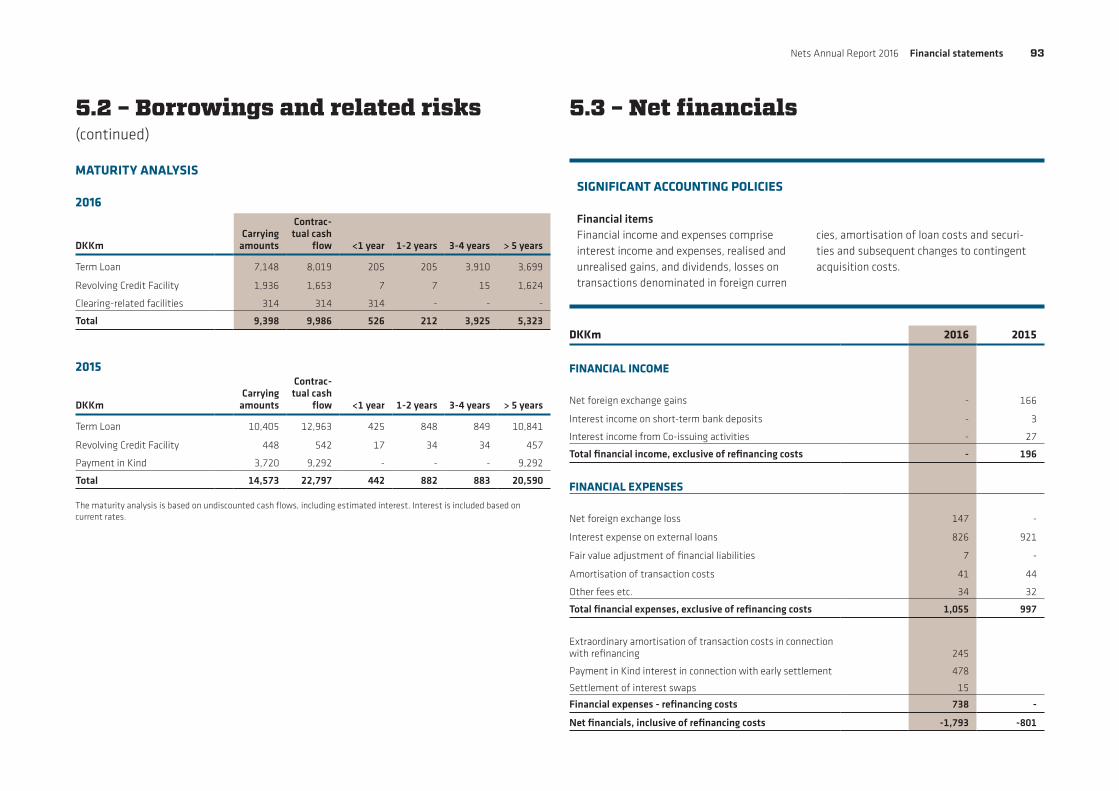
Nets Annual Report 2016 Financial statements 93
5.2 – Borrowings and related risks (continued)
5.3 – Net financials
SIGNIFICANT ACCOUNTING POLICIES
Financial itemsFinancial income and expenses comprise interest income and expenses, realised and unrealised gains, and dividends, losses on transactions denominated in foreign curren
cies, amortisation of loan costs and securi-ties and subsequent changes to contingent acquisition costs.
DKKmCarrying
amounts
Contrac-tual cash
flow <1 year 1-2 years 3-4 years > 5 years
Term Loan 7,148 8,019 205 205 3,910 3,699
Revolving Credit Facility 1,936 1,653 7 7 15 1,624
Clearing-related facilities 314 314 314 - - -
Total 9,398 9,986 526 212 3,925 5,323
DKKmCarrying
amounts
Contrac-tual cash
flow <1 year 1-2 years 3-4 years > 5 years
Term Loan 10,405 12,963 425 848 849 10,841
Revolving Credit Facility 448 542 17 34 34 457
Payment in Kind 3,720 9,292 - - - 9,292
Total 14,573 22,797 442 882 883 20,590
The maturity analysis is based on undiscounted cash flows, including estimated interest. Interest is included based on current rates.
DKKm 2016 2015
FINANCIAL INCOME
Net foreign exchange gains - 166
Interest income on short-term bank deposits - 3
Interest income from Co-issuing activities - 27
Total financial income, exclusive of refinancing costs - 196
FINANCIAL EXPENSES
Net foreign exchange loss 147 -
Interest expense on external loans 826 921
Fair value adjustment of financial liabilities 7 -
Amortisation of transaction costs 41 44
Other fees etc. 34 32
Total financial expenses, exclusive of refinancing costs 1,055 997
Extraordinary amortisation of transaction costs in connection with refinancing 245
Payment in Kind interest in connection with early settlement 478
Settlement of interest swaps 15
Financial expenses - refinancing costs 738 -
Net financials, inclusive of refinancing costs -1,793 -801
2016
2015
MATURITY ANALYSIS

Nets Annual Report 2016 Financial statements 94
5.4 – Interest risk management
Probable change in
interest
Hypothetical impact on profit for the year
Hypothetical impact on equity
DKKm 2016 2015 2016 2015
Borrowings 1 p.p. 23 7 -180 7
The Group is exposed to interest rate risk on loans, credits and cash balances as well as mismatches on maturities between loans and cash, resulting in variable interest cash flows. The Group’s loan arrangements are based on
EXPOSURE TO CHANGES IN INTEREST RATES
DKKmVariable,
non-contractualContractual variable
rates < 1 month Total
Cash on hand 1,869 - 1,869
Bank loans - -9,106 -9,106
Clearing-related facilities - -314 -314
Net 1,869 -9,420 -7,551
A probable change in interest rates compared to the interest as at the balance sheet date would have the following hypothetical impact
5.5 – Commitments, contingencies and collaterals
SIGNIFICANT ACCOUNTING POLICIES
LeasesContracts to lease assets are classified as financial leasing if they transfer substantially all the risks and rewards of ownership of the asset to the Group. Other contracts to lease assets are classified as operating leases.
The Group as lesseeOperating lease payments are recognised as an expense on a straight-line basis over the lease term, except where another systematic basis is more representative of the time pattern in which economic benefits from the leased asset are consumed. Contingent rentals arising under operating leases are recognised as an expense in the period in which they are incurred.
GROUP AS A LESSEE:
The total contractual obligations as at 31 December can be specified as follows:
DKKm
Less than 1 year 1 - 3 years 3 - 5 years
More than 5 years Total
2016Operating leases 100 149 69 206 524
Total contractual obligations 100 149 69 206 524
2015Operating leases 103 142 72 0 317
Total contractual obligations 103 142 72 0 317
Operating lease commitments are related to non-cancellable operating leases primarily per-taining to premises, cars and office equipment. The lease costs for 2016 and 2015 were DKK 107 million and DKK 101 million, respectively.
COMMITMENTSThe Group has entered into a number of long-term agreements for the purchase of services.
CONTINGENCIESThe Group is engaged in certain litigation pro-ceedings. In the opinion of Management, settle-ment or continuation of these proceedings is not expected to have a material effect on the Group’s financial position, operating profit or cash flow.
The interest rate on the Term Loans in NOK and DKK are hedged (reference note 5.2). An increase in the interest rate of 1 p.p. would therefore only affect the Term Loans in EUR
and the revolving credit facility. An increase in the interest rate of 1 p.p. would result in a gain on equity related to the value of the derived financial instruments (interest hedge).
variable basis interest rates. Cash held at vari-able rates partly offsets risk arising from changing interest rates on the Group’s loans and credits.
on profit before tax and the Group’s equity, based on the exposure of balances as at 31 December.
Nets Annual Report 2016 Financial statements 95
This section includes disclosures that relate to the Group’s Tax and Governance policies.
Section 6:
Tax and Governance
6.1 – Income and deferred income taxes
SIGNIFICANT ACCOUNTING POLICIES
Income taxesTax for the year comprises current income tax, change in deferred tax and adjustments from prior years. Tax is recognised in the income statement except to the extent that it relates to items recognised in other com-prehensive income or equity.
The tax rates and tax laws used to compute the amount are those that are enacted, or substantively enacted, as at the reporting date in the countries where the Group oper-ates and generates taxable income. Deferred tax arises due to temporary differences between the carrying amount in the consoli-dated financial statements and the tax base of assets and liabilities as at the balance sheet date. Deferred tax is not recognised for temporary differences arising on the initial recognition of goodwill and other items where amortisation for tax purposes is disallowed.
Deferred tax assets are recognised if they can be offset against deferred tax in other consolidated enterprises or if it is probable that they can be utilised in future earnings.
Deferred tax is measured on the basis of the tax rules and tax rates in the respective countries that will be effective under the leg-islation as at the balance sheet date whenthe deferred tax is expected to be realised or the liability settled.
Changes in deferred tax as a result of changes in tax rates are recognised in the consolidated income statements except for the effect of items recognised directly in Other comprehensive income.
Deferred tax assets and liabilities are offset in the consolidated statement of financial posi-tion if the Group has a legally enforceable right to offset and the deferred tax assets and liabil-ities relate to the same legal tax entity.
Nets A/S and Danish subsidiaries are jointly taxed. The current Danish corporation tax allocated between the jointly taxed compa-nies in proportion to their taxable income is recognised in the consolidated income state-ments. The tax saving as a result of losses is also refunded proportionately.
The companies in the Group are taxed under the on-account tax scheme. Interest/refunds relating to the tax payment are included in interest income and expense and similar items.
Deferred tax assets and liabilities are offset in the consolidated statement of financial posi-tion if the Group has a legally enforceable right to offset and the deferred tax assets and liabil-ities relate to the same legal tax entity.

Nets Annual Report 2016 Financial statements 96
KEY ACCOUNTING ESTIMATES AND JUDGEMENTS
Deferred tax assetsThe Group recognises deferred tax assets, including the expected tax value of tax loss carry-forwards if management assesses that these tax assets can be offset against posi-tive taxable income in the near future. This judgement is made annually and based on budgets and business plans for the coming years, including planned commercial initia-
tives. As at 31 December 2016, the carrying amount of the deferred tax assets is DKK 376 million (2015: DKK 205 million) and unrec-ognised tax losses are DKK 1.117 million (2015: DKK 244 million). As a result of the IPO refi-nancing, capital losses due to foreign cur-rency translations on external debt have been realised and partly capitalised in 2016.
DKKm 2016 2015
INCOME TAXES EXPENSED
Current tax on profit for the year 659 160
Deferred tax on profit for the year -769 303
Adjustments related to previous years - current tax -2 -59
Income taxes in the income statement -112 404
6.1 – Income and deferred income taxes (continued)
DKKm 2016 2015
INCOME TAXES PAID
Income taxes paid in Denmark 534 127
Income taxes paid outside Denmark 119 -47
Total income taxes paid *) 653 80
* In 2016, tax paid related to VISA pass-through proceeds was DKK 388 million in Denmark and DKK 63 million in Finland.

Nets Annual Report 2016 Financial statements 97
6.1 – Income and deferred income taxes (continued)
DKKm 2016 2015
COMPUTATION OF EFFECTIVE TAX RATE PERCENTAGE
Statutory corporate income tax rate in Denmark 22.0 23.5 Deviation in foreign subsidiaries' tax rates compared with Danish tax rate 5.1 2.2
Permanent differences 1) -40.0 -23.3
Adjustments related to previous years - deferred tax 2.0 -
Adjustments related to previous years - current tax 0.3 -11.3 Previous years not recognised tax losses utilised or capitalised 2) 14.9 -
Change in income tax rates on deferred tax - 0.6
Other taxes 1.5 -4.0 Tax effect of fair value adjustment of Visa shares and related contingent consideration liability 3) 10.4 89.6
Effective tax rate 16.1 77.3
OTHER TAX INFORMATION
1. Permanent differences in 2016 mainly include income in Norway due to foreign cur-rency translation adjustments on external debt that is only recognised for tax pur-poses, and non-deductible costs related to the IPO of Nets. None of these items are expected to have a significant tax impact from 2017 and onwards.
The tax on the Group’s profit before tax differs from the theoretical amount that would arise using the weighted average tax rate applicable to profits of the consolidated entities as follows:
DKKm 2016 2015
PROFIT BEFORE TAX -696 523
Income tax expense calculated at domestic tax rate -153 123 Deviation in foreign subsidiaries' tax rates compared with Danish tax rate -35 11
Permanent differences 1) 279 -122
Adjustments related to previous years - deferred tax -14 -
Adjustments related to previous years - current tax -2 -59 Previous years not recognised tax losses utilised or capitalised 2) -104 -
Change in income tax rates on deferred tax - 3
Other taxes -10 -21 Tax effect of fair value adjustment of Visa shares and related contingent consideration liability 3) -73 469
Income tax expense recognised in the income statement -112 404
2. As a result of improved financial perfor-mance after the IPO of Nets, capitalisation of previous years’ losses have been revised, and an additional share of previous years losses has therefore been capitalised.
3. In 2016, the tax effect of pass-through pro-ceeds related to VISA shares includes a deferred tax income of DKK 115 million related to prior years. In 2016, Nets Oy received an advance ruling from the Finnish tax authorities allowing Nets Oy to deduct a certain amount of the proceeds from the VISA shares that is passed on to the rightful owners of the proceeds. As the full expense was treated as non-deductible in 2015, a deferred tax income of DKK 115 million related to prior years is recorded. See note 7.2.
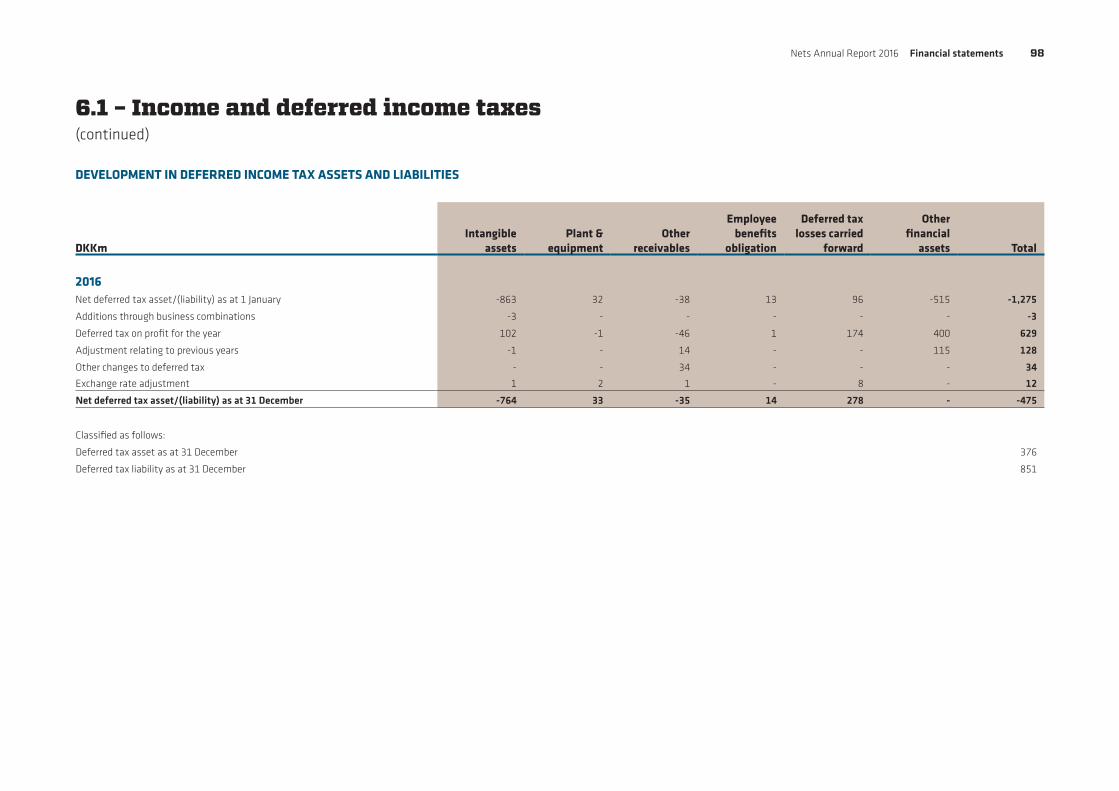
Nets Annual Report 2016 Financial statements 98
6.1 – Income and deferred income taxes (continued)
DKKmIntangible
assetsPlant &
equipmentOther
receivables
Employee benefits
obligation
Deferred tax losses carried
forward
Other financial
assets Total
2016Net deferred tax asset/(liability) as at 1 January -863 32 -38 13 96 -515 -1,275
Additions through business combinations -3 - - - - - -3
Deferred tax on profit for the year 102 -1 -46 1 174 400 629
Adjustment relating to previous years -1 - 14 - - 115 128
Other changes to deferred tax - - 34 - - - 34
Exchange rate adjustment 1 2 1 - 8 - 12
Net deferred tax asset/(liability) as at 31 December -764 33 -35 14 278 - -475
Classified as follows:
Deferred tax asset as at 31 December 376
Deferred tax liability as at 31 December 851
DEVELOPMENT IN DEFERRED INCOME TAX ASSETS AND LIABILITIES

Nets Annual Report 2016 Financial statements 99
6.1 – Income and deferred income taxes (continued)
DKKmIntangible
assetsPlant &
equipmentOther
receivables
Employee benefits
obligation
Deferred tax losses carried
forward
Other financial
assets Total
2015Net deferred tax asset/(liability) as at 1 January -863 35 -17 22 - - -823
Additions through business combinations -139 - - - - - -139
Deferred tax on profit for the year 148 -3 -21 -8 96 -515 -303
Adjustment relating to previous years -8 - - - - - -8 Deferred tax on items recognised inOther comprehensive income - - - -1 - - -1
Exchange rate adjustment -1 - - - - - -1
Net deferred tax asset/(liability) as at 31 December -863 32 -38 13 96 -515 -1,275
Classified as follows:
Deferred tax asset as at 31 December 205
Deferred tax liability as at 31 December 1,480
DEVELOPMENT IN DEFERRED INCOME TAX ASSETS AND LIABILITIES
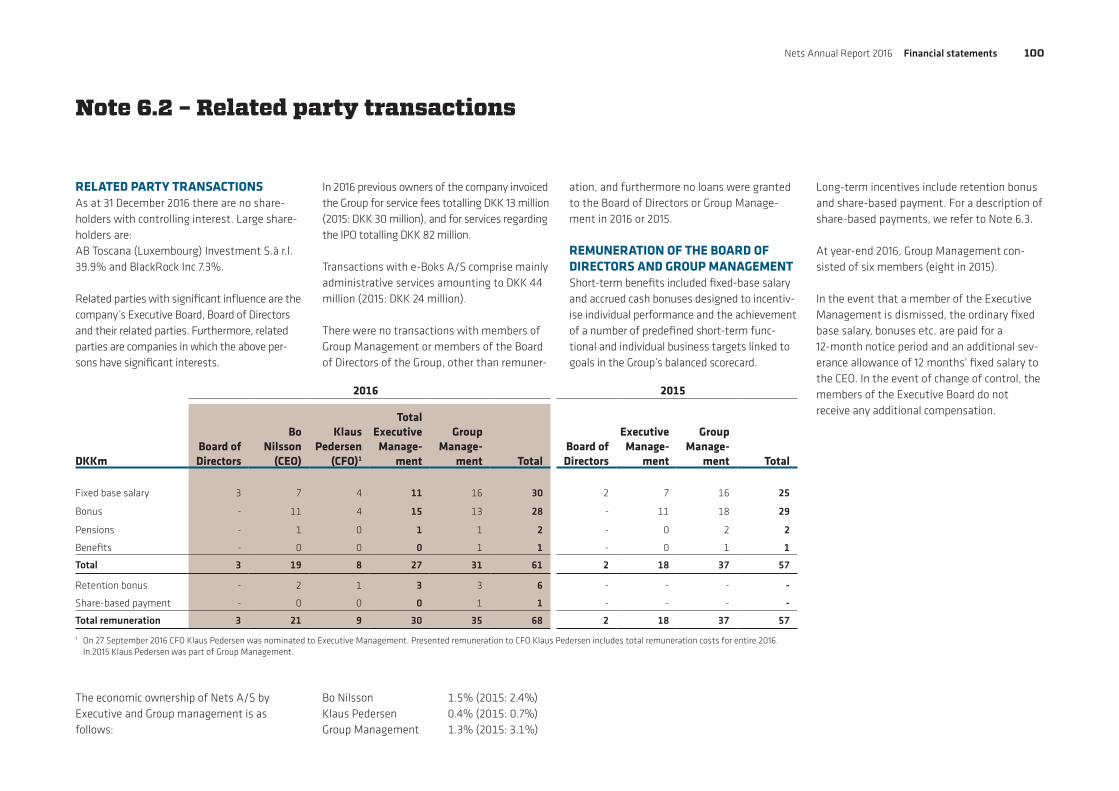
Nets Annual Report 2016 Financial statements 100
Note 6.2 – Related party transactions
RELATED PARTY TRANSACTIONSAs at 31 December 2016 there are no share-holders with controlling interest. Large share-holders are:AB Toscana (Luxembourg) Investment S.à r.l. 39.9% and BlackRock Inc 7.3%.
Related parties with significant influence are the company’s Executive Board, Board of Directors and their related parties. Furthermore, related parties are companies in which the above per-sons have significant interests.
In 2016 previous owners of the company invoiced the Group for service fees totalling DKK 13 million (2015: DKK 30 million), and for services regarding the IPO totalling DKK 82 million.
Transactions with e-Boks A/S comprise mainly administrative services amounting to DKK 44 million (2015: DKK 24 million).
There were no transactions with members of Group Management or members of the Board of Directors of the Group, other than remuner-
ation, and furthermore no loans were granted to the Board of Directors or Group Manage-ment in 2016 or 2015.
REMUNERATION OF THE BOARD OF DIRECTORS AND GROUP MANAGEMENTShort-term benefits included fixed-base salary and accrued cash bonuses designed to incentiv-ise individual performance and the achievement of a number of predefined short-term func-tional and individual business targets linked to goals in the Group’s balanced scorecard.
The economic ownership of Nets A/S by Executive and Group management is as follows:
Bo Nilsson 1.5% (2015: 2.4%)Klaus Pedersen 0.4% (2015: 0.7%)Group Management 1.3% (2015: 3.1%)
2016 2015
DKKmBoard of Directors
Bo Nilsson
(CEO)
Klaus Pedersen
(CFO)1
TotalExecutive
Manage-ment
Group Manage-
ment TotalBoard of Directors
Executive Manage-
ment
Group Manage-
ment Total
Fixed base salary 3 7 4 11 16 30 2 7 16 25
Bonus - 11 4 15 13 28 - 11 18 29
Pensions - 1 0 1 1 2 - 0 2 2
Benefits - 0 0 0 1 1 - 0 1 1
Total 3 19 8 27 31 61 2 18 37 57
Retention bonus - 2 1 3 3 6 - - - -
Share-based payment - 0 0 0 1 1 - - - -
Total remuneration 3 21 9 30 35 68 2 18 37 57
1 On 27 September 2016 CFO Klaus Pedersen was nominated to Executive Management. Presented remuneration to CFO Klaus Pedersen includes total remuneration costs for entire 2016. In 2015 Klaus Pedersen was part of Group Management.
Long-term incentives include retention bonus and share-based payment. For a description of share-based payments, we refer to Note 6.3.
At year-end 2016, Group Management con-sisted of six members (eight in 2015).
In the event that a member of the Executive Management is dismissed, the ordinary fixed base salary, bonuses etc. are paid for a 12-month notice period and an additional sev-erance allowance of 12 months’ fixed salary to the CEO. In the event of change of control, the members of the Executive Board do not receive any additional compensation.

Nets Annual Report 2016 Financial statements 101
Note 6.3 – Share-based payment
Employee share awardFollowing the IPO, each full-time employee was awarded shares worth DKK 24,900. The consolidated group expense in connection with
Accounting policiesThe share option programme is accounted for on an accrual basis over the vesting period. Share options issued are measured at fair value at the date of granting times the proba-bility of vesting. The total amount to be expensed over the vesting period is deter-mined by reference to the fair value of the options granted, excluding the impact of any non-market vesting conditions. The fair value is fixed at the grant date. Non-market vesting conditions are included in assumptions about the number of options that are expected to vest. The probabilities are adjusted at year-end. Nets A/S recognises the impact of adjustments to estimates, if any, in the income statement and in a corresponding adjustment to equity (change in proceeds) over the remaining vesting period. Adjust-ments relating to prior years are included in the income statement in the year of adjust-ment.
Share option programmeA long-term share option programme was established in 2016 in connection with the IPO and granted to Management and certain key employees. In connection with the Annual General Meeting, and as determined by the Board of Directors, share options are granted annually for an amount equivalent to 20-100% of annual salary (however maximum
0.75% of the share capital). Vesting is subject to fulfilment of certain key financial targets and continued employment at the vesting date. Each option gives the right to purchase one existing share in Nets A/S. The total value of the share option programme granted in 2016 was DKK 22 million. DKK 2 million was expensed in 2016 relating to the long-term share option programme.
Retention programmeIn connection with the IPO, a non-recurring share-based retention programme has been established for members of the Executive Committee and certain other employees (the “Retention Programme”). Under the Retention Programme, the participants may be granted shares at the end of a 720-day period subse-quent to the date where the Company was listed. The shares equal an amount of 24 months’ base salary, provided, among other things, that the participants have retained at least 25% of the total number of shares that were directly or indirectly held by the partici-pant under the former management Incentive Programme. The total costs associated with the Retention Programme amount to DKK 53 million, and will be recognised in the Income statements as staff costs over a two-year period. The cost recognised in 2016 amounts to DKK 6 million.
Share option programme 2016
Vesting conditions (KPIs)
Organic growth and
EBITDA
Exercise price DKK 165.00
Vesting July 2019Weighted average share price during exercise period Not vested
Average Black-Scholes value of options 19.4
Assumptions:
Risk-free interest rate -0.52%
Retention rate 80%
Volatility1 25.00%
Dividend 0.65%
Period 3,4 years
Number of share options Bo NilssonKlaus
PedersenGroup
ManagementKey
employees Total
Granted in the year 312,111 132,647 401,984 593,388 1,440,130
Outstanding as at 31 Decem-ber 2016 312,111 132,647 401,984 593,388 1,440,130
the Employee share award amounted to DKK 64 million in total including social costs. The shares delivered under the Employee share award were covered by issuing bonus shares.
1 A peer group for the estimation of the volatility has been applied. The volatility estimation is based on daily, weekly and monthly returns for the last 3.4 years, which is the expected duration of the options in the LTIP.

Nets Annual Report 2016 Financial statements 102
Note 6.4 – Fee to statutory auditors
DKKm 2016 2015
REMUNERATION TO AUDITORS(PWC AS ELECTED BY THE ANNUAL GENERAL MEETING)
Statutory audit 6 5
Non-statutory audit services:
Other assurance engagements 1 1
Tax advisory services 1 1
IPO-related costs 21 0
Other services* 3 11
Total non-statutory audit services 26 14
Total 32 18
* In 2016 and 2015 other services mainly comprised services related to Merger & Acquisition activities and business optimisation.

Nets Annual Report 2016 Financial statements 103
Included in this section are disclosures which are material to the financial statements from either a quantitative or a qualitative perspective, but which do not directly relate to a specific theme section.
Section 7:
Other disclosures
Note 7.1 – Pension assets and pension obligations, net
SIGNIFICANT ACCOUNTING POLICIES
PensionsThe Group has entered into defined benefit plans and defined contribution plans with its employees.
In a defined benefit plan, the Group is obliged to pay a specific benefit to certain employees from the time of retirement. A pension asset or pension obligation corresponding to the present value of the obligations less the defined pension plan’s assets at fair value is recognised for these benefit plans.
The costs of providing benefits under the defined benefit plan are determined annually by independent actuaries using the projected unit credit method.
The defined pension plans’ assets are esti-mated at fair value at the balance sheet date.
Remeasurements, comprising actuarial gains and losses, the effect of the asset ceiling, excluding amounts included in net interest on the net defined benefit liability and the return on plan assets (excluding amounts included in net interest on the net defined benefit liabil-ity), are recognised immediately in the state-ment of financial position with a correspond-ing debit or credit to retained earnings through OCI in the period in which they occur.
Remeasurements are not reclassified to profit or loss in subsequent periods.
Pension assets recognised are limited to the present value of future repayments from the pension plan or reduced future funding com-mitments. To calculate the present value of economic benefits, consideration is given to any applicable minimum funding requirements.
In case of changes in benefits relating to employees’ previous service period, a change in the estimated present value of the pen-sion obligations will occur, which will be rec-ognised immediately if the employees have acquired a final right to the changed bene-fits. If not, the change is recognised over the period in which the employees become enti-tled to the changed benefit.
Net periodic pension income/(cost) from defined benefit plans consists of the items: service costs, interest expenses and interest income on assets. Service costs are rec-ognised in wages, salaries and pension costs. Interest expenses and interest income on assets, net, are recognised in pension costs.
For the defined contribution plans, the Group will pay in a fixed periodic contribution to sepa-rate legal entities and will have no further obli-gations after the payment has been made.
Costs regarding defined contribution plans are recognised as incurred within staff costs.
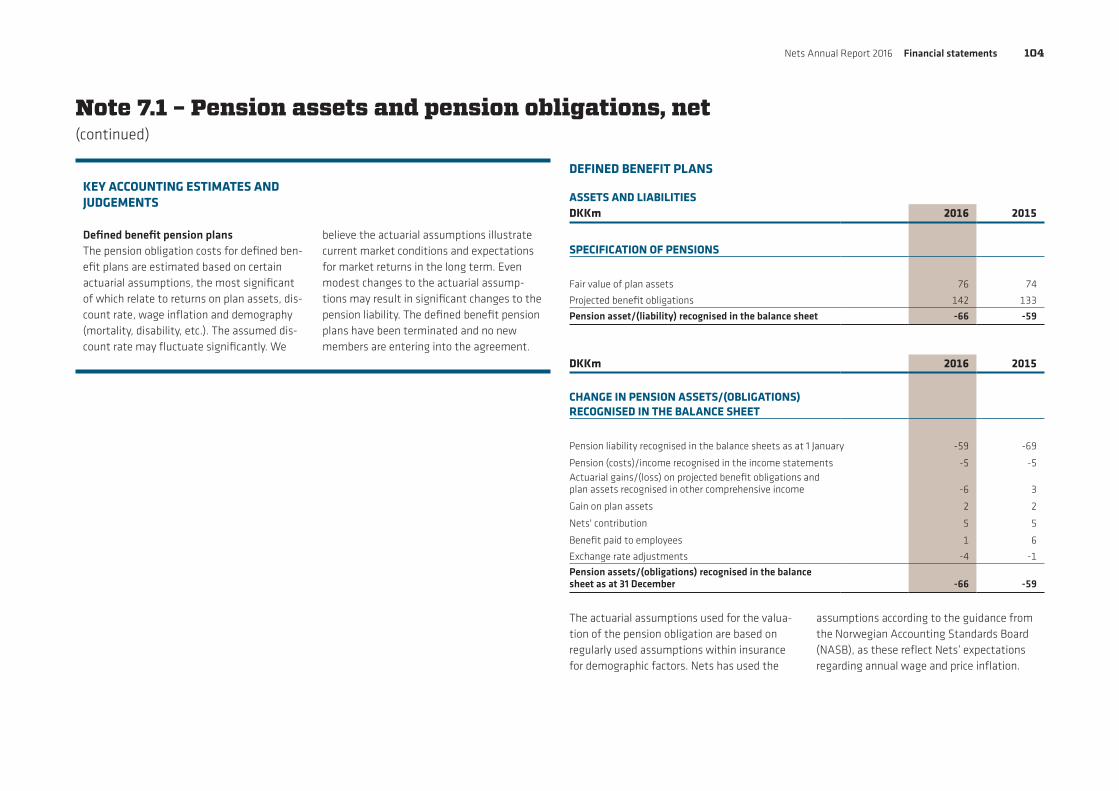
Nets Annual Report 2016 Financial statements 104
KEY ACCOUNTING ESTIMATES AND JUDGEMENTS
Defined benefit pension plansThe pension obligation costs for defined ben-efit plans are estimated based on certain actuarial assumptions, the most significant of which relate to returns on plan assets, dis-count rate, wage inflation and demography (mortality, disability, etc.). The assumed dis-count rate may fluctuate significantly. We
believe the actuarial assumptions illustrate current market conditions and expectations for market returns in the long term. Even modest changes to the actuarial assump-tions may result in significant changes to the pension liability. The defined benefit pension plans have been terminated and no new members are entering into the agreement.
Note 7.1 – Pension assets and pension obligations, net (continued)
The actuarial assumptions used for the valua-tion of the pension obligation are based on regularly used assumptions within insurance for demographic factors. Nets has used the
assumptions according to the guidance from the Norwegian Accounting Standards Board (NASB), as these reflect Nets’ expectations regarding annual wage and price inflation.
DEFINED BENEFIT PLANS
ASSETS AND LIABILITIESDKKm 2016 2015
SPECIFICATION OF PENSIONS
Fair value of plan assets 76 74
Projected benefit obligations 142 133
Pension asset/(liability) recognised in the balance sheet -66 -59
DKKm 2016 2015
CHANGE IN PENSION ASSETS/(OBLIGATIONS) RECOGNISED IN THE BALANCE SHEET
Pension liability recognised in the balance sheets as at 1 January -59 -69
Pension (costs)/income recognised in the income statements -5 -5 Actuarial gains/(loss) on projected benefit obligations and plan assets recognised in other comprehensive income -6 3
Gain on plan assets 2 2
Nets' contribution 5 5
Benefit paid to employees 1 6
Exchange rate adjustments -4 -1
Pension assets/(obligations) recognised in the balance sheet as at 31 December -66 -59

Nets Annual Report 2016 Financial statements 105
Note 7.1 – Pension assets and pension obligations, net (continued)
The table above shows the estimated impact of some of the risks that the Group is exposed to. The Group is also exposed to fluctuations in the market value of assets. For some of these risks, if the defined benefit obligation rises or falls, the market value of assets may move in the opposite direction, thereby eliminating part of the risk.
The Group has used a mortality rate in accor-dance with the Norwegian K2013 table. Overall, an expected lifetime after retirement at age 65 is 18.1 years for men and 21.1 years for women.
Assumptions Sensitivity Sensitivity
2016 2015
2016 2015 +1
%-point-1
%-point +1
%-point-1
%-point
Discount rate 2.6% 2.7% -14 18 -21 23
General wage inflation 2.5% 2.5% 4 -4 6 -5
Expected regulation of minimum payment 1.5% 0.0% 13 -11 18 -15
DKKm 2016 2015
EXPECTED MATURITY OF PROJECTED BENEFIT OBLIGATION
Within 1 year 6 7
1 - 5 years 23 25
Beyond 5 years 113 101
Total 142 133
Note 7.2 – Other financial assets and financial liabilities
SIGNIFICANT ACCOUNTING POLICIES
Financial assetsOther financial assets are classified, at initial rec-ognition, as financial assets at fair value through the income statement, held-to-maturity invest-ments, available-for-sale financial assets, or as derivatives designated as hedging instruments in an effective hedge, as appropriate.
All financial assets are recognised initially at fair value plus, in the case of financial assets not recorded at fair value through profit or loss, transaction costs that are attributable to the acquisition of the financial asset.
KEY ACCOUNTING ESTIMATES AND JUDGEMENTS
Other financial assets The Visa Inc. shares and contingent considerations held by Nets Oy and Teller A/S are designated as fair value through the income statement in order to present both the fair value gain of the assets and the value adjustment on the related liability to pass on the proceeds in the income statement.
Other financial liabilitiesOther financial liabilities consist of the liabilityto pass on the net proceed after tax to the former owners and are measured at fair value.
The fair value adjustments of the Visa Inc. shares and contingent consideration (assets) and the obligation to pass on any proceeds (liability) have been measured based on available information and Executive Management’s best estimate as at 31 December 2016.
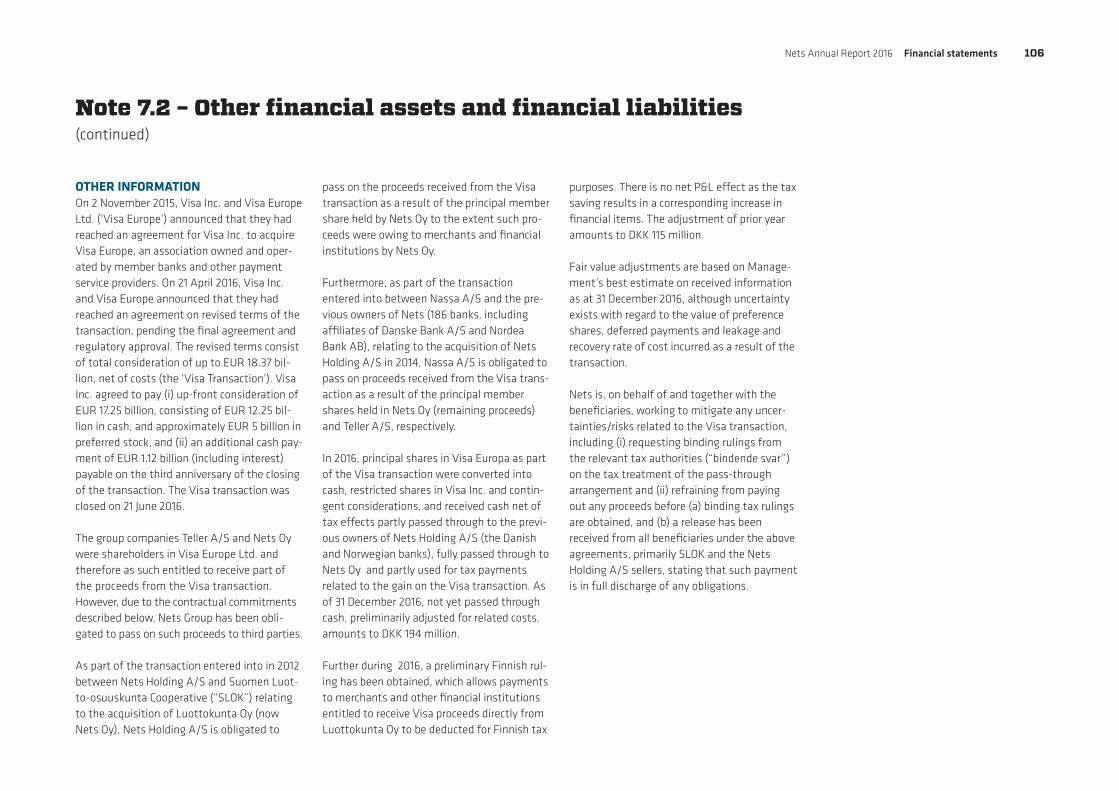
Nets Annual Report 2016 Financial statements 106
OTHER INFORMATIONOn 2 November 2015, Visa Inc. and Visa Europe Ltd. (‘Visa Europe’) announced that they had reached an agreement for Visa Inc. to acquire Visa Europe, an association owned and oper-ated by member banks and other payment service providers. On 21 April 2016, Visa Inc. and Visa Europe announced that they had reached an agreement on revised terms of the transaction, pending the final agreement and regulatory approval. The revised terms consist of total consideration of up to EUR 18.37 bil-lion, net of costs (the ‘Visa Transaction’). Visa Inc. agreed to pay (i) up-front consideration of EUR 17.25 billion, consisting of EUR 12.25 bil-lion in cash, and approximately EUR 5 billion in preferred stock, and (ii) an additional cash pay-ment of EUR 1.12 billion (including interest) payable on the third anniversary of the closing of the transaction. The Visa transaction was closed on 21 June 2016.
The group companies Teller A/S and Nets Oy were shareholders in Visa Europe Ltd. and therefore as such entitled to receive part of the proceeds from the Visa transaction. However, due to the contractual commitments described below, Nets Group has been obli-gated to pass on such proceeds to third parties.
As part of the transaction entered into in 2012 between Nets Holding A/S and Suomen Luot-to-osuuskunta Cooperative (“SLOK”) relating to the acquisition of Luottokunta Oy (now Nets Oy), Nets Holding A/S is obligated to
pass on the proceeds received from the Visa transaction as a result of the principal member share held by Nets Oy to the extent such pro-ceeds were owing to merchants and financial institutions by Nets Oy.
Furthermore, as part of the transaction entered into between Nassa A/S and the pre-vious owners of Nets (186 banks, including affiliates of Danske Bank A/S and Nordea Bank AB), relating to the acquisition of Nets Holding A/S in 2014, Nassa A/S is obligated to pass on proceeds received from the Visa trans-action as a result of the principal member shares held in Nets Oy (remaining proceeds) and Teller A/S, respectively.
In 2016, principal shares in Visa Europa as part of the Visa transaction were converted into cash, restricted shares in Visa Inc. and contin-gent considerations, and received cash net of tax effects partly passed through to the previ-ous owners of Nets Holding A/S (the Danish and Norwegian banks), fully passed through to Nets Oy and partly used for tax payments related to the gain on the Visa transaction. As of 31 December 2016, not yet passed through cash, preliminarily adjusted for related costs, amounts to DKK 194 million.
Further during 2016, a preliminary Finnish rul-ing has been obtained, which allows payments to merchants and other financial institutions entitled to receive Visa proceeds directly from Luottokunta Oy to be deducted for Finnish tax
Note 7.2 – Other financial assets and financial liabilities (continued)
purposes. There is no net P&L effect as the tax saving results in a corresponding increase in financial items. The adjustment of prior year amounts to DKK 115 million.
Fair value adjustments are based on Manage-ment’s best estimate on received information as at 31 December 2016, although uncertainty exists with regard to the value of preference shares, deferred payments and leakage and recovery rate of cost incurred as a result of the transaction.
Nets is, on behalf of and together with the beneficiaries, working to mitigate any uncer-tainties/risks related to the Visa transaction, including (i) requesting binding rulings from the relevant tax authorities (“bindende svar”) on the tax treatment of the pass-through arrangement and (ii) refraining from paying out any proceeds before (a) binding tax rulings are obtained, and (b) a release has been received from all beneficiaries under the above agreements, primarily SLOK and the Nets Holding A/S sellers, stating that such payment is in full discharge of any obligations.

Nets Annual Report 2016 Financial statements 107
Note 7.2 – Other financial assets and financial liabilities (continued)
In addition, the Group could potentially receive a share of proceeds payable by Visa Inc. to Visa Sweden, through the Group’s branch in Sweden. These proceeds are subject to a number of uncertainties and therefore not recognised in the balance sheet as at 31 December 2016.
DKKm 2016 2015
DEFERED TAX LIABILITY
Deferred tax on net fair value gain on available-for-sale financial assets - -515
Deferred tax liability as at 31 December - -515
CURRENT TAX LIABILITY
Current tax on net fair value gain -28 -
Current tax liability as at 31 December -28 -
DKKm 2016 2015
CASH FLOW
Received cash consideration related to Visa Europe Shares held by Teller Branch Norway 127 - Received cash consideration related to Visa Europe Shares held by Teller A/S 1,216 - Received cash consideration related to Visa Europe Shares held by Nets Oy 727 -
Proceeds from Visa Europe shares 2,070 -
Payment of Visa proceeds to former owners of Nets Holding A/S -662 -
Payment of Visa proceeds to former owners of Nets Oy -625 -
Payment of proceeds -1,287 -
Tax paid on pass through proceeds Teller A/S -388 -
Tax paid on pass through proceeds Nets Oy -64 -
Tax paid on pass through proceeds -452 -
DKKm 2016 2015
CONSOLIDATED INCOME STATEMENT
Value adjustment on shares (financial income) 413 2,428
Value adjustment on debt (financial expense) -448 -1,913
Adjustment related to previous year’s tax on pass through proceeds 115
Tax on pass through proceeds -80 -515
Net profit for the year on pass through proceeds - -
Proceeds related to Teller Branch Norway (financial income) 185 -
Tax on proceeds related to Teller Branch Norway -1 -
Net profit for the year 184 -
DKKm 2016 2015
OTHER FINANCIAL ASSETS
Visa Europe Shares and deferred consideration held by Teller A/S - 1,460
Visa Europe Shares and deferred consideration held by Nets Oy - 968 Restricted shares in Visa Inc. and contingent consideration held by Teller Branch Norway 59 - Restricted shares in Visa Inc. and contingent consideration held by Teller A/S 562 - Restricted shares in Visa Inc. and contingent consideration held by Nets Oy 336 -
Other financial assets as at 31 December 957 2,428
DKKm 2016 2015
OTHER FINANCIAL LIABILITIES
VISA proceeds to be transferred to former owners of Nets Holding A/S -721 -1,139
VISA proceeds to be transferred to former owners of Nets Oy -343 -774
Other financial liabilities as at 31 December -1,064 -1,913
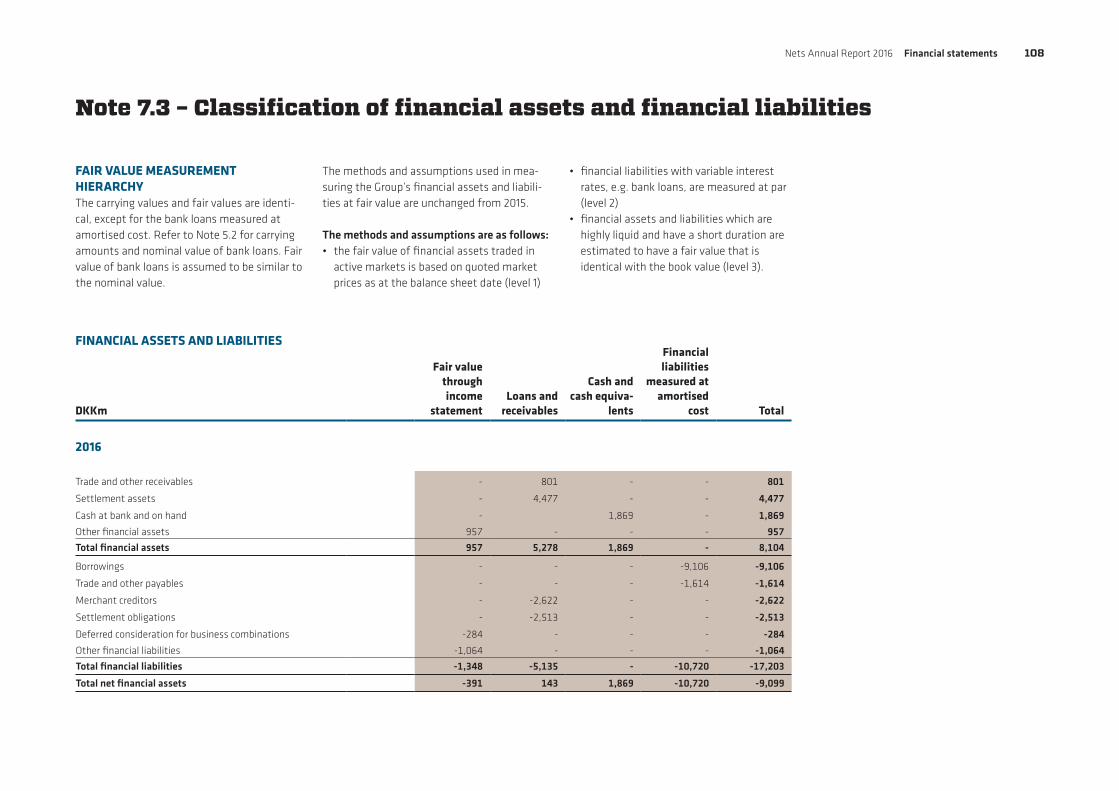
Nets Annual Report 2016 Financial statements 108
Note 7.3 – Classification of financial assets and financial liabilities
DKKm
Fair value through income
statementLoans and
receivables
Cash and cash equiva-
lents
Financial liabilities
measured at amortised
cost Total
2016
Trade and other receivables - 801 - - 801
Settlement assets - 4,477 - - 4,477
Cash at bank and on hand - 1,869 - 1,869
Other financial assets 957 - - - 957
Total financial assets 957 5,278 1,869 - 8,104
Borrowings - - - -9,106 -9,106
Trade and other payables - - - -1,614 -1,614
Merchant creditors - -2,622 - - -2,622
Settlement obligations - -2,513 - - -2,513
Deferred consideration for business combinations -284 - - - -284
Other financial liabilities -1,064 - - - -1,064
Total financial liabilities -1,348 -5,135 - -10,720 -17,203
Total net financial assets -391 143 1,869 -10,720 -9,099
FINANCIAL ASSETS AND LIABILITIES
FAIR VALUE MEASUREMENT HIERARCHYThe carrying values and fair values are identi-cal, except for the bank loans measured at amortised cost. Refer to Note 5.2 for carrying amounts and nominal value of bank loans. Fair value of bank loans is assumed to be similar to the nominal value.
The methods and assumptions used in mea-suring the Group’s financial assets and liabili-ties at fair value are unchanged from 2015.
The methods and assumptions are as follows:• the fair value of financial assets traded in
active markets is based on quoted market prices as at the balance sheet date (level 1)
• financial liabilities with variable interest rates, e.g. bank loans, are measured at par (level 2)
• financial assets and liabilities which are highly liquid and have a short duration are estimated to have a fair value that is identical with the book value (level 3).

Nets Annual Report 2016 Financial statements 109
Note 7.3 – Classification of financial assets and financial liabilities (continued)
DKKm
Fair value through income
statementLoans and
receivables
Cash and cash equiva-
lents
Financial liabilities
measured at amortised
cost Total
2015
Trade and other receivables - 832 - - 832
Settlement assets - 3,705 - - 3,705
Cash at bank and on hand - - 2,310 - 2,310
Other financial assets 2,428 - - - 2,428
Total financial assets 2,428 4,537 2,310 - 9,275
Borrowings - - - -14,573 -14,573
Trade and other payables - - - -1,863 -1,863
Merchant creditors - -2,066 - - -2,066
Settlement obligations - -2,417 - - -2,417
Deferred consideration for business combinations -163 - - - -163
Other financial liabilities -774 - - - -774
Total financial liabilities -937 -4,483 - -16,436 -21,856
Total net financial assets 1,491 54 2,310 -16,436 -12,581
FINANCIAL ASSETS AND LIABILITIES

Nets Annual Report 2016 Financial statements 110
Note 7.4 – Standards issued but not yet effective
The standards and interpretations which have been issued, but are not yet effective, up to the date of issuance of the Group’s financial statements, and which are considered to have an effect on the Group, are disclosed below.
New standards and amendments which are not yet effective and which are not considered to have an impact on the Group are not disclosed. The Group intends to adopt these standards, if applicable, when they become effective.
IFRS 9 FINANCIAL INSTRUMENTSIn July 2014, the IASB issued the final version of IFRS 9 Financial Instruments, which reflects all phases of the financial instruments project and replaces IAS 39 Financial Instruments: Recognition and Measurement and all previous versions of IFRS 9.
IFRS 9 is currently awaiting EU endorsement. The standard introduces new requirements for classification and measurement, impairment, and hedge accounting. IFRS 9 is effective for annual periods beginning on or after 1 Janu-ary 2018, with early application permitted.
The Group has assesed that there is no material impact of IFRS 9, and plans to adopt the new standard on the required effective date.
IFRS 15 REVENUE FROM CONTRACTS WITH CUSTOMERSIFRS 15 was issued in May 2014 and establishes a new five-step model that will apply to revenue arising from contracts with customers.
Under IFRS 15, revenue is recognised at an amount that reflects the consideration to which an entity expects to be entitled in exchange for transferring goods or services to a customer. The principles in IFRS 15 provide a more struc-tured approach to measuring and recognising revenue.
The new revenue standard is applicable to all entities and will supersede all current revenue recognition requirements under IFRS.
Either full or modified retrospective application is required for annual periods beginning on or after 1 January 2018, with early adoption permitted.
The Group has assesed that there is no material impact of IFRS 15, and plans to adopt the new standard on the required effective date.
IFRS 16 LEASESIASB has issued IFRS 16 ´Leases´, with effective date 1 January 2019. IFRS 16 is part of the con-vergence project with FASB to replace IAS 17. The standard requires recognition of assets and lia-bilities for most leases. Nets Group has made preliminary assessment of the impact of the standard and evaluated that the implementa-tion of the standard is likely to result in capital-isation of the majority of the Group´s opera-tional lease contracts. The Group is currently assessing the impact of IFRS 16, and plans to adopt the new standard on the required effec-tive date.
Note 7.5 – Events after the balance sheet date
On 31 January 2017, the Group acquired the remaining 42.3% of the shares in EDIgard AS, meaning that EDIgard AS is now fully owned by the Group.
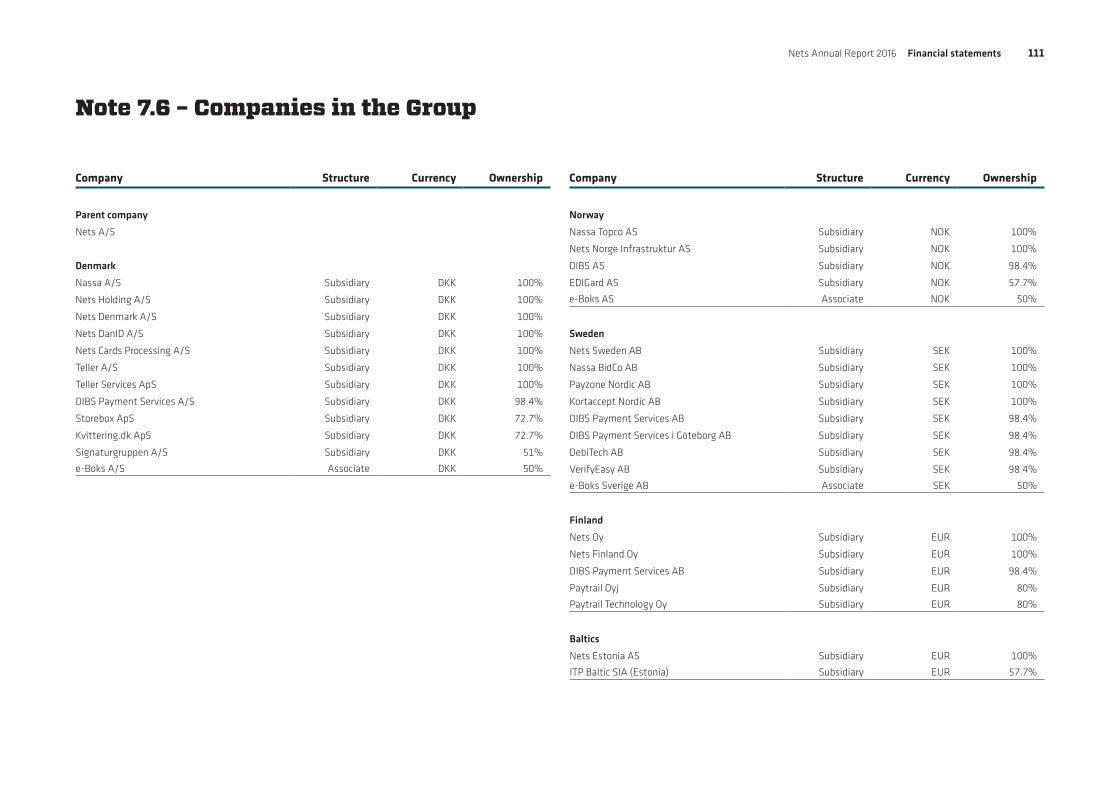
Nets Annual Report 2016 Financial statements 111
Note 7.6 – Companies in the Group
Company Structure Currency Ownership
Norway
Nassa Topco AS Subsidiary NOK 100%
Nets Norge Infrastruktur AS Subsidiary NOK 100%
DIBS AS Subsidiary NOK 98.4%
EDIGard AS Subsidiary NOK 57.7%
e-Boks AS Associate NOK 50%
Sweden
Nets Sweden AB Subsidiary SEK 100%
Nassa BidCo AB Subsidiary SEK 100%
Payzone Nordic AB Subsidiary SEK 100%
Kortaccept Nordic AB Subsidiary SEK 100%
DIBS Payment Services AB Subsidiary SEK 98.4%
DIBS Payment Services i Göteborg AB Subsidiary SEK 98.4%
DebiTech AB Subsidiary SEK 98.4%
VerifyEasy AB Subsidiary SEK 98.4%
e-Boks Sverige AB Associate SEK 50%
Finland
Nets Oy Subsidiary EUR 100%
Nets Finland Oy Subsidiary EUR 100%
DIBS Payment Services AB Subsidiary EUR 98.4%
Paytrail Oyj Subsidiary EUR 80%
Paytrail Technology Oy Subsidiary EUR 80%
Baltics
Nets Estonia AS Subsidiary EUR 100%
ITP Baltic SIA (Estonia) Subsidiary EUR 57.7%
Company Structure Currency Ownership
Parent company
Nets A/S
Denmark
Nassa A/S Subsidiary DKK 100%
Nets Holding A/S Subsidiary DKK 100%
Nets Denmark A/S Subsidiary DKK 100%
Nets DanID A/S Subsidiary DKK 100%
Nets Cards Processing A/S Subsidiary DKK 100%
Teller A/S Subsidiary DKK 100%
Teller Services ApS Subsidiary DKK 100%
DIBS Payment Services A/S Subsidiary DKK 98.4%
Storebox ApS Subsidiary DKK 72.7%
Kvittering.dk ApS Subsidiary DKK 72.7%
Signaturgruppen A/S Subsidiary DKK 51%
e-Boks A/S Associate DKK 50%
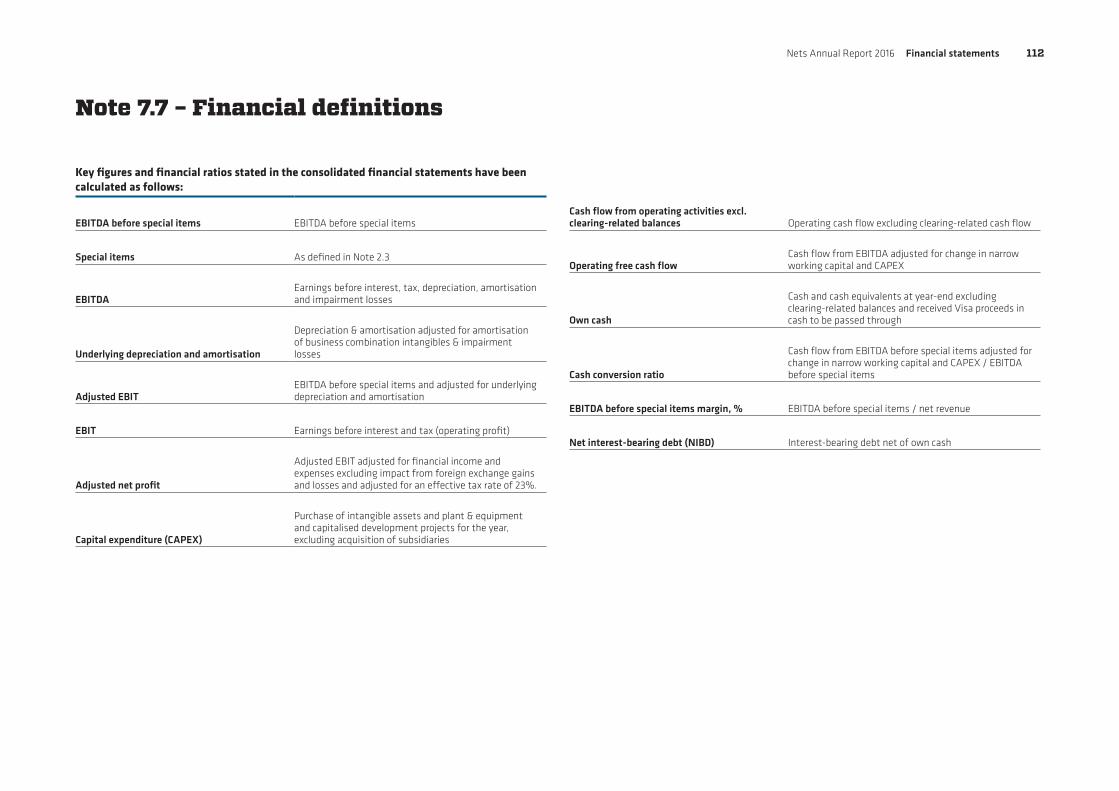
Nets Annual Report 2016 Financial statements 112
Note 7.7 – Financial definitions
Key figures and financial ratios stated in the consolidated financial statements have been calculated as follows:
EBITDA before special items EBITDA before special items
Special items As defined in Note 2.3
EBITDAEarnings before interest, tax, depreciation, amortisation and impairment losses
Underlying depreciation and amortisation
Depreciation & amortisation adjusted for amortisation of business combination intangibles & impairment losses
Adjusted EBITEBITDA before special items and adjusted for underlying depreciation and amortisation
EBIT Earnings before interest and tax (operating profit)
Adjusted net profit
Adjusted EBIT adjusted for financial income and expenses excluding impact from foreign exchange gains and losses and adjusted for an effective tax rate of 23%.
Capital expenditure (CAPEX)
Purchase of intangible assets and plant & equipment and capitalised development projects for the year, excluding acquisition of subsidiaries
Cash flow from operating activities excl. clearing-related balances Operating cash flow excluding clearing-related cash flow
Operating free cash flowCash flow from EBITDA adjusted for change in narrow working capital and CAPEX
Own cash
Cash and cash equivalents at year-end excluding clearing-related balances and received Visa proceeds in cash to be passed through
Cash conversion ratio
Cash flow from EBITDA before special items adjusted for change in narrow working capital and CAPEX / EBITDA before special items
EBITDA before special items margin, % EBITDA before special items / net revenue
Net interest-bearing debt (NIBD) Interest-bearing debt net of own cash

Nets Annual Report 2016 Financial statements 113
Income statement for the parent companyDKKm Note 2016
Revenue 2 1
External expenses -79
Staff costs 3 -10
Operating profit (EBIT) -88
Financial income 4 2
Financial expenses 4 -0
Net financials 2
Profit before tax -86
Income taxes -4
Net profit for the year -90
Proposed profit appropriation
Retained earnings -90
Total appropriation -90
Financial statement:
Parent Company

Nets Annual Report 2016 Financial statements 114
Balance sheet for the parent company
EQUITY AND LIABILITIES
Equity
Share capital 200
Reserves 10,130
Total equity 10,330
Current liabilities
Trade and other payables 6 86
Payable to group enterprises 4
Total current liabilities 90
Total liabilities 90
Total equity and liabilities 10,420
Accounting policies 1Contingent liabilities 7Related party transactions 8
DKKm Note 2016
ASSETS
Non-current assets
Investment in subsidiaries 5 10,144
Total non-current assets 10,144
Current assets
Other receivables 13
Prepayments (prepaid wages) 1
Receivables from group enterprises 261
Cash and cash equivalent 1
Total current assets 276
Total assets 10,420
Statement of changes in equity for the parent company
DKKmShare
capitalRetained earnings
Total equity
2016
Equity 5 February 1 - 1
Capital increase (share exchange) 162 4,859 5,021
Capital increase (sale of primary) 37 5,463 5,500
IPO-related costs - -170 -170
Net profit for the year - -90 -90
Share based payment (Employee share bonus) - 60 60
Share based payment 8 8
Total changes in equity 199 10,130 10,329
Equity 31 December 200 10,130 10,330 Nets A/S was formed on 5 February 2016 with a share capital of DKK 500,000. Several capital increases were made in the year of 2016, by issuing a total of 200,411,094 new shares, each with a nominal share value of DKK 1. Moreover, a capital reduction was made during the year of DKK 500,000. At 31 December 2016, total outstanding shares in Nets A/S is 200,411,094, each with a nominal value of DKK 1. All shares are ordinary shares.

Nets Annual Report 2016 Financial statements 115
Note 1 – Accounting policies
when the recoverable amount of investment decreases below acquisition cost.
Dividend or other direct payments received from subsidiaries or associates are recognised as income from financing and investing activi-ties and presented in the income statement.
Fair value of share options issued to employ-ees of the subsidiaries of Nets A/S are accounted for as a capital contribution over the vesting period, whereby it is recorded as an addition during the year. Payments received from subsidiaries to compensate Nets A/S upon an employees’ exercise of share options are, oppositely, deducted from the accumu-lated cost of investments in subsidiaries.
TaxFor Danish tax purposes, the Parent is assessed jointly with its Danish subsidiaries. The Danish jointly taxed companies are included in a Danish on-account tax payment scheme for Danish corporate income tax. All current taxes under the scheme are recorded in the individual companies.
Statement of cash flowsNo separate statement of cash flows has been prepared for the parent company; please refer to the consolidated statement of cash flows.
The financial statements of the parent company have been prepared in accordance with the Dan-ish Financial Statements Act (Class D) and other accounting regulations for companies listed on NASDAQ Copenhagen.
The accounting policies for the financial state-ments of the parent company are the same as for the consolidated financial statements with the following additions. For a description of the accounting policies of the Group, please refer to Section 1 in the consolidated financial statements.
Nets A/S was formed on 5 February 2016 for the purpose of acquiring Nassa Topco AS (the former ultimate holding company of Nets Holding A/S).
The shareholders of Nassa Topco AS have, prior to the IPO, exchanged all shares in Nassa Topco AS for new shares in Nets A/S via a share-for-share exchange. Nets A/S is hereaf-ter the new parent of the Group.
SUPPLEMENTARY ACCOUNTING POLICIES FOR THE PARENT COMPANYFinancial assetsIn the financial statements of the parent com-pany, investments in subsidiaries and associ-ated companies are recorded at their acquisi-tion cost. The acquisition cost is adjusted only
Note 2 – Revenue
DKKm 2016
Group services (wages and salaries etc) 1
Total 1
Note 3 – Staff costs
DKKm 2016
Staff costs
Wages and salaries 7
Share-based payment costs 3
Pensions - defined contribution plans 0
Other social security contributions 0
Other employee costs 0
Total employee costs for the year 10
Average number of full-time employees 2
Year-end number of full-time employees 2
Staff costs comprise costs to Executive Management who were employed in Nets A/S from 1 October 2016.
For information regarding remuneration to the Board of Directors and the Executive Management please refer to note 6.2 in the consolidated financial statements. For information regarding share-based payment please refer to note 6.3 in the consolidated financial statements.
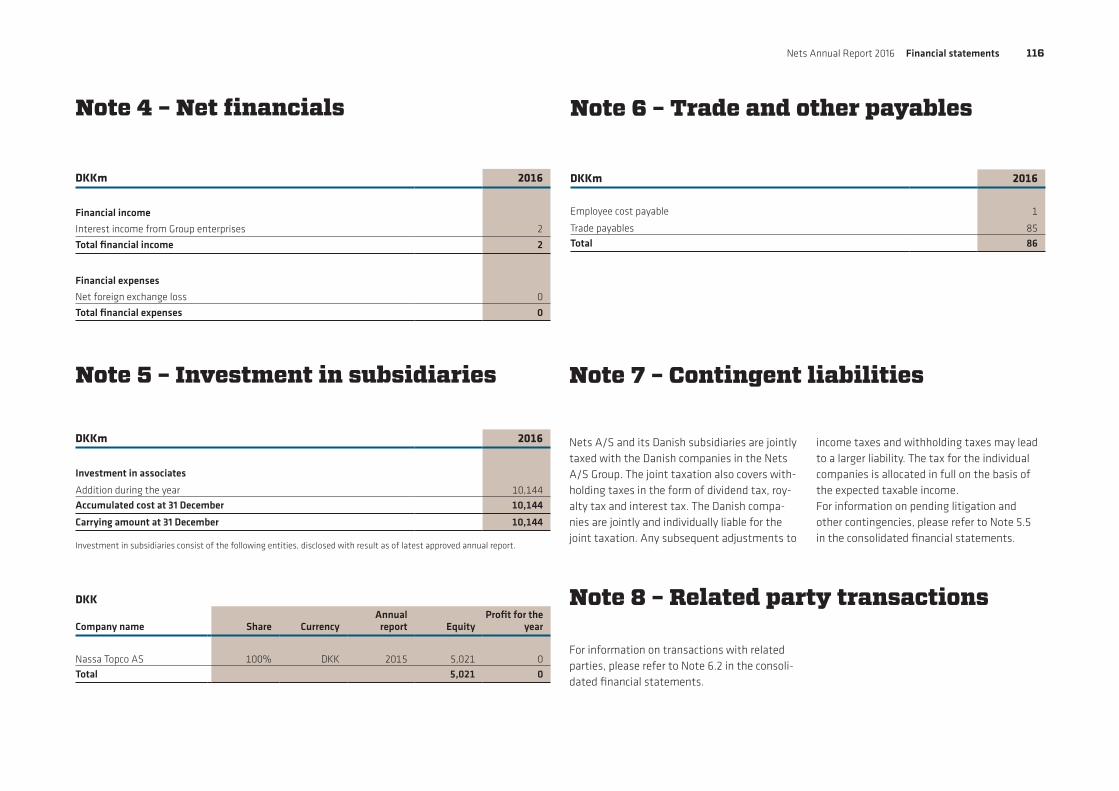
Nets Annual Report 2016 Financial statements 116
Note 5 – Investment in subsidiaries
Note 6 – Trade and other payables
DKKm 2016
Investment in associates
Addition during the year 10,144
Accumulated cost at 31 December 10,144
Carrying amount at 31 December 10,144
DKKm 2016
Employee cost payable 1
Trade payables 85
Total 86
Note 7 – Contingent liabilities
Nets A/S and its Danish subsidiaries are jointly taxed with the Danish companies in the Nets A/S Group. The joint taxation also covers with-holding taxes in the form of dividend tax, roy-alty tax and interest tax. The Danish compa-nies are jointly and individually liable for the joint taxation. Any subsequent adjustments to
income taxes and withholding taxes may lead to a larger liability. The tax for the individual companies is allocated in full on the basis of the expected taxable income. For information on pending litigation and other contingencies, please refer to Note 5.5 in the consolidated financial statements.
Note 8 – Related party transactions
For information on transactions with related parties, please refer to Note 6.2 in the consoli-dated financial statements.
Note 4 – Net financials
DKKm 2016
Financial income
Interest income from Group enterprises 2
Total financial income 2
Financial expenses
Net foreign exchange loss 0
Total financial expenses 0
DKK
Company name Share CurrencyAnnual
report EquityProfit for the
year
Nassa Topco AS 100% DKK 2015 5,021 0
Total 5,021 0
Investment in subsidiaries consist of the following entities, disclosed with result as of latest approved annual report.
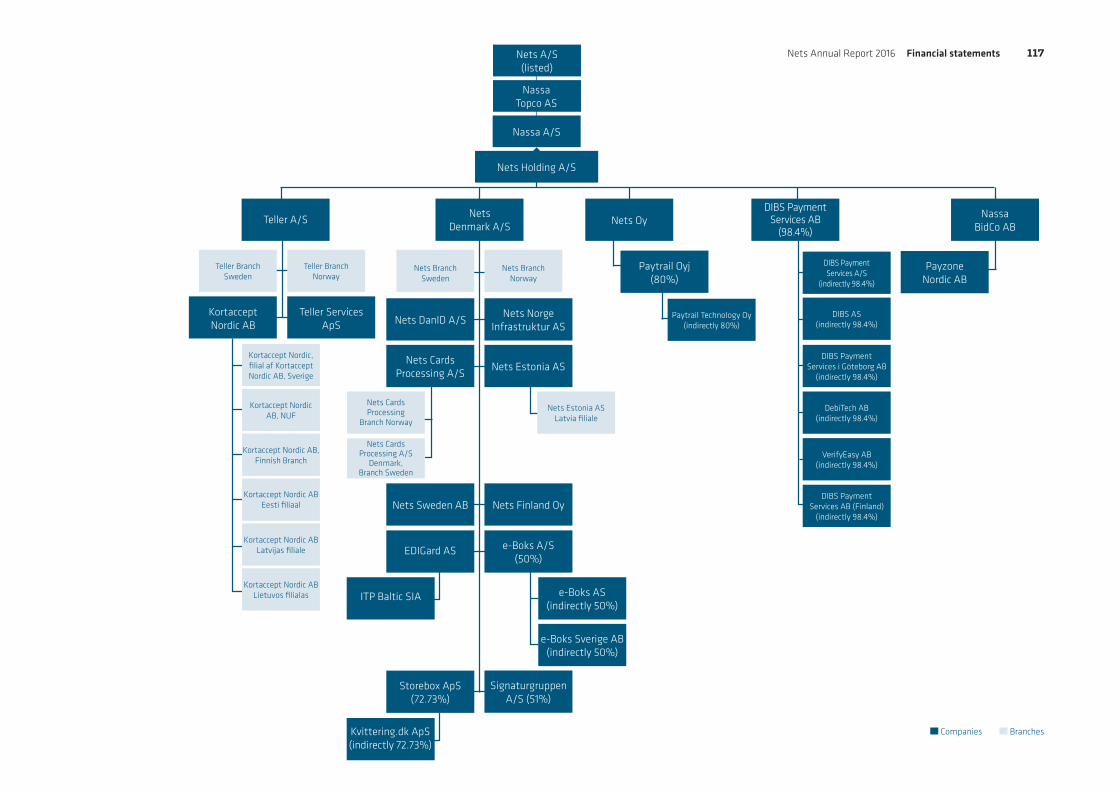
NassaTopco AS
Nets A/S(listed)
Nets Holding A/S
NassaBidCo AB
PayzoneNordic AB
Nets Oy
Paytrail Technology Oy(indirectly 80%)
Paytrail Oyj(80%)
Teller A/S
Teller BranchNorway
Teller BranchSweden
Companies Branches
KortacceptNordic AB
Teller Services ApS
Kortaccept Nordic,filial af KortacceptNordic AB, Sverige
Kortaccept NordicAB, NUF
Kortaccept Nordic AB,Finnish Branch
Kortaccept Nordic ABEesti filiaal
Kortaccept Nordic ABLatvijas filiale
Kortaccept Nordic ABLietuvos filialas
Nets Denmark A/S
Nets BranchSweden
Nets Sweden AB
Nets DanID A/S
EDIGard AS
Storebox ApS(72.73%)
ITP Baltic SIA
Nets Cards Processing A/S
Nets Cards Processing
Branch Norway
Nets CardsProcessing A/S
Denmark, Branch Sweden
e-Boks AS(indirectly 50%)
e-Boks Sverige AB(indirectly 50%)
Nets Estonia AS
Nets Estonia ASLatvia filiale
Nets BranchNorway
Nets Finland Oy
Nets Norge Infrastruktur AS
e-Boks A/S (50%)
Signaturgruppen A/S (51%)
DIBS Payment Services AB
(98.4%)
DIBS PaymentServices A/S
(indirectly 98.4%)
DIBS AS(indirectly 98.4%)
DIBS PaymentServices i Göteborg AB
(indirectly 98.4%)
DebiTech AB(indirectly 98.4%)
VerifyEasy AB(indirectly 98.4%)
DIBS PaymentServices AB (Finland)
(indirectly 98.4%)
Nassa A/S
Kvittering.dk ApS(indirectly 72.73%)
Nets Annual Report 2016 Financial statements 117

Nets Annual Report 2016 Financial statements 118
Digital login - login details to log on to a digital mailbox or similar
Digital receipt - refer to ‘e-receipt’
Digital wallet – software that allows an individual to carry out electronic transactions, in-store or online
Direct debit payment – (Betalingsservice) an instruction from a consumer to their bank, authorising the receiver, usually a corporate, to collect varying amounts from the consumer’s account, provided the account holder has been given advanced notice of the amount and dates of collection
DNS - Domain Name System
Dynamic Currency Conversion - a financial service in which credit card holders have the cost of a transaction converted to their home currency at the point of sale when shopping abroad
e-billing (electronic billing) - when a company sends its bills over the internet, and customers pay the bills electronically
e-commerce (electronic commerce) - a transaction of buying or selling online
e-identity - refer to ‘digital identity’
eFaktura - Nets’ Norwegian e-billing service
e-receipt - an electronic receipt of any goods/services that have been purchased, opposed to a paper receipt.
e-wallet - refer to ‘digital wallet’
Contactless transactions - payment card transactions carried out in-store without the consumer having to insert their card into a terminal or enter their pin
CMS – Consumer Management Services
CVC - card verification code – a 3-digit number at the back of a credit or debit card
Dankort - the Danish domestic debit card owned and operated by Nets
Dankort app – a certified app for iOS and Android which will enable all Dankort cardholders to pay with their mobile
Data analytics - in this context, the process of examining very large data sets in order to draw conclusions about the information they contain, increasingly with the aid of specialised software
DDoS (Distributed Denial of Service) - a cyber-attack where the perpetrator uses more than one, often thousands, of unique IP addresses
Digital authentication - an electronic authentication process that confirms or certifies a person’s identity and works
Digital identity - information on an entity used by computer systems to represent an external agent. That agent may be a person, organisation, application, or device
Digital Innovation Lab - Nets’ Digital Lab undertakes user-driven innovation with stakeholders across the business and in close dialogue with end-users and customers
Glossary*
3D Secure (secured by Nets) - an additional security layer for online credit and debit card transactions
A2A - account-to-account
Acceptance - a service that allows merchants to accept card payments
Account-based services - payments-based account infrastructure
Acquiring services (merchant acquiring) - the act of handling credit or debit card payments on behalf of a merchant
API - ‘application programme interface’. A language and message format used by software applications to communicate with each other
Artificial intelligence (AI) - intelligence exhibited by machines
Avtalegiro - a service offered by Nets in Norway for automatic invoicing and payment of recurring bills
BankAxept - a domestic payment scheme owned by Norwegian banks. Nets operates the common operating infrastructure for BankAxept’s debit card
BankID - a digital identity solution in Norway operated by Nets on behalf of banks
Betalingsservice - a direct debit solution offered by Nets to Danish corporates and their customers
Biometrics - metrics related to human characteristics, such as finger print, iris og face recognition or behavioral patterns such as typing patterns, used a.o. for access control
Blockchain – a distributed ledger technology / decentral database
Blockchain Lab - Nets’ blockchain lab established in May 2016 in a strategic partnership with Coinify
Bluetooth Low Energy (BLE) - a wireless technology standard for exchanging data over short distances between devices, e.g. a terminal and a mobile phone
Card issuer - most often a bank that issues payment cards, authorises and clears card transactions, and provides ongoing statementing, collections, and customer service
Card storage -a functionality offered by Nets, which allows consumers to shop online using only 3 digits instead of having to enter all card details
CERT - Computer Emergency Response Team
CERT Coordination Center - the worldwide center for coordinating information about internet security at Carnegie Mellon University
Clearing - the process of reconciliation of orders between transacting parties
Collecting Payment Service Provider (cPSP) - offers an integrated payment service to merchants that handles the technical facilitation of a transaction as well as the resulting financial settlement to the merchants’ account
Contactless Dankort - the Danish domestic debit card with a contactless functionality. The Dankort scheme is owned by Nets
*Terms are explained in the context of this report
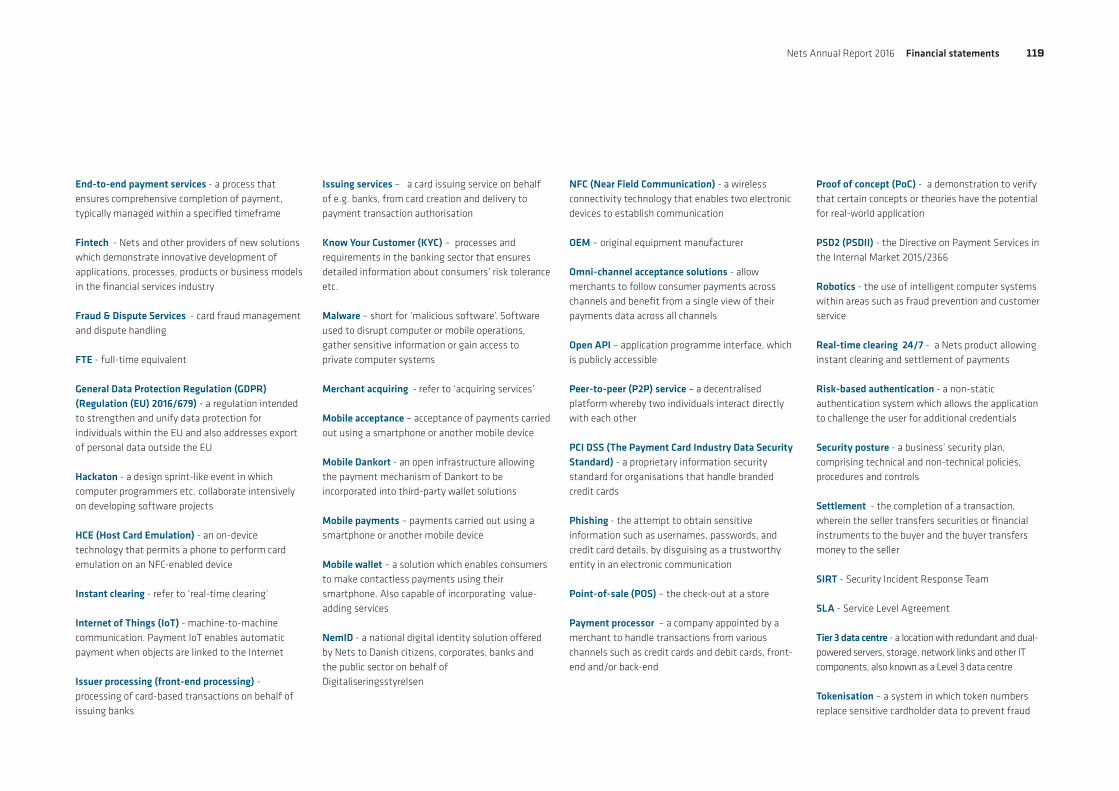
Nets Annual Report 2016 Financial statements 119
Proof of concept (PoC) - a demonstration to verify that certain concepts or theories have the potential for real-world application
PSD2 (PSDII) - the Directive on Payment Services in the Internal Market 2015/2366
Robotics - the use of intelligent computer systems within areas such as fraud prevention and customer service
Real-time clearing 24/7 - a Nets product allowing instant clearing and settlement of payments
Risk-based authentication - a non-static authentication system which allows the application to challenge the user for additional credentials
Security posture - a business’ security plan, comprising technical and non-technical policies, procedures and controls
Settlement - the completion of a transaction, wherein the seller transfers securities or financial instruments to the buyer and the buyer transfers money to the seller
SIRT - Security Incident Response Team
SLA - Service Level Agreement
Tier 3 data centre - a location with redundant and dual-powered servers, storage, network links and other IT components, also known as a Level 3 data centre
Tokenisation – a system in which token numbers replace sensitive cardholder data to prevent fraud
NFC (Near Field Communication) - a wireless connectivity technology that enables two electronic devices to establish communication OEM – original equipment manufacturer
Omni-channel acceptance solutions - allow merchants to follow consumer payments across channels and benefit from a single view of their payments data across all channels
Open API – application programme interface, which is publicly accessible
Peer-to-peer (P2P) service – a decentralised platform whereby two individuals interact directly with each other
PCI DSS (The Payment Card Industry Data Security Standard) - a proprietary information security standard for organisations that handle branded credit cards
Phishing - the attempt to obtain sensitive information such as usernames, passwords, and credit card details, by disguising as a trustworthy entity in an electronic communication
Point-of-sale (POS) – the check-out at a store
Payment processor – a company appointed by a merchant to handle transactions from various channels such as credit cards and debit cards, front-end and/or back-end
Issuing services – a card issuing service on behalf of e.g. banks, from card creation and delivery to payment transaction authorisation
Know Your Customer (KYC) – processes and requirements in the banking sector that ensures detailed information about consumers’ risk tolerance etc.
Malware – short for ‘malicious software’. Software used to disrupt computer or mobile operations, gather sensitive information or gain access to private computer systems
Merchant acquiring - refer to ‘acquiring services’
Mobile acceptance – acceptance of payments carried out using a smartphone or another mobile device
Mobile Dankort - an open infrastructure allowing the payment mechanism of Dankort to be incorporated into third-party wallet solutions
Mobile payments – payments carried out using a smartphone or another mobile device
Mobile wallet – a solution which enables consumers to make contactless payments using their smartphone. Also capable of incorporating value-adding services
NemID - a national digital identity solution offered by Nets to Danish citizens, corporates, banks and the public sector on behalf of Digitaliseringsstyrelsen
End-to-end payment services - a process that ensures comprehensive completion of payment, typically managed within a specified timeframe
Fintech - Nets and other providers of new solutions which demonstrate innovative development of applications, processes, products or business models in the financial services industry
Fraud & Dispute Services - card fraud management and dispute handling
FTE - full-time equivalent
General Data Protection Regulation (GDPR) (Regulation (EU) 2016/679) - a regulation intended to strengthen and unify data protection for individuals within the EU and also addresses export of personal data outside the EU
Hackaton - a design sprint-like event in which computer programmers etc. collaborate intensively on developing software projects
HCE (Host Card Emulation) - an on-device technology that permits a phone to perform card emulation on an NFC-enabled device
Instant clearing - refer to ‘real-time clearing’
Internet of Things (IoT) - machine-to-machine communication. Payment IoT enables automatic payment when objects are linked to the Internet
Issuer processing (front-end processing) - processing of card-based transactions on behalf of issuing banks

Nets Annual Report 2016 Financial statements 120
Nets A/SLautrupbjerg 10 • DK-2750 Ballerup • www.nets.eu • CVR no. 37427497


![On the invariants of coloured Petri Netslcm.csa.iisc.ernet.in/hari/all-publications/journals-book... · 2016. 8. 3. · Predicate-Transition Nets (Pr-T Nets) [2,3] and Coloured Petri](https://static.documents.pub/doc/80x56/60a86f88117d2a1dcd3b6f09/on-the-invariants-of-coloured-petri-2016-8-3-predicate-transition-nets-pr-t.jpg)
