2016 Calgary Profile: Chapter 7 Housing, Mobility and Migration 1 Published July 2018 Introduction This profile contains information released by Statistics Canada from the 2016 Census of Canada about Calgary. This chapter presents data that covers housing (specific to private dwellings) as well as mobility and migration. Highlighted terms throughout the document are defined in the Glossary. Data quality information, notes and sources are found in the Notes and References sections at the end of the document. For more information visit our webpage or contact socialresearch@calgary.ca. Results Snapshot 2016 = █ 2006 = █ Sources: Statistics Canada 2008a; 2008b; 2008c; 2017a; 2017b; 2017c; 2017d; 2017e; 2017f. Table of Contents Introduction 1 Core Housing Need 9 Notes 14 Results Snapshot 1 Mobility and Migration 10 References 15 Calgary in 2016 Canadian Comparisons Glossary 16 Tenure 2 Tenure 12 Dwelling Value 5 Core Housing Need 12 Shelter Cost 6 Subsidized Housing 13 Housing Affordability 7 Mobility and Migration 13 Median Value of Dwellings $450,338 $328,625 Percentage of Owner Occupied Households 71% 73% Average Monthly Shelter Costs (Owned Dwellings) $1,612 $1,175 Average Monthly Shelter Costs (Rented Dwellings) $1,354 $871 Households in Core Housing Need 52,965 12% 34,802 9% Percentage of Households Experiencing Dimensions of Core Housing Need Unaffordable…….22% Unsuitable…………5% Inadequate………...4% Living in Subsidized Housing Individuals Households 28,250 13,555 2% 3%
Transcript
2016 Calgary Profile: Chapter 7 Housing, Mobility and Migration
1 Published July 2018
Introduction This profile contains information released by Statistics Canada from the 2016 Census of Canada about
Calgary. This chapter presents data that covers housing (specific to private dwellings) as well as mobility and
migration.
Highlighted terms throughout the document are defined in the Glossary. Data quality information, notes and
sources are found in the Notes and References sections at the end of the document. For more information visit
The median household total income of owner households ($117,267) in the Calgary CMA was almost twice the
median household income of renter households ($62,096).
Median Total Household Income by Tenure, Calgary CMA 2015
Owner Renter
Median total household income $117,267 $62,096
Renter household income as a percentage of owner household income
- 53%
Source: Statistics Canada 2017i.
Calgary Profile – Chapter 7: Housing, Mobility and Migration
5 Published July 2018
Calgary: Dwelling Value Between 2006 and 2016, the median owner-estimated dwelling value increased by 37 per cent from $328,625
to $450,338.This value is specific to owner households and refers to the dollar amount expected by the owner
if the dwelling were to be sold. Information on dwelling value is not available for renter households.
Dwelling Value (Owner-Estimated), Calgary 2006 & 2016
2006 2016
Per Cent Change 2006-2016
Median value of dwelling for owner households $328,625 $450,338 37%
Source: Statistics Canada 2008c; 2017e.
Among owner households in Calgary, there were 4,400 homes valued below $100,000 and 5,600 homes
estimated to be worth $1.5 million dollars or more. However, most homes (62 per cent) were valued at
between $300,000 and $599,999.
Source: Statistics Canada 2017j.
Among owner households in Calgary, single-detached homes had the highest dwelling value at just over
$500,000, followed by duplexes ($448,946) and semi-detached homes ($400,808).
Dwelling Value (Owner-Estimated) by Structure Type for Owner Households, Calgary 2016 Median Value of Dwellings
Total owner private households $450,338
Single-detached house $500,762
Semi-detached house $400,808
Duplex $448,946
Row house $320,719
Apartment in a building that has five or more storeys $349,836
Apartment in a building that has fewer than five storeys $276,414
Movable dwelling $60,127
Source: Statistics Canada 2017j.
4,410
5,060
29,690
65,885
82,725
59,500
45,300
25,010
10,275
5,580
Less than $100,000
$100,000 to $199,999
$200,000 to $299,999
$300,000 to $399,999
$400,000 to $499,999
$500,000 to $599,999
$600,000 to $749,999
$750,000 to $999,999
$1,000,000 to $1,499,999
$1,500,000 or more
Dwelling Value (Owner-Estimated) for Owner Households, Calgary 2016
Calgary Profile – Chapter 7: Housing, Mobility and Migration
6 Published July 2018
Calgary: Shelter Costs Shelter costs for owner households include, where applicable, mortgage payments, property taxes and
condominium fees, along with the costs of electricity, heat, water and other municipal services. For renter
households, shelter costs include rent and the costs of electricity, heat, water and other municipal services.
Shelter costs were higher for owner households than they were for renter households. In 2016, shelter costs
for owner households were $1,600 on average, compared to $1,350 for renter households. Between 2006 and
2016, shelter costs for both types of households increased, however the increase for renter households was
greater (55 per cent compared to 37 per cent).
Shelter Costs, Calgary 2006 & 2016
Average Monthly Shelter Costs 2006 2016 Per Cent Change
2006-2016
Owned dwellings $1,175 $1,612 37%
Rented dwellings $871 $1,354 55%
Source: Statistics Canada 2008a; 2017e.
The median monthly shelter cost for all private households in the Calgary CMA was $1,490. Couple families
with children and multiple family households had the highest shelter costs at just under $2,000 a month, while
one person households had the lowest at $1,100 a month.
Source: Statistics Canada 2017i.
$1,490
$1,290
$1,872
$1,420
$1,953
$1,126
Total private households
Couple census family without children
Couple census family with children
One lone-parent census family
Multiple-census-family household
One person household
Median Monthly Shelter Costs by Selected Family Types, Calgary CMA 2016
Calgary Profile – Chapter 7: Housing, Mobility and Migration
7 Published July 2018
Calgary: Housing Affordability The shelter-cost-to-income ratio is an indicator for housing affordability. Housing is considered to be affordable
if the occupants pay less than 30% of their total household income towards shelter costs. Households that
spend more than this proportion are considered to be overspending on shelter. For example, housing that
costs less than $30,000 a year would be considered affordable for a household with an income of $100,000.
About one in five households in Calgary overspend on shelter. Renters are much more likely than owners to
spend more than 30% of their income on shelter costs. More than a third of renters (36 per cent) overspent on
shelter compared to 16 per cent of owners. Almost half of Calgarians living in subsidized housing (45 per cent)
face affordability issues despite subsidized costs.
Source: Statistics 2017a.
Housing affordability issues are most prevalent among lone-parent families and among those that are not part
of a census family, such as those that live alone or with roommates. Over one-third of lone parent and non-
census family households spend more than 30 per cent of their total household income on shelter.
Housing Affordability by Selected Census Family Types, Calgary 2016
Total Households
Households Overspending on Shelter
Number Per Cent
Total private households 466,715 103,295 22%
Census family households 323,140 53,835 17%
Couple census family without children 107,845 13,520 13%
Couple census family with children 140,605 22,775 16%
Lone-parent census family 34,375 11,930 35%
Other census family households 40,310 5,610 14%
Non-census family households 143,575 49,455 34%
Source: Statistics 2017a.
45%
36%
6%
22%
16%
22%
Renters in subsidized housing
All renters
Owners without mortgage
Owners with mortgage
All owners
All households
Re
nte
rsO
wne
rs
Households Living in Housing that is not Affordable, Calgary 2016
Calgary Profile – Chapter 7: Housing, Mobility and Migration
8 Published July 2018
Calgary: Housing Affordability Housing affordability is most likely to impact households with lower incomes. Over 80 per cent of households
with incomes under $20,000 overspent on shelter costs, compared with only two per cent of households with
incomes of $100,000 and over.
Source: Statistics Canada 2017k.
Almost half of all households that had a primary household maintainer between the ages of 15 and 24 spent
more than 30 per cent of their total household income on shelter. For the other age groups, rates of
overspending on shelter ranged from 19 to 29 per cent.
Source: Statistics Canada 2017b.
22%
81%
66%
46%
26%
13%
2%
Total private households
Under $20,000
$20,000 to $39,999
$40,000 to $59,999
$60,000 to $79,999
$80,000 to $99,999
$100,000 and over
Households Overspending on Shelter Costs by Total Household Income
Group, Calgary CMA 2016
22%
48%
23%
19%
22%
29%
Total private households
15 to 24 years
25 to 44 years
45 to 64 years
65 to 84 years
85 years and over
Households Overspending on Shelter Costs by Age of Primary Household Maintainer, Calgary 2016
Calgary Profile – Chapter 7: Housing, Mobility and Migration
9 Published July 2018
Calgary: Core Housing Need A household in core housing need is one whose dwelling is considered unsuitable, inadequate or unaffordable
and whose income level is such that they could not afford alternative suitable and adequate housing in their
community.
Housing standards are defined as follows:
Adequate housing is reported by their residents as not requiring any major repairs.
Affordable housing has shelter costs that are less than 30% of total before-tax household income.
Suitable housing has enough bedrooms for the size and composition of residents according to National
Occupancy Standard (NOS) requirements.
The rate of core housing need in Calgary increased from 9.4 per cent in 2006 to 11.8 per cent in 2016. This
was an increase of about 18,000 households.
Core Housing Need, Calgary 2006 & 2016
2006 2016
Rate of core housing need 9.4% 11.8%
Number of households in core housing need 34,802 52,965
Source: Statistics Canada 2017f.
The large majority of households in core housing need (82 per cent) face issues of affordability. The other two
dimensions, suitability and adequacy, only account for a small percentage of households in core housing need
(three per cent for each).
Core Housing Need by Dimension, Calgary 2016 Number Per Cent
Total households in core housing need 52,965 -
Unaffordable only 49500 82%
Unsuitable only 5285 3%
Inadequate only 4780 3%
Two or more dimensions 6380 12%
Source: Statistics Canada 2017f.
Currently living in inadequate,
unsuitable or unaffordable
housing
Median rent of acceptable local housing is over
30% of the household's total
income
Core Housing
Need
Calgary Profile – Chapter 7: Housing, Mobility and Migration
10 Published July 2018
Calgary: Mobility and Migration Most Calgarians (84 per cent) had not moved from their place of residence in the year prior to census day but
almost half (54 per cent) had moved within five years of census day. Most movers were non-migrants, meaning
that when they moved, they stayed within Calgary.
Mobility Status, Calgary CMA 2016
Mobility status 1 year ago Mobility status 5 years ago
Number Per Cent Number Per Cent
Total population 1,357,180 100% 1,285,960 100%
Non-movers 1,142,750 84% 689,470 54%
Movers 214,425 16% 596,490 46%
Non-migrants 153,055 11% 356,385 28%
Migrants 61,370 5% 240,105 19%
Internal migrants 39,845 3% 148,940 12%
Intraprovincial migrants 23,685 2% 69,950 5%
Interprovincial migrants 16,160 1% 78,990 6%
External migrants 21,530 2% 91,165 7%
Sources: Statistics Canada 2017c, 2017d.
Almost half (49 per cent) of households that had moved in the five years prior to census day had a primary
household maintainer between the ages of 20 and 39 years, while one-quarter had maintainers aged 40-64
years. Households with the oldest group of maintainers (aged 65 and above) only accounted for a small
fraction of movers (5 per cent).
Source: Statistics Canada 2017d.
15-19 yrs19%
20-39 yrs49%
40-64 yrs27%
65+ yrs5%
Movers (5 years ago) by Age of Primary Household Maintainer, Calgary 2016
Calgary Profile – Chapter 7: Housing, Mobility and Migration
11 Published July 2018
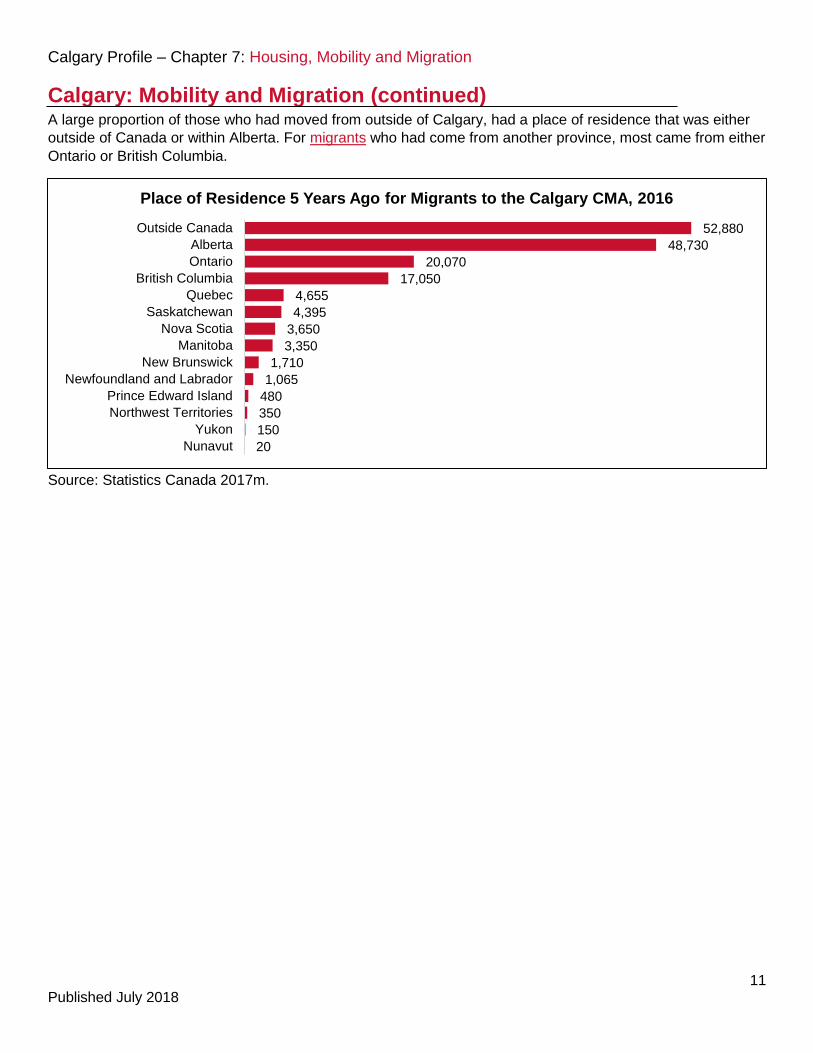
Calgary: Mobility and Migration (continued) A large proportion of those who had moved from outside of Calgary, had a place of residence that was either
outside of Canada or within Alberta. For migrants who had come from another province, most came from either
Ontario or British Columbia.
Source: Statistics Canada 2017m.
20
150
350
480
1,065
1,710
3,350
3,650
4,395
4,655
17,050
20,070
48,730
52,880
Nunavut
Yukon
Northwest Territories
Prince Edward Island
Newfoundland and Labrador
New Brunswick
Manitoba
Nova Scotia
Saskatchewan
Quebec
British Columbia
Ontario
Alberta
Outside Canada
Place of Residence 5 Years Ago for Migrants to the Calgary CMA, 2016
Calgary Profile – Chapter 7: Housing, Mobility and Migration
12 Published July 2018
Canadian Comparisons: Tenure Compared to other major cities in Canada, Calgary had the highest rate of home ownership (71 per cent).
Source: Statistics Canada, 2017g.
Canadian Comparisons: Core Housing Need The overall rate for households in core housing need in Calary (12 per cent) is lower than most other major
cities.
Source: Statistics Canada 2017f.
37%
47%
48%
53%
53%
56%
58%
60%
61%
64%
65%
66%
67%
68%
68%
71%
Montréal
Vancouver
Charlottetown
Toronto
Québec
Yellowknife
Fredericton
Halifax
St. John's
Edmonton
Winnipeg
Ottawa
Saskatoon
Canada
Regina
Calgary
Percentage of Owner Households, Major Cities 2016
8%
11%
12%
12%
13%
13%
13%
13%
13%
14%
14%
14%
14%
15%
20%
23%
Québec
Yellowknife
Charlottetown
Calgary
Fredericton
Saskatoon
Canada
Winnipeg
Ottawa
Halifax
St. John's
Regina
Edmonton
Montréal
Vancouver
Toronto
Rate of Core Housing Need, Major Cities 2016
Calgary Profile – Chapter 7: Housing, Mobility and Migration
13 Published July 2018
Canadian Comparisons: Subsidized Housing Three per cent of all private households in Calgary were living in subsidized housing. This was the lowest
percentage among major cities in Canada.
Source: Statistics Canada 2017b.
Canadian Comparisons: Mobility and Migration One-quarter of Calgarians had moved within the city in the five years prior census day. This rate of non-
migrant movers is on par with most other major Canadian cities.
Source: Statistics Canada 2017d.
3%
3%
4%
4%
5%
5%
5%
5%
6%
6%
6%
7%
7%
7%
10%
11%
Calgary
Halifax
Edmonton
Canada
Fredericton
Québec
Saskatoon
Ottawa
Montréal
Regina
Winnipeg
Toronto
Vancouver
Charlottetown
St. John's
Yellowknife
Per Cent of Households Living in Subsidized Housing, Major Cities 2016
19%
19%
20%
21%
21%
21%
22%
24%
25%
25%
26%
26%
26%
26%
28%
28%
Canada
St. John's
Charlottetown
Halifax
Fredericton
Québec
Montréal
Ottawa - Gatineau
Toronto
Winnipeg
Regina
Saskatoon
Calgary
Edmonton
Vancouver
Yellowknife
Non-Migrant Movers 5 Years Ago, Major Cities 2016
Calgary Profile – Chapter 7: Housing, Mobility and Migration
14 Published July 2018
Notes The data in this profile comes from the 2006 and 2016 Censuses of Canada conducted by Statistics Canada.
Census of Canada
Data from the Census of Canada presented in this profile are based on the results of a long form questionnaire
that was distributed to one in four private dwellings. Census day for the 2016 Census of Canada was May 10,
2016. The Census of Canada is conducted every five years.
Population Universes
The relationship between populations is illustrated (right) and
terms related to the different populations can be found in the
glossary.
Random Rounding
To ensure confidentiality, Statistics Canada products include
values and totals that are randomly rounded either up or down to
a multiple of ‘5’ or ‘10’. Therefore, in both the original data from
Statistics Canada and in the compilation of this document, total
values may not match the individual values. Similarly,
percentages, which are calculated on rounded data, may not
necessarily add up to 100 per cent.
Calgary Census Subdivision vs. Census Metropolitan Area
The data presented in this profile represents either the Calgary
census subdivision or the Calgary census metropolitan area as
defined by Statistics Canada. The boundary of the Calgary
census subdivision corresponds to the City boundary. Where data for this level of geography was unavailable,
data representing the Calgary census metropolitan area is presented. The boundary of the Calgary census
metropolitan area includes the City of Calgary as well as the surrounding municipalities of Rocky View County,
Airdrie, Beiseker, Chestermere, Cochrane, Crossfield, Irricana, and Tsuu T’ina Nation.
Populations [adapted from Statistics
Canada Census Dictionary (Statistics
Canada 2017n)].
Calgary Profile – Chapter 7: Housing, Mobility and Migration
15 Published July 2018
References
Statistics Canada, 2007a. Census Profile. 2006 Census of Population, Statistics Canada Catalogue no. 92-591-XWE. Released March 13, 2007.
Statistics Canada, 2008a. 2006 Census of Population, Statistics Canada Catalogue no. 94-581-XCB2006002. Updated July 29, 2008.
Statistics Canada, 2008b. 2006 Census of Population, Statistics Canada Catalogue no. 97-554-XCB2006039. Released May 1, 2008.
Statistics Canada, 2008c. 2006 Census of Population, Statistics Canada Catalogue no. 97-554-XCB2006040. Released September 30, 2008.
Statistics Canada, 2017a. 2016 Census of Population, Statistics Canada Catalogue no. 98-400-X2016229. Released October 25, 2017.
Statistics Canada, 2017b. 2016 Census of Population, Statistics Canada Catalogue no. 98-400-X2016231. Released October 25, 2017.
Statistics Canada, 2017c. 2016 Census of Population, Statistics Canada Catalogue no. 98-400-X2016310. Released November 29, 2017.
Statistics Canada, 2017d. 2016 Census of Population, Statistics Canada Catalogue no. 98-400-X2016311. Released November 29, 2017.
Statistics Canada, 2017e. 2016 Census of Population, Statistics Canada Catalogue no. 98-401-X2016055. Released November 29, 2017.
Statistics Canada, 2017f. 2016 Census of Population, Statistics Canada Catalogue no. 98-509-X2016001. Released November 15, 2017.
Statistics Canada, 2017g. Census Profile. 2016 Census of Population, Statistics Canada Catalogue no. 98-316-X2016001. Released November 29, 2017.
Statistics Canada, 2017h. 2016 Census of Population, Statistics Canada Catalogue no. 98-400-X2016227. Released October 25, 2017.
Statistics Canada, 2017i. 2016 Census of Population, Statistics Canada Catalogue no. 98-400-X2016228. Released October 25, 2017.
Statistics Canada, 2017j. 2016 Census of Population, Statistics Canada Catalogue no. 98-400-X2016233. Released October 25, 2017.
Statistics Canada, 2017k. 2016 Census of Population, Statistics Canada Catalogue no. 98-400-X2016225. Released October 25, 2017.
Statistics Canada, 2017l. 2016 Census of Population, Statistics Canada Catalogue no. 98-400-X2016230. Released October 25, 2017.
Statistics Canada, 2017m. 2016 Census of Population, Statistics Canada Catalogue no. 98-400-X2016296. Released November 29, 2017.
Statistics Canada. 2017n. Census Dictionary, 2016 Census of Population. Statistics Canada Catalogue no. 98-301-X. Updated September 13, 2017.
Statistics Canada, 2018a. 2016 Census of Population, Statistics Canada Catalogue no. 98-400-X2016222. Released March 18, 2018.
Calgary Profile – Chapter 7: Housing, Mobility and Migration
16 Published July 2018
Glossary
Apartment A dwelling unit that is part of a building that contains at least three dwelling units on three or more levels.
Calgary The Calgary census subdivision (CSD), as defined by Statistics Canada, unless otherwise indicated. The boundary of the Calgary census subdivision corresponds to the City boundary.
Calgary Census Metropolitan Area
A geographic area defined by Statistics Canada. The Calgary census metropolitan area (CMA) includes the city of Calgary as well as the surrounding municipalities of Rocky View County, Airdrie, Beiseker, Chestermere, Cochrane, Crossfield, Irricana, and Tsuu T’ina Nation.
Census Family
A married couple and the children, if any, of either and/or both spouses; a couple living common law and the children, if any, of either and/or both partners; or a lone parent of any marital status with at least one child living in the same dwelling and that child or those children. All members of a particular census family live in the same dwelling. A couple may be of opposite or same sex.
Children
Children may be children by birth, marriage, common-law union or adoption regardless of their age or marital status as long as they live in the dwelling and do not have their own married spouse, common-law partner or child living in the dwelling. Grandchildren living with their grandparent(s) but with no parents present also constitute a census family.
Common-Law Includes persons who are living with a person as a couple but who are not legally married to that person.
Core Housing Need
A household is said to be in core housing need if its housing falls below at least one of the adequacy, affordability or suitability standards and it would have to spend 30% or more of its total before-tax income to pay the median rent of alternative local housing that is acceptable (meets all three housing standards).
Only private, non-farm, non-reserve and owner- or renter-households with incomes greater than zero and shelter-cost-to-income ratios less than 100% are assessed for core housing need.
Non-family households with at least one maintainer aged 15 to 29 attending school are considered not to be in core housing need regardless of their housing circumstances. Attending school is considered a transitional phase and low incomes earned by student households are viewed as being a temporary condition.
Couple Census Family
A census family that contains a married or common-law couple (either with or without children). A couple may be of opposite sex or same sex.
Duplex One of two dwellings, located one above the other, may or may not be attached to other dwellings or buildings.
External Migrant Migrants who moved from outside of Canada.
Calgary Profile – Chapter 7: Housing, Mobility and Migration
17 Published July 2018
Household
A person or group of persons who occupy the same dwelling and do not have a usual place of residence elsewhere in Canada. It may consist of a census family, of two or more families sharing a dwelling, of a group of unrelated persons, or of one person living alone.
Housing Adequacy Housing is considered adequate if residents report that it does not require any major repairs.
Housing Affordability
Housing is considered affordable if shelter costs are less than 30% of total before-tax household income.
Housing Suitability
Refers to whether a private household is living in suitable accommodations according to the National Occupancy Standard (NOS); that is, whether the dwelling has enough bedrooms for the household based on the age, sex, and relationships among household members.
Intraprovincial migrant
Internal migrants who moved within the province or territory.
Interprovincial migrant
Internal migrants who moved to a different province or territory.
Internal Migrant Migrants who moved within Canada.
Lone-Parent Census Family
A census family containing only one parent with his or her child(ren).
Median Income The amount that divides the income distribution of a specified group into two halves (i.e., the incomes of half of the units in that group are below the median, while those of the other half are above the median).
Migrant Persons who moved outside of their census subdivision.
Mobility Status
Mobility status, one year refers to the status of a person with regard to the place of residence on the census day in relation to the place of residence on the same date one year earlier.
Mobility status, five years refers to the status of a person with regard to the place of residence on the census day in relation to the place of residence on the same date five years earlier.
Mover Persons who did not live in the same residence.
Multiple Census Family Household
A household that consists of two or more census families. There may also be persons that are not in a census family in these households.
Non-Census Family Household
A household that does not contain a census family.
Non-Migrant Persons who moved within the census subdivision.
Calgary Profile – Chapter 7: Housing, Mobility and Migration
18 Published July 2018
Non-Mover Persons who lived in the same residence.
Other Census Family Household
A household that is not multigenerational and where there is one census family with additional persons or more than one census family.
Other Dwelling
For the purposes of this profile, other dwellings include movable dwellings and other single-attached houses. Movable dwellings are mobile homes and other movable dwellings such as houseboats, recreational vehicles and railroad cars. Other single-attached houses are single dwellings attached to another building and that does not fall into any of the other categories, such as a single dwelling attached to a non-residential structure (e.g., a store or a church) or occasionally to another residential structure (e.g., an apartment building).
Owner-Estimated Value of Dwelling
Refers to the dollar amount expected by the owner if the asset were to be sold.
Owner Household Refers to a household where some member of the household owns the dwelling, even if it is not fully paid for, for example if there is a mortgage or some other claim on it.
Primary Household Maintainer
Refers to the first person in the household identified as someone who pays the rent or the mortgage, or the taxes, or the electricity bill, and so on, for the dwelling.
In the case of a household where two or more people are listed as household maintainers, the first person listed is chosen as the primary household maintainer.
Private Household A person or group of persons who occupy the same private dwelling (as opposed to a collective dwelling such as a rooming house, motel, jail, hospital or nursing home) and do not have a usual place of residence elsewhere in Canada or abroad.
Renter Household Refers to households where no member of the household owns their dwelling. A household is considered to rent that dwelling even if the dwelling is provided without cash rent or at a reduced rent, or if the dwelling is part of a cooperative.
Row House
One of three or more dwellings joined side by side (or occasionally side to back), such as a townhouse or garden home, but not having any other dwellings either above or below. Townhouses attached to a high-rise building are also classified as row houses.
Semi-Detached House
One of two dwellings attached side by side (or back to back) to each other but not attached to any other dwelling or structure (except its own garage or shed). A semi-detached dwelling has no dwellings either above it or below it, and the two units together have open space on all sides.
Calgary Profile – Chapter 7: Housing, Mobility and Migration
19 Published July 2018
Shelter Cost
Refers to the average monthly total of all shelter expenses paid by households that own or rent their dwelling.
Shelter costs for owner households include, where applicable, mortgage payments, property taxes and condominium fees, along with the costs of electricity, heat, water and other municipal services. For renter households, shelter costs include, where applicable, the rent and the costs of electricity, heat, water and other municipal services.
Shelter-Cost-to-Income Ratio
Shelter-cost-to-income ratio is calculated by dividing the average monthly shelter costs by the average monthly total household income.
Single-Detached House
Refers to a single dwelling not attached to any other structure (except its own garage or shed). A single-detached house has open space on all sides, and has no dwellings either above it or below it. A mobile home fixed permanently to a foundation is also classified as a single-detached house.
Subsidized Housing
Refers to whether a renter household lives in a dwelling that is subsidized. Subsidized housing includes rent geared to income, social housing, public housing, government-assisted housing, non-profit housing, rent supplements and housing allowances.
Tenure Refers to whether the household owns or rents their private dwelling. A household is considered to rent their dwelling if no member of the household owns the dwelling.
Total Household Income
The sum of certain incomes (in cash and, in some circumstances, in kind) of the statistical unit during a specified reference period for all household members.