0 2016 Community Health Needs Assessment Kaiser Foundation Hospital Woodland Hills License #930000358 Approved by KFH Board of Directors September 21, 2016 To provide feedback about this Community Health Needs Assessment, email [email protected]
Transcript
0
2016 Community Health
Needs Assessment
Kaiser Foundation Hospital Woodland Hills
License #930000358
Approved by KFH Board of Directors
September 21, 2016
To provide feedback about this Community Health Needs Assessment, email [email protected]
Valley Care Community Consortium (VCCC) was contracted to prepare the 2016 Community Health Needs Assessment (CHNA) for Kaiser Foundation Hospital (KFH) Woodland Hills. The following persons contributed to the preparation of this report:
Olubukola Olajide, MPH Health Education, Lead-author
Patricia Ochoa, MA Chicano Studies, Co-author
Contributors for health profiles, data gathering and asset mapping are:
Belen Arangure, BS Health Education
Maribel Aguilar, BS Health Education
Mayra Quijano, BS Community Health
Alique Berberian, BA
Christiana Ojobaro, BS Health Promotion
Annet Nalubwama, MPH Health Education
Surekha Vasant, MPH Health Education
VCCC subcontracted with the Center for Nonprofit Management (CNM) for data gathering for the portions of the CHNA pertaining to the Ventura County zip codes of KFH-Woodland Hills service area.
Maura J. Harrington, PhD, MBA
Sarah Flores, MS
Jeniffer DeLara Vallejo, Project Coordinator for CNM
VCCC would like to thank the following entities for their review, feedback and technical support to the report:
Jennifer Lopez, Community Benefit Manager, KFH-Woodland Hills
Susan Ng, Public Affairs and Brand Communications Director, KFH-Woodland Hills
Mary Jarvis, Public Affairs Director, Kaiser Permanente Ventura County
Mehrnaz Davoudi, Senior Program Evaluation Manager, Kaiser Permanente Southern California
Jacqueline Rangel, Community Benefit Program Manager, Kaiser Permanente Southern California
Lynda Lee, Community Benefit Program Manager, Kaiser Permanente Southern California
Conducting a community health needs assessment is no small task and would not be possible without the contributions of Valley Care Community Consortium (VCCC) staff, Center for Nonprofit Management (CNM), Los Angeles County Department of Public Health, our VCCC partner agencies including KFH – Woodland Hills Medical Center, and community residents. We would like to give a special recognition to the graduate and undergraduate interns who worked with us on this project from California State University Northridge and Los Angeles, and Occidental University.
We would like to extend a special thanks to Center for Nonprofit Management (CNM) who as a subcontractor working with VCCC, provided primary data. VCCC acknowledges and honors CNM’s contribution of time, dedication, and expertise in identifying the community health needs in Ventura County.
We would like to recognize and acknowledge our local KFH – Woodland Hills Public Affairs Director and her Community Benefits staff for their ongoing guidance and support. In addition, we appreciate the technical assistance and leadership from the Kaiser Permanente Southern California Regional Office; their efforts have been instrumental in completing this report.
We are also very grateful to those members of the community that shared their personal views by participating in the KFH – Woodland Hills Medical Center Service Area Video Voice Mapping Project.
We want to express our gratitude to those agencies that supported VCCC and CNM through participation in key informant interviews, focus groups, community forums, surveys, and prioritization meetings. Agencies represented include:
All-Inclusive Community Health Center
Avon Cares for Life
California State University, Northridge
California Youth Connection
City of San Fernando
Community Memorial Health System
Community Synergy for Children and Families
Comprehensive Community Health Centers
Fullbright Elementary School Parent Center
Glendale Adventist Medical Center
Hope of the Valley Rescue Mission
Kaiser Permanente Woodland Hills
L.A. Care
LA Family Housing
Los Angeles County Department of Health Services
Los Angeles County Department of Public Health
Los Angeles Department of City Planning
Los Angeles Unified School District
Mary B. Perry High School
Mend Each Need with Dignity (MEND)
Mission City Community Network
Mixteco/Indigena Community Organizing Project
Northeast Valley Health Corporation
Northridge Hospital Medical Center
Occidental College
Olive View-UCLA Medical Center
Partners in Care
Providence Health and Services
Samuel Dixon Family Health Center, Inc.
San Fernando Community Health Center
San Fernando Valley Community Mental Health Center Inc.
A. Identifying Community Health Needs .................................................................................... 28
i. Definition of Health Need ....................................................................................................... 28
ii. Criteria and analytical methods used to identify the community health needs .................... 28
B. Process and criteria used for prioritization of the health needs .......................................... 29
C. Prioritized description of all the community health needs identified through the CHNA .. 29
i. Community Health Landscape and Trends ............................................................................ 29
ii. Prioritized list of health needs ................................................................................................ 34
D. Community assets, capacities and resources potentially available to respond to the identified health needs .................................................................................................................. 43
VII. KFH WOODLAND HILLS 2013 IMPLEMENTATION STRATEGY EVALUATION OF IMPACT ...... 46
Appendix A: Secondary Data Sources and Dates ............................................................................ 74
Appendix B: Community Input Tracking Form .................................................................................. 82
Appendix C: Health Need Profiles .................................................................................................... 86
Dental Health ........................................................................................................................ 130
Affordable Housing and Homelessness ............................................................................. 134
Appendix D: Glossary of Terms ...................................................................................................... 140
6
I. EXECUTIVE SUMMARY
Kaiser Permanente is one of the largest nonprofit integrated healthcare systems in the United States. Comprised of Kaiser Foundation Hospitals (KFH) and their subsidiaries, Kaiser Foundation Health Plan, and the Permanente Medical Groups, Kaiser Permanente serves more than 10 million members. Situated near the Los Angeles-Ventura County line in west San Fernando Valley, KFH-Woodland Hills is in a unique position to serve the diverse communities in both counties. The communities served by KFH-Woodland Hills range from affluent to agricultural. These include Ventura County and the West San Fernando Valley of Los Angeles County.
This community health needs assessment (CHNA) describes the health of the residents of the KFH-Woodland Hills service area. The results of the CHNA will direct the development of implementation strategies by KFH-Woodland Hills to address the health needs of the community. Overall, the report attempts to capture broader factors driving the health needs. These drivers indicate the physical environment (i.e. access to parks and grocery stores), socioeconomic status (i.e. household income and poverty level), and access to health that can contribute to people’s overall wellbeing. This executive summary recaps the list of prioritized health needs identified in the service area, the process and methodology to identify the health needs and a summary of the overall CHNA.
A. Community Health Needs Assessment (CHNA Background)
The Patient Protection and Affordable Care Act (ACA), enacted on March 23, 2010, included new requirements for nonprofit hospitals in order to maintain their tax exempt status. The provision was the subject of final regulations providing guidance on the requirements of section 501(r) of the Internal Revenue Code. Included in the new regulations is a requirement that all nonprofit hospitals must conduct a community health needs assessment (CHNA) and develop an implementation strategy (IS) every three years (http://www.gpo.gov/fdsys/pkg/FR-2014-12-31/pdf/2014-30525.pdf).
While Kaiser Permanente has conducted CHNAs for many years to identify needs and resources in our communities and to guide our Community Benefit plans, these new requirements have provided an opportunity to revisit our needs assessment and strategic planning processes with an eye toward enhancing compliance and transparency and leveraging emerging technologies. The CHNA process undertaken in 2016 and described in this report was conducted in compliance with current federal requirements.
B. Summary of Prioritized Needs
Ten health needs resulted for the entire service area of KFH–Woodland Hills Medical Center based on the community’s ranking through surveys, focus groups, forums and key informant interviews. Data retrieved from sources that include the Centers for Disease Control and Prevention, National Cancer Institute, U.S. Census Bureau, and the Los Angeles Department of Public Health aided in the process. Final ranking of the health needs was accomplished through a rigorous prioritization process by which the health needs had to meet several criteria.
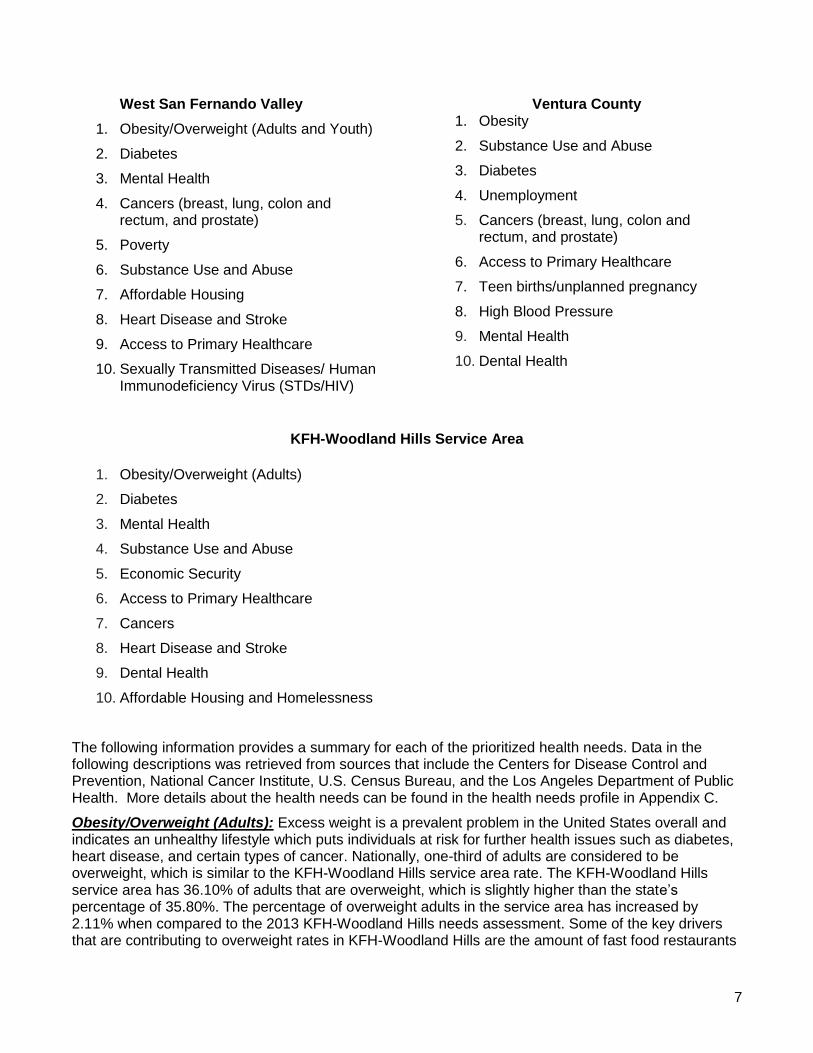
Because the KFH-Woodland Hills Medical Center service area includes two unique geographic areas, West San Fernando and Ventura County, issues of high priority in one service area may not rank high in the other. Therefore, the prioritized health need is listed first by the geographic area (West San Fernando Valley and Ventura County) and then by KHF-Woodland Hills to show the health needs that arose in each geographic area. The order of the health needs is listed from highest to lowest priority:
4. Cancers (breast, lung, colon and rectum, and prostate)
5. Poverty
6. Substance Use and Abuse
7. Affordable Housing
8. Heart Disease and Stroke
9. Access to Primary Healthcare
10. Sexually Transmitted Diseases/ Human Immunodeficiency Virus (STDs/HIV)
Ventura County 1. Obesity
2. Substance Use and Abuse
3. Diabetes
4. Unemployment
5. Cancers (breast, lung, colon and rectum, and prostate)
6. Access to Primary Healthcare
7. Teen births/unplanned pregnancy
8. High Blood Pressure
9. Mental Health
10. Dental Health
KFH-Woodland Hills Service Area
1. Obesity/Overweight (Adults)
2. Diabetes
3. Mental Health
4. Substance Use and Abuse
5. Economic Security
6. Access to Primary Healthcare
7. Cancers
8. Heart Disease and Stroke
9. Dental Health
10. Affordable Housing and Homelessness
The following information provides a summary for each of the prioritized health needs. Data in the following descriptions was retrieved from sources that include the Centers for Disease Control and Prevention, National Cancer Institute, U.S. Census Bureau, and the Los Angeles Department of Public Health. More details about the health needs can be found in the health needs profile in Appendix C.
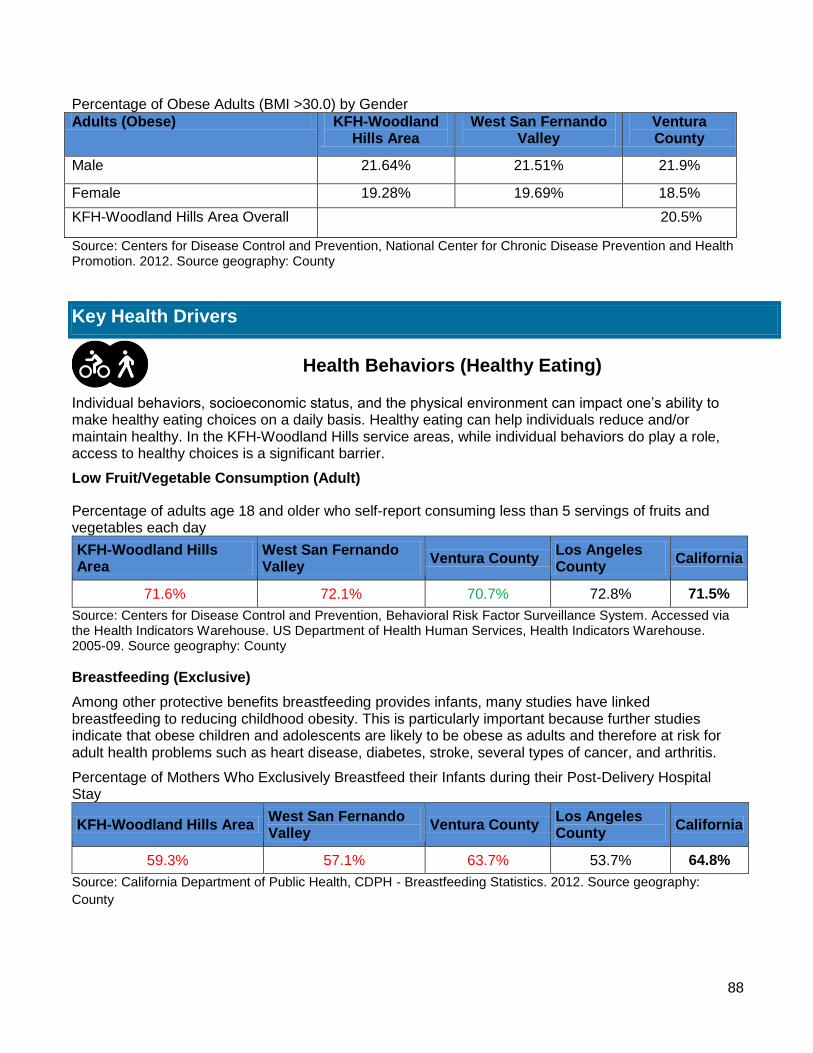
Obesity/Overweight (Adults): Excess weight is a prevalent problem in the United States overall and indicates an unhealthy lifestyle which puts individuals at risk for further health issues such as diabetes, heart disease, and certain types of cancer. Nationally, one-third of adults are considered to be overweight, which is similar to the KFH-Woodland Hills service area rate. The KFH-Woodland Hills service area has 36.10% of adults that are overweight, which is slightly higher than the state’s percentage of 35.80%. The percentage of overweight adults in the service area has increased by 2.11% when compared to the 2013 KFH-Woodland Hills needs assessment. Some of the key drivers that are contributing to overweight rates in KFH-Woodland Hills are the amount of fast food restaurants
8
in the area (80.38 fast food restaurants per 100,000 population and 74.51 for California) and a larger rate of adults who commute to work by car (76.07%) when compared to the state’s rate (73.16%).
Diabetes: Diabetes can result in serious and potentially fatal health complications that include heart disease, blindness, kidney failure and amputation of the legs, if untreated. Although the prevalence of diabetes in KFH-Woodland Hills (7.60%) is lower than the state (8.05%), the rate has increased slightly since the 2013 KFH-Woodland Hills community needs assessment (7.19%). Additionally, the correlation between obesity, Type-II diabetes, and the increase in overweight rates for the area makes the health need a concern. Community members also prioritized diabetes as a health need during the prioritization process. There is a higher prevalence of diabetes in West San Fernando Valley (7.90%) than Ventura County (7%).
Similar to heart disease, the identified drivers for diabetes in the medical center service area are physical inactivity among adults, high access to liquor stores and poor management of high blood pressure.
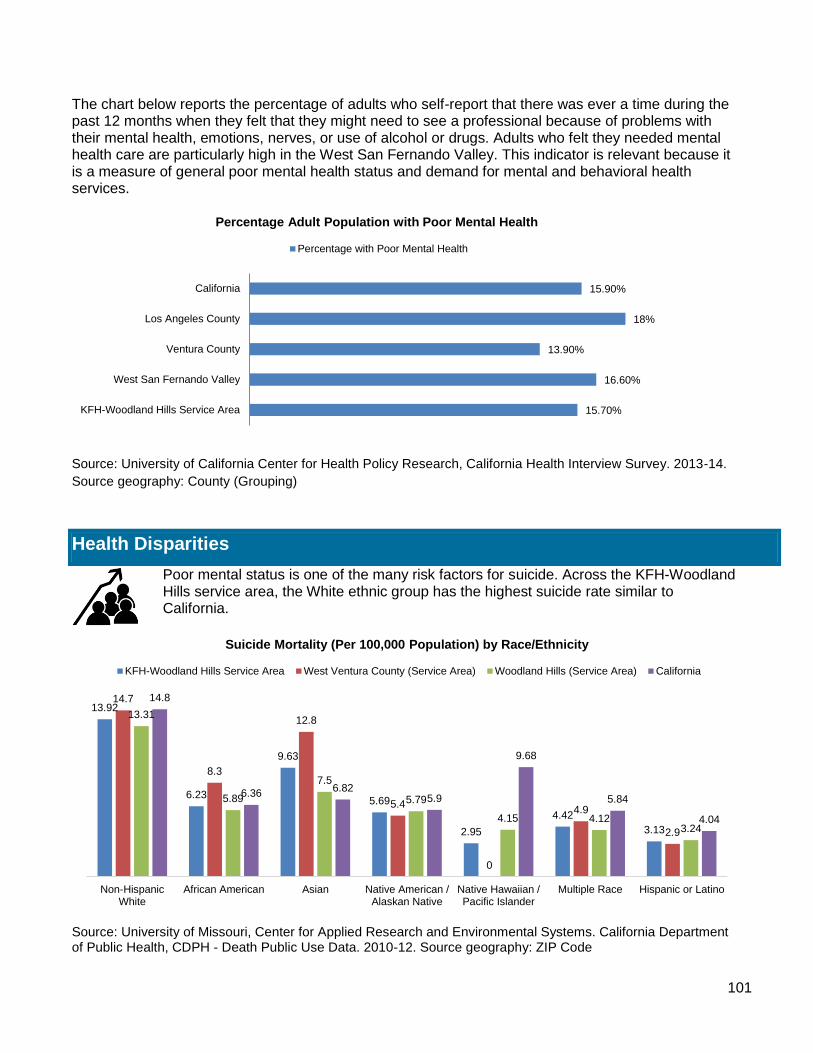
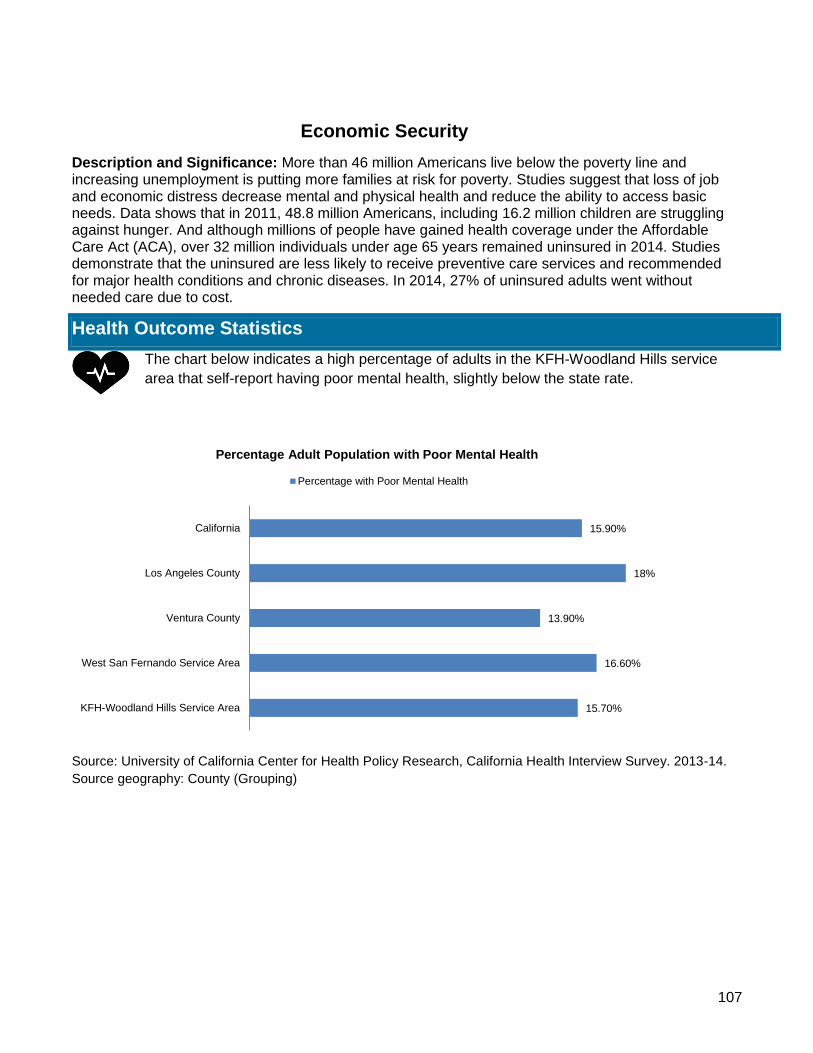
Mental Health: Positive mental health is associated with improved health outcomes. When individuals have a positive state of well-being, they are more readily able to cope with the stresses of life, be productive and have a positive sense of self. Strong social networks and support systems have been identified as indicators of positive mental health. Indicators and contributors to poor mental health include poverty and low-levels of education.
In the KFH-Woodland Hills service area, the rate of adults who need mental health services is slightly lower (15.70%) than the state’s rate (15.90%). The rate of Medicare beneficiaries, adults over the age of 65, with depression is slightly higher (13.70%) in KHF-Woodland Hills than the state (13.40%). The West San Fernando Valley has higher rates (14.20%) of Medicare beneficiaries with depression when compared to Ventura County (13.90%). Inadequate social and emotional support is determined to be a key driver for mental health in the medical center’s service area as reported by 25.1% of adults compared to the state at 24.6%.
Substance Use and Abuse: While the rate of alcohol consumption is lower in the service area (16.60%) than the state’s rate (17.20%), the percentage of adults who consume excess alcohol is higher in Ventura County (17.70%). High concentration of liquor stores in the medical center’s service area is identified as the one driver for substance use and abuse. According to the U.S. Census Bureau, there are more liquor stores in the KFH-Woodland Hills service area than in California (13.73 per 100,000 population vs. 10.02 per 100,000 population).
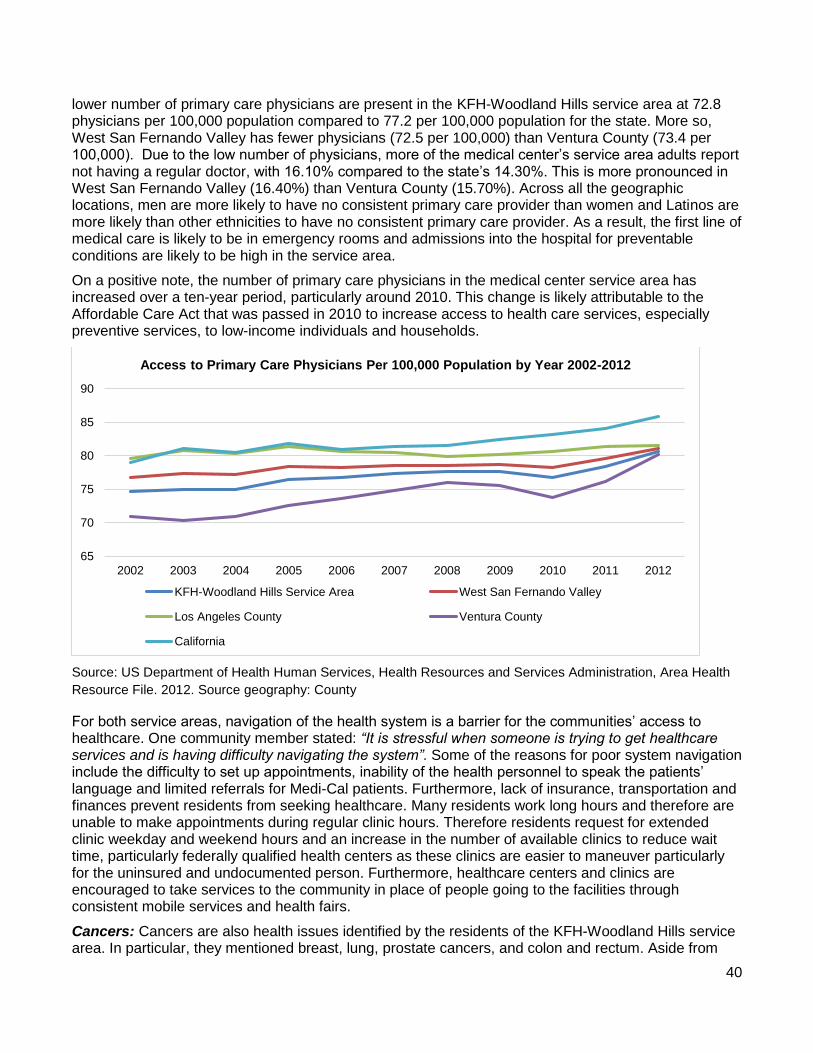
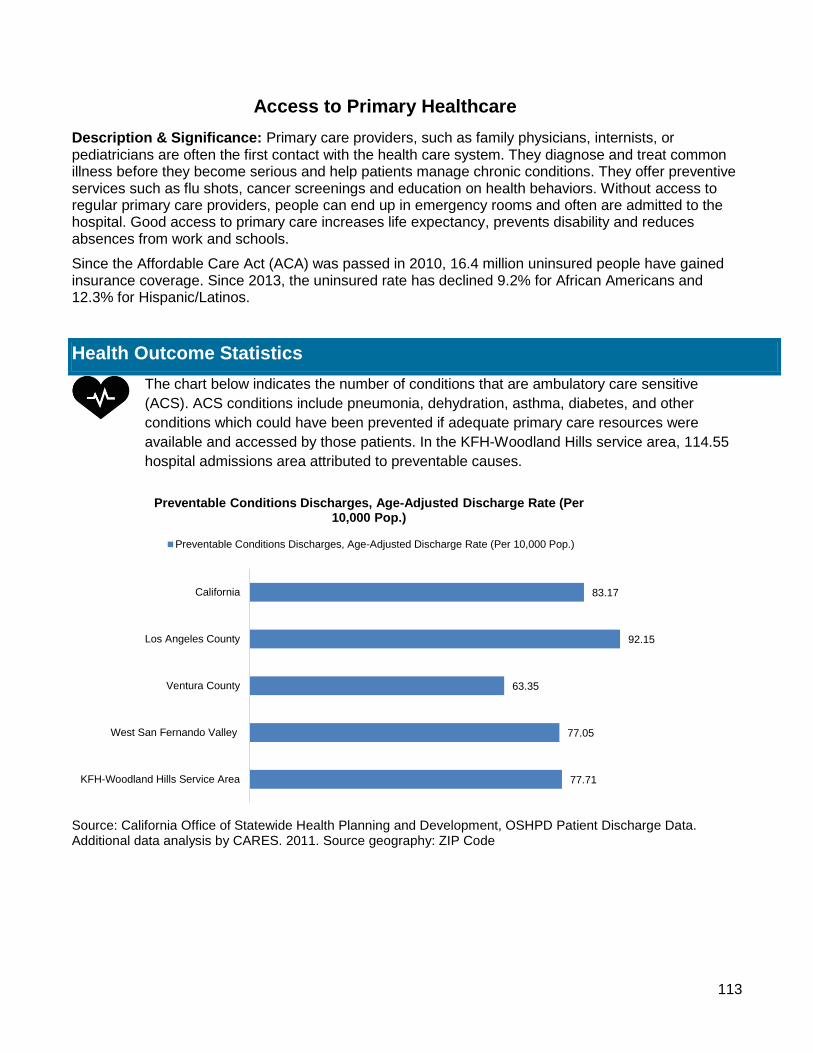
Access to Primary Healthcare: Proportionally, there are fewer primary care providers per 100,000 population in the KFH-Woodland Hills service area (72.8 per 100,000 population), West San Fernando Valley (72.5 per 100,000 population) and Ventura County (73.4 per 100,000 population) than in California (77.2 per 100,000 population). Additionally, more adults in the KFH-Woodland Hills service area (16.10%), West San Fernando Valley (16.40%) and Ventura County (15.70%) report lacking a consistent primary care provider than the state (14.30%). Therefore, it is likely that the lack of primary care providers results in the high hospital admission for preventable causes. In the KFH-Woodland Hills service area, 77.71 patients are admitted for preventable reasons per 10,000 population. There is a higher rate in West San Fernando Valley (77.05 per 10,000 population) than Ventura County (63.35 per 10,000 population).
Living in areas with low primary care physicians is a driver for this health need. However, this is not as big a problem in West San Fernando Valley as it is in Ventura County. According to data, 0% of West San Fernando Valley residents live in a primary care provider shortage area compared to 37.79% in Ventura County.
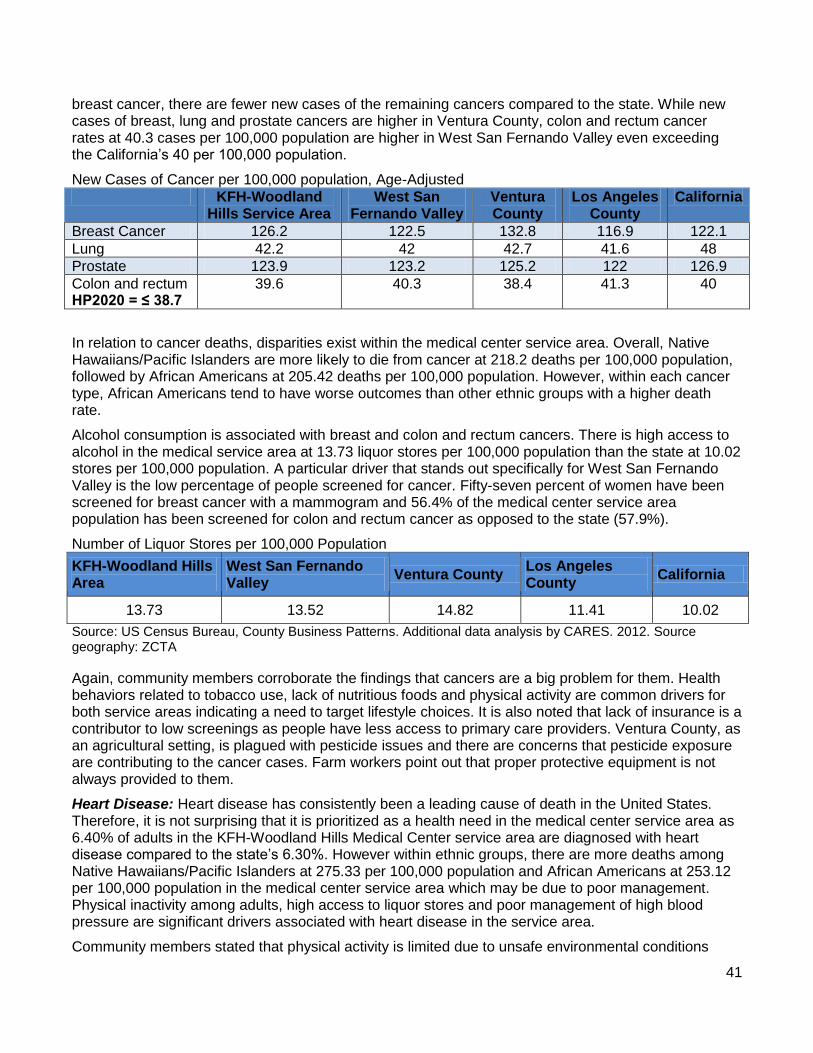
Cancers (breast, lung, colon and rectum, and prostate): The cancer rates for breast, lung, colon and rectum, and prostate, vary for KFH-Woodland Hills. The West San Fernando Valley shows fewer
9
new cases per 100,000 people of breast, lung, and prostate cancer than Ventura County. Respectively, for West San Fernando Valley and Ventura County the rates are: breast cancer (122.5 versus 132.8), lung cancer (42 versus 42.7), and prostate cancer (123.2 versus 125.2). However, the rate of colon and rectum cancer is higher for the West San Fernando Valley (40.3) than Ventura County (38.4). Additionally, fewer residents in West San Fernando Valley are screened for breast cancer (57%) and colon and rectum (55.5%) cancer compared to Ventura County (60.5% and 58.1%, respectively).
Environmental and social drivers associated with some cancers include alcohol consumption. The medical center has a slightly higher rate of liquor stores in the area (13.73 liquor stores per 100,000 population) when compared to the state’s rate (10.02 liquor stores per 100,000 population). Ventura County has a higher concentration at 14.12 liquor stores per 100,000 population compared to West San Fernando Valley’s 13.52 liquor stores per 100,000 population.
Heart disease: Hear disease is a consistent leading cause of death in the United States. The percentage of adults diagnosed with heart disease or angina is slightly higher in KFH-Woodland Hills service area (6.40%) compared to the state (6.30%), with West San Fernando Valley at 6.10% and Ventura County at 7%. Disproportionately, Native Hawaiians/Pacific Islanders at 275.33 per 100,000 population and African Americans at 253.12 per 100,000 population die from heart disease than other ethnicities in the medical center service.
Identified drivers in the medical center service area for heart disease include physical inactivity among adults, high access to liquor stores and poor management of high blood pressure.
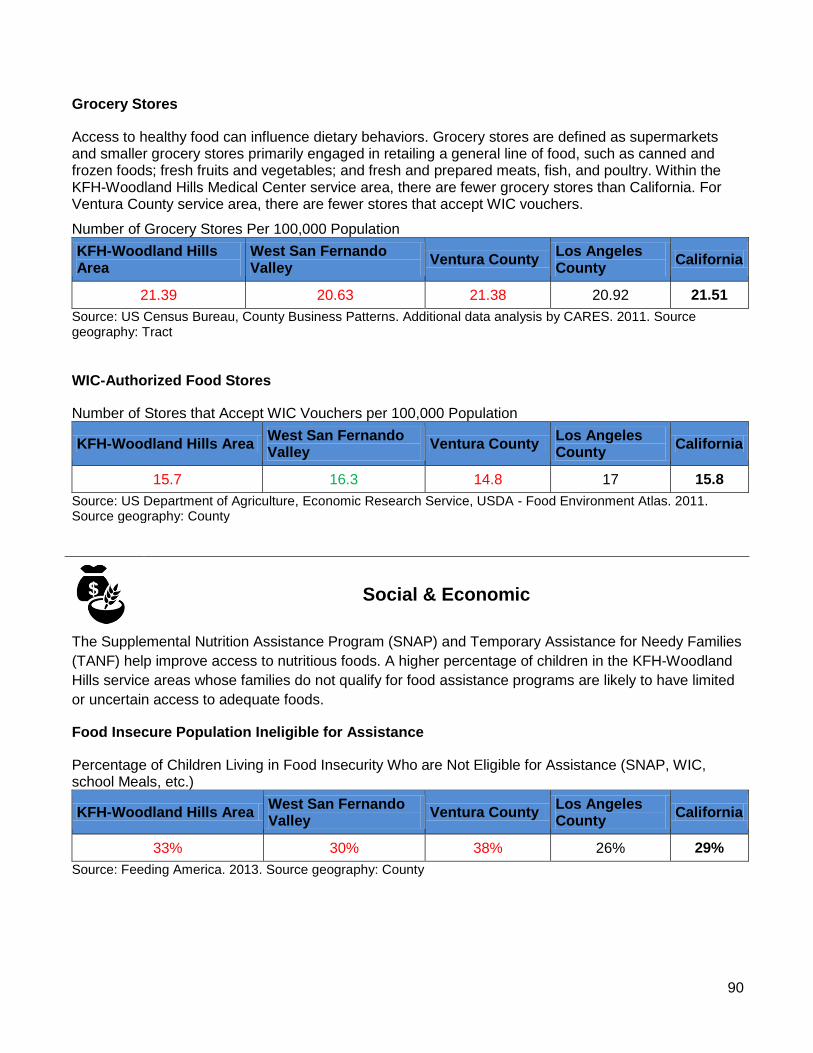
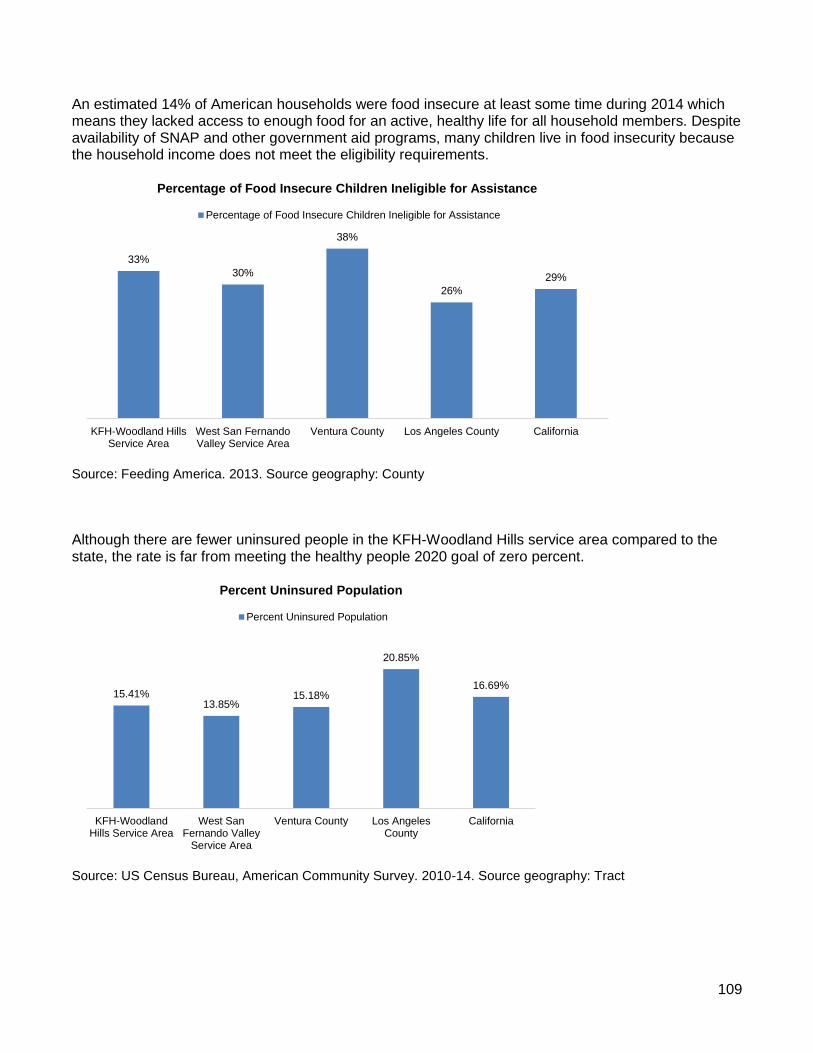
Economic Security: Unemployment and poverty are determined to be key drivers for economic security. The unemployment rate in the medical center service area is slightly lower (6.7%) than the state’s 6.8%. However, in West San Fernando Valley, there is a higher rate of unemployment (7.1%) compared to 6.2% in Ventura County. An eight-year trend indicates that more people in the KFH-Woodland Hills service area have consistently received assistance to access nutritious foods through the US Department of Agriculture (USDA) supplemental nutrition assistance program (SNAP) indicating a high rate of low-income households.
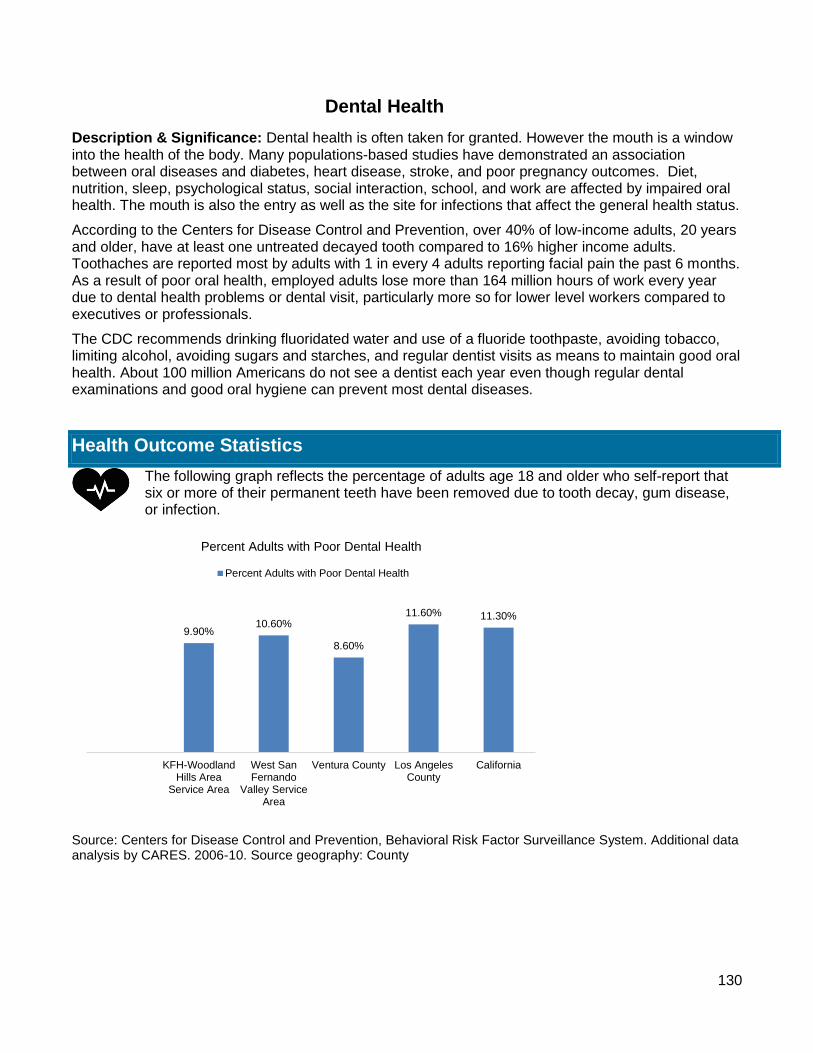
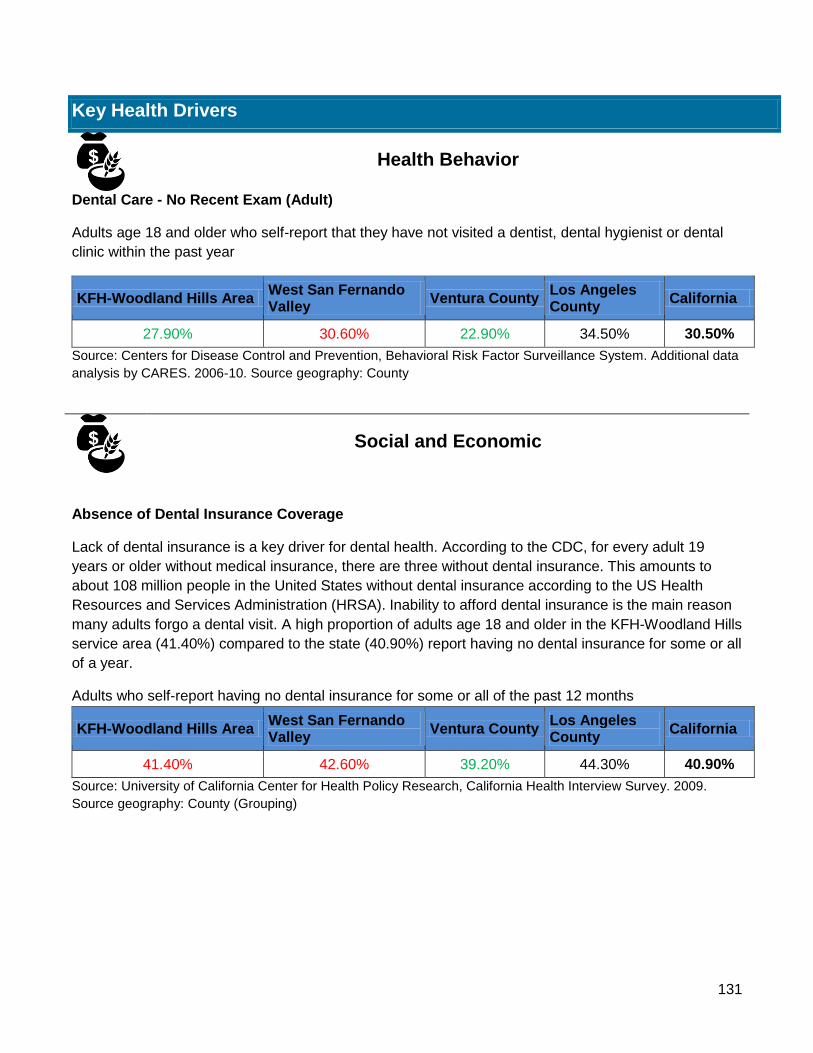
Dental health: Poor dental health, such as cavities and tooth decay and missing teeth can cause pain and affect individual’s self-esteem. More recently, a large body of evidence has linked poor oral health, like gum disease, to diabetes, heart disease and stroke. Poor oral health in pregnant woman has also been has been associated with premature births and low-birth weight. Preventing oral problems include routine visits to the dentist.
While the KFH-Woodland Hills service area has a higher percentage (72.10%) of adults who have received a dental exam in the past 12 months, when compared to the state (69.50%), the shortfall of dentist in the medical service area is significantly greater (22.98%) than the state’s rate (4.93%). EACH AREA. Another barrier to poor oral health is the percentage of adults who have dental insurance. The medical service area has a slightly higher rate of uninsured adults (41.40%) than the state (40.90%).
Affordable Housing & Homelessness: In the KFH-Woodland Hills service area, 46.49% of households spend more than 30% of their income toward housing cost compared to California at 44.99%. There are more US Department of Housing and Urban Development (HUD)-funded assisted housing units in the medical center service area (377.06 per 10,000 households) than in the state (368.32) indicative of a high population of low-income households. Compared to the state’s 47.54%, 48.01% of housing units in the KFH-Woodland Hills service area are in substandard conditions.
C. Summary of Needs Assessment Methodology and Process
The overarching aim of this report is to identify and prioritize unmet community health needs. More importantly, this report will be the foundation to the development of an implementation strategy to plan
10
coordinated and potentially collaborative efforts and activities to promote and improve the health of all individuals residing in the KFH-Woodland Hills Medical Center service area. Secondary data were collected through the Kaiser Permanente CHNA Data Platform allowing for identification of health needs, key drivers and community assets and resources. Secondary data are information that have been collected and published by another entity. They are typically quantitative (numerical) in nature. Secondary data are helpful in highlighting objectively health needs that significantly impact a community. The CHNA team collected data on 33 common indicators from the Kaiser Permanente CHNA data platform which included categories from the Mobilizing Action Toward Community Health (MATCH) framework: demographics, social and economic factors, health behaviors, physical environment, clinical care, and health outcomes. Additionally, the team utilized other sources to supplement collected data. The values were benchmarked against those of the state, nation and Healthy People 2020. Health indicators not meeting benchmarks were compiled into a list of identified health needs.
The list of health needs informed the methodology and process for primary data collection and any additional health need identified from primary data was included in the list. Primary data are new data collected first-hand. They are typically qualitative (non-numerical) in nature. For this CHNA, primary data was collected through key informant interviews, focus groups, community forums and surveys. The primary data describes what is important to the people residing in and serving the medical center’s service area. Between August and November 2015, 11 key informant interviews, 17 focus groups, 188 surveys, and 2 forums were conducted in various settings throughout the service area.
Following identification of the health needs, the CHNA team conducted a two-step process to prioritize the list into the 10 most immediate and significant needs for KFH-Woodland Hills Medical Center’s service area. Utilizing secondary and primary data from each of the medical center’s distinct service areas (Ventura County and West San Fernando Valley) along with a set of five criteria, the CHNA team determined the top 10 health needs for each service areas. These two lists were then combined and the final list of leading 10 needs was compiled based on the same five criteria along with the secondary data for the entire medical center’s service area. The criteria utilized during the prioritization process were:
Health needs definition: Meets Kaiser Permanente’s definition of a health need which is “a poor health outcome and its associated health driver, or a health driver associated with a poor health outcome where the outcome itself has not yet arisen as a need”
Disparity: Vulnerable groups are affected by the health need
Trend: The health need has worsened over time
Community concern: The community identified the health need as a priority
Benchmark: The health need does not meet the state benchmark
The CHNA team then utilized the prioritized health needs to substantiate the presence of assets and resources in the medical center service area that may potentially be applied toward targeted implementation strategies.
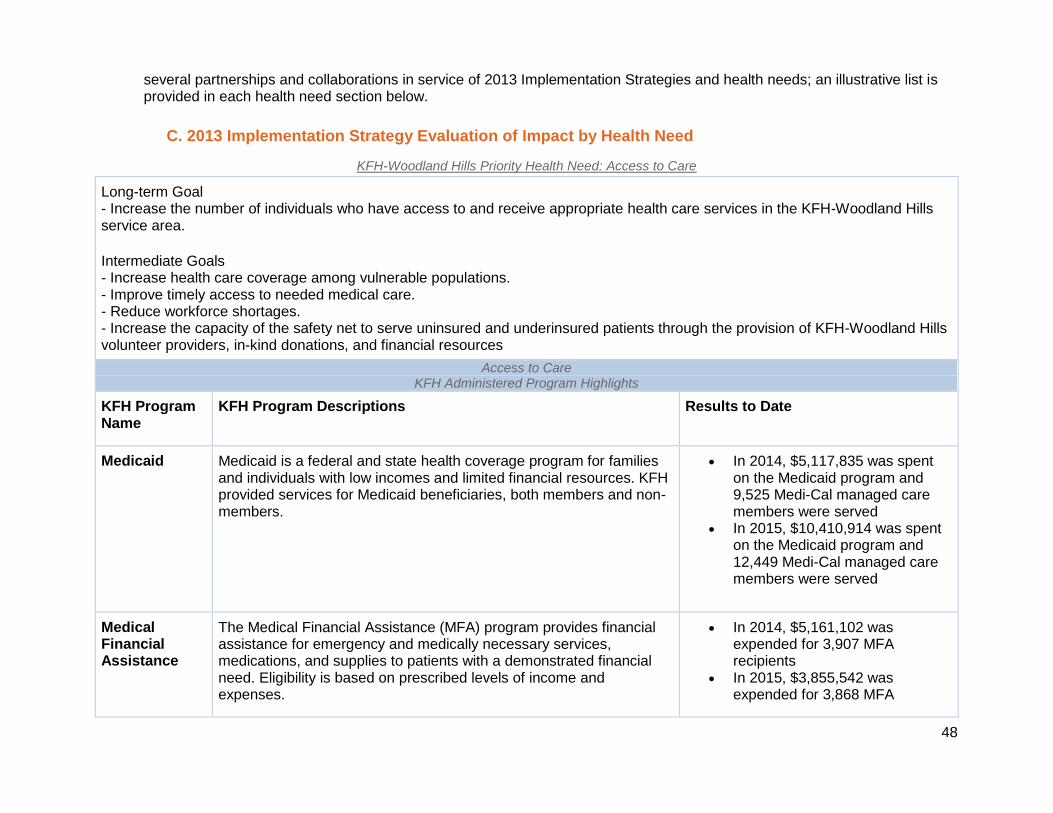
D. Implementation Strategy Evaluation of Impact
In the 2013 Implementation Strategy (IS) process, all KFH planned for and drew on a broad array of resources and strategies to improve the health of communities and vulnerable populations, such as grantmaking, in-kind resources, collaborations and partnerships, as well as several internal KFH programs including, charitable health coverage programs, future health professional training programs, and research. KFH-Woodland Hills Medical Center is monitoring and evaluating progress to date on
11
their 2013 Implementation Strategies for the purpose of tracking the implementation of those strategies as well as to document the impact of those strategies in addressing selected CHNA health needs. Tracking metrics for each prioritized health need include the number of grants made, the number of dollars spent, the number of people reached/served, collaborations and partnerships, and KFH in-kind resources. In addition, KFH-Woodland Hills Medical Center tracks outcomes, including behavior and health outcomes, as appropriate and where available. As of the documentation of this CHNA Report in March 2016, KFH-Woodland Hills Medical Center had evaluation of impact information on activities from 2014 and 2015. While not reflected in this report, KFH-Woodland Hills Medical Center will continue to monitor impact for strategies implemented in 2016.
II. INTRODUCTION/BACKGROUND
A. About Kaiser Permanente (KP)
Founded in 1942 to serve employees of Kaiser Industries and opened to the public in 1945, Kaiser Permanente is recognized as one of America’s leading health care providers and nonprofit health plans. We were created to meet the challenge of providing American workers with medical care during the Great Depression and World War II, when most people could not afford to go to a doctor. Since our beginnings, we have been committed to helping shape the future of health care. Among the innovations Kaiser Permanente has brought to U.S. health care are:
● Prepaid health plans, which spread the cost to make it more affordable
● A focus on preventing illness and disease as much as on caring for the sick
● An organized coordinated system that puts as many services as possible under one roof—all
connected by an electronic medical record
Kaiser Permanente is an integrated health care delivery system comprised of Kaiser Foundation Hospitals (KFH), Kaiser Foundation Health Plan (KFHP), and physicians in the Permanente Medical Groups. Today we serve more than 10 million members in nine states and the District of Columbia. Our mission is to provide high-quality, affordable health care services and to improve the health of our members and the communities we serve.
Care for members and patients is focused on their Total Health and guided by their personal physicians, specialists, and team of caregivers. Our expert and caring medical teams are empowered and supported by industry-leading technology advances and tools for health promotion, disease prevention, state-of-the-art care delivery, and world-class chronic disease management. Kaiser Permanente is dedicated to care innovations, clinical research, health education, and the support of community health.
B. About Kaiser Permanente Community Benefit
For more than 70 years, Kaiser Permanente has been dedicated to providing high-quality, affordable health care services and to improving the health of our members and the communities we serve. We believe good health is a fundamental right shared by all and we recognize that good health extends beyond the doctor’s office and the hospital. It begins with healthy environments: fresh fruits and vegetables in neighborhood stores, successful schools, clean air, accessible parks, and safe playgrounds. These are the vital signs of healthy communities. Good health for the entire community, which we call Total Community Health, requires equity and social and economic well-being.
Like our approach to medicine, our work in the community takes a prevention-focused, evidence-based approach. We go beyond traditional corporate philanthropy or grant making to pair financial resources
12
with medical research, physician expertise, and clinical practices. Historically, we’ve focused our investments in three areas—Health Access, Healthy Communities, and Health Knowledge—to address critical health issues in our communities.
For many years, we’ve worked side-by-side with other organizations to address serious public health issues such as obesity, access to care, and violence. And we’ve conducted Community Health Needs Assessments to better understand each community’s unique needs and resources. The CHNA process informs our community investments and helps us develop strategies aimed at making long-term, sustainable change—and it allows us to deepen the strong relationships we have with other organizations that are working to improve community health.
C. Purpose of the CHNA Report
i. To Advance Community Health
Community Health Needs Assessments (CHNA) have been integral to learning about the health of the communities Kaiser Permanente serves. We are committed to building on the CHNA and relationships in the community to deepen our knowledge of the community specific needs and the resources and leaders in the community. This deeper knowledge will enable us to develop a new approach by engaging differently and activating in a way that addresses specific community needs and in collective action with the community. This new approach will leverage our existing and new community partnerships and harness the power of all Kaiser Permanente assets – economic, relationships, and expertise – to positively impact community health.
ii. To Implement ACA Regulations
The Patient Protection and Affordable Care Act (ACA), enacted on March 23, 2010, included new requirements for nonprofit hospitals in order to maintain their tax exempt status. The provision was the subject of final regulations providing guidance on the requirements of section 501(r) of the Internal Revenue Code. Included in the new regulations is a requirement that all nonprofit hospitals must conduct a community health needs assessment (CHNA) and develop an implementation strategy (IS) every three years (http://www.gpo.gov/fdsys/pkg/FR-2014-12-31/pdf/2014-30525.pdf). The required written IS plan is set forth in a separate written document. Both the CHNA Report and the IS for each Kaiser Foundation Hospital facility are available publicly at kp.org/chna.
D. Kaiser Permanente Approach to CHNA
Kaiser Permanente has conducted CHNAs for many years, often as part of long-standing community collaboratives. The new federal CHNA requirements have provided an opportunity to revisit our needs assessment and strategic planning processes with an eye toward enhanced compliance and transparency and leveraging emerging technologies. Our intention is to develop and implement a transparent, rigorous, and whenever possible, collaborative approach to understanding the needs and assets in our communities. From data collection and analysis to the identification of prioritized needs and the development of an implementation strategy, the intent was to develop a rigorous process that would yield meaningful results.
Kaiser Permanente’s innovative approach to CHNAs include the development of a free, web-based CHNA data platform that is available to the public. The data platform provides access to a core set of approximately 150 publicly available indicators to understand health through a framework that includes social and economic factors; health behaviors; physical environment; clinical care; and health outcomes.
In addition to reviewing the secondary data available through the CHNA data platform, and in some
cases other local sources, each KFH facility, individually or with a collaborative, collected primary data through key informant interviews, focus groups, and surveys. Primary data collection consisted of reaching out to local public health experts, community leaders, and residents to identify issues that most impacted the health of the community. The CHNA process also included an identification of existing community assets and resources to address the health needs.
Each hospital/collaborative developed a set of criteria to determine what constituted a health need in their community. Once all of the community health needs were identified, they were all prioritized, based on identified criteria. This process resulted in a complete list of prioritized community health needs. The process and the outcome of the CHNA are described in this report.
In conjunction with this report, KFH-Woodland Hills will develop an implementation strategy for the priority health needs the hospital will address. These strategies will build on Kaiser Permanente’s assets and resources, as well as evidence-based strategies, wherever possible. The Implementation Strategy will be filed with the Internal Revenue Service using Form 990 Schedule H. Both the CHNA and the Implementation Strategy, once they are finalized, will be posted publicly on our website, www.kp.org/chna.
III. COMMUNITY SERVED
A. Kaiser Permanente’s Definition of Community Served
Kaiser Permanente defines the community served by a hospital as those individuals residing within its hospital service area. A hospital service area includes all residents in a defined geographic area surrounding the hospital and does not exclude low-income or underserved populations.
B. Map and Description of Community Served
i. Map
KFH-Woodland Hills serves the communities of West San Fernando Valley and Ventura County as depicted in the map. KFH- Woodland Hills medical center is an integrated delivery system that serves the population of this broad area. The broad communities served by KFH-Woodland Hills have diverse geography, topography and varied levels of socio-economic status. As such, in addition to providing information about the broader KFH-Woodland Hills service area, this report will also include information about West San Fernando Valley and Ventura County service areas separately to capture both the commonalities as well as the unique problems that exist across these geographies. This will enhance understanding of the significant health needs of KFH-Woodland Hills communities to form more targeted implementation strategies.
ii. Geographic description of community served (towns, county, and/or zip codes)
KFH-Woodland Hills Medical Center’s service area includes communities from West San Fernando Valley (Los Angeles County) and Ventura County.
The West San Fernando Valley service area includes Agoura Hills, Calabasas, Canoga Park, Chatsworth, Encino, Malibu, Northridge, Porter Ranch, Reseda, Sherman Oaks, Tarzana, Topanga, West Hills, Winnetka and Woodland Hills.
The Ventura County Service Area includes Camarillo, Fillmore, Moorpark, Newbury Park, Oak Park, Oak View, Oxnard, Port Hueneme, Santa Paula, Simi Valley, Somis, Thousand Oaks, Ventura, and Westlake Village. Communities served by KFH-Woodland Hills are summarized in the table below.
Communities of KFH-Woodland Hills Medical Center Service Area by Zip Code and County
Cities/Communities Zip Codes County
Camarillo 93010, 93012 Ventura
Fillmore 93015 Ventura
Moorpark 93021 Ventura
Newbury Park 91320 Ventura
Oak Park 91377 Ventura
Oak View 93022 Ventura
Oxnard 93030, 93033, 93035, 93036 Ventura
Port Hueneme 93041 Ventura
Santa Paula 93060 Ventura
Simi Valley 93063, 93065, 93093 Ventura
Somis 93066 Ventura
Thousand Oaks 91360, 91362 Ventura
Ventura 93001, 93003, 93004 Ventura
Westlake Village 91361 Ventura
Agoura Hills 91301 Los Angeles
Calabasas 91302 Los Angeles
Canoga Park 91303, 91304 Los Angeles
15
Cities/Communities Zip Codes County
Chatsworth 91311 Los Angeles
Encino 91316, 91436 Los Angeles
Malibu 90265 Los Angeles
Northridge 91324, 91325 Los Angeles
Porter Ranch 91326 Los Angeles
Reseda 91335 Los Angeles
Sherman Oaks 91403 Los Angeles
Tarzana 91356 Los Angeles
Topanga 90290 Los Angeles
West Hills 91307 Los Angeles
Winnetka 91306 Los Angeles
Woodland Hills 91364, 91367 Los Angeles
iii. Demographic profile of community served
Total Population
In the KFH-Woodland Hills Medical Center service area, the West San Fernando Valley is significantly more densely populated with 932,750 people occupying 552 square miles compared to the Ventura County service area with 835,790 residents living in 1,843 square miles. Overall, the KFH-Woodland Hills Medical Center service area is more than 5 times densely populated than the state and more than 14 times that of the nation. High population density can result in overcrowding which may be linked to frequent and severe outbreaks of communicable diseases.
Report Area Total Population Total Land Area (Square Miles)
Population Density (Per Square Mile)
KFH-Woodland Hills Service Area 1,428,966 1,121 1,273.67
West San Fernando Valley 932,750 552 1,688.1
Los Angeles County 9,974,203 4,058.07 2,457.87
Ventura County 835,790 1,843.01 453.49
California 38,066,920 155,785.98 244.35
United States 317,746,048 3,535,356.15 89.88
Source: US Census Bureau, American Community Survey. 2010-14. Source geography: Tract
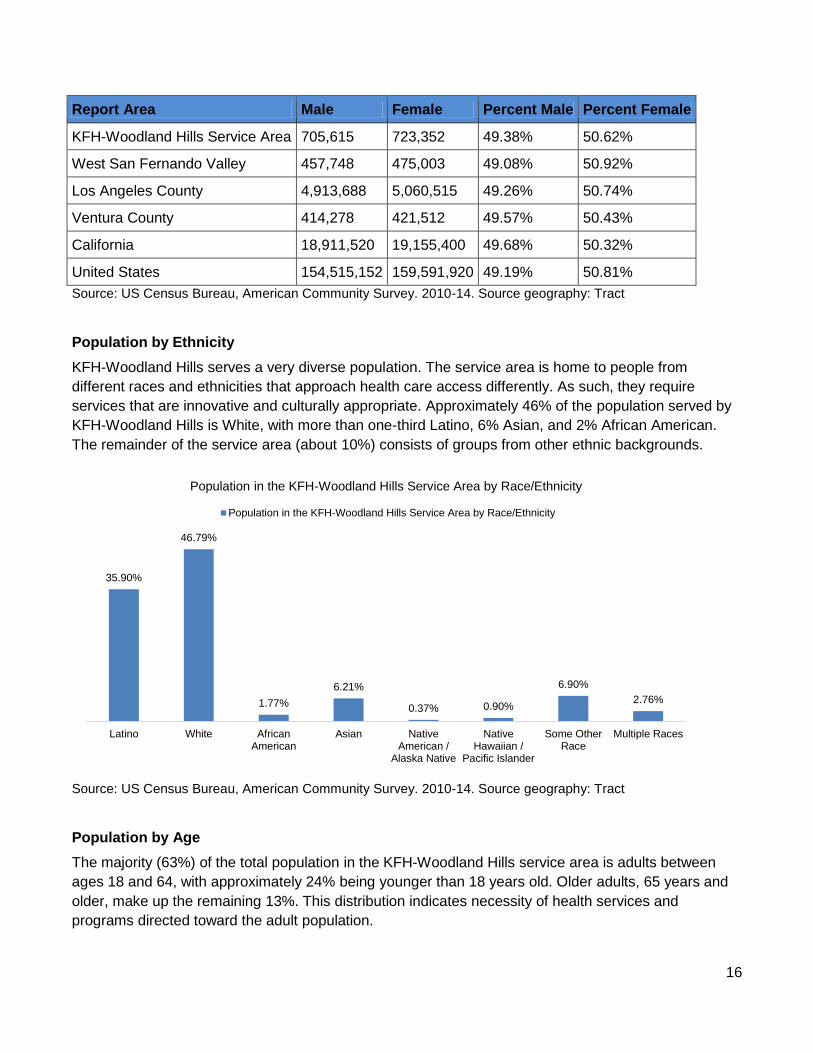
Population by Gender
The gender distribution of the KFH-Woodland Hills service area is almost equally distributed with 50.62% females and 49.38% males; a similar distribution exists across West San Fernando Valley, Ventura County, California and the United States.
16
Report Area Male Female Percent Male Percent Female
KFH-Woodland Hills Service Area 705,615 723,352 49.38% 50.62%
West San Fernando Valley 457,748 475,003 49.08% 50.92%
Los Angeles County 4,913,688 5,060,515 49.26% 50.74%
Ventura County 414,278 421,512 49.57% 50.43%
California 18,911,520 19,155,400 49.68% 50.32%
United States 154,515,152 159,591,920 49.19% 50.81%
Source: US Census Bureau, American Community Survey. 2010-14. Source geography: Tract
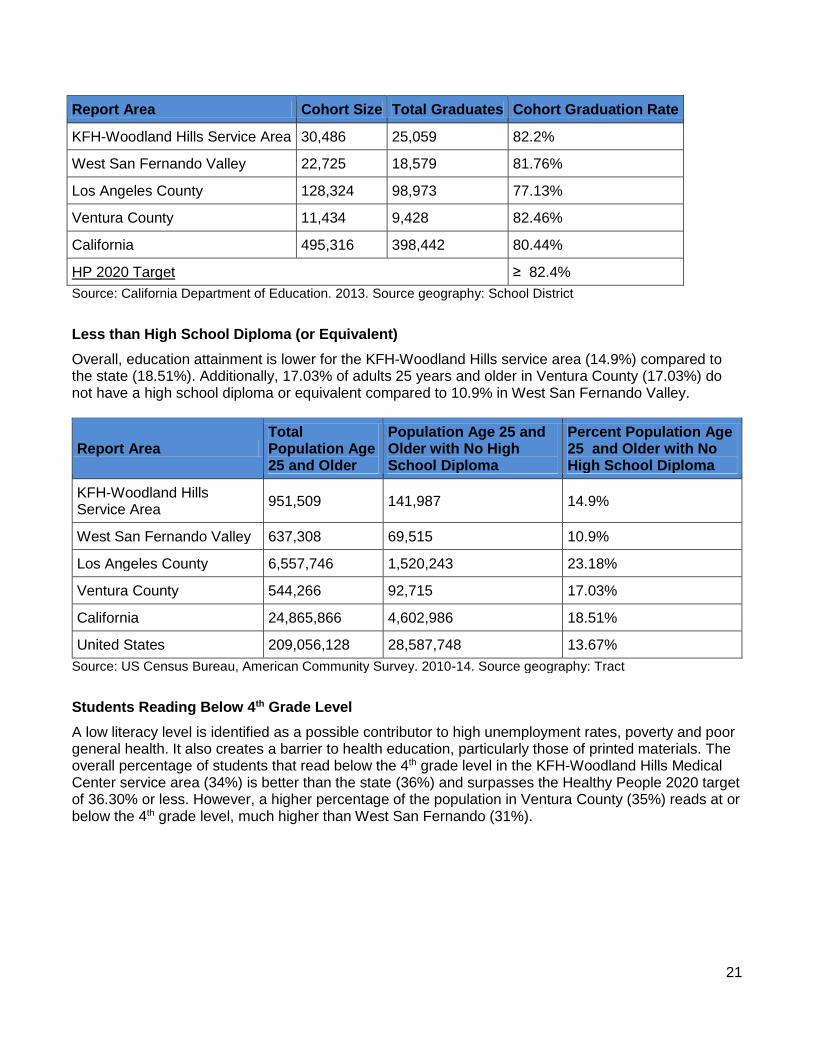
Population by Ethnicity
KFH-Woodland Hills serves a very diverse population. The service area is home to people from
different races and ethnicities that approach health care access differently. As such, they require
services that are innovative and culturally appropriate. Approximately 46% of the population served by
KFH-Woodland Hills is White, with more than one-third Latino, 6% Asian, and 2% African American.
The remainder of the service area (about 10%) consists of groups from other ethnic backgrounds.
Source: US Census Bureau, American Community Survey. 2010-14. Source geography: Tract
Population by Age
The majority (63%) of the total population in the KFH-Woodland Hills service area is adults between
ages 18 and 64, with approximately 24% being younger than 18 years old. Older adults, 65 years and
older, make up the remaining 13%. This distribution indicates necessity of health services and
programs directed toward the adult population.
35.90%
46.79%
1.77%
6.21%
0.37% 0.90%
6.90%
2.76%
Latino White AfricanAmerican
Asian NativeAmerican /
Alaska Native
NativeHawaiian /
Pacific Islander
Some OtherRace
Multiple Races
Population in the KFH-Woodland Hills Service Area by Race/Ethnicity
Population in the KFH-Woodland Hills Service Area by Race/Ethnicity
17
Source: US Census Bureau, American Community Survey. 2009-13. Source geography: Tract
Population Change
Within 10 years, there has been an increase in the population of the medical center service area by almost 8%. The population of the Ventura County service area has grown more than the medical center’s service area at 9.3% and more than West San Fernando Valley at 7.24%. Such positive shifts in population may indicate the need for more health care providers and the increased utilization of health care services and resources.
Report Area Total Population, 2000 Census
Total Population, 2010 Census
Total Population Change, 2000-2010
Percent Population Change, 2000-2010
KFH-Woodland Hills Service Area
1,287,136 1,393,646 106,510 8.27%
West San Fernando Valley
844,217 905,373 61,156 7.24%
Los Angeles County
9,519,257 9,818,605 299,348 3.14%
Ventura County 753,240 823,318 70,078 9.3%
California 33,871,651 37,253,956 3,382,305 9.99%
United States 280,405,781 307,745,539 27,339,758 9.75%
Source: US Census Bureau, Decennial Census. 2000 - 2010. Source geography: Tract
Population with Limited English Proficiency
Limited ability to speak English can be a barrier to accessing health care, limit communication with health providers, and discourage understanding of health information. A lower percentage of residents ages 5 and above do not speak English well in the KFH-Woodland Hills service area (17.54%) as compared to California (19.1%). However, there is a higher percentage in the Ventura County service area (16.27%) in contrast to West San Fernando (15.51%) indicating possibility of a higher language barrier to access health care needs.
6.20%
17.36%
9.86%
13.07% 13.32%14.73%
12.24%13.24%
Age 0-4 Age 5-17 Age 18-24 Age 25-34 Age 35-44 Age 45-54 Age 55-64 Age 65
Population in the KFH-Woodland Hills Service Area by Age
Population in the KFH-Woodland Hills Service Area by Age
18
Report Area Total Population
Population Age 5 and older
Population Age 5 and older with Limited English Proficiency
Percent Population Age 5 and older with Limited English Proficiency
KFH-Woodland Hills Service Area
1,340,431 1,340,431 235,058 17.54%
West San Fernando Valley
881,868 881,868 136,759 15.51%
Los Angeles County
9,329,565 9,329,565 2,407,270 25.8%
Ventura County 781,184 781,184 127,100 16.27%
California 35,545,620 35,545,621 6,789,522 19.1%
United States 294,133,376 294,133,388 25,305,204 8.6%
Source: US Census Bureau, American Community Survey. 2010-14. Source geography: Tract
Population with Limited English Proficiency by Language Spoken at Home
Lack of effective communication between health providers and community residents can reduce compliance with medical plans which could negatively affect health outcomes. More than 7% of the population in KFH-Woodland Hills service area, that are at least 5 years old, live in linguistically isolated households (household in which no one 14 years and older (1) speaks only English (2) speaks one language and English less than “very well”). Therefore, individuals in these households could be further limited in accessing health care services.
Report Area Total Population Age 5 and Older
Linguistically Isolated Population
Percent Linguistically Isolated Population
KFH-Woodland Hills Service Area
1,340,430 111,622 8.33%
West San Fernando Valley
881,868 64,450 7.31%
Los Angeles County 9,329,565 1,182,439 12.67%
Ventura County 781,184 59,657 7.64%
California 35,545,620 3,366,547 9.47%
United States 294,133,376 13,692,809 4.66%
Source: US Census Bureau, American Community Survey. 2010-14. Source geography: Tract
Community Safety
Community safety is linked with the state of one’s health. When community residents do not feel safe, they are less likely to go outside their homes to participate in physical activity and other community activities. Common safety concerns include crime, inadequate street lighting, sidewalks in disrepair, and gang violence. The following table reports the rate of crime activity in KFH-Woodland Hills service area per 100,000 population. Evidently, the service area suffers from a high crime rate thereby
19
indicating the community’s health status may be negatively impacted due to poor living conditions.
Report Area Motor Vehicle Accidents All Violent Crimes
KFH-Woodland Hills Service Area 6.08 319.5
West San Fernando Valley 5.58 381.1
Los Angeles County 5.37 473.9
Ventura County 6.53 205
California 5.18 425
Source: Federal Bureau of Investigation, FBI Uniform Crime Reports. Additional analysis by the National Archive of Criminal Justice Data. Accessed via the Inter-university Consortium for Political and Social Research. 2010-12. Source geography: County.
Population Below 200% Federal Poverty Level (FPL)
Poverty is an important social determinant of health and a barrier to meeting basic needs including
healthy foods, housing and health care. Compared to California, the service area of KFH-Woodland
Hills has a higher population, about 35% in the Ventura County service area, with household income
below 200% FPL. Aside from affecting access to health care, poverty is associated with decreased high
school graduation rates and increased unemployment rates.
Report Area Total Population
Population with Income at or Below 200% FPL
Percent Population with Income at or Below 200% FPL
KFH-Woodland Hills Service Area
1,408,235 398,650 28.31%
West San Fernando Valley
920,232 225,564 24.51%
Los Angeles County 9,819,397 4,014,863 40.89%
Ventura County 824,329 232,553 28.21%
California 37,323,128 13,576,255 36.37%
United States 306,226,400 105,773,408 34.54%
Source: US Census Bureau, American Community Survey. 2010-14. Source geography: Tract
Unemployment Rate
A high unemployment rate could lead to an increase in the number of people living below 200% FPL
and, as such, impact the ability to access health care. The table below indicates that the service area
has similar unemployment rate (6.7%) as the state (6.8%). Ventura County appears to have better
employment prospect (6.2%) than West San Fernando Valley (7.1%).
20
Report Area Labor Force
Number Employed
Number Unemployed
Unemployment Rate
KFH-Woodland Hills Service Area
721,888 673,204 48,683 6.7%
West San Fernando Valley
468,311 435,280 33,030 7.1%
Los Angeles County 5,047,001 4,667,406 379,595 7.5%
Ventura County 427,575 401,181 26,394 6.2%
California 18,855,659 17,578,188 1,277,471 6.8%
United States 156,985,221 148,497,233 8,487,988 5.4%
Source: US Department of Labor, Bureau of Labor Statistics. 2015 - December. Source geography: County
Children in Poverty
Children between 0 and 17 years of age who live below 100% FPL can face greater barriers than adults. Research shows that hunger affects learning and behavior. Poverty impacts the parent’s ability to access health services, affordable housing, and healthy food along with other necessary life-sustaining services that impact the overall health of a child. Compared to the state’s 22.7% populations under age 18 living 100% below FPL, KFH-Woodland Hills has a lower percentage of 16.19%. Within the medical center service area, for Ventura County, more children (16.2%) live in poverty compared to West San Fernando Valley (13.39%).
Report Area Total Population
Population Under Age 18
Population Under Age 18 in Poverty
Percent Population Under Age 18 in Poverty
KFH-Woodland Hills Service Area
1,408,235 331,195 53,625 16.19%
West San Fernando Valley
920,231 204,974 27,446 13.39%
Los Angeles County 9,819,397 2,314,447 602,728 26.04%
Ventura County 824,329 204,652 33,152 16.2%
California 37,323,128 9,072,050 2,059,262 22.7%
United States 306,226,400 72,637,888 15,907,395 21.9%
Source: US Census Bureau, American Community Survey. 2010-14. Source geography: Tract
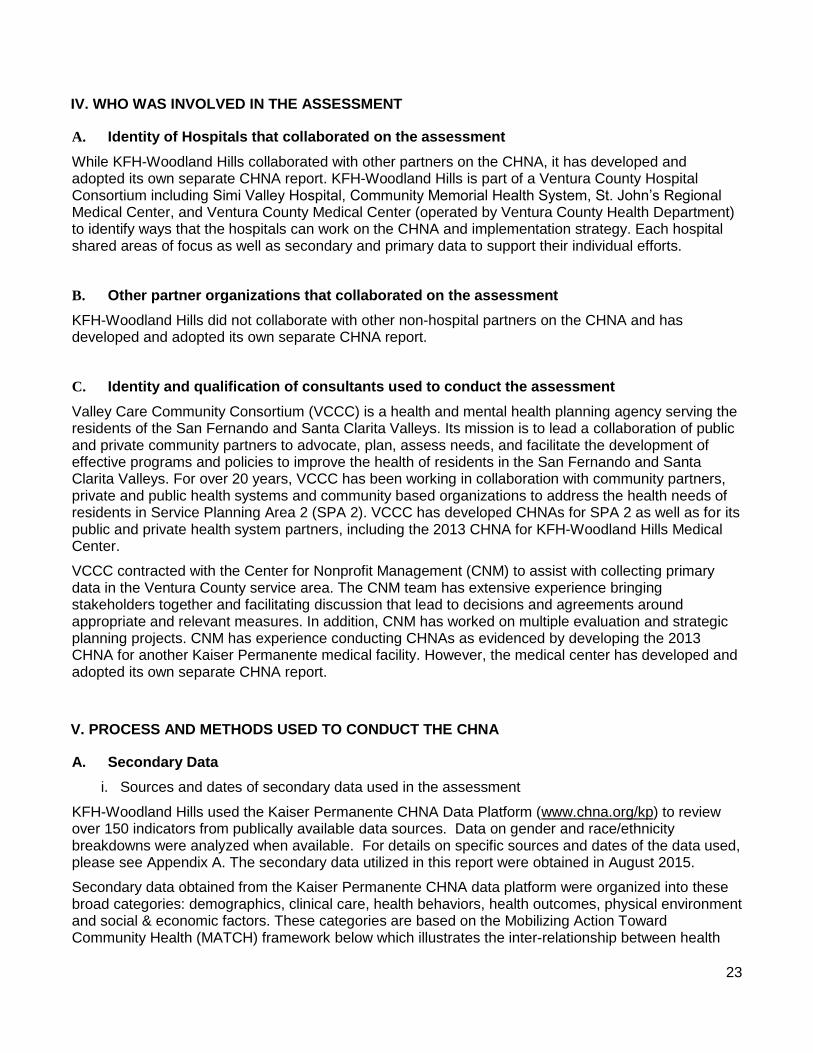
High School Graduation Rate
The table below shows the rate of high school graduation by receipt of high school diploma within four years. Low levels of education are often linked to poverty and poor health. The graduation rate for the KFH-Woodland Hills service area exceeds that of the state but is slightly lower than the target for Healthy People 2020. On closer look, more efforts need to be increased in West San Fernando Valley given that the Ventura County service area exceeds both the state and the Healthy People 2020 target.
21
Report Area Cohort Size Total Graduates Cohort Graduation Rate
KFH-Woodland Hills Service Area 30,486 25,059 82.2%
West San Fernando Valley 22,725 18,579 81.76%
Los Angeles County 128,324 98,973 77.13%
Ventura County 11,434 9,428 82.46%
California 495,316 398,442 80.44%
HP 2020 Target ≥ 82.4%
Source: California Department of Education. 2013. Source geography: School District
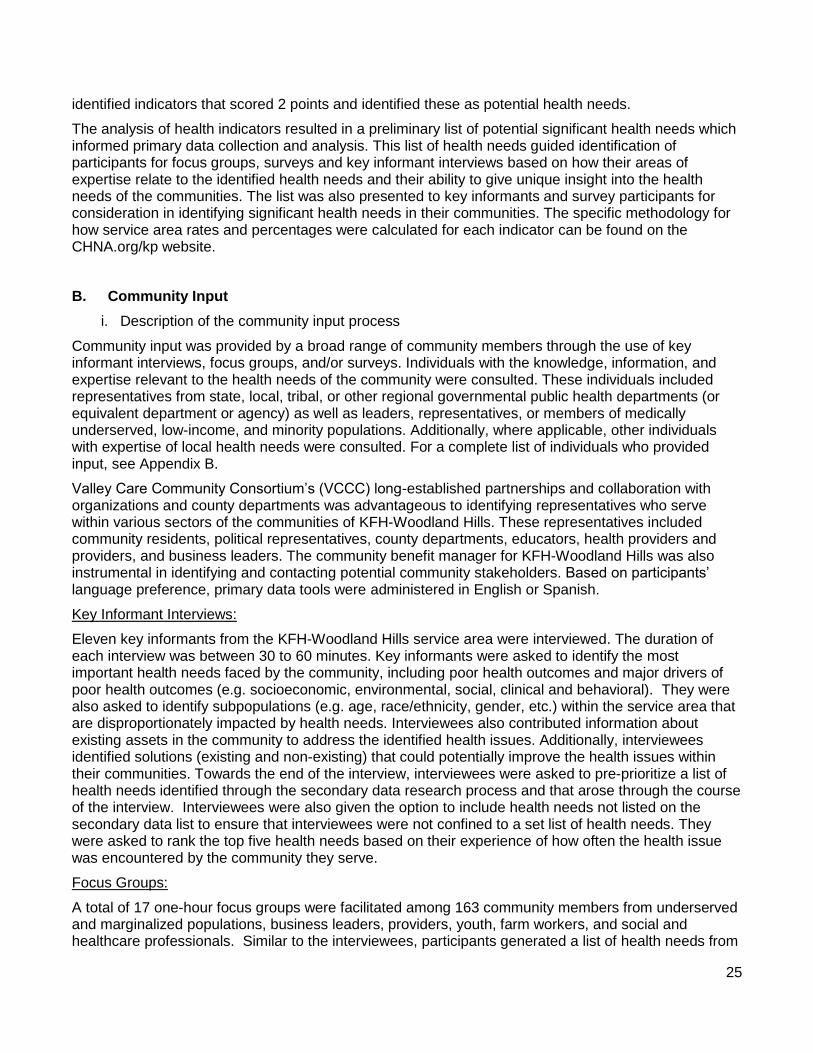
Less than High School Diploma (or Equivalent)
Overall, education attainment is lower for the KFH-Woodland Hills service area (14.9%) compared to the state (18.51%). Additionally, 17.03% of adults 25 years and older in Ventura County (17.03%) do not have a high school diploma or equivalent compared to 10.9% in West San Fernando Valley.
Report Area Total Population Age 25 and Older
Population Age 25 and Older with No High School Diploma
Percent Population Age 25 and Older with No High School Diploma
KFH-Woodland Hills Service Area
951,509 141,987 14.9%
West San Fernando Valley 637,308 69,515 10.9%
Los Angeles County 6,557,746 1,520,243 23.18%
Ventura County 544,266 92,715 17.03%
California 24,865,866 4,602,986 18.51%
United States 209,056,128 28,587,748 13.67%
Source: US Census Bureau, American Community Survey. 2010-14. Source geography: Tract
Students Reading Below 4th Grade Level
A low literacy level is identified as a possible contributor to high unemployment rates, poverty and poor general health. It also creates a barrier to health education, particularly those of printed materials. The overall percentage of students that read below the 4th grade level in the KFH-Woodland Hills Medical Center service area (34%) is better than the state (36%) and surpasses the Healthy People 2020 target of 36.30% or less. However, a higher percentage of the population in Ventura County (35%) reads at or below the 4th grade level, much higher than West San Fernando (31%).
Source: California Department of Education. 2012-13. Source geography: School District
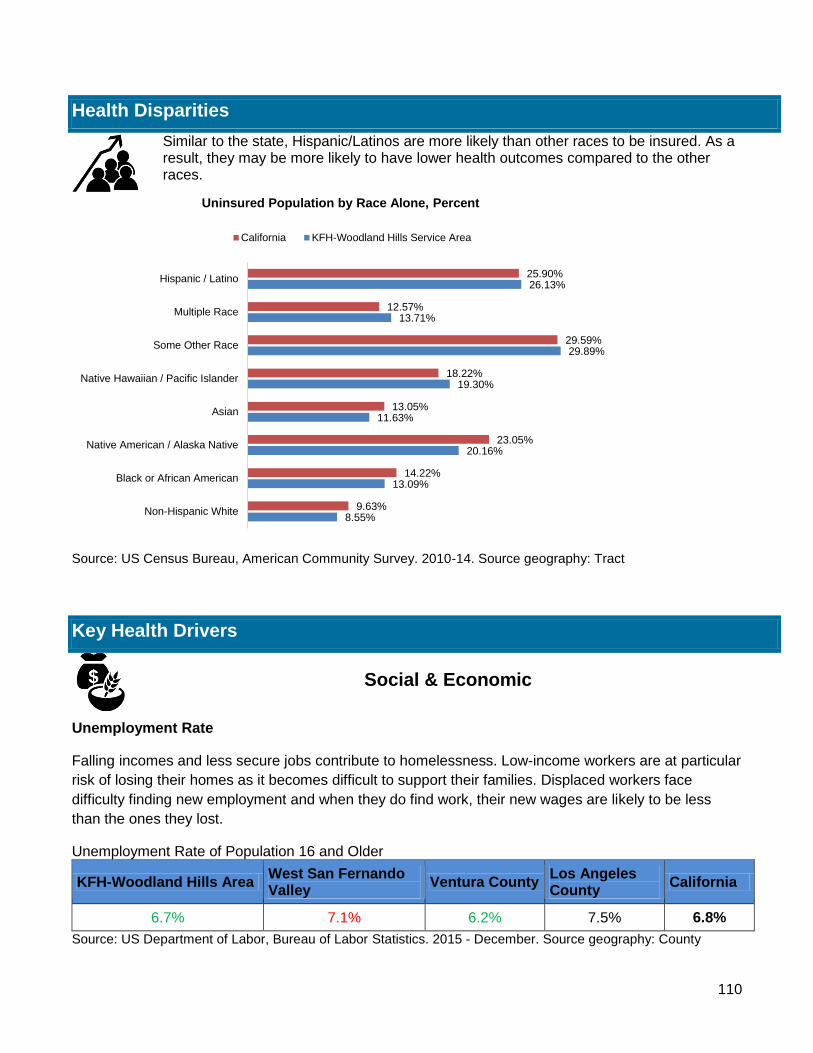
Uninsured Population
The lack of health insurance is considered a key driver of health status. Populations with no access to
health insurance have limited or no access to primary, dental, mental and specialty care thus resulting
in poor health status. There are fewer uninsured people in the KFH-Woodland Hills Medical Center
service area (15.41%) compared to the state’s 16.69%. Higher rates of uninsured exist in Ventura
County (15.18%) than West San Fernando Valley (13.85%). It is therefore likely that residents of
Ventura County have more challenges in accessing health care compared to those in West San
Fernando Valley. Please note that with the passage of the Affordable Care Act in 2010, the number of
residents covered may be higher as a result of Medi-Cal expansion and changes availability of health
coverage than those displayed in the chart below.
Source: US Census Bureau, American Community Survey. 2010-14. Source geography: Tract
KFH-WoodlandHills Service
Area
West SanFernando
Valley
VenturaCounty
Los AngelesCounty
California HP 2020Target
34%
31%
35%
36% 36% 36.30%
Percentage of Scores 'Basic' or Worse
Percentage of Scores 'Basic' or Worse
KFH-WoodlandHills Service
Area
West SanFernando
Valley
Ventura County Los AngelesCounty
California
15.41%13.85%
15.18%
20.85%
16.69%
Percent Uninsured Population
Percent Uninsured Population
23
IV. WHO WAS INVOLVED IN THE ASSESSMENT
A. Identity of Hospitals that collaborated on the assessment
While KFH-Woodland Hills collaborated with other partners on the CHNA, it has developed and adopted its own separate CHNA report. KFH-Woodland Hills is part of a Ventura County Hospital Consortium including Simi Valley Hospital, Community Memorial Health System, St. John’s Regional Medical Center, and Ventura County Medical Center (operated by Ventura County Health Department) to identify ways that the hospitals can work on the CHNA and implementation strategy. Each hospital shared areas of focus as well as secondary and primary data to support their individual efforts.
B. Other partner organizations that collaborated on the assessment
KFH-Woodland Hills did not collaborate with other non-hospital partners on the CHNA and has developed and adopted its own separate CHNA report.
C. Identity and qualification of consultants used to conduct the assessment
Valley Care Community Consortium (VCCC) is a health and mental health planning agency serving the residents of the San Fernando and Santa Clarita Valleys. Its mission is to lead a collaboration of public and private community partners to advocate, plan, assess needs, and facilitate the development of effective programs and policies to improve the health of residents in the San Fernando and Santa Clarita Valleys. For over 20 years, VCCC has been working in collaboration with community partners, private and public health systems and community based organizations to address the health needs of residents in Service Planning Area 2 (SPA 2). VCCC has developed CHNAs for SPA 2 as well as for its public and private health system partners, including the 2013 CHNA for KFH-Woodland Hills Medical Center.
VCCC contracted with the Center for Nonprofit Management (CNM) to assist with collecting primary data in the Ventura County service area. The CNM team has extensive experience bringing stakeholders together and facilitating discussion that lead to decisions and agreements around appropriate and relevant measures. In addition, CNM has worked on multiple evaluation and strategic planning projects. CNM has experience conducting CHNAs as evidenced by developing the 2013 CHNA for another Kaiser Permanente medical facility. However, the medical center has developed and adopted its own separate CHNA report.
V. PROCESS AND METHODS USED TO CONDUCT THE CHNA
A. Secondary Data
i. Sources and dates of secondary data used in the assessment
KFH-Woodland Hills used the Kaiser Permanente CHNA Data Platform (www.chna.org/kp) to review over 150 indicators from publically available data sources. Data on gender and race/ethnicity breakdowns were analyzed when available. For details on specific sources and dates of the data used, please see Appendix A. The secondary data utilized in this report were obtained in August 2015.
Secondary data obtained from the Kaiser Permanente CHNA data platform were organized into these broad categories: demographics, clinical care, health behaviors, health outcomes, physical environment and social & economic factors. These categories are based on the Mobilizing Action Toward Community Health (MATCH) framework below which illustrates the inter-relationship between health
To augment and corroborate data from the KP CHNA data platform, other secondary data sources were explored for local and county (related department data and reports such as public health and mental health), state (department of public health) and national (includes the CDC and Healthy People 2020) sources. These data sources are listed in Appendix A.
ii. Methodology for collection, interpretation and analysis of secondary data
As a first step, in-depth reports of indicators of health were generated from the CHNA data platform for both service areas of KFH-Woodland Hills (West San Fernando Valley and Ventura County). When possible, service area values represent the aggregate of all data for geographies (zip codes, counties, census tract, etc.), which fall within the service area boundary. When one or more geographic boundaries were not entirely encompassed by a service area, the measure was aggregated proportionally.
The generated reports grouped common health indicators into health needs. For example, indicators for diabetes prevalence and diabetes hospitalization were grouped under the “Diabetes” health need. Each indicator for the service areas was compared to state, national, regional and Healthy People 2020 benchmarks.. Points were assigned to each indicator based on whether the indicator met the benchmark (0 point value) or does not meet benchmark. The maximum points that the CHNA data platform assigned to a health indicator was 4—a score of 4 shows that the health indicator greatly exceeds the benchmarks. The point values given to the health indicators for KFH-Woodland Hills ranged between 0-2 points showing that a few of the health indicators did not met or exceed the state indicator benchmark. For the health indicators rate scored between 0-2 points. The CHNA team
25
identified indicators that scored 2 points and identified these as potential health needs.
The analysis of health indicators resulted in a preliminary list of potential significant health needs which informed primary data collection and analysis. This list of health needs guided identification of participants for focus groups, surveys and key informant interviews based on how their areas of expertise relate to the identified health needs and their ability to give unique insight into the health needs of the communities. The list was also presented to key informants and survey participants for consideration in identifying significant health needs in their communities. The specific methodology for how service area rates and percentages were calculated for each indicator can be found on the CHNA.org/kp website.
B. Community Input
i. Description of the community input process
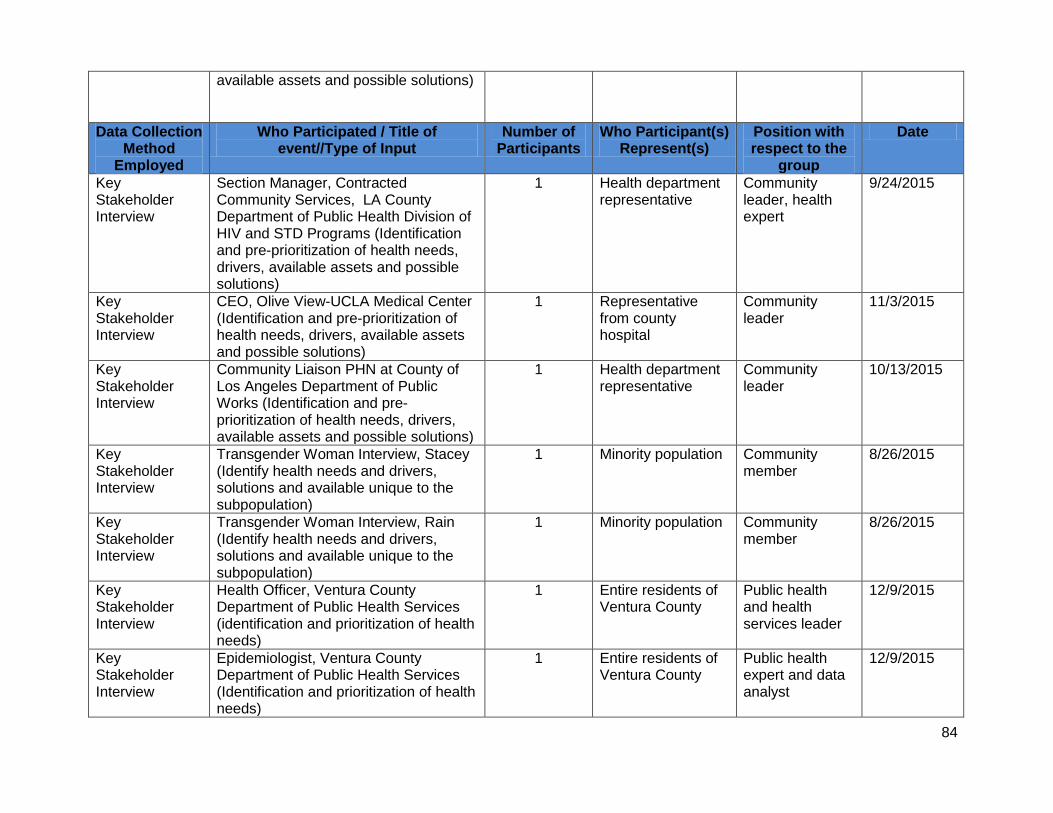
Community input was provided by a broad range of community members through the use of key informant interviews, focus groups, and/or surveys. Individuals with the knowledge, information, and expertise relevant to the health needs of the community were consulted. These individuals included representatives from state, local, tribal, or other regional governmental public health departments (or equivalent department or agency) as well as leaders, representatives, or members of medically underserved, low-income, and minority populations. Additionally, where applicable, other individuals with expertise of local health needs were consulted. For a complete list of individuals who provided input, see Appendix B.
Valley Care Community Consortium’s (VCCC) long-established partnerships and collaboration with organizations and county departments was advantageous to identifying representatives who serve within various sectors of the communities of KFH-Woodland Hills. These representatives included community residents, political representatives, county departments, educators, health providers and providers, and business leaders. The community benefit manager for KFH-Woodland Hills was also instrumental in identifying and contacting potential community stakeholders. Based on participants’ language preference, primary data tools were administered in English or Spanish.
Key Informant Interviews:
Eleven key informants from the KFH-Woodland Hills service area were interviewed. The duration of each interview was between 30 to 60 minutes. Key informants were asked to identify the most important health needs faced by the community, including poor health outcomes and major drivers of poor health outcomes (e.g. socioeconomic, environmental, social, clinical and behavioral). They were also asked to identify subpopulations (e.g. age, race/ethnicity, gender, etc.) within the service area that are disproportionately impacted by health needs. Interviewees also contributed information about existing assets in the community to address the identified health issues. Additionally, interviewees identified solutions (existing and non-existing) that could potentially improve the health issues within their communities. Towards the end of the interview, interviewees were asked to pre-prioritize a list of health needs identified through the secondary data research process and that arose through the course of the interview. Interviewees were also given the option to include health needs not listed on the secondary data list to ensure that interviewees were not confined to a set list of health needs. They were asked to rank the top five health needs based on their experience of how often the health issue was encountered by the community they serve.
Focus Groups:
A total of 17 one-hour focus groups were facilitated among 163 community members from underserved and marginalized populations, business leaders, providers, youth, farm workers, and social and healthcare professionals. Similar to the interviewees, participants generated a list of health needs from
26
which they then ranked the top five. Unlike interviewees, focus group participants were only asked to identify and rank the health needs they mentioned during the focus group. The intent of the focus groups was to capture the perceived health needs from a specific community group—business leaders, low-income residents, farm workers, youth, etc.—and not to capture their perspective on pre-identified health needs that arose from secondary research. They also identified impacted subpopulations, existing assets, and possible solutions to address the health needs.
Community Surveys:
188 surveys were administered (paper and electronic) to health professionals, community residents, elected officials representatives, and seniors. The information gathered included demographics and significant health needs in their communities. Respondents also ranked three health needs from a pre-generated list that included secondary and primary pre-identified health needs. Respondents were asked to rank three instead of five health needs to ensure that the required number of health needs are ranked and reduce the likelihood of unranked health needs. Spaces were also created in the survey tool to allow respondents to add any health need not listed that they believed were important.
Community Forums:
Two forums were conducted with 59 business leaders and health experts. The community forum was conducted in two parts. The first part resembled the focus group format where participants were asked to identify the perceived health needs in the community, drivers that contributed to the health needs, the impacted populations and neighborhoods, and the community assets and solutions in existence to address the needs including any additional non-existing solutions to address the health needs. While the participants listed their health needs, they were also asked to pre-prioritize the health needs based on how often the health issue was encountered by the community they serve. The pre-prioritized responses were later tallied to determine the ranking order of the health needs for the whole group.
The second part of the community forums consisted of utilizing TurningPoint clicker technology in which participants used a clicker to answer the questions. The reason that TurningPoint technology was used is that it allowed anonymity. The questions asked during the second part of the Community Forum focused on demographics and healthcare barriers. The demographic questions asked included questions about the participants’ age, race and income. The questions regarding healthcare barriers included questions asking about the type of healthcare providers used, where the healthcare service was obtained—hospital, community clinic, local pharmacy, etc.—and questions about listing the barriers to health care services, such as language barriers, insurance, cost, etc. Community forum participants were non-profit agency leaders, representatives of elected officials, and local businesses that service low-income and marginalized communities within the KFH- Woodland Hills service area.
ii. Methodology for interpretation and analysis of primary data
The primary data collection methods (surveys, focus groups, forums and key informant interviews), were used to identify the health needs of certain populations and communities and to determine additional health needs beyond secondary data research. Emphasis was placed on reaching out to non-traditional health stakeholders and vulnerable populations such as incarcerated youth, immigrant population, and the farm working community in an effort to capture health needs that may have been absent due to the marginalization of these communities, and to be reflective of the health needs of the KFH-Woodland Hills service area.
The geographic boundaries of the KFH-Woodland Hills service area also influenced the design and methods for analyzing primary data. KFH-Woodland Hills includes populations and communities from Los Angeles County and Ventura County, which are different in composition. To better understand the health needs from each area, qualitative data was analyzed separately for Ventura County and West San Fernando Valley during the primary data collection process, but then grouped together when the health needs were prioritized.
27
The steps below outline the primary data collection methods process included in the development of the CHNA.
Health Need Identification and Pre-prioritization: The primary data collection process was simultaneously used to pre-prioritize health needs in the service area. During the primary data gathering process, participants were asked to identify the health needs and barriers to community health. The responses from the participants were captured and ranked by the community themselves. The focus group and interviews ranked the top five health needs, and the surveys and community forums ranked the top three health needs.
Weight-Value Scoring: The final ranked health needs were then weighted differently to reflect the health needs of the represented population that was engaged in the primary data collection efforts. The maximum value assigned to focus groups and interviewee responses was 10 and for the community forums and surveys the maximum score value was 3 because the sample size for each community engagement process was different.
Therefore, score values of 10, 8, 6, 4, and 2 were provided to the first five health needs identified in each of the focus groups and interviews and score values of 3, 2, and 1 were provided to the first three health needs identified in each of the surveys and community forums. The final score values were then aggregated to determine the top five health needs for each qualitative data process.
The aggregated score values for each top five health need from the qualitative data process were then combined for a final score that numerically indicates the level of significance the health needs hold for the community. For example, in West San Fernando Valley, obesity scored 10.81 in focus groups, 9.6 in interviews and 2.88 in forums and surveys for a final total of 23.29 versus a final total of 19.33 for diabetes indicating obesity is a major health need for this service area.
Corroboration of Health Need: After each health need received its weighted-score value results, the health need was corroborated using a five-point criteria system to determine if the identified health issue can be categorized as a health need. The health issue must score in three out of the five criteria points in order to be classified, as a health need. The corroborating criteria includes:
1. Benchmarking: The health issue’s rate is compared to state, national and regional levels to determine if the need, meets or exceeds the benchmark.
2. Disparities exist: Disparities exist impacting certain populations by looking at ethnic, gender and lack of insurance. Each health need received a score of 0 if the disparity does not exist and 1 if the disparity does exist.
3. Time-trend analysis: The health need is getting worse over time (entails comparing current secondary data for each service area to the 2013 secondary data). Score was determined as follows: 0 if the health needs has improved; 1 if no change is noted and 2 if it has worsened.
4. Defined as a health need: The health need meets Kaiser Permanente’s definition: scored 0 for “No” and 1 for “Yes”
5. Community Concern: The health issue received a score, meaning it was mentioned as a health need during the primary data gathering process.
Prioritization: The final list of health needs for each geographic boundary (Ventura County and West San Fernando Valley) is then grouped together and the total values of each health need is summed up and the new value assigned determines the priority order of the health need. Health drivers, populations impacted, assets and solutions were then grouped thematically to present a better picture of how they were related to the lists of health needs.
As an example, in the West San Fernando Valley, mental health scored 24.37 weighted-points when the primary data methods were ranked for West San Fernando Valley, placing it as the third health need for the area. However, when the health needs were ranked for the primary data methods for Ventura County, mental health scored 8.50 weighted-points, placing it as the 11th health need for the
28
area. After combining the scores for both areas, and corroborating the results with secondary and the five-point criteria listed above, mental health was prioritized as the second health need for the KFH- Woodland Hills Medical Center, scoring 32.87 points.
By the end of the data analysis process, there was a total of 17 health needs (including health outcomes and drivers) for West San Fernando Valley and a total of 14 health needs (also including health outcomes and drivers) for Ventura County. These retained lists were included in the prioritization phase to determine the ranked order of the most significant health needs in each area. Please see the prioritization process in Section VI.
C. Written Comments
Kaiser Permanente provided the public an opportunity to submit written comments on the facility’s previous CHNA Report through [email protected]. This website will continue to allow for written community input on the facility’s most recently conducted CHNA Report.
As of the time of this CHNA report development, KFH-Woodland Hills had not received written comments about previous CHNA Reports. Kaiser Permanente will continue to track any submitted written comments and ensure that relevant submissions will be considered and addressed by the appropriate facility staff.
D. Data limitations and information gaps
The Kaiser Permanente CHNA data platform includes approximately 150 secondary indicators that provide timely, comprehensive data to identify the broad health needs faced by a community. However, there are some limitations with regard to these data, as is true with any secondary data. Some data were only available at a county level, making an assessment of health needs at a neighborhood level challenging. Furthermore, disaggregated data around age, ethnicity, race, and gender are not available for all data indicators, which limited the ability to examine disparities of health within the community. Lastly, data are not always collected on a yearly basis, meaning that some data are several years old.
Due to scheduling difficulties, a few key informant interviewees were accommodated with phone interviews. As face-to-face interviews allowed for voice recording for comprehensive note-taking, with a phone interview, the interviewer was limited to recording the key points of the interviews.
Lastly, information was gathered from special populations such as the medically underserved, low-income, and minority populations.
VI. IDENTIFICATION AND PRIORITIZATION OF COMMUNITY HEALTH NEEDS: PROCESS AND KEY FINDINGS
A. Identifying Community Health Needs
i. Definition of Health Need
For the purposes of the CHNA, Kaiser Permanente defines a “health need” as a health outcome and/or the related conditions that contribute to a defined health need. Health needs are identified by the comprehensive identification, interpretation, and analysis of a robust set of primary and secondary data.
ii. Criteria and analytical methods used to identify the community health needs
In order to retain and emphasize the community’s perspectives, identification and prioritization of health needs occurred concurrently with primary data collection as participants were asked to rank the health
29
needs based on importance (highest to lowest priority). A rigorous two-step process that utilized several criteria (elaborated in section B below) was conducted to first prioritize the top 10 health needs for each service area. The 17 health needs for West San Fernando Valley and 14 health needs for Ventura County were condensed to 10 health needs each. The two lists were then combined and prioritized for the final 10 health needs for the entire medical center’s service area.
B. Process and criteria used for prioritization of the health needs
Prioritization of the health needs was informed by the rank order provided by community members during the primary data collection process (surveys, focus groups, forums, and interviews). Contributors include: community residents and parents, medically underserved and low-income minority groups, farm workers, youth, transitional housing populations, business leaders, higher institution educators, public health experts and medical professionals. The score value provided to each health need during the identification and pre-prioritization process determined the list of health needs for Ventura County (14) and West San Fernando Valley (17).
Following the development of the health needs list for each area, the CHNA team and the KFH-Woodland Hills medical and community benefit staff participated in a meeting to review the data and establish criteria points for the prioritization of the health needs. During the meeting, the following criteria was established and used to determine the prioritization order of the health needs:
1. Benchmarking: The health issue’s rate is compared to state, national and regional levels to determine if the need, meets or exceeds the benchmark.
2. Disparities exist: Disparities exist impacting certain populations by looking at ethnic, gender and lack of insurance. Each health need received a score of 0 if the disparity does not exist and 1 if the disparity does exist.
3. Time-trend analysis: The health need is getting worse over time (entails comparing current secondary data for each service area to the 2013 secondary data). Score was determined as follows: 0 if the health needs has improved; 1 if no change is noted and 2 if it has worsened.
4. Defined as a health need: The health need meets Kaiser Permanente’s definition: scored 0 for “No” and 1 for “Yes”
5. Community Concern: The health issue received a score, meaning it was mentioned as a health need during the primary data gathering process.
The CHNA team applied the five-criteria points to each health need identified during the pre-prioritization process and combined the scores from each area to determine the total score for each health need. The top 10 health needs were ranked as the health needs for KFH-Woodland Hills Medical Center and are listed in section VI.C. ii. The list also includes the breakdown of how the health needs ranked for each service area.
C. Prioritized description of all the community health needs identified through the CHNA
i. Community Health Landscape and Trends
This section describes the health outcomes and important determinants (drivers) of health in the community. The list of significant health outcomes and drivers listed in this section is determined by the secondary and primary data collection and analysis (as described in Section V). In some cases, the secondary data did not indicate the health need as “significant” meaning that the secondary data demonstrated that the health need was meeting the state benchmark or doing better than the state’s rate. When this was the case, primary data results and/or corroborating secondary data showing that the rate of the health issue was getting worse over time, determined if the health need was defined as a significant health need. It should be noted that for the KFH-Woodland Hills service area, secondary
30
data demonstrated that when the health need exceeded the state benchmark, it was by a slight margin. The health needs and drivers that significantly exceeded state levels were for shortage of oral health providers (by 18.05%), breastfeeding (by 5.50%), rate of fast food restaurants (by a rate of 5.87 more points) and assisted housing (by a rate of 8.72 more points). Therefore some health needs’ rates are lower than the state’s rate, but still considered to be significant health needs.
a. Significant Morbidity and Mortality (Health Outcomes)
To determine the list of significant health outcomes for KFH-Woodland Hills, mortality and morbidity data from the Los Angeles County mortality and morbidity report and California Department of Public Health (CDPH) death profile data for the area and the hospital admissions report from the Office of Statewide Health Planning and Development (OSHPD) were analyzed. Across the board, cardiovascular and circulatory related diseases, cancers and stroke were the leading health issues for the medical center service area.
Among the list of significant health outcomes determined for all the service areas (KFH-Woodland Hills, West San Fernando Valley and Ventura County) are cancers, adult obesity, heart disease, infant mortality, and deaths by motor vehicle accidents.
Cancers: Although the death rate for cancer in all three areas are much lower than that of California, the chart below indicates an ethnic disparity with a higher rate among the White, African American, and Native Hawaiian/Pacific Islander subpopulations. There is also an indication that the KFH-Service area has more cases of breast cancer when compared to the state. However, the rates are slightly lower for prostate, lung, and colon and rectum. Cervical cancer rates are mainly high in West San Fernando.
Source: University of Missouri, Center for Applied Research and Environmental Systems. California Department of Public Health, CDPH - Death Public Use Data. 2010-12. Source geography: ZIP Code
16
1.2
3 205.4
2
74.6
4 113.3
2
218.2
44.8
3
105.1
5
163.3
7 210.0
3
71.8
5
118.9
3
208.1
3
45.0
4
104.2
1158.4
7
177.8
5
78
.8 96.8
243.1
44.5
107.0
6
170.7
8
208.2
3
93
119.7
7
192.3
6
72.9
9 108.3
9
N O N - H I S P A N I C W H I T E
A F R I C A N A M E R I C A N
A S I A N N A T I V E A M E R I C A N /
A L A S K A N N A T I V E
N A T I V E H A W A I I A N /
P A C I F I C I S L A N D E R
M U L T I P L E R A C E
H I S P A N I C O R L A T I N O
C AN C E R M O R TAL I TY , AG E - AD J U S TE D R ATE ( P E R 1 0 0 , 0 0 0 P O P U L ATI O N ) B Y R AC E / E TH N I C I TY
KFH Woodland Hills Area West San Fernando Valley Ventura County California
31
Source: National Institutes of Health, National Cancer Institute, Surveillance, Epidemiology, and End Results Program. State Cancer Profiles. 2008-12. Source geography: County
Adult Overweight: Across the KFH-Woodland Hills service area, there are more overweight adults that may indicate poor lifestyle behaviors and/or limited resources to encourage healthy eating and physical activity.
KFH-Woodland Hills Service Area
West San Fernando Valley
Ventura County Service Area
California
Percent Adults Overweight, ≥18 Years
36.1% 36.1% 36.3% 35.8%
Heart Disease and stroke: The percentage rate of heart disease for KFH-Woodland Hills (36.1%) is slightly higher than the state’s rate of 35.8%. While not a notable significant health outcome, the rate of overweight adults in the area has been increasing over time. Overweight is a precursor to diabetes, hypertension, heart disease and stroke.
Cancer Incidence Rates, Age-Adjusted (Per 100,000 Population)
California Ventura County West San Fernando Valley KFH Woodland Hills Area
32
Infant Mortality: Death rates among infants less than one year old in the medical center service area are slightly higher than the state’s rate. However, this rate is below the Healthy People 2020 benchmark. Infant mortality may indicate low access to healthcare that may be due to a lack of health insurance, and/or high poverty and unemployment rates for the area.
Motor Vehicle Crashes: High rates of deaths due to motor vehicle accidents may restrict community members from having active lifestyles due to poor safety. Motor vehicle deaths are higher in the KFH-Woodland Hills service area compared to the state.
KFH-Woodland Hills Service Area
West San Fernando Valley
Ventura County Service Area
California
Death Rate Due to Motor Vehicle Crashes, Age-Adjusted (Per 100,000 Population) HP2020 = ≤12.4
6.08 5.58 6.53 5.18
b. Significant Health Drivers
Health drivers can be clinical, social, environmental and behavioral indicators that contribute to health inequities and health outcomes in an area. The KFH-Woodland Hills CHNA team reviewed secondary and primary data for the associated indicators for each health need identified to determine the health drivers for the medical center’s service area
i. Access to Care
In the KFH-Woodland Hills service area, individuals have low access to primary care and dental providers when compared to the state. Access to routine and consistent healthcare is an important determinant of health. It is critical not only for early detection and treatment of illnesses but also to access preventive measures including physical examinations, immunizations, screenings and health education.
KFH-Woodland
Hills Service Area
West San Fernando Valley
Ventura County
Service Area
California
Primary Care Physicians Rate (Per 100,000 population)
72.8 72.5 73.4 77.2
Percent of Population Without a Regular Doctor
16.1% 16.4% 15.7% 14.3%
Percent of Population Living in a Dental Health Professional Service Area
22.98% 0% 41.58% 4.93%
Due to low and inconsistent access to health providers, fewer residents of the service area than California receive recommended screenings for cancers and pneumonia thereby increasing the risk for poor health outcomes.
33
KFH-Woodland
Hills Service Area
West San Fernando Valley
Ventura County
Service Area
California
Percent Female Medical Enrollees with Mammogram in Past 2 Years, ≥67 Years
58.4% 57% 60.5% 59.3%
Percent Adult Females with Regular Pap Test (Age-adjusted), ≥ 18 Years
74.5% 76.4% 71.5% 78.3%
Percent Adults Screened for Colon Cancer (Age-Adjusted), ≥ 50 Years
56.4% 55.5% 58.1% 57.9%
Percent Adults Never Screened for HIV/AIDS, 18-70 Years
64% 61% 69.20% 60.83%
Percent Population with Pneumonia Vaccination (Age-Adjusted), ≥65 Years
61.9% 61.1% 63.3% 63.4%
ii. Health Behaviors
Health behaviors can directly affect health outcomes. Health behaviors such as physical activity and healthy eating can lower the risk of conditions like heart disease, diabetes, and some cancers. Secondary data, illustrated below indicates that compared to California, the population of the KFH-Woodland Hills service areas are less likely to practice behaviors that reduce the risk for chronic diseases.
KFH-Woodland Hills Service
Area
West San Fernando Valley
Ventura County
Service Area
California
Percent Adult to Consume ≤5 Servings of Fruits and Vegetables Daily, ≥18 Years
71.6% 72.1% 70.7% 71.5%
Percent Youth to Consume ≤5 Servings of Fruits and Vegetables Daily, 2-13 Years
52.3% 49.3% 57.6% 47.4%
Percent of Mothers Who Breastfeed Exclusively During Their Postpartum Hospital Stay
59.3% 57.1% 63.7% 64.8%
Percent Adults with No Leisure Time Physical Activity, Age ≥20
16.8% 17% 16.4% 16.6%
Percent of Worker Commuting to Work by Car Alone
76.04% 76.56% 76.54% 73.25%
Percent of Population Walking or Biking to Work
2.71% 2.65% 2.63% 3.84%
Percent of Adults with High Blood Pressure Not Taking Their Medication, ≥18 Years
31.8% 32.1% 31.4% 30.3%
34
iii. Physical Environment
According to the World Health Organization (WHO), the physical environment is one of the factors that affect the health of individuals and communities. Physical environments encompass safe water, clean air, healthy workplaces, safe housing and roads.
The physical environment of the KFH-Woodland Hills service areas raises the likelihood of conditions such as obesity and related conditions, cancers, asthma, and mental health distress due to lower access to nutritious foods, higher chances of alcohol and tobacco use, poor air quality and education, and housing instability.
KFH-Woodland
Hills Service Area
West San Fernando Valley
Ventura County
Service Area
California
Grocery Store Rate (Per 100,000 Pop.)
21.39 20.63 21.38 21.51
Liquor Store Rate (Per 100,000 Pop.)
13.73 13.52 14.82 10.02
Percent of Weeks in Drought (Population-Weighted)
95.43% 95.44% 95.48% 92.81%
Percent Area Covered by Tree Canopy (Population-Weighted)
9.8% 11.02% 5.58% 15.13%
Total Road Network Density (Road Miles Per Acre)
5.21 6.54 2.18 2.02
Head Start Program Facilities Rate (Per 10,000 Children Under Age 5)
3.11 1.59 3.98 6.34
HUD-Assisted Housing Units Rate (Per 10,000 Housing Units)
377.06 402.12 329.68 368.32
iv. Socioeconomic Factors
A higher percentage of children in the KFH-Woodland Hills service areas whose families do not qualify for food assistance programs are likely to have limited or uncertain access to adequate foods. The Supplemental Nutrition Assistance Program (SNAP) and Temporary Assistance for Needy Families (TANF) help improve access to nutritious foods. However, children whose families have been cut from SNAP or TANF when their income exceeds eligibility limits are likely to experience child food insecurity.
KFH-Woodland Hills Service
Area
West San Fernando Valley
Ventura County
Service Area
California
Percent of Food Insecure Children Ineligible for Assistance Programs, ≤18 Years
33% 30% 38% 29%
ii. Prioritized list of health needs
Even though there are health needs shared by both the Ventura County and West San Fernando Valley, each area differs in how they prioritized each health need. Comprehensive health need profiles for the top 10 most significant health needs for the service area of KFH-Woodland Hills Medical Center are located in Appendix C. The table below displays the list of the health needs and how they ranked for the medical center service area and each sub-service area. The health needs are also compared with the prioritized health needs for the 2013 CHNA in order to show which health needs remain a priority over the three years.
35
Health Needs KFH-Woodland Hills Medical Center Rank
West San Fernando
Valley Rank
Ventura County
Service Area Rank
Prioritized in 2013 CHNA
Overweight/Obesity (Adults) 1 1 1 Yes
Diabetes 2 2 3 Yes
Mental Health 3 3 9 No
Substance Use and Abuse 4 6 2 No
Economic Security (Unemployment and Poverty)
5 5 4 No
Access to Primary Healthcare 6 9 6 Yes
Cancers 7 4 5 No
Heart Disease 8 8 No
Dental Health 9 10 Yes
Affordable Housing and Homelessness
10 7 No
Diabetes and Obesity/Overweight (Adults and Youth): Diabetes and overweight obesity are highly associated with each other. Increased body fat raises the risk for type 2 diabetes. The prevalence of diabetes in the KFH-Woodland Hills service area at 7.60% is slightly less than that of the state at 8.05% indicating that efforts toward reducing this health condition may be paying off. However, within the medical center’s service area West San Fernando Valley has a higher percentage of diabetes, 7.90%, than Ventura County at 7%. And across all geographic areas, men are more likely than women to be diagnosed with diabetes.
Source: Centers for Disease Control and Prevention, National Center for Chronic Disease Prevention and Health Promotion. 2012. Source geography: County
As a health problem and driver for diabetes, overweight/obesity is a problem in the KFH-Woodland Hills service area. Reflecting the nation’s statistics, more than one third of adults (36.1%) in the medical center’s service area are overweight, slightly more than California (35.8%). Within the medical center service area gender and ethnic differences exist with 21.64% of men compared to 19.28% of women being obese, a trend reflected in West San Fernando Valley and Ventura County.
KFH-Woodland Hills Area
West San Fernando Valley
Ventura County California
Percent Adults Overweight, ≥18 Years
36.1% 36.1% 36.3% 35.8%
Source: Centers for Disease Control and Prevention, Behavioral Risk Factor Surveillance System. Additional data analysis by CARES. 2011-12. Source geography: County
KFH-Woodland Hills Service Area
West San Fernando Valley Service Area
Ventura County
Los Angeles County
California
7.60%
7.90%
7%
8.40%
8.05%
Population with Diagnosed Diabetes, Age-Adjusted Rate
Population with Diagnosed Diabetes, Age-Adjusted Rate
36
Health drivers for diabetes and overweight/obesity are reflective of eating habits and active living. Adults and youth in the medical center service area tend to consume less than the recommended daily servings of 5 fruits and vegetables. The rate of grocery stores may indicate the availability and accessibility of fresh food in the KFH-Woodland Hills service area and the ability of community residents to purchase and consume fruits and vegetables. In West San Fernando Valley, there are 20.63 grocery stores per 100,000 population and 21.38 grocery stores in Ventura County per 100,000 population compared to the state’s 21.51 grocery stores per 100,000 population. The situation is worsened by the high number of fast food restaurants per 100,000 population, particularly in West San Fernando Valley at 85.17 restaurants as opposed to 73.36 restaurants in Ventura County. Physical inactivity is lower among the KFH-Woodland Hills service area adults at 16.8% than the state at 16.6%. Furthermore, the KFH-Woodland Hills service area adults are less likely to incorporate physical activity into daily routines since 2.71% as opposed to the state’s 3.84% are likely to walk or bike to work.
Many of the community’s input with regards to overweight/obesity and diabetes are due to little access to parks, exercise programs and recreational facilities. To address this, the community asks for more open green spaces, more exercise equipment to be installed in parks that are accessible to the public as well as free exercise classes, such as walking and Zumba to encourage physical activity. Additionally, community based organizations are asked to send role models that resemble the community as champions for healthy lifestyles to encourage residents to change. Participants also point out that lack of accessible transportation to parks and recreation facilities limits physical activity and that there are not enough farmers markets in their communities. Furthermore, according to community members, the free/reduced lunches served to children at schools have low nutritional values thus increasing the likelihood of obesity among youth who may grow to be obese adults. Community members, therefore, ask that healthy cooking options be taught to parents through television commercials. To address diabetes, participants request that chronic disease self-management workshops be embedded within their neighborhoods so as to make it easier to access them.
Mental Health: Mental illness as a concern is more prominent in West San Fernando Valley as 14.20% of Medicare beneficiaries are diagnosed with depression than Ventura County (13%) and in the state (13.4%). Along the same line, a higher percentage of West San Fernando Valley adults (16.60%) than Ventura County (13.90%) and the state (15.90%) report needing mental health care within a one-year period.
Suicide has been linked to poor mental health. In the KFH-Woodland Hills service area and California Non-Hispanic Whites have a higher suicide rate compared to other ethnicities which may indicate a higher rate of poor mental health. This finding is consistent across all geographic locations. The key driver identified for poor mental health in the medical center service area is inadequate social or emotional support which is reported more among West San Fernando Valley adults (26.4%) than Ventura County (22.6%) and California (24.6%).
37
Source: University of Missouri, Center for Applied Research and Environmental Systems. California Department of Public Health, CDPH - Death Public Use Data. 2010-12. Source geography: ZIP Code
Stress related to day-to-day survival is noted as a big contributor to mental health in the community. Community residents are plagued with financial and job insecurity, unstable housing situations due to high rents and mortgages, concealing undocumented immigration statuses, and poor insurance coverage which in many cases does not cover mental health. Furthermore, societal perception and stigma that mental health is a character weakness discourages residents from seeking help. System-wise, the health system is complicated to navigate and as such residents have difficulty setting up and keeping appointments. Participants suggest that addressing issues related to economic security as well as increasing funds for programs that provide mental health support are likely options to address the mental health need in their community.
Substance Use and Abuse: Community members in Ventura County prioritized substance use and abuse as a health need than West San Fernando Valley. Data indicate that excessive consumption of alcohol is a problem in Ventura County service area with 17.7% of adults drinking excessively. This is higher than the medical center service area (16.6%), West San Fernando Valley (16%) and California (17.2%). The key driver identified for the high alcohol expense is the higher access to liquor stores. Compared to California’s 10.02 liquor stores per 100,000 population, the medical center service area is more saturated with liquor stores with 13.73 liquor stores per 100,000 population. Supporting the high consumption of alcohol, Ventura County service area has more liquor stores at 14.12 per 100,000 population than West San Fernando Valley with 13.52 liquor stores per 100,000 population.
Number of Liquor Stores per 100,000 Population
KFH-Woodland Hills Area West San Fernando Valley
Ventura County
Los Angeles County
California
13.73 13.52 14.82 11.41 10.02
Source: US Census Bureau, County Business Patterns. Additional data analysis by CARES. 2012. Source geography: ZCTA
Both service areas’ community participants indicate that residents are routinely exposed to drug and alcohol messages in their neighborhoods. They believe the situation is further exacerbated by low opportunities for employment and quality education that increase financial constraints thereby
13.92
6.23
9.63
5.69
2.95
4.42
3.13
14.7
8.3
12.8
5.4
0
4.9
2.9
13.31
5.89
7.5
5.79
4.15 4.123.24
14.8
6.366.82
5.9
9.68
5.84
4.04
Non-HispanicWhite
African American Asian Native American /Alaskan Native
Native Hawaiian /Pacific Islander
Multiple Race Hispanic or Latino
Suicide Mortality (Per 100,000 Population) by Race/Ethnicity
KFH-Woodland Hills Service Area West Ventura County (Service Area) Woodland Hills (Service Area) California
38
contributing to daily stress. As such, these stresses can result in mental health issues which “can contribute to drug use because individuals use drugs to self-medicate”. To address this need, community members call for a program that cohesively and comprehensively addresses multiple physical and mental health needs in addition to substance use disorders that is integrated into an individual’s primary health care.
Economic Security: For the purpose of this CHNA, economic security includes unemployment and poverty rates. Studies suggest that loss of job and economic distress decrease mental and physical health and reduce health insurance affordability. As such, many people forgo health care for basic needs. Although secondary data indicates that the KFH-Woodland Hills service area is performing much better than the state in terms of poverty rate and unemployment rates, the community states that these two factors continue to influence their overall health status.
The unemployment rate for KFH-Woodland Hills is slightly lower (6.7%) than the state (6.8%) with West San Fernando exceeding the state at 7.1% and Ventura County’s rate of 6.2%.
Lack of economic security can influence an individual’s ability to access and afford healthcare, food, and education. The inability for an individual to afford daily living expenses can result in chronic stress, which may lead to poor health outcomes including, mental health, heart disease and digestive problems. For example, in the KFH-Woodland Hills service area 15.70% percent of adults report poor mental health compared to the state rate of 15.90%. West San Fernando Valley surpasses the state at 16.60% and Ventura County’s 13.90%. Heart disease rates are also slightly higher in KFH-Woodland Hills than the state, 6.40% vs. 6.30%. Ventura County has higher rates of heart disease than all areas at 7%.
Aside from poor health outcomes related to lack of economic security, limited access to health care and food are evident in the medical center service area. Many residents do not have a regular doctor in the KFH-Woodland Hills service area. Compared to the state (14.30%), 16.10% of adults in KFH-Woodland Hills do not have a consistent source of primary care with a higher rate in West San Fernando Valley (16.40%) than Ventura County (15.70%). This lack of consistent care may indicate lack of insurance due to inability to afford costs. And although, there are fewer uninsured people in the medical center service area (15.41%) than the state (16.69%), the rate is far from meeting the Healthy People 2020 goal of zero percent uninsured. Within the medical center service area, Ventura County has a higher uninsured population at 15.18% than West San Fernando Valley at 13.85%. Hispanic/Latinos, more than other races are more likely to be uninsured at 26.13% in the KFH-Woodland Hills service area compared to 25.90% Hispanic/Latinos in the state.
Poverty rate is indicated by the fact that between 2004 and 2011, more people in the medical center service area than the state have consistently received food assistance through the USDA supplemental nutrition assistance program (SNAP) to access healthy food and reduce food insecurity.
39
Source: US Census Bureau, Small Area Income Poverty Estimates. 2011. Source geography: County
Additionally, data indicates an estimated 14% of American household were food insecure at some time during 2014 meaning they lacked access to enough food for an active, healthy life for all household members. These include children. A high rate of children who are food insecure and ineligible for assistance reside in the medical center service area at 33% as opposed to 29% at the state level. Of these 33 percent, 30% reside in West San Fernando Valley and 38% in Ventura County.
Education is another driver for economic security. Education is known to lead to better jobs and higher education. Additionally, research shows that individuals with higher education live longer and healthier lives than those less educated and the same applies to their children. Among the range of the services offered through the Head Start program is education for children three to five years old from low-income households to help children grow intellectually, socially and emotionally. There are less than half the Head Start program facilities in the KFH-Woodland Hills area (3.11 per 10,000 children under the age of 5) than the state (6.34 per 10,000 children). There are significantly fewer facilities in West San Fernando (1.59 per 10,000 children) compared with 3.98 per 10,000 in Ventura County.
Community members indicate that unemployment is a major problem for them especially as it relates to their socio-economic status and ability to afford housing and access community resources. They call for increased selection of jobs available within the community. Of particular note, key informant interviewees point out that there is a need to increase quality education attainment in order to increase job and economic opportunities for residents. In order to accomplish this, community stakeholders emphasize support for parents during their children’s early childhood development because verbal, learning and communication skills are learned by the age of 5, well before schooling begins. Additionally, community leaders call for the engagement of non-traditional stakeholders such as businesses, city officials and education-focused non-profit organizations to increase education attainment.
Access to Primary Healthcare: Access to primary care is a key determinant of health that exposes individuals to preventive measures and disease management thereby reducing the likelihood of hospitalizations and emergency room admissions. In the KFH-Woodland Hills service area, there are 77.71 emergency room admissions per 10,000 population due to preventable causes. It is higher in West San Fernando service area (77.05 per 10,000 population) than Ventura County (63.35 per 10,000 population).
This health need is highly associated with the number of physicians within a community. A significantly
0.00%
5.00%
10.00%
15.00%
20.00%
25.00%
2004 2005 2006 2007 2008 2009 2010 2011
Percent Population Receiving SNAP Benefits by Year, 2004-2011
KFH-Woodland Hills Service Area California
40
lower number of primary care physicians are present in the KFH-Woodland Hills service area at 72.8 physicians per 100,000 population compared to 77.2 per 100,000 population for the state. More so, West San Fernando Valley has fewer physicians (72.5 per 100,000) than Ventura County (73.4 per 100,000). Due to the low number of physicians, more of the medical center’s service area adults report not having a regular doctor, with 16.10% compared to the state’s 14.30%. This is more pronounced in West San Fernando Valley (16.40%) than Ventura County (15.70%). Across all the geographic locations, men are more likely to have no consistent primary care provider than women and Latinos are more likely than other ethnicities to have no consistent primary care provider. As a result, the first line of medical care is likely to be in emergency rooms and admissions into the hospital for preventable conditions are likely to be high in the service area.
On a positive note, the number of primary care physicians in the medical center service area has increased over a ten-year period, particularly around 2010. This change is likely attributable to the Affordable Care Act that was passed in 2010 to increase access to health care services, especially preventive services, to low-income individuals and households.
Source: US Department of Health Human Services, Health Resources and Services Administration, Area Health
Resource File. 2012. Source geography: County
For both service areas, navigation of the health system is a barrier for the communities’ access to healthcare. One community member stated: “It is stressful when someone is trying to get healthcare services and is having difficulty navigating the system”. Some of the reasons for poor system navigation include the difficulty to set up appointments, inability of the health personnel to speak the patients’ language and limited referrals for Medi-Cal patients. Furthermore, lack of insurance, transportation and finances prevent residents from seeking healthcare. Many residents work long hours and therefore are unable to make appointments during regular clinic hours. Therefore residents request for extended clinic weekday and weekend hours and an increase in the number of available clinics to reduce wait time, particularly federally qualified health centers as these clinics are easier to maneuver particularly for the uninsured and undocumented person. Furthermore, healthcare centers and clinics are encouraged to take services to the community in place of people going to the facilities through consistent mobile services and health fairs.
Cancers: Cancers are also health issues identified by the residents of the KFH-Woodland Hills service area. In particular, they mentioned breast, lung, prostate cancers, and colon and rectum. Aside from
Access to Primary Care Physicians Per 100,000 Population by Year 2002-2012
KFH-Woodland Hills Service Area West San Fernando Valley
Los Angeles County Ventura County
California
41
breast cancer, there are fewer new cases of the remaining cancers compared to the state. While new cases of breast, lung and prostate cancers are higher in Ventura County, colon and rectum cancer rates at 40.3 cases per 100,000 population are higher in West San Fernando Valley even exceeding the California’s 40 per 100,000 population.
New Cases of Cancer per 100,000 population, Age-Adjusted
KFH-Woodland Hills Service Area
West San Fernando Valley
Ventura County
Los Angeles County
California
Breast Cancer 126.2 122.5 132.8 116.9 122.1
Lung 42.2 42 42.7 41.6 48
Prostate 123.9 123.2 125.2 122 126.9
Colon and rectum HP2020 = ≤ 38.7
39.6 40.3 38.4 41.3 40
In relation to cancer deaths, disparities exist within the medical center service area. Overall, Native Hawaiians/Pacific Islanders are more likely to die from cancer at 218.2 deaths per 100,000 population, followed by African Americans at 205.42 deaths per 100,000 population. However, within each cancer type, African Americans tend to have worse outcomes than other ethnic groups with a higher death rate.
Alcohol consumption is associated with breast and colon and rectum cancers. There is high access to alcohol in the medical service area at 13.73 liquor stores per 100,000 population than the state at 10.02 stores per 100,000 population. A particular driver that stands out specifically for West San Fernando Valley is the low percentage of people screened for cancer. Fifty-seven percent of women have been screened for breast cancer with a mammogram and 56.4% of the medical center service area population has been screened for colon and rectum cancer as opposed to the state (57.9%).
Number of Liquor Stores per 100,000 Population
KFH-Woodland Hills Area
West San Fernando Valley
Ventura County Los Angeles County
California
13.73 13.52 14.82 11.41 10.02
Source: US Census Bureau, County Business Patterns. Additional data analysis by CARES. 2012. Source geography: ZCTA
Again, community members corroborate the findings that cancers are a big problem for them. Health behaviors related to tobacco use, lack of nutritious foods and physical activity are common drivers for both service areas indicating a need to target lifestyle choices. It is also noted that lack of insurance is a contributor to low screenings as people have less access to primary care providers. Ventura County, as an agricultural setting, is plagued with pesticide issues and there are concerns that pesticide exposure are contributing to the cancer cases. Farm workers point out that proper protective equipment is not always provided to them.
Heart Disease: Heart disease has consistently been a leading cause of death in the United States. Therefore, it is not surprising that it is prioritized as a health need in the medical center service area as 6.40% of adults in the KFH-Woodland Hills Medical Center service area are diagnosed with heart disease compared to the state’s 6.30%. However within ethnic groups, there are more deaths among Native Hawaiians/Pacific Islanders at 275.33 per 100,000 population and African Americans at 253.12 per 100,000 population in the medical center service area which may be due to poor management. Physical inactivity among adults, high access to liquor stores and poor management of high blood pressure are significant drivers associated with heart disease in the service area.
Community members stated that physical activity is limited due to unsafe environmental conditions
42
such as poor lighting as well as low access to parks and recreational facilities. Furthermore, there is need to share information more with residents about health fairs so that they can receive free screenings and information. However, some members pointed out that health fairs tend to be too far away thereby making transportation an added issue of access to services. It is therefore necessary that health fairs, services and chronic disease self-management programs be entrenched within the neighborhoods to increase accessibility.
Dental Health: Dental health is a key contributor to overall health status. Poor oral health can complicate an individual’s health conditions and limit effectiveness of therapeutic measures. A higher percentage of adults in West San Fernando Valley (10.60%) than Ventura County (8.60%) report poor dental health, having six or more their permanent teeth removed due to tooth decay, gum disease or infection.
In the KFH-Woodland Hills service area, residents are more likely to have no dental insurance coverage than the state (40.90%) with a higher rate in West San Fernando Valley of 42.60% than Ventura County at 39.20%. Furthermore, adults in West San Fernando Valley at 30.60% are less likely to visit a dental provider for oral examination than Ventura County at 22.90%. Of particular importance to adults in Ventura County is the lack of access to dental providers. A surprising 41.58% live in areas with inadequate presence of dental providers compared to zero percent in West San Fernando and 22.98% in the medical center service area, and significantly higher than the state’s 4.93%.
Lack of dental insurance and transportation are notable barriers to accessing dental services in both West San Fernando Valley and Ventura County. Participants, therefore, call for transportation assistance particularly for emergency dental services as well as increased dental coverage. Additionally, community members mention that many residents tend to consume unhealthy foods which include high sugar intake that can cause dental problems. As an agricultural community, Ventura County faces a unique problem in that water may be unpurified for some populations such as farm workers thereby decreasing the likelihood of drinking fluoridated water.
Affordable Housing and Homelessness: Recent economic downturn worsened housing affordability for a large proportion of Americans and has not improved despite the federal government’s economic stimulus efforts according to the 2015 State of Homelessness in America Report. Many low-income people are at risk of homelessness despite the decrease in unemployment rate (7.4%) since poverty rates remain relatively stable (15.8%). Since 2007, the number of households with severe housing cost burden (paying more than 50% of income toward housing) has increase by 25% in the United States. Fortunately, the national rate of homelessness has decreased to 18.3 homeless people per 10,000 population, a change attributed to emphasis placed on permanent supportive housing and rapid re-housing as opposed to transitional housing and emergency shelters.
There has been significant decrease in the homeless population in Ventura County between 2013 and 2015 (20%) compared to service planning area 2 (SPA 2) or San Fernando Valley in which there is a 7% increase. Approximately 70% of the homeless in both service areas live on the streets and according to the 2015 homeless count in both service areas, men more than women are more likely to be homeless. Many subpopulations exist in the homeless community in the KFH-Woodland Hills service including those with mental illness (40.2% in San Fernando Valley and 20.6% in Ventura County) and substance abusers (26.9% in San Fernando Valley and 28.7% in Ventura County). Please note, subpopulation information presented for San Fernando Valley encompass both sheltered and unsheltered persons while those for Ventura County include unsheltered persons alone.
43
Homeless Count Results for Greater Los Angeles and Ventura Counties, 2015
San Fernando Valley Area*
Ventura County Los Angeles County
Total 5,216 1,417 44,359
On the streets 73.4% 67.5% 70%
In shelters 26.6% 32.5% 30%
Veterans 11.3% 9.1%** 10%
Mental Illness 40.2% 20.6%** 30%
Substance Abuse 26.9% 28.7%** 25%
Physical Disability 21.0% 29.8%** 20%
Have HIV/AIDS 1.7% 1.3%** 2%
Domestic Violence Experience 23.9% 19.6%** 21% Source: Los Angeles Homeless Services Authority Homeless Count, 2015. Source geography: Service Planning Area. *Note: No data was available solely for the Panorama City service area. San Fernando Valley (SPA 2) data is used as substitution. **These numbers do not include sheltered individuals
Affordability and quality of housing are drivers that stand out for the KFH-Woodland Hills service area as contributing to homelessness. In the medical center service area, 46.49% of households spend more than 30% of their income toward housing costs compared to 44.99% for California. More households in West San Fernando Valley (47.11%) than Ventura County (43.68%) exceed this 30% limit. Additionally, there are more HUD-funded assisted housing units in the medical center service area (377.06 per 10,000 households) than the state (368.32 per 10,000 households) indicating a large population of low-income households. Again, there are more HUD-funded housing units in West San Fernando Valley (402.12) than Ventura County (329.68).
Many households in the KFH-Woodland Hills service area also live in substandard conditions which consists of one of the following conditions: 1) lacking complete plumbing facilities, 2) lacking complete kitchen facilities, 3) with 1.01 or more occupants per room, 4) selected monthly owner costs as a percentage of household income greater than 30%, and 5) gross rent as a percentage of household income greater than 30%. Compared to the state (47.54%), 48.01% of housing units in the medical center service area are in substandard conditions with 48.07% in West San Fernando Valley versus 45.11% in Ventura County.
The unemployment rate in the medical center service area (6.7%) is relatively low compared to the state (6.8%). However, West San Fernando Valley rates (7.1%) exceeds both the state and Ventura County (6.2%) thereby indicating a higher risk for homelessness in the community.
Community leaders indicate that there is a lack of truly affordable housing. As such, housing insecurity and homelessness reduce quality of life and are barriers to people’s adherence to medical management plans. An inadequate system that lacks coordinated and timely responsive services in particular for families and mentally ill persons is held responsible for the high homelessness situation. Therefore, residents call for not only coordinated systems (including other services such as job assistance and training, mental health and substance abuse services, and primary health care) to house the homeless promptly and permanently. Additionally, community members call for an increase in secure housing units, rent freezes to limit rent increases and rent scales based on income and government supplements.
D. Community assets, capacities and resources potentially available to respond to the identified health needs
This section explores existing assets, capacities and resources that potentially could be utilized to
44
address the aforementioned health needs. Additionally, it is meant to inform strategic plans to address the prioritized health needs. Community assets or resources are anything that improves the quality of community life. These include community members, physical structures or places, businesses, collaborations and partnerships, and local organizations or institutions (private, public and nonprofit). While the narrative below broadly describes the assets and resources existing in the KFH-Woodland Hills service area, links to resources pertaining to each health need in West San Fernando Valley and Ventura County are listed in Appendix C. The resource lists are not meant to be comprehensive but to act as starting points to access further community assets.
i. Access to Care
Access to care relate to one’s ability to obtain preventive services and primary care services. This includes the number of available health care providers and eligibility for health insurance. The KFH-Woodland Hills service area consists of many hospitals and clinics that provide medical care and life-saving screenings as well as no/low-cost health programs for low-income and underserved populations. Solutions suggested by many focus groups members to improve access to care and enhance community knowledge of available resources is to utilize the promotora model to bring such information directly to people. Others suggest providing scheduled mobile services and health fairs within low-income communities to limit need to miss work and/or transportation issues. A few interviewees pointed out that there is a need for more federally qualified health centers that are better reimbursed for services rendered. Such facilities are more easily navigated by residents than medical centers, particularly for the uninsured. Integration of comprehensive, patient-centered services which includes mental, dental, and social services could be accomplished through the medical home model. Additionally, more medical providers are needed in the community.
Language is also an issue brought up through community input. Participants in Ventura County would like an increase in providers who speak their language and can understand their cultural backgrounds. Navigators who understand what patients are experiencing are suggested to fill this gap in order to not only help people maneuver the health system but also in a culturally-sensitive approach.
ii. Health Behaviors
Health behaviors play a big role in the maintenance of healthy lifestyles. An individual’s daily choices of consumption, level of activity and social interactions can determine their overall health outcomes. Programs and health education classes exist through hospitals and community-based organizations in the KFH-Woodland Hills service area to guide residents to modify their behaviors to live healthier lifestyles. Residents and community leaders indicate offering free preventive and disease management classes within the community would greatly enhance behavior change. People are willing to eat better and increase physical activity. However, many low-income community members cannot afford the classes available or find transportation to go. As a result, community members request that more green spaces be installed in their neighborhoods, exercise equipment that are accessible to the public to be installed in parks, and free exercise, cooking and disease management classes offered. If possible, cooking tips and lessons could be broadcasted during television commercials, frequent health fairs at local stores, churches, schools and businesses, and public service announcements (PSAs) on television or social media are proposed outlets to share information about diseases and community resources.
iii. Physical Environment
To combat obesity and related chronic health conditions, access to healthy foods and opportunities for physical activity are essential. Many farmer markets and grocery stores in the KFH-Woodland Hills service area provide fresh fruits and vegetables while parks and recreational facilities offer physical activity programs to suit all ages and budgets. The local hospitals, community-based clinics and county offer various preventive and disease management programs and services to community residents.
45
However, community members indicate that the current resources are not enough. More farmers markets are called for to improve eating habits, repair of broken sidewalks and installation exercise equipment in parks will improve community walkability. To address alcohol use, one suggestion is to restrict the number of retailers in an area and increased fees for liquor retailers.
iv. Socioeconomic Factors
Community members in the KFH-Woodland Hills service area mentioned lack of job opportunities, poor educational attainment and low household income as stressors affecting their ability to manage their health. Within the service area, many programs provide job training opportunities, continuing education and supplemental income. However, health professionals and leaders interviewed stressed the need for collaboration among different health, mental, social and government sectors to coordinate efforts, share resources and information and reduce barriers to services as related to education attainment particularly teaching people to recognize the connection between education attainment and health outcomes.
46
VII. KFH WOODLAND HILLS 2013 IMPLEMENTATION STRATEGY EVALUATION OF IMPACT
A. Purpose of 2013 Implementation Strategy evaluation of impact
KFH-Woodland Hills’s 2013 Implementation Strategy report was developed to identify activities to address health needs identified in the 2013 CHNA. This section of the CHNA Report describes and assesses the impact of these activities. For more information on KFH-Woodland Hills’s Implementation Strategy report, including the health needs identified in the facility’s 2013 service area, the health needs the facility chose to address, and the process and criteria used for developing Implementation Strategies, please visit https://share.kaiserpermanente.org/wp-content/uploads/2013/10/IS-Report-Woodland-Hills.pdf . For reference, the list below includes the 2013 CHNA health needs that were prioritized to be addressed by KFH-Woodland Hills in the 2013 Implementation strategy report.
1. Access to Care 2. Healthy Eating Active Living 3. Oral Health 4. Social and Emotional Support 5. Broader Health Care System Needs in Our Communities - Research and Workforce
KFH-Woodland Hills is monitoring and evaluating progress to date on their 2013 Implementation Strategies for the purpose of tracking the implementation of those strategies as well as to document the impact of those strategies in addressing selected CHNA health needs. Tracking metrics for each prioritized health need include the number of grants made, the number of dollars spent, the number of people reached/served, collaborations and partnerships, and KFH in-kind resources. In addition, KFH-Woodland Hills tracks outcomes, including behavior and health outcomes, as appropriate and where available.
As of the documentation of this CHNA Report in March 2016, KFH-Woodland Hills had evaluation of impact information on activities from 2014 and 2015. While not reflected in this report, KFH-Woodland Hills will continue to monitor impact for strategies implemented in 2016.
B. 2013 Implementation Strategy Evaluation of Impact Overview
In the 2013 IS process, all KFH planned for and drew on a broad array of resources and strategies to improve the health of communities and vulnerable populations, such as grant making, in-kind resources, collaborations and partnerships, as well as several internal KFH programs including, charitable health coverage programs, future health professional training programs, and research. Based on years 2014 and 2015, an overall summary of these strategies is below, followed by tables highlighting a subset of activities used to address each prioritized health need.
KFH Programs: From 2014-2015, KFH supported several health care and coverage, workforce training, and research programs to increase access to appropriate and effective health care services and address a wide range of specific community health needs, particularly impacting vulnerable populations. These programs included:
o Medicaid: Medicaid is a federal and state health coverage program for families and individuals with low incomes and limited financial resources. KFH provided services for Medicaid beneficiaries, both members and non-members.
o Medical Financial Assistance: The Medical Financial Assistance (MFA) program provides financial assistance for emergency and medically necessary services, medications, and supplies to patients with a demonstrated financial need. Eligibility is based on prescribed levels of income and expenses.
o Charitable Health Coverage: Charitable Health Coverage (CHC) programs provide health care coverage to low-income individuals and families who have no access to public or private health coverage programs.
o Workforce Training: Supporting a well-trained, culturally competent, and diverse health care workforce helps ensure access to high-quality care. This activity is also essential to making progress in the reduction of health care disparities that persist in most of our communities.
o Research: Deploying a wide range of research methods contributes to building general knowledge for improving health and health care services, including clinical research, health care services research, and epidemiological and translational studies on health care that are generalizable and broadly shared. Conducting high-quality health research and disseminating its findings increases awareness of the changing health needs of diverse communities, addresses health disparities, and improves effective health care delivery and health outcomes.
Grant-making: For 70 years, Kaiser Permanente has shown its commitment to improving Total Community Health through a variety of grants for charitable and community-based organizations. Successful grant applicants fit within funding priorities with work that examines social determinants of health and/or addresses the elimination of health disparities and inequities. From 2014-2015, KFH-Woodland Hills made 36 grant payments amounting to a total of $592,898 in service of 2013 health needs. Additionally, KFH-Woodland Hills has funded significant contributions to a donor advised fund (DAF), managed by the The California Community Foundation, in the interest of funding effective long-term, strategic community benefit initiatives. During 2014-2015, a portion of money managed by this foundation was used to support 42 grant payments totaling $4,949,638 in service of 2013 health needs. An illustrative list of active grants is provided in each health need section below.
In-Kind Resources: Kaiser Permanente’s commitment to Total Community Health means reaching out far beyond our membership to improve the health of our communities. Volunteerism, community service, and providing technical assistance and expertise to community partners are critical components of Kaiser Permanente’s approach to improving the health of all of our communities. From 2014-2015, KFH-Woodland Hills donated several in-kind resources in service of 2013 Implementation Strategies and health needs; an illustrative list is provided in each health need section below.
Collaborations and Partnerships: Kaiser Permanente has a long legacy of sharing its most valuable resources: its knowledge and talented professionals. By working together with partners (including nonprofit organizations, government entities, and academic institutions), these collaborations and partnerships can make a difference in promoting thriving communities that produce healthier, happier, more productive people. From 2014-2015, KFH-Woodland Hills engaged in
48
several partnerships and collaborations in service of 2013 Implementation Strategies and health needs; an illustrative list is provided in each health need section below.
C. 2013 Implementation Strategy Evaluation of Impact by Health Need
KFH-Woodland Hills Priority Health Need: Access to Care
Long-term Goal - Increase the number of individuals who have access to and receive appropriate health care services in the KFH-Woodland Hills service area.
Intermediate Goals - Increase health care coverage among vulnerable populations. - Improve timely access to needed medical care. - Reduce workforce shortages. - Increase the capacity of the safety net to serve uninsured and underinsured patients through the provision of KFH-Woodland Hills volunteer providers, in-kind donations, and financial resources
Access to Care KFH Administered Program Highlights
KFH Program Name
KFH Program Descriptions Results to Date
Medicaid Medicaid is a federal and state health coverage program for families and individuals with low incomes and limited financial resources. KFH provided services for Medicaid beneficiaries, both members and non-members.
In 2014, $5,117,835 was spent on the Medicaid program and 9,525 Medi-Cal managed care members were served
In 2015, $10,410,914 was spent on the Medicaid program and 12,449 Medi-Cal managed care members were served
Medical Financial Assistance
The Medical Financial Assistance (MFA) program provides financial assistance for emergency and medically necessary services, medications, and supplies to patients with a demonstrated financial need. Eligibility is based on prescribed levels of income and expenses.
In 2014, $5,161,102 was expended for 3,907 MFA recipients
In 2015, $3,855,542 was expended for 3,868 MFA
49
recipients
Charitable Health Coverage
Charitable Health Coverage (CHC) programs provide health care coverage to low-income individuals and families who have no access to public or private health coverage programs.
In 2014, $938,959 was spent on the CHC program and 2,003 individuals received CHC
In 2015, $743,948 was spent on the CHC program and 1,843 individuals received CHC
Access to Care Grant-Making Highlights
Grant-Making Snapshot During 2014-2015, there were 8 KFH grant payments, totaling $160,000, addressing the priority health need in the KFH-Woodland Hills service area. In addition, a portion of the money managed by a donor advised fund (DAF), the California Community Foundation, was used to support 19 grant payments, totaling $1,987,500; DAF grants are denoted by asterisks (*). Donor advised fund (DAF) grants may cover multiple KFH service areas and address multiple health needs. All grant amounts reflect the amount paid in 2014 or 2015 and may not be reflective of the total grant amount awarded.
Grantee Grant
Amount Project Description Results to Date
Albert Schweitzer Fellowship
$95,000* The Los Angeles Schweitzer Fellows Program is dedicated to developing a pipeline of emerging professionals with the skills and commitment necessary to address unmet health needs. Fellows’ health backgrounds include medicine, dentistry, and public health. They use professional training as well as support from faculty advisors at their schools to design and implement projects that address unmet community health needs. Each Fellow works with a site mentor to develop a plan of action, identify desired outcomes, and will meet frequently with the clients to assure that the services are tailored to their needs. This grant contributes toward the training and development of health professionals to better understand the needs of underserved clients and how to address their needs through various medical and non-medical interventions.
15 fellows and a development consultant is creating a three-year fund development plan to provide continued support for this year-long fellowship. The fund will support 200 hours of service, 100 hours spent face-to-face with underserved clients, and attendance at monthly meetings and retreats.
50
Grantee Grant
Amount Project Description Results to Date
Free Clinic Of Simi Valley
$200,000* The Under One Roof Capital Campaign will allow the Free Clinic of Simi Valley to consolidate its four services (medical, legal, counseling and dental) in one location, allowing for shared maintenance and reception.
The Free Clinic of Simi Valley will increase new patient visits by 850 and create a collaborative synergistic environment for the Free Clinic and its 14 nonprofit partners to better serve all the needs of individuals and families.
Community Partners
$512,500 * Please see description for the Specialty Care Initiative under Impact of Regional Initiatives.
Please see description for the Specialty Care Initiative under Impact of Regional Initiatives.
Community Clinics Health Network
$175,000* Please see description for the ALL HEART program under Impact of Regional Initiatives.
Please see description for the ALL HEART program under Impact of Regional Initiatives.
Hope Of The Valley Rescue Mission
$20,000 The Hope of the Valley Rescue Mission aims for homeless individuals, who are recovering from an illness or medical emergency to achieve the skills, tools and resources required for them to obtain and maintain a permanent living situation.
To date, the Mission has provided 387 health related referrals, 89 mental health referrals, and 144 permanent housing placements. Forty-two percent (42%) of those served have designated community clinics as their medical home.
Turning Point Foundation
$20,000 The Turning Point Foundation H2H Peer Health Navigator Project provides a peer health navigator to assist persons who are homeless and mentally ill to receive a physical health assessment, create a healthcare plan and access healthcare services and experience improved health outcomes.
To date, 229 clients have received health navigation services through street outreach and ongoing health care at local medical clinics. In addition, 86 clients have received Tuberculosis clearance, permitting them residency at local Shelters
51
Grantee Grant
Amount Project Description Results to Date
and Safe Havens. Sixty-nine (69) clients have received medical insurance allowing clients continued affordable access to health care services. Additionally, the project was able to provide 480 general health care appointments, 245 mental health appointments, 106 dental or optometry appointments, and 213 drug and alcohol treatment appointments were attended. This project successfully reduced emergency room visits, from 502 emergency services prior to being assigned a health navigator as compared to 83 after receiving supportive services.
CAREGIVERS Volunteers Assisting the Elderly
$20,000 CAREGIVERS aims to sustain in-home support and transportation services for more than 550 homebound seniors in Ventura County, focusing on expanding the free services for isolated, frail seniors so they may remain at home for as long as possible.
To date, CAREGIVERS has provided free access to healthcare through the provision of 288 "care packages" for 782 seniors throughout Ventura County. This included 38,528 hours of personal volunteer support for 494 seniors who are enrolled in Caregivers and served by 454 volunteers.
Westminster Free Clinic
$20,000 WFC partners with volunteer medical professionals, the local business community, and over 80 local high school student interns to provide free access to health screening, preventive services, mental health and chronic disease support for the uninsured population.
To date, WFC has served 1,582 unique patients from the underserved population with needed primary and/or specialty care medical services. In total,
52
Grantee Grant
Amount Project Description Results to Date
more than 12,629 services were provided. In the last year, 2,429 patients participated in our health education program, a 49% increase in participation from the year before with 649 of the participants being new patients. Last year, 225 individuals with diabetes or at risk for heart disease were tracked through our Corazones Sanos para Mi Familia (Healthy Hearts for my family) program and 52% have shown clinical improvements in their lab values. The Leaders of Change Weight Loss Program resulted in a total 115 participants successfully losing weight, decreasing the need for medications. The clinic provided 358 chiropractic services for back and neck issues, which helped the patients return to work.
Access to Care Collaboration/Partnership Highlights
Organization/Collaborative Name
Collaborative/Partnership Goal Results to Date
Maternal Child Adolescent Health Collaborative
The aim of this Collaborative is to improve healthcare accessibility, provide quality and coordination of care with cultural appropriateness.
To date the, the Collaborative has promoted the health of mothers and infants by improving access to prenatal care for low-income, at-risk pregnant women and by formulating an action plan based on gap areas that emerged including transitions, special populations, centralized information, healthcare provider practices, parent knowledge
53
Organization/Collaborative Name
Collaborative/Partnership Goal Results to Date
and support.
Ventura County Hospital and Health Department Collaborative
The goal of the Ventura County Children’s Oral Health Collaborative is to eliminate untreated tooth decay.
KFH-Woodland Hills staff helped to encourage participation of low income community residents in the development of a "Building Healthy Smiles Advocacy Tool Kit" in English and Spanish aimed at strengthening the system of oral health education and care in Ventura County.
Free Clinic Vaccine Partnership The Rotary Club of Thousand Oaks provides vaccines, administered by KFH - Woodland Hill’s staff at the Westminster Free Clinic and Food Share provides donated fruits and vegetables to those who are vaccinated.
To date, 734 vaccines were administered by KFH-Woodland Hill’s staff to children and adults at the Westminster Free Clinic.
This collaborative works to provide resources for community residents who need transportation assistance to their medical providers but cannot afford it.
KFH - Woodland Hills participated in the creation of a Mobility Management Mileage Reimbursement Program, a rider-centered program designed to reimburse mileage to drivers who drive seniors to medical appointments, making it easier for seniors to get around in Ventura County. The program reimburses senior riders at 35 cents a mile up to 100 miles a month based on need. The rider will then turn the reimbursements over to their drivers. The program is open to seniors who are 65 or older, reside in Ventura County, and have an interest in reimbursing someone for driving them.
Access to Care In-Kind Resources Highlights
Recipient Description of Contribution and Purpose/Goals
California State Board of KFH - Woodland optometrist Dr. Madhu Chawla was elected President of the California State Board of
54
Recipient Description of Contribution and Purpose/Goals
Optometry Optometry.
Community Clinics in the San Fernando Valley and Ventura County
An improvement project was designed with El Proyecto Del Barrio and All Care One Community Health Center to enhance the medical supply donation process utilizing Video Ethnography. This effort helped the KFH - Woodland Hills Supply Chain Department understand how community clinics prefer to pick up in-kind donations from the Woodland Hills Medical Center and utilize the items to care for their patients.
El Salvador Foundation Kaiser Permanente Woodland Hill’s Nursing staff organized blood pressure screenings and health education materials provided at this Navidad en el Valle (Christmas in the Valley) event.
Leisure Village Kaiser Permanente Woodland Hill’s Physicians and staff conducted health education seminars ranging from topics on topics as Cancer, Diabetes, Managing Medication, Fall Prevention, Parkinson’s, Alzheimer’s, Stroke, Joint Health and Mobility.
Ventura Education Partnership
Kaiser Permanente Woodland Hill’s physicians and medical staff coordinated sports physicals and vaccines for students as part of Summerfest.
Westminster Free Clinic Kaiser Permanente Woodland Hill’s physicians and medical staff created a vision clinic with eye exams, prescriptions and eye glasses.
Impact of Regional Initiatives Addressing Access to Care
In addition to the illustrated grants listed above, Kaiser Permanente designs Regional Health Initiatives that are implemented in one or more KFH service areas to address the priority health needs. These initiatives are multi-year investments that support policy, advocacy and/or system changes in communities, including support for clinic systems to enhance capacity, service provision and or coordination. Kaiser Permanente invests in external evaluation for Regional Health Initiatives, and where possible, the results to date will reflect the most recent evaluation findings.
ALL HEART - In 2006, Kaiser Permanente’s Southern California Community Benefit (KPSC CB) began the translation of KP’s evidence-based cardiovascular disease (CVD) risk-reduction program across the safety net organizations in Southern California through a program called ALL (Aspirin, Lisinopril, and Lipid lowering medications). As a result of receiving the James A. Vohs Award for Quality in 2011, Kaiser Permanente Southern California selected the Community Clinic Health Network (CCHN) to serve as a Project Office to further translate the ALL protocol across the Southern California Region. The program was renamed to ALL HEART (Heart Smart Diet, Exercise, Alcohol limits, Rx Medicine compliance, and Tobacco cessation) to include lifestyle measures that were
55
also included in this program. CCHN continues to enroll community health centers across Southern California into the ALL HEART Program. To date, KPSC CB has invested a total of six (6) grants, amounting to $1,220,000 to support this initiative. This current two year grant began in 2015 and the focus will be on the diabetic and/or hypertension population. The ALL HEART program will also continue its pilot projects around behavioral health integration and clinic to community linkages.
CCHN has exceeded reach targets for ALL HEART, reaching over 35,000 patients served by 14 health centers and 75 clinic sites in Southern California. Based on the results of an evaluation of a cohort of 11 health centers in San Diego County, ALL HEART has built health center capacity to successfully implement and institutionalize the ALL medication protocol and most participating health centers improved blood pressure control among their patients, potentially reducing the risks associated with cardiovascular disease. Furthermore, Health Centers built their capacity to engage in population health management and to align with other national initiatives, such as Patient Centered Medical Home (PCMH) and Meaningful Use. Successful implementation of ALL HEART was driven by several HEAL Center characteristics, including data & IT systems, dedicated staffing, leadership buy-in, quality improvement infrastructure, and adequate time and space.
Kaiser Permanente’s Building Clinic Capacity for Quality (BCCQ) initiative aims to improve the quality of health care provided to Southern Californians by enhancing the capacity of community clinics to implement Quality Improvement (QI) strategies that are supported by health information technology (HIT). The overall goals of BCCQ are to increase the capacity of participating community clinics and to advance community clinics’ implementation of HIT. In order to accomplish these goals, Kaiser Permanente funded a project office (Community Partners) to develop and implement a three series training program designed to reach clinics that were at different levels of QI experience and capacity. Additionally, the project office piloted the Proactive Office Encounter (POE) program to translate a promising practice from Kaiser Permanente to community clinics. POE is a model of planned care that uses clinical care guidelines, patient data, and team and practice organization to proactively ensure all patient needs are met. Clinics were recruited to participate in BCCQ in Los Angeles, Orange, and San Diego Counties. BCCQ also engaged with the Riverside County Health System by implementing a tailored program. To date, KPSC CB has invested a total of three (3) grants, amounting to $3,500,000 to support this initiative. (Note that this initiative continued to operate in 2014 and 2015, although no grant amounts were paid for these years).
Over 40 community clinics participated in this program and developed projects focused on improving areas such as cancer and LDL screening, patient wait times, diabetes self-management, no-show rates, scheduling and appointments, care team guidelines and protocols, and medication management (among others). To date, participating clinics have reported satisfactory progress against their stated project goals. Among clinics participating in POE, most are indicating improvements in areas such as clinic and operational outcomes, data, and ability to provide high quality pro-active care, including improved preventive health services.
Kaiser Permanente’s Specialty Care Initiative aims to increase access to healthcare services for the underserved through the development and enhancement of specialty care access. In order to achieve this goal, Kaiser Permanente funded technical assistance through Community Partners to implement a coalition approach, where various partners collaborated to develop and implement strategies tailored to their communities in Southern California. These strategies focused on instituting and enhancing
56
referral processes, building and expanding specialty care networks, increasing primary care physicians’ capacity, and utilizing care coordination in the safety net. This multi-year initiative was launched in 2007 and to date a total of over $4,953,000 were awarded and paid to community based agencies across Southern California to support specialty care access
The Ventura County Safety-Net Specialty Care Access Coalition improved referral systems by developing a new eReferral system for Ventura County (the Referral Center) and developing and implementing guidelines in many specialty areas to make more effective referrals. Further, they used data from the Referral Center to inform the Health Care Agency's recruiting efforts to help expand networks. The coalition was also able to support the implementation of telemedicine by creating the needed infrastructure and training medical assistants and specialists to use it for retinal screenings.
KFH-Woodland Hills Priority Health Need: Healthy Eating Active Living
Long-term Goal - Reduce obesity among residents in low socioeconomic areas within the KFH-Woodland Hills service area.
Intermediate Goals - Improved environments and policies resulting from community leaders’ advocacy efforts that make it easier for residents to eat healthy and be physically active in the KFH-Woodland Hills service area. - Increased opportunities for community residents in the KFH-Woodland Hills service area to advocate for healthier communities utilizing Kaiser Permanente-sponsored-tools. - Increased opportunities for community residents in the KFH-Woodland Hills service area to participate and engage in healthy eating and active living behaviors through Kaiser Permanente-sponsored programs.
Healthy Eating Active Living Grant-Making Highlights
Grant-Making Snapshot During 2014-2015, there were 6 KFH grant payments, totaling $96,580 addressing the priority health need in the KFH-Woodland Hills service area. In addition, a portion of the money managed by a donor advised fund (DAF), The California Community Foundation, was used to support 18 grant payments, totaling $1,737,138; DAF grants are denoted by asterisks (*). Donor advised fund (DAF) grants may cover multiple KFH service areas and address multiple health needs. All grant amounts reflect the amount paid in 2014 or 2015 and may not be reflective of the total grant amount awarded.
Grantee Grant
Amount Project Description Results to Date
County of Ventura Public Health
$150,000* This HEAL Zone site focuses on school and community strategies, such as: a) increasing the use of healthier options for fundraising, rewards, and celebrations in schools, b) implementing a Safe Routes to School (SRTS)
To date, the following key accomplishments were documented: a) clinic partners are using HEAL Rx to actively refer patients and have shared that patients are taking advantage of the physical activity opportunities in recommended
57
Grantee Grant
Amount Project Description Results to Date
program, c) implementing the CalFresh Outreach program, increasing access to healthy foods in retail stores and restaurants, d) implementing a HEAL Rx program and BMI screening in clinic and other community settings, e) improving safe access to and linkage between parks and recreational spaces, f) and supporting the purchase of Kellog Park to improve access to physical activity.
in the community, b) Kellogg park has been purchased and a crosswalk has been installed near park for safe access, and c) implementing a healthy kid menu program with local restaurants. These efforts have the potential to reach approximately 10,000 students, parents, and residents.
Los Angeles County Bicycle Coalition
$50,000* The Active Transportation Planning, Project Development & Implementation in Low-Income Communities project seeks community input in countywide and cities’ planning processes and funding allocations in Los Angeles County.
The Los Angeles County Bicycle Coalition (LACBC) has built public support for implementation of walking, biking and safe routes to school projects through outreach and engagement activities. LACBC has submitted an application for a Caltrans Sustainable Communities Planning Grant that would fund bicycle and pedestrian plans for five southeast Los Angeles County cities. LACBC has worked to get a motion passed at Metro board directing staff to create a cost estimate for making all of Los Angeles County walkable and bikeable. The report was estimates between $11 billion to $30 billion over 20 years to build first/last mile improvements at every major transit stop, connect regional bike paths, repair sidewalks, and build safe routes to school.
California Food Policy Advocates (20640981)
$212,500* The Improving Nutrition Program Participation and Quality in Southern California project works to ensure that eligible people in need of nutritional support programs have access to CalFresh and Child Nutrition Programs such as
To date, the California Food Policy Advocates has increased school breakfast participation, increased the number of public school students in Medi-Cal households who are enrolled in free school meal programs, and increased CalFresh
58
Grantee Grant
Amount Project Description Results to Date
federally subsidized school breakfast and lunch programs and child care nutrition.
enrollment. The grant has built awareness, evidence, and support for child care nutrition policies.
City of Ventura Parks, Recreations & Community Partnerships Department
$31,349* This Operation Splash program provides swim lessons, water safety education, swim passes, and junior lifeguard training for low-income youth.
The City of Ventura has partnered in the Operation Splash program since 2009. In 2014 and 2015, it provided approximately 300 swim lessons on an annual basis. In 2015, it also provided 10 junior guard trainings.
Conejo Valley Unified School District
Total Amount: $11,599*
This Thriving School project aims to provide a healthy beverage drink campaign and access to water at multiple points in school settings to support a healthy environment, increase water consumption and maintain hydration.
To date, the school district has installed hydration stations at three schools and reach over 900 students through the Rethink Your Drink Education Campaign to promote water consumption and to reduce sugar sweetened beverage consumption. This project is being implemented in two (2) Elementary Schools, 1 High School and potentially reaches 933 students.
Central Coast Alliance United for a Sustainable Economy (CAUSE)
$20,000 CAUSE is helping improve health outcomes by empowering residents to advocate in their community for environmental change by creating a leadership pipeline which will formalize the development of 60 new and unlikely leaders who will seek the development of a community pool to reduce childhood obesity.
All of the program participants have taken part of community related efforts to improve their community’s physical environment. To date, 200 signature petitions were signed and addressed to Ventura Unified Superintendent Michael Babb, organizing a forum on the Westside Pool, and to engage 47 attendees and the former Superintendent for inclusion on the Westside Pool Coalition’s project “Dive in”. One quarter (25%) of the resident leaders are still active in a community: 2 as chairwomen of the Housing Authority resident committee, 2 serve as
59
Grantee Grant
Amount Project Description Results to Date
Westside Community Council Board members and 1 serves as CAUSE liaison with the community partnership groups.
The Foundation for Educational & Employment Resources Development Inc.
$8,290 The goal of the Foundation is to create a healthier community, by providing swim lessons to non-swimming youth/ parents, healthy options/nutrition, and awareness about the direct correlation between personal health options (healthy nutrition options, exercise; swim, bike, dance, skateboard) and how to protect the local ecology.
Since 2014, 256 community members, predominantly farm workers and factory working parents and children, have received services through outreach events and have maintained follow-up care at Neighborhood Healthy Living Events at Café on A. In addition, 170 individuals have been given referrals for ACCESS Water Swim, Exercise and Healthy Eating Activities. To date, 90% of those that participated confirmed that they are more aware of their bodies, and the positive effect that exercise, nutrition, and confidence around the water has provided them. Four youth were identified to complete junior lifeguard training. 38 youth and family members participated in presentations before decision-making bodies, and key officials including members of the city council, police chief, fire chief and board of supervisors to advocate for greater pool access for low-income communities.
SOSMentor $20,000 SOSMentors Take Action Program empowers youth to make healthier lifestyle choices through nutrition and exercise education as well as environmental and policy changes that improve their schools.
To date, SOSMentor provided 136 hours of nutrition education and physical activity. The nutrition portion of the program served 185 students and the physical activity skill-building program served 333 students. Additionally, through the Take Action Program, students at eight middle schools created two gardens, hosted a healthy food tasting fair, and launched two poster campaign contests. Students at four
60
Grantee Grant
Amount Project Description Results to Date
of the schools have partnered with the cafeteria staff to provide temporary cold-water stations during lunch. At three of the schools, students have been fundraising to purchase and install permanent hydration stations with water bottle fill-up capacities on their campuses.
Young Mens Christian Association of Metropolitan Los Angeles
$20,000 The North Valley Family YMCA aims to create four parent advocacy councils throughout our service area to help identify needs to improve the health of the school students, staff and administration and help to create policies within the schools to improve the physical and nutritional health of all concerned.
To date, established four Parent Advisory Councils and trained 86 child care staff across 16 school sites on how to implement healthy practices. Results included over 5,000 students, faculty and families across 15 school sites measuring their activity with pedometers and 130 families who accumulated the most steps celebrating at Healthy Family Night.
Healthy Eating Active Living Collaboration/Partnership Highlights
Organization/Collaborative Name
Collaborative/Partnership Goal Results to Date
LA Counties Community Health Improvement Plan
The Community Health Improvement Plan aims to create healthy communities by setting up collaboration among diverse partners, both inside and outside of the health sector.
The Community Health Improvement Plan is a strategic plan for the Department of Public Health and community partners to collaboratively improve the health of community members in Los Angeles County over the next five years. The Community Health Improvement Plan serves as a roadmap for improved health in Los Angeles County.
Partnership For a Healthy Ventura County
The Partnership aims to promote community activities, policies and environmental changes that foster healthy eating and regular physical activity to counter obesity and its related chronic diseases.
The Partnership has presented five Health Champion Awards at the Ventura County Board of Supervisors meeting, which highlighted model programs or organizations that reflect the goal of the collaborative.
61
Organization/Collaborative Name
Collaborative/Partnership Goal Results to Date
Kellogg Park Working Group The aim of this collaborative is to advocate for the approval, design and implementation of a new park in the community.
The collaborative provided a space for families to advocate for the successful acquisition of land for a park as well as design it with plans including an amphitheater, community garden, adventure playground and walking path. Efforts are now focused on fundraising for the playground and a groundbreaking ceremony. KFH - Woodland Hill’s staff worked with low income community residents, the city of Ventura, schools and non-profit organizations on the West Side of Ventura County to design and develop a new park.
Healthy Eating Active Living In-Kind Resources Highlights
Recipient Description of Contribution and Purpose/Goals
Free Clinic of Simi Valley KFH - Woodland Hills Community Medicine Fellow helped to start a walking group for the health of staff and patients at The Free Clinic of Simi Valley.
North Valley Family YMCA KFH - Woodland Hills staff coordinated the community clean up to help create an environment that makes it easier to be physically active.
North Valley Family YMCA KFH - Woodland Hills staff taught children from the San Fernando Valley about the importance of being active and eating healthy.
Western Ventura Residents in the HEAL Zone
Convening a training that explores best practices for working with interpreters and translators to plan inclusive and effective multilingual events.
Impact of Regional Initiatives Addressing Healthy Eating Active Living
In addition to the illustrated grants listed above, Kaiser Permanente designs Regional Health Initiatives that are implemented in one or more KFH service areas to address the priority health needs. These initiatives are multi-year investments that support policy, advocacy and/or system changes in communities, including support for clinic systems to enhance capacity, service provision and or coordination. Kaiser Permanente invests in external evaluation for Regional Health Initiatives, and where possible, the results to date will reflect the most recent evaluation findings.
62
Kaiser Permanente’s Thriving Schools initiative expands Kaiser Permanente’s commitment to the total health of members and the communities it serves through work with local schools and school districts. It is an effort to improve healthy eating, physical activity and school climate in K-12 schools in Kaiser Permanente’s service areas, primarily through a focus on policy, systems and environmental changes that support healthy choices and a positive school climate. For the specific project implemented in KFH-Woodland Hills and the results to date, please see the Thriving Schools listing above under Conejo Valley Unified School District.
Kaiser Permanente’s HEAL (Healthy Eating, Active Living) Zone initiative is a place-based approach that aims to lower the prevalence of obesity and overweight by increasing access to fresh fruit, vegetables and healthy beverages, as well as increasing safe places to be play and be physically active. HEAL Zones work through a collaboration of local organizations and agencies to implement policies, programs and environmental system changes to impact healthy eating and active living behavior. To date, Kaiser Permanente has awarded over $7,000,000 to community based organizations across Southern California to support this initiative. For the specific project implemented in KFH-Woodland Hills and the results to date, please see the listing above for Ventura HEAL Zone coordinated by the County of Ventura Public Health.
Operation Splash programs reach out to undeserved youth and provide them with opportunities to receive aquatic skill acquisition and water safety instruction through City Parks and Recreation swimming pools. The swim lessons enable greater access to physical activity for youth. Almost all centers provide opportunities for learning about healthy beverage education through Healthy Beverage campaigns that educate about the nutritional content of soda and other sugary drinks, and encourage youth to choose healthier beverages such as water. Kaiser Permanente has supported Operation Splash for its Southern California KFH since 2008. See above for specific program in the KFH service area.
KFH-Woodland Hills Priority Health Need: Oral Health
Long-term Goal - Improve oral health among residents in low socioeconomic areas.
Intermediate Goal - Improved access to oral health education and dental services.
Oral Health Grant-Making Highlights
Grant-Making Snapshot During 2014-2015, there were 8 KFH grant payments, totaling $126,580, addressing the priority health need in the KFH-Woodland Hills service area. All grant amounts reflect the amount paid in 2014 or 2015 and may not be reflective of the total grant amount awarded.
Grantee Grant
Amount Project Description Results to Date
63
Grantee Grant
Amount Project Description Results to Date
Ventura County Medical Resource Foundation
$20,000 The Ventura County Medical Resource Foundation Children's Resource Program coordinates culturally and linguistically responsive access to donated dental treatment and vision care for underserved infants' through 18 year-old who are in low-income households.
Since 2014, the Children’s Resource Program, provided 325 low-income children with over 500 dental services and treatments; resulting in decreased wait times for children in pain. There has been a 15% increase in the number of low-income children who have been referred and treated by the CRP. In addition to providing access to dental care services, children have benefited by removing a major barrier to their ability to learn and develop appropriately.
United Way of Ventura County
$20,000 United Ways’ Building Healthy Smiles Care Coordination program is implementing a system for providing access to oral health care services for children needing dental care.
Since 2014, the Building Healthy Smiles Care Coordination implemented a pilot program in Port Hueneme and has since then expanded to all of western Ventura County. This program focuses on recruiting dental providers, setting up referral systems, identifying children in need of dental care, and providing supportive case management. Currently, twenty dentists and 2 oral surgeons are included in the provider network and will provide pro bono and/or reduced fee services for children. In addition 61 children have been referred to Building Healthy Smiles for oral health services.
Valley Village $15,000 Valley Village works closely with dentists and our nurses to ensure that people with developmental disabilities are cared for to avoid tooth loss, disease and loss of confidence.
To date, Valley Village provided restorative care to 17 clients with developmental disabilities including one flexible bridge and two crowns, resulting in increased confidence, greater participation in self-care and lower risk for disease.
United Cancer Advocacy Action Network (UCAAN)
$8,290 UCAAN CARE (Caries and Restorative Education) aims to prevent and manage dental caries due to the treatment of radiation and chemotherapy through education and collaboration with local non-profit dental
Since 2014, 275 cancer patients have received information and education through outreach events about the preventative steps to take to prevent dental deterioration prior to receiving cancer treatments. Additionally, information and engagement packets
64
Grantee Grant
Amount Project Description Results to Date
programs. were distributed to 57 doctors and 62 social workers in the Ventura County and San Fernando Valley Areas to recruit as partners. UCAAN has also advocated for a cancer treatment protocol to be include in preventative dental information before the Dental Association and National Institute of Health.
Oral Health Collaboration/Partnership Highlights
Organization/Collaborative Name
Collaborative/Partnership Goal Results to Date
Ventura County Children s Oral Health Collaborative
The goal of the Ventura County Children’s Oral Health Collaborative is to eliminate untreated tooth decay.
KFH-Woodland Hills’ staff helped to encourage participation of low income community residents in the development of a "Building Healthy Smiles Advocacy Tool Kit" in English and Spanish aimed at strengthening the system of oral health education and care in Ventura County.
KFH-Woodland Hills Priority Health Need: Social and Emotional Support
Long-term Goals - Increase social and emotional support among residents in low socioeconomic areas in the KFH-Woodland Hills.
Intermediate Goals - Build and contribute to existing social and emotional support infrastructure.
Social and Emotional Support Grant-Making Highlights
Grant-Making Snapshot During 2014-2015, there were 14 KFH grant payments, totaling $209,739, addressing the priority health need in the KFH-Woodland Hills service area. In addition, a portion of the money managed by a donor advised fund (DAF), The California Community Foundation, was used to pay 1 grant, totaling $25,000; DAF grants are denoted by asterisks (*). Donor advised fund (DAF) grants may cover multiple KFH service areas and address multiple health needs. All grant amounts reflect the amount paid in 2014 or 2015 and may not be reflective of the total grant amount awarded.
65
Grantee Grant
Amount Project Description Results to Date
One Step a la Vez
$8,290 One Step a la Vez aims to provide linkages between the Juvenile Justice System, Fillmore Unified School District and local support services in order to better serve recently released incarcerated and probationary youth.
Since 2014 One Step a la Vez has worked with the Fillmore Unified School District to provide 10 interventions prior to suspension/expulsion as well support programs for 27 failing students. Twenty (20) youth have received services during and following incarceration which include school scheduling, drug/alcohol/personal/job counseling, community service hour assignments, peer to peer support, as well as basic needs such as housing and food. An additional 90 at-risk youth (including youth living below the poverty line, undocumented youth and gang involved youth) attend the center and also benefit from these services.
Women Crowned In Glory, Inc.
$8,290 Women Crowned in Glory offers the 'Stepping Stones to a New Life' program, an intense 6 month program for women who are victims of domestic violence.
To date, the program served a total of 30 abused women, 23 (75%) of whom did not have stable jobs or safe living situations. At the conclusion of the program, 27 (90%) had stable jobs, 100% had emotionally healthy families and safe places to live. Outcomes included increase in knowledge of abuse and all 30 women became community advocates that spoke against domestic violence at events and volunteered at Safe Passage.
The Village Family Services
$15,000 The Village Family Services provides supportive services to homeless and at-risk youth through the Transition Age Youth (TAY) Drop-In Center (and soon to open Emergency Shelter), such as mental health counseling, peer support, life-skills, and primary care at VCC's teen clinic.
Since 2014, The Transitional Age Youth Drop-In Center reached 967 new clients with 728 returning clients for a total of 472 clients and 2,016 visits. Three-hundred and forty six (346) youth received case management and 160 youth received counseling. Additionally, there have been 742 therapy sessions. Twenty-five youth have shared their life experiences and participated as mentors to others. In addition, the Youth Leadership Board has provided mentoring to 12 clients each month, for a total of 144 clients served during the annual year.
Grandparents $20,000 GAP provides social and emotional To date, GAPs’ Strengthening Families and Community
66
Grantee Grant
Amount Project Description Results to Date
As Parents Inc. support for kinship families via support groups and mental health services.
Initiative has provided crisis intervention and counseling, individual and family therapy, and home visits for 300 kinship family members. It has also provided support groups, educational classes, nutrition and health information, and safety-net referrals for 150 kinship caregivers.
El Centrito Family Learning Centers
$10,000 The Padres Promotores engage Latino and immigrant parents through peer-to-peer support and trainings, giving them knowledge and confidence to guide their children to higher education.
To date has trained 877 low-income immigrant and English learning parents on the pathways to higher education, strengthening their understanding of requirements for college admission, financial aid options, and the importance of being involved in their child’s educational journey. Ninety-seven percent (97%) of parents recently reported that they had gained new knowledge that supported their ability to put new strategies for engaging with their child’s education into practice.
Center for Living and Learning
$7,000 The Center for Living and Learning provides support groups for those transitioning from drug treatment and incarceration into the workforce.
Since 2014, Center for Living and Learning provided 51 peer mentor-led support groups at four partnering agencies, leading to increased employment preparation and increased mental outlooks regarding barriers to employment. To date a total of 183 individuals were served with 111 (61%) accessing more intensive career counseling services.
Social and Emotional Support Collaboration/Partnership Highlights
Organization/Collaborative Name
Collaborative/Partnership Goal Results to Date
The Providers Collaborative of the San Fernando Valley
The Collaborative aims to provide training and networking opportunities for service providers in the San Fernando Valley.
The Collaborative held a training on harm reduction for homeless service providers in the San Fernando Valley. It also engaged in street outreach to clinics as well as sober living sites and housing programs. The training focused on encouraging provides to provide easily accessible
67
Organization/Collaborative Name
Collaborative/Partnership Goal Results to Date
services with a nonjudgmental approach.
Public/Private Hospital Mental Health Workgroup
Identified the top five most relevant mental health issues to focus on together including crisis intervention, substance abuse, housing, medical delivery and insurance subsidy.
The workgroup has reassessed the process and protocol for 5150 involuntary holds of patients in hospital emergency departments and updating the status of crisis stabilization units.
VC-PACT VC-PACT aims to improve the quality and consistency of physical and mental health care for Children with special health care needs in Ventura County through collaboration, coordination, and a focus on strengthening families.
Developed an Acuity Screening Tool for Children with Special Health Care Needs to improve care coordination utilizing Kaiser Permanente's Vincent J. Felitti MD’s Adverse Childhood Experiences Study.
Southern California Grantmakers Public Policy Advisory Committee
The Advisory Committee aims to foster engagement and collaborations with non-profits and policymakers to build strong communities.
The Advisory Committee worked to influence emerging public policy issues through briefings on proposed Child Care Vouchers for Foster Families as well as with the State Controller.
Progressing the Advancement of Transitional Age Youth
This partnership focuses on the coordination of foster youth services in Ventura County.
Collaborative members collectively worked to improve the quality and consistency of wrap around services to meet the needs of foster youth as they transition to independent living.
Community Aging & Research Program Community Partners Meeting
The aim of this partnership is to develop a Healthy Aging Initiative for Ventura County.
The collaborative is developing community based physical activity programs for older adults.
Camarillo Council on Aging The Council provides a mechanism for the senior community to make recommendations regarding matters
Developed a Senior Resource Guide to provide information regarding agencies, organizations and businesses providing senior services which links directly
68
Organization/Collaborative Name
Collaborative/Partnership Goal Results to Date
of concern to the City Council, the Ventura County Area Agency on Aging, and other organizations.
to provider websites.
LA County Coalition Client Participation in an association of current or former Mental Health Clients/Consumers/Survivors who carry the message of Hope, Recovery, Wellness and Self-Determination to its Peers and Communities, including the Mental Health Community.
The Coalition held an Innovations in Recovery Integrating Physical and Mental Health Conference featuring a study that reported that people with a lived experience of mental health are more effective then staff at peer health navigation and are the most authentic voice in the mental health system.
Action Ventura County A collaborative of faith organizations brought together to address pressing community needs.
KFH-Woodland Hills’ staff coordinated a toy drive collection to benefit families of veterans and those with disabilities during the holiday season.
Social and Emotional Support In-Kind Resources Highlights
Recipient Description of Contribution and Purpose/Goals
Fleet Street Bikes Fleet street volunteers take donated, used bikes and teaches the boys at Pacific Lodge to repair the bikes. Fleet Street then donates the repaired bikes to veterans organizations, foster care, homeless shelters, the Make a Wish Foundation, college students and the under privileged in need.
Casa Pacifica Centers for Children and Families
Coordinated a Pack-a-Backpack Drive assuring that abused, neglected, and at risk children start off the school year with all the supplies they needed including pencils, pens, crayons, glue sticks, markers, rulers, spiral notebooks, white glue, backpacks, etc. Support for the Pack-a-Backpack appeal helps Casa Pacifica Centers for Children and Families bring a sense of normalcy to our children’s lives, making sure that they have all the needed items to start the school year, the same as the other children at school – children whose lives haven’t placed them out of their homes and away from their families.
Partnership for Safe Family and Communities of
The Partnership for Safe Family and Communities of Ventura County provides training's, workshops and resources towards the prevention of child abuse, violence and sexual assault through youth and
69
Recipient Description of Contribution and Purpose/Goals
Ventura County parent leadership.
Los Angeles Police Department
KFH – Woodland Hills has develop pathways to relationship-based community policing by sharing Kaiser Permanente’s staff training to encourage best practices in caring for transgender patients.
LA Family Housing KFH - Woodland Hills staff have coordinated monthly visits to LA Family Housing, the largest provider of affordable housing in the San Fernando Valley and a best practices provider of basic needs and homeless services throughout Greater Los Angeles.
The Lighthouse For Women and Children
Kaiser Permanente Woodland Hills staff coordinated monthly visits to the Lighthouse for Women and Children in Oxnard
Westminster Free Clinic Kaiser Permanente Woodland Hill’s Pediatric Department coordinated a backpack and school supply drive distributing the donations with more than 50 other Kaiser Permanente Departments.
Habitat For Humanity San Fernando Valley
Kaiser Permanente Woodland Hill’s staff serve on the Board of Directors of this organization and participated in the Women’s Empowerment Build to help construct housing for veterans.
Genesis House Kaiser Permanente Woodland Hill’s Women Embracing Life and Leadership (KPWELL) Business Resource Group coordinated a formal wear drive
National Alliance on Mental Illness (NAMI)
Kaiser Permanente Woodland Hills served as a Spanish “Train the Trainer” site for NAMI’s Familia a Familia (Family to Family) program
PRIORITY HEALTH NEED: BROADER HEALTH CARE SYSTEM NEEDS IN OUR COMMUNITIES – WORKFORCE
KFH Workforce Development Highlights
Long Term Goal:
To address health care workforce shortages and cultural and linguistic disparities in the health care workforce
Intermediate Goal:
Increase the number of skilled, culturally competent, diverse professionals working in and entering the health care workforce to provide access to quality, culturally relevant care
Summary of Impact: During 2014-2015, a portion of money managed by a donor advised fund at California Community Foundation
70
was used to pay two grants, totaling $150,000, that address this need. An illustrative sample of grants is provided below; DAF grants are denoted by asterisks (*).All grant amounts reflect the amount paid in 2014 or 2015 and may not be reflective of the total grant amount awarded. KFH-Woodland Hills also provided trainings and education for 56 residents in its Graduate Medical Education program, four nurse practitioner or other nursing beneficiaries, and 32 other health (non-MD) beneficiaries as well as internships for 35 high school and college students (Summer Youth, INROADS, etc.).
Grant Highlights
Grantee Grant Amount Project Description Results to Date
California Institute for Nursing and Health Care (CINHC)
$100,000* To provide expert technical assistance to registered nursing programs at California state universities (CSUs) and their identified California community college (CCC) partners in Southern California. It will also help schools implement an associate degree to a bachelor of science in nursing pathway, facilitating fast tracking and efficient implementation of the California Collaborative Model of Nursing Education (CCMNE).
CINHC will facilitate engagement and partnership to develop, implement, and sustain the CCMNE across all 10 CSU’s and respective CCC’s. CINHC will engage interested private universities and colleges within the region, including deans, directors, and faculty. Lastly, CINHC will conduct a curriculum review, mapping process, and development of integrated pathways based on prior success strategies that are consistent with evidence based models.
Campaign for College Opportunity (CCO)
$50,000* This grant supports an in-depth research report to analyze trends in California science, technology, engineering, and math (STEM)/health workforce needs. The STEM/Health Workforce Report will focus on factors affecting demand and supply; public higher education funding policies; and programs to help meet workforce demands. This grant supports an in-depth research report to analyze trends in California science, technology, engineering, and math (STEM)/health workforce needs. The STEM/Health Workforce Report will focus on factors affecting demand and supply; public higher education funding policies; and
The Campaign for College Opportunity will develop and disseminate the STEM/Health Workforce Report to increase awareness among the public and policymakers of the growing need for STEM health workers in California and the role California community colleges play in filing the demand. CCO has completed the report and the general release will occur in June 2016. The report's release will be accompanied by a media and communications strategy including a webinar, briefings with key stakeholders (in education, business, community and civic organizations) along with policymakers in Sacramento.
71
programs to help meet workforce demands.
In-Kind Resources Highlights
Recipient Description of Contribution and Purpose/Goals
Individuals and organizations in the health care and medical workforce.
Kaiser Permanente Southern California Region’s Department of Professional Education offered Advanced Practice and Allied Health Care Educational Programs for allied health care providers throughout Southern California. In 2015, across Kaiser Permanente Southern California Region, 644 community-based nurses, nurse practitioners, physician assistants, imaging professionals, clinical laboratory scientists, community audiologists and speech pathologists, and other health care professionals participated in symposia at no cost.
Westlake High School KFH-Woodland Hills staff encourage high school students to attend major universities in the fall and eventually consider medical school.
Van Nuys Middle School KFH-Woodland Hills staff organized a Woodland Hills Medical Center Tour for students interested in health care to expose them to this field of interest in action and inspire them to become a future part of the workforce.
California State University, Northridge
KFH-Woodland Hills Radiology/Diagnostic Imaging Department provided internship and job shadowing opportunities.
Ventura County High Schools
Dr. Beverly Torres, Physician in Charge of the Oxnard Medical Office Building created a Summer Youth Program.
Westminster Free Clinic KFH-Woodland Hills staff coordinated a Woodland Hills Medical Center Tour for Middle and High School Students interested in health care to expose them to this field of interest in action and inspire them to become a future part of the workforce.
Collaboration/Partnership Highlights
Organization/Collaborative Name
Collaborative/Partnership Goal Results to Date
Meet Each Need With Dignity Poverty Conference Planning Committee.
The aim of this Committee is to coordinate a convening of nonprofit agency executives, poverty experts, media experts and funders to spread knowledge about curricula, training and health career ladder/pipeline programs.
KFH – Woodland Hills staff facilitated a Restorative Justice panel on Income Inequality and organized community residents in partnership with The Center For Living and Learning who shared their experience returning to the workforce after being incarcerated.
72
PRIORITY HEALTH NEED VI: BROADER HEALTH CARE SYSTEM NEEDS IN OUR COMMUNITIES – RESEARCH
KFH Research Highlights
Long Term Goal:
To increase awareness of the changing health needs of diverse communities
Intermediate Goal:
Increase access to, and the availability of, relevant public health and clinical care data and research
Summary of Impact: Kaiser Permanente conducts, publishes, and disseminates research to improve the health and medical care of members and the communities served. The Southern California Region Department of Research and Evaluation (DRE) conducted a total of 988 studies in 2014 and 1,404 studies in 2015 across all regional hospitals, totaling $16,385,832. Research focuses on clinical trials, building scientific expertise in health services and policy, and implementation science to bridge the gap between research and practice. In addition, a portion of money managed by a donor advised fund (DAF) at California Community Foundation was used to pay two grants, totaling $1,050,000 that address this need. All grant amounts reflect the amount paid in 2014 or 2015 and may not be reflective of the total grant amount awarded.
Grant Highlights Research
Grantee Grant Amount Project Description Results to Date
UCLA Center for Health Policy Research
$500,000*
The California Health Interview Survey (CHIS) investigates key public health and health care policy issues, including health insurance coverage and access to health services, chronic health conditions and their prevention and management, the health of children, working age adults, and the elderly, health care reform, and cost effectiveness of health services delivery models.
At the end of the grant period, UCLA Center for Health Policy Research interviewed approximately 41,500 households and completed 78,127 screenings along with 40,125 adult, 2,255 adolescent and 5,514 child interviews. In addition, 12 AskCHIS online trainings were completed.
In-Kind Resources Highlights Research
Recipient Description of Contribution and Purpose/Goals
Individuals and organizations in the health care and medical community.
Kaiser Permanente Southern California Region’s Department of Research and Evaluation works closely with national and regional research institutions and universities to provide high-quality health research. In the KFH-Woodland Hills service area, 15 research projects were active in 2014 and 14 research projects were active as of year-end 2015.
Individuals and organizations in the health care and
Kaiser Permanente Southern California Region’s Nursing Research Program provides administrative and technical support for nurses to conduct, publish and disseminate research studies and evidence based practice projects. In the KFH-Woodland Hills service area, six research projects were active as of year-end
73
medical community. 2014 and five research projects were active as of year-end 2015. Collaboration/Partnership Highlights
Research
Organization/Collaborative Name
Collaborative/Partnership Goal Results to Date
Community Engagement in Research Collaborative
The Community Engagement in Research Program facilitates research collaborations between academics, clinicians, public health officials, patient groups and community-based organizations to improve health and health care in Los Angeles.
To date, the collaborative has promoted and sustained two-way knowledge-sharing between the community and academia while driving innovation in community engagement to accelerate the volume and impact of partnered research in diverse communities.
Greater Los Angeles Homeless Count Coordinating Committee
Kaiser Permanente Woodland Hills Medical Center served as a site for the homeless count to highlight the need for more resources to treat our most vulnerable neighbors living on the street.
To date, the Coordinating Committee have trained 135 Kaiser Permanente staff and community members and recruited 8 additional Homeless Count Deployment sites including Chatsworth, Northridge, North Hills, Mission Hills, as well as Kaiser Permanente Medical Centers in Panorama City, Los Angeles, Baldwin Park, and South Bay. KFH - Woodland Hills Medical Center served as a site for the homeless count to highlight the need for more resources to treat our most vulnerable neighbors living on the street.
74
Appendix A: Secondary Data Sources and Dates
Alisha, C. J., Matthew R., & Christian G. (September, 2015). United States Department of Agriculture
Economic Research Service: Household Food Security in the United States in 2014. Economic
Research Report No. (ERR-194). Retrieved May 20, 2016 from
World Health Organization (2016). The Determinants of Health. Retrieved from
http://www.who.int/hia/evidence/doh/en/ (February 25, 2016). Provided definition for physical
environment and what it entails
Yan, J., Liu, L., Zhu, Y., Huang, G. and Wang, P.P. (2014). The Association between Breastfeeding
and Childhood Obesity: A Meta-Analysis. BioMed Central Public Health, 14(1267), December
13, 2014. Doi: 10.1186/1471-2458-14-1267. Retrieved May 24, 2016 from
http://bmcpublichealth.biomedcentral.com/articles/10.1186/1471-2458-14-1267. Review of
studies related to the link between breastfeeding and reduction of childhood obesity
82
Appendix B: Community Input Tracking Form
Data Collection Method
Employed
Who Participated / Title of event//Type of Input
Number of Participants
Who Participant(s) Represent(s)
Position with respect to the
group
Date
Focus Group Fullbright Elementary School, parent group (identification and prioritization of health needs)
16 Low-income, medically underserved minority community members
Community members
9/22/2015
Focus Group Chronic Disease Committee (identification and prioritization of health needs)
13 Health experts representing the SFV
Community leaders, health experts
8/11/2015
Focus Group Hope of the Valley Rescue Mission, Homeless community (identification and prioritization of health needs)
9 Low-income, medically underserved minority community members
Community members
10/27/2015
Focus Group Mid Valley Health Center, physicians (identification and prioritization of health needs)
13 Representatives from county hospital
Community leaders, health experts
9/29/2015
Focus Group Valley Economic Alliance (identification and prioritization of health needs)
4 Community/business leaders from SFV
Community leaders
11/20/2015
Focus Group Valley Industry and Commerce Association (identification and prioritization of health needs)
16 Community/business leaders from SFV
Community leaders
10/7/2015
Focus Group Low-wage immigrant farm workers (identification and prioritization of health needs) in Santa Paula
12 Low-income, medically underserved minority community members
Community members
8/20/2015
Focus Group Leadership Ventura, business leaders (identification and prioritization of health needs)
6 Business community
Business leaders
9/23/2015
Focus Group California Youth Connection at the Ventura Office of Education, Foster youth (identification and prioritization of health needs)
20 Foster Youth Community members
11/4/2015
83
Data Collection Method
Employed
Who Participated / Title of event//Type of Input
Number of Participants
Who Participant(s) Represent(s)
Position with respect to the
group
Date
Focus Group Mixteco Parent Group- "Among men" (identification and prioritization of health needs)
10 Low-income, medically underserved minority community members
Community members
11/23/2015
Focus Group Mary B. Perry High School in The Ventura Youth Correctional Facility, incarcerated youth (identification and prioritization of health needs); conducted six separate focus groups simultaneously
24 Incarcerated youth Community members
10/28/2015
Forum VICA (identification and prioritization of health needs, triggers and solutions)
16 Business leaders Community leaders
10/7/2015
Forum Community health professionals at VCCC's large group meeting at Valley Presbyterian Hospital (identification and prioritization of health needs, triggers and solutions)
27 Health professionals serving various sectors of the San Fernando Valley
Community leaders and health experts
10/8/2015
Key Stakeholder Interview
Director of Program Development, Tarzana Treatment Center (identification and prioritization of health needs)
1 Director of behavioral health organization (substance abuse and mental health treatment)
Community leader, health expert
9/29/2015
Key Stakeholder Interview
Health educator, LA County Department of Public Health, Service Planning Areas 1, 2 (Identification and pre-prioritization of health needs, drivers, available assets and possible solutions)
1 Health department representative
Community leader, health educator
10/13/2015
Key Stakeholder Interview
Director, LA County Department of Public Health Division of HIV and STD Programs (Identification and pre-prioritization of health needs, drivers,
1 Health department representative
Community leader, health expert
10/6/2015
84
available assets and possible solutions)
Data Collection Method
Employed
Who Participated / Title of event//Type of Input
Number of Participants
Who Participant(s) Represent(s)
Position with respect to the
group
Date
Key Stakeholder Interview
Section Manager, Contracted Community Services, LA County Department of Public Health Division of HIV and STD Programs (Identification and pre-prioritization of health needs, drivers, available assets and possible solutions)
1 Health department representative
Community leader, health expert
9/24/2015
Key Stakeholder Interview
CEO, Olive View-UCLA Medical Center (Identification and pre-prioritization of health needs, drivers, available assets and possible solutions)
1 Representative from county hospital
Community leader
11/3/2015
Key Stakeholder Interview
Community Liaison PHN at County of Los Angeles Department of Public Works (Identification and pre-prioritization of health needs, drivers, available assets and possible solutions)
1 Health department representative
Community leader
10/13/2015
Key Stakeholder Interview
Transgender Woman Interview, Stacey (Identify health needs and drivers, solutions and available unique to the subpopulation)
1 Minority population Community member
8/26/2015
Key Stakeholder Interview
Transgender Woman Interview, Rain (Identify health needs and drivers, solutions and available unique to the subpopulation)
1 Minority population Community member
8/26/2015
Key Stakeholder Interview
Health Officer, Ventura County Department of Public Health Services (identification and prioritization of health needs)
1 Entire residents of Ventura County
Public health and health services leader
12/9/2015
Key Stakeholder Interview
Epidemiologist, Ventura County Department of Public Health Services (Identification and prioritization of health needs)
1 Entire residents of Ventura County
Public health expert and data analyst
12/9/2015
85
Key Stakeholder Interview
Health Education Manager, Ventura County Department of Public Health Services (Identification and prioritization of health needs)
1 Entire residents of Ventura County
Public Health expert
12/8/2015
Data Collection Method
Employed
Who Participated / Title of event//Type of Input
Number of Participants
Who Participant(s) Represent(s)
Position with respect to the
group
Date
Key Stakeholder Interview
Medical Social Work Department Administrator, Kaiser Permanente (Identification and prioritization of health needs)
1 Mental health, underserved and vulnerable populations in West San Fernando Valley
Mental health expert
12/8/2015
Survey Lanark Park, Canoga Park (Identification and prioritization of health needs)
24 Low-income, medically underserved minority community members, health priorities & access to health
Community members
8/28/2015
Survey VCCC's large group, VICA, Valley Economic alliance with online survey (Identification and prioritization, drivers and solutions)
31 Business leaders, for profit & nonprofit community organizations, education administrators, community representatives
Community leaders
11/3/2015 - 11/20/2015
Survey Business groups, community representatives with online surveys (Identification and prioritization, drivers and solutions)
45 Health professionals serving various sectors of the San Fernando Valley
Community leaders and health experts
10/8/2015
86
Appendix C: Health Need Profiles
After prioritizing the top 10 health needs for both West San Fernando Valley and Ventura County, it was noted that a few health needs differed slightly between the service areas. Taking this into consideration, the CHNA team created health need profiles for all 10 health needs and when necessary presented information separately for each service area. The health profiles are organized in order of priority for easier access. Each health need profile follows a similar format: 1) description & significance, 2) health outcomes statistics, 3) health disparities, 4) health drivers, 5) community input, and 6) assets and opportunities.
Please note that within the tables that comparing the service areas, values are highlighted in RED whenever a health need does not meet the state benchmark (BOLDED). In other words, the values are worse than the state. Those values highlighted in GREEN indicate the health need meets or exceeds the state benchmark. It should also be noted that for the KFH-Woodland Hills service area, secondary data demonstrated that when the health need exceeds the state benchmark, it was by a slight margin. Additionally, some data are collected at the county level rather than at the local level therefore values for the service may reflect those of the county.
87
Overweight/Obesity (Adults)
Description & Significance: The World Health Organization (WHO), defines overweight and obesity as “abnormal or excessive fat accumulation that may impair health.” Over two-thirds (39.5%) of American adults are overweight (body mass index or BMI ≥25) or obese (BMI ≥30). More than a third of these (34.9%) are obese. Of children and youth 2 to 19 years, 31.8 percent were either overweight or obese with approximately 17 percent being obese. Obesity is preventable. It is caused by an overconsumption of calories and low calorie output due to physical inactivity. Overweight and obesity increases the risk of developing many other health problems, including heart diseases, diabetes, musculoskeletal disorders, and some types of cancers. Eating a well-balanced diet, decreasing or limiting consumption of sugary and fatty foods, while engaging in regular physical activity can reduce or prevent overweight and obesity.
Health Outcome Statistics
More than 36% of adult population is overweight in the KFH-Woodland Hills service area compared to 35.8% in California.
Overweight Adults in KFH-Woodland Hills Service Area (BMI 25.0 – 29.9)
Overweight (BMI 25.0-29.9), Adults Age 18 , Percent by County, BRFSS 2011-12
Over 39.0%
36.1 - 39.0%
33.1 - 36.0%
Under 33.1%
No Data or Data Suppressed
Report Area
Source: Centers for Disease Control and Prevention, Behavioral Risk Factor Surveillance System. Additional data analysis by CARES. 2011-12. Source geography: County
Health Disparities
Across all service areas, adult men are more likely to be obese than women. The percentage of obese men also exceeds that of the medical center’s 20.5%.
88
Percentage of Obese Adults (BMI >30.0) by Gender
Adults (Obese) KFH-Woodland Hills Area
West San Fernando Valley
Ventura County
Male 21.64% 21.51% 21.9%
Female 19.28% 19.69% 18.5%
KFH-Woodland Hills Area Overall 20.5%
Source: Centers for Disease Control and Prevention, National Center for Chronic Disease Prevention and Health Promotion. 2012. Source geography: County
Key Health Drivers
Health Behaviors (Healthy Eating)
Individual behaviors, socioeconomic status, and the physical environment can impact one’s ability to make healthy eating choices on a daily basis. Healthy eating can help individuals reduce and/or maintain healthy. In the KFH-Woodland Hills service areas, while individual behaviors do play a role, access to healthy choices is a significant barrier.
Low Fruit/Vegetable Consumption (Adult)
Percentage of adults age 18 and older who self-report consuming less than 5 servings of fruits and vegetables each day
KFH-Woodland Hills Area
West San Fernando Valley
Ventura County Los Angeles County
California
71.6% 72.1% 70.7% 72.8% 71.5%
Source: Centers for Disease Control and Prevention, Behavioral Risk Factor Surveillance System. Accessed via the Health Indicators Warehouse. US Department of Health Human Services, Health Indicators Warehouse. 2005-09. Source geography: County
Breastfeeding (Exclusive)
Among other protective benefits breastfeeding provides infants, many studies have linked breastfeeding to reducing childhood obesity. This is particularly important because further studies indicate that obese children and adolescents are likely to be obese as adults and therefore at risk for adult health problems such as heart disease, diabetes, stroke, several types of cancer, and arthritis.
Percentage of Mothers Who Exclusively Breastfeed their Infants during their Post-Delivery Hospital Stay
KFH-Woodland Hills Area West San Fernando Valley
Ventura County Los Angeles County
California
59.3% 57.1% 63.7% 53.7% 64.8%
Source: California Department of Public Health, CDPH - Breastfeeding Statistics. 2012. Source geography:
County
89
Health Behaviors (Physical Activity)
Being active, combined with healthy eating, can help keep your weight, blood glucose levels,
cholesterol, and blood pressure on target. In the KFH-Woodland Hills service area, many adults are
physically inactive.
Physical Inactivity (Adult)
Percentage of adults age 20 and older who self-report that they perform no leisure time activity
KFH-Woodland Hills Area
West San Fernando Valley
Ventura County Los Angeles County
California
16.8% 17% 16.4% 17.3% 16.6%
Source: Centers for Disease Control and Prevention, National Center for Chronic Disease Prevention and Health
Promotion. 2012. Source geography: County
Walking/Biking
Percent of the Adult Population Walking or Biking to Work
KFH-Woodland Hills Area West San Fernando Valley
Ventura County Los Angeles County
California
2.71% 2.65% 2.63% 3.75% 3.84%
Source: US Census Bureau, American Community Survey. 2010-14. Source geography: Tract
Physical Environment
Fast Food Restaurants
Proximity to fast food restaurants has been found to impact obesity among the youth. The closer they
area to these establishments, the more likely the less likely to are to eat fruits and vegetables, more
likely to drink more soda and as a result be overweight or obese. Based on the table below, there are
more fast food restaurants in the KFH-Woodland Hills Medical Center service area.
Number of Fast Food Restaurants Per 100,000 Population
KFH-Woodland Hills Area
West San Fernando Valley
Ventura County Los Angeles County
California
80.38 85.17 73.36 77.82 74.51
Source: US Census Bureau, County Business Patterns. Additional data analysis by CARES. 2011. Source geography: Tract
90
Grocery Stores
Access to healthy food can influence dietary behaviors. Grocery stores are defined as supermarkets and smaller grocery stores primarily engaged in retailing a general line of food, such as canned and frozen foods; fresh fruits and vegetables; and fresh and prepared meats, fish, and poultry. Within the KFH-Woodland Hills Medical Center service area, there are fewer grocery stores than California. For Ventura County service area, there are fewer stores that accept WIC vouchers.
Number of Grocery Stores Per 100,000 Population
KFH-Woodland Hills Area
West San Fernando Valley
Ventura County Los Angeles County
California
21.39 20.63 21.38 20.92 21.51
Source: US Census Bureau, County Business Patterns. Additional data analysis by CARES. 2011. Source geography: Tract
WIC-Authorized Food Stores
Number of Stores that Accept WIC Vouchers per 100,000 Population
KFH-Woodland Hills Area West San Fernando Valley
Ventura County Los Angeles County
California
15.7 16.3 14.8 17 15.8
Source: US Department of Agriculture, Economic Research Service, USDA - Food Environment Atlas. 2011. Source geography: County
Social & Economic
The Supplemental Nutrition Assistance Program (SNAP) and Temporary Assistance for Needy Families
(TANF) help improve access to nutritious foods. A higher percentage of children in the KFH-Woodland
Hills service areas whose families do not qualify for food assistance programs are likely to have limited
or uncertain access to adequate foods.
Food Insecure Population Ineligible for Assistance
Percentage of Children Living in Food Insecurity Who are Not Eligible for Assistance (SNAP, WIC, school Meals, etc.)
KFH-Woodland Hills Area West San Fernando Valley
Ventura County Los Angeles County
California
33% 30% 38% 26% 29%
Source: Feeding America. 2013. Source geography: County
91
Community Input
Community members shared the following concerns related to this health need:
West San Fernando Valley Don’t have access or money to buy nutritious food Lack of farmers markets Limited access to inexpensive and healthy foods Sidewalks are not complete making it difficult for people to walk Poor eating habits No safe place to play Lack of exercise No access to parks High consumption of unhealthy foods (fast food, juice, soda) Limited access to safe recreation spaces for exercise Transportation is a barrier to places like YMCA and Lanark Park
Ventura County Lack of physical activity Lack of healthy food Access to unhealthy processed foods Greasy food is cheaper Organic food is expensive Poor lighting in parks and streets limit walkability Lack of information regarding recreational facilities and gyms, nutrition programs and exercise classes Lack of information regarding health fairs for screenings and education Poor nutrition is perpetuated by lack of education and cultural values No access to sidewalks or parks Free/reduced school lunches are not nutritious Corner grocery stores with healthy options are not within one mile of low income areas
Assets & Opportunities for Overweight/Obesity (Adults)
Community assets are resources within the community potentially available to meet the identified need.
100 Citizens Program** – free physical activity program delivered by California State University Northridge Kinesiology students at San Fernando and El Cariso parks: http://www.100citizens.org/
California Food Pantries - A dynamic website that lists food pantries and food banks in California by city; http://www.foodpantries.org/st/california
Choose Health LA** - Local initiative of the Los Angeles County Department of Public Health to prevent and control chronic disease in LA County by bringing together a broad range of partners to implement community based public education, skills-building and environmental changes that promote physical activity and healthy eating. Includes Choose LA Kids, Choose Health LA Child Care and Choose Health LA Moms: http://www.choosehealthla.com/about-us/
Chronic Disease Prevention Program* - Encourages healthy active living through free physical activity and healthy eating opportunities including health screens (blood sugar, blood pressure and body fat), fitness classes, walking clubs and diabetes self-management; http://vchca.org/public-health/events-and-activity-calendars
Community Gardens* - List of community garden plots by city. Some may require nominal fees; http://healthyventuracounty.org/healthy-eating/community-gardens/Food Share, Inc.* - A nonprofit organization dedicated to reducing hunger in Ventura County through distributing healthy foods to low income families and educating the community about hunger. Community members can download a list of food pantries in Ventura County including their hours of operation;
HEAL (Healthy Eating, Active Living) Healthy School Partnership Program – School-based initiative by Kaiser Permanente that aims to prevent and treat childhood obesity and increase healthy behaviors through full integration between the school and Wellness Center by 1) improving school-based healthcare services in obesity prevention and management, 2) improving and increasing access to physical activity opportunities, 3) improving and increasing access to healthy food and beverages options offered on campus, and 4) improving learning opportunities about health eating and active living: http://thelatrust.org/heal/
Healthy Class** – Search for articles, apps, medication and health information, classes and educational events for chronic diseases in the San Fernando Valley area. Most classes are held at hospitals or clinics and cover disease prevention, management, diet and meal planning: http://www.healthyclass.com/site-map/california/san-fernando-valley/diabetes
Local Harvest: Locates farmers markets, family farms, farm stands and community supported agriculture (CSA); http://www.localharvest.org
Los Angeles County Department of Parks and Recreation** – Provides the public a wide variety of recreational opportunities including special programs for children and seniors and food programs and fitness classes for all ages. Use the Parks Locator to find the closest park by address, city or zip code: http://parks.lacounty.gov/wps/portal/dpr/parkslocator/
Los Angeles County Department of Public Social Services (DPSS)** - Offers nutrition assistance in the form of CalFresh benefits (formerly known as Food Stamps) to help individuals and families with little or no income to buy nutritious groceries; http://www.ventura.org/human-services-agency/calfresh-food-stamps
Los Angeles Food Policy Council** – Collective impact initiative working to build a Good Food system for all Los Angeles residents where food is healthy, affordable, fair, and sustainable: http://goodfoodla.org/
Nutrition Education and Obesity Prevention Program: provides nutrition education classes, cooking and physical activity demonstration to promote informed food choices and healthier lifestyles; http://vchca.org/public-health/health-education/nutrition-education
Partnership for a Healthy Ventura County (PHVC)* - A partnership-driven network of government, community, direct services providers, schools, and local business representative that share resources and promote policies and services around issues related to healthy eating and active living in Ventura County; http://healthyventuracounty.org/about-us/
University of California, Master Gardeners of Ventura County* - A helpful site dedicated to providing the community gardening advice; http://ucanr.edu/sites/VCMG/
Valley Care Community Consortium’s Chronic Disease Committee** – Collaboration of public and private community partners to advocate, plan, assess needs and facilitate development of effective programs and policies to improve the health of the residents of the San Fernando and Santa Clarita Valleys: http://www.valleyccc.org/aboutus.php
Ventura County Parks and Recreation* – Locate parks and recreation sites in the county: http://www.ventura.org/general-services-agency/parks-department
Ventura County Together – Collaboration of non-profit agencies, public agencies and community members who come together to address the growing need for basic needs (food, shelter and health care) services in Ventura County: http://www.vctogether.org/index.htm
Women, Infant & Children (WIC) Supplemental Nutrition Program at eight Ventura County Health Care Agency sites* – Provides vouchers for healthy foods, support for breast-feeding, nutrition education, and helps with locating other health care and community services. Services are for children under 5 years and women who are pregnant, breastfeeding or new mothers below 185% of the federal poverty level: http://www.vchca.org/public-health/wic/locations
Women, Infant & Children (WIC) Supplemental Nutrition Program at two Northeast Valley Health Corporation locations** – Provides vouchers for healthy foods, support for breast-feeding,
nutrition education, and helps with locating other health care and community services. Services are for children under 5 years and women who are pregnant, breastfeeding or new mothers below 185% of the federal poverty level: https://www.nevhc.org/programs-a-services/wic-nutrition-program.html
YMCA (Ventura)* – Offers youth development programs, fitness and wellbeing programs, employment/vocational training, and sports and recreation programs. http://www.ciymca.org/ventura/index.html
YMCA (North Valley & West Valley)** – Offers youth development programs, fitness and wellbeing programs, employment/vocational training, and sports and recreation programs. http://www.ymcala.org/metro/locations
Note: *Applies only to Ventura County; **Applies only to West San Fernando Valley. Icons from The Noun Project
Description & Significance: Diabetes is a disease in which blood glucose levels are above normal. This is due to low production of insulin, a hormone that gets glucose into the cells of the body. Diabetes is the 7th leading cause of death in the United States. Type 2 diabetes accounts for about 90% to 95% of all diagnosed diabetes. If untreated, diabetes can cause serious and potentially fatal health complications including heart disease, blindness, kidney failure, and amputation of the legs. About 86 million Americans over age 20 have pre-diabetes, an indicator precursor for diabetes. It means their blood glucose levels are higher than normal but not yet high enough to be called diabetes. People with pre-diabetes are also at higher risk to have a heart attack or stroke.
Health Outcome Statistics
81,274 Number of adults diagnosed with diabetes in the KFH-Woodland Hills service area.
Source: Centers for Disease Control and Prevention, National Center for Chronic Disease Prevention and Health Promotion. 2012. Source geography: County
Health Disparities
In the KFH-Woodland Hills service area, more men than women have diabetes.
Adults Diagnosed with Diabetes by Gender
Report Area Percent Males with Diabetes
Percent Females with Diabetes
Source: Centers for Disease Control and Prevention, National Center for Chronic Disease Prevention and Health Promotion. 2012. Source geography: County
KFH-Woodland Hills Service Area 7.65% 6.76%
West San Fernando Valley 7.9% 7.01%
Ventura County 7.2% 6.3%
Los Angeles County 8.3% 7.4%
California 8.41% 7.13%
KFH-Woodland Hills Service Area
West San Fernando Valley
Ventura County
Los Angeles County
California
7.60%
7.90%
7%
8.40%
8.05%
Population with Diagnosed Diabetes, Age-Adjusted Rate
Population with Diagnosed Diabetes, Age-Adjusted Rate
95
Key Health Drivers
Health Outcome
Overweight (Adult)
Although there are many risk factors for diabetes such as age, race, pregnancy, stress, certain medications, family history, high cholesterol and obesity, being overweight or obese is the single best predictor of diabetes as almost 90% of people living with diabetes are overweight or obese. In the KFH-Woodland Hills area over one-third of adults are overweight putting them at increased for diabetes.
Percent of Overweight Adults 18 and older
KFH-Woodland Hills Area
West San Fernando Valley
Ventura County Los Angeles County
California
36.1% 36.1% 36.3% 35.9% 35.8%
Source: Centers for Disease Control and Prevention, Behavioral Risk Factor Surveillance System. Accessed via the Health Indicators Warehouse. US Department of Health Human Services, Health Indicators Warehouse. 2005-09. Source geography: County
Health Behaviors (Healthy Eating)
Low Fruit/Vegetable Consumption (Adult)
Individual behaviors, socioeconomic status, and the physical environment can impact one’s ability to make healthy eating choices on a daily basis. Healthy eating can help individuals with pre-diabetes stave off developing diabetes and support those already diagnosed with diabetes with managing their disease. In the KFH-Woodland Hills service areas, individual eating behaviors do play a role appears to be a significant driver for overweight. For the most part, the service area exceeds the state.
Percentage of adults age 18 and older who self-report consuming less than 5 servings of fruits and vegetables each day
KFH-Woodland Hills Area
West San Fernando Valley
Ventura County Los Angeles County
California
71.6% 72.1% 70.7% 72.8% 71.5%
Source: Centers for Disease Control and Prevention, Behavioral Risk Factor Surveillance System. Accessed via the Health Indicators Warehouse. US Department of Health Human Services, Health Indicators Warehouse. 2005-09. Source geography: County
96
Health Behaviors (Physical Activity)
Being active, combined with healthy eating, can help keep your weight, blood glucose levels,
cholesterol, and blood pressure on target. In the KFH-Woodland Hills service area, many adults are
physically inactive.
Physical Inactivity (Adult)
Percentage of adults age 20 and older who self-report that they perform no leisure time activity
KFH-Woodland Hills Area
West San Fernando Valley
Ventura County Los Angeles County
California
16.8% 17% 16.4% 17.3% 16.6%
Source: Centers for Disease Control and Prevention, National Center for Chronic Disease Prevention and Health
Promotion. 2012. Source geography: County
Walking/Biking
Percent of the Adult Population Walking or Biking to Work
KFH-Woodland Hills Area West San Fernando Valley
Ventura County Los Angeles County
California
2.71% 2.65% 2.63% 3.75% 3.84%
Source: US Census Bureau, American Community Survey. 2010-14. Source geography: Tract
Physical Environment
Fast Food Restaurants
Proximity to fast food restaurants has been found to impact obesity among the youth. The closer they
area to these establishments, the more likely the less likely to are to eat fruits and vegetables, more
likely to drink more soda and as a result be overweight or obese. Based on the table below, there are
more fast food restaurants in the KFH-Woodland Hills Medical Center service area.
Number of Fast Food Restaurants Per 100,000 Population
KFH-Woodland Hills Area
West San Fernando Valley
Ventura County Los Angeles County
California
80.38 85.17 73.36 77.82 74.51
Source: US Census Bureau, County Business Patterns. Additional data analysis by CARES. 2011. Source geography: Tract
97
Grocery Stores
Access to healthy food can influence dietary behaviors. Grocery stores are defined as supermarkets
and smaller grocery stores primarily engaged in retailing a general line of food, such as canned and
frozen foods; fresh fruits and vegetables; and fresh and prepared meats, fish, and poultry. Within the
KFH-Woodland Hills Medical Center service area, there are fewer grocery stores than California. For
Ventura County service area, there are fewer stores that accept WIC vouchers.
Number of Grocery Stores Per 100,000 Population
KFH-Woodland Hills Area
West San Fernando Valley
Ventura County Los Angeles County
California
21.39 20.63 21.38 20.92 21.51
Source: US Census Bureau, County Business Patterns. Additional data analysis by CARES. 2011. Source geography: Tract
WIC-Authorized Food Stores
Number of Stores that Accept WIC Vouchers per 100,000 Population
KFH-Woodland Hills Area West San Fernando Valley
Ventura County Los Angeles County
California
15.7 16.3 14.8 17 15.8
Source: US Department of Agriculture, Economic Research Service, USDA - Food Environment Atlas. 2011. Source geography: County
Social & Economic
The Supplemental Nutrition Assistance Program (SNAP) and Temporary Assistance for Needy Families
(TANF) help improve access to nutritious foods. A higher percentage of children in the KFH-Woodland
Hills service areas whose families do not qualify for food assistance programs are likely to have limited
or uncertain access to adequate foods.
Food Insecure Population Ineligible for Assistance
Percentage of Children Living in Food Insecurity Who are Not Eligible for Assistance (SNAP, WIC, school Meals, etc.)
KFH-Woodland Hills Area West San Fernando Valley
Ventura County Los Angeles County
California
33% 30% 38% 26% 29%
Source: Feeding America. 2013. Source geography: County
98
Community Input
Community members shared the following concerns related to this health need:
West San Fernando Valley Don’t have access or money to buy nutritious food Lack of farmers markets Limited access to inexpensive and healthy foods Sidewalks are not complete making it difficult for people to walk Poor eating habits No safe place to play Lack of exercise No access to parks High consumption of unhealthy foods (fast food, juice, soda) Limited access to safe recreation spaces for exercise Transportation is a barrier to places like YMCA and Lanark Park
Ventura County Lack of physical activity Lack of healthy food Access to unhealthy processed foods Greasy food is cheaper Organic food is expensive Poor lighting in parks and streets limit walkability Lack of information regarding recreational facilities and gyms, nutrition programs and exercise classes Lack of information regarding health fairs for screenings and education Poor nutrition is perpetuated by lack of education and cultural values No access to sidewalks or parks Free/reduced school lunches are not nutritious Corner grocery stores with healthy options are not within one mile of low income areas
Assets & Opportunities for Diabetes
Community assets are resources within the community potentially available to meet the identified need.
100 Citizens Program** – free physical activity program delivered by California State University Northridge Kinesiology students at Lanark park: http://www.100citizens.org/
Choose Health LA** - Local initiative of the Los Angeles County Department of Public Health to prevent and control chronic disease in LA County by bringing together a broad range of partners to implement community based public education, skills-building and environmental changes that promote physical activity and healthy eating. Includes Choose LA Kids, Choose Health LA Child Care and Choose Health LA Moms: http://www.choosehealthla.com/about-us/
Chronic Disease Prevention Program* - Encourages healthy active living through free physical activity and healthy eating opportunities including health screens (blood sugar, blood pressure and body fat), fitness classes, walking clubs and diabetes self-management; http://vchca.org/public-health/events-and-activity-calendars
Healthy Class** – Search for articles, apps, medication and health information, classes and educational events for chronic diseases in the San Fernando Valley area. Most classes are held at hospitals or clinics and cover disease prevention, management, diet and meal planning: http://www.healthyclass.com/site-map/california/san-fernando-valley/diabetes
Los Angeles Department of Parks and Recreation** – Provides the public a wide variety of recreational opportunities including special programs for children and seniors and food programs and fitness classes for all ages. Use the Parks Locator to find the closest park by
address, city or zip code: http://parks.lacounty.gov/wps/portal/dpr/parkslocator/
Los Angeles County Department of Public Social Services (DPSS)** - Offers nutrition assistance in the form of CalFresh benefits (formerly known as Food Stamps) to help individuals and families with little or no income to buy nutritious groceries; http://www.ventura.org/human-services-agency/calfresh-food-stamps
Valley Care Community Consortium’s Chronic Disease Committee** – Collaboration of public and private community partners to advocate, plan, assess needs and facilitate development of effective programs and policies to improve the health of the residents of the San Fernando and Santa Clarita Valleys: http://www.valleyccc.org/aboutus.php
Ventura County Parks and Recreation* – Locate parks and recreation sites in the county: http://www.ventura.org/general-services-agency/parks-department
Ventura County Together* – Collaboration of non-profit agencies, public agencies and community members who come together to address the growing need for basic needs (food, shelter and health care) services in Ventura County: http://www.vctogether.org/index.htm
Women, Infant & Children (WIC) Supplemental Nutrition Program at eight Ventura County Health Care Agency sites* – Provides vouchers for healthy foods, support for breast-feeding, nutrition education, and helps with locating other health care and community services. Services are for children under 5 years and women who are pregnant, breastfeeding or new mothers below 185% of the federal poverty level: http://www.vchca.org/public-health/wic/locations
Women, Infant & Children (WIC) Supplemental Nutrition Program at two Northeast Valley Health Corporation locations** – Provides vouchers for healthy foods, support for breast-feeding, nutrition education, and helps with locating other health care and community services. Services are for children under 5 years and women who are pregnant, breastfeeding or new mothers below 185% of the federal poverty level: https://www.nevhc.org/programs-a-services/wic-nutrition-program.html
YMCA Diabetes Prevention Program – Trained lifestyle coaches use a CDC-approved curriculum to introduce topics in small group environments and encourage participants as they explore how healthy eating, physical activity, and behavior changes, and weight loss can help them reduce their risk of developing diabetes: http://www.ymca.net/diabetes-prevention
Note: *Applies only to Ventura County; **Applies only to West San Fernando Valley. Icons from The Noun Project
Description & Significance: According to the Center for Disease Control and Prevention, mental health is a state of well-being in which the individual realizes his or her own abilities, can cope with the normal stresses of life, can work productively and fruitfully, and is able to make a contribution to his or her communities. There is evidence that positive mental health is associated with improved health outcomes. Mental illnesses are health conditions that are characterized by alterations in thinking, mood, or behavior or a combination of these. These conditions are usually associated with distress and/or impaired functions. Approximate 1 in 5 adults (43.8 million) experience mental illness in a given year. Depression is the most common type of mental illness with 16 million adults having at least one major depressive episode in the past year. And among the 20.2 million adults who experienced a substance use disorder, 50.5% (10.2 million) had a co-occurring mental illness.
People with mental health problems are more likely to have rates of chronic diseases (including HIV), practice high risk behaviors, be more vulnerable (to poverty, social isolation, trauma and violence, discrimination, and incarceration), and lack access to health care.
Health Outcome Statistics
The graph below indicates there is a high rate of depression among seniors in the KFH-Woodland Hills service area, more than the state.
Source: Centers for Medicare and Medicaid Services. 2012. Source geography: County
KFH-Woodland HillsService Area
West San FernandoValley
Ventura County Los Angeles County California
13.70%
14.20%
13%
15.10%
13.40%
Percent Medicare Beneficiaries with Diagnosed Depression
Percent with Depression
101
The chart below reports the percentage of adults who self-report that there was ever a time during the past 12 months when they felt that they might need to see a professional because of problems with their mental health, emotions, nerves, or use of alcohol or drugs. Adults who felt they needed mental health care are particularly high in the West San Fernando Valley. This indicator is relevant because it is a measure of general poor mental health status and demand for mental and behavioral health services.
Source: University of California Center for Health Policy Research, California Health Interview Survey. 2013-14.
Source geography: County (Grouping)
Health Disparities
Poor mental status is one of the many risk factors for suicide. Across the KFH-Woodland Hills service area, the White ethnic group has the highest suicide rate similar to California.
Source: University of Missouri, Center for Applied Research and Environmental Systems. California Department of Public Health, CDPH - Death Public Use Data. 2010-12. Source geography: ZIP Code
15.70%
16.60%
13.90%
18%
15.90%
KFH-Woodland Hills Service Area
West San Fernando Valley
Ventura County
Los Angeles County
California
Percentage Adult Population with Poor Mental Health
Percentage with Poor Mental Health
13.92
6.23
9.63
5.69
2.95
4.42
3.13
14.7
8.3
12.8
5.4
0
4.9
2.9
13.31
5.89
7.5
5.79
4.15 4.123.24
14.8
6.366.82
5.9
9.68
5.84
4.04
Non-HispanicWhite
African American Asian Native American /Alaskan Native
Native Hawaiian /Pacific Islander
Multiple Race Hispanic or Latino
Suicide Mortality (Per 100,000 Population) by Race/Ethnicity
KFH-Woodland Hills Service Area West Ventura County (Service Area) Woodland Hills (Service Area) California
102
Key Health Drivers
Clinical Care
Lack of Social or Emotional Support
Friends and family can influence someone with mental illness to get the treatment and services they need. They can make themselves available to help, support them in accessing mental health services and treat them with respect. The table below indicates the level of lack of social or emotional support in the service area compared to the state.
Percent of Adults Age 18 and Older who Report Inadequate Social or Emotional Support
KFH-Woodland Hills Area West San Fernando Valley
Ventura County Los Angeles County
California
25.1% 26.4% 22.6% 28.4% 24.6%
Source: Centers for Disease Control and Prevention, Behavioral Risk Factor Surveillance System. Accessed via the Health Indicators Warehouse. US Department of Health Human Services, Health Indicators Warehouse. 2006-12. Source geography: County
Community Input
Community members shared the following concerns related to this health need:
West San Fernando Valley Mental stress related to economic security, expensive housing, immigration status, and lack of access to care and insurance Lack of institutions to provide housing to mentally ill individuals Homelessness Poverty Stigma surrounding mental health is a barrier Appointments for mental health are too complicated and can be cancelled No access to specialty care providers People don’t feel safe in their neighborhoods due to violence and being assaulted or violence in their homes Mental health system is complicated to navigate Not covered by insurance
Ventura County Homelessness – no one talks about it in Ventura Homebound due to physical health reasons Lack of mental health therapy Medi-Cal does not cover mental health Lack of shelter for mentally ill individuals Language barrier results in isolation which causes depression Stressful to identify and access services Lack of mental health services available to Hispanic/Latinos in Santa Paula Perception that mental health problems represent a weakness in a person Finances, health problems, housing issues, relationships and education attainment increase stress
103
Assets & Opportunity for Mental Health
Community assets are resources within the community potentially available to meet the identified need.
Los Angeles County Department of Mental Health – Services include assessments, case management, crisis intervention, medication support, peer support and other rehabilitative services: http://dmh.lacounty.gov/wps/portal/dmh/our_services
National Alliance on Mental Health (NAMI)* – grassroots mental health organization dedicated to building better lives for Americans affected by mental illness through community education, advocacy, helpline and referral support. Location in Camarillo: http://namiventura.org/
LAUSD School Mental Health** – Established clinics and centers throughout the District to provide high quality direct free mental health services to students and families in conveniently located facilities which includes Valley School Mental Health Clinic (Van Nuys): http://notebook.lausd.net/portal/page?_pageid=33,1049491&_dad=ptl&_schema=PTL_EP
Network of Care** – List of mental health services and programs for service members, veterans and their families: http://losangeles.networkofcare.org/veterans/services/category.aspx?cid=33440&targetgrp=
Substance Abuse and Mental Health Services Administration (SAMHSA) - Substance Abuse Treatment Facility Locator: https://findtreatment.samhsa.gov/TreatmentLocator/faces/geographicSearch.jspx
Ventura County Behavioral Health Department* – Provides services for youth and adults for alcohol and drugs and mental health: http://www.vchca.org/behavioral-health
Note: *Applies only to Ventura County; **Applies only to West San Fernando Valley. Icons from The Noun Project
Description & Significance: According to World Health Organization (WHO), substance abuse refers to the harmful use of psychoactive substances, including alcohol, tobacco, prescription and illicit (marijuana, cocaine, heroin, etc.) drugs. In 2013, 24.6 million people ages 12 years and older used an illicit drug in the past month. In 2014, 16.3 million adults and an estimated 679,000 adolescents ages 12-17 had an alcohol use disorder. Nearly 88,000 people die from alcohol-related causes annually and 31% of overall driving fatalities are due to alcohol-impaired driving.
Repeated use of psychoactive substances can lead to a dependence on the drug including a strong desire to take the drug, difficulties in controlling its use, persisting in its use despite harmful consequences, a higher priority given to drug use than to other activities and obligations, increased tolerance resulting in needing a higher dose, and sometimes a physical withdrawal state. Many adverse consequences can result from substance abuse: the spread of infectious disease such as HIV/AIDs and Hepatitis C through sharing of drug paraphernalia or unprotected sex; death due to overdose; effects on unborn children of drug-using women; crime; and homelessness.
Health Outcome Statistics
Excessive alcohol consumption is a more significant health problem in Ventura County than
in West San Fernando Valley in the KFH-Woodland Hills service area.
Source: Centers for Disease Control and Prevention, Behavioral Risk Factor Surveillance System. Accessed via the Health Indicators Warehouse. US Department of Health Human Services, Health Indicators Warehouse. 2006-12. Source geography: County
A liquor store is a place where alcohol may be legally sold. There is evidence of a positive relationship between the number of liquor stores and excessive alcohol consumption and the related harms. The Presence of more liquor stores may increase the chances of alcohol use. The table below measures the rate per 100,000 population of number of beer, wine and liquor store access. People within the KFH-Woodland Hills Area have more liquor stores than the state, particularly Ventura County.
Number of Liquor Stores per 100,000 Population
KFH-Woodland Hills Area West San Fernando Valley
Ventura County
Los Angeles County
California
13.73 13.52 14.82 11.41 10.02
Source: US Census Bureau, County Business Patterns. Additional data analysis by CARES. 2012. Source geography: ZCTA
Community Input
Community members shared the following concerns related to this health need:
West San Fernando Valley Tobacco use “Mental health issues can contribute to drug use because individuals use drugs to self-medicate” Routine exposure to alcohol and drug messages Environments conducive to substance use (high density of alcohol outlets and low degree of job opportunities and quality education) Lack of opportunity to ask for help or assistance
Ventura County Few classes on drug dependence Drugs are seen in the neighborhood Unemployment Most community members do not have insurance to pay for behavioral health care Substance abuse services for adolescents is limited
Assets & Opportunities Substance Use and Abuse
Community assets are resources within the community potentially available to meet the identified need.
1-800-NO-BUTTS – California’s smokers’ helpline providing free telephone counseling, text messages and web-based referral to smokers and their loved ones. Search for nearby help by County: http://www.nobutts.org/county-listing
Alcoholics Anonymous* – An international fellowship of men and women who share their experience, strength and hope with each other that they may solve their common problem and help
others to recover from alcoholism: http://aaventuracounty.org/
Alcoholics Anonymous** – An international fellowship of men and women who share their experience, strength and hope with each other that they may solve their common problem and help others to recover from alcoholism: http://lacoaa.org/find-a-meeting/
Narcotics Anonymous* – Offers recovery to addicts around the world by focusing on the disease of addiction rather than any particular drug: http://www.clana.org/index.html
Narcotics Anonymous** – Offers recovery to addicts around the world by focusing on the disease of addiction rather than any particular drug: http://weana.org/
Los Angeles County Substance Abuse Prevention and Control (SAPC) – Provider locator by agency name, city, or zip code: http://sapccis.ph.lacounty.gov/registration/providerlocator/providerdirectory2.aspx
Nicotine Anonymous – Fellowship of men and women helping each other live their lives free of nicotine: https://nicotine-anonymous.org/face-to-face-meetings.html
Smokefree women – Helps with quitting smoking by providing quitting advice, tips and support specific to women’s needs, including expecting mothers: http://women.smokefree.gov/
Smoking Cessation – Created by the Tobacco Control Research Branch of the National Cancer Institute to helps individuals quit smoking cigarettes by providing immediate assistance in the form of quitlines, LiveHelp, information, Smokefree texts, apps and publication: http://smokefree.gov/
Substance Abuse and Mental Health Services Administration (SAMHSA) - Substance Abuse Treatment Facility Locator: https://findtreatment.samhsa.gov/TreatmentLocator/faces/geographicSearch.jspx
Tobacco Control and Prevention Program Project** – aimed to reduce smoking prevalence and decrease exposure to secondhand smoke, especially in disadvantaged communities by implementing evidence-based policies and environmental change strategies that promote tobacco cessation and smoke-free environments: http://www.laquits.com/
Note: *Applies only to Ventura County; **Applies only to West San Fernando Valley. Icons from The Noun Project
Description and Significance: More than 46 million Americans live below the poverty line and increasing unemployment is putting more families at risk for poverty. Studies suggest that loss of job and economic distress decrease mental and physical health and reduce the ability to access basic needs. Data shows that in 2011, 48.8 million Americans, including 16.2 million children are struggling against hunger. And although millions of people have gained health coverage under the Affordable Care Act (ACA), over 32 million individuals under age 65 years remained uninsured in 2014. Studies demonstrate that the uninsured are less likely to receive preventive care services and recommended for major health conditions and chronic diseases. In 2014, 27% of uninsured adults went without needed care due to cost.
Health Outcome Statistics
The chart below indicates a high percentage of adults in the KFH-Woodland Hills service
area that self-report having poor mental health, slightly below the state rate.
Source: University of California Center for Health Policy Research, California Health Interview Survey. 2013-14.
Source geography: County (Grouping)
15.70%
16.60%
13.90%
18%
15.90%
KFH-Woodland Hills Service Area
West San Fernando Service Area
Ventura County
Los Angeles County
California
Percentage Adult Population with Poor Mental Health
Percentage with Poor Mental Health
108
There are significantly more individuals in the KFH-Woodland Hills service area without a consistent source of primary healthcare compared to the state.
Source: University of California Center for Health Policy Research, California Health Interview Survey. 2011-12. Source geography: County (Grouping)
The national supplemental nutrition assistance program (SNAP) offer nutrition assistance to millions of eligible low-income individuals and families (130% of the federal poverty level) and provides economic benefits to communities. For over 8 years, more individuals in the KFH-Woodland Hills service area consistently receive SNAP benefits to supplement their food purchases thereby indicating a high population of low-income individuals.
Source: US Census Bureau, Small Area Income Poverty Estimates. 2011. Source geography: County
KFH-Woodland Hills Service Area
West San Fernando Valley Service Area
Ventura County
Los Angeles County
California
16.10%
16.40%
15.70%
16.70%
14.30%
Percentage Without Regular Doctor
Percentage Without Regular Doctor
0.00%
5.00%
10.00%
15.00%
20.00%
25.00%
2004 2005 2006 2007 2008 2009 2010 2011
Percent Population Receiving SNAP Benefits by Year, 2004-2011
KFH-Woodland Hills Service Area California
109
An estimated 14% of American households were food insecure at least some time during 2014 which means they lacked access to enough food for an active, healthy life for all household members. Despite availability of SNAP and other government aid programs, many children live in food insecurity because the household income does not meet the eligibility requirements.
Source: Feeding America. 2013. Source geography: County
Although there are fewer uninsured people in the KFH-Woodland Hills service area compared to the state, the rate is far from meeting the healthy people 2020 goal of zero percent.
Source: US Census Bureau, American Community Survey. 2010-14. Source geography: Tract
33%
30%
38%
26%
29%
KFH-Woodland HillsService Area
West San FernandoValley Service Area
Ventura County Los Angeles County California
Percentage of Food Insecure Children Ineligible for Assistance
Percentage of Food Insecure Children Ineligible for Assistance
15.41%13.85%
15.18%
20.85%
16.69%
KFH-WoodlandHills Service Area
West SanFernando Valley
Service Area
Ventura County Los AngelesCounty
California
Percent Uninsured Population
Percent Uninsured Population
110
Health Disparities
Similar to the state, Hispanic/Latinos are more likely than other races to be insured. As a result, they may be more likely to have lower health outcomes compared to the other races.
Source: US Census Bureau, American Community Survey. 2010-14. Source geography: Tract
Key Health Drivers
Social & Economic
Unemployment Rate
Falling incomes and less secure jobs contribute to homelessness. Low-income workers are at particular
risk of losing their homes as it becomes difficult to support their families. Displaced workers face
difficulty finding new employment and when they do find work, their new wages are likely to be less
than the ones they lost.
Unemployment Rate of Population 16 and Older
KFH-Woodland Hills Area West San Fernando Valley
Ventura County Los Angeles County
California
6.7% 7.1% 6.2% 7.5% 6.8%
Source: US Department of Labor, Bureau of Labor Statistics. 2015 - December. Source geography: County
8.55%
13.09%
20.16%
11.63%
19.30%
29.89%
13.71%
26.13%
9.63%
14.22%
23.05%
13.05%
18.22%
29.59%
12.57%
25.90%
Non-Hispanic White
Black or African American
Native American / Alaska Native
Asian
Native Hawaiian / Pacific Islander
Some Other Race
Multiple Race
Hispanic / Latino
Uninsured Population by Race Alone, Percent
California KFH-Woodland Hills Service Area
111
Physical Environment
Head Start Program Facilities
Research indicates that living in poverty in early childhood is associated with less than average rates of school completion and lower than average academic performance beginning from kindergarten. The higher the level of education, the more earnings increased. One of the many purposes of head start programs is to promote school readiness among young children from low-income families. The table below indicates there are fewer Head Start facilities in the medical center service area than the state indicating that low-income families in the service area are less likely to have opportunities for these programs.
Head Start Programs Facilities Rate, Per 10,000 Children Under Age 5
KFH-Woodland Hills Area West San Fernando Valley
Ventura County Los Angeles County
California
3.11 1.59 3.98 7.17 6.34
Source: US Department of Health Human Services, Administration for Children and Families. 2014. Source geography: Point
Community Input
Community members shared the following concerns related to this health need:
West San Fernando Valley Discrimination against sexual orientation makes it harder to secure employment Poverty and socio-economic status limits access to care and community resources Lack of educational attainment Unemployment results in homelessness and unstable housing
Ventura County Need to engage non-traditional stakeholders to increase educational attainment Children to need to receive higher quality education in order to increase their economic opportunities Support parents in early child development because verbal, learning and communications skills are mostly learned before the start of schooling Poverty is a big problem resulting in lack of affordable housing, lack of transportation options, lack of social and community support, lack of investment in the community and priorities Unemployment is perpetuating poverty
112
Assets & Opportunities Economic Security
Community assets are resources within the community potentially available to meet the identified need.
EDD – job search assistance
Ventura Rescue Mission** - lighthouse for women and children, meals, clothing assistance, programs for men http://venturacountyrescuemission.com/index.php/en/
Resources for Homeless People in Western Ventura County** - this is a resource directory with phone numbers and addresses for alcohol & drug services, Calworks, General Relief, CalFresh, Medi-Cal, bus, campground, children services, citizenship/immigration, disabled services, housing, shelters, showers/toilets, meals, medical and mental health services, transportation, domestic violence, employment and job training etc.
Department of Social Services – Employment, cash aid, food, residential care, day care, in-home care, adoption, foster care, refugee services. http://www.dss.cahwnet.gov/cdssweb/PG181.htm
Salvation Army – alcohol & drug rehabilitation, health services, homeless services, veterans & senior services http://www.salvationarmy-socal.org/southern-california/LA_County#sanfernandovalley
San Fernando Santa Clarita Valleys Homeless Coalition* - coalition of agencies that provide homeless services in San Fernando and Santa Clarita Valleys come together to share resources and services they provide. Housing, mental health, homeless services www.lafh.org
California Department of Rehabilitation* - Homeless Resources for San Fernando: includes homeless service providers such as government agencies, food banks, homeless shelters/housing, hospitals, mental health agencies, job training, churches, mental health providers, Red Cross, sober living, drug & alcohol services, domestic violence, legal services and senior citizen services in San Fernando Valley. www.dor.ca.gov/GreaterLosAngeles/index.asp
Ventura Human Services Agency** – cash aid, food and nutrition, medical services, foster services, homeless issues, job training, covered Ventura county http://www.ventura.org/human-services-agency/human-services-agency
Chrysalis – help find jobs, job training, and job fairs. http://www.changelives.org/events/
Description & Significance: Primary care providers, such as family physicians, internists, or pediatricians are often the first contact with the health care system. They diagnose and treat common illness before they become serious and help patients manage chronic conditions. They offer preventive services such as flu shots, cancer screenings and education on health behaviors. Without access to regular primary care providers, people can end up in emergency rooms and often are admitted to the hospital. Good access to primary care increases life expectancy, prevents disability and reduces absences from work and schools.
Since the Affordable Care Act (ACA) was passed in 2010, 16.4 million uninsured people have gained insurance coverage. Since 2013, the uninsured rate has declined 9.2% for African Americans and 12.3% for Hispanic/Latinos.
Health Outcome Statistics
The chart below indicates the number of conditions that are ambulatory care sensitive
(ACS). ACS conditions include pneumonia, dehydration, asthma, diabetes, and other
conditions which could have been prevented if adequate primary care resources were
available and accessed by those patients. In the KFH-Woodland Hills service area, 114.55
hospital admissions area attributed to preventable causes.
Source: California Office of Statewide Health Planning and Development, OSHPD Patient Discharge Data. Additional data analysis by CARES. 2011. Source geography: ZIP Code
The table below displays that men are less likely to visit primary care physicians than women. Additionally, Latinos are less likely than other races to have a consistent primary care physician. Therefore, it is likely that these groups’ first access to care may be through the emergency room.
Population without Consistent Source of Primary Care by Sex and Race/Ethnicity
KFH-Woodland Hills Service Area
West San Fernando Valley
Ventura County
Los Angeles County
California
Male 19.81% 19.83% 19.7% 19.9% 16.95%
Female 13% 13.24% 12.5% 13.6% 11.63%
White 9.15% 9.52% 8.65% 10.34% 9.99%
African American
10.08% 10.08% no data 10.08% 11.03%
Hispanic 23.03% 22.05% 25.07% 20.7% 19.27%
Other race 15.85% 17.06% 12.66% 18.46% 13.85% Source: University of California Center for Health Policy Research, California Health Interview Survey. 2011-12.
Source geography: County (Grouping)
Key Health Drivers
Physical Environment
Health Professional Shortage Area – Primary Care
Access to primary care physicians is associated with health status. A higher number of physicians
increase the likelihood of accessing preventive care and disease management. A high percentage of
individuals in Ventura have less access to primary care physicians than the rest of the KFH-Woodland
Hills service area.
Percentage of Population Living in a Primary Care Health Professional Shortage Area
KFH-Woodland Hills Area West San Fernando Valley
Ventura County Los Angeles County
California
22.20% 0% 37.79% 31.35% 25.18%
Source: US Department of Health Human Services, Health Resources and Services Administration, Health
Resources and Services Administration. March 2015. Source geography: HPSA
115
Access to Primary Care
There are significantly fewer physicians and a high rate of individuals with no regular doctor in the KFH-Woodland Hills service area compared to the state as illustrated in the tables below significantly reducing their access to primary care services.
Rate of Primary Care Physicians per 100,000 Population
KFH-Woodland Hills Area West San Fernando Valley
Ventura County Los Angeles County
California
72.8 72.5 73.4 72 77.2
Source: US Department of Health Human Services, Health Resources and Services Administration, Area Health Resource File. 2012. Source geography: County Lack of a Consistent Source of Primary Care Percentage of Population without a Regular Doctor
KFH-Woodland Hills Area West San Fernando Valley
Ventura County Los Angeles County
California
16.10% 16.40% 15.70% 16.70% 14.30%
Source: University of California Center for Health Policy Research, California Health Interview Survey. 2011-12. Source geography: County (Grouping)
Over the course of 10 years, the number of primary care physicians in the KFH-Woodland Hills service area has increased likely due to the passing of the Affordable Care Act in 2010. This act made affordable health insurance more accessible to a larger percentage of the population through Medi-Cal expansion, opening the insurance marketplace and subsidizing health insurance costs for individual and families who qualify.
Source: US Department of Health Human Services, Health Resources and Services Administration, Area Health
Access to Primary Care Physicians Per 100,000 Population by Year 2002-2012
KFH-Woodland Hills Service Area
West San Fernando Valley
Los Angeles County
Ventura County
California
116
Community Input
Community members shared the following concerns related to this health need:
West San Fernando Valley “It is stressful when someone is trying to get healthcare services and is having difficulty navigating the system” Unable to take time off from work Lack insurance Lack of available primary care providers Limited availability of physicians leading to increased wait times Cannot afford health care when unemployed Poor health care access for undocumented individuals Lack of providers who accept Medi-Cal Poverty Unaffordable health coverage Unable to pay co-pays Health services are too far away Lack of education about the importance of primary care More community clinics and Federally Qualified Health Centers (FQHCs) are needed in the San Fernando Valley “Full Plate Syndrome”: Community residents have so many issues and concerns to be address regarding their day-to-day survival that maintenance of good health is a low priority
Ventura County Under-insured Complex health care system Transportation is expensive Lack of regular checkup because of lack of insurance Insurance is too expensive when offered Difficult to get appointments Limited referrals with Medi-Cal Long wait times in clinics and ER Lack of compassion from doctors to patients (rushed appointments, poor communication and little attention paid) Lack of transportation options Lack of health personnel that speak the clients’ language Lack of qualified personnel Language and cultural barriers Lack of finances and transportation Long work hours prevents making doctor’s appointment Increase the number of clinics to reduce wait time Extend weekday hours and increase weekend hours Limited services available for undocumented population
Asset & Opportunities for Access To Primary Healthcare
Community assets are resources within the community potentially available to meet the identified need.
211 LA County** - A resource link to programs and services available in the county. Service categories include housing, food, income, health care, mental health, substance abuse and transportation: https://www.211la.org/
211 Ventura Health Care* - A resource link to programs and services available in the county. Service categories include housing, food, income, health care, mental health, substance abuse and transportation. The list can be modified by city and zip code and many services are available in multiple languages; http://www.211ventura.org/
Covered California - Help Californians buy low-cost health insurance coverage. Those who qualify may get federal assistance to buy private insurance at a discount or get health insurance through Medi-Cal; http://www.coveredca.com/
Health Care for Kids & Ace for Kids Program* B- Health care assistance programs available to children from eligible families living in Ventura County; http://www.vchca.org/public-health/health-care-for-kids-ace
LAUSD Health and Wellness Policy** – A comprehensive health and wellness plan that encompasses nutrition services, physical education, health education, health services, mental health and social services, to ensure students can learn to make healthy choices for lifelong health and improve learning readiness and academic success among students: http://achieve.lausd.net/healthandwellness
Los Angeles County Department of Health Services** – Provides several no-cost and low-cost programs at county medical facilities, including ability to pay, pre-payment plan, mental health services, child delivery plan, discount payment plan, and dialysis, post-polio and tuberculosis plans: https://dhs.lacounty.gov/wps/portal/dhs/!ut/p/b1/04_SjzQ0NzYxNDY3MTXQj9CPykssy0xPLMnMz0vMAfGjzOLdDAwM3P2dgo3cXf0MDBwNwkx9DM3MjQy8DPTD9aMIKcmN8nIEAJ1y8rQ!/
My Health LA** – Provides primary care at no cost to eligible residents of LA County. MHLA is not an insurance but a health care program for the uninsured and un-insurable residents of the county: https://dhs.lacounty.gov/wps/portal/dhs/coverageoptions/myhealthla
The L.A. Trust Wellness Centers** – A collaboration between LAUSD Student Health and Human Services Division, the Joint Use Development Program and the L.A. Trust to increase access to vital health and mental health services, wellness promotion, and health career options: http://thelatrust.org/wellness-centers/
Note: *Applies only to Ventura County; **Applies only to West San Fernando Valley. Icons from The Noun Project
Description & Significance: The human body is made up of trillions of cells. Normally, these cells grow, divide into new cells and when old or damaged die. Cancers occur when this normal process breaks down. Old and damaged cells continue to divide without stopping and grow into a tumor. Cancer cells are malignant and so can spread into or invade nearby and distant tissues. When removed, cancers cells may re-grow. Cancer can grow in any body tissue, including breast, lung, skin, colon, prostate, blood etc.
Cancer mortality rate has been decreasing in the nation since the early 1990s. The 2016 Annual report to the Nation on the Status of Cancer state that from 2003 to 2012, cancer death rates have declined on average 1.8% per year among men, 1.4% per year among women and 2% per year among children 0-19 years. Many cancers are associated with behavioral causes. More than 3% of cancer deaths (3.5%) are alcohol-related including breast, and colon and rectum cancers. And 4% of new cancer cases in men and 7% in women are associated with obesity including colon and rectum, breast. About 80% of lung cancer are cause by tobacco smoking and other by secondhand smoking.
Health Outcome Statistics
The rates of new cases of cancers in the KFH-Woodland Hills service area either exceed or are slightly less than those of the state.
Breast Cancer
Source: National Institutes of Health, National Cancer Institute, Surveillance, Epidemiology, and End Results Program. State Cancer Profiles. 2008-12. Source geography: County
KFH-WoodlandHills Service
Area
West SanFernando Valley
Ventura County Los AngelesCounty
California
126.2
122.5
132.8
116.9
122.1
Breast Cancer Incidence Rate
Breast Cancer Incidence Rate (Per 100,000 Pop.)
119
Colon and Rectum Cancer (Colorectal Cancer)
Source: National Institutes of Health, National Cancer Institute, Surveillance, Epidemiology, and End Results Program. State Cancer Profiles. 2008-12. Source geography: County
Lung Cancer
Source: National Institutes of Health, National Cancer Institute, Surveillance, Epidemiology, and End Results Program. State Cancer Profiles. 2008-12. Source geography: County
KFH-WoodlandHills Service
Area
West SanFernando
Valley
VenturaCounty
Los AngelesCounty
California HP 2020Target
39.6
40.3
38.4
41.3
40
38.7
Colon and Rectum Cancer Incidence Rate (Per 100,000 Pop.)
Colon and Rectum Cancer Incidence Rate (Per 100,000 Pop.)
KFH-WoodlandHills Service
Area
West SanFernando
Valley
Ventura County Los AngelesCounty
California
42.2 4242.7
41.6
48
Lung Cancer Incidence Rate (Per 100,000 Pop.)
Lung Cancer Incidence Rate (Per 100,000 Pop.)
120
Prostate Cancer
Source: National Institutes of Health, National Cancer Institute, Surveillance, Epidemiology, and End Results Program. State Cancer Profiles. 2008-12. Source geography: County
Health Disparities
Cancer Mortality: The graph below displays that overall Native Hawaiians/Pacific Islanders, African Americans, and Whites die of cancer at a higher rate respectively than other ethnic groups in the KFH-Woodland Hills Service Area (145.56 per 100,000 population).
Source: University of Missouri, Center for Applied Research and Environmental Systems. California Department of Public Health, CDPH - Death Public Use Data. 2010-12. Source geography: ZIP Code
KFH-WoodlandHills Service
Area
West SanFernando Valley
Ventura County Los AngelesCounty
California
123.9
123.2
125.2
122
126.9
Prostate Cancer Incidence Rate (Per 100,000 Pop.)
Prostate Cancer Incidence Rate (Per 100,000 Pop.)
161.23
205.42
74.64113.32
218.2
44.83
105.15
145.56
Cancer Mortality Rates in KFH-Woodland Hills Service Area by Race/Ethnicity, Per 100,000 Population
KFH Woodlandhills Service Area
121
Breast Cancer
Breast cancer is the most common cancer in women following skin cancer in the United States. It occurs in both men and women, but it is very rare in men. Most new cases in the KFH-Woodland Hills service area are among White and African American ethnic groups.
New Cases of Breast Cancer in the KFH-Woodland Hills Service Area by Race/Ethnicity per 100,000 Population, Age-Adjusted
Report Area White African American
Asian / Pacific Islander
American Indian / Alaskan Native
Hispanic or Latino
KFH-Woodland Hills Area
130.4 123.3 98.3 17 88.7
Source: National Institutes of Health, National Cancer Institute, Surveillance, Epidemiology, and End Results Program. State Cancer Profiles. 2008-12. Source geography: County
Colon and Rectum Cancer
Colorectal cancer is the third most common type of cancer in men and women in the United States. Deaths from colorectal cancer have decreased with the use of colonoscopies and fecal occult blood tests (checks for blood in the stool). African Americans account for the most number of new cases in the KFH-Woodland Hills service area.
New Cases of Colorectal Cancer in the KFH-Woodland Hills Service Area by Race/Ethnicity per 100,000 Population, Age-Adjusted
Report Area White African American
Asian / Pacific Islander
American Indian / Alaskan Native
Hispanic or Latino
KFH-Woodland Hills Area
38.8 53.3 36.9 6.8 34.1
Source: National Institutes of Health, National Cancer Institute, Surveillance, Epidemiology, and End Results Program. State Cancer Profiles. 2008-12. Source geography: County
Lung Cancer
Lung cancer is the leading cause of cancer death in the United States among both men and women. Tobacco smoking is the most common cause of lung cancer. African Americans account for the most number of new cases in the KFH-Woodland Hills service area.
New Cases of Lung Cancer in the KFH-Woodland Hills Service Area by Race/Ethnicity per 100,000 Population, Age-Adjusted
Report Area White African American
Asian / Pacific Islander
American Indian / Alaskan Native
Hispanic or Latino
KFH-Woodland Hills Area
42.9 56.2 32.2 5.6 24.3
Source: National Institutes of Health, National Cancer Institute, Surveillance, Epidemiology, and End Results Program. State Cancer Profiles. 2008-12. Source geography: County
122
Prostate Cancer
Prostate cancer is the most common cancer among men in the United States following skin cancer and is the second leading cause of cancer death among men. Prostate cancer occurs more often in African-American men and they are more likely to die from the disease than men from other ethnic groups. African Americans account for the most number of new cases in the KFH-Woodland Hills service area.
New Cases of Prostate Cancer in the KFH-Woodland Hills Service Area by Race/Ethnicity per 100,000 Population, Age-Adjusted
Report Area White African American
Asian / Pacific Islander
American Indian / Alaskan Native
Hispanic or Latino
KFH-Woodland Hills Area
116.7 189.5 64.8 19.8 106.9
Source: National Institutes of Health, National Cancer Institute, Surveillance, Epidemiology, and End Results Program. State Cancer Profiles. 2008-12. Source geography: County
Key Health Drivers
Physical Environment
Liquor Store Access
The risks for cancer include exposure to chemicals or other substances, things people cannot control like age, genetics, and family history, as well as certain behaviors like diet, alcohol consumption and tobacco use. Drinking alcohol excessively can increase the risk for cancers of the mouth, throat, and breast. Tobacco use is a risk for cancers of the lung, throat, liver, colon and rectum, and stomach. Aside from causing other conditions like heart disease, type II diabetes, and high blood pressure, a poor nutritional diet and physical inactivity can increase risk for cancers of the breast, colon and rectum, esophagus, kidney, and gallbladder. The table below indicates the number of liquor stores per 100,000 population which is related to access to alcohol, tobacco and foods with low nutrition. Number of Liquor Stores per 100,000 Population
KFH-Woodland Hills Area
West San Fernando Valley
Ventura County Los Angeles County
California
13.73 13.52 14.82 11.41 10.02
Source: US Census Bureau, County Business Patterns. Additional data analysis by CARES. 2012. Source geography: ZCTA
Clinical Care
Cancer Screenings
Checking for cancer or for conditions that may become cancer in people who show no symptoms is called screening. Screening can help doctors find and treat several types of cancer early. Early detection is important because when abnormal tissue or cancer is found early, it may be easier to treat.
123
By the time symptoms appear, cancer may have begun to spread and is harder to treat. The tables below show how well the population in KFH-Woodland Hills Medical Center service area are being screened for certain types of cancers. Percent Population that Received Mammogram to Screen for Breast Cancer
KFH-Woodland Hills Area
West San Fernando Valley
Ventura County Los Angeles County
California
58.4% 57% 60.5% 54% 59.3%
Source: Dartmouth College Institute for Health Policy Clinical Practice, Dartmouth Atlas of Health Care. 2012. Source geography: County
Percent Population that Received Sigmoid/Colonoscopy to Screen for Colon and Rectum Cancer
KFH-Woodland Hills Area
West San Fernando Valley
Ventura County Los Angeles County
California
56.4% 55.5% 58.1% 54% 57.9%
Source: Centers for Disease Control and Prevention, Behavioral Risk Factor Surveillance System. Accessed via the Health Indicators Warehouse. US Department of Health Human Services, Health Indicators Warehouse. 2006-12. Source geography: County
Community Input
Community members shared the following concerns related to this health need:
West San Fernando Valley Low screenings Poor diet due to high consumption of unhealthy foods Tobacco use Lack of exercise Lack of insurance prevents screenings Lack of primary care providers available
Ventura County Lack of access to nutritious food Lack of physical activity Smoking Pollution Lack of policies and regulation regarding pesticides Pesticide deposits in soil and groundwater
Assets & Opportunity for Cancers
Community assets are resources within the community potentially available to meet the identified need.
American Cancer Society – Has free programs and services to help people with cancer and their loved ones understand cancer, manage their lives through treatment and recovery, and find the emotional support they need: http://www.cancer.org/treatment/supportprogramsservices/index
American College of Surgeons – Search for cancer centers by name, city, or zip code: https://www.facs.org/search/cancer-programs
Breast and Cervical Treatment Program (BCCTP)** – Covers breast or cervical cancer detection, follow-up care and treatment for low income families: https://dhs.lacounty.gov/wps/portal/dhs/healthcoverageoptions/other/cancerdetection/bcctp
City of Hope – Comprehensive research and treatment center for cancer, diabetes and other life-threatening disease: http://www.cityofhope.org/homepage
Healthy Class** – Search for articles, apps, medication and health information, classes and educational events for chronic diseases in the San Fernando Valley area. Most classes are held at hospitals or clinics and cover disease prevention, management, diet and meal planning: http://www.healthyclass.com/site-map/california/san-fernando-valley/diabetes
UCLA Cancer Care Locations – Facilitated through UCLA Health, these centers offer cancer care in clinics and hospital: http://www.cancer.ucla.edu/patient-care/receiving-clinical-care/cancer-care-locations
Ventura County Mobile Mammogram Program* – Provides screening to women and men in the community setting: http://www.vchca.org/docs/public-info-office/mobile-mammography-program-brochure-english.pdf?sfvrsn=0.
Note: *Applies only to Ventura County; **Applies only to West San Fernando Valley. Icons from The Noun Project
Heart disease is the leading cause of death in both men and women in the United States including most racial/ethnic groups including African American, Hispanics/Latinos and White/Caucasian. About 1 in every 4 American die from heart disease each year. The main risk factors for heart disease are high blood pressure, high cholesterol and smoking and about 49% of Americans have at least one of these three risk factors. Fortunately, in some cases, it is preventable. High blood pressure, high cholesterol, cigarette smoking, diabetes, poor diet and physical inactivity, and being overweight or obese can contribute to heart disease. Over time, these related health behaviors and conditions can cause changes in the heart and blood vessels leading to heart attacks, heart failure and strokes.
Health Outcome Statistics
The number of people diagnosed with heart disease in the KFH-Woodland Hills service area exceeds that of the state, particularly in Ventura County.
Source: University of California Center for Health Policy Research, California Health Interview Survey. 2011-12. Source geography: County (Grouping)
Heart Disparities
Men are more likely to have heart disease compared to women in KFH-Woodland Hills Medical Center’s service area. And while Whites are more likely to be diagnosed with heart disease, Native Hawaiians/Pacific Islanders and African Americans are more likely to die from heart disease compared to the other races in both the medical center and California.
Adults Ever Diagnosed with Heart Disease
Male 8.66%
Female 4.23%
White 8.58%
African American 6.12%
Latino 4.28%
KFH-Woodland Hills Area 6.40% Source: University of California Center for Health Policy Research, California Health Interview Survey. 2011-12. Source geography: County (Grouping)
KFH-Woodland Hills Service Area
West San Fernando Valley
Ventura County
Los Angeles County
California
6.40%
6.10%
7%
5.60%
6.30%
Percentage with Heart Disease
Percentage with Heart Disease
126
Source: University of Missouri, Center for Applied Research and Environmental Systems. California Department of Public Health, CDPH - Death Public Use Data. 2010-12. Source geography: ZIP Code
Key Health Drivers
Health Behaviors
Physical Inactivity (Adults)
Lack of physical activity has been shown to be a risk factor for heart disease and other conditions like
high blood pressure, heart disease, diabetes, certain cancers and other conditions
Percent of Adults who Perform No Leisure Time Physical Activity
KFH-Woodland Hills Area West San Fernando Valley
Ventura County Los Angeles County
California
16.8% 17% 16.4% 17.3% 16.6%
Source: Centers for Disease Control and Prevention, National Center for Chronic Disease Prevention and Health Promotion. 2012. Source geography: County
168.34
253.12
66.66
104.87
275.33
52.62
99.44
175.3
238.65
104.92
104.77
253.08
76.19
113.88
Non-Hispanic White
African American
Asian
Native American/Alaskan Native
Native Hawaiian/Pacific Islander
Multiple Races
Hispanic or Latino
Heart Disease Mortality Per 100,000 Population (Age-Adjusted) by Race/Ethnicity
California KFH-Woodland Hills Service Area
127
Clinical Care
High Blood Pressure – Unmanaged
High blood pressure or hypertension is a common disease in which blood flows through blood vessels
(arteries) at higher than normal pressures (120/80 mmHg). Along with biological causes, unhealthy
lifestyle habits (high salt intake, excessive alcohol consumption, and lack of physical activity that can
result in overweight/obesity) can result in high blood pressure. Over time, consistent high blood
pressure weakens and damages the blood vessels and can damage the body. Some common
complications of high blood pressure are vision changes or blindness, heart attack, stroke, chronic
kidney disease, and peripheral artery disease.
Percent of Population with Unmanaged High Blood Pressure
KFH-Woodland Hills Area West San Fernando Valley
Ventura County
Los Angeles County
California
31.8% 32.1% 31.4% 32.4% 30.3%
Source: Centers for Disease Control and Prevention, Behavioral Risk Factor Surveillance System. Additional data
analysis by CARES. 2006-10. Source geography: County
Health Outcome
Overweight (Adult)
Being obese can raise cholesterol and other fats thereby increase the risk for health problems such as
blood pressure, diabetes, heart disease and stroke.
Percent of Adults that are Overweight
KFH-Woodland Hills Area West San Fernando Valley
Ventura County
Los Angeles County
California
36.1% 36.1% 36.3% 35.9% 35.8%
Source: Centers for Disease Control and Prevention, Behavioral Risk Factor Surveillance System. Additional data analysis by CARES. 2011-12. Source geography: County
128
Physical Environment
Liquor Store Access
A liquor store is a place where alcohol may be legally sold. There is evidence of a positive relationship between the number of liquor stores and excessive alcohol consumption and the related harms. The more liquor stores accessible to the community, the higher the chances of excess alcohol use. The table below measures the rate per 100,000 population of number of beer, wine and liquor store access. People within the KFH-Woodland Hills Area have more liquor stores than the state.
Liquor Stores per 100,000 Population
KFH-Woodland Hills Area West San Fernando Valley
Ventura County Los Angeles County
California
13.73 13.52 14.82 11.41 10.02
Source: US Census Bureau, County Business Patterns. Additional data analysis by CARES. 2012. Source geography: ZCTA
Community input
Community members shared the following concerns related to this health need:
West San Fernando Valley Smoking and tobacco use High consumption of unhealthy foods Limited access to safe recreational spaces to exercise Unaffordable healthy foods Cultural beliefs
Ventura County Access to unhealthy processed foods Greasy food is cheaper Poor nutrition because organic food is expensive Poor lighting in parks and streets limit walkability Lack of information regarding recreational facilities and gyms, nutrition program and exercise classes Lack of information regarding health fairs for screenings and education Poor nutrition is perpetuated by lack of education and cultural values
Assets & Opportunities for Heart Disease and Stroke
Community assets are resources within the community potentially available to meet the identified need.
100 Citizens Program** – Free physical activity program delivered by California State University Northridge Kinesiology students at San Fernando and El Cariso parks: http://www.100citizens.org/
Choose Health LA** - Local initiative of the Los Angeles County Department of Public Health to prevent and control chronic disease in LA County by bringing together a broad range of partners to implement community based public education, skills-building and environmental changes that promote physical activity and healthy eating. Includes Choose LA Kids, Choose Health LA Child
Care and Choose Health LA Moms: http://www.choosehealthla.com/about-us/
Chronic Disease Prevention Program: Encourages healthy active living through free physical activity and healthy eating opportunities including health screens (blood sugar, blood pressure and body fat), fitness classes, walking clubs and diabetes self-management; http://vchca.org/public-health/events-and-activity-calendars
HEAL (Healthy Eating, Active Living) Healthy School Partnership Program – School-based initiative by Kaiser Permanente that aims to prevent and treat childhood obesity and increase healthy behaviors through full integration between the school and Wellness Centers by 1) improving school-based healthcare services in obesity prevention and management, 2) improving and increasing access to physical activity opportunities, 3) improving and increasing access to healthy food and beverages options offered on campus, and 4) improving learning opportunities about healthy eating and active living: http://thelatrust.org/heal/
Healthy Class – Search for articles, apps, medication and health information, classes and educational events for chronic diseases in the San Fernando Valley area. Most classes are held at hospitals or clinics and cover disease prevention, management, diet and meal planning: http://www.healthyclass.com/site-map/california/san-fernando-valley/diabetes
Local Harvest: Locates farmers markets, family farms, farm stands and community supported agriculture (CSA): http://www.localharvest.org
Los Angeles County Department of Public Social Services (DPSS) - Offers nutrition assistance in the form of CalFresh benefits (formerly known as Food Stamps) to help individuals and families with little or no income to buy nutritious groceries; http://www.ventura.org/human-services-agency/calfresh-food-stamps
Los Angeles Food Policy Council** – Collective impact initiative working to build a Good Food system for all Los Angeles residents where food is healthy, affordable, fair, and sustainable: http://goodfoodla.org/
Partnership for a Healthy Ventura County (PHVC)* - A partnership-driven network of government, community, direct services providers, schools, and local business representative that share resources and promote policies and services around issues related to healthy eating and active living in Ventura County; http://healthyventuracounty.org/about-us/
Valley Care Community Consortium’s Chronic Disease Committee** – Collaboration of public and private community partners to advocate, plan, assess needs and facilitate development of effective programs and policies to improve the health of the residents of the San Fernando and Santa Clarita Valleys: http://www.valleyccc.org/aboutus.php
Ventura County Parks and Recreation* – Locate parks and recreation sites in the county: http://www.ventura.org/general-services-agency/parks-department
Women, Infant & Children (WIC) Supplemental Nutrition Program at 11 Northeast Valley Health Corporation locations** – Provides vouchers for healthy foods, support for breast-feeding, nutrition education, and helps with locating other health care and community services. Services are for children under 5 years and women who are pregnant, breastfeeding or new mothers below 185% of the federal poverty level: https://www.nevhc.org/programs-a-services/wic-nutrition-program.html
YMCA (Ventura) – Offers youth development programs, fitness and wellbeing programs, employment/vocational training, and sports and recreation programs. http://www.ciymca.org/ventura/index.html
YMCA (West Valley& North Valley)** – Offers youth development programs, fitness and wellbeing programs, employment/vocational training, and sports and recreation programs. http://www.ymcala.org/metro/locations
Note: *Applies only to Ventura County; **Applies only to West San Fernando Valley. Icons from The Noun Project
Description & Significance: Dental health is often taken for granted. However the mouth is a window into the health of the body. Many populations-based studies have demonstrated an association between oral diseases and diabetes, heart disease, stroke, and poor pregnancy outcomes. Diet, nutrition, sleep, psychological status, social interaction, school, and work are affected by impaired oral health. The mouth is also the entry as well as the site for infections that affect the general health status.
According to the Centers for Disease Control and Prevention, over 40% of low-income adults, 20 years and older, have at least one untreated decayed tooth compared to 16% higher income adults. Toothaches are reported most by adults with 1 in every 4 adults reporting facial pain the past 6 months. As a result of poor oral health, employed adults lose more than 164 million hours of work every year due to dental health problems or dental visit, particularly more so for lower level workers compared to executives or professionals.
The CDC recommends drinking fluoridated water and use of a fluoride toothpaste, avoiding tobacco, limiting alcohol, avoiding sugars and starches, and regular dentist visits as means to maintain good oral health. About 100 million Americans do not see a dentist each year even though regular dental examinations and good oral hygiene can prevent most dental diseases.
Health Outcome Statistics
The following graph reflects the percentage of adults age 18 and older who self-report that six or more of their permanent teeth have been removed due to tooth decay, gum disease, or infection.
Source: Centers for Disease Control and Prevention, Behavioral Risk Factor Surveillance System. Additional data analysis by CARES. 2006-10. Source geography: County
9.90%10.60%
8.60%
11.60% 11.30%
KFH-WoodlandHills Area
Service Area
West SanFernando
Valley ServiceArea
Ventura County Los AngelesCounty
California
Percent Adults with Poor Dental Health
Percent Adults with Poor Dental Health
131
Key Health Drivers
Health Behavior
Dental Care - No Recent Exam (Adult)
Adults age 18 and older who self-report that they have not visited a dentist, dental hygienist or dental
clinic within the past year
KFH-Woodland Hills Area West San Fernando Valley
Ventura County Los Angeles County
California
27.90% 30.60% 22.90% 34.50% 30.50%
Source: Centers for Disease Control and Prevention, Behavioral Risk Factor Surveillance System. Additional data
analysis by CARES. 2006-10. Source geography: County
Social and Economic
Absence of Dental Insurance Coverage
Lack of dental insurance is a key driver for dental health. According to the CDC, for every adult 19
years or older without medical insurance, there are three without dental insurance. This amounts to
about 108 million people in the United States without dental insurance according to the US Health
Resources and Services Administration (HRSA). Inability to afford dental insurance is the main reason
many adults forgo a dental visit. A high proportion of adults age 18 and older in the KFH-Woodland Hills
service area (41.40%) compared to the state (40.90%) report having no dental insurance for some or all
of a year.
Adults who self-report having no dental insurance for some or all of the past 12 months
KFH-Woodland Hills Area West San Fernando Valley
Ventura County Los Angeles County
California
41.40% 42.60% 39.20% 44.30% 40.90%
Source: University of California Center for Health Policy Research, California Health Interview Survey. 2009.
Source geography: County (Grouping)
132
Physical Environment
Health Professional Shortage Area – Dental
This indicator reports the percentage of the population that is living in a geographic area designated as
a "Health Professional Shortage Area" (HPSA), defined as having a shortage of dental health
professionals. This indicator is relevant because lack of access to health care, including regular primary
care, dental care, and other specialty health services, contributes to poor health status. There are
almost five times the proportion of people living in dental HPSAs in the KFH-Woodland Hills medical
center service area compared to the state.
Population Living in a Dental Health Professional Shortage Area (HPSA)
KFH-Woodland Hills Area West San Fernando Valley
Ventura County Los Angeles County
California
22.98% 0% 41.58% 1.95% 4.93%
Source: US Department of Health Human Services, Health Resources and Services Administration, Health
Resources and Services Administration. March 2015. Source geography: HPSA
Community Input
Community members shared the following concerns related to this health need:
West San Fernando Valley Unable to take time off from work Lack of insurance Lack of access for undocumented individuals No access to specialty providers Unable to pay co-pay High consumption of unhealthy foods (fast food, juice, soda)
Ventura County Transportation is expensive Lack of insurance Insurance is too expensive when offered “Growers do not buy purified water for the farm workers. When we fill a cup, we can see the residue left. This is the water we drink and cook with” High sugar intake Lack of qualified personnel Must pay upfront Lack of transportation for emergency dental services
133
Assets & Opportunities for Dental Health
Community assets are resources within the community potentially available to meet the identified need.
Los Angeles Unified School District Referral** - List of low-cost and free dental services in LA County: http://thelatrust.org/oral-health-2/oral-health-initiative/oral-health-resources/
Low-Cost Dental Care Listings** – List of organizations providing low-cost dental health services in LA County: http://publichealth.lacounty.gov/ohp/ppplistings.htm
San Fernando Valley Dental Group** – has dentists list in cities of Reseda, Tarzana, Encino, Northridge, Granada Hills & West Hills Area. http://www.sfvdentalgroup.com/
San Fernando Valley Dental Society – A network of volunteer member dentists that provide free dental care through four main programs to meet the oral health needs of low income and underserved members of the Northern Los Angeles County community including Smiles from the Heart, Give Kids a Smile, Veterans’ Smile Day and Education. Membership has 1340 dentists and covers from Santa Monica mountains to Ventura county and Antelope Valley: http://www.sfvds.org/
Santa Barbara Ventura County Dental Society* - Lists dentists in Ventura and Santa Barbara counties. http://sbvcds.org/
The L.A. Trust Oral Health Oral Health Initiative** – Addresses oral health in collaboration with LAUSD by providing community-wide health education, providing direct preventive care and early intervention on school campuses and linking all elementary school campuses to restorative care: http://thelatrust.org/oral-health-2/oral-health-initiative/
Valley Care Community Consortium’s Oral Health Access Committee** – Collaboration of public and private community partners to advocate, plan, assess needs and facilitate development of effective programs and policies to improve the health of the residents of the San Fernando and Santa Clarita Valleys: http://www.valleyccc.org/aboutus.php
Ventura Dentist Directory* - provides information about dentists in Ventura: http://www.venturasmiles.net/
Note: *Applies only to Ventura County; **Applies only to West San Fernando Valley. Icons from The Noun Project
Description & Significance: Unaffordable housing reduces the income a household has available for other basic needs such as nutritious food, health care expenses, and transportation. People who cannot afford their housing may move more often which can impact mental health due to psychological stress and depression. According to the Department of Housing and Urban Development (HUD), although the number of homeless population in the United States has declined since 2007, more than 564,000 people including more than 127,000 children under the age of 18 years were homeless on a single night in January 2015. Homelessness can worsen chronic physical and mental health conditions or contribute to substance abuse problems. Environmental exposures, exposure to communicable diseases, lack of access to preventive and medical care, and lack of access to proper nutrition and sleep all contribute to high rates of poor health among homeless people.
Health Outcome Statistics
Between 2013 and 2015, the homeless population has decreased in Ventura County by 20% and increased in the
San Fernando Valley by 7% Source: Los Angeles Homeless Services Authority Homeless Count, 2015. Source geography: Service Planning Area.
Health Disparities
This breakdown of subpopulations in the service area shows that two of the health needs identified in the CHNA are associated to homelessness in the KFH-Woodland Hills service area.
Homeless Count Results for Greater Los Angeles and Ventura Counties, 2015
San Fernando Valley Area*
Ventura County Los Angeles County
Total 5,216 1,417 44,359
On the streets 73.4% 67.5% 70%
In shelters 26.6% 32.5% 30%
Veterans 11.3% 9.1%** 10%
Mental Illness 40.2% 20.6%** 30%
Substance Abuse 26.9% 28.7%** 25%
Physical Disability 21.0% 29.8%** 20%
Have HIV/AIDS 1.7% 1.3%** 2%
Domestic Violence Experience 23.9% 19.6%** 21% Source: Los Angeles Homeless Services Authority Homeless Count, 2015. Source geography: Service Planning Area. *Note: No data was available solely for the Panorama City service area. San Fernando Valley (SPA 2) data is used as substitution. **These numbers do not include sheltered individuals
135
In both San Fernando Valley and Ventura County, homeless persons are more likely to be White, Latino and multi-racial/other.
Source: Los Angeles Homeless Services Authority Homeless Count, 2015. Source geography: Service Planning Area. Ventura County 2015 Homeless Count and Subpopulation Survey: Final Report. Source geography: County
Males are more likely than other genders to be homeless.
Ventura County 2015 Homeless Count and Subpopulation Survey: Final Report. Source geography: County. Note: Data does not include sheltered individuals
Source: Los Angeles Homeless Services Authority Homeless Count, 2015. Source geography: Service Planning Area
1484
795
2076
308
102
2
449
309
41
504
7
32
5
101
Latino
African-American
White
Asian
American Indian/Alaskan Native
Native Hawaiian/Other Pacific Islanders
Multi-racial/Other
Homeless Population by Race Ethnicity, 2015
Ventura County San Fernando Valley
71%
29%
Homeless Population In Ventura County Area By Gender, 2015
Men Women
68%
32%
0%
0%
Homeless Population in the San Fernando Area by Gender, 2015
Male
Female
Transgender Male toFemale
136
Key Health Drivers
Social & Economic
Cost Burdened Households and Assisted Housing
According to the U.S. Department of Housing and Urban Development, housing is affordable if the
people living there pay less than 30% of their income on rent or mortgage payment. Households that
pay more than this amount may not have enough money to meet other needs such as food and health
care and are at risk to become homeless.
Percentage of Households where Housing Costs Exceed 30% of Income
KFH-Woodland Hills Area West San Fernando Valley
Ventura County Los Angeles County
California
46.49% 47.11% 43.68% 49.87%% 44.99%
Source: US Census Bureau, American Community Survey. 2010-14. Source geography: Tract
Number of HUD-funded assisted housing units available to eligible renters (per 10,000 total households)
KFH-Woodland Hills Area West San Fernando Valley
Ventura County Los Angeles County
California
377.06 402.12 329.68 439.3 368.32
Source: US Department of Housing and Urban Development. 2013. Source geography: County
Housing - Substandard Housing
Quality housing is linked with positive physical and mental wellbeing. The design, construction and
maintenance of houses and the presence or absence of safety devices can impact injury, illness and
mental health. The table below reports the percentage of owner- and renter-occupied housing units
having at least one of the following conditions: 1) lacking complete plumbing facilities, 2) lacking
complete kitchen facilities, 3) with 1.01 or more occupants per room, 4) selected monthly owner costs
as a percentage of household income greater than 30%, and 5) gross rent as a percentage of
household income greater than 30%.
Percent of Housing Units with Substandard Conditions
KFH-Woodland Hills Area West San Fernando Valley
Ventura County Los Angeles County
California
48.01% 48.07% 45.11% 53.95% 47.54%
Source: US Census Bureau, American Community Survey. 2010-14. Source geography: Tract
137
Unemployment Rate
Falling incomes and less secure jobs contribute to homelessness. Low-income workers are at particular
risk of losing their homes as it becomes difficult to support their families. Displaced workers face
difficulty finding new employment and when they do find work, their new wages are likely to be less
than the ones they lost.
Percent Unemployment Rate
KFH-Woodland Hills Area West San Fernando Valley
Ventura County Los Angeles County
California
6.7% 7.1% 6.2% 7.5% 6.8%
Source: US Department of Labor, Bureau of Labor Statistics. 2015 - December. Source geography: County
Community Input
Community members shared the following concerns related to this health need:
West San Fernando Valley Housing burden and living conditions affects quality of life Housing insecurity and homelessness are barriers to adhering to medication Lack of a more comprehensively responsive way to address homelessness particularly among the severely mentally ill Lack of truly affordable housing
Ventura County More housing needed for the mentally ill “Some families seem only to be offered services from a prescribed menu of services that are not necessarily coordinated or even responsive to the primary concern” Lack of timely housing services
138
Assets & Opportunities for Affordable Housing and Homelessness
Community assets are resources within the community potentially available to meet the identified need.
California Department of Rehabilitation** - Homeless Resources for San Fernando: includes homeless service providers such as government agencies, food banks, homeless shelters/housing, hospitals, mental health agencies, job training, churches, mental health providers, Red Cross, sober living, drug & alcohol services, domestic violence, legal services and senior citizen services in San Fernando Valley. www.dor.ca.gov/GreaterLosAngeles/index.asp
California Department of Social Services – Employment, cash aid, food, residential care, day care, in-home care, adoption, foster care, refugee services. http://www.dss.cahwnet.gov/cdssweb/PG181.htm
California Employment Development Department – Provides job search assistance and training services in partnership with state and local agencies and organizations: http://www.edd.ca.gov/
California Homeless Resources – List of resources for each city including homeless shelters and other support services: http://www.homelessresourcesca.org/
Family Solutions System (FSS)** – developed by a collaboration of partner organizations (housing service providers, the Department of Social Services, the Los Angeles Housing Services Authority, 211 Los Angeles County, and other partnering agencies) to improve and expedite the delivery of housing and other supportive services to homeless families in Los Angeles County: https://www.lahsa.org/hfss/about
Home for Good Funders Collaborative** – Action plan launched in December 2010 to end chronic and veteran homelessness in LA County by 2016 by providing grants: http://homeforgoodla.org/our-work/funders-collaborative/
Homeless and Housing Program Fund** – Stems from an initiative to address the critical shortage of permanent housing, shelter beds, and supportive services in the County: http://www.lacdc.org/programs/homeless-and-housing-program-fund-%28hhpf%29
Los Angeles County Housing Resource Center** - Web-based service created to help people list and find affordable, special-needs, accessible, and emergency housing within the county: http://housing.lacounty.gov/index.html
Resources for Homeless People in Western Ventura County* - This is a resource directory with phone numbers and addresses for alcohol & drug services, Calworks, General Relief, CalFresh, Medi-Cal, bus, campground, children services, citizenship/immigration, disabled services, housing, shelters, showers/toilets, meals, medical and mental health services, transportation, domestic violence, employment and job training etc.: http://www.vchca.org/docs/amb-care/homeless-resources---west-county-0111_web.pdf?sfvrsn=0
Resources for Homeless People in Eastern Ventura County* - This is a resource directory with phone numbers and addresses for alcohol & drug services, Calworks, General Relief, CalFresh, Medi-Cal, bus, campground, children services, citizenship/immigration, disabled services, housing, shelters, showers/toilets, meals, medical and mental health services, transportation, domestic violence, employment and job training etc.: http://www.vchca.org/docs/amb-care/homeless-resources---east-county-0111_web.pdf?sfvrsn=0
San Fernando Santa Clarita Valleys Homeless Coalition** - Coalition of agencies that provide homeless services in San Fernando and Santa Clarita Valleys come together to share resources
and services they provide. Housing, mental health, homeless services www.lafh.org
Salvation Army – Provides alcohol & drug rehabilitation, health services, homeless services, veterans & senior services. Local locations can be found by city or zip code: http://www.salvationarmyusa.org/usn/
United Homeless Healthcare Partners (UHHP)** - Network of homeless service providers, social service organizations, private health providers, professional association, city and federal officials focusing on issues and practices relating to the delivery of healthcare services to homeless residents of Los Angeles County: http://www.uhhpla.org/index.html
Van Nuys-North Sherman Oaks Work Source Center** - Lists nearby unemployment assistance office locations. http://www.countyoffice.org/van-nuys-north-sherman-oaks-worksource-center-los-angeles-ca-f8a/
Ventura Human Services Agency* – cash aid, food and nutrition, medical services, foster services, homeless issues, job training, covered Ventura county http://www.ventura.org/human-services-agency/human-services-agency
Ventura Rescue Mission* - lighthouse for women and children, meals, clothing assistance, programs for men http://venturacountyrescuemission.com/index.php/en/