53
United Community Action Network Douglas and Josephine County 2016 Community Needs Assessment

United Community Action Network Douglas and Josephine County
2016 Community Needs Assessment

2
Purpose and Scope of Needs Assessment
The purpose of this needs assessment is to provide an understanding of the needs and resources of residents in United Community Action Network’s (UCAN) service area: Douglas and Josephine County, Oregon. The assessment begins with a description of UCAN and its programs. The assessment then provides an overview of Douglas and Josephine County, Oregon, and the regions and communities within the Counties. The assessment continues by first focusing on Douglas County needs followed by a similar review of Josephine County needs. Results of a survey of low-income residents are then summarized and analyzed. The assessment ends with potential actions to take to address needs.

3
Approach/General Data Sources
The scope of this assessment is primarily limited to Douglas County and Josephine County. In a few cases, where county communities are located near to major service centers outside the county, information regarding those communities is included. County data is often compared with comparable Oregon data. Much of the assessment’s data comes from the United States Census Bureau and state agencies. The assessment also includes some relatively new sources of data, such as County Health Rankings. Though new, this data is helpful in reaching general conclusions regarding area needs. As available, local community data is included to better understand differences between county communities. Because small community data derived from the Census has a larger margin of error than countywide data, wherever possible, estimates are based on five years of data. The assessment also includes results of a comprehensive survey completed by over 400 local, low-income residents.
4
United Community Action Network: An Overview
UCAN is a 501(c) (3) non-profit that provides comprehensive human services in both Douglas and Josephine Counties. UCAN has provided services for 47 years. UCAN’s mission is: Creating solutions to poverty, improving lives in our community. UCAN’s vision is that every Douglas and Josephine County resident has the resources and opportunities needed to reach their full social, civic, and economic potential, to be secure in their own lives and to be vital participants in their communities. UCAN board, staff and volunteers embrace the following values when working to create solutions and improve lives:
Respect, Dignity, Compassion and Equity:
UCAN board, staff and volunteers embrace these qualities in their interactions with people using UCAN's services, the staff and the community.
Accountability:
UCAN provides services in a manner that is effective, efficient and meaningful to the community and people’s lives. UCAN uses public and private funds in a prudent manner and has fiscal controls that assure superior accountability.
Making a Positive Difference:
UCAN’s services make a positive difference in people’s lives because all people have the ability to grow, improve and change. UCAN makes a positive difference in our communities by providing needed, meaningful and quality services.
Quality and Excellence:
UCAN is committed to performing all its functions to the highest caliber and strives for “best practices” in all aspects of its operations. UCAN is a “learning organization” that values creativity and flexibility, and embraces the concept of continuously improving the quality of its services throughout the agency.
Partnering:
UCAN is an interactive partner with the people using UCAN’s services, other agencies and the community.
Courage:
UCAN is willing to take risks, try new things, and encourages staff ideas for new projects.
Honesty/Integrity:
UCAN is committed to honesty and integrity in all aspects of its organization.
5
While many of UCAN’s programs target low-income individuals, UCAN also has programs that can benefit all area residents, strengthening communities throughout the region. UCAN improves the lives of large numbers of residents, provides a wide array of services, and implements solutions rapidly. UCAN currently serves approximately 30% of residents in its service area with a staff of around 200, a cohort of National Service members, and a large pool of dedicated volunteers. UCAN expands its work in the region by partnering with hundreds of local agencies and organizations. UCAN staff represent the agency and the region on many local and statewide boards and coalitions, including the State Head Start Association, the Rural Oregon Continuum of Care, Oregon Housing and Community Services’ Housing Council, and homeless coalitions.
UCAN operates a number of different programs including:
• Head Start and Early Head Start, • Healthy Families, Healthy Start, Nurse Home Visiting and WIC • Emergency food, • Affordable housing development, • Rental and housing assistance, • Public transit, • Energy assistance and weatherization programs.
UCAN maintains regional National Service programs, including AmeriCorps and Senior Corps. AmeriCorps members serve in Douglas, Josephine, Coos, Curry and Jackson County. Senior Corps service members offer programs such as a regional Tax-Aide program to help local residents become self-sufficient. UCAN serves residents from all walks of life through the Seniors Health Insurance Benefits Assistance Program (SHIBA) and Prescription Assistance programs. UCAN offers regional Medicaid Transportation service.

6
Oregon/Douglas/Josephine County Overview
Oregon
(U.S. Census American Community Survey map) Douglas and Josephine County are located in the southwest portion of Oregon. Oregon is the 10th largest state in the United States.1 The state is split into distinctive portions in the west and east by the Cascade Mountains, which rise to over 11,000 feet in elevation.2 The Willamette River, the United State’s 19th largest by volume3, creates a unique region in the northwestern portion of the state. Most of the original settlers who migrated along the Oregon Trail settled in the Willamette River basin. Over the years, much of Oregon’s population has remained concentrated in this valley. Of Oregon’s 3,970,239 residents, approximately 70% (2,726,559) reside in counties found here (Lane, Linn, Benton, Marion, Yamhill, Clackamas, Washington and Multnomah).4 The Valley contains Oregon’s three largest metropolitan areas, Portland, the state capitol Salem, and Eugene-Springfield. Much of the state’s economic activity, its academic research centers (University of Oregon and Oregon State University), and major government offices are headquartered in the Willamette Valley. 1 United States Census Bureau. 2 United States Geological Survey. 3 United States Geological Survey. 4 United States Census, 2014 five year estimate.

7
Douglas County
General Description
(Douglas County Planning Department) Douglas County lies just south of the Willamette Valley, and encompasses 5,036 square miles (an area larger than Connecticut)5. The County extends from the Cascade Mountains at elevations of over 9,000 feet to sea level at the Pacific Ocean.6 Most of the County is covered by rugged mountains that are heavily forested. The County encompasses the Umpqua River watershed, much of which flows through dramatic canyons and narrow valleys. Both the County’s rugged terrain and federal landholdings limit development. The United States Forest Service and Bureau of Land Management administer more than 50% of the county's land.7 These lands are not subject to local property taxes, greatly diminishing the local government’s tax base.
5 US Census Bureau. 6United States Geological Survey. 7 Douglas County website: https://www.co.douglas.or.us/overview.asp.

8
Roseburg, the Douglas County seat, is located approximately 70 miles south of the edge of the greater Eugene area (a drive of over one hour). The next closest major urban area is Medford (78,557 residents), a drive of over 1 ½ hours south. Douglas County residents generally conduct their daily activities within the County, rarely traveling to Oregon’s metropolitan areas. Within the County, residents may have to drive long distances to access resources and needed services. For example:
• Residents of Yoncalla and Drain in northern Douglas County live more than 30 minutes from Roseburg.
• Residents of Glendale, Oregon, in southern Douglas County live 49 minutes from Roseburg.
• Coastal Douglas County residents living in Reedsport are 1 ½ hours from Roseburg.
Residents living near the County borders may travel to Eugene, Grants Pass, and North Bend/Coos Bay to obtain some services.
Though Douglas County is larger than Connecticut, it only has 109,385 residents.8 Many of Douglas County’s residents live along the I-5 corridor which bisects the County from north to south. Central Douglas County is the region’s most densely populated area, and includes the County’s three most populous communities: Roseburg (22,510), Sutherlin (7,945) and Winston (5,410).9 The most populous communities in southern Douglas County are Myrtle Creek, Riddle, Canyonville and Glendale with a combined population of 7,435.10 Eastern Douglas County has no incorporated communities, but has a number of residents in unincorporated areas such as Glide. Drain and Yoncalla, with a combined 2,200 residents, are found in north Douglas County.11 Reedsport is the single incorporated community in western Douglas County, with 4,150 residents.12 A little less than half of Douglas County’s population lives in unincorporated areas.13 Such areas are found adjacent to Roseburg as well as in the more rural portions of the County. The population of Douglas County is stable, and estimates are that it will continue to grow slowly in the near future.
8Portland State University, Population Research Center, 2014. 9 Ibid. 10 Ibid. 11 Ibid. 12 Ibid. 13 Ibid.
9
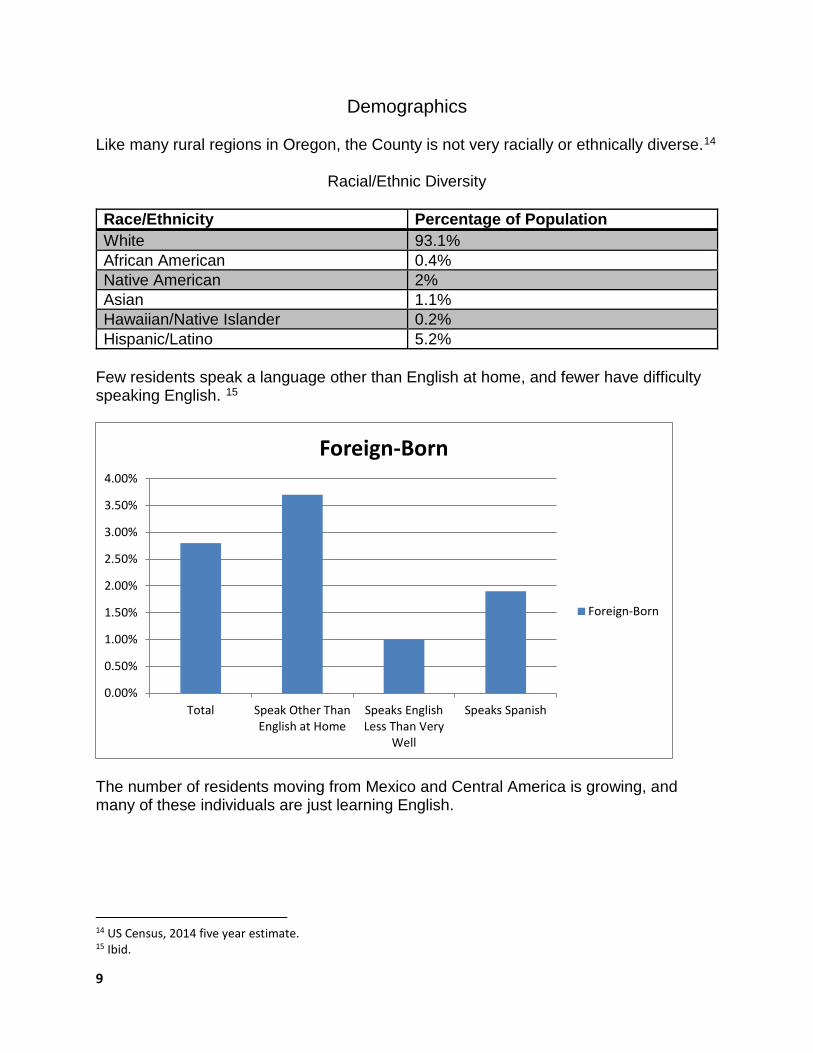
Demographics Like many rural regions in Oregon, the County is not very racially or ethnically diverse.14
Racial/Ethnic Diversity Race/Ethnicity Percentage of Population White 93.1% African American 0.4% Native American 2% Asian 1.1% Hawaiian/Native Islander 0.2% Hispanic/Latino 5.2%
Few residents speak a language other than English at home, and fewer have difficulty speaking English. 15
The number of residents moving from Mexico and Central America is growing, and many of these individuals are just learning English.
14 US Census, 2014 five year estimate. 15 Ibid.
0.00%
0.50%
1.00%
1.50%
2.00%
2.50%
3.00%
3.50%
4.00%
Total Speak Other ThanEnglish at Home
Speaks EnglishLess Than Very
Well
Speaks Spanish
Foreign-Born
Foreign-Born

10
While Douglas County lacks racial/ethnic diversity, its population is overrepresented by three groups that create unique, significant demands on the area’s social service system. The three groups of people are veterans, seniors and people with disabilities. The chart below captures this:
Percentage of Veterans, Seniors and People with Disabilities16
Though many of these individuals, particularly veterans, do not face additional life challenges, a number do. The disproportionate numbers of these three populations adds to pressure in the region for such services as: • Medical/dental, • Case management and life skill support, • Food, • Affordable housing But these needs may differ from the general population’s needs for such services. For example, seniors and people with disabilities needing affordable housing are also more likely to require home modifications. Veterans with health needs are more likely to have incidences of brain trauma and post-traumatic stress disorder. The resources available to address these needs may also differ from those available to the general population. Douglas County has medical facilities specifically addressing veterans’ needs, and has special programs only offered to veterans, seniors and people with disabilities. In general, these special programs do not fully meet the many needs of these populations.
16 . US Census, 2014 five year estimate.
0
5
10
15
20
25
Seniors People with Disabilities Veterans
Douglas County
Oregon
11
Not only does Douglas County have a disproportionate number of seniors, Douglas County’s median age is rising faster than in many parts of the state. The area is experiencing an influx of older residents attracted by low property prices and low property tax rates. Some of these households, referred to as “equity migrants,” are able to use the equity they built up owning property elsewhere to purchase lower priced houses locally. At the same time, the County also has many seniors who formerly worked in the timber industry who lack resources to move out of the area. This is particularly true of some of the more remote towns. For example, in the unincorporated area of Scottsburg, residents’ median age is 51.5 year of age.17 Overall, the median age of County residents is over seven years older than residents statewide (46.7 as opposed to 38.9 years of age).18 Despite Douglas County’s increasing median age, many families with children make their homes in the County. 25.7% of County households consist of families with children ages 0-18.19 21,048 children ages 0-17 live in the County.20 The average family size is about the same both county-wide and state-wide, with approximately three members per family.
Economy Douglas County’s economy has long relied on logging and the manufacture of wood products. These industries have regularly witnessed periods of boom and bust. In recent years, however, wood manufacturing jobs have steadily decreased. Areas worst hit by this decline are the more isolated, rural towns. Many of these towns have had difficulty developing jobs in other industries. One highlight for the region is the beginnings of an economy based on the production of wine. The County now has over two dozen producers (from growers to wineries).21 Still, the County’s unemployment rate continues to regularly exceed the state rate. Median income typically is far below the state, with poverty rates generally far higher than state averages. Many people without college degrees have lost or are at risk of losing higher paying logging and wood product manufacturing jobs. These jobs are generally being replaced by lower paying service sector jobs.
Health Douglas County has consistently been ranked as one of the least healthy counties in Oregon by County Health Rankings, a program of the Robert Woods Johnson Foundation. The County currently ranks 32nd out of 34 ranked counties.22 Two areas of 17 US Census, 2013 five year estimate. 18 US Census, 2014 five year estimate. 19 Ibid. 20 Ibid. 21 http://www.winesnw.com/southern_oregon.html 22 http://www.countyhealthrankings.org/app/oregon/2015/rankings/outcomes/overall

12
persistent concern are health behaviors and quality of life. Access to health care is also a major problem within the County, especially for low-income individuals.
Education
Children’s participation in education in Douglas County is similar to that seen statewide, with about the same percentage of children participating in pre-K school locally and statewide, and the same number of children graduating from high school locally and statewide. Nonetheless, Douglas County residents overall have much lower levels of educational attainment than other areas of the state. The area has a particular shortage of individuals who have baccalaureate and advanced degrees. County communities have difficulty keeping better students from leaving the area. Those who desire a 4-year degree or graduate education must leave the County to obtain their degree (unless they take on-line degree programs). The area’s high unemployment and low median wages are disincentives to returning to the area after completion of college.
Summary A number of Douglas County residents struggle with various aspects of life, oftentimes as a result of a depressed local economy. Despite these challenges, the County continues to attract new residents. Families living in the County can enjoy a more laidback lifestyle than those living in bigger cities, and there are many beautiful areas to explore.

13
Josephine County
General Description
Josephine County has an area of 1,639 square miles.23 Though much smaller than Douglas County, it is still larger than Rhode Island. Josephine County encompasses the Rogue River watershed, which like the Umpqua, is comprised of steep canyons and rugged, forest clad mountains. Like Douglas County, federal landholdings limit development and local tax receipts, with United States agencies administering more than 50% of the county's land.
Grants Pass, the Josephine County seat, is located 69 miles south of Roseburg. Drivers heading north from Grants Pass must cross several passes between 1,500 and 2,000 feet. Driving is occasionally treacherous when winter snow storms impact the passes. In contrast, Medford is more easily accessed on I-5 only 30 miles to the south. Grants Pass residents are much more likely to access resources and services in Medford than in Roseburg.
23 US Census.
14
Josephine County has a total population of 83,105,24 with 50.4 residents per square mile.25 Many residents live in Grants Pass at the junction of I-5 and US highway 199. The only other population center of note is in the Illinois Valley, traversed by highway 199. Though not nearly as large as Douglas County, residents in more rural areas of Josephine County still have fairly long drives to access services and resources available in Grants Pass, with estimated driving times of:
• 40 minutes from Cave Junction in the southwest, • 50 minutes from the California border community of Takilma, • 27 minutes from Williams in the southeast, • 24 minutes from Wolf Creek in far northern Josephine County
Grants Pass has a population of 35,06026. Cave Junction to the southwest on highway 199 is the only other incorporated community in the County, with a population of 1,90527. Like Douglas County, a little less than half of Josephine County’s population live in unincorporated areas. Such areas are found along I-5, highway 199, and in the southeast part of the county.
24 Portland State University Population Research Center, 2014 populations. 25 US Census, 2010. 26Portland State University, Population Research Center, 2014 populations. 27Ibid.

15
Demographics
Josephine County’s populace lacks racial/ethnic diversity, though it has a slightly higher percentage of Latinos than Douglas County.28 Race/Ethnicity Percentage of Population White 93.5% African American 0.6% Native American 1.5% Asian 1% Hawaiian/Native Islander 0.2% Hispanic/Latino 7%
Few residents are foreign born, speak a language other than English at home, have difficulty speaking English, or speak Spanish.29
28 US Census, 2014 five-year estimate. 29 Ibid.
0
1
2
3
4
5
6
Total Language otherthan English
Speaks English LessThan Very Well
Speaks Spanish
Foreign Born
Foreign Born

16
Like Douglas County, while Josephine County lacks racial/ethnic diversity, its population is overrepresented by veterans, seniors and people with disabilities30
Percentage of Veterans, Seniors and People with Disabilities.
As mentioned earlier, though many members of these groups, particularly veterans, do not necessarily face additional life challenges, a disproportionate number do, which further strains resources available in the County.
With a climate that is even drier and warmer than Douglas County, Josephine County is seeing an even greater influx of older “equity” migrants. At the same time, the area has a higher percentage of people living in poverty than Douglas County. Many seniors living in poverty do not have funds to move out of the area. Josephine County’s median age of 47.731 years of age exceeds that of Douglas County, and far exceeds the statewide median age.
But the County also has many households with children. 22.7% of county households consist of families with children ages 0-18.32 16,437 children ages 0-17 live in the County.33 Like Douglas County, the average family size in Josephine County is around 3 people.34
30 US Census, 2014 five year estimate. 31 Ibid. 32 Ibid. 33 Ibid. 34 Ibid.
0
5
10
15
20
25
Seniors People with Disabilities Veterans
Josephine County
Oregon

17
Economy
Josephine County has had a long history of reliance on timber for its economy. Josephine County has arguably been hit even harder by the turndown in this industry than most counties. The Rough and Ready Mill in Cave Junction is the last mill operating in the County, and it has only operated intermittently in recent years. An increase in wine production is raising hopes of a new economic base, but the industry is not growing as fast here as in Douglas County. Tourism plays a large role in local economies, as many visitors enjoy recreational opportunities available along the Rogue River, and others travel on highway 199 headed for California’s redwood country. But most jobs associated with tourism pay poorly. Like Douglas County, the County’s unemployment rate regularly exceeds the state rate, and median wages are even lower than Douglas County’s. More so than in Douglas County, lower paying service sector jobs are now the norm.
Health
Like Douglas County, Josephine County consistently ranks as one of the least healthy counties in Oregon by County Health Rankings. The County currently ranks 27th out of 34 for Health Outcomes.35 Access to health care is also a major problem within the county, especially for those living outside of Grants Pass.
Education
As with Douglas County residents, Josephine County residents overall have much lower levels of educational attainment than other areas of the state. The area has a particular shortage of individuals who have baccalaureate and advanced degrees. County communities have difficulty keeping better students from leaving the area. The closest four-year college is Southern Oregon University in Ashland, about 45 minutes to the south of Grants Pass. The area’s high unemployment and low median wages are disincentives to returning to the area after completion of college.
Summary
In spite of its challenges, the number of people living in Josephine County continues to nudge upward. With an even warmer, dryer climate than Douglas County, the area is particularly attractive to retirees. But outside of Grants Pass, rates of poverty are high, and opportunities for economic growth are currently dim.
35 County Health Rankings at: http://www.countyhealthrankings.org/app/oregon/2015/rankings/josephine/county/outcomes/overall/snapshot

18
Community Challenges
The next portion of the Needs Assessment delves deeper into the needs experienced by many residents of Douglas and Josephine County. In most cases, both Counties have the same types of needs, but the magnitude of the needs and the resources to address the needs often differs. This analysis begins with a look at economic challenges.
Economy
As recently as the 1970s, both Douglas and Josephine County experienced employment growth that exceeded that of the State of Oregon as a whole. But starting in the 1980s, both counties struggled to maintain job growth at the same percentage as the State. Douglas County particularly saw a significant drop of in its percentage employment growth, and has experienced negative growth since 2000. Josephine County has experienced its worst period of employment growth in the past five years, while the State of Oregon has begun to recover from the Recession that began in 2008.36
Percentage Employment Growth by County
A major reason for the decrease in employment growth has been the loss of jobs in logging and wood product manufacturing. During its early years, Roseburg was known as the “Timber Capitol of the Nation.”37 Over the years, the percentage of jobs in
36 https://oregon.reaproject.org/analysis/comparative-indicators/growth_by_decade/total_employment/tools/410019/ 37 City of Roseburg at: http://www.cityofroseburg.org/visitors/history/.
-1
0
1
2
3
4
5
6
7
1970-1979 1980-1989 1990-1999 2000-2009 2010-2014
Douglas
Josephine
Oregon

19
Douglas County in the logging and wood products sectors has nosedived. In 1970, 35.7% of all jobs in Douglas County were in these sectors. By 2000, this percentage had dropped to 16.7% (industry classifications have since changed, making it difficult to determine percentages beyond 2000).38
Douglas and Josephine County have experienced very high unemployment rates during recessionary periods. During the most recent recession, Douglas and Josephine County had unemployment rates (not seasonally adjusted) as high as 17.7% and 16%.39 Oregon unemployment peaked at 12.2%.40 Even though the employment picture has improved recently, Douglas and Josephine County’s November 2015 seasonally adjusted unemployment rates of 7.5% and 7.9% significantly exceeded the statewide rate of 5.7%. Of Oregon’s 36 counties, Douglas and Josephine County had the 7th and 4th highest rates of unemployment as of November 2015.41
Local residents are not only challenged to find work in both Counties, but jobs that are available to those with less education are paying less over time. Consequently, the median income for Douglas and Josephine County residents is well below the state’s median income. The economic situation in the counties’ smaller communities is generally worse, as can be seen in the table below.42
38 Worksource Oregon, Labor Market Information. 39 Bureau of Labor Statistics: Local Area Unemployment Statistics Map at: http://data.bls.gov/map/MapToolServlet 40 Ibid. 41 Ibid. 42 US Census, 2013 five year estimate.
05000
100001500020000250003000035000400004500050000
Median Income
Median Income

20
Not only are median incomes of more rural communities particularly low, some have seen astonishing drops in recent years. For example, Reedsport’s median income plunged by almost $14,000 between 1990 and 2013.43
With weak economies and low incomes, the poverty rates for residents of Douglas and Josephine County are well above that of Oregon. The poverty rates for families with children are considerably higher than the poverty rates for all residents, and those of families with children ages 0-5 are even higher.44
Poverty Rates
In Douglas and Josephine County, almost 40% of families with children ages 0-5 live at or below the federal poverty level. And many families living above the federal poverty level still struggle to make ends meet.
Trends/Possible Near-Term Changes Although Douglas and Josephine counties’ economies are expected to continue to recover and add jobs in the near future, the expectation is that both counties will continue to see a shift away from higher paying manufacturing jobs to lower-paying service jobs. Proposed federal legislation could change this picture somewhat. Bills have circulated recently in both the United States House and Senate that would open up a considerable amount of federally owned land in Douglas and Josephine County to more timber harvesting. If this legislation were to pass, higher wage wood products jobs could return to the area. But even if the legislation passes, increasing automation in the
43 US Census, 2013 five year estimate. 44 US Census, 2014 five year estimate.
0
5
10
15
20
25
30
35
40
Overall Rate Rate 0-17 Rate 0-5
Douglas
Josephine
Oregon

21
logging and wood product manufacturing industries and outsourcing of jobs to countries with workers willing to work for less will limit growth in these jobs. The State of Oregon recently enacted two laws that will help residents working minimum wage jobs in the region. One law will incrementally raise the minimum wage. Between 2016 and 2022, the minimum wage in the area will increase by $0.50 each year, going from $9.50/hr. to $12.50/hr. From that year onward, the wage is set to be adjusted upward to match inflation. The other law will require many area employers to provide 40 hours of sick leave to all full-time employees. This legislation will definitely increase the earnings and benefits for those in the workforce. But those who are unemployed, retired or who cannot work will not see a benefit from the laws.

22
Education
This portion of the Needs Assessment focuses on education issues of both children and adults. Children’s educational data is available by school district rather than by county. For the purposes of this analysis, the individual high schools throughout each county are examined, with a focus on dropout rates and the percentage of students going on to a community college or 4-year college within 16 months of graduation.45 Douglas County schools included in this assessment, with their respective enrollments are: Days Creek (75 students), Douglas High School in Winston (421 students), Elkton School (271 students), Glendale High School (93), Glide High School (222), North Douglas County High School in Drain (94), Oakland High School (176), Reedsport Charter School (165), Riddle High School (109), Roseburg High School (1,833), South Umpqua High School in Myrtle Creek (408), Sutherlin High School (403), and Yoncalla High School (125). Josephine County schools included in this assessment include: Grants Pass High School (1,684), Hidden Valley High School (659), Illinois Valley High School (338), and North Valley High School (511). The tables that follow compare dropout rates and the percentages of students going on to post-secondary school with the state rate/percentage.
Oregon/Douglas County Schools Dropout Rates46
45 All data for this section taken from Oregon Department of Education, 2014-2015 school report cards. 46 Elkton is not included due to questionable results included in its report card.
0
1
2
3
4
5
6
7
8
Dropout rate
Dropout rate
OregonRate-4.0

23
Oregon/Josephine County Schools Dropout Rates
Although a number of schools have dropout rates below the Oregon average, it is concerning that the largest high schools in both Counties have rates above the state average. Moreover, it is very concerning that Illinois Valley, which has the lowest median income of any area in the two-county region, has the high school with the highest dropout rate.
0
1
2
3
4
5
6
7
8
Grants Pass Hidden Valley Illinois Valley North Valley
Dropout rates
Dropout rates
Oregon Rate-4.0
24
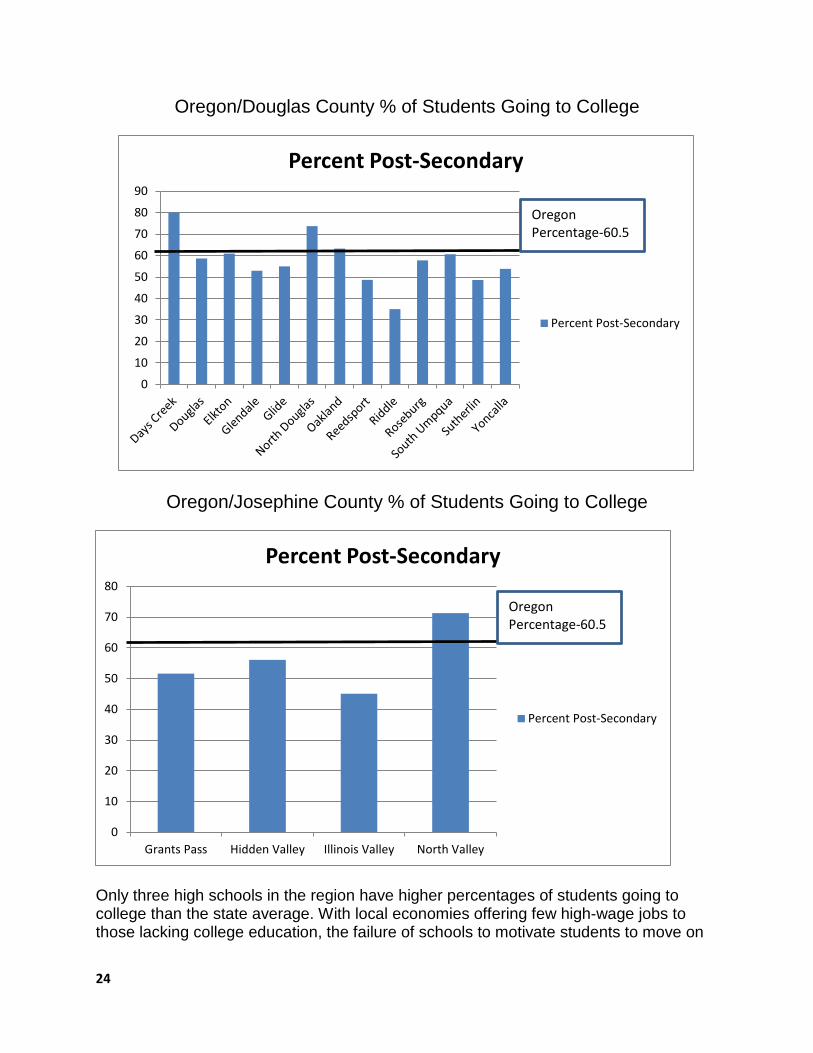
Oregon/Douglas County % of Students Going to College
Oregon/Josephine County % of Students Going to College
Only three high schools in the region have higher percentages of students going to college than the state average. With local economies offering few high-wage jobs to those lacking college education, the failure of schools to motivate students to move on
0
10
20
30
40
50
60
70
80
90
Percent Post-Secondary
Percent Post-Secondary
0
10
20
30
40
50
60
70
80
Grants Pass Hidden Valley Illinois Valley North Valley
Percent Post-Secondary
Percent Post-Secondary
Oregon Percentage-60.5
Oregon Percentage-60.5
25
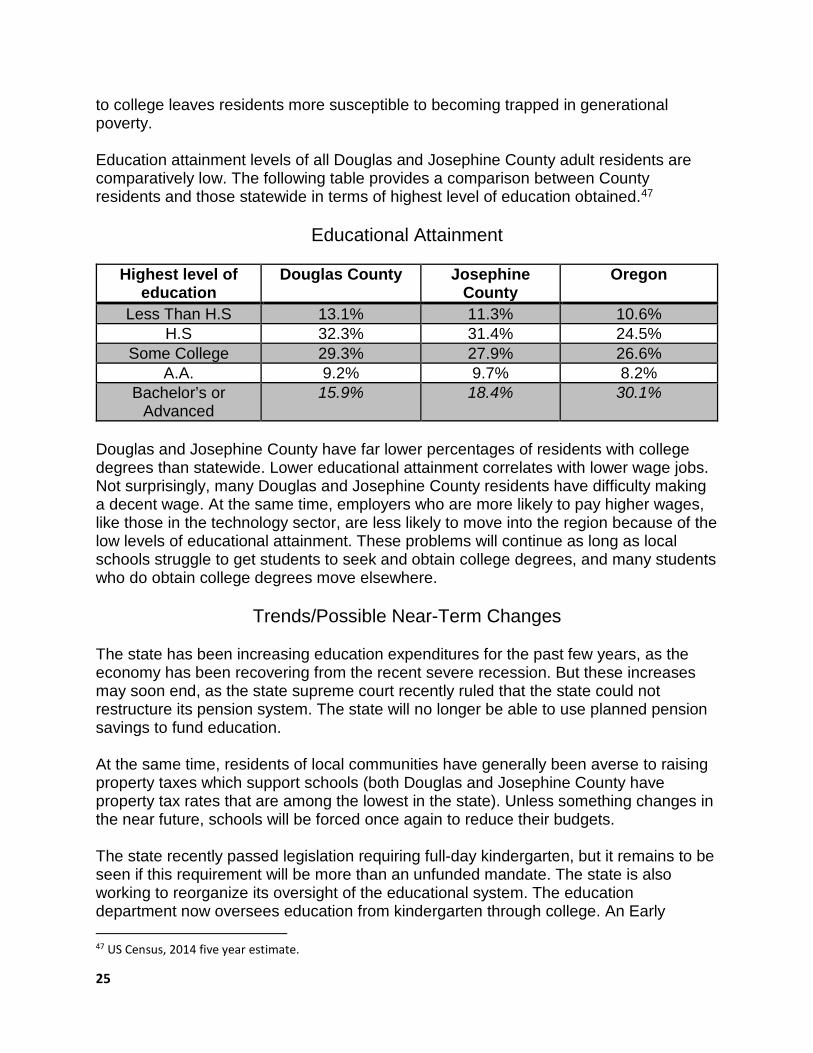
to college leaves residents more susceptible to becoming trapped in generational poverty. Education attainment levels of all Douglas and Josephine County adult residents are comparatively low. The following table provides a comparison between County residents and those statewide in terms of highest level of education obtained.47
Educational Attainment
Highest level of education
Douglas County Josephine County
Oregon
Less Than H.S 13.1% 11.3% 10.6% H.S 32.3% 31.4% 24.5%
Some College 29.3% 27.9% 26.6% A.A. 9.2% 9.7% 8.2%
Bachelor’s or Advanced
15.9% 18.4% 30.1%
Douglas and Josephine County have far lower percentages of residents with college degrees than statewide. Lower educational attainment correlates with lower wage jobs. Not surprisingly, many Douglas and Josephine County residents have difficulty making a decent wage. At the same time, employers who are more likely to pay higher wages, like those in the technology sector, are less likely to move into the region because of the low levels of educational attainment. These problems will continue as long as local schools struggle to get students to seek and obtain college degrees, and many students who do obtain college degrees move elsewhere.
Trends/Possible Near-Term Changes
The state has been increasing education expenditures for the past few years, as the economy has been recovering from the recent severe recession. But these increases may soon end, as the state supreme court recently ruled that the state could not restructure its pension system. The state will no longer be able to use planned pension savings to fund education. At the same time, residents of local communities have generally been averse to raising property taxes which support schools (both Douglas and Josephine County have property tax rates that are among the lowest in the state). Unless something changes in the near future, schools will be forced once again to reduce their budgets. The state recently passed legislation requiring full-day kindergarten, but it remains to be seen if this requirement will be more than an unfunded mandate. The state is also working to reorganize its oversight of the educational system. The education department now oversees education from kindergarten through college. An Early 47 US Census, 2014 five year estimate.

26
Learning Division now supervises Early Learning Hubs, which are in theory supposed to leverage resources so that early childhood education programming increases. Again, it is not yet clear whether these steps will improve the educational outcomes for youth in the region.

27
Child Care Given that nearly 40% of Douglas and Josephine County residents with children ages 0-5 live below the federal poverty level, many parents need low-cost child care to extend the number of hours in which they can work. The Oregon Child Care Research Partnership prepares county reports every two years examining the need and cost for childcare in each Oregon County. The Partnership’s most recent reports are for the year 2014.48 In 2014, Douglas County had 15,033 children age 0-12 years (ages that might require child care). Of these children, 5,672 were pre-kindergarten (ages 0-4). Douglas County had 2,052 childcare slots, or 14 slots per 100 children potentially needing child care. The median cost of child care was $6,900 per year per child, which was a significant decrease from 2012. Still, the cost represented 36% of the annual wage of a person working a full-time minimum wage job. 405 Douglas County children per month received a subsidy to help pay for child care in 2014. Josephine County had 11,363 children age 0-12 years that same year. Of these, 4,205 were pre-kindergarten. Josephine County had 1,543 child care slots in 2014, or 13 slots for 100 children. The median annual cost of child care for Josephine County was also $6,900, so a person making minimum wage full-time in Josephine County would also need to pay 36% of their annual wages to have one child in child care. On average, families of 309 Josephine County children per month received a subsidy to help pay for child care in 2014. These figures indicate that both Counties have far less child care than is needed, that the child care is not affordable for many families, and that there are not enough subsidies to meet the needs of those living in poverty. The Partnership also publishes maps showing the availability of child care by school district. These maps indicate that coastal Douglas County, central Douglas County (between Sutherlin and Roseburg), Grants Pass and the Illinois Valley have the greatest availability of child care slots. Areas most lacking in child care include western and eastern Douglas County (excluding the coastal region) and all of Josephine County outside of Grants Pass and the Illinois Valley. The area served by elementary schools in Canyonville, Camas Valley and Tiller in Douglas County and Williams in Josephine County have no child care slots.
Trends/Possible Near-Term Changes
As mentioned in the section on education, Oregon is implementing a new system to support a more cohesive early childhood education system. “Early Learning Hubs” are being established statewide to coordinate resources for children and their families. Under the Early Learning Hub model, all of the sectors that touch early childhood education – health care, early childhood educators, human and social services, K-12 school districts, and the private sector – will have a common place to focus their efforts, resources, and strategies with a shared purpose.
48 All data for this section taken from 2014 reports found at: http://health.oregonstate.edu/sbhs/family-policy-program/occrp/childcare-dynamics-publications/child-care-and-education-in-oregon-and-its-counties-2014

28
An early learning hub has been established that covers Douglas County, Klamath and Lake County. Another early learning hub covers Josephine and Jackson County. The goal of these hubs is to build on existing knowledge and expertise in each community – with the significant change including coordinating across sectors and focusing on a commonly shared set of outcomes. As the hubs are relatively new, it remains to be seen how successful they will be at accomplishing their goal. There are also indications that both Oregon and the federal government are interested in adding Early Head Start slots (for ages 0-2) and potentially converting Head Start slots (primarily ages 3-4) into Early Head Start slots. Based on recent research findings indicating that family supports and education are needed as early in a child’s life as possible, the trend toward increasing slots for infants and toddlers is likely to continue.

29
Health and Wellness
Many state and local agencies regularly assess county health needs. Consequently, this assessment only provides high-level information regarding such needs. As a state, Oregon is ranked by United Health Foundation’s America’s Health Rankings as 28th out of 50 states for two major areas: health outcomes and health behaviors.49 The magnitude of the health challenges Douglas and Josephine county face is evidenced by the Counties’ standings in County Health Rankings. The Rankings, sponsored by the Robert Woods Johnson Foundation, compare counties on a number of key health metrics. County Health Rankings50 uses these metrics to rank each county’s Overall Health Factors and Overall Health Outcomes against other counties in each state. In Oregon, 34 of 36 counties are ranked annually. Health Outcomes is measured by how long people live and how healthy people feel. Health Factors measures factors influencing the health of county residents. Since the first rankings appeared five years ago, Douglas County and Josephine County have consistently ranked as two of Oregon’s least healthy counties. Douglas County currently ranks 25th overall in Health Factors and 32nd in Health Outcomes. Josephine County currently ranks 26th in Health Factors and 27th in Health Outcomes. Some of the indicators that are particular worrisome for Douglas County residents include:
• Poor physical health days, • Poor mental health days, • Poor or fair health, • Premature mortality, • Adult obesity, • Adult smoking, • Physical inactivity, • Food insecurity
Indicators that are of particular concern for Josephine County residents include:
• Poor mental health days, • Premature mortality, • Adult smoking, • Physical inactivity, • Alcohol impaired driving deaths, • Food insecurity
49 http://www.americashealthrankings.org/OR/ 50 All County Health Ranking data for this section found at: http://www.countyhealthrankings.org/app/oregon/2014/overview
30
The Health Rankings take into account social and economic measures that have a significant impact on health. Two of these rankings in which both Douglas and Josephine County fare poorly are:
• Unemployment: Douglas 31st, Josephine 32nd • Child Poverty Rate: Douglas 31st, Josephine 32nd
Josephine County ranks 33rd overall for all social and economic measures.
Additional health challenges in Douglas and Josephine counties are described in their respective community health assessments.51 Some of the health issues noted in these assessments include:
• The cancer death rate in Douglas and Josephine counties is much higher than the state, with breast, prostate, lung and colorectal cancers the leading types.
• Douglas and Josephine counties have rates of heart and chronic respiratory disease that are twice national benchmark goals.
• Rates of all major chronic conditions, such as asthma and diabetes, in Douglas County are higher than state rates; in Josephine County, rates of high cholesterol and high blood pressure are higher than state rates.
• Over 60% of children living in poverty grades 1-3 in the two Counties have “rampant” and “untreated” tooth decay,
• Josephine County’s assessment states that county residents “have significant issues with addictions to alcohol, tobacco, other drugs and gambling” (the Douglas County assessment does not have a similar finding).
• The infant death rates for Douglas and Josephine counties exceed the state rates (8.5 and 9.6 versus 5.0 per 1000 births).
• The rates of unwed mothers and pregnant mothers who smoke far exceed state averages (Douglas and Josephine County have two of the highest rates of pregnant women who smoke statewide).
The assessments also indicate that there are significant issues of access to healthcare in both Counties. Both Counties are designated as Medically Underserved Areas.
51 Community Health Assessment: Douglas County and 2013 Community Health Assessment: Josephine and Jackson County.

31
The availability and use of healthy, nutritious food has a direct impact on health. Residents participate in a number of programs that help address the need for more food and better nutrition. The table below summarizes data on program participation52:
Food Program Participation Rates
Given the region’s high poverty rate, it is not surprising that the rate at which local residents participate in food and nutrition assistance programs exceeds statewide rates. It is unfortunate that despite the high level of participation, the rate of food insecurity for children in both Counties is approximately 30%, far exceeding the national rate of 15.4%.53
Trends/Possible Near-Term Changes Oregon’s healthcare system is undergoing major reform arising from federal and state initiatives. Many more Oregonians are now covered by health insurance due to the Affordable Care Act and the state’s decision to greatly expand Medicaid. The state is reforming health care, increasing a focus on prevention and use of teams to address healthcare issues. In doing so, the state has established coordinated care organizations (CCOs) that are responsible for meeting new standards. Within this new system, mental health services are also undergoing substantial change. The CCO model is requiring
52 Douglas and Josephine County Health Departments 2014 WIC facts; Community Commons, 2010-2014 Food Stamp Data; Kids Count Data Center 2014-2015 (Free/Reduced Lunches) 53 Feeding America, 2014 found at: http://www.feedingamerica.org/hunger-in-america/our-research/map-the-meal-gap/
0
10
20
30
40
50
60
70
Food Stamp ParticipationRate-All
WIC Participation Rate Free/Reduced Lunches
Douglas
Josephine
Oregon

32
that mental health services be delivered in conjunction with other health care services. In 2013, the Oregon legislature made a substantial investment to mental health services. The impact of these changes remains to be seen. CCOs have published the earlier mentioned community health assessments. Since undertaking the assessments, the organizations prepared community health improvement plans. These plans set priorities for initial efforts to be made by the organizations. Actions prioritized for Douglas County include:
• Increase access to and coordination of non-emergency medical transportation.
• Expand care to improve coordination of care for people with severe and persistent mental illness.
• Advocate for increased number of tobacco-free environments in Douglas County.
• Explore opportunities to collaborate in the development of a local Mental Health Court.
• Collaborate with the Early Learning Hub to provide incentives to parents to complete voluntary child assessments and increase the number of at-risk children getting services.
• Support comprehensive worksite wellness initiatives addressing healthy food, physical activity and tobacco-free environments.
Actions prioritized for Josephine County include:
• Participate in preconception health programs to improve birth outcomes, including reduction of substance use during pregnancy.
• Identify opportunities to collaborate with the regional Early Learning Hub, focusing on parenting skills, support and kindergarten readiness efforts.
• Identify opportunities for collaboration on reducing homelessness among youth.
• Support people living with chronic conditions and chronic pain. • Support efforts to reduce the misuse of prescription medications. • Increase member engagement in physical activity, including expanded
wellness benefits. • Support alcohol, tobacco and drug counseling for youth in certain area
schools.

33
Housing
The quality and cost of housing in the region are a result of current economic and demographic trends. As noted earlier, both Counties have aging populations. But the economic circumstances of the aging populations contrast sharply. Older individuals moving into the area tend to be relatively wealthy, and often have significant equity to use to purchase high-end homes. Seniors who have grown up in the region are much more likely to lack resources and live in very inexpensive homes, in some cases lacking basic amenities. In many parts of both counties, it is not uncommon to drive past a large, gated community sitting high on a hillside, and then round a bend and pass a derelict trailer park with dozens of aging mobile homes. The issue of greatest concern at this time in the region is the increasing cost of rent. The table below shows median rents over the past five years for both counties.54
MEDIAN RENTAL COSTS (2010-2014)
In 2010, both Douglas and Josephine County had similar median rents just under $700/month.55 Both Counties’ rents have risen substantially in the past five years, with rents in Douglas County increasing to around $775/month and those in Josephine County to around $825/month.56
54 US Census,2010, 2011, 2012, 2013, and 2014 five year estimates. 55 US Census, 2010 five year estimate. 56 US Census, 2014 five year estimate.
600
650
700
750
800
850
2010 2011 2012 2013 2014
Douglas
Josephine

34
As wages have stayed relatively flat during this time, housing has become less affordable. Housing costs are considered to be a burden when they are 30% of take home pay and a severe burden when they are 50% of such pay. Over half of Douglas and Josephine County renters are burdened by their rent payments; 25% and 30% of such renters are severely burdened by their payments.57 This local trend is following state and national trends-many feel that we are in the midst of a housing crisis. A number of the region’s residents are homeless, though not all live on the streets. They may live in shelters, in vehicles, doubled-up with relatives or friends, or in other situations meeting the federal definition of homeless. An annual Point-In-Time count provides an estimate of the number of homeless living in each county. Because the count is performed on a single day in the winter and is limited to certain communities within each county, the estimate undercounts the true number of homeless individuals living in the region. The 2015 PIT Douglas County homeless count tallied 408 homeless people of whom 198 were without shelter.58 This included 199 family members, of whom 105 were unsheltered.59 The situation was worse in Josephine County. The County had 883 homeless people, third highest of any Oregon county.60 Of these, 759 were unsheltered (second highest of any county).61 The County had 534 homeless family members, of whom 495 were unsheltered (highest of any county).62
Trends/Possible Near-Term Changes
As the economy continues to recover from the recent recession, more people will be employed in Douglas and Josephine County. But with wages relatively stagnant and the cost of renting continuing to increase, the number of people burdened by their rent payments may continue to increase. For those who are homeless or who are living in situations that may broadly defined as inadequate, the near-term situation looks challenging. Congress has been reducing funding for almost all programs that help create new affordable housing. At the same time, Congress has also been decreasing funding for rent subsidies that can decrease the number of people who are rent-burdened. The number of people on waiting lists for subsidies is very large, and wait times for a subsidy can last for years. Oregon has recently taken action to increase the development of affordable rentals through the sales of bonds. Some of the funds resulting from these sales are to be prioritized for development of rural housing (defined as communities with 25,000 or less people), some for housing for communities of color, and other funds are to be prioritized
57 US Census, 2014 five-year estimate. 58 OHCS, 2015 PIT Count. 59 Ibid. 60 Ibid. 61 Ibid. 62 Ibid.

35
for housing for people with a severe mental illness. These funds may help address Douglas County’s affordable housing crisis, as Roseburg and other Douglas County communities meet the definition of “rural community.” The funding will not be of help in Grants Pass, because this community has more than 25,000 residents and has a relatively small community of color. Housing for those with severe mental illness will benefit the area, but the benefit is blunted by the fact that Oregon is limiting such housing to no more than 20% of units in a development. So this new source of funding, while helpful, will not remedy the area’s shortage of affordable housing.

36
Transportation
A significant challenge for those who live in poverty in the region is the lack of reliable transportation. Many of Douglas and Josephine Counties’ resources and services are found in Roseburg and Grants Pass respectively. These communities are not just centers of health and human service; they are centers of retail, service and recreational amenities. In some cases, a particular service or resource may not be available in Roseburg/Grants Pass and may only be available in major metropolitan areas such as Medford or Eugene. Public highways play the key role in local transportation. The lack of such highways in a region with an area larger than Connecticut and Rhode Island combined is a serious problem for local residents. The map below again shows public highways found in Douglas County.
Many Douglas County communities are found on or near Interstate 5, a major highway that connects Portland in far northern Oregon to the California border near Medford. Glide and Idlelyd Park are found on Oregon Highway 138, which winds steeply to the east to the Cascade Mountains. Drain is found off Oregon Highway 99, which continues on to the junction of Oregon Highways 38 and 138 at Elkton. These highways provide the only connection to Reedsport. Reedsport and Winchester Bay are both on US Highway 101, which connects many of Oregon’s coastal communities. Days Creek,

37
Milo, and Tiller are among the County’s most isolated communities, connected to I-5 by a winding county highway. Oregon Highway 42 provides a connection from I-5 to Winston/Dillard, and also connects Roseburg with the Coos Bay/North Bend area. The table below provides the distance and time to drive from various Douglas County communities to Roseburg, across Douglas County from east to west, across Douglas County from north to south, and from Roseburg to Eugene to the north and Medford to the south.63
Douglas County Drive Times
Driving Segment Miles Time Roseburg-Sutherlin 13.5 16 min. Roseburg-Oakland 16.6 20 min. Roseburg-Yoncalla 29.2 31 min.
Roseburg-Drain 34.2 37 min. Roseburg-Elkton 37.4 43 min.
Roseburg-Reedsport 72.9 1 hr. 22 min. Roseburg-Winston 8.2 miles 13 min.
Roseburg-Myrtle Creek 18.4 22 min. Roseburg-Riddle 23.8 28 min.
Roseburg-Canyonville 26.8 28 min. Roseburg-Glendale (just south of
Azalea) 47.3 49 min.
Roseburg-Days Creek 34 39 min. Roseburg-Tiller 49.8 1 hr. 6 min. Roseburg-Glide 16.7 20 min.
Roseburg-Idlelyd Park 21.2 25 min. Douglas County East to West 153 2 hr. 53 min.
Douglas County North to South 85.6 1 hr. 21 min. Roseburg-Eugene 70.9 1 hr. 8 min. Roseburg-Medford 96.9 1 hr. 34 min.
Despite the fact that most Douglas County communities are located along I-5, many communities are at least 30 minutes from Roseburg. UCAN operates a transit bus locally in Roseburg, and two commuter buses, one traveling to Canyonville in the south, the other to Sutherlin in the north, but the buses have limited hours and do not operate on weekends. 63 Google Maps.

38
Below is the map of Josephine County depicting its two public highways, I-5 and U.S. 199.
I-5 connects Grants Pass to several small unincorporated communities, including Wolf Creek and Merlin. US Highway 199 connects a number of communities to Grants Pass, including O’ Brien, Cave Junction, Kerby, and Selma. Other small unincorporated communities, such as Takilma, Murphy and Williams are located along small, paved byways.

39
The table below provides the distance and time to drive from various Josephine County communities to Grants Pass, across Josephine County along US 199, across Josephine County along I-5, and from Grants Pass to Medford.64
Josephine County Drive Times
Driving Segment Miles Time Grants Pass-Merlin 8.7 15 min.
Grants Pass-Wolf Creek 20.2 25 min. Grants Pass-Murphy 7 13 min. Grants Pass-Williams 19.2 28 min. Grants Pass-Takilma 38.6 53 min. Grants Pass-O’Brien 36.6 45 min.
Grants Pass-Cave Junction 29.5 37 min. Grants Pass-Kerby 27.2 33 min. Grants Pass-Selma 20.7 26 min.
US 199 Grants Pass-California border 41.7 55 min. I-5 N-S Josephine County 26.7 28 min.
Grants Pass-Medford 29.7 36 min. . As is the case in Douglas County, many of Josephine County’s communities are located over 30 minutes from the center of most services. Josephine County Transit operates buses between Cave Junction and Grants Pass, Wolf Creek and Grants Pass, and within Grants Pass. In 2014, Josephine County Transit began commuter service between Grants Pass and Medford as well. In both Counties, a small fraction of the local population uses public transit.65 For those interested in long-distance bus travel, Greyhound has a route that passes along I-5 through the region. Residents can access Greyhound in Roseburg and Grants Pass. National air service carriers can be found in Eugene and Medford. The Census reports that 948 and 373 households respectively in Douglas and Josephine counties have no vehicle available to them.66 Many more residents may be unable to pay for repairs or insurance needed to drive. Some residents lack resources to regularly fill their car with gas. With or without reliable transportation, accessing services from those towns located far from Roseburg or Grants Pass is challenging. Many residents must schedule multiple services on the same day to access them. On these days, such residents may wait hours between appointments. Sometimes, the distance is too much of a barrier.
64 Google Maps. 65 US Census, 2014 Five Year Estimate. 66 Ibid.

40
Trends/Possible Near-Term Changes
Perhaps the most important trend for transportation in the near term will be the fluctuating cost of fuel and petroleum-based products. The price of gas has varied significantly in the past few years. Currently, due to increased levels of petroleum production in the United States, the price has dipped to between $2.00 and $2.50 per gallon. This is good news for those living below the federal poverty level.

41
Community Survey This past year, UCAN undertook a survey of local residents to better understand their needs. The survey was comprised of 68 items. Though available to all UCAN clients, many survey respondents were individuals seeking energy assistance during October of 2015. To qualify for energy assistance programs, these clients must be living at or below 200% of the federal poverty level. Since different UCAN program clients may have different needs-for example, early childhood program clients are likely to have more needs related to children-survey results are not a perfect reflection of the needs of all low-income residents of the region. Nonetheless, as 420 unduplicated clients completed the survey, survey results still provide valuable insight into the needs of local residents living in poverty.
The number of residents taking the survey in each County reflected the proportion of residents living in the two Counties. 70% of survey respondents lived alone or with one other family member. Most of the remaining 30% comprised families ranging from 3-7 members. 400 of those taking the survey reported incomes of less than 200% of the federal poverty level.
Housing Approximately 93% of survey respondents rent their homes. The table below displays renters’ circumstances.
Renters’ Situations
Answer Options Response Percent
Response Count
I typically make my rent/mortgage payments on time. 76.0% 272
I don’t have trouble paying for my utilities (electric, gas, etc.) 26.0% 93
I live in a good neighborhood (it’s safe, clean, quiet, kid-friendly). 72.1% 258
I live close enough to my work, shopping and services. 50.6% 181
My home has enough space, bedrooms and bathrooms. 77.4% 277
My home is in good shape (has needed appliances, good plumbing/electric, has phone service, has toilets/bathtubs, has heat/cooling, does not need major repairs, does not have mold/mildew or major pest problem).
65.6% 235
I can get into and use all major rooms. 85.2% 305 None of the above. 3.1% 11
As can be seen from the table above, most survey respondents were not able to pay their utilities on-time, and about half did not live in a convenient location. Almost one-third reported living in homes that were not in good shape. Around one-fourth reported
42
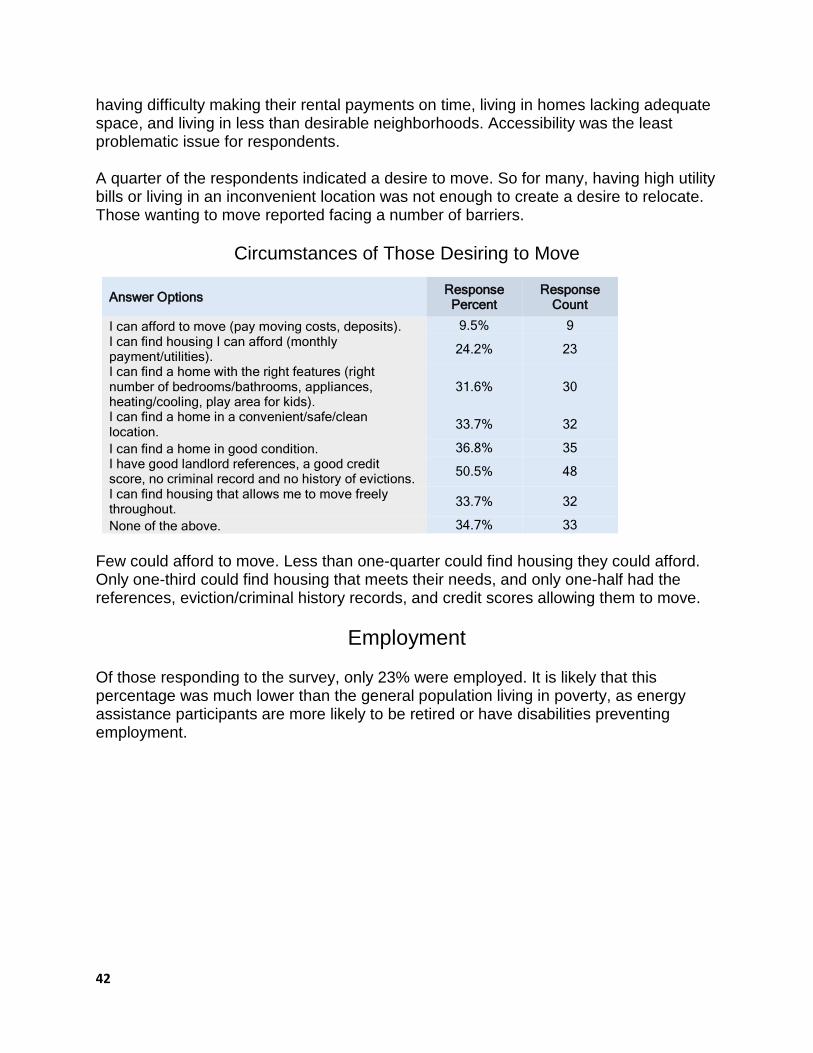
having difficulty making their rental payments on time, living in homes lacking adequate space, and living in less than desirable neighborhoods. Accessibility was the least problematic issue for respondents. A quarter of the respondents indicated a desire to move. So for many, having high utility bills or living in an inconvenient location was not enough to create a desire to relocate. Those wanting to move reported facing a number of barriers.
Circumstances of Those Desiring to Move
Answer Options Response Percent
Response Count
I can afford to move (pay moving costs, deposits). 9.5% 9 I can find housing I can afford (monthly payment/utilities). 24.2% 23
I can find a home with the right features (right number of bedrooms/bathrooms, appliances, heating/cooling, play area for kids).
31.6% 30
I can find a home in a convenient/safe/clean location. 33.7% 32
I can find a home in good condition. 36.8% 35 I have good landlord references, a good credit score, no criminal record and no history of evictions. 50.5% 48
I can find housing that allows me to move freely throughout. 33.7% 32
None of the above. 34.7% 33 Few could afford to move. Less than one-quarter could find housing they could afford. Only one-third could find housing that meets their needs, and only one-half had the references, eviction/criminal history records, and credit scores allowing them to move.
Employment
Of those responding to the survey, only 23% were employed. It is likely that this percentage was much lower than the general population living in poverty, as energy assistance participants are more likely to be retired or have disabilities preventing employment.

43
Those who were employed reported:
Working Respondents’ Circumstances
Answer Options Response Percent
Response Count
My job pays what I would expect for my qualifications. 44.8% 39
My job pays enough so I can meet all of my/my family’s basic needs. 32.2% 28
I get enough hours of work each week. 33.3% 29 I usually work no more than 40 hours/week. 48.3% 42 I have a healthy balance of work and personal time. 48.3% 42 My job provides needed benefits, like sick leave and health insurance. 13.8% 12
My job is not hard to get to. 56.3% 49 None of the above. 11.5% 10
Most working respondents reported circumstances indicating they lack desirable jobs:
• Most were not receiving pay commensurate with their qualifications, had to work more than 40 hours a week, and had a poor balance of work/personal time.
• Only one-third had jobs paying enough to cover their basic needs; the same fraction wanted to work more hours.
• Few of those surveyed had work with needed benefits. Those who stated they want to obtain work indicated:
Circumstances of Those Looking for Work
Answer Options Response Percent
Response Count
I have the knowledge/tools to find a job. 66.7% 60 There are jobs available for the type of work I want to do. 42.2% 38
I have enough education to get the job I want. 37.8% 34 I have the training I need to get the job I want. 32.2% 29 I have adequate transportation to get to work. 57.8% 52 I have a clean criminal record or one that won’t cause problems when I look for work. 73.3% 66
I have good job references. 60.0% 54 None of the above. 10.0% 9
The greatest barriers to obtaining work were lack of training and lack of education needed to get the desired job. Other significant barriers included the lack of available jobs and the lack of transportation to get to work. Over 80% of respondents separately reported that they lacked affordable child care to be able to work.

44
Personal Finances
In response to an item addressing assets, financial knowledge and income supports, participants responded:
Respondents’ Finance-Related Circumstances
Answer Options Response Percent
Response Count
I have a savings or checking account with a bank or credit union. 64.5% 245
I own a home, car, have stock or other valuable asset. 53.4% 203
I have a credit card. 32.4% 123 My credit history is good enough that I can open a savings/checking account, get a credit card, get a loan from a bank/credit union.
34.5% 131
I know how to claim tax credits like the child credit and earned income credit, and get credits I qualify for.
29.5% 112
I know whether I qualify for income supports, like TANF and SNAP, and get the supports I qualify for. 65.8% 250
None of the above. 10.8% 41
These responses generally show that many respondents could use assistance with respect to their personal finances, whether the assistance helps them establish a bank account, obtain assets, obtain a credit card and develop credit history, or learn about relevant tax credits and income supports.
A separate item explored where respondents obtain loans. Responses were as follows:
Source of Loans
Answer Options Response Percent
Response Count
I get it from a bank/credit union. 21.2% 81 I get it from a family/friend. 25.7% 98 I get a payday loan. 4.5% 17 I get a title loan. 3.9% 15 I get a tax return loan/loan in advance of tax return. 1.8% 7 None of the above. 53.4% 204
Based on the responses to this item and the prior item, it appears that many of those UCAN serves have difficulty obtaining credit or loans. Only around one-third had a credit card, and only one-half obtained loans from any source. The majority that obtained loans got their loans from family or friends. Only 16% of respondents wanted to learn how to manage their money better through budgeting, setting financial goals saving, etc. About 20% stated they would like to learn how to pay their monthly bills/manage their debt.

45
Family Well-Being
A few survey items addressed the topic of family well-being. Of respondents with children age 0-17, 13% were interested in taking parent education classes. Of married respondents, 11% wanted to learn how to have a better relationship with their partner. And of all respondents, 10% indicated they do not feel safe around their spouse/partner or someone they with whom they formerly had a relationship. Nonetheless, this comprised 40 respondents. Moreover, the ages for which domestic violence is most common for women are 16-24. Given that the survey likely skewed toward older respondents, it is likely that the 10% figure under reports the number of those who live in fear of partner violence.
Education
The survey examined early childhood, childhood and adult education needs. Of respondents having children not yet in kindergarten, almost half reported a desire to have supports such as the Head Start program available for their children. Of families with children in kindergarten-12th grade, about one quarter expressed a desire to have tutoring/mentoring services available for their kids. Thirty five respondents reported having children with special needs. Of these, seven said their children were not getting the services they need. Respondents were asked whether they were interested in a variety of adult education programs.
Desired Adult Education
Answer Options Response Percent
Response Count
I would like to get a GED. 7.7% 29 I would like to improve my math/reading/writing. 10.4% 39 I would like to speak/write English better. 4.0% 15 I would like to take some college classes. 18.1% 68 I would like to get a more advanced degree (associates, bachelors, etc.) 15.2% 57
I would like to get professional training/certifications. 17.3% 65 None of the above. 67.0% 252
Though less than one-third indicated an interest in adult education, more than 50 respondents had an interest in taking some college classes, working toward a more advanced degree, or getting professional training/certification. The survey might have had more respondents interested in obtaining their GED if a younger cohort had participated. Given that the survey itself was only provided in English, it is likely that there would be a greater interest in English classes if mono-lingual Spanish-speakers also participated.

46
Health
The survey included several items related to health and well-being. The first asked respondents to self-report on various aspects of their own health. Self-reports of health have been found to be good indicators of actual health.
Respondents’ Health Circumstances
I am in good health. 54.3% 204 I am in good dental health. 40.7% 153 I can obtain medical care when I need it. 84.6% 318 I can obtain dental care when I need it. 62.0% 233 I can obtain prescriptions when I need them. 79.8% 300 I can obtain emergency health treatment when I need it. 77.1% 290
None of the above. 6.9% 26
These numbers reflect the fact that residents of Douglas and Josephine County are often in poor health, as was discussed in the earlier section discussing County Health Rankings. Just over half of respondents reported they were in good health and only four out of ten reported they were in good dental health. While better access to healthcare would help, it may be that what is more needed is greater availability to preventative health care and better education on health issues. A greater number of people did not have access to dental care as opposed to health care. More dentists and better coverage of the costs of dental care might help in this case.
16% of respondents reported not being in good mental health. Of these, three-quarters were able to obtain mental health care when needed. Almost half of respondents reported having an addiction to alcohol or drugs. If this response is accurate, this is a serious problem for the region. Of those reporting addiction issues, 25% reported not being able to obtain treatment when needed.
Of those responding, 125 had children age 0-18. The reported health of children was much better then self-reports of health.
Children’s Health
Answer Options Response Percent
Response Count
My children are generally in good health. 97.6% 122 My children generally have good dental health. 87.2% 109 My children generally have good mental health. 86.4% 108 My children do not drink or use illegal drugs. 88.0% 110 None of the above. 1.6% 2

47
Though almost all children were reported to be in good health, dental and behavioral issues could be improved within this population.
Food
As with health, food needs were examined both at the level of the respondent and at the level of respondents’ children. Regarding themselves, respondents reported:
Respondents’ Food Situation
Answer Options Response Percent
Response Count
I am able to obtain enough food to meet my needs. 80.1% 297 I am able to obtain enough healthy food to meet my needs. 65.0% 241
I know how to make healthy meals. 83.8% 311 I have access to a kitchen and the things I need to cook my meals. 92.2% 342
I have a supermarket located near where I live. 80.6% 299 None of the above. 3.2% 12
The percentage of respondents reporting that they did not have enough food to meet their needs is remarkably close to the levels of food insecurity reported by Feeding America for the area. Perhaps more concerning is the one-third of respondents who reported not having enough healthy food to meet needs. Obesity is a major problem in the area, and lack of healthy foods is undoubtedly one cause of this key health problem. Those with children reported that:
Children’s Food Situation
Answer Options Response Percent
Response Count
I am able to obtain enough food to meet their needs. 90.2% 110 I am able to provide them enough healthy food. 73.8% 90 None of the above. 9.0% 11
These results support findings that indicate that when food is scarce, parents will often make sure their children’s needs are met before meeting their own needs. Still, almost 10% of children were not having their food needs met, and over one-quarter of children were not on healthy diets.
48
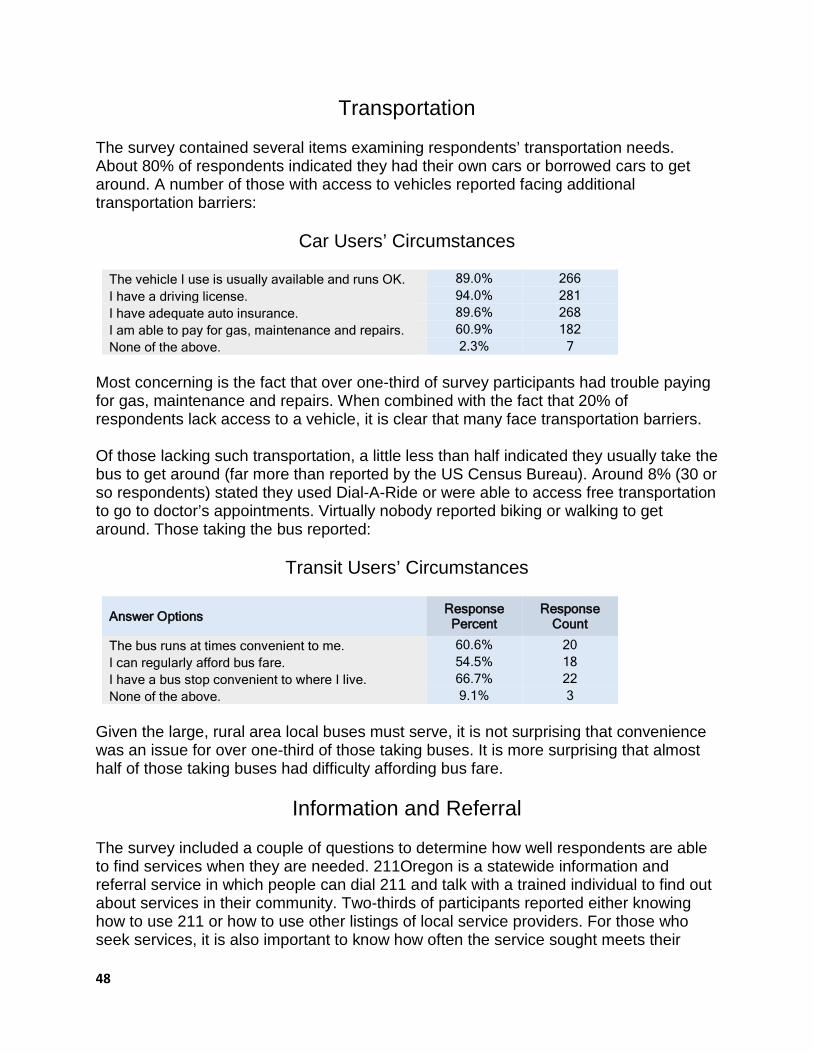
Transportation
The survey contained several items examining respondents’ transportation needs. About 80% of respondents indicated they had their own cars or borrowed cars to get around. A number of those with access to vehicles reported facing additional transportation barriers:
Car Users’ Circumstances
The vehicle I use is usually available and runs OK. 89.0% 266 I have a driving license. 94.0% 281 I have adequate auto insurance. 89.6% 268 I am able to pay for gas, maintenance and repairs. 60.9% 182 None of the above. 2.3% 7
Most concerning is the fact that over one-third of survey participants had trouble paying for gas, maintenance and repairs. When combined with the fact that 20% of respondents lack access to a vehicle, it is clear that many face transportation barriers. Of those lacking such transportation, a little less than half indicated they usually take the bus to get around (far more than reported by the US Census Bureau). Around 8% (30 or so respondents) stated they used Dial-A-Ride or were able to access free transportation to go to doctor’s appointments. Virtually nobody reported biking or walking to get around. Those taking the bus reported:
Transit Users’ Circumstances
Answer Options Response Percent
Response Count
The bus runs at times convenient to me. 60.6% 20 I can regularly afford bus fare. 54.5% 18 I have a bus stop convenient to where I live. 66.7% 22 None of the above. 9.1% 3
Given the large, rural area local buses must serve, it is not surprising that convenience was an issue for over one-third of those taking buses. It is more surprising that almost half of those taking buses had difficulty affording bus fare.
Information and Referral
The survey included a couple of questions to determine how well respondents are able to find services when they are needed. 211Oregon is a statewide information and referral service in which people can dial 211 and talk with a trained individual to find out about services in their community. Two-thirds of participants reported either knowing how to use 211 or how to use other listings of local service providers. For those who seek services, it is also important to know how often the service sought meets their

49
needs. A number of services have waiting lists, and some service providers may not otherwise be able to respond to the needs of those who seek their assistance. Around 80% of survey participants reported being able to obtain services they sought.
Survey Summary Taken as a whole, survey results suggest a significant number of area residents living in poverty:
• Rent rather than own homes. • Have significant issues addressing needs requiring immediate cash outlays like
paying utilities, paying moving costs, paying for gas, bus fare, car maintenance and repair.
• Do not live in areas convenient for them. • Generally want to stay in their home, even though many are inadequate. • Face substantial hurdles if they wish to relocate. • Often work more than 40 hours a week. • If unemployed, desire training or college classes to improve their employability. • Face a challenging job market. • Fail to take tax credits which would benefit them. • Are not obtaining TANF and SNAP benefits. • Need help building credit, obtaining credit cards, and obtaining loans. • Need early childhood programming, child care and tutoring/mentoring programs. • If adult, lack good general health and dental health. • Have problems with addiction. • If adult, lack adequate food, particularly healthy food. • If children, lack adequate healthy food. • Face various barriers to adequate transportation. • Do not know how to use 211 or other directories of service.
50
KEY STRATEGIES TO ADDRESS AREA NEEDS
Economy Because UCAN’s mission is to help those living in poverty, strategies that best ameliorate poverty would help clients the most. Two ways to best address poverty are outside of the direct role of social service agencies like UCAN:
• Increase the number of jobs in the region. • Increase area wages.
State and local policy-makers are in the best position to directly address these two issues. Passage of the state’s minimum wage law will increase area wages. As additional education may be one of the best ways for UCAN clients to obtain better jobs or wages, UCAN direct service staff could prioritize discussing the importance of obtaining such education with adult clients seeking any of UCAN’s services. Staff could also distribute marketing materials from local education/training providers like Rogue and Umpqua Community Colleges. UCAN could consider prioritizing some program services for people who cannot work, to the extent funding sources allow for such prioritization.
Education/Child Care UCAN has an incredible opportunity to improve both early childhood outcomes as well as provide additional no-cost childcare in Douglas County. In the past year, in addition to Head Start, UCAN began offering Healthy Start and Healthy Families services, as well as Nurse Home Visiting and WIC programs. Of these, Head Start is most directly related to school readiness. But all of these programs improve school readiness of children ages 0-5, either by improving parents’ abilities to be their children’s first teachers, or by addressing the health, safety and well-being of children so they are better able to learn. As UCAN now operates all of these programs within its Child Service Division, staff have the opportunity to align, integrate and wrap-around various program services so that Douglas County’s most vulnerable children are best prepared to enter and succeed in kindergarten. UCAN is also in the midst of a major capital campaign that will result in the construction of a new Early Childhood Service Center in Roseburg. This facility will relieve long-time space constraints, making it easier for UCAN to increase the number of children and families who can receive Head Start services. As Head Start also provides no-cost child care, the facility will increase the availability of such care. The Center will support the integration of program services, and will reduce program operating costs. Program savings can be reinvested into these programs, increasing the availability and quality of program services. UCAN supports one program directly serving children with special needs and exceptional children in K-12 schools (in Douglas County only)-Foster Grandparents.

51
This program serves schools and after-school programs by placing people 55+ in such settings as tutors and mentors. Members providing services receive a stipend for their services. Increasing the number of such members would not only improve school outcomes for these children, it would also provide additional funds to seniors in need (members must also be low-income). This program is supported by the Volunteer Foundation of Douglas County, which is currently overseen by local volunteers. Steps that would strengthen the Foundation would enhance funding availability to this program.
Health and Wellness
UCAN has traditionally been viewed as a “social service” agency. But the line distinguishing social and health services is blurring. Public health researchers are becoming increasingly aware of the key role that “social determinants” play in people’s health and well-being. UCAN’s programs address many areas identified by the Healthy People 2020 Initiative67 as social determinants, including:
• Poverty • Food Security • Housing Stability • High School Graduation • Language and Literacy • Early Childhood Education and Development • Social Cohesion • Civic Participation • Access to Health Care • Access to Primary Care • Health Literacy • Access to Healthy Foods • Quality of Housing • Environmental Conditions
When Oregon’s former Governor John Kitzhaber undertook to reorganize the state’s health care system, he acknowledged the importance and cost-effectiveness of addressing social determinants of health. The example he and his staff often shared was that of a woman suffering from a chronic illness requiring hospitalization whenever she became overheated. The woman in this example lived in housing without air conditioning. The Governor pointed out that it would be much better “healthcare” if, rather than repeatedly hospitalizing this woman, she simply had an air conditioner purchased for her. Though this idea makes a great deal of sense, it has only slowly been adopted by health agencies. This is in part because such agencies’ funding streams do not yet pay for many such solutions. But it is also due to the fact that healthcare providers have not
67 https://www.healthypeople.gov/2020/topics-objectives/topic/social-determinants-of-health

52
been trained to think this way when addressing health issues. The State is working with the federal government to expand uses of Medicaid to address such situations. While this effort is ongoing, UCAN has an opportunity to educate local Coordinated Care Organizations and other health care agencies on the importance of seeking health solutions from outside the traditional model of healthcare. To the extent that UCAN helps residents address social determinants of health, the agency is also improving resident health and wellness. For example, from the resident survey, we know that provision of healthy food is challenging for local, low-income residents. UCAN can continue to expand its community farm in Josephine County to increase the amount of healthy food local residents receive in emergency food boxes. Both of UCAN’s Food Banks, as well as its Head Start and WIC nutrition programs can work with residents to increase their understanding of the importance of nutrition and help residents learn how to shop for and cook with healthier ingredients. UCAN’s Douglas County programs serving pregnant women and young children offer perhaps the greatest opportunity for UCAN to improve County residents’ health and well-being. A recent report by the National Scientific Council on the Developing Child and the National Forum on Early Childhood Policy and Programs68 recommends rethinking health policies and programs:
A focus on health promotion in the early childhood period-where an extensive body of research supports the promise of effective prevention programs that can change the trajectory of children’s lives-can help reduce the social and economic burden of illness, not only in childhood but throughout the adult years. This connection between early life experiences and health underscores the importance of strategic investments in the care and protection of pregnant women, infants and children, and it suggests that most current attempts to prevent adult disease and create a healthier workforce may be starting too late [emphasis added].
The report specifically notes the potentially important roles that WIC and Head Start can play in health promotion.69 As noted earlier, UCAN now operates many of the programs targeting the health and well-being of pregnant women and children in Douglas County. Not only does UCAN operate Head Start and WIC, the agency also operates three home visiting programs focused on the health of pregnant women and young children: Healthy Families, Healthy Start, and Nurse Home Visiting. UCAN can improve the County’s health by simply increasing the availability of these programs to local residents. By developing innovative approaches to maximize these programs’ effectiveness, UCAN can further improve local health outcomes.
68 National Scientific Council on the Developing Child and the National Forum on Early Childhood Policy and Programs. The Foundations of Lifelong Health Are Built in Early Childhood. July 2010. Center on the Developing Child at Harvard University. 69 Ibid at 17-18.

53
Housing
Though more affordable housing is needed in Douglas County, the housing situation is much worse in Josephine County. Rents are higher in Josephine County, and the County has a higher percentage of severely burdened renters than does Douglas County. Josephine County also has a severe homeless problem. Making matters worse, Josephine County lacks an agency currently dedicated to affordable housing development. UCAN has offered a range of programs to help address housing issues, including housing development, rental and move-in assistance, energy assistance, weatherization, and second chance renter programs. UCAN has focused affordable housing development activities in Douglas County, but has the opportunity to develop housing in Josephine County as well. If UCAN has flexible dollars available to address housing issues in either County, the agency can prioritize funds for housing programs serving Josephine County residents.
Transportation
UCAN offers transportation services, including Douglas County’s public transit and both Counties’ Medicaid transportation. In addition, UCAN’s Senior Companions can provide transportation for frail, seniors in both Counties. These services play an important role in helping to address transportation issues in UCAN’s service area. But according to survey respondents, the greatest transportation-related need is money to pay for gas and bus fare. UCAN does not receive any source of revenue specifically targeted to address this need. UCAN does have some flexible revenue sources available to it, and might want to put a small amount of these funds aside to make gas and bus vouchers available to residents.
Summary
This past year, UCAN has become a primary provider of early childhood services in Douglas County. UCAN was already a provider of many social services in both Douglas and Josephine County, and an active partner with many other social service, health and education agencies. Perhaps one of the most promising strategies for better addressing local community needs is through strategic collective impact. The more that UCAN and partner agencies are able to work together to meet the region’s greatest needs, the more effectively these needs will be met. At the same time, job creation and job training would best address the many issues discussed in this assessment. The region had far fewer needs when many residents without college educations had relatively high-paying jobs in the timber extraction and wood manufacturing industries. But most of these jobs have been lost to globalization, automation and regulation. Residents who formerly worked these jobs need the training and opportunity to find living wage jobs. Even though UCAN is not an employment or job training agency, staff can help clients connect with the services they need to improve their wages and employability.


