60
Bay State Gas Company d/b/a Columbia Gas of Massachusetts 2016 Energy Efficiency Plan-Year Report D.P.U. 17-100 May 1, 2017

Bay State Gas Company d/b/a
Columbia Gas of Massachusetts
2016
Energy Efficiency Plan-Year Report
D.P.U. 17-100
May 1, 2017

Bay State Gas Company d/b/a Columbia Gas of Massachusetts
2016 Energy Efficiency Plan-Year Report
D.P.U. 17-100
May 1, 2017
Table of Contents
2016 PLAN YEAR REPORT DATA TABLES Appendix 1: Significant Core Initiative Variances & Cost-Effectiveness Appendix 2: Benefit-Cost Ratio Screening Tool Appendix 3: Technical Reference Manual – 2016 Report Version Appendix 4: Statewide Evaluation Studies Summary
Appendix 4A - Table of Evaluation Studies
Appendix 4B - Summary of the Studies with the Most Significant Effects
Appendix 4C - Evaluation Study Summaries
Appendix 4D - 2016 Plan-Year Report Evaluation Studies Appendix 5: Performance Incentives Appendix 6: Demand Reduction Update

10 of 47
Energy Efficiency Data Tables2016 Plan Year Report OverviewCMAMay 1, 2017
OVERVIEW
USING THE DATA TABLES
BENEFIT-COST SCREENING MODEL
PERFORMANCE INCENTIVE MODEL
EM&V ACTIVITIES
The following data tables provide a summary of the Program Administrator's benefits, costs, savings, and cost-effectiveness for 2016 through 2018. The planned values are consistent with each Program Administrator's 2016-2018 Three-Year Plan. The 2016 preliminary and evaluated values are presented here for the first time as part of each Program Administrator's 2016 Plan Year Report.
The data included in these tables is based on other supporting models. The primary supporting models used by the Program Administrators in the preparation of this 2016 Plan Year Report are the Benefit-Cost Screening model and the Performance Incentive model. These exhibits should be referenced when looking for more detailed analyses, such as measure-level savings. High-level summaries for each of these models are provided below.
The Benefit-Cost Screening model provides measure-level savings and benefits. This model uses the avoided cost values from the 2015 Avoided Energy Supply Cost study prepared by Tabors Caramanis Rudkevich.
The Performance Incentive model filed as part of the Joint Statewide Three-Year Plan provides support for the performance incentive dollars proposed for collection by the Program Administrator. Final performance incentive amounts will be based on the three-year term and will be subject to review and final approval in the three-year term report; the amounts shown in the Plan-Year Report are based on the data available to date and will change as additional years of data are included. Note that performance incentives are not applicable to the Cape Light Compact.
The Evaluation, Monitoring & Verification (EMV) Section of the Joint Statewide Three-Year Plan describes in detail the EM&V activities planned for 2016-2018. The EMV section of each Program Administrator's 2016 Plan Year Report summarizes the evaluation results completed in 2016 and their impact on the 2016 evaluated results. The Technical Reference Manual (TRM) has been updated to account for recent evaluation results.
These Plan Year Report data tables are in a pivot table format with set outputs based on the Department's direction in D.P.U. 11-120, Phase II. Users can manipulate the data by using either the raw data included on the Master Data tab, or the Slicers shown on the Selections tab. The Slicers will update the comparisons between the planned, preliminary, or evaluated results on the Plan Year Summary tables only.
Bay State Gas Company d/b/a Columbia Gas of Massachusetts 2016 Energy Efficiency Plan-Year Report D.P.U. 17-100 May 1, 2017 Page 1 of 37

2016 Plan Year Report VariancesVariances SummaryCMAMay 1, 2017
A - Residential 32.5% 25.5% 16.6% -8.5%A1 - Residential Whole House 46.9% 33.3% 20.6% -10.4%
A1a - Residential New Construction 160.8% 144.7% 121.6% -60.6%A1b - Residential Multi-Family Retrofit 14.7% -12.3% -8.6% 41.2%A1c - Residential Home Energy Services - Measures 42.1% 19.7% 9.0% 0.0%A1d - Residential Home Energy Services - RCS 50.5%A1e - Residential Behavior/Feedback Program
A2 - Residential Products -8.5% 0.8% -0.2% 0.0%A2a - Residential Heating & Cooling Equipment -8.5% 0.8% -0.2% 0.0%A2b - Residential Consumer ProductsA2c - Residential Lighting
B - Low-Income -4.5% -4.3% 0.0% 0.0%B1 - Low-Income Whole House -3.8% -4.3% 0.0% 0.0%
B1a - Low-Income Single Family Retrofit -8.7% 8.7% 8.6% 0.0%B1b - Low-Income Multi-Family Retrofit 2.0% -12.4% -8.5% 0.0%
C - Commercial & Industrial -29.6% -33.1% -20.2% -6.4%C1 - C&I New Construction -9.1% -15.2% -18.3% -21.3%
C1a - C&I New Buildings & Major Renovations -60.0% -77.1% -80.7% -1.1%C1b - C&I Initial Purchase & End of Useful Life 14.8% 15.2% 12.2% -23.0%
C2 - C&I Retrofit -39.4% -40.4% -20.8% -0.7%C2a - C&I Existing Building Retrofit -38.7% -42.1% -27.6% -0.9%C2b - C&I Small Business -16.5% -4.1% 63.7% 0.0%C2c - C&I Multifamily Retrofit -63.6% -76.6% -78.7% 0.0%C2d - C&I Upstream Lighting
Grand Total 11.6% 0.7% 4.7% -7.3%
Notes• Significant variances, which require explanation, are defined as:
(1) variances between planned and actual core initiative budget of 15 percent or greater;(2) variances between planned and preliminary core initiative total lifetime savings showing a decrease of 15 percent or greater; (3) variances between planned and preliminar y core initiative total benefits showing a decrease of 15 percent or greater; and (4) variances between preliminary and evaluated core initiative total resource benefits showing a decrease of 15 percent or greater .
• Cells highlighted in the above tables indicate that a variance is significant enough to require explanation. Refer to the Program Administrator's Plan Year Report for explanations of significant variances.
• Variances are calculated as a percent of the three-year goal, meaning variance are calculated as the percentage difference between the percentage of the Three-Year Plan goals planned to be achieved through the Plan Year Report year compared to the percentage of the Three-Year Plan goals actually achieved through the Plan Year Report year.
Variances Summary
ProgramTotal Resource
Benefits (2016$) Variances
Total Program Cost Variances
Lifetime Natural Gas Savings
(Therms)
Total Benefits (2016$) Variances
Bay State Gas Company d/b/a Columbia Gas of Massachusetts 2016 Energy Efficiency Plan-Year Report D.P.U. 17-100 May 1, 2017 Page 2 of 37

2016 Plan Year Report VariancesTotal Program Cost VariancesCMAMay 1, 2017
2016 2017 2018 2016-2018 2016Planned 2016 % Total Plan
Actual 2016 % Total Plan
Planned v Actual (%)
A - Residential 20,487,754 20,844,547 21,121,172 62,453,474 27,155,124 33% 43% 32.5%A1 - Residential Whole House 15,351,855 15,692,295 15,951,430 46,995,580 22,557,433 33% 48% 46.9%
A1a - Residential New Construction 812,241 884,940 986,115 2,683,296 2,118,207 30% 79% 160.8%A1b - Residential Multi-Family Retrofit 1,606,798 1,544,640 1,561,742 4,713,180 1,842,994 34% 39% 14.7%A1c - Residential Home Energy Services - Measures 10,320,086 10,585,818 10,664,091 31,569,995 14,664,878 33% 46% 42.1%A1d - Residential Home Energy Services - RCS 2,612,730 2,676,897 2,739,482 8,029,109 3,931,354 33% 49% 50.5%A1e - Residential Behavior/Feedback Program - - - - -
A2 - Residential Products 4,566,836 4,565,385 4,572,559 13,704,780 4,177,099 33% 30% -8.5%A2a - Residential Heating & Cooling Equipment 4,566,836 4,565,385 4,572,559 13,704,780 4,177,099 33% 30% -8.5%A2b - Residential Consumer Products - - - - - A2c - Residential Lighting - - - - -
B - Low-Income 7,174,103 7,250,925 7,427,057 21,852,085 6,852,117 33% 31% -4.5%B1 - Low-Income Whole House 6,991,776 7,065,308 7,236,203 21,293,286 6,723,025 33% 32% -3.8%
B1a - Low-Income Single Family Retrofit 3,824,912 3,843,534 3,929,987 11,598,433 3,491,602 33% 30% -8.7%B1b - Low-Income Multi-Family Retrofit 3,166,864 3,221,774 3,306,216 9,694,853 3,231,424 33% 33% 2.0%
C - Commercial & Industrial 7,592,090 7,707,446 7,817,243 23,116,779 5,343,575 33% 23% -29.6%C1 - C&I New Construction 2,328,421 2,428,107 2,517,892 7,274,420 2,115,716 32% 29% -9.1%
C1a - C&I New Buildings & Major Renovations 745,493 803,957 832,498 2,381,949 298,366 31% 13% -60.0%C1b - C&I Initial Purchase & End of Useful Life 1,582,928 1,624,150 1,685,394 4,892,471 1,817,350 32% 37% 14.8%
C2 - C&I Retrofit 5,087,722 5,099,288 5,115,860 15,302,870 3,082,962 33% 20% -39.4%C2a - C&I Existing Building Retrofit 3,609,982 3,627,821 3,639,716 10,877,519 2,211,485 33% 20% -38.7%C2b - C&I Small Business 707,007 703,767 709,273 2,120,047 590,587 33% 28% -16.5%C2c - C&I Multifamily Retrofit 770,733 767,700 766,871 2,305,304 280,891 33% 12% -63.6%C2d - C&I Upstream Lighting - - - - -
Grand Total 35,253,948 35,802,918 36,365,472 107,422,338 39,350,815 33% 37% 11.6%
NotesPlan year core initiative significant variance explanations are required for: (1) variances between planned and actual core initiative budget of 15 percent or greater.
Actual Planned v. Actual (%)Total Program Cost Variances
ProgramPlanned
Bay State Gas Company d/b/a Columbia Gas of Massachusetts 2016 Energy Efficiency Plan-Year Report D.P.U. 17-100 May 1, 2017 Page 3 of 37

2016 Plan Year Report VariancesLifetime Natural Gas Savings (Therms) VariancesCMAMay 1, 2017
2016 2017 2018 2016-2018 2016Planned 2016 % Total Plan
Preliminary 2016 % Total Plan
Planned v Preliminary (%)
A - Residential 37,781,956 37,994,448 38,869,815 114,646,219 47,428,618 33% 41% 25.5%A1 - Residential Whole House 28,764,612 28,977,103 29,852,471 87,594,186 38,341,960 33% 44% 33.3%
A1a - Residential New Construction 3,548,020 3,861,642 4,768,265 12,177,927 8,680,260 29% 71% 144.7%A1b - Residential Multi-Family Retrofit 1,612,228 1,511,097 1,511,097 4,634,423 1,414,538 35% 31% -12.3%A1c - Residential Home Energy Services - Measures 23,604,364 23,604,364 23,573,109 70,781,836 28,247,163 33% 40% 19.7%A1d - Residential Home Energy Services - RCS - - - - - A1e - Residential Behavior/Feedback Program - - - - -
A2 - Residential Products 9,017,344 9,017,344 9,017,344 27,052,033 9,086,658 33% 34% 0.8%A2a - Residential Heating & Cooling Equipment 9,017,344 9,017,344 9,017,344 27,052,033 9,086,658 33% 34% 0.8%A2b - Residential Consumer Products - - - - - A2c - Residential Lighting - - - - -
B - Low-Income 7,381,851 7,304,702 7,304,702 21,991,254 7,061,581 34% 32% -4.3%B1 - Low-Income Whole House 7,381,851 7,304,702 7,304,702 21,991,254 7,061,581 34% 32% -4.3%
B1a - Low-Income Single Family Retrofit 2,826,030 2,826,030 2,826,030 8,478,090 3,070,656 33% 36% 8.7%B1b - Low-Income Multi-Family Retrofit 4,555,821 4,478,672 4,478,672 13,513,164 3,990,925 34% 30% -12.4%
C - Commercial & Industrial 26,674,639 27,012,615 27,341,728 81,028,981 17,852,215 33% 22% -33.1%C1 - C&I New Construction 7,763,266 8,400,564 8,841,324 25,005,154 6,585,686 31% 26% -15.2%
C1a - C&I New Buildings & Major Renovations 2,554,992 3,082,826 3,353,668 8,991,486 585,351 28% 7% -77.1%C1b - C&I Initial Purchase & End of Useful Life 5,208,274 5,317,738 5,487,655 16,013,667 6,000,336 33% 37% 15.2%
C2 - C&I Retrofit 18,911,373 18,612,050 18,500,404 56,023,827 11,266,528 34% 20% -40.4%C2a - C&I Existing Building Retrofit 16,004,362 15,775,155 15,677,705 47,457,223 9,274,291 34% 20% -42.1%C2b - C&I Small Business 1,809,690 1,764,934 1,759,814 5,334,438 1,735,533 34% 33% -4.1%C2c - C&I Multifamily Retrofit 1,097,321 1,071,961 1,062,885 3,232,167 256,704 34% 8% -76.6%C2d - C&I Upstream Lighting - - - - -
Grand Total 71,838,445 72,311,764 73,516,245 217,666,454 72,342,414 33% 33% 0.7%
Notes
Lifetime Natural Gas Savings (Therms) Variances
ProgramPlanned Preliminary Planned v. Preliminary (%)
Plan year core initiative significant variance explanations are required for: (2) variances between planned and preliminary core initiative total lifetime savings showing a decrease of 15 percent or greater.
Bay State Gas Company d/b/a Columbia Gas of Massachusetts 2016 Energy Efficiency Plan-Year Report D.P.U. 17-100 May 1, 2017 Page 4 of 37

2016 Plan Year Report VariancesTotal Benefits (2016$) VariancesCMAMay 1, 2017
2016 2017 2018 2016-2018 2016Planned 2016 % Total Plan
Preliminary 2016 % Total Plan
Planned v Preliminary (%)
A - Residential 66,575,024 66,704,532 67,837,626 201,117,182 77,648,000 33% 39% 16.6%A1 - Residential Whole House 53,903,665 54,133,336 55,290,087 163,327,088 65,003,581 33% 40% 20.6%
A1a - Residential New Construction 5,995,657 6,531,647 7,701,140 20,228,445 13,288,315 30% 66% 121.6%A1b - Residential Multi-Family Retrofit 2,874,206 2,674,072 2,662,206 8,210,484 2,626,878 35% 32% -8.6%A1c - Residential Home Energy Services - Measures 45,033,802 44,927,618 44,926,740 134,888,159 49,088,388 33% 36% 9.0%A1d - Residential Home Energy Services - RCS - - - - - A1e - Residential Behavior/Feedback Program - - - - -
A2 - Residential Products 12,671,359 12,571,196 12,547,539 37,790,094 12,644,419 34% 33% -0.2%A2a - Residential Heating & Cooling Equipment 12,671,359 12,571,196 12,547,539 37,790,094 12,644,419 34% 33% -0.2%A2b - Residential Consumer Products - - - - - A2c - Residential Lighting - - - - -
B - Low-Income 11,051,359 10,884,164 10,871,350 32,806,874 11,053,238 34% 34% 0.0%B1 - Low-Income Whole House 11,051,359 10,884,164 10,871,350 32,806,874 11,053,238 34% 34% 0.0%
B1a - Low-Income Single Family Retrofit 5,491,106 5,470,236 5,472,064 16,433,406 5,963,229 33% 36% 8.6%B1b - Low-Income Multi-Family Retrofit 5,560,253 5,413,929 5,399,286 16,373,468 5,090,009 34% 31% -8.5%
C - Commercial & Industrial 29,958,031 29,491,100 29,394,753 88,843,884 23,900,056 34% 27% -20.2%C1 - C&I New Construction 6,823,343 7,273,614 7,605,272 21,702,229 5,574,869 31% 26% -18.3%
C1a - C&I New Buildings & Major Renovations 2,239,190 2,668,556 2,891,459 7,799,205 432,851 29% 6% -80.7%C1b - C&I Initial Purchase & End of Useful Life 4,584,153 4,605,058 4,713,813 13,903,024 5,142,018 33% 37% 12.2%
C2 - C&I Retrofit 23,134,688 22,217,486 21,789,481 67,141,655 18,325,187 34% 27% -20.8%C2a - C&I Existing Building Retrofit 19,439,154 18,695,380 18,333,110 56,467,644 14,067,688 34% 25% -27.6%C2b - C&I Small Business 2,437,906 2,313,111 2,265,699 7,016,716 3,989,645 35% 57% 63.7%C2c - C&I Multifamily Retrofit 1,257,628 1,208,994 1,190,672 3,657,294 267,854 34% 7% -78.7%C2d - C&I Upstream Lighting - - - - -
Grand Total 107,584,414 107,079,796 108,103,729 322,767,940 112,601,294 33% 35% 4.7%
NotesPlan year core initiative significant variance explanations are required for: (3) variances between planned and preliminary core initiative total benefits showing a decrease of 15 percent or greater.
Total Benefits (2016$) Variances
ProgramPlanned Preliminary Planned v. Preliminary (%)
Bay State Gas Company d/b/a Columbia Gas of Massachusetts 2016 Energy Efficiency Plan-Year Report D.P.U. 17-100 May 1, 2017 Page 5 of 37

2016 Plan Year Report VariancesTotal Resource Benefits (2016$) VariancesCMAMay 1, 2017
Preliminary EvaluatedPreliminary v Evaluated (%)
A - Residential 57,371,292 52,492,530 -8.5%A1 - Residential Whole House 46,912,863 42,034,101 -10.4%
A1a - Residential New Construction 9,032,408 3,559,964 -60.6%A1b - Residential Multi-Family Retrofit 1,463,312 2,066,530 41.2%A1c - Residential Home Energy Services - Measures 36,417,143 36,407,606 0.0%A1d - Residential Home Energy Services - RCS - - A1e - Residential Behavior/Feedback Program - -
A2 - Residential Products 10,458,429 10,458,429 0.0%A2a - Residential Heating & Cooling Equipment 10,458,429 10,458,429 0.0%A2b - Residential Consumer Products - - A2c - Residential Lighting - -
B - Low-Income 7,645,327 7,645,326 0.0%B1 - Low-Income Whole House 7,645,327 7,645,326 0.0%
B1a - Low-Income Single Family Retrofit 3,913,100 3,913,100 0.0%B1b - Low-Income Multi-Family Retrofit 3,732,227 3,732,225 0.0%
C - Commercial & Industrial 19,954,230 18,669,849 -6.4%C1 - C&I New Construction 5,574,869 4,386,725 -21.3%
C1a - C&I New Buildings & Major Renovations 432,851 428,068 -1.1%C1b - C&I Initial Purchase & End of Useful Life 5,142,018 3,958,657 -23.0%
C2 - C&I Retrofit 14,379,361 14,283,125 -0.7%C2a - C&I Existing Building Retrofit 10,322,240 10,226,003 -0.9%C2b - C&I Small Business 3,795,256 3,795,256 0.0%C2c - C&I Multifamily Retrofit 261,866 261,866 0.0%C2d - C&I Upstream Lighting - -
Grand Total 84,970,849 78,807,705 -7.3%
NotesPlan year core initiative significant variance explanations are required for: (4) variances between preliminary and evaluated core initiative total resource benefits showing a decrease of 15 percent or greater.
Total Resource Benefits (2016$) Variances
Program2016
Bay State Gas Company d/b/a Columbia Gas of Massachusetts 2016 Energy Efficiency Plan-Year Report D.P.U. 17-100 May 1, 2017 Page 6 of 37

Program Administrator Budgets, Plan Year Summary2016 Planned vs. EvaluatedCMAMay 1, 2017
Program Planning and Administration
Marketing and Advertising
Participant Incentive
Sales, Technical Assistance & Training
Evaluation and Market Research
Total Program Costs
A - Residential 812,236 574,650 13,542,750 4,776,799 781,319 20,487,754 776,264 21,264,018 1,310 2.35 A1 - Residential Whole House 489,826 312,708 9,526,276 4,421,047 601,997 15,351,855 670,993 16,022,848 1,938 2.50
A1a - Residential New Construction 24,819 16,567 593,040 145,920 31,895 812,241 70,332 882,573 1,867 4.51 A1b - Residential Multi-Family Retrofit 49,176 32,774 1,335,719 126,037 63,093 1,606,798 29,453 1,636,251 1,544 1.05 A1c - Residential Home Energy Services - Measures 315,843 210,498 7,597,517 1,790,998 405,229 10,320,086 571,208 10,891,293 1,601 3.20 A1d - Residential Home Energy Services - RCS 99,988 52,870 - 2,358,091 101,780 2,612,730 - 2,612,730 - A1e - Residential Behavior/Feedback Program - - - - - - - -
A2 - Residential Products 139,767 93,149 3,914,475 240,124 179,322 4,566,836 105,271 4,672,108 591 2.17 A2a - Residential Heating & Cooling Equipment 139,767 93,149 3,914,475 240,124 179,322 4,566,836 105,271 4,672,108 591 2.17 A2b - Residential Consumer Products - - - - - - - - A2c - Residential Lighting - - - - - - - -
A3 - Residential Hard-to-Measure 182,643 168,793 101,999 115,628 - 569,063 - 569,063 - A3a - Residential Statewide Marketing - 160,862 - - - 160,862 - 160,862 - A3b - Residential Statewide Database 20,108 - - - - 20,108 - 20,108 - A3c - Residential DOER Assessment 96,285 - - - - 96,285 - 96,285 - A3d - Residential EEAC Consultants 54,449 - - - - 54,449 - 54,449 - A3e - Residential Sponsorships & Subscriptions 8,066 5,441 - - - 13,507 - 13,507 - A3f - Residential HEAT Loan 3,736 2,490 101,999 9,040 - 117,265 - 117,265 - A3g - Residential Workforce Development - - - 48,325 - 48,325 - 48,325 - A3h - Residential R&D and Demonstration - - - 8,262 - 8,262 - 8,262 - A3i - Residential Education - - - 50,000 - 50,000 - 50,000 -
B - Low-Income 327,022 206,335 5,182,584 1,183,393 274,770 7,174,103 108,924 7,283,027 11,800 1.10 B1 - Low-Income Whole House 208,299 142,730 5,182,584 1,183,393 274,770 6,991,776 108,924 7,100,700 11,500 1.12
B1a - Low-Income Single Family Retrofit 113,952 78,082 2,768,885 713,678 150,315 3,824,912 47,654 3,872,566 6,980 0.93 B1b - Low-Income Multi-Family Retrofit 94,347 64,648 2,413,699 469,715 124,455 3,166,864 61,270 3,228,134 52,781 1.36
B2 - Low-Income Hard-to-Measure 118,723 63,605 - - - 182,328 - 182,328 - B2a - Low-Income Statewide Marketing - 61,523 - - - 61,523 - 61,523 - B2b - Low-Income Statewide Database 7,690 - - - - 7,690 - 7,690 - B2c - Low-Income DOER Assessment 36,825 - - - - 36,825 - 36,825 - B2d - Low-Income Energy Affordability Network 71,123 - - - - 71,123 - 71,123 - B2e - Low-Income Sponsorships & Subscriptions 3,085 2,081 - - - 5,166 - 5,166 -
C - Commercial & Industrial 348,985 217,433 5,362,838 1,390,023 272,811 7,592,090 374,901 7,966,992 2,710 3.17 C1 - C&I New Construction 86,147 44,493 1,728,557 383,570 85,654 2,328,421 72,887 2,401,308 4,762 2.93
C1a - C&I New Buildings & Major Renovations 27,582 14,245 485,051 191,191 27,424 745,493 24,671 770,164 3,843 3.00 C1b - C&I Initial Purchase & End of Useful Life 58,565 30,248 1,243,506 192,378 58,230 1,582,928 48,216 1,631,144 5,366 2.90
C2 - C&I Retrofit 188,236 97,220 3,634,281 980,827 187,158 5,087,722 302,015 5,389,736 2,201 3.39 C2a - C&I Existing Building Retrofit 133,563 68,982 2,566,178 708,463 132,797 3,609,982 259,111 3,869,094 9,945 3.88 C2b - C&I Small Business 26,158 13,510 497,633 143,698 26,008 707,007 30,440 737,446 796 3.20 C2c - C&I Multifamily Retrofit 28,516 14,728 570,470 128,667 28,352 770,733 12,464 783,196 726 1.27 C2d - C&I Upstream Lighting - - - - - - - -
C3 - C&I Hard-to-Measure 74,601 75,720 - 25,626 - 175,948 - 175,948 - C3a - C&I Statewide Marketing - 73,243 - - - 73,243 - 73,243 - C3b - C&I Statewide Database 9,155 - - - - 9,155 - 9,155 - C3c - C&I DOER Assessment 43,840 - - - - 43,840 - 43,840 - C3d - C&I EEAC Consultants 17,933 - - - - 17,933 - 17,933 - C3e - C&I Sponsorships & Subscriptions 3,672 2,478 - - - 6,150 - 6,150 - C3f - C&I Workforce Development - - - 13,626 - 13,626 - 13,626 - C3g - C&I R&D and Demonstration - - - 12,000 - 12,000 - 12,000 -
Grand Total 1,488,243 998,418 24,088,172 7,350,215 1,328,900 35,253,948 1,260,089 36,514,037 1,850 2.27
2016 Planned Program Administrator Budget
ProgramProgram Costs
Performance Incentive
Total Program Administrator Budget
Program Cost per Participant
Resource Benefit per Program Cost
Bay State Gas Company d/b/a Columbia Gas of Massachusetts 2016 Energy Efficiency Plan-Year Report D.P.U. 17-100 May 1, 2017 Page 7 of 37

Program Administrator Budgets, Plan Year Summary2016 Planned vs. EvaluatedCMAMay 1, 2017
Program Planning and Administration
Marketing and Advertising
Participant Incentive
Sales, Technical Assistance & Training
Evaluation and Market Research
Total Program Costs
A - Residential 695,026 450,537 20,279,848 5,400,812 328,900 27,155,124 777,183 27,932,307 1,922 1.93 A1 - Residential Whole House 414,059 205,297 16,502,054 5,172,398 263,625 22,557,433 657,593 23,215,026 2,728 1.86
A1a - Residential New Construction 20,751 10,732 1,873,548 157,119 56,056 2,118,207 71,825 2,190,032 2,675 1.68 A1b - Residential Multi-Family Retrofit 42,793 19,259 1,602,751 155,225 22,966 1,842,994 34,579 1,877,574 1,131 1.12 A1c - Residential Home Energy Services - Measures 266,622 137,377 13,025,754 1,087,629 147,496 14,664,878 551,188 15,216,067 2,508 2.48 A1d - Residential Home Energy Services - RCS 83,893 37,929 - 3,772,425 37,107 3,931,354 - 3,931,354 - A1e - Residential Behavior/Feedback Program - - - - - - - -
A2 - Residential Products 114,534 79,399 3,711,984 205,918 65,265 4,177,099 119,591 4,296,690 713 2.50 A2a - Residential Heating & Cooling Equipment 114,534 79,399 3,711,984 205,918 65,265 4,177,099 119,591 4,296,690 713 2.50 A2b - Residential Consumer Products - - - - - - - - A2c - Residential Lighting - - - - - - - -
A3 - Residential Hard-to-Measure 166,434 165,841 65,811 22,496 10 420,591 - 420,591 - A3a - Residential Statewide Marketing (139) 162,605 - - - 162,466 - 162,466 - A3b - Residential Statewide Database 2,625 - - - - 2,625 - 2,625 - A3c - Residential DOER Assessment 107,134 - - - - 107,134 - 107,134 - A3d - Residential EEAC Consultants 54,381 - - - - 54,381 - 54,381 - A3e - Residential Sponsorships & Subscriptions - - - - - - - - A3f - Residential HEAT Loan 2,470 3,237 65,811 5,432 10 76,959 - 76,959 - A3g - Residential Workforce Development (25) - - 7,064 - 7,039 - 7,039 - A3h - Residential R&D and Demonstration (4) - - - - (4) - (4) - A3i - Residential Education (9) - - 10,000 - 9,991 - 9,991 -
B - Low-Income 246,834 147,728 5,212,963 1,140,837 103,755 6,852,117 174,823 7,026,940 2,833 1.12 B1 - Low-Income Whole House 179,967 85,503 5,212,963 1,140,837 103,755 6,723,025 174,823 6,897,849 2,779 1.14
B1a - Low-Income Single Family Retrofit 97,279 46,797 2,561,312 727,749 58,465 3,491,602 125,312 3,616,914 5,668 1.12 B1b - Low-Income Multi-Family Retrofit 82,689 38,706 2,651,651 413,088 45,290 3,231,424 49,511 3,280,935 1,792 1.15
B2 - Low-Income Hard-to-Measure 66,867 62,225 - - - 129,092 - 129,092 - B2a - Low-Income Statewide Marketing (25) 62,225 - - - 62,200 - 62,200 - B2b - Low-Income Statewide Database 1,050 - - - - 1,050 - 1,050 - B2c - Low-Income DOER Assessment 40,975 - - - - 40,975 - 40,975 - B2d - Low-Income Energy Affordability Network 24,867 - - - - 24,867 - 24,867 - B2e - Low-Income Sponsorships & Subscriptions - - - - - - - -
C - Commercial & Industrial 322,108 363,832 3,140,219 1,282,682 234,734 5,343,575 277,582 5,621,157 6,392 3.49 C1 - C&I New Construction 78,169 111,514 1,419,111 433,208 73,715 2,115,716 52,993 2,168,709 6,045 2.07
C1a - C&I New Buildings & Major Renovations 25,806 33,581 104,659 110,713 23,607 298,366 5,580 303,946 15,703 1.43 C1b - C&I Initial Purchase & End of Useful Life 52,362 77,933 1,314,452 322,495 50,108 1,817,350 47,413 1,864,763 5,490 2.18
C2 - C&I Retrofit 173,105 178,256 1,721,109 849,474 161,018 3,082,962 224,590 3,307,552 6,344 4.63 C2a - C&I Existing Building Retrofit 122,005 159,342 1,184,295 631,577 114,265 2,211,485 169,333 2,380,817 11,399 4.62 C2b - C&I Small Business 24,387 9,049 404,615 130,155 22,381 590,587 53,457 644,044 2,148 6.43 C2c - C&I Multifamily Retrofit 26,713 9,865 132,198 87,743 24,372 280,891 1,800 282,691 16,523 0.93 C2d - C&I Upstream Lighting - - - - - - - -
C3 - C&I Hard-to-Measure 70,834 74,062 - - - 144,896 - 144,896 - C3a - C&I Statewide Marketing (88) 74,062 - - - 73,974 - 73,974 - C3b - C&I Statewide Database 3,931 - - - - 3,931 - 3,931 - C3c - C&I DOER Assessment 48,780 - - - - 48,780 - 48,780 - C3d - C&I EEAC Consultants 18,234 - - - - 18,234 - 18,234 - C3e - C&I Sponsorships & Subscriptions - - - - - - - - C3f - C&I Workforce Development (23) - - - - (23) - (23) - C3g - C&I R&D and Demonstration - - - - - - - -
Grand Total 1,263,968 962,098 28,633,031 7,824,331 667,388 39,350,815 1,229,589 40,580,404 2,264 2.00
2016 Evaluated Program Administrator Budget
ProgramProgram Costs
Performance Incentive
Total Program Administrator Budget
Program Cost per Participant
Resource Benefit per Program Cost
Bay State Gas Company d/b/a Columbia Gas of Massachusetts 2016 Energy Efficiency Plan-Year Report D.P.U. 17-100 May 1, 2017 Page 8 of 37

Program Administrator Budgets, Plan Year Summary2016 Planned vs. EvaluatedCMAMay 1, 2017
Program Planning and Administration
Marketing and Advertising
Participant Incentive
Sales, Technical Assistance & Training
Evaluation and Market Research
Total Program Costs
A - Residential -14% -22% 50% 13% -58% 33% 0% 31% 47% -18%A1 - Residential Whole House -15% -34% 73% 17% -56% 47% -2% 45% 41% -25%
A1a - Residential New Construction -16% -35% 216% 8% 76% 161% 2% 148% 43% -63%A1b - Residential Multi-Family Retrofit -13% -41% 20% 23% -64% 15% 17% 15% -27% 7%A1c - Residential Home Energy Services - Measures -16% -35% 71% -39% -64% 42% -4% 40% 57% -22%A1d - Residential Home Energy Services - RCS -16% -28% 60% -64% 50% 50%A1e - Residential Behavior/Feedback Program
A2 - Residential Products -18% -15% -5% -14% -64% -9% 14% -8% 21% 15%A2a - Residential Heating & Cooling Equipment -18% -15% -5% -14% -64% -9% 14% -8% 21% 15%A2b - Residential Consumer ProductsA2c - Residential Lighting
A3 - Residential Hard-to-Measure -9% -2% -35% -81% -26% -26%A3a - Residential Statewide Marketing 1% 1% 1%A3b - Residential Statewide Database -87% -87% -87%A3c - Residential DOER Assessment 11% 11% 11%A3d - Residential EEAC Consultants 0% 0% 0%A3e - Residential Sponsorships & Subscriptions -100% -100% -100% -100%A3f - Residential HEAT Loan -34% 30% -35% -40% -34% -34%A3g - Residential Workforce Development -85% -85% -85%A3h - Residential R&D and Demonstration -100% -100% -100%A3i - Residential Education -80% -80% -80%
B - Low-Income -25% -28% 1% -4% -62% -4% 61% -4% -76% 2%B1 - Low-Income Whole House -14% -40% 1% -4% -62% -4% 61% -3% -76% 1%
B1a - Low-Income Single Family Retrofit -15% -40% -7% 2% -61% -9% 163% -7% -19% 20%B1b - Low-Income Multi-Family Retrofit -12% -40% 10% -12% -64% 2% -19% 2% -97% -15%
B2 - Low-Income Hard-to-Measure -44% -2% -29% -29%B2a - Low-Income Statewide Marketing 1% 1% 1%B2b - Low-Income Statewide Database -86% -86% -86%B2c - Low-Income DOER Assessment 11% 11% 11%B2d - Low-Income Energy Affordability Network -65% -65% -65%B2e - Low-Income Sponsorships & Subscriptions -100% -100% -100% -100%
C - Commercial & Industrial -8% 67% -41% -8% -14% -30% -26% -29% 136% 10%C1 - C&I New Construction -9% 151% -18% 13% -14% -9% -27% -10% 27% -29%
C1a - C&I New Buildings & Major Renovations -6% 136% -78% -42% -14% -60% -77% -61% 309% -52%C1b - C&I Initial Purchase & End of Useful Life -11% 158% 6% 68% -14% 15% -2% 14% 2% -25%
C2 - C&I Retrofit -8% 83% -53% -13% -14% -39% -26% -39% 188% 37%C2a - C&I Existing Building Retrofit -9% 131% -54% -11% -14% -39% -35% -38% 15% 19%C2b - C&I Small Business -7% -33% -19% -9% -14% -16% 76% -13% 170% 101%C2c - C&I Multifamily Retrofit -6% -33% -77% -32% -14% -64% -86% -64% 2175% -27%C2d - C&I Upstream Lighting
C3 - C&I Hard-to-Measure -5% -2% -100% -18% -18%C3a - C&I Statewide Marketing 1% 1% 1%C3b - C&I Statewide Database -57% -57% -57%C3c - C&I DOER Assessment 11% 11% 11%C3d - C&I EEAC Consultants 2% 2% 2%C3e - C&I Sponsorships & Subscriptions -100% -100% -100% -100%C3f - C&I Workforce Development -100% -100% -100%C3g - C&I R&D and Demonstration -100% -100% -100%
Grand Total -15% -4% 19% 6% -50% 12% -2% 11% 22% -12%
Notes• Where not otherwise indicated, budgets for each year are represented in nominal dollars (2016$, 2017$, 2018$).• Refer to common definitions for allocation of costs.• EEAC Consultant fees on the electric side do not get paid out of the Program Administrators' budgets, but are instead paid by the DOER out of the RGGI proceeds. • The budgets in the above tables do not include costs associated with the Program Administrator's demand response activities.• The plan year variances provided above are intended to indicate the Program Administrator's performance in the plan year only. The variances used to determine significant variances are provided separately. The variances above and the significant variances use different calculations to determine variances on an annual basis and over the three-year term, respectively.
2016 Planned v. Evaluated Program Administrator Budget Variances (%)
ProgramProgram Costs
Performance Incentive
Total Program Administrator Budget
Program Cost per Participant
Resource Benefit per Program Cost
Bay State Gas Company d/b/a Columbia Gas of Massachusetts 2016 Energy Efficiency Plan-Year Report D.P.U. 17-100 May 1, 2017 Page 9 of 37

Program Administrator Budgets, Three-Year Total2016-2018 Program Administrator BudgetCMAMay 1, 2017
Program Planning and Administration
Marketing and Advertising
Participant Incentive
Sales, Technical Assistance & Training
Evaluation and Market Research
Total Program Costs
A - Residential 695,026 450,537 20,279,848 5,400,812 328,900 27,155,124 777,183 27,932,307 1,922 1.93 A1 - Residential Whole House 414,059 205,297 16,502,054 5,172,398 263,625 22,557,433 657,593 23,215,026 2,728 1.86
A1a - Residential New Construction 20,751 10,732 1,873,548 157,119 56,056 2,118,207 71,825 2,190,032 2,675 1.68 A1b - Residential Multi-Family Retrofit 42,793 19,259 1,602,751 155,225 22,966 1,842,994 34,579 1,877,574 1,131 1.12 A1c - Residential Home Energy Services - Measures 266,622 137,377 13,025,754 1,087,629 147,496 14,664,878 551,188 15,216,067 2,508 2.48 A1d - Residential Home Energy Services - RCS 83,893 37,929 - 3,772,425 37,107 3,931,354 - 3,931,354 - A1e - Residential Behavior/Feedback Program - - - - - - - -
A2 - Residential Products 114,534 79,399 3,711,984 205,918 65,265 4,177,099 119,591 4,296,690 713 2.50 A2a - Residential Heating & Cooling Equipment 114,534 79,399 3,711,984 205,918 65,265 4,177,099 119,591 4,296,690 713 2.50 A2b - Residential Consumer Products - - - - - - - - A2c - Residential Lighting - - - - - - - -
A3 - Residential Hard-to-Measure 166,434 165,841 65,811 22,496 10 420,591 - 420,591 - A3a - Residential Statewide Marketing (139) 162,605 - - - 162,466 - 162,466 - A3b - Residential Statewide Database 2,625 - - - - 2,625 - 2,625 - A3c - Residential DOER Assessment 107,134 - - - - 107,134 - 107,134 - A3d - Residential EEAC Consultants 54,381 - - - - 54,381 - 54,381 - A3e - Residential Sponsorships & Subscriptions - - - - - - - - A3f - Residential HEAT Loan 2,470 3,237 65,811 5,432 10 76,959 - 76,959 - A3g - Residential Workforce Development (25) - - 7,064 - 7,039 - 7,039 - A3h - Residential R&D and Demonstration (4) - - - - (4) - (4) - A3i - Residential Education (9) - - 10,000 - 9,991 - 9,991 -
B - Low-Income 246,834 147,728 5,212,963 1,140,837 103,755 6,852,117 174,823 7,026,940 2,833 1.12 B1 - Low-Income Whole House 179,967 85,503 5,212,963 1,140,837 103,755 6,723,025 174,823 6,897,849 2,779 1.14
B1a - Low-Income Single Family Retrofit 97,279 46,797 2,561,312 727,749 58,465 3,491,602 125,312 3,616,914 5,668 1.12 B1b - Low-Income Multi-Family Retrofit 82,689 38,706 2,651,651 413,088 45,290 3,231,424 49,511 3,280,935 1,792 1.15
B2 - Low-Income Hard-to-Measure 66,867 62,225 - - - 129,092 - 129,092 - B2a - Low-Income Statewide Marketing (25) 62,225 - - - 62,200 - 62,200 - B2b - Low-Income Statewide Database 1,050 - - - - 1,050 - 1,050 - B2c - Low-Income DOER Assessment 40,975 - - - - 40,975 - 40,975 - B2d - Low-Income Energy Affordability Network 24,867 - - - - 24,867 - 24,867 - B2e - Low-Income Sponsorships & Subscriptions - - - - - - - -
C - Commercial & Industrial 322,108 363,832 3,140,219 1,282,682 234,734 5,343,575 277,582 5,621,157 6,392 3.49 C1 - C&I New Construction 78,169 111,514 1,419,111 433,208 73,715 2,115,716 52,993 2,168,709 6,045 2.07
C1a - C&I New Buildings & Major Renovations 25,806 33,581 104,659 110,713 23,607 298,366 5,580 303,946 15,703 1.43 C1b - C&I Initial Purchase & End of Useful Life 52,362 77,933 1,314,452 322,495 50,108 1,817,350 47,413 1,864,763 5,490 2.18
C2 - C&I Retrofit 173,105 178,256 1,721,109 849,474 161,018 3,082,962 224,590 3,307,552 6,344 4.63 C2a - C&I Existing Building Retrofit 122,005 159,342 1,184,295 631,577 114,265 2,211,485 169,333 2,380,817 11,399 4.62 C2b - C&I Small Business 24,387 9,049 404,615 130,155 22,381 590,587 53,457 644,044 2,148 6.43 C2c - C&I Multifamily Retrofit 26,713 9,865 132,198 87,743 24,372 280,891 1,800 282,691 16,523 0.93 C2d - C&I Upstream Lighting - - - - - - - -
C3 - C&I Hard-to-Measure 70,834 74,062 - - - 144,896 - 144,896 - C3a - C&I Statewide Marketing (88) 74,062 - - - 73,974 - 73,974 - C3b - C&I Statewide Database 3,931 - - - - 3,931 - 3,931 - C3c - C&I DOER Assessment 48,780 - - - - 48,780 - 48,780 - C3d - C&I EEAC Consultants 18,234 - - - - 18,234 - 18,234 - C3e - C&I Sponsorships & Subscriptions - - - - - - - - C3f - C&I Workforce Development (23) - - - - (23) - (23) - C3g - C&I R&D and Demonstration - - - - - - - -
Grand Total 1,263,968 962,098 28,633,031 7,824,331 667,388 39,350,815 1,229,589 40,580,404 2,264 2.00
2016 Evaluated Program Administrator Budget
ProgramProgram Costs
Performance Incentive
Total Program Administrator Budget
Program Cost per Participant
Resource Benefit per Program Cost
Bay State Gas Company d/b/a Columbia Gas of Massachusetts 2016 Energy Efficiency Plan-Year Report D.P.U. 17-100 May 1, 2017 Page 10 of 37

Program Administrator Budgets, Three-Year Total2016-2018 Program Administrator BudgetCMAMay 1, 2017
Program Planning and Administration
Marketing and Advertising
Participant Incentive
Sales, Technical Assistance & Training
Evaluation and Market Research
Total Program Costs
A - Residential 838,750 582,338 13,733,971 4,903,439 786,050 20,844,547 799,663 21,644,211 1,334 2.31 A1 - Residential Whole House 506,771 319,527 9,714,946 4,542,339 608,712 15,692,295 690,669 16,382,964 1,985 2.45
A1a - Residential New Construction 27,393 18,044 654,388 150,740 34,375 884,940 79,029 963,970 1,844 4.47 A1b - Residential Multi-Family Retrofit 47,814 31,496 1,281,409 123,922 60,000 1,544,640 28,015 1,572,655 1,575 1.01 A1c - Residential Home Energy Services - Measures 327,681 215,847 7,779,149 1,851,943 411,197 10,585,818 583,625 11,169,443 1,642 3.11 A1d - Residential Home Energy Services - RCS 103,883 54,140 - 2,415,735 103,139 2,676,897 - 2,676,897 - A1e - Residential Behavior/Feedback Program - - - - - - - -
A2 - Residential Products 141,320 93,089 3,914,475 239,161 177,339 4,565,385 108,994 4,674,379 591 2.15 A2a - Residential Heating & Cooling Equipment 141,320 93,089 3,914,475 239,161 177,339 4,565,385 108,994 4,674,379 591 2.15 A2b - Residential Consumer Products - - - - - - - - A2c - Residential Lighting - - - - - - - -
A3 - Residential Hard-to-Measure 190,660 169,721 104,549 121,938 - 586,868 - 586,868 - A3a - Residential Statewide Marketing - 160,649 - - - 160,649 - 160,649 - A3b - Residential Statewide Database 20,081 - - - - 20,081 - 20,081 - A3c - Residential DOER Assessment 100,965 - - - - 100,965 - 100,965 - A3d - Residential EEAC Consultants 57,140 - - - - 57,140 - 57,140 - A3e - Residential Sponsorships & Subscriptions 8,600 6,521 - - - 15,121 - 15,121 - A3f - Residential HEAT Loan 3,873 2,551 104,549 9,277 - 120,250 - 120,250 - A3g - Residential Workforce Development - - - 48,302 - 48,302 - 48,302 - A3h - Residential R&D and Demonstration - - - 14,359 - 14,359 - 14,359 - A3i - Residential Education - - - 50,000 - 50,000 - 50,000 -
B - Low-Income 334,615 208,295 5,235,661 1,197,684 274,670 7,250,925 109,976 7,360,901 11,946 1.06 B1 - Low-Income Whole House 213,112 144,181 5,235,661 1,197,684 274,670 7,065,308 109,976 7,175,284 11,640 1.09
B1a - Low-Income Single Family Retrofit 115,933 78,435 2,768,885 730,861 149,421 3,843,534 49,874 3,893,408 7,014 0.92 B1b - Low-Income Multi-Family Retrofit 97,179 65,746 2,466,776 466,824 125,249 3,221,774 60,102 3,281,876 54,606 1.29
B2 - Low-Income Hard-to-Measure 121,503 64,114 - - - 185,617 - 185,617 - B2a - Low-Income Statewide Marketing - 61,613 - - - 61,613 - 61,613 - B2b - Low-Income Statewide Database 7,702 - - - - 7,702 - 7,702 - B2c - Low-Income DOER Assessment 38,723 - - - - 38,723 - 38,723 - B2d - Low-Income Energy Affordability Network 71,790 - - - - 71,790 - 71,790 - B2e - Low-Income Sponsorships & Subscriptions 3,289 2,501 - - - 5,790 - 5,790 -
C - Commercial & Industrial 360,945 220,258 5,430,503 1,421,579 274,161 7,707,446 377,135 8,084,581 2,682 3.07 C1 - C&I New Construction 91,251 46,422 1,806,239 395,759 88,436 2,428,107 80,556 2,508,663 3,948 3.00
C1a - C&I New Buildings & Major Renovations 30,214 15,371 530,211 198,880 29,282 803,957 31,599 835,556 2,871 3.32 C1b - C&I Initial Purchase & End of Useful Life 61,037 31,052 1,276,027 196,879 59,154 1,624,150 48,956 1,673,106 4,848 2.84
C2 - C&I Retrofit 191,637 97,492 3,624,264 1,000,170 185,725 5,099,288 296,579 5,395,867 2,257 3.22 C2a - C&I Existing Building Retrofit 136,337 69,359 2,559,602 730,390 132,132 3,627,821 254,962 3,882,782 10,077 3.68 C2b - C&I Small Business 26,448 13,455 495,770 142,461 25,632 703,767 29,429 733,196 814 3.04 C2c - C&I Multifamily Retrofit 28,851 14,677 568,892 127,319 27,961 767,700 12,189 779,889 742 1.22 C2d - C&I Upstream Lighting - - - - - - - -
C3 - C&I Hard-to-Measure 78,057 76,344 - 25,649 - 180,051 - 180,051 - C3a - C&I Statewide Marketing - 73,366 - - - 73,366 - 73,366 - C3b - C&I Statewide Database 9,171 - - - - 9,171 - 9,171 - C3c - C&I DOER Assessment 46,110 - - - - 46,110 - 46,110 - C3d - C&I EEAC Consultants 18,861 - - - - 18,861 - 18,861 - C3e - C&I Sponsorships & Subscriptions 3,916 2,978 - - - 6,894 - 6,894 - C3f - C&I Workforce Development - - - 13,649 - 13,649 - 13,649 - C3g - C&I R&D and Demonstration - - - 12,000 - 12,000 - 12,000 -
Grand Total 1,534,310 1,010,891 24,400,134 7,522,702 1,334,882 35,802,918 1,286,774 37,089,693 1,873 2.22
2017 Planned Program Administrator Budget
ProgramProgram Costs
Performance Incentive
Total Program Administrator Budget
Program Cost per Participant
Resource Benefit per Program Cost
Bay State Gas Company d/b/a Columbia Gas of Massachusetts 2016 Energy Efficiency Plan-Year Report D.P.U. 17-100 May 1, 2017 Page 11 of 37

Program Administrator Budgets, Three-Year Total2016-2018 Program Administrator BudgetCMAMay 1, 2017
Program Planning and Administration
Marketing and Advertising
Participant Incentive
Sales, Technical Assistance & Training
Evaluation and Market Research
Total Program Costs
A - Residential 875,079 588,209 13,852,242 5,017,917 787,726 21,121,172 841,614 21,962,787 1,347 2.32 A1 - Residential Whole House 530,194 324,486 9,833,217 4,651,499 612,033 15,951,430 727,252 16,678,682 2,005 2.46
A1a - Residential New Construction 31,413 20,088 738,355 158,368 37,890 986,115 98,190 1,084,305 1,840 4.89 A1b - Residential Multi-Family Retrofit 49,750 31,815 1,293,972 126,198 60,007 1,561,742 28,794 1,590,535 1,592 0.99 A1c - Residential Home Energy Services - Measures 339,712 217,241 7,800,891 1,896,497 409,751 10,664,091 600,268 11,264,360 1,657 3.08 A1d - Residential Home Energy Services - RCS 109,319 55,343 - 2,470,436 104,385 2,739,482 - 2,739,482 - A1e - Residential Behavior/Feedback Program - - - - - - - -
A2 - Residential Products 145,662 93,149 3,914,475 243,580 175,693 4,572,559 114,362 4,686,921 592 2.14 A2a - Residential Heating & Cooling Equipment 145,662 93,149 3,914,475 243,580 175,693 4,572,559 114,362 4,686,921 592 2.14 A2b - Residential Consumer Products - - - - - - - - A2c - Residential Lighting - - - - - - - -
A3 - Residential Hard-to-Measure 199,222 170,574 104,549 122,838 - 597,184 - 597,184 - A3a - Residential Statewide Marketing - 160,422 - - - 160,422 - 160,422 - A3b - Residential Statewide Database 20,053 - - - - 20,053 - 20,053 - A3c - Residential DOER Assessment 105,864 - - - - 105,864 - 105,864 - A3d - Residential EEAC Consultants 60,068 - - - - 60,068 - 60,068 - A3e - Residential Sponsorships & Subscriptions 9,243 7,597 - - - 16,840 - 16,840 - A3f - Residential HEAT Loan 3,995 2,555 104,549 9,487 - 120,586 - 120,586 - A3g - Residential Workforce Development - - - 48,351 - 48,351 - 48,351 - A3h - Residential R&D and Demonstration - - - 15,000 - 15,000 - 15,000 - A3i - Residential Education - - - 50,000 - 50,000 - 50,000 -
B - Low-Income 349,791 212,589 5,365,571 1,220,807 278,299 7,427,057 112,654 7,539,711 12,236 1.04 B1 - Low-Income Whole House 223,978 147,548 5,365,571 1,220,807 278,299 7,236,203 112,654 7,348,856 11,921 1.06
B1a - Low-Income Single Family Retrofit 121,642 80,133 2,827,639 749,428 151,144 3,929,987 51,396 3,981,383 7,172 0.90 B1b - Low-Income Multi-Family Retrofit 102,335 67,414 2,537,933 471,379 127,155 3,306,216 61,258 3,367,474 56,038 1.26
B2 - Low-Income Hard-to-Measure 125,813 65,042 - - - 190,854 - 190,854 - B2a - Low-Income Statewide Marketing - 62,101 - - - 62,101 - 62,101 - B2b - Low-Income Statewide Database 7,763 - - - - 7,763 - 7,763 - B2c - Low-Income DOER Assessment 40,981 - - - - 40,981 - 40,981 - B2d - Low-Income Energy Affordability Network 73,534 - - - - 73,534 - 73,534 - B2e - Low-Income Sponsorships & Subscriptions 3,535 2,941 - - - 6,476 - 6,476 -
C - Commercial & Industrial 377,488 222,438 5,512,309 1,429,870 275,137 7,817,243 385,388 8,202,631 2,657 3.02 C1 - C&I New Construction 97,686 48,114 1,875,666 405,676 90,750 2,517,892 86,877 2,604,769 3,623 3.02
C1a - C&I New Buildings & Major Renovations 32,298 15,908 550,368 203,919 30,005 832,498 36,018 868,517 2,685 3.47 C1b - C&I Initial Purchase & End of Useful Life 65,388 32,206 1,325,298 201,757 60,745 1,685,394 50,859 1,736,252 4,378 2.80
C2 - C&I Retrofit 198,479 97,758 3,636,643 998,593 184,387 5,115,860 298,511 5,414,371 2,277 3.13 C2a - C&I Existing Building Retrofit 141,209 69,550 2,569,418 728,355 131,183 3,639,716 256,578 3,896,295 10,195 3.57 C2b - C&I Small Business 27,518 13,553 499,410 143,228 25,564 709,273 29,533 738,806 824 2.95 C2c - C&I Multifamily Retrofit 29,752 14,654 567,815 127,010 27,640 766,871 12,400 779,271 745 1.20 C2d - C&I Upstream Lighting - - - - - - - -
C3 - C&I Hard-to-Measure 81,323 76,567 - 25,601 - 183,491 - 183,491 - C3a - C&I Statewide Marketing - 73,105 - - - 73,105 - 73,105 - C3b - C&I Statewide Database 9,138 - - - - 9,138 - 9,138 - C3c - C&I DOER Assessment 48,243 - - - - 48,243 - 48,243 - C3d - C&I EEAC Consultants 19,734 - - - - 19,734 - 19,734 - C3e - C&I Sponsorships & Subscriptions 4,208 3,462 - - - 7,670 - 7,670 - C3f - C&I Workforce Development - - - 13,601 - 13,601 - 13,601 - C3g - C&I R&D and Demonstration - - - 12,000 - 12,000 - 12,000 -
Grand Total 1,602,357 1,023,236 24,730,122 7,668,594 1,341,162 36,365,472 1,339,655 37,705,128 1,891 2.21
2018 Planned Program Administrator Budget
ProgramProgram Costs
Performance Incentive
Total Program Administrator Budget
Program Cost per Participant
Resource Benefit per Program Cost
Bay State Gas Company d/b/a Columbia Gas of Massachusetts 2016 Energy Efficiency Plan-Year Report D.P.U. 17-100 May 1, 2017 Page 12 of 37

Program Administrator Budgets, Three-Year Total2016-2018 Program Administrator BudgetCMAMay 1, 2017
Program Planning and Administration
Marketing and Advertising
Participant Incentive
Sales, Technical Assistance & Training
Evaluation and Market Research
Total Program Costs
A - Residential 2,408,855 1,621,084 47,866,061 15,322,167 1,902,676 69,120,843 2,418,461 71,539,304 1,521 2.17 A1 - Residential Whole House 1,451,024 849,311 36,050,218 14,366,236 1,484,370 54,201,158 2,075,514 56,276,672 2,246 2.21
A1a - Residential New Construction 79,558 48,865 3,266,292 466,227 128,320 3,989,262 249,044 4,238,306 2,206 3.09 A1b - Residential Multi-Family Retrofit 140,357 82,569 4,178,131 405,345 142,974 4,949,376 91,388 5,040,764 1,378 1.04 A1c - Residential Home Energy Services - Measures 934,015 570,465 28,605,794 4,836,069 968,444 35,914,788 1,735,081 37,649,869 1,917 2.85 A1d - Residential Home Energy Services - RCS 297,094 147,412 - 8,658,595 244,632 9,347,733 - 9,347,733 - A1e - Residential Behavior/Feedback Program - - - - - - - -
A2 - Residential Products 401,516 265,636 11,540,934 688,659 418,297 13,315,042 342,947 13,657,990 625 2.26 A2a - Residential Heating & Cooling Equipment 401,516 265,636 11,540,934 688,659 418,297 13,315,042 342,947 13,657,990 625 2.26 A2b - Residential Consumer Products - - - - - - - - A2c - Residential Lighting - - - - - - - -
A3 - Residential Hard-to-Measure 556,315 506,136 274,909 267,272 10 1,604,643 - 1,604,643 - A3a - Residential Statewide Marketing (139) 483,676 - - - 483,537 - 483,537 - A3b - Residential Statewide Database 42,759 - - - - 42,759 - 42,759 - A3c - Residential DOER Assessment 313,963 - - - - 313,963 - 313,963 - A3d - Residential EEAC Consultants 171,588 - - - - 171,588 - 171,588 - A3e - Residential Sponsorships & Subscriptions 17,843 14,118 - - - 31,961 - 31,961 - A3f - Residential HEAT Loan 10,337 8,342 274,909 24,196 10 317,795 - 317,795 - A3g - Residential Workforce Development (25) - - 103,717 - 103,692 - 103,692 - A3h - Residential R&D and Demonstration (4) - - 29,359 - 29,355 - 29,355 - A3i - Residential Education (9) - - 110,000 - 109,991 - 109,991 -
B - Low-Income 931,240 568,612 15,814,195 3,559,328 656,724 21,530,099 397,453 21,927,552 5,926 1.07 B1 - Low-Income Whole House 617,057 377,232 15,814,195 3,559,328 656,724 21,024,536 397,453 21,421,989 5,787 1.10
B1a - Low-Income Single Family Retrofit 334,854 205,365 8,157,836 2,208,038 359,030 11,265,123 226,582 11,491,705 6,580 0.98 B1b - Low-Income Multi-Family Retrofit 282,203 171,867 7,656,359 1,351,290 297,694 9,759,413 170,871 9,930,284 5,080 1.24
B2 - Low-Income Hard-to-Measure 314,183 191,380 - - - 505,563 - 505,563 - B2a - Low-Income Statewide Marketing (25) 185,938 - - - 185,914 - 185,914 - B2b - Low-Income Statewide Database 16,514 - - - - 16,514 - 16,514 - B2c - Low-Income DOER Assessment 120,678 - - - - 120,678 - 120,678 - B2d - Low-Income Energy Affordability Network 170,191 - - - - 170,191 - 170,191 - B2e - Low-Income Sponsorships & Subscriptions 6,824 5,442 - - - 12,266 - 12,266 -
C - Commercial & Industrial 1,060,541 806,529 14,083,031 4,134,131 784,032 20,868,264 1,040,105 21,908,368 3,137 3.16 C1 - C&I New Construction 267,106 206,050 5,101,015 1,234,643 252,902 7,061,716 220,425 7,282,141 4,254 2.73
C1a - C&I New Buildings & Major Renovations 88,318 64,859 1,185,238 513,512 82,894 1,934,822 73,198 2,008,019 3,177 3.09 C1b - C&I Initial Purchase & End of Useful Life 178,788 141,190 3,915,777 721,131 170,008 5,126,894 147,228 5,274,122 4,878 2.59
C2 - C&I Retrofit 563,221 373,506 8,982,016 2,848,238 531,130 13,298,110 819,679 14,117,790 2,664 3.51 C2a - C&I Existing Building Retrofit 399,552 298,252 6,313,315 2,090,322 377,580 9,479,021 680,872 10,159,894 10,405 3.86 C2b - C&I Small Business 78,353 36,057 1,399,796 415,844 73,577 2,003,627 112,419 2,116,046 1,001 4.01 C2c - C&I Multifamily Retrofit 85,316 39,196 1,268,905 342,072 79,973 1,815,462 26,388 1,841,850 873 1.17 C2d - C&I Upstream Lighting - - - - - - - -
C3 - C&I Hard-to-Measure 230,214 226,974 - 51,250 - 508,438 - 508,438 - C3a - C&I Statewide Marketing (88) 220,534 - - - 220,445 - 220,445 - C3b - C&I Statewide Database 22,240 - - - - 22,240 - 22,240 - C3c - C&I DOER Assessment 143,132 - - - - 143,132 - 143,132 - C3d - C&I EEAC Consultants 56,829 - - - - 56,829 - 56,829 - C3e - C&I Sponsorships & Subscriptions 8,124 6,440 - - - 14,564 - 14,564 - C3f - C&I Workforce Development (23) - - 27,250 - 27,228 - 27,228 - C3g - C&I R&D and Demonstration - - - 24,000 - 24,000 - 24,000 -
Grand Total 4,400,636 2,996,225 77,763,287 23,015,626 3,343,432 111,519,206 3,856,019 115,375,224 2,001 2.14
Notes• Where not otherwise indicated, budgets for each year are represented in nominal dollars (2016$, 2017$, 2018$).• Refer to common definitions for allocation of costs.• EEAC Consultant fees on the electric side do not get paid out of the Program Administrators' budgets, but are instead paid by the DOER out of the RGGI proceeds. • The budgets in the above tables do not include costs associated with the Program Administrator's demand response activities.
2016-2018 Program Administrator Budget
ProgramProgram Costs
Performance Incentive
Total Program Administrator Budget
Program Cost per Participant
Resource Benefit per Program Cost
Bay State Gas Company d/b/a Columbia Gas of Massachusetts 2016 Energy Efficiency Plan-Year Report D.P.U. 17-100 May 1, 2017 Page 13 of 37

Program Savings, Plan Year Summary2016 Planned vs. EvaluatedCMAMay 1, 2017
Summer Winter Annual Lifetime Annual Lifetime Annual Lifetime Annual Lifetime Annual LifetimeA - Residential 15,645 1,308 500 1,760 39,334 1,908,612 37,781,956 7,488,868 52,422,079
A1 - Residential Whole House 7,922 988 498 1,598 36,867 1,396,643 28,764,612 7,488,868 52,422,079 A1a - Residential New Construction 435 4 10 120 2,997 153,976 3,548,020 - - A1b - Residential Multi-Family Retrofit 1,041 4 - 2 23 96,553 1,612,228 2,126,465 14,885,258 A1c - Residential Home Energy Services - Measures 6,446 980 488 1,476 33,848 1,146,114 23,604,364 5,362,403 37,536,821 A1d - Residential Home Energy Services - RCS - - - - - - - - - A1e - Residential Behavior/Feedback Program - - - - - - - - -
A2 - Residential Products 7,723 320 2 162 2,466 511,969 9,017,344 - - A2a - Residential Heating & Cooling Equipment 7,723 320 2 162 2,466 511,969 9,017,344 - - A2b - Residential Consumer Products - - - - - - - - - A2c - Residential Lighting - - - - - - - - -
B - Low-Income 608 113 51 143 2,819 356,228 7,381,851 251,340 1,759,380 B1 - Low-Income Whole House 608 113 51 143 2,819 356,228 7,381,851 251,340 1,759,380
B1a - Low-Income Single Family Retrofit 548 113 51 143 2,819 143,354 2,826,030 - - B1b - Low-Income Multi-Family Retrofit 60 - - - - 212,874 4,555,821 251,340 1,759,380
C - Commercial & Industrial 2,801 - 0 2 41 1,876,083 26,674,639 8,916,051 76,312,078 C1 - C&I New Construction 489 - 0 2 41 357,010 7,763,266 349,279 4,191,345
C1a - C&I New Buildings & Major Renovations 194 - 0 0 4 114,840 2,554,992 - - C1b - C&I Initial Purchase & End of Useful Life 295 - 0 2 37 242,170 5,208,274 349,279 4,191,345
C2 - C&I Retrofit 2,312 - - - - 1,519,073 18,911,373 8,566,772 72,120,733 C2a - C&I Existing Building Retrofit 363 - - - - 1,282,188 16,004,362 4,564 36,511 C2b - C&I Small Business 888 - - - - 170,784 1,809,690 7,935,005 67,693,799 C2c - C&I Multifamily Retrofit 1,061 - - - - 66,101 1,097,321 627,203 4,390,423 C2d - C&I Upstream Lighting - - - - - - - - -
Grand Total 19,054 1,421 551 1,905 42,194 4,140,924 71,838,445 16,656,259 130,493,536
Summer Winter Annual Lifetime Annual Lifetime Annual Lifetime Annual Lifetime Annual LifetimeA - Residential 14,128 1,262 477 1,558 35,247 2,214,865 42,956,609 - - - - 10,221,007 71,547,046
A1 - Residential Whole House 8,269 841 476 1,349 32,091 1,688,769 33,869,951 - - - - 10,213,183 71,492,278 A1a - Residential New Construction 792 8 43 110 2,000 159,795 3,565,415 - - - - - - A1b - Residential Multi-Family Retrofit 1,629 - - - - 126,192 2,057,373 - - - - 1,831,985 12,823,892 A1c - Residential Home Energy Services - Measures 5,848 833 433 1,239 30,091 1,402,782 28,247,163 - - - - 8,381,198 58,668,386 A1d - Residential Home Energy Services - RCS - - - - - - - - - - - - - A1e - Residential Behavior/Feedback Program - - - - - - - - - - - - -
A2 - Residential Products 5,859 421 1 208 3,157 526,096 9,086,658 - - - - 7,824 54,768 A2a - Residential Heating & Cooling Equipment 5,859 421 1 208 3,157 526,096 9,086,658 - - - - 7,824 54,768 A2b - Residential Consumer Products - - - - - - - - - - - - - A2c - Residential Lighting - - - - - - - - - - - - -
B - Low-Income 2,419 128 64 158 3,128 337,599 7,061,580 - - - - 12,744 89,208 B1 - Low-Income Whole House 2,419 128 64 158 3,128 337,599 7,061,580 - - - - 12,744 89,208
B1a - Low-Income Single Family Retrofit 616 128 64 158 3,128 155,495 3,070,656 - - - - - - B1b - Low-Income Multi-Family Retrofit 1,803 - - - - 182,104 3,990,924 - - - - 12,744 89,208
C - Commercial & Industrial 836 - 0 1 13 1,258,929 16,412,083 - - - - 42,923,792 432,447,433 C1 - C&I New Construction 350 - 0 1 13 286,155 5,245,904 - - - - 555,104 6,661,244
C1a - C&I New Buildings & Major Renovations 19 - - - - 36,813 579,957 - - - - 230,773 2,769,281 C1b - C&I Initial Purchase & End of Useful Life 331 - 0 1 13 249,342 4,665,947 - - - - 324,330 3,891,963
C2 - C&I Retrofit 486 - - - - 972,774 11,166,179 - - - - 42,368,689 425,786,189 C2a - C&I Existing Building Retrofit 194 - - - - 801,756 9,173,942 - - - - 20,068,729 200,319,871 C2b - C&I Small Business 275 - - - - 156,231 1,735,533 - - - - 21,939,652 221,863,244 C2c - C&I Multifamily Retrofit 17 - - - - 14,787 256,704 - - - - 360,307 3,603,074 C2d - C&I Upstream Lighting - - - - - - - - - - - - -
Grand Total 17,383 1,390 542 1,716 38,389 3,811,393 66,430,271 - - - - 53,157,543 504,083,687
Other SavingsPropane (MMBTU) Water (Gallons)
2016 Planned Net Savings
Other Savings
Program # of ParticipantsElectric Savings Natural Gas Savings
Annual Capacity (kW) Energy (MWh) (Therms) Oil (MMBTU)Deliverable Fuel Savings
Annual Capacity (kW) Energy (MWh) (Therms) Oil (MMBTU)
2016 Evaluated Net Savings
Propane (MMBTU) Water (Gallons)Program # of ParticipantsElectric Savings Natural Gas Savings Deliverable Fuel Savings
Bay State Gas Company d/b/a Columbia Gas of Massachusetts 2016 Energy Efficiency Plan-Year Report D.P.U. 17-100 May 1, 2017 Page 14 of 37

Program Savings, Plan Year Summary2016 Planned vs. EvaluatedCMAMay 1, 2017
Summer Winter Annual Lifetime Annual Lifetime Annual Lifetime Annual Lifetime Annual LifetimeA - Residential -10% -3% -4% -12% -10% 16% 14% 36% 36%
A1 - Residential Whole House 4% -15% -4% -16% -13% 21% 18% 36% 36%A1a - Residential New Construction 82% 92% 328% -8% -33% 4% 0%A1b - Residential Multi-Family Retrofit 56% -100% -100% -100% 31% 28% -14% -14%A1c - Residential Home Energy Services - Measures -9% -15% -11% -16% -11% 22% 20% 56% 56%A1d - Residential Home Energy Services - RCSA1e - Residential Behavior/Feedback Program
A2 - Residential Products -24% 32% -25% 28% 28% 3% 1%A2a - Residential Heating & Cooling Equipment -24% 32% -25% 28% 28% 3% 1%A2b - Residential Consumer ProductsA2c - Residential Lighting
B - Low-Income 298% 13% 26% 11% 11% -5% -4% -95% -95%B1 - Low-Income Whole House 298% 13% 26% 11% 11% -5% -4% -95% -95%
B1a - Low-Income Single Family Retrofit 12% 13% 26% 11% 11% 8% 9%B1b - Low-Income Multi-Family Retrofit 2905% -14% -12% -95% -95%
C - Commercial & Industrial -70% -56% -68% -68% -33% -38% 381% 467%C1 - C&I New Construction -28% -56% -68% -68% -20% -32% 59% 59%
C1a - C&I New Buildings & Major Renovations -90% -100% -100% -100% -68% -77%C1b - C&I Initial Purchase & End of Useful Life 12% -51% -65% -65% 3% -10% -7% -7%
C2 - C&I Retrofit -79% -36% -41% 395% 490%C2a - C&I Existing Building Retrofit -47% -37% -43% 439626% 548551%C2b - C&I Small Business -69% -9% -4% 176% 228%C2c - C&I Multifamily Retrofit -98% -78% -77% -43% -18%C2d - C&I Upstream Lighting
Grand Total -9% -2% -2% -10% -9% -8% -8% 219% 286%
Notes• The plan year variances provided above are intended to indicate the Program Administrator's performance in the plan year only. The variances used to determine significant variances are provided separately. The variances above and the significant variances use different calculations to determine variances on an annual basis and over the three-year term, respectively.
2016 Planned v. Evaluated Net Savings Variances (%)
Program # of ParticipantsElectric Savings Natural Gas Savings Deliverable Fuel Savings Other Savings
Annual Capacity (kW) Energy (MWh) (Therms) Oil (MMBTU) Propane (MMBTU) Water (Gallons)
Bay State Gas Company d/b/a Columbia Gas of Massachusetts 2016 Energy Efficiency Plan-Year Report D.P.U. 17-100 May 1, 2017 Page 15 of 37

Program Savings, Three-Year Total2016-2018 Net SavingsCMAMay 1, 2017
Summer Winter Annual Lifetime Annual Lifetime Annual Lifetime Annual Lifetime Annual LifetimeA - Residential 14,128 1,262 477 1,558 35,247 2,214,865 42,956,609 - - - - 10,221,007 71,547,046
A1 - Residential Whole House 8,269 841 476 1,349 32,091 1,688,769 33,869,951 - - - - 10,213,183 71,492,278 A1a - Residential New Construction 792 8 43 110 2,000 159,795 3,565,415 - - - - - - A1b - Residential Multi-Family Retrofit 1,629 - - - - 126,192 2,057,373 - - - - 1,831,985 12,823,892 A1c - Residential Home Energy Services - Measures 5,848 833 433 1,239 30,091 1,402,782 28,247,163 - - - - 8,381,198 58,668,386 A1d - Residential Home Energy Services - RCS - - - - - - - - - - - - - A1e - Residential Behavior/Feedback Program - - - - - - - - - - - - -
A2 - Residential Products 5,859 421 1 208 3,157 526,096 9,086,658 - - - - 7,824 54,768 A2a - Residential Heating & Cooling Equipment 5,859 421 1 208 3,157 526,096 9,086,658 - - - - 7,824 54,768 A2b - Residential Consumer Products - - - - - - - - - - - - - A2c - Residential Lighting - - - - - - - - - - - - -
B - Low-Income 2,419 128 64 158 3,128 337,599 7,061,580 - - - - 12,744 89,208 B1 - Low-Income Whole House 2,419 128 64 158 3,128 337,599 7,061,580 - - - - 12,744 89,208
B1a - Low-Income Single Family Retrofit 616 128 64 158 3,128 155,495 3,070,656 - - - - - - B1b - Low-Income Multi-Family Retrofit 1,803 - - - - 182,104 3,990,924 - - - - 12,744 89,208
C - Commercial & Industrial 836 - 0 1 13 1,258,929 16,412,083 - - - - 42,923,792 432,447,433 C1 - C&I New Construction 350 - 0 1 13 286,155 5,245,904 - - - - 555,104 6,661,244
C1a - C&I New Buildings & Major Renovations 19 - - - - 36,813 579,957 - - - - 230,773 2,769,281 C1b - C&I Initial Purchase & End of Useful Life 331 - 0 1 13 249,342 4,665,947 - - - - 324,330 3,891,963
C2 - C&I Retrofit 486 - - - - 972,774 11,166,179 - - - - 42,368,689 425,786,189 C2a - C&I Existing Building Retrofit 194 - - - - 801,756 9,173,942 - - - - 20,068,729 200,319,871 C2b - C&I Small Business 275 - - - - 156,231 1,735,533 - - - - 21,939,652 221,863,244 C2c - C&I Multifamily Retrofit 17 - - - - 14,787 256,704 - - - - 360,307 3,603,074 C2d - C&I Upstream Lighting - - - - - - - - - - - - -
Grand Total 17,383 1,390 542 1,716 38,389 3,811,393 66,430,271 - - - - 53,157,543 504,083,687
Summer Winter Annual Lifetime Annual Lifetime Annual Lifetime Annual Lifetime Annual LifetimeA - Residential 15,630 1,307 579 1,766 39,563 1,915,879 37,994,448 7,365,937 51,561,560
A1 - Residential Whole House 7,907 987 569 1,603 37,097 1,403,909 28,977,103 7,365,937 51,561,560 A1a - Residential New Construction 480 5 69 132 3,307 167,234 3,861,642 - - A1b - Residential Multi-Family Retrofit 981 4 - 2 21 90,561 1,511,097 2,003,534 14,024,739 A1c - Residential Home Energy Services - Measures 6,446 979 500 1,469 33,769 1,146,114 23,604,364 5,362,403 37,536,821 A1d - Residential Home Energy Services - RCS - - - - - - - - - A1e - Residential Behavior/Feedback Program - - - - - - - - -
A2 - Residential Products 7,723 320 10 162 2,466 511,969 9,017,344 - - A2a - Residential Heating & Cooling Equipment 7,723 320 10 162 2,466 511,969 9,017,344 - - A2b - Residential Consumer Products - - - - - - - - - A2c - Residential Lighting - - - - - - - - -
B - Low-Income 607 113 58 143 2,819 352,557 7,304,702 246,384 1,724,688 B1 - Low-Income Whole House 607 113 58 143 2,819 352,557 7,304,702 246,384 1,724,688
B1a - Low-Income Single Family Retrofit 548 113 58 143 2,819 143,354 2,826,030 - - B1b - Low-Income Multi-Family Retrofit 59 - - - - 209,203 4,478,672 246,384 1,724,688
C - Commercial & Industrial 2,874 - 1 2 41 1,883,361 27,012,615 8,695,786 74,460,139 C1 - C&I New Construction 615 - 1 2 41 387,504 8,400,564 349,279 4,191,345
C1a - C&I New Buildings & Major Renovations 280 - 0 0 4 137,640 3,082,826 - - C1b - C&I Initial Purchase & End of Useful Life 335 - 1 2 37 249,863 5,317,738 349,279 4,191,345
C2 - C&I Retrofit 2,259 - - - - 1,495,857 18,612,050 8,346,507 70,268,794 C2a - C&I Existing Building Retrofit 360 - - - - 1,264,618 15,775,155 4,564 36,511 C2b - C&I Small Business 865 - - - - 166,655 1,764,934 7,731,238 65,957,345 C2c - C&I Multifamily Retrofit 1,034 - - - - 64,585 1,071,961 610,705 4,274,938 C2d - C&I Upstream Lighting - - - - - - - - -
Grand Total 19,111 1,420 638 1,911 42,423 4,151,797 72,311,764 16,308,107 127,746,387
Oil (MMBTU) Propane (MMBTU) Water (Gallons)
2016 Evaluated Net Savings
Program # of ParticipantsElectric Savings Natural Gas Savings Deliverable Fuel Savings Other Savings
Annual Capacity (kW) Energy (MWh) (Therms)
# of ParticipantsProgram Annual Capacity (kW) Energy (MWh) (Therms) Oil (MMBTU)Other SavingsDeliverable Fuel Savings
Propane (MMBTU) Water (Gallons)
2017 Planned Net SavingsNatural Gas SavingsElectric Savings
Bay State Gas Company d/b/a Columbia Gas of Massachusetts 2016 Energy Efficiency Plan-Year Report D.P.U. 17-100 May 1, 2017 Page 16 of 37

Program Savings, Three-Year Total2016-2018 Net SavingsCMAMay 1, 2017
Summer Winter Annual Lifetime Annual Lifetime Annual Lifetime Annual Lifetime Annual LifetimeA - Residential 15,677 1,305 499 1,770 39,834 1,956,638 38,869,815 7,358,402 51,508,815
A1 - Residential Whole House 7,954 985 497 1,608 37,368 1,444,669 29,852,471 7,358,402 51,508,815 A1a - Residential New Construction 536 5 12 148 3,692 209,550 4,768,265 - - A1b - Residential Multi-Family Retrofit 981 4 - 2 21 90,561 1,511,097 2,003,534 14,024,739 A1c - Residential Home Energy Services - Measures 6,437 976 485 1,458 33,654 1,144,559 23,573,109 5,354,868 37,484,076 A1d - Residential Home Energy Services - RCS - - - - - - - - - A1e - Residential Behavior/Feedback Program - - - - - - - - -
A2 - Residential Products 7,723 320 2 162 2,466 511,969 9,017,344 - - A2a - Residential Heating & Cooling Equipment 7,723 320 2 162 2,466 511,969 9,017,344 - - A2b - Residential Consumer Products - - - - - - - - - A2c - Residential Lighting - - - - - - - - -
B - Low-Income 607 113 51 143 2,819 352,557 7,304,702 246,384 1,724,688 B1 - Low-Income Whole House 607 113 51 143 2,819 352,557 7,304,702 246,384 1,724,688
B1a - Low-Income Single Family Retrofit 548 113 51 143 2,819 143,354 2,826,030 - - B1b - Low-Income Multi-Family Retrofit 59 - - - - 209,203 4,478,672 246,384 1,724,688
C - Commercial & Industrial 2,942 - 0 2 41 1,899,078 27,341,728 8,658,189 74,146,250 C1 - C&I New Construction 695 - 0 2 41 411,658 8,841,324 349,279 4,191,345
C1a - C&I New Buildings & Major Renovations 310 - 0 0 4 150,111 3,353,668 - - C1b - C&I Initial Purchase & End of Useful Life 385 - 0 2 37 261,546 5,487,655 349,279 4,191,345
C2 - C&I Retrofit 2,247 - - - - 1,487,420 18,500,404 8,308,910 69,954,905 C2a - C&I Existing Building Retrofit 357 - - - - 1,257,334 15,677,705 4,564 36,511 C2b - C&I Small Business 861 - - - - 166,067 1,759,814 7,696,079 65,660,526 C2c - C&I Multifamily Retrofit 1,029 - - - - 64,019 1,062,885 608,267 4,257,868 C2d - C&I Upstream Lighting - - - - - - - - -
Grand Total 19,226 1,418 550 1,915 42,694 4,208,274 73,516,245 16,262,975 127,379,753
Summer Winter Annual Lifetime Annual Lifetime Annual Lifetime Annual Lifetime Annual LifetimeA - Residential 45,436 3,875 1,555 5,093 114,645 6,087,382 119,820,872 - - - - 24,945,346 174,617,421
A1 - Residential Whole House 24,131 2,813 1,543 4,560 106,556 4,537,347 92,699,525 - - - - 24,937,522 174,562,653 A1a - Residential New Construction 1,808 18 125 390 8,999 536,579 12,195,322 - - - - - - A1b - Residential Multi-Family Retrofit 3,591 7 - 4 42 307,314 5,079,568 - - - - 5,839,053 40,873,370 A1c - Residential Home Energy Services - Measures 18,732 2,788 1,418 4,167 97,515 3,693,454 75,424,635 - - - - 19,098,469 133,689,283 A1d - Residential Home Energy Services - RCS - - - - - - - - - - - - - A1e - Residential Behavior/Feedback Program - - - - - - - - - - - - -
A2 - Residential Products 21,305 1,062 12 533 8,089 1,550,034 27,121,347 - - - - 7,824 54,768 A2a - Residential Heating & Cooling Equipment 21,305 1,062 12 533 8,089 1,550,034 27,121,347 - - - - 7,824 54,768 A2b - Residential Consumer Products - - - - - - - - - - - - - A2c - Residential Lighting - - - - - - - - - - - - -
B - Low-Income 3,633 353 173 443 8,766 1,042,714 21,670,983 - - - - 505,512 3,538,584 B1 - Low-Income Whole House 3,633 353 173 443 8,766 1,042,714 21,670,983 - - - - 505,512 3,538,584
B1a - Low-Income Single Family Retrofit 1,712 353 173 443 8,766 442,203 8,722,716 - - - - - - B1b - Low-Income Multi-Family Retrofit 1,921 - - - - 600,511 12,948,267 - - - - 505,512 3,538,584
C - Commercial & Industrial 6,652 - 1 5 95 5,041,368 70,766,425 - - - - 60,277,767 581,053,822 C1 - C&I New Construction 1,660 - 1 5 95 1,085,316 22,487,792 - - - - 1,253,661 15,043,933
C1a - C&I New Buildings & Major Renovations 609 - 0 0 9 324,565 7,016,452 - - - - 230,773 2,769,281 C1b - C&I Initial Purchase & End of Useful Life 1,051 - 1 5 86 760,751 15,471,340 - - - - 1,022,888 12,274,652
C2 - C&I Retrofit 4,992 - - - - 3,956,052 48,278,633 - - - - 59,024,106 566,009,888 C2a - C&I Existing Building Retrofit 911 - - - - 3,323,708 40,626,802 - - - - 20,077,857 200,392,894 C2b - C&I Small Business 2,001 - - - - 488,953 5,260,281 - - - - 37,366,969 353,481,114 C2c - C&I Multifamily Retrofit 2,080 - - - - 143,391 2,391,550 - - - - 1,579,280 12,135,880 C2d - C&I Upstream Lighting - - - - - - - - - - - - -
Grand Total 55,721 4,228 1,730 5,542 123,507 12,171,463 212,258,280 - - - - 85,728,625 759,209,827
2016-2018 Net Savings
Program # of ParticipantsElectric Savings Natural Gas Savings Deliverable Fuel Savings Other Savings
Annual Capacity (kW) Energy (MWh) (Therms) Oil (MMBTU) Propane (MMBTU) Water (Gallons)
(Therms) Oil (MMBTU) Propane (MMBTU) Water (Gallons)
2018 Planned Net Savings
Program # of ParticipantsElectric Savings Natural Gas Savings Deliverable Fuel Savings Other Savings
Annual Capacity (kW) Energy (MWh)
Bay State Gas Company d/b/a Columbia Gas of Massachusetts 2016 Energy Efficiency Plan-Year Report D.P.U. 17-100 May 1, 2017 Page 17 of 37

Program Benefits, Plan Year Summary2016 Planned vs. EvaluatedCMAMay 1, 2017
Summer Generation Trans. Distrib.Electric
Capacity DRIPE
Total Capacity Benefits
ElectricElectric Energy
DRIPETotal Energy
Benefits
A - Residential 4,788,680$ 662,094$ 2,999,114$ -$ 8,449,888$ 3,634,745$ 263,814$ 3,898,558$ A1 - Residential Whole House 4,023,797$ 548,737$ 2,485,637$ -$ 7,058,172$ 3,448,581$ 242,468$ 3,691,050$
A1a - Residential New Constr 17,910$ 2,430$ 11,006$ -$ 31,346$ 283,839$ 19,027$ 302,866$ A1b - Residential Multi-Fami 7,146$ 1,128$ 5,109$ -$ 13,383$ 1,624$ 241$ 1,865$ A1c - Residential Home Ener 3,998,741$ 545,180$ 2,469,522$ -$ 7,013,443$ 3,163,118$ 223,200$ 3,386,318$ A1d - Residential Home Ener -$ -$ -$ -$ -$ -$ -$ -$ A1e - Residential Behavior/F -$ -$ -$ -$ -$ -$ -$ -$
A2 - Residential Products 764,882$ 113,357$ 513,477$ -$ 1,391,717$ 186,164$ 21,345$ 207,509$ A2a - Residential Heating & C 764,882$ 113,357$ 513,477$ -$ 1,391,717$ 186,164$ 21,345$ 207,509$ A2b - Residential Consumer P -$ -$ -$ -$ -$ -$ -$ -$ A2c - Residential Lighting -$ -$ -$ -$ -$ -$ -$ -$
B - Low-Income 375,511$ 52,610$ 238,311$ -$ 666,431$ 242,250$ 20,866$ 263,116$ B1 - Low-Income Whole House 375,511$ 52,610$ 238,311$ -$ 666,431$ 242,250$ 20,866$ 263,116$
B1a - Low-Income Single Fam 375,511$ 52,610$ 238,311$ -$ 666,431$ 242,250$ 20,866$ 263,116$ B1b - Low-Income Multi-Fam -$ -$ -$ -$ -$ -$ -$ -$
C - Commercial & Industrial -$ -$ -$ -$ -$ 3,346$ 339$ 3,684$ C1 - C&I New Construction -$ -$ -$ -$ -$ 3,346$ 339$ 3,684$
C1a - C&I New Buildings & M -$ -$ -$ -$ -$ 352$ 36$ 388$ C1b - C&I Initial Purchase & E -$ -$ -$ -$ -$ 2,993$ 303$ 3,297$
C2 - C&I Retrofit -$ -$ -$ -$ -$ -$ -$ -$ C2a - C&I Existing Building Re -$ -$ -$ -$ -$ -$ -$ -$ C2b - C&I Small Business -$ -$ -$ -$ -$ -$ -$ -$ C2c - C&I Multifamily Retrofi -$ -$ -$ -$ -$ -$ -$ -$ C2d - C&I Upstream Lighting -$ -$ -$ -$ -$ -$ -$ -$
Grand Total 5,164,191$ 714,704$ 3,237,425$ -$ 9,116,320$ 3,880,340$ 285,019$ 4,165,359$
Summer Generation Trans. Distrib.Electric
Capacity DRIPE
Total Capacity Benefits
ElectricElectric Energy
DRIPETotal Energy
Benefits
A - Residential 4,554,005$ 630,900$ 2,857,813$ -$ 8,042,718$ 3,256,978$ 233,031$ 3,490,008$ A1 - Residential Whole House 3,547,232$ 481,695$ 2,181,950$ -$ 6,210,877$ 3,019,468$ 205,715$ 3,225,183$
A1a - Residential New Constr 15,867$ 2,432$ 11,017$ -$ 29,317$ 184,038$ 16,544$ 200,582$ A1b - Residential Multi-Fami -$ -$ -$ -$ -$ -$ -$ -$ A1c - Residential Home Ener 3,531,365$ 479,262$ 2,170,933$ -$ 6,181,561$ 2,835,430$ 189,171$ 3,024,601$ A1d - Residential Home Ener -$ -$ -$ -$ -$ -$ -$ -$ A1e - Residential Behavior/F -$ -$ -$ -$ -$ -$ -$ -$
A2 - Residential Products 1,006,773$ 149,206$ 675,862$ -$ 1,831,841$ 237,510$ 27,316$ 264,826$ A2a - Residential Heating & C 1,006,773$ 149,206$ 675,862$ -$ 1,831,841$ 237,510$ 27,316$ 264,826$ A2b - Residential Consumer P -$ -$ -$ -$ -$ -$ -$ -$ A2c - Residential Lighting -$ -$ -$ -$ -$ -$ -$ -$
B - Low-Income 425,647$ 59,634$ 270,129$ -$ 755,410$ 268,910$ 23,090$ 292,001$ B1 - Low-Income Whole House 425,647$ 59,634$ 270,129$ -$ 755,410$ 268,910$ 23,090$ 292,001$
B1a - Low-Income Single Fam 425,647$ 59,634$ 270,129$ -$ 755,410$ 268,910$ 23,090$ 292,001$ B1b - Low-Income Multi-Fam -$ -$ -$ -$ -$ -$ -$ -$
C - Commercial & Industrial -$ -$ -$ -$ -$ 1,056$ 107$ 1,164$ C1 - C&I New Construction -$ -$ -$ -$ -$ 1,056$ 107$ 1,164$
C1a - C&I New Buildings & M -$ -$ -$ -$ -$ -$ -$ -$ C1b - C&I Initial Purchase & E -$ -$ -$ -$ -$ 1,056$ 107$ 1,164$
C2 - C&I Retrofit -$ -$ -$ -$ -$ -$ -$ -$ C2a - C&I Existing Building Re -$ -$ -$ -$ -$ -$ -$ -$ C2b - C&I Small Business -$ -$ -$ -$ -$ -$ -$ -$ C2c - C&I Multifamily Retrofi -$ -$ -$ -$ -$ -$ -$ -$ C2d - C&I Upstream Lighting -$ -$ -$ -$ -$ -$ -$ -$
Grand Total 4,979,652$ 690,535$ 3,127,941$ -$ 8,798,128$ 3,526,945$ 256,228$ 3,783,173$
Program
Electric Benefits
2016 Planned Benefits
2016 Evaluated Benefits
Capacity EnergyElectric Benefits
Program
Capacity Energy
Bay State Gas Company d/b/a Columbia Gas of Massachusetts 2016 Energy Efficiency Plan-Year Report D.P.U. 17-100 May 1, 2017 Page 18 of 37

Program Benefits, Plan Year Summary2016 Planned vs. EvaluatedCMAMay 1, 2017
Summer Generation Trans. Distrib.Electric
Capacity DRIPE
Total Capacity Benefits
ElectricElectric Energy
DRIPETotal Energy
Benefits
A - Residential -5% -5% -5% -5% -10% -12% -10%A1 - Residential Whole House -12% -12% -12% -12% -12% -15% -13%
A1a - Residential New Constr -11% 0% 0% -6% -35% -13% -34%A1b - Residential Multi-Fami -100% -100% -100% -100% -100% -100% -100%A1c - Residential Home Ener -12% -12% -12% -12% -10% -15% -11%A1d - Residential Home Ener A1e - Residential Behavior/F
A2 - Residential Products 32% 32% 32% 32% 28% 28% 28%A2a - Residential Heating & C 32% 32% 32% 32% 28% 28% 28%A2b - Residential Consumer PA2c - Residential Lighting
B - Low-Income 13% 13% 13% 13% 11% 11% 11%B1 - Low-Income Whole House 13% 13% 13% 13% 11% 11% 11%
B1a - Low-Income Single Fam 13% 13% 13% 13% 11% 11% 11%B1b - Low-Income Multi-Fam
C - Commercial & Industrial -68% -68% -68%C1 - C&I New Construction -68% -68% -68%
C1a - C&I New Buildings & M -100% -100% -100%C1b - C&I Initial Purchase & E -65% -65% -65%
C2 - C&I RetrofitC2a - C&I Existing Building ReC2b - C&I Small BusinessC2c - C&I Multifamily RetrofiC2d - C&I Upstream Lighting
Grand Total -4% -3% -3% -3% -9% -10% -9%
Notes• Total Resource Benefits is the sum of electric benefits, natural gas benefits, and other resource benefits.• The plan year variances provided above are intended to indicate the Program Administrator's performance in the plan year only. The variances used to determine significant variances are provided separately. The variances above and the significant variances use different calculations to determine variances on an annual basis and over the three-year term, respectively.
2016 Planned v. Evaluated Benefit Variances (%)
Program
Electric BenefitsCapacity Energy
Bay State Gas Company d/b/a Columbia Gas of Massachusetts 2016 Energy Efficiency Plan-Year Report D.P.U. 17-100 May 1, 2017 Page 19 of 37

Program Benefits, Plan Y 2016 Planned vs. EvaluatedCMAMay 1, 2017
A - ResidentialA1 - Residential Whole House
A1a - Residential New ConstrA1b - Residential Multi-Fami A1c - Residential Home Ener A1d - Residential Home Ener A1e - Residential Behavior/F
A2 - Residential ProductsA2a - Residential Heating & C A2b - Residential Consumer PA2c - Residential Lighting
B - Low-IncomeB1 - Low-Income Whole House
B1a - Low-Income Single Fam B1b - Low-Income Multi-Fam
C - Commercial & IndustrialC1 - C&I New Construction
C1a - C&I New Buildings & M C1b - C&I Initial Purchase & E
C2 - C&I RetrofitC2a - C&I Existing Building ReC2b - C&I Small BusinessC2c - C&I Multifamily RetrofiC2d - C&I Upstream Lighting
Grand Total
Program
ProgramNatural Gas Natural Gas DRIPE Total Gas Benefits Oil Propane Water
Total Other Resource Benefits
32,157,535$ 3,176,852$ 35,334,386$ 559,260$ 559,260$ 48,242,093$ 18,332,931$ 66,575,024$ 3,083.51$ 24,682,005$ 2,341,808$ 27,023,813$ 559,260$ 559,260$ 38,332,294$ 15,571,371$ 53,903,665$ 4,838.59$
3,057,788$ 267,747$ 3,325,535$ -$ -$ 3,659,747$ 2,335,910$ 5,995,657$ 8,413.21$ 1,359,631$ 153,945$ 1,513,576$ 158,802$ 158,802$ 1,687,625$ 1,186,581$ 2,874,206$ 1,621.16$
20,264,586$ 1,920,116$ 22,184,702$ 400,458$ 400,458$ 32,984,922$ 12,048,880$ 45,033,802$ 5,116.95$ -$ -$ -$ -$ -$ -$ -$ -$ -$ -$ -$ -$ -$ -$ -$ -$
7,475,530$ 835,043$ 8,310,573$ -$ -$ 9,909,799$ 2,761,560$ 12,671,359$ 1,283.15$ 7,475,530$ 835,043$ 8,310,573$ -$ -$ 9,909,799$ 2,761,560$ 12,671,359$ 1,283.15$
-$ -$ -$ -$ -$ -$ -$ -$ -$ -$ -$ -$ -$ -$ -$ -$
6,312,244$ 598,047$ 6,910,290$ 18,770$ 18,770$ 7,858,608$ 3,192,752$ 11,051,359$ 12,925.34$ 6,312,244$ 598,047$ 6,910,290$ 18,770$ 18,770$ 7,858,608$ 3,192,752$ 11,051,359$ 12,925.34$ 2,400,188$ 237,250$ 2,637,439$ -$ -$ 3,566,986$ 1,924,120$ 5,491,106$ 6,509.10$ 3,912,055$ 360,797$ 4,272,852$ 18,770$ 18,770$ 4,291,621$ 1,268,632$ 5,560,253$ 71,527.02$
20,242,088$ 3,012,309$ 23,254,397$ 811,091$ 811,091$ 24,069,173$ 5,888,858$ 29,958,031$ 8,593.06$ 6,136,876$ 638,552$ 6,775,428$ 44,230$ 44,230$ 6,823,343$ -$ 6,823,343$ 13,953.67$ 2,032,867$ 205,936$ 2,238,803$ -$ -$ 2,239,190$ -$ 2,239,190$ 11,542.22$ 4,104,009$ 432,616$ 4,536,626$ 44,230$ 44,230$ 4,584,153$ -$ 4,584,153$ 15,539.50$
14,105,212$ 2,373,757$ 16,478,969$ 766,861$ 766,861$ 17,245,830$ 5,888,858$ 23,134,688$ 7,459.27$ 12,005,378$ 1,997,036$ 14,002,415$ 389$ 389$ 14,002,803$ 5,436,351$ 19,439,154$ 38,575.22$
1,276,442$ 265,362$ 1,541,804$ 719,633$ 719,633$ 2,261,437$ 176,469$ 2,437,906$ 2,546.66$ 823,392$ 111,359$ 934,751$ 46,839$ 46,839$ 981,590$ 276,038$ 1,257,628$ 925.16$
-$ -$ -$ -$ -$ -$ -$ -$ 58,711,866$ 6,787,208$ 65,499,074$ 1,389,120$ 1,389,120$ 80,169,873$ 27,414,541$ 107,584,414$ 4,207.46$
Natural Gas Natural Gas DRIPE Total Gas Benefits Oil Propane WaterTotal Other Resource
Benefits
36,531,399$ 3,665,112$ 40,196,511$ -$ -$ 763,292$ 763,292$ 52,492,530$ 20,276,708$ 72,769,238$ 3,715.50$ 29,025,712$ 2,809,621$ 31,835,333$ -$ -$ 762,708$ 762,708$ 42,034,101$ 18,090,718$ 60,124,819$ 5,083.34$
3,053,883$ 276,182$ 3,330,065$ -$ -$ -$ -$ 3,559,964$ 4,255,907$ 7,815,871$ 4,494.90$ 1,729,561$ 200,159$ 1,929,720$ -$ -$ 136,810$ 136,810$ 2,066,530$ 1,163,566$ 3,230,096$ 1,268.59$
24,242,268$ 2,333,279$ 26,575,547$ -$ -$ 625,898$ 625,898$ 36,407,606$ 12,671,246$ 49,078,852$ 6,225.65$ -$ -$ -$ -$ -$ -$ -$ -$ -$ -$ -$ -$ -$ -$ -$ -$ -$ -$ -$ -$
7,505,687$ 855,491$ 8,361,178$ -$ -$ 584$ 584$ 10,458,429$ 2,185,990$ 12,644,419$ 1,785.02$ 7,505,687$ 855,491$ 8,361,178$ -$ -$ 584$ 584$ 10,458,429$ 2,185,990$ 12,644,419$ 1,785.02$
-$ -$ -$ -$ -$ -$ -$ -$ -$ -$ -$ -$ -$ -$ -$ -$ -$ -$ -$ -$
6,027,574$ 569,390$ 6,596,963$ -$ -$ 952$ 952$ 7,645,326$ 7,745,952$ 15,391,278$ 3,160.53$ 6,027,574$ 569,390$ 6,596,963$ -$ -$ 952$ 952$ 7,645,326$ 7,745,952$ 15,391,278$ 3,160.53$ 2,608,216$ 257,473$ 2,865,690$ -$ -$ -$ -$ 3,913,100$ 6,388,170$ 10,301,270$ 6,352.44$ 3,419,357$ 311,916$ 3,731,274$ -$ -$ 952$ 952$ 3,732,225$ 1,357,783$ 5,090,008$ 2,070.01$
12,097,014$ 1,989,736$ 14,086,750$ -$ -$ 4,581,935$ 4,581,935$ 18,669,849$ 4,396,385$ 23,066,234$ 22,332.36$ 3,824,889$ 490,377$ 4,315,267$ -$ -$ 70,294$ 70,294$ 4,386,725$ 584,262$ 4,970,987$ 12,533.50$
349,411$ 49,434$ 398,844$ -$ -$ 29,224$ 29,224$ 428,068$ 157,360$ 585,428$ 22,529.89$ 3,475,479$ 440,944$ 3,916,422$ -$ -$ 41,071$ 41,071$ 3,958,657$ 426,902$ 4,385,559$ 11,959.69$ 8,272,125$ 1,499,359$ 9,771,484$ -$ -$ 4,511,641$ 4,511,641$ 14,283,125$ 3,812,123$ 18,095,248$ 29,389.15$ 6,875,402$ 1,227,374$ 8,102,776$ -$ -$ 2,123,227$ 2,123,227$ 10,226,003$ 3,611,746$ 13,837,748$ 52,711.35$ 1,197,937$ 247,093$ 1,445,030$ -$ -$ 2,350,226$ 2,350,226$ 3,795,256$ 194,389$ 3,989,645$ 13,800.93$
198,786$ 24,892$ 223,677$ -$ -$ 38,188$ 38,188$ 261,866$ 5,989$ 267,854$ 15,403.87$ -$ -$ -$ -$ -$ -$ -$ -$ -$ -$
54,655,987$ 6,224,238$ 60,880,225$ -$ -$ 5,346,179$ 5,346,179$ 78,807,705$ 32,419,046$ 111,226,750$ 4,533.61$
Non-Electric Resource Benefits
Resource Benefits per Participant
2016 Planned Benefits
2016 Evaluated Benefits
Total Resource Benefits
(Electric + Non-Electric)
Non-Electric, Non-Resource
BenefitsTotal Benefits
Natural Gas Benefits Other Resource BenefitsNon-Electric Resource Benefits
Total Resource Benefits
(Electric + Non-Electric)
Non-Electric, Non-Resource
BenefitsTotal Benefits
Resource Benefits per Participant
Natural Gas Benefits Other Resource Benefits
Bay State Gas Company d/b/a Columbia Gas of Massachusetts 2016 Energy Efficiency Plan-Year Report D.P.U. 17-100 May 1, 2017 Page 20 of 37

Program Benefits, Plan Y 2016 Planned vs. EvaluatedCMAMay 1, 2017
A - ResidentialA1 - Residential Whole House
A1a - Residential New ConstrA1b - Residential Multi-Fami A1c - Residential Home Ener A1d - Residential Home Ener A1e - Residential Behavior/F
A2 - Residential ProductsA2a - Residential Heating & C A2b - Residential Consumer PA2c - Residential Lighting
B - Low-IncomeB1 - Low-Income Whole House
B1a - Low-Income Single Fam B1b - Low-Income Multi-Fam
C - Commercial & IndustrialC1 - C&I New Construction
C1a - C&I New Buildings & M C1b - C&I Initial Purchase & E
C2 - C&I RetrofitC2a - C&I Existing Building ReC2b - C&I Small BusinessC2c - C&I Multifamily RetrofiC2d - C&I Upstream Lighting
Grand Total
ProgramNatural Gas Natural Gas DRIPE Total Gas Benefits Oil Propane Water
Total Other Resource Benefits
14% 15% 14% 36% 36% 9% 11% 9% 20%18% 20% 18% 36% 36% 10% 16% 12% 5%
0% 3% 0% -3% 82% 30% -47%27% 30% 27% -14% -14% 22% -2% 12% -22%20% 22% 20% 56% 56% 10% 5% 9% 22%
0% 2% 1% 6% -21% 0% 39%0% 2% 1% 6% -21% 0% 39%
-5% -5% -5% -95% -95% -3% 143% 39% -76%-5% -5% -5% -95% -95% -3% 143% 39% -76%9% 9% 9% 10% 232% 88% -2%
-13% -14% -13% -95% -95% -13% 7% -8% -97%-40% -34% -39% 465% 465% -22% -25% -23% 160%-38% -23% -36% 59% 59% -36% -27% -10%-83% -76% -82% -81% -74% 95%-15% 2% -14% -7% -7% -14% -4% -23%-41% -37% -41% 488% 488% -17% -35% -22% 294%-43% -39% -42% 546182% 546182% -27% -34% -29% 37%
-6% -7% -6% 227% 227% 68% 10% 64% 442%-76% -78% -76% -18% -18% -73% -98% -79% 1565%
-7% -8% -7% 285% 285% -2% 18% 3% 8%
Other Resource Benefits
2016 Planned v. Evaluated Benefit Variances (%)Non-Electric Resource Benefits
Total Resource Benefits
(Electric + Non-Electric)
Non-Electric, Non-Resource
BenefitsTotal Benefits
Resource Benefits per Participant
Natural Gas Benefits
Bay State Gas Company d/b/a Columbia Gas of Massachusetts 2016 Energy Efficiency Plan-Year Report D.P.U. 17-100 May 1, 2017 Page 21 of 37

Program Benefits, Three-Year Total2016-2018 BenefitsCMAMay 1, 2017
Summer Generation Trans. Distrib.Electric
Capacity DRIPETotal Capacity
BenefitsElectric
Electric Energy DRIPE
Total Energy Benefits
A - Residential 4,554,005$ 630,900$ 2,857,813$ -$ 8,042,718$ 3,256,978$ 233,031$ 3,490,008$ A1 - Residential Whole House 3,547,232$ 481,695$ 2,181,950$ -$ 6,210,877$ 3,019,468$ 205,715$ 3,225,183$
A1a - Residential New Construction 15,867$ 2,432$ 11,017$ -$ 29,317$ 184,038$ 16,544$ 200,582$ A1b - Residential Multi-Family Retrofit -$ -$ -$ -$ -$ -$ -$ -$ A1c - Residential Home Energy Services - Measu 3,531,365$ 479,262$ 2,170,933$ -$ 6,181,561$ 2,835,430$ 189,171$ 3,024,601$ A1d - Residential Home Energy Services - RCS -$ -$ -$ -$ -$ -$ -$ -$ A1e - Residential Behavior/Feedback Program -$ -$ -$ -$ -$ -$ -$ -$
A2 - Residential Products 1,006,773$ 149,206$ 675,862$ -$ 1,831,841$ 237,510$ 27,316$ 264,826$ A2a - Residential Heating & Cooling Equipment 1,006,773$ 149,206$ 675,862$ -$ 1,831,841$ 237,510$ 27,316$ 264,826$ A2b - Residential Consumer Products -$ -$ -$ -$ -$ -$ -$ -$ A2c - Residential Lighting -$ -$ -$ -$ -$ -$ -$ -$
B - Low-Income 425,647$ 59,634$ 270,129$ -$ 755,410$ 268,910$ 23,090$ 292,001$ B1 - Low-Income Whole House 425,647$ 59,634$ 270,129$ -$ 755,410$ 268,910$ 23,090$ 292,001$
B1a - Low-Income Single Family Retrofit 425,647$ 59,634$ 270,129$ -$ 755,410$ 268,910$ 23,090$ 292,001$ B1b - Low-Income Multi-Family Retrofit -$ -$ -$ -$ -$ -$ -$ -$
C - Commercial & Industrial -$ -$ -$ -$ -$ 1,056$ 107$ 1,164$ C1 - C&I New Construction -$ -$ -$ -$ -$ 1,056$ 107$ 1,164$
C1a - C&I New Buildings & Major Renovations -$ -$ -$ -$ -$ -$ -$ -$ C1b - C&I Initial Purchase & End of Useful Life -$ -$ -$ -$ -$ 1,056$ 107$ 1,164$
C2 - C&I Retrofit -$ -$ -$ -$ -$ -$ -$ -$ C2a - C&I Existing Building Retrofit -$ -$ -$ -$ -$ -$ -$ -$ C2b - C&I Small Business -$ -$ -$ -$ -$ -$ -$ -$ C2c - C&I Multifamily Retrofit -$ -$ -$ -$ -$ -$ -$ -$ C2d - C&I Upstream Lighting -$ -$ -$ -$ -$ -$ -$ -$
Grand Total 4,979,652$ 690,535$ 3,127,941$ -$ 8,798,128$ 3,526,945$ 256,228$ 3,783,173$
Summer Generation Trans. Distrib.Electric
Capacity DRIPETotal Capacity
BenefitsElectric
Electric Energy DRIPE
Total Energy Benefits
A - Residential 4,994,435$ 662,009$ 2,998,726$ -$ 8,655,170$ 3,769,608$ 165,638$ 3,935,246$ A1 - Residential Whole House 4,179,062$ 548,652$ 2,485,249$ -$ 7,212,963$ 3,575,704$ 152,978$ 3,728,682$
A1a - Residential New Construction 20,517$ 2,684$ 12,157$ -$ 35,357$ 321,210$ 13,395$ 334,605$ A1b - Residential Multi-Family Retrofit 7,124$ 1,036$ 4,691$ -$ 12,851$ 1,552$ 128$ 1,680$ A1c - Residential Home Energy Services - Measu 4,151,421$ 544,932$ 2,468,401$ -$ 7,164,755$ 3,252,942$ 139,455$ 3,392,397$ A1d - Residential Home Energy Services - RCS -$ -$ -$ -$ -$ -$ -$ -$ A1e - Residential Behavior/Feedback Program -$ -$ -$ -$ -$ -$ -$ -$
A2 - Residential Products 815,373$ 113,357$ 513,477$ -$ 1,442,207$ 193,904$ 12,660$ 206,564$ A2a - Residential Heating & Cooling Equipment 815,373$ 113,357$ 513,477$ -$ 1,442,207$ 193,904$ 12,660$ 206,564$ A2b - Residential Consumer Products -$ -$ -$ -$ -$ -$ -$ -$ A2c - Residential Lighting -$ -$ -$ -$ -$ -$ -$ -$
B - Low-Income 393,277$ 52,610$ 238,311$ -$ 684,198$ 249,343$ 12,892$ 262,235$ B1 - Low-Income Whole House 393,277$ 52,610$ 238,311$ -$ 684,198$ 249,343$ 12,892$ 262,235$
B1a - Low-Income Single Family Retrofit 393,277$ 52,610$ 238,311$ -$ 684,198$ 249,343$ 12,892$ 262,235$ B1b - Low-Income Multi-Family Retrofit -$ -$ -$ -$ -$ -$ -$ -$
C - Commercial & Industrial -$ -$ -$ -$ -$ 3,412$ 210$ 3,622$ C1 - C&I New Construction -$ -$ -$ -$ -$ 3,412$ 210$ 3,622$
C1a - C&I New Buildings & Major Renovations -$ -$ -$ -$ -$ 359$ 22$ 381$ C1b - C&I Initial Purchase & End of Useful Life -$ -$ -$ -$ -$ 3,053$ 187$ 3,240$
C2 - C&I Retrofit -$ -$ -$ -$ -$ -$ -$ -$ C2a - C&I Existing Building Retrofit -$ -$ -$ -$ -$ -$ -$ -$ C2b - C&I Small Business -$ -$ -$ -$ -$ -$ -$ -$ C2c - C&I Multifamily Retrofit -$ -$ -$ -$ -$ -$ -$ -$ C2d - C&I Upstream Lighting -$ -$ -$ -$ -$ -$ -$ -$
Grand Total 5,387,712$ 714,619$ 3,237,037$ -$ 9,339,367$ 4,022,363$ 178,740$ 4,201,103$
2016 Evaluated Benefits
Program
Electric BenefitsCapacity Energy
Program
Electric Benefits2017 Planned Benefits
Capacity Energy
Bay State Gas Company d/b/a Columbia Gas of Massachusetts 2016 Energy Efficiency Plan-Year Report D.P.U. 17-100 May 1, 2017 Page 22 of 37

Program Benefits, Three-Year Total2016-2018 BenefitsCMAMay 1, 2017
Summer Generation Trans. Distrib.Electric
Capacity DRIPETotal Capacity
BenefitsElectric
Electric Energy DRIPE
Total Energy Benefits
A - Residential 5,144,195$ 661,371$ 2,995,837$ -$ 8,801,403$ 3,920,727$ 94,045$ 4,014,772$ A1 - Residential Whole House 4,290,951$ 548,014$ 2,482,360$ -$ 7,321,324$ 3,718,816$ 88,326$ 3,807,141$
A1a - Residential New Construction 23,540$ 2,999$ 13,584$ -$ 40,123$ 368,880$ 9,164$ 378,044$ A1b - Residential Multi-Family Retrofit 7,545$ 1,036$ 4,691$ -$ 13,271$ 1,610$ 52$ 1,663$ A1c - Residential Home Energy Services - Measu 4,259,866$ 543,979$ 2,464,084$ -$ 7,267,929$ 3,348,326$ 79,109$ 3,427,435$ A1d - Residential Home Energy Services - RCS -$ -$ -$ -$ -$ -$ -$ -$ A1e - Residential Behavior/Feedback Program -$ -$ -$ -$ -$ -$ -$ -$
A2 - Residential Products 853,244$ 113,357$ 513,477$ -$ 1,480,079$ 201,911$ 5,719$ 207,631$ A2a - Residential Heating & Cooling Equipment 853,244$ 113,357$ 513,477$ -$ 1,480,079$ 201,911$ 5,719$ 207,631$ A2b - Residential Consumer Products -$ -$ -$ -$ -$ -$ -$ -$ A2c - Residential Lighting -$ -$ -$ -$ -$ -$ -$ -$
B - Low-Income 406,603$ 52,610$ 238,311$ -$ 697,524$ 257,243$ 7,102$ 264,345$ B1 - Low-Income Whole House 406,603$ 52,610$ 238,311$ -$ 697,524$ 257,243$ 7,102$ 264,345$
B1a - Low-Income Single Family Retrofit 406,603$ 52,610$ 238,311$ -$ 697,524$ 257,243$ 7,102$ 264,345$ B1b - Low-Income Multi-Family Retrofit -$ -$ -$ -$ -$ -$ -$ -$
C - Commercial & Industrial -$ -$ -$ -$ -$ 3,495$ 122$ 3,617$ C1 - C&I New Construction -$ -$ -$ -$ -$ 3,495$ 122$ 3,617$
C1a - C&I New Buildings & Major Renovations -$ -$ -$ -$ -$ 368$ 13$ 381$ C1b - C&I Initial Purchase & End of Useful Life -$ -$ -$ -$ -$ 3,127$ 109$ 3,236$
C2 - C&I Retrofit -$ -$ -$ -$ -$ -$ -$ -$ C2a - C&I Existing Building Retrofit -$ -$ -$ -$ -$ -$ -$ -$ C2b - C&I Small Business -$ -$ -$ -$ -$ -$ -$ -$ C2c - C&I Multifamily Retrofit -$ -$ -$ -$ -$ -$ -$ -$ C2d - C&I Upstream Lighting -$ -$ -$ -$ -$ -$ -$ -$
Grand Total 5,550,798$ 713,981$ 3,234,148$ -$ 9,498,927$ 4,181,465$ 101,269$ 4,282,734$
Summer Generation Trans. Distrib.Electric
Capacity DRIPETotal Capacity
BenefitsElectric
Electric Energy DRIPE
Total Energy Benefits
A - Residential 14,692,635$ 1,954,280$ 8,852,376$ -$ 25,499,290$ 10,947,313$ 492,714$ 11,440,026$ A1 - Residential Whole House 12,017,244$ 1,578,360$ 7,149,559$ -$ 20,745,164$ 10,313,988$ 447,019$ 10,761,006$
A1a - Residential New Construction 59,924$ 8,115$ 36,758$ -$ 104,797$ 874,127$ 39,103$ 913,231$ A1b - Residential Multi-Family Retrofit 14,668$ 2,071$ 9,382$ -$ 26,122$ 3,162$ 181$ 3,343$ A1c - Residential Home Energy Services - Measu 11,942,652$ 1,568,174$ 7,103,419$ -$ 20,614,245$ 9,436,698$ 407,735$ 9,844,433$ A1d - Residential Home Energy Services - RCS -$ -$ -$ -$ -$ -$ -$ -$ A1e - Residential Behavior/Feedback Program -$ -$ -$ -$ -$ -$ -$ -$
A2 - Residential Products 2,675,390$ 375,919$ 1,702,816$ -$ 4,754,126$ 633,325$ 45,695$ 679,020$ A2a - Residential Heating & Cooling Equipment 2,675,390$ 375,919$ 1,702,816$ -$ 4,754,126$ 633,325$ 45,695$ 679,020$ A2b - Residential Consumer Products -$ -$ -$ -$ -$ -$ -$ -$ A2c - Residential Lighting -$ -$ -$ -$ -$ -$ -$ -$
B - Low-Income 1,225,527$ 164,855$ 746,750$ -$ 2,137,132$ 775,497$ 43,085$ 818,581$ B1 - Low-Income Whole House 1,225,527$ 164,855$ 746,750$ -$ 2,137,132$ 775,497$ 43,085$ 818,581$
B1a - Low-Income Single Family Retrofit 1,225,527$ 164,855$ 746,750$ -$ 2,137,132$ 775,497$ 43,085$ 818,581$ B1b - Low-Income Multi-Family Retrofit -$ -$ -$ -$ -$ -$ -$ -$
C - Commercial & Industrial -$ -$ -$ -$ -$ 7,963$ 438$ 8,402$ C1 - C&I New Construction -$ -$ -$ -$ -$ 7,963$ 438$ 8,402$
C1a - C&I New Buildings & Major Renovations -$ -$ -$ -$ -$ 727$ 35$ 762$ C1b - C&I Initial Purchase & End of Useful Life -$ -$ -$ -$ -$ 7,236$ 403$ 7,640$
C2 - C&I Retrofit -$ -$ -$ -$ -$ -$ -$ -$ C2a - C&I Existing Building Retrofit -$ -$ -$ -$ -$ -$ -$ -$ C2b - C&I Small Business -$ -$ -$ -$ -$ -$ -$ -$ C2c - C&I Multifamily Retrofit -$ -$ -$ -$ -$ -$ -$ -$ C2d - C&I Upstream Lighting -$ -$ -$ -$ -$ -$ -$ -$
Grand Total 15,918,162$ 2,119,134$ 9,599,126$ -$ 27,636,422$ 11,730,773$ 536,237$ 12,267,009$
Notes• Total Resource Benefits is the sum of electric benefits, natural gas benefits, and other resource benefits.
Capacity Energy
2018 Planned Benefits
Program
Electric BenefitsCapacity Energy
2016-2018 Benefits
Program
Electric Benefits
Bay State Gas Company d/b/a Columbia Gas of Massachusetts 2016 Energy Efficiency Plan-Year Report D.P.U. 17-100 May 1, 2017 Page 23 of 37

Program Benefits, Three-Year Total2016-2018 BenefitsCMAMay 1, 2017
A - ResidentialA1 - Residential Whole House
A1a - Residential New ConstructionA1b - Residential Multi-Family RetrofitA1c - Residential Home Energy Services - MeasuA1d - Residential Home Energy Services - RCSA1e - Residential Behavior/Feedback Program
A2 - Residential ProductsA2a - Residential Heating & Cooling EquipmentA2b - Residential Consumer ProductsA2c - Residential Lighting
B - Low-IncomeB1 - Low-Income Whole House
B1a - Low-Income Single Family RetrofitB1b - Low-Income Multi-Family Retrofit
C - Commercial & IndustrialC1 - C&I New Construction
C1a - C&I New Buildings & Major RenovationsC1b - C&I Initial Purchase & End of Useful Life
C2 - C&I RetrofitC2a - C&I Existing Building RetrofitC2b - C&I Small BusinessC2c - C&I Multifamily RetrofitC2d - C&I Upstream Lighting
Grand Total
Program
Program
Natural Gas Natural Gas DRIPE Total Gas Benefits Oil Propane WaterTotal Other Resource
Benefits
36,531,399$ 3,665,112$ 40,196,511$ -$ -$ 763,292$ 763,292$ 52,492,530$ 20,276,708$ 72,769,238$ 3,715.50$ 29,025,712$ 2,809,621$ 31,835,333$ -$ -$ 762,708$ 762,708$ 42,034,101$ 18,090,718$ 60,124,819$ 5,083.34$
3,053,883$ 276,182$ 3,330,065$ -$ -$ -$ -$ 3,559,964$ 4,255,907$ 7,815,871$ 4,494.90$ 1,729,561$ 200,159$ 1,929,720$ -$ -$ 136,810$ 136,810$ 2,066,530$ 1,163,566$ 3,230,096$ 1,268.59$
24,242,268$ 2,333,279$ 26,575,547$ -$ -$ 625,898$ 625,898$ 36,407,606$ 12,671,246$ 49,078,852$ 6,225.65$ -$ -$ -$ -$ -$ -$ -$ -$ -$ -$ -$ -$ -$ -$ -$ -$ -$ -$ -$ -$
7,505,687$ 855,491$ 8,361,178$ -$ -$ 584$ 584$ 10,458,429$ 2,185,990$ 12,644,419$ 1,785.02$ 7,505,687$ 855,491$ 8,361,178$ -$ -$ 584$ 584$ 10,458,429$ 2,185,990$ 12,644,419$ 1,785.02$
-$ -$ -$ -$ -$ -$ -$ -$ -$ -$ -$ -$ -$ -$ -$ -$ -$ -$ -$ -$
6,027,574$ 569,390$ 6,596,963$ -$ -$ 952$ 952$ 7,645,326$ 7,745,952$ 15,391,278$ 3,160.53$ 6,027,574$ 569,390$ 6,596,963$ -$ -$ 952$ 952$ 7,645,326$ 7,745,952$ 15,391,278$ 3,160.53$ 2,608,216$ 257,473$ 2,865,690$ -$ -$ -$ -$ 3,913,100$ 6,388,170$ 10,301,270$ 6,352.44$ 3,419,357$ 311,916$ 3,731,274$ -$ -$ 952$ 952$ 3,732,225$ 1,357,783$ 5,090,008$ 2,070.01$
12,097,014$ 1,989,736$ 14,086,750$ -$ -$ 4,581,935$ 4,581,935$ 18,669,849$ 4,396,385$ 23,066,234$ 22,332.36$ 3,824,889$ 490,377$ 4,315,267$ -$ -$ 70,294$ 70,294$ 4,386,725$ 584,262$ 4,970,987$ 12,533.50$
349,411$ 49,434$ 398,844$ -$ -$ 29,224$ 29,224$ 428,068$ 157,360$ 585,428$ 22,529.89$ 3,475,479$ 440,944$ 3,916,422$ -$ -$ 41,071$ 41,071$ 3,958,657$ 426,902$ 4,385,559$ 11,959.69$ 8,272,125$ 1,499,359$ 9,771,484$ -$ -$ 4,511,641$ 4,511,641$ 14,283,125$ 3,812,123$ 18,095,248$ 29,389.15$ 6,875,402$ 1,227,374$ 8,102,776$ -$ -$ 2,123,227$ 2,123,227$ 10,226,003$ 3,611,746$ 13,837,748$ 52,711.35$ 1,197,937$ 247,093$ 1,445,030$ -$ -$ 2,350,226$ 2,350,226$ 3,795,256$ 194,389$ 3,989,645$ 13,800.93$
198,786$ 24,892$ 223,677$ -$ -$ 38,188$ 38,188$ 261,866$ 5,989$ 267,854$ 15,403.87$ -$ -$ -$ -$ -$ -$ -$ -$ -$ -$
54,655,987$ 6,224,238$ 60,880,225$ -$ -$ 5,346,179$ 5,346,179$ 78,807,705$ 32,419,046$ 111,226,750$ 4,533.61$
Natural Gas Natural Gas DRIPE Total Gas Benefits Oil Propane WaterTotal Other Resource
Benefits
32,978,958$ 2,078,219$ 35,057,177$ 550,079$ 550,079$ 48,197,672$ 18,506,860$ 66,704,532$ 3,083.62$ 25,356,142$ 1,540,170$ 26,896,313$ 550,079$ 550,079$ 38,388,037$ 15,745,300$ 54,133,336$ 4,854.82$
3,390,239$ 193,889$ 3,584,128$ -$ -$ 3,954,091$ 2,577,556$ 6,531,647$ 8,237.69$ 1,299,143$ 91,912$ 1,391,055$ 149,621$ 149,621$ 1,555,208$ 1,118,864$ 2,674,072$ 1,585.33$
20,666,759$ 1,254,370$ 21,921,129$ 400,458$ 400,458$ 32,878,738$ 12,048,880$ 44,927,618$ 5,100.48$ -$ -$ -$ -$ -$ -$ -$ -$ -$ -$ -$ -$ -$ -$ -$ -$
7,622,816$ 538,048$ 8,160,865$ -$ -$ 9,809,635$ 2,761,560$ 12,571,196$ 1,270.18$ 7,622,816$ 538,048$ 8,160,865$ -$ -$ 9,809,635$ 2,761,560$ 12,571,196$ 1,270.18$
-$ -$ -$ -$ -$ -$ -$ -$ -$ -$ -$ -$ -$ -$ -$ -$
6,362,068$ 387,776$ 6,749,844$ 18,400$ 18,400$ 7,714,677$ 3,169,488$ 10,884,164$ 12,709.52$ 6,362,068$ 387,776$ 6,749,844$ 18,400$ 18,400$ 7,714,677$ 3,169,488$ 10,884,164$ 12,709.52$ 2,445,386$ 154,297$ 2,599,683$ -$ -$ 3,546,116$ 1,924,120$ 5,470,236$ 6,471.01$ 3,916,682$ 233,479$ 4,150,161$ 18,400$ 18,400$ 4,168,560$ 1,245,368$ 5,413,929$ 70,653.57$
20,961,817$ 1,929,120$ 22,890,937$ 791,399$ 791,399$ 23,685,957$ 5,805,143$ 29,491,100$ 8,241.46$ 6,759,007$ 466,755$ 7,225,762$ 44,230$ 44,230$ 7,273,614$ -$ 7,273,614$ 11,827.01$ 2,501,040$ 167,134$ 2,668,174$ -$ -$ 2,668,556$ -$ 2,668,556$ 9,530.56$ 4,257,967$ 299,621$ 4,557,588$ 44,230$ 44,230$ 4,605,058$ -$ 4,605,058$ 13,746.44$
14,202,810$ 1,462,365$ 15,665,174$ 747,169$ 747,169$ 16,412,343$ 5,805,143$ 22,217,486$ 7,265.31$ 12,104,386$ 1,230,875$ 13,335,261$ 389$ 389$ 13,335,650$ 5,359,730$ 18,695,380$ 37,043.47$
1,276,421$ 160,565$ 1,436,986$ 701,173$ 701,173$ 2,138,159$ 174,952$ 2,313,111$ 2,471.86$ 822,003$ 70,924$ 892,927$ 45,607$ 45,607$ 938,534$ 270,460$ 1,208,994$ 907.67$
-$ -$ -$ -$ -$ -$ -$ -$ 60,302,843$ 4,395,115$ 64,697,958$ 1,359,878$ 1,359,878$ 79,598,306$ 27,481,491$ 107,079,796$ 4,165.01$
2016 Evaluated BenefitsNon-Electric Resource Benefits
Total Resource Benefits
(Electric + Non-Electric)
Non-Electric, Non-Resource
BenefitsTotal Benefits
Resource Benefits per Participant
Natural Gas Benefits Other Resource Benefits
Non-Electric Resource BenefitsTotal Resource
Benefits (Electric +
Non-Electric)
Non-Electric, Non-Resource
Benefits
2017 Planned Benefits
Total BenefitsResource
Benefits per Participant
Natural Gas Benefits Other Resource Benefits
Bay State Gas Company d/b/a Columbia Gas of Massachusetts 2016 Energy Efficiency Plan-Year Report D.P.U. 17-100 May 1, 2017 Page 24 of 37

Program Benefits, Three-Year Total2016-2018 BenefitsCMAMay 1, 2017
A - ResidentialA1 - Residential Whole House
A1a - Residential New ConstructionA1b - Residential Multi-Family RetrofitA1c - Residential Home Energy Services - MeasuA1d - Residential Home Energy Services - RCSA1e - Residential Behavior/Feedback Program
A2 - Residential ProductsA2a - Residential Heating & Cooling EquipmentA2b - Residential Consumer ProductsA2c - Residential Lighting
B - Low-IncomeB1 - Low-Income Whole House
B1a - Low-Income Single Family RetrofitB1b - Low-Income Multi-Family Retrofit
C - Commercial & IndustrialC1 - C&I New Construction
C1a - C&I New Buildings & Major RenovationsC1b - C&I Initial Purchase & End of Useful Life
C2 - C&I RetrofitC2a - C&I Existing Building RetrofitC2b - C&I Small BusinessC2c - C&I Multifamily RetrofitC2d - C&I Upstream Lighting
Grand Total
A - ResidentialA1 - Residential Whole House
A1a - Residential New ConstructionA1b - Residential Multi-Family RetrofitA1c - Residential Home Energy Services - MeasuA1d - Residential Home Energy Services - RCSA1e - Residential Behavior/Feedback Program
A2 - Residential ProductsA2a - Residential Heating & Cooling EquipmentA2b - Residential Consumer ProductsA2c - Residential Lighting
B - Low-IncomeB1 - Low-Income Whole House
B1a - Low-Income Single Family RetrofitB1b - Low-Income Multi-Family Retrofit
C - Commercial & IndustrialC1 - C&I New Construction
C1a - C&I New Buildings & Major RenovationsC1b - C&I Initial Purchase & End of Useful Life
C2 - C&I RetrofitC2a - C&I Existing Building RetrofitC2b - C&I Small BusinessC2c - C&I Multifamily RetrofitC2d - C&I Upstream Lighting
Grand Total
Program
Program
Natural Gas Natural Gas DRIPE Total Gas Benefits Oil Propane WaterTotal Other Resource
Benefits
34,206,223$ 1,474,304$ 35,680,528$ 549,517$ 549,517$ 49,046,219$ 18,791,407$ 67,837,626$ 3,128.48$ 26,475,495$ 1,106,763$ 27,582,258$ 549,517$ 549,517$ 39,260,241$ 16,029,846$ 55,290,087$ 4,935.71$
4,232,078$ 172,624$ 4,404,703$ -$ -$ 4,822,870$ 2,878,271$ 7,701,140$ 8,997.89$ 1,316,991$ 61,796$ 1,378,787$ 149,621$ 149,621$ 1,543,342$ 1,118,864$ 2,662,206$ 1,573.23$
20,926,425$ 872,343$ 21,798,769$ 399,895$ 399,895$ 32,894,029$ 12,032,711$ 44,926,740$ 5,109.89$ -$ -$ -$ -$ -$ -$ -$ -$ -$ -$ -$ -$ -$ -$ -$ -$
7,730,729$ 367,541$ 8,098,269$ -$ -$ 9,785,978$ 2,761,560$ 12,547,539$ 1,267.12$ 7,730,729$ 367,541$ 8,098,269$ -$ -$ 9,785,978$ 2,761,560$ 12,547,539$ 1,267.12$
-$ -$ -$ -$ -$ -$ -$ -$ -$ -$ -$ -$ -$ -$ -$ -$
6,450,991$ 270,602$ 6,721,594$ 18,400$ 18,400$ 7,701,863$ 3,169,488$ 10,871,350$ 12,688.41$ 6,450,991$ 270,602$ 6,721,594$ 18,400$ 18,400$ 7,701,863$ 3,169,488$ 10,871,350$ 12,688.41$ 2,479,401$ 106,674$ 2,586,075$ -$ -$ 3,547,945$ 1,924,120$ 5,472,064$ 6,474.35$ 3,971,590$ 163,928$ 4,135,518$ 18,400$ 18,400$ 4,153,918$ 1,245,368$ 5,399,286$ 70,405.39$
21,528,913$ 1,311,385$ 22,840,298$ 788,061$ 788,061$ 23,631,976$ 5,762,777$ 29,394,753$ 8,032.62$ 7,200,567$ 356,858$ 7,557,425$ 44,230$ 44,230$ 7,605,272$ -$ 7,605,272$ 10,942.84$ 2,759,084$ 131,994$ 2,891,078$ -$ -$ 2,891,459$ -$ 2,891,459$ 9,327.29$ 4,441,483$ 224,864$ 4,666,347$ 44,230$ 44,230$ 4,713,813$ -$ 4,713,813$ 12,243.67$
14,328,346$ 954,527$ 15,282,873$ 743,831$ 743,831$ 16,026,704$ 5,762,777$ 21,789,481$ 7,132.49$ 12,207,175$ 802,010$ 13,009,185$ 389$ 389$ 13,009,574$ 5,323,536$ 18,333,110$ 36,441.38$
1,293,151$ 103,752$ 1,396,903$ 698,017$ 698,017$ 2,094,920$ 170,779$ 2,265,699$ 2,433.12$ 828,021$ 48,765$ 876,786$ 45,425$ 45,425$ 922,210$ 268,462$ 1,190,672$ 896.22$
-$ -$ -$ -$ -$ -$ -$ -$ 62,186,128$ 3,056,292$ 65,242,420$ 1,355,977$ 1,355,977$ 80,380,057$ 27,723,672$ 108,103,729$ 4,180.73$
Natural Gas Natural Gas DRIPE Total Gas Benefits Oil Propane WaterTotal Other Resource
Benefits
103,716,581$ 7,217,635$ 110,934,216$ -$ -$ 1,862,888$ 1,862,888$ 149,736,421$ 57,574,975$ 207,311,396$ 3,295.58$ 80,857,349$ 5,456,555$ 86,313,904$ -$ -$ 1,862,304$ 1,862,304$ 119,682,378$ 49,865,864$ 169,548,242$ 4,960$ 10,676,201$ 642,695$ 11,318,896$ -$ -$ -$ -$ 12,336,925$ 9,711,734$ 22,048,659$ 6,824$
4,345,695$ 353,867$ 4,699,562$ -$ -$ 436,053$ 436,053$ 5,165,080$ 3,401,293$ 8,566,373$ 1,438$ 65,835,453$ 4,459,992$ 70,295,445$ -$ -$ 1,426,250$ 1,426,250$ 102,180,373$ 36,752,837$ 138,933,210$ 5,455$
-$ -$ -$ -$ -$ -$ -$ -$ -$ -$ -$ -$ -$ -$ -$ -$ -$ -$ -$ -$
22,859,232$ 1,761,080$ 24,620,312$ -$ -$ 584$ 584$ 30,054,043$ 7,709,111$ 37,763,153$ 1,411$ 22,859,232$ 1,761,080$ 24,620,312$ -$ -$ 584$ 584$ 30,054,043$ 7,709,111$ 37,763,153$ 1,411$
-$ -$ -$ -$ -$ -$ -$ -$ -$ -$ -$ -$ -$ -$ -$ -$ -$ -$ -$ -$
18,840,633$ 1,227,768$ 20,068,401$ -$ -$ 37,751$ 37,751$ 23,061,865$ 14,084,928$ 37,146,793$ 6,348$ 18,840,633$ 1,227,768$ 20,068,401$ -$ -$ 37,751$ 37,751$ 23,061,865$ 14,084,928$ 37,146,793$ 6,348$
7,533,003$ 518,445$ 8,051,448$ -$ -$ -$ -$ 11,007,161$ 10,236,409$ 21,243,570$ 6,429$ 11,307,629$ 709,323$ 12,016,953$ -$ -$ 37,751$ 37,751$ 12,054,704$ 3,848,519$ 15,903,223$ 6,275$ 54,587,744$ 5,230,241$ 59,817,985$ -$ -$ 6,161,395$ 6,161,395$ 65,987,782$ 15,964,305$ 81,952,087$ 9,920$ 17,784,463$ 1,313,991$ 19,098,454$ -$ -$ 158,755$ 158,755$ 19,265,611$ 584,262$ 19,849,873$ 11,606$
5,609,535$ 348,562$ 5,958,097$ -$ -$ 29,224$ 29,224$ 5,988,083$ 157,360$ 6,145,442$ 9,833$ 12,174,928$ 965,429$ 13,140,357$ -$ -$ 129,531$ 129,531$ 13,277,528$ 426,902$ 13,704,431$ 12,633$ 36,803,281$ 3,916,250$ 40,719,531$ -$ -$ 6,002,640$ 6,002,640$ 46,722,171$ 15,380,043$ 62,102,214$ 9,359$ 31,186,963$ 3,260,259$ 34,447,222$ -$ -$ 2,124,004$ 2,124,004$ 36,571,226$ 14,295,012$ 50,866,238$ 40,144$
3,767,509$ 511,410$ 4,278,919$ -$ -$ 3,749,416$ 3,749,416$ 8,028,335$ 540,120$ 8,568,455$ 4,012$ 1,848,809$ 144,581$ 1,993,390$ -$ -$ 129,220$ 129,220$ 2,122,610$ 544,911$ 2,667,521$ 1,020$
-$ -$ -$ -$ -$ -$ -$ -$ -$ -$ 177,144,958$ 13,675,644$ 190,820,602$ -$ -$ 8,062,034$ 8,062,034$ 238,786,068$ 87,624,208$ 326,410,276$ 4,285$
Non-Electric, Non-Resource
BenefitsTotal Benefits
Resource Benefits per Participant
Natural Gas Benefits Other Resource Benefits
2018 Planned BenefitsNon-Electric Resource Benefits
Total Resource Benefits
(Electric + Non-Electric)
Non-Electric, Non-Resource
BenefitsTotal Benefits
Resource Benefits per Participant
Natural Gas Benefits Other Resource Benefits
2016-2018 BenefitsNon-Electric Resource Benefits
Total Resource Benefits
(Electric + Non-Electric)
Bay State Gas Company d/b/a Columbia Gas of Massachusetts 2016 Energy Efficiency Plan-Year Report D.P.U. 17-100 May 1, 2017 Page 25 of 37

Cost-Effectiveness, Plan Year Summary2016 Planned vs. EvaluatedCMAMay 1, 2017
Total Program Costs Performance Incentive Participant CostsTotal TRC Test
CostsA - Residential 2.18 36,003,483 66,575,024 20,487,754 776,264 9,307,523 30,571,540
A1 - Residential Whole House 2.56 32,829,901 53,903,665 15,351,855 670,993 5,050,917 21,073,764 A1a - Residential New Construction 2.47 3,565,924 5,995,657 812,241 70,332 1,547,160 2,429,733 A1b - Residential Multi-Family Retrofit 1.87 1,336,661 2,874,206 1,606,798 29,453 (98,706) 1,537,545 A1c - Residential Home Energy Services - Measures 3.11 30,540,046 45,033,802 10,320,086 571,208 3,602,462 14,493,755 A1d - Residential Home Energy Services - RCS 0.00 (2,612,730) - 2,612,730 - - 2,612,730 A1e - Residential Behavior/Feedback Program - - - - - -
A2 - Residential Products 1.42 3,742,645 12,671,359 4,566,836 105,271 4,256,606 8,928,714 A2a - Residential Heating & Cooling Equipment 1.42 3,742,645 12,671,359 4,566,836 105,271 4,256,606 8,928,714 A2b - Residential Consumer Products - - - - - - A2c - Residential Lighting - - - - - -
A3 - Residential Hard-to-Measure 0.00 (569,063) - 569,063 - - 569,063 B - Low-Income 1.52 3,768,332 11,051,359 7,174,103 108,924 - 7,283,027
B1 - Low-Income Whole House 1.56 3,950,660 11,051,359 6,991,776 108,924 - 7,100,700 B1a - Low-Income Single Family Retrofit 1.42 1,618,540 5,491,106 3,824,912 47,654 - 3,872,566 B1b - Low-Income Multi-Family Retrofit 1.72 2,332,119 5,560,253 3,166,864 61,270 - 3,228,134
B2 - Low-Income Hard-to-Measure 0.00 (182,328) - 182,328 - - 182,328 C - Commercial & Industrial 2.74 19,035,527 29,958,031 7,592,090 374,901 2,955,513 10,922,504
C1 - C&I New Construction 1.87 3,183,688 6,823,343 2,328,421 72,887 1,238,347 3,639,655 C1a - C&I New Buildings & Major Renovations 2.00 1,116,879 2,239,190 745,493 24,671 352,148 1,122,312 C1b - C&I Initial Purchase & End of Useful Life 1.82 2,066,809 4,584,153 1,582,928 48,216 886,200 2,517,343
C2 - C&I Retrofit 3.26 16,027,786 23,134,688 5,087,722 302,015 1,717,165 7,106,902 C2a - C&I Existing Building Retrofit 3.56 13,976,874 19,439,154 3,609,982 259,111 1,593,187 5,462,280 C2b - C&I Small Business 2.77 1,556,762 2,437,906 707,007 30,440 143,698 881,144 C2c - C&I Multifamily Retrofit 1.65 494,150 1,257,628 770,733 12,464 (19,719) 763,477 C2d - C&I Upstream Lighting - - - - - -
C3 - C&I Hard-to-Measure 0.00 (175,948) - 175,948 - - 175,948 Grand Total 2.21 58,807,342 107,584,414 35,253,948 1,260,089 12,263,035 48,777,072
Total Program Costs Performance Incentive Participant CostsTotal TRC Test
CostsA - Residential 1.70 29,860,707 72,769,238 27,155,124 777,183 14,976,224 42,908,531
A1 - Residential Whole House 1.77 26,196,840 60,124,819 22,557,433 657,593 10,712,953 33,927,979 A1a - Residential New Construction 1.41 2,272,188 7,815,871 2,118,207 71,825 3,353,652 5,543,683 A1b - Residential Multi-Family Retrofit 1.90 1,528,464 3,230,096 1,842,994 34,579 (175,942) 1,701,632 A1c - Residential Home Energy Services - Measures 2.16 26,327,542 49,078,852 14,664,878 551,188 7,535,244 22,751,310 A1d - Residential Home Energy Services - RCS 0.00 (3,931,354) - 3,931,354 - - 3,931,354 A1e - Residential Behavior/Feedback Program - - - - - -
A2 - Residential Products 1.48 4,084,458 12,644,419 4,177,099 119,591 4,263,271 8,559,961 A2a - Residential Heating & Cooling Equipment 1.48 4,084,458 12,644,419 4,177,099 119,591 4,263,271 8,559,961 A2b - Residential Consumer Products - - - - - - A2c - Residential Lighting - - - - - -
A3 - Residential Hard-to-Measure 0.00 (420,591) - 420,591 - - 420,591 B - Low-Income 2.19 8,364,338 15,391,278 6,852,117 174,823 - 7,026,940
B1 - Low-Income Whole House 2.23 8,493,429 15,391,278 6,723,025 174,823 - 6,897,849 B1a - Low-Income Single Family Retrofit 2.85 6,684,356 10,301,270 3,491,602 125,312 - 3,616,914 B1b - Low-Income Multi-Family Retrofit 1.55 1,809,074 5,090,008 3,231,424 49,511 - 3,280,935
B2 - Low-Income Hard-to-Measure 0.00 (129,092) - 129,092 - - 129,092 C - Commercial & Industrial 2.68 14,446,906 23,066,234 5,343,575 277,582 2,998,171 8,619,328
C1 - C&I New Construction 1.88 2,325,326 4,970,987 2,115,716 52,993 476,952 2,645,661 C1a - C&I New Buildings & Major Renovations 1.50 194,275 585,428 298,366 5,580 87,207 391,153 C1b - C&I Initial Purchase & End of Useful Life 1.95 2,131,051 4,385,559 1,817,350 47,413 389,745 2,254,508
C2 - C&I Retrofit 3.10 12,266,477 18,095,248 3,082,962 224,590 2,521,219 5,828,771 C2a - C&I Existing Building Retrofit 2.92 9,099,485 13,837,748 2,211,485 169,333 2,357,446 4,738,263 C2b - C&I Small Business 4.94 3,181,646 3,989,645 590,587 53,457 163,955 807,999 C2c - C&I Multifamily Retrofit 0.95 (14,655) 267,854 280,891 1,800 (182) 282,509 C2d - C&I Upstream Lighting - - - - - -
C3 - C&I Hard-to-Measure 0.00 (144,896) - 144,896 - - 144,896 Grand Total 1.90 52,671,950 111,226,750 39,350,815 1,229,589 17,974,396 58,554,800
Costs
2016 Evaluated Total Resource Cost Test (2016$)Benefit-Cost
RatioNet Benefits
Total TRC Test Benefits
CostsProgram
2016 Planned Total Resource Cost Test (2016$)
Program Benefit-Cost Ratio
Net BenefitsTotal TRC Test
Benefits
Bay State Gas Company d/b/a Columbia Gas of Massachusetts 2016 Energy Efficiency Plan-Year Report D.P.U. 17-100 May 1, 2017 Page 26 of 37

Cost-Effectiveness, Plan Year Summary2016 Planned vs. EvaluatedCMAMay 1, 2017
Total Program Costs Performance Incentive Participant CostsTotal TRC Test
CostsA - Residential -22% -17% 9% 33% 0% 61% 40%
A1 - Residential Whole House -31% -20% 12% 47% -2% 112% 61%A1a - Residential New Construction -43% -36% 30% 161% 2% 117% 128%A1b - Residential Multi-Family Retrofit 2% 14% 12% 15% 17% 78% 11%A1c - Residential Home Energy Services - Measures -31% -14% 9% 42% -4% 109% 57%A1d - Residential Home Energy Services - RCS 50% 50% 50%A1e - Residential Behavior/Feedback Program
A2 - Residential Products 4% 9% 0% -9% 14% 0% -4%A2a - Residential Heating & Cooling Equipment 4% 9% 0% -9% 14% 0% -4%A2b - Residential Consumer ProductsA2c - Residential Lighting
A3 - Residential Hard-to-Measure -26% -26% -26%B - Low-Income 44% 122% 39% -4% 61% -4%
B1 - Low-Income Whole House 43% 115% 39% -4% 61% -3%B1a - Low-Income Single Family Retrofit 101% 313% 88% -9% 163% -7%B1b - Low-Income Multi-Family Retrofit -10% -22% -8% 2% -19% 2%
B2 - Low-Income Hard-to-Measure -29% -29% -29%C - Commercial & Industrial -2% -24% -23% -30% -26% 1% -21%
C1 - C&I New Construction 0% -27% -27% -9% -27% -61% -27%C1a - C&I New Buildings & Major Renovations -25% -83% -74% -60% -77% -75% -65%C1b - C&I Initial Purchase & End of Useful Life 7% 3% -4% 15% -2% -56% -10%
C2 - C&I Retrofit -5% -23% -22% -39% -26% 47% -18%C2a - C&I Existing Building Retrofit -18% -35% -29% -39% -35% 48% -13%C2b - C&I Small Business 78% 104% 64% -16% 76% 14% -8%C2c - C&I Multifamily Retrofit -42% -103% -79% -64% -86% -99% -63%C2d - C&I Upstream Lighting
C3 - C&I Hard-to-Measure -18% -18% -18%Grand Total -14% -10% 3% 12% -2% 47% 20%
Notes• The Green Communities Act requires that energy efficiency programs be cost-effective. G.L. c. 25, §§ 21(a), 21(b)(3). If a core initiative is not cost-effective, the Program Administrator has provided an explanation in its report filing.• The plan year variances provided above are intended to indicate the Program Administrator's performance in the plan year only. The variances used to determine significant variances are provided separately. The variances above and the significant variances use different calculations to determine variances on an annual basis and over the three-year term, respectively.
Total TRC Test Benefits
CostsProgram
2016 Planned v. Evaluated Total Resource Cost Test (2016$) Variances (%)Benefit-Cost
RatioNet Benefits
Bay State Gas Company d/b/a Columbia Gas of Massachusetts 2016 Energy Efficiency Plan-Year Report D.P.U. 17-100 May 1, 2017 Page 27 of 37

Cost-Effectiveness, Three-Year Total2016-2018 Total Resource Cost Test (2016$)CMAMay 1, 2017
Total Program Costs Performance Incentive Participant CostsTotal TRC Test
CostsA - Residential 1.70 29,860,707 72,769,238 27,155,124 777,183 14,976,224 42,908,531
A1 - Residential Whole House 1.77 26,196,840 60,124,819 22,557,433 657,593 10,712,953 33,927,979 A1a - Residential New Construction 1.41 2,272,188 7,815,871 2,118,207 71,825 3,353,652 5,543,683 A1b - Residential Multi-Family Retrofit 1.90 1,528,464 3,230,096 1,842,994 34,579 (175,942) 1,701,632 A1c - Residential Home Energy Services - Measures 2.16 26,327,542 49,078,852 14,664,878 551,188 7,535,244 22,751,310 A1d - Residential Home Energy Services - RCS 0.00 (3,931,354) - 3,931,354 - - 3,931,354 A1e - Residential Behavior/Feedback Program - - - - - -
A2 - Residential Products 1.48 4,084,458 12,644,419 4,177,099 119,591 4,263,271 8,559,961 A2a - Residential Heating & Cooling Equipment 1.48 4,084,458 12,644,419 4,177,099 119,591 4,263,271 8,559,961 A2b - Residential Consumer Products - - - - - - A2c - Residential Lighting - - - - - -
A3 - Residential Hard-to-Measure 0.00 (420,591) - 420,591 - - 420,591 B - Low-Income 2.19 8,364,338 15,391,278 6,852,117 174,823 - 7,026,940
B1 - Low-Income Whole House 2.23 8,493,429 15,391,278 6,723,025 174,823 - 6,897,849 B1a - Low-Income Single Family Retrofit 2.85 6,684,356 10,301,270 3,491,602 125,312 - 3,616,914 B1b - Low-Income Multi-Family Retrofit 1.55 1,809,074 5,090,008 3,231,424 49,511 - 3,280,935
B2 - Low-Income Hard-to-Measure 0.00 (129,092) - 129,092 - - 129,092 C - Commercial & Industrial 2.68 14,446,906 23,066,234 5,343,575 277,582 2,998,171 8,619,328
C1 - C&I New Construction 1.88 2,325,326 4,970,987 2,115,716 52,993 476,952 2,645,661 C1a - C&I New Buildings & Major Renovations 1.50 194,275 585,428 298,366 5,580 87,207 391,153 C1b - C&I Initial Purchase & End of Useful Life 1.95 2,131,051 4,385,559 1,817,350 47,413 389,745 2,254,508
C2 - C&I Retrofit 3.10 12,266,477 18,095,248 3,082,962 224,590 2,521,219 5,828,771 C2a - C&I Existing Building Retrofit 2.92 9,099,485 13,837,748 2,211,485 169,333 2,357,446 4,738,263 C2b - C&I Small Business 4.94 3,181,646 3,989,645 590,587 53,457 163,955 807,999 C2c - C&I Multifamily Retrofit 0.95 (14,655) 267,854 280,891 1,800 (182) 282,509 C2d - C&I Upstream Lighting - - - - - -
C3 - C&I Hard-to-Measure 0.00 (144,896) - 144,896 - - 144,896 Grand Total 1.90 52,671,950 111,226,750 39,350,815 1,229,589 17,974,396 58,554,800
Total Program Costs Performance Incentive Participant CostsTotal TRC Test
CostsA - Residential 2.19 36,281,541 66,704,532 20,328,211 779,855 9,314,925 30,422,991
A1 - Residential Whole House 2.56 32,992,433 54,133,336 15,303,584 673,560 5,163,759 21,140,903 A1a - Residential New Construction 2.51 3,926,633 6,531,647 863,020 77,072 1,664,922 2,605,014 A1b - Residential Multi-Family Retrofit 1.86 1,235,576 2,674,072 1,506,378 27,321 (95,204) 1,438,495 A1c - Residential Home Energy Services - Measures 3.10 30,440,812 44,927,618 10,323,599 569,168 3,594,040 14,486,806 A1d - Residential Home Energy Services - RCS 0.00 (2,610,588) - 2,610,588 - - 2,610,588 A1e - Residential Behavior/Feedback Program - - - - - -
A2 - Residential Products 1.44 3,861,439 12,571,196 4,452,296 106,294 4,151,167 8,709,757 A2a - Residential Heating & Cooling Equipment 1.44 3,861,439 12,571,196 4,452,296 106,294 4,151,167 8,709,757 A2b - Residential Consumer Products - - - - - - A2c - Residential Lighting - - - - - -
A3 - Residential Hard-to-Measure 0.00 (572,330) - 572,330 - - 572,330 B - Low-Income 1.52 3,705,599 10,884,164 7,071,313 107,252 - 7,178,565
B1 - Low-Income Whole House 1.56 3,886,618 10,884,164 6,890,294 107,252 - 6,997,546 B1a - Low-Income Single Family Retrofit 1.44 1,673,271 5,470,236 3,748,327 48,639 - 3,796,965 B1b - Low-Income Multi-Family Retrofit 1.69 2,213,348 5,413,929 3,141,968 58,613 - 3,200,581
B2 - Low-Income Hard-to-Measure 0.00 (181,019) - 181,019 - - 181,019 C - Commercial & Industrial 2.71 18,590,104 29,491,100 7,516,526 367,793 3,016,677 10,900,996
C1 - C&I New Construction 1.92 3,478,619 7,273,614 2,367,961 78,560 1,348,474 3,794,995 C1a - C&I New Buildings & Major Renovations 2.22 1,464,930 2,668,556 784,042 30,817 388,766 1,203,625 C1b - C&I Initial Purchase & End of Useful Life 1.78 2,013,689 4,605,058 1,583,918 47,744 959,708 2,591,370
C2 - C&I Retrofit 3.21 15,287,076 22,217,486 4,972,974 289,233 1,668,203 6,930,410 C2a - C&I Existing Building Retrofit 3.51 13,361,742 18,695,380 3,537,957 248,646 1,547,036 5,333,639 C2b - C&I Small Business 2.70 1,457,912 2,313,111 686,334 28,700 140,166 855,200 C2c - C&I Multifamily Retrofit 1.63 467,423 1,208,994 748,684 11,887 (18,999) 741,571 C2d - C&I Upstream Lighting - - - - - -
C3 - C&I Hard-to-Measure 0.00 (175,591) - 175,591 - - 175,591 Grand Total 2.21 58,577,244 107,079,796 34,916,051 1,254,900 12,331,602 48,502,552
2017 Planned Total Resource Cost Test (2016$)
Program Benefit-Cost Ratio
Net BenefitsTotal TRC Test
Benefits
Costs
2016 Evaluated Total Resource Cost Test (2016$)
Program Benefit-Cost Ratio
Net BenefitsTotal TRC Test
Benefits
Costs
Bay State Gas Company d/b/a Columbia Gas of Massachusetts 2016 Energy Efficiency Plan-Year Report D.P.U. 17-100 May 1, 2017 Page 28 of 37

Cost-Effectiveness, Three-Year Total2016-2018 Total Resource Cost Test (2016$)CMAMay 1, 2017
Total Program Costs Performance Incentive Participant CostsTotal TRC Test
CostsA - Residential 2.25 37,688,422 67,837,626 20,087,755 800,436 9,261,013 30,149,204
A1 - Residential Whole House 2.62 34,214,785 55,290,087 15,170,957 691,669 5,212,675 21,075,301 A1a - Residential New Construction 2.71 4,864,027 7,701,140 937,866 93,386 1,805,862 2,837,114 A1b - Residential Multi-Family Retrofit 1.88 1,243,248 2,662,206 1,485,329 27,385 (93,756) 1,418,958 A1c - Residential Home Energy Services - Measures 3.16 30,712,955 44,926,740 10,142,318 570,898 3,500,568 14,213,785 A1d - Residential Home Energy Services - RCS 0.00 (2,605,445) - 2,605,445 - - 2,605,445 A1e - Residential Behavior/Feedback Program - - - - - -
A2 - Residential Products 1.48 4,041,601 12,547,539 4,348,833 108,766 4,048,339 8,505,938 A2a - Residential Heating & Cooling Equipment 1.48 4,041,601 12,547,539 4,348,833 108,766 4,048,339 8,505,938 A2b - Residential Consumer Products - - - - - - A2c - Residential Lighting - - - - - -
A3 - Residential Hard-to-Measure 0.00 (567,965) - 567,965 - - 567,965 B - Low-Income 1.52 3,700,543 10,871,350 7,063,666 107,142 - 7,170,807
B1 - Low-Income Whole House 1.56 3,882,059 10,871,350 6,882,149 107,142 - 6,989,291 B1a - Low-Income Single Family Retrofit 1.45 1,685,483 5,472,064 3,737,700 48,881 - 3,786,581 B1b - Low-Income Multi-Family Retrofit 1.69 2,196,576 5,399,286 3,144,449 58,261 - 3,202,710
B2 - Low-Income Hard-to-Measure 0.00 (181,516) - 181,516 - - 181,516 C - Commercial & Industrial 2.70 18,511,317 29,394,753 7,434,761 366,531 3,082,145 10,883,437
C1 - C&I New Construction 1.94 3,680,908 7,605,272 2,394,697 82,626 1,447,041 3,924,364 C1a - C&I New Buildings & Major Renovations 2.36 1,668,088 2,891,459 791,766 34,256 397,349 1,223,371 C1b - C&I Initial Purchase & End of Useful Life 1.75 2,012,820 4,713,813 1,602,931 48,370 1,049,692 2,700,993
C2 - C&I Retrofit 3.21 15,004,921 21,789,481 4,865,551 283,905 1,635,104 6,784,560 C2a - C&I Existing Building Retrofit 3.51 13,111,812 18,333,110 3,461,632 244,024 1,515,642 5,221,298 C2b - C&I Small Business 2.69 1,424,791 2,265,699 674,570 28,088 138,250 840,908 C2c - C&I Multifamily Retrofit 1.65 468,318 1,190,672 729,349 11,793 (18,788) 722,354 C2d - C&I Upstream Lighting - - - - - -
C3 - C&I Hard-to-Measure 0.00 (174,513) - 174,513 - - 174,513 Grand Total 2.24 59,900,281 108,103,729 34,586,181 1,274,109 12,343,158 48,203,448
Total Program Costs Performance Incentive Participant CostsTotal TRC Test
CostsA - Residential 2.00 103,830,670 207,311,396 67,571,089 2,357,474 33,552,163 103,480,726
A1 - Residential Whole House 2.23 93,404,058 169,548,242 53,031,975 2,022,822 21,089,387 76,144,184 A1a - Residential New Construction 2.01 11,062,848 22,048,659 3,919,093 242,282 6,824,436 10,985,811 A1b - Residential Multi-Family Retrofit 1.88 4,007,288 8,566,373 4,834,701 89,285 (364,901) 4,559,085 A1c - Residential Home Energy Services - Measures 2.70 87,481,309 138,933,210 35,130,795 1,691,255 14,629,852 51,451,902 A1d - Residential Home Energy Services - RCS 0.00 (9,147,386) - 9,147,386 - - 9,147,386 A1e - Residential Behavior/Feedback Program - - - - - -
A2 - Residential Products 1.47 11,987,498 37,763,153 12,978,228 334,652 12,462,776 25,775,656 A2a - Residential Heating & Cooling Equipment 1.47 11,987,498 37,763,153 12,978,228 334,652 12,462,776 25,775,656 A2b - Residential Consumer Products - - - - - - A2c - Residential Lighting - - - - - -
A3 - Residential Hard-to-Measure 0.00 (1,560,886) - 1,560,886 - - 1,560,886 B - Low-Income 1.74 15,770,480 37,146,793 20,987,096 389,217 - 21,376,313
B1 - Low-Income Whole House 1.78 16,262,107 37,146,793 20,495,469 389,217 - 20,884,686 B1a - Low-Income Single Family Retrofit 1.90 10,043,109 21,243,570 10,977,629 222,832 - 11,200,461 B1b - Low-Income Multi-Family Retrofit 1.64 6,218,997 15,903,223 9,517,840 166,385 - 9,684,225
B2 - Low-Income Hard-to-Measure 0.00 (491,627) - 491,627 - - 491,627 C - Commercial & Industrial 2.70 51,548,326 81,952,087 20,294,861 1,011,907 9,096,993 30,403,761
C1 - C&I New Construction 1.92 9,484,853 19,849,873 6,878,374 214,179 3,272,467 10,365,020 C1a - C&I New Buildings & Major Renovations 2.18 3,327,293 6,145,442 1,874,174 70,653 873,322 2,818,149 C1b - C&I Initial Purchase & End of Useful Life 1.82 6,157,559 13,704,431 5,004,200 143,527 2,399,145 7,546,871
C2 - C&I Retrofit 3.18 42,558,473 62,102,214 12,921,488 797,727 5,824,526 19,543,741 C2a - C&I Existing Building Retrofit 3.33 35,573,039 50,866,238 9,211,073 662,003 5,420,124 15,293,200 C2b - C&I Small Business 3.42 6,064,349 8,568,455 1,951,491 110,245 442,371 2,504,107 C2c - C&I Multifamily Retrofit 1.53 921,086 2,667,521 1,758,924 25,480 (37,969) 1,746,435 C2d - C&I Upstream Lighting - - - - - -
C3 - C&I Hard-to-Measure 0.00 (495,000) - 495,000 - - 495,000 Grand Total 2.10 171,149,476 326,410,276 108,853,047 3,758,597 42,649,156 155,260,800
Notes• The Green Communities Act requires that energy efficiency programs be cost-effective. G.L. c. 25, §§ 21(a), 21(b)(3). If a core initiative is not cost-effective, the Program Administrator has provided an explanation in its report filing.
2018 Planned Total Resource Cost Test (2016$)
Program Benefit-Cost Ratio
Net BenefitsTotal TRC Test
Benefits
Costs
2016-2018 Total Resource Cost Test (2016$)
Program Benefit-Cost Ratio
Net BenefitsTotal TRC Test
Benefits
Costs
Bay State Gas Company d/b/a Columbia Gas of Massachusetts 2016 Energy Efficiency Plan-Year Report D.P.U. 17-100 May 1, 2017 Page 29 of 37

Core Initiatives, Plan Year SummaryResidential ProgramsCMAMay 1, 2017
Metric Units Planned Preliminary Evaluated Plan v Preliminary
Plan v Evaluated
Preliminary v Evaluated
Metric Units Planned Preliminary Evaluated Plan v Preliminary
Plan v Evaluated
Preliminary v Evaluated
Annual Energy MWh 120 342 110 186% -8% -68% Annual Energy MWh 162 208 208 28% 28% 0%Lifetime Energy MWh 2,997 7,987 2,000 167% -33% -75% Lifetime Energy MWh 2,466 3,157 3,157 28% 28% 0%Annual Natural Gas Therms 153,976 367,029 159,795 138% 4% -56% Annual Natural Gas Therms 511,969 526,096 526,096 3% 3% 0%Lifetime Natural Gas Therms 3,548,020 8,680,260 3,565,415 145% 0% -59% Lifetime Natural Gas Therms 9,017,344 9,086,658 9,086,658 1% 1% 0%Total Benefits 2016$ 5,995,657 13,288,315 7,815,871 122% 30% -41% Total Benefits 2016$ 12,671,359 12,644,419 12,644,419 0% 0% 0%Total Program Costs nominal$ 812,241 2,118,207 2,118,207 161% 161% 0% Total Program Costs nominal$ 4,566,836 4,177,099 4,177,099 -9% -9% 0%Total Resource Costs 2016$ 2,429,733 5,543,683 5,543,683 128% 128% 0% Total Resource Costs 2016$ 8,928,714 8,559,961 8,559,961 -4% -4% 0%Benefit Cost Ratio B/C 2.47 2.40 1.41 -3% -43% -41% Benefit Cost Ratio B/C 1.42 1.48 1.48 4% 4% 0%
Metric Units Planned Preliminary Evaluated Plan v Preliminary
Plan v Evaluated
Preliminary v Evaluated
Metric Units Planned Preliminary Evaluated Plan v Preliminary
Plan v Evaluated
Preliminary v Evaluated
Annual Energy MWh 2 - - -100% -100% Annual Energy MWh - - - Lifetime Energy MWh 23 - - -100% -100% Lifetime Energy MWh - - - Annual Natural Gas Therms 96,553 85,642 126,192 -11% 31% 47% Annual Natural Gas Therms - - - Lifetime Natural Gas Therms 1,612,228 1,414,538 2,057,373 -12% 28% 45% Lifetime Natural Gas Therms - - - Total Benefits 2016$ 2,874,206 2,626,878 3,230,096 -9% 12% 23% Total Benefits 2016$ - - - Total Program Costs nominal$ 1,606,798 1,842,994 1,842,994 15% 15% 0% Total Program Costs nominal$ - - - Total Resource Costs 2016$ 1,537,545 1,701,632 1,701,632 11% 11% 0% Total Resource Costs 2016$ - - - Benefit Cost Ratio B/C 1.87 1.54 1.90 -17% 2% 23% Benefit Cost Ratio B/C
Metric Units Planned Preliminary Evaluated Plan v Preliminary
Plan v Evaluated
Preliminary v Evaluated
Metric Units Planned Preliminary Evaluated Plan v Preliminary
Plan v Evaluated
Preliminary v Evaluated
Annual Energy MWh 1,476 1,242 1,239 -16% -16% 0% Annual Energy MWh - - - Lifetime Energy MWh 33,848 30,169 30,091 -11% -11% 0% Lifetime Energy MWh - - - Annual Natural Gas Therms 1,146,114 1,402,782 1,402,782 22% 22% 0% Annual Natural Gas Therms - - - Lifetime Natural Gas Therms 23,604,364 28,247,163 28,247,163 20% 20% 0% Lifetime Natural Gas Therms - - - Total Benefits 2016$ 45,033,802 49,088,388 49,078,852 9% 9% 0% Total Benefits 2016$ - - - Total Program Costs nominal$ 10,320,086 14,664,878 14,664,878 42% 42% 0% Total Program Costs nominal$ - - - Total Resource Costs 2016$ 14,493,755 22,751,310 22,751,310 57% 57% 0% Total Resource Costs 2016$ - - - Benefit Cost Ratio B/C 3.11 2.16 2.16 -31% -31% 0% Benefit Cost Ratio B/C
Metric Units Planned Preliminary Evaluated Plan v Preliminary
Plan v Evaluated
Preliminary v Evaluated
Annual Energy MWh - - - Lifetime Energy MWh - - - Annual Natural Gas Therms - - - Lifetime Natural Gas Therms - - - Total Benefits 2016$ - - - Total Program Costs nominal$ - - - Total Resource Costs 2016$ - - - Benefit Cost Ratio B/C
Notes• The plan year variances provided above are intended to indicate the Program Administrator's performance in the plan year only. The variances used to determine significant variances are provided separately. The variances above and the significant variances use different calculations to determine variances on an annual basis and over the three-year term, respectively.
A1e - Residential Behavior/Feedback Program
A1 - Residential Whole, 2016 SummaryA1a - Residential New Construction
A1b - Residential Multi-Family Retrofit
A1c - Residential Home Energy Services - Measures
A2a - Residential Heating & Cooling Equipment
A2b - Residential Consumer Products
A2c - Residential Lighting
A2 - Residential Products, 2016 Summary
Bay State Gas Company d/b/a Columbia Gas of Massachusetts 2016 Energy Efficiency Plan-Year Report D.P.U. 17-100 May 1, 2017 Page 30 of 37

Core Initiatives, Plan Year SummaryLow-Income ProgramsCMAMay 1, 2017
Metric Units Planned Preliminary Evaluated Plan v Preliminary
Plan v Evaluated
Preliminary v Evaluated
Annual Energy MWh 143 158 158 11% 11% 0%Lifetime Energy MWh 2,819 3,128 3,128 11% 11% 0%Annual Natural Gas Therms 143,354 155,495 155,495 8% 8% 0%Lifetime Natural Gas Therms 2,826,030 3,070,656 3,070,656 9% 9% 0%Total Benefits 2016$ 5,491,106 5,963,229 10,301,270 9% 88% 73%Total Program Costs nominal$ 3,824,912 3,491,602 3,491,602 -9% -9% 0%Total Resource Costs 2016$ 3,872,566 3,616,914 3,616,914 -7% -7% 0%Benefit Cost Ratio B/C 1.42 1.65 2.85 16% 101% 73%
Metric Units Planned Preliminary Evaluated Plan v Preliminary
Plan v Evaluated
Preliminary v Evaluated
Annual Energy MWh - - - Lifetime Energy MWh - - - Annual Natural Gas Therms 212,874 182,104 182,104 -14% -14% 0%Lifetime Natural Gas Therms 4,555,821 3,990,925 3,990,924 -12% -12% 0%Total Benefits 2016$ 5,560,253 5,090,009 5,090,008 -8% -8% 0%Total Program Costs nominal$ 3,166,864 3,231,424 3,231,424 2% 2% 0%Total Resource Costs 2016$ 3,228,134 3,280,935 3,280,935 2% 2% 0%Benefit Cost Ratio B/C 1.72 1.55 1.55 -10% -10% 0%
Notes• The plan year variances provided above are intended to indicate the Program Administrator's performance in the plan year only. The variances used to determine significant variances are provided separately. The variances above and the significant variances use different calculations to determine variances on an annual basis and over the three-year term, respectively.
B1a - Low-Income Single Family Retrofit
B1b - Low-Income Multi-Family Retrofit
B1 - Low-Income Whole House, 2016 Summary
Bay State Gas Company d/b/a Columbia Gas of Massachusetts 2016 Energy Efficiency Plan-Year Report D.P.U. 17-100 May 1, 2017 Page 31 of 37

Core Initiatives, Plan Year SummaryC&I ProgramsCMAMay 1, 2017
Metric Units Planned Preliminary Evaluated Plan v Preliminary
Plan v Evaluated
Preliminary v Evaluated
Metric Units Planned Preliminary Evaluated Plan v Preliminary
Plan v Evaluated
Preliminary v Evaluated
Annual Energy MWh 0 - - -100% -100% Annual Energy MWh - - - Lifetime Energy MWh 4 - - -100% -100% Lifetime Energy MWh - - - Annual Natural Gas Therms 114,840 37,029 36,813 -68% -68% -1% Annual Natural Gas Therms 1,282,188 818,481 801,756 -36% -37% -2%Lifetime Natural Gas Therms 2,554,992 585,351 579,957 -77% -77% -1% Lifetime Natural Gas Therms 16,004,362 9,274,291 9,173,942 -42% -43% -1%Total Benefits 2016$ 2,239,190 432,851 585,428 -81% -74% 35% Total Benefits 2016$ 19,439,154 14,067,688 13,837,748 -28% -29% -2%Total Program Costs nominal$ 745,493 298,366 298,366 -60% -60% 0% Total Program Costs nominal$ 3,609,982 2,211,485 2,211,485 -39% -39% 0%Total Resource Costs 2016$ 1,122,312 391,153 391,153 -65% -65% 0% Total Resource Costs 2016$ 5,462,280 4,738,263 4,738,263 -13% -13% 0%Benefit Cost Ratio B/C 2.00 1.11 1.50 -45% -25% 35% Benefit Cost Ratio B/C 3.56 2.97 2.92 -17% -18% -2%
Metric Units Planned Preliminary Evaluated Plan v Preliminary
Plan v Evaluated
Preliminary v Evaluated
Metric Units Planned Preliminary Evaluated Plan v Preliminary
Plan v Evaluated
Preliminary v Evaluated
Annual Energy MWh 2 1 1 -65% -65% 0% Annual Energy MWh - - - Lifetime Energy MWh 37 13 13 -65% -65% 0% Lifetime Energy MWh - - - Annual Natural Gas Therms 242,170 302,705 249,342 25% 3% -18% Annual Natural Gas Therms 170,784 156,231 156,231 -9% -9% 0%Lifetime Natural Gas Therms 5,208,274 6,000,336 4,665,947 15% -10% -22% Lifetime Natural Gas Therms 1,809,690 1,735,533 1,735,533 -4% -4% 0%Total Benefits 2016$ 4,584,153 5,142,018 4,385,559 12% -4% -15% Total Benefits 2016$ 2,437,906 3,989,645 3,989,645 64% 64% 0%Total Program Costs nominal$ 1,582,928 1,817,350 1,817,350 15% 15% 0% Total Program Costs nominal$ 707,007 590,587 590,587 -16% -16% 0%Total Resource Costs 2016$ 2,517,343 2,254,508 2,254,508 -10% -10% 0% Total Resource Costs 2016$ 881,144 807,999 807,999 -8% -8% 0%Benefit Cost Ratio B/C 1.82 2.28 1.95 25% 7% -15% Benefit Cost Ratio B/C 2.77 4.94 4.94 78% 78% 0%
Notes
Metric Units Planned Preliminary Evaluated Plan v Preliminary
Plan v Evaluated
Preliminary v Evaluated
Annual Energy MWh - - - Lifetime Energy MWh - - - Annual Natural Gas Therms 66,101 14,787 14,787 -78% -78% 0%Lifetime Natural Gas Therms 1,097,321 256,704 256,704 -77% -77% 0%Total Benefits 2016$ 1,257,628 267,854 267,854 -79% -79% 0%Total Program Costs nominal$ 770,733 280,891 280,891 -64% -64% 0%Total Resource Costs 2016$ 763,477 282,509 282,509 -63% -63% 0%Benefit Cost Ratio B/C 1.65 0.95 0.95 -42% -42% 0%
Metric Units Planned Preliminary Evaluated Plan v Preliminary
Plan v Evaluated
Preliminary v Evaluated
Annual Energy MWh - - - Lifetime Energy MWh - - - Annual Natural Gas Therms - - - Lifetime Natural Gas Therms - - - Total Benefits 2016$ - - - Total Program Costs nominal$ - - - Total Resource Costs 2016$ - - - Benefit Cost Ratio B/C
C2 - C&I Retrofit, 2016 SummaryC1a - C&I New Buildings & Major Renovations
• The plan year variances provided above are intended to indicate the Program Administrator's performance in the plan year only. The variances used to determine significant variances are provided separately. The variances above and the significant variances use different calculations to determine variances on an annual basis and over the three-year term, respectively.
C2a - C&I Existing Building Retrofit
C2b - C&I Small Business
C2c - C&I Multifamily Retrofit
C2d - C&I Upstream Lighting
C1b - C&I Initial Purchase & End of Useful Life
C1 - C&I New Construction, 2016 Summary
Bay State Gas Company d/b/a Columbia Gas of Massachusetts 2016 Energy Efficiency Plan-Year Report D.P.U. 17-100 May 1, 2017 Page 32 of 37

Core Initiatives, Three-Year TotalResidential ProgramsCMAMay 1, 2017
Metric Units 2016 Evaluated 2017 Planned 2018 Planned 2016-2018 Total Metric Units 2016 Evaluated 2017 Planned 2018 Planned 2016-2018 Total
Annual Energy MWh 110 132 148 390 Annual Energy MWh 208 162 162 533 Lifetime Energy MWh 2,000 3,307 3,692 8,999 Lifetime Energy MWh 3,157 2,466 2,466 8,089 Annual Natural Gas Therms 159,795 167,234 209,550 536,579 Annual Natural Gas Therms 526,096 511,969 511,969 1,550,034 Lifetime Natural Gas Therms 3,565,415 3,861,642 4,768,265 12,195,322 Lifetime Natural Gas Therms 9,086,658 9,017,344 9,017,344 27,121,347 Total Benefits 2016$ 7,815,871 6,531,647 7,701,140 22,048,659 Total Benefits 2016$ 12,644,419 12,571,196 12,547,539 37,763,153 Total Program Costs nominal$ 2,118,207 884,940 986,115 3,989,262 Total Program Costs nominal$ 4,177,099 4,565,385 4,572,559 13,315,042 Total Resource Costs 2016$ 5,543,683 2,605,014 2,837,114 10,985,811 Total Resource Costs 2016$ 8,559,961 8,709,757 8,505,938 25,775,656 Benefit Cost Ratio B/C 1.41 2.51 2.71 2.01 Benefit Cost Ratio B/C 1.48 1.44 1.48 1.47
Metric Units 2016 Evaluated 2017 Planned 2018 Planned 2016-2018 Total Metric Units 2016 Evaluated 2017 Planned 2018 Planned 2016-2018 Total
Annual Energy MWh - 2 2 4 Annual Energy MWh - - - - Lifetime Energy MWh - 21 21 42 Lifetime Energy MWh - - - - Annual Natural Gas Therms 126,192 90,561 90,561 307,314 Annual Natural Gas Therms - - - - Lifetime Natural Gas Therms 2,057,373 1,511,097 1,511,097 5,079,568 Lifetime Natural Gas Therms - - - - Total Benefits 2016$ 3,230,096 2,674,072 2,662,206 8,566,373 Total Benefits 2016$ - - - - Total Program Costs nominal$ 1,842,994 1,544,640 1,561,742 4,949,376 Total Program Costs nominal$ - - - - Total Resource Costs 2016$ 1,701,632 1,438,495 1,418,958 4,559,085 Total Resource Costs 2016$ - - - - Benefit Cost Ratio B/C 1.90 1.86 1.88 1.88 Benefit Cost Ratio B/C
Metric Units 2016 Evaluated 2017 Planned 2018 Planned 2016-2018 Total Metric Units 2016 Evaluated 2017 Planned 2018 Planned 2016-2018 Total
Annual Energy MWh 1,239 1,469 1,458 4,167 Annual Energy MWh - - - - Lifetime Energy MWh 30,091 33,769 33,654 97,515 Lifetime Energy MWh - - - - Annual Natural Gas Therms 1,402,782 1,146,114 1,144,559 3,693,454 Annual Natural Gas Therms - - - - Lifetime Natural Gas Therms 28,247,163 23,604,364 23,573,109 75,424,635 Lifetime Natural Gas Therms - - - - Total Benefits 2016$ 49,078,852 44,927,618 44,926,740 138,933,210 Total Benefits 2016$ - - - - Total Program Costs nominal$ 14,664,878 10,585,818 10,664,091 35,914,788 Total Program Costs nominal$ - - - - Total Resource Costs 2016$ 22,751,310 14,486,806 14,213,785 51,451,902 Total Resource Costs 2016$ - - - - Benefit Cost Ratio B/C 2.16 3.10 3.16 2.70 Benefit Cost Ratio B/C
Metric Units 2016 Evaluated 2017 Planned 2018 Planned 2016-2018 Total
Annual Energy MWh - - - - Lifetime Energy MWh - - - - Annual Natural Gas Therms - - - - Lifetime Natural Gas Therms - - - - Total Benefits 2016$ - - - - Total Program Costs nominal$ - - - - Total Resource Costs 2016$ - - - -
Benefit Cost Ratio B/C
A2 - Residential Products, 2016-2018 SummaryA2a - Residential Heating & Cooling Equipment
A2b - Residential Consumer Products
A2c - Residential Lighting
A1b - Residential Multi-Family Retrofit
A1c - Residential Home Energy Services - Measures
A1e - Residential Behavior/Feedback Program
A1 - Residential Whole, 2016-2018 SummaryA1a - Residential New Construction
Bay State Gas Company d/b/a Columbia Gas of Massachusetts 2016 Energy Efficiency Plan-Year Report D.P.U. 17-100 May 1, 2017 Page 33 of 37

Core Initiatives, Three-Year TotalLow-Income ProgramsCMAMay 1, 2017
Metric Units 2016 Evaluated 2017 Planned 2018 Planned 2016-2018 Total
Annual Energy MWh 158 143 143 443 Lifetime Energy MWh 3,128 2,819 2,819 8,766 Annual Natural Gas Therms 155,495 143,354 143,354 442,203 Lifetime Natural Gas Therms 3,070,656 2,826,030 2,826,030 8,722,716 Total Benefits 2016$ 10,301,270 5,470,236 5,472,064 21,243,570 Total Program Costs nominal$ 3,491,602 3,843,534 3,929,987 11,265,123 Total Resource Costs 2016$ 3,616,914 3,796,965 3,786,581 11,200,461 Benefit Cost Ratio B/C 2.85 1.44 1.45 1.90
Metric Units 2016 Evaluated 2017 Planned 2018 Planned 2016-2018 Total
Annual Energy MWh - - - - Lifetime Energy MWh - - - - Annual Natural Gas Therms 182,104 209,203 209,203 600,511 Lifetime Natural Gas Therms 3,990,924 4,478,672 4,478,672 12,948,267 Total Benefits 2016$ 5,090,008 5,413,929 5,399,286 15,903,223 Total Program Costs nominal$ 3,231,424 3,221,774 3,306,216 9,759,413 Total Resource Costs 2016$ 3,280,935 3,200,581 3,202,710 9,684,225 Benefit Cost Ratio B/C 1.55 1.69 1.69 1.64
B1 - Low-Income Whole House, 2016-2018 SummaryB1a - Low-Income Single Family Retrofit
B1b - Low-Income Multi-Family Retrofit
Bay State Gas Company d/b/a Columbia Gas of Massachusetts 2016 Energy Efficiency Plan-Year Report D.P.U. 17-100 May 1, 2017 Page 34 of 37

Core Initiatives, Three-Year TotalC&I ProgramsCMAMay 1, 2017
Metric Units 2016 Evaluated 2017 Planned 2018 Planned 2016-2018 Total Metric Units 2016 Evaluated 2017 Planned 2018 Planned 2016-2018 Total
Annual Energy MWh - 0 0 0 Annual Energy MWh - - - - Lifetime Energy MWh - 4 4 9 Lifetime Energy MWh - - - - Annual Natural Gas Therms 36,813 137,640 150,111 324,565 Annual Natural Gas Therms 801,756 1,264,618 1,257,334 3,323,708 Lifetime Natural Gas Therms 579,957 3,082,826 3,353,668 7,016,452 Lifetime Natural Gas Therms 9,173,942 15,775,155 15,677,705 40,626,802 Total Benefits 2016$ 585,428 2,668,556 2,891,459 6,145,442 Total Benefits 2016$ 13,837,748 18,695,380 18,333,110 50,866,238 Total Program Costs nominal$ 298,366 803,957 832,498 1,934,822 Total Program Costs nominal$ 2,211,485 3,627,821 3,639,716 9,479,021 Total Resource Costs 2016$ 391,153 1,203,625 1,223,371 2,818,149 Total Resource Costs 2016$ 4,738,263 5,333,639 5,221,298 15,293,200 Benefit Cost Ratio B/C 1.50 2.22 2.36 2.18 Benefit Cost Ratio B/C 2.92 3.51 3.51 3.33
Metric Units 2016 Evaluated 2017 Planned 2018 Planned 2016-2018 Total Metric Units 2016 Evaluated 2017 Planned 2018 Planned 2016-2018 Total
Annual Energy MWh 1 2 2 5 Annual Energy MWh - - - - Lifetime Energy MWh 13 37 37 86 Lifetime Energy MWh - - - - Annual Natural Gas Therms 249,342 249,863 261,546 760,751 Annual Natural Gas Therms 156,231 166,655 166,067 488,953 Lifetime Natural Gas Therms 4,665,947 5,317,738 5,487,655 15,471,340 Lifetime Natural Gas Therms 1,735,533 1,764,934 1,759,814 5,260,281 Total Benefits 2016$ 4,385,559 4,605,058 4,713,813 13,704,431 Total Benefits 2016$ 3,989,645 2,313,111 2,265,699 8,568,455 Total Program Costs nominal$ 1,817,350 1,624,150 1,685,394 5,126,894 Total Program Costs nominal$ 590,587 703,767 709,273 2,003,627 Total Resource Costs 2016$ 2,254,508 2,591,370 2,700,993 7,546,871 Total Resource Costs 2016$ 807,999 855,200 840,908 2,504,107 Benefit Cost Ratio B/C 1.95 1.78 1.75 1.82 Benefit Cost Ratio B/C 4.94 2.70 2.69 3.42
Metric Units 2016 Evaluated 2017 Planned 2018 Planned 2016-2018 Total
Annual Energy MWh - - - - Lifetime Energy MWh - - - - Annual Natural Gas Therms 14,787 64,585 64,019 143,391 Lifetime Natural Gas Therms 256,704 1,071,961 1,062,885 2,391,550 Total Benefits 2016$ 267,854 1,208,994 1,190,672 2,667,521 Total Program Costs nominal$ 280,891 767,700 766,871 1,815,462 Total Resource Costs 2016$ 282,509 741,571 722,354 1,746,435 Benefit Cost Ratio B/C 0.95 1.63 1.65 1.53
Metric Units 2016 Evaluated 2017 Planned 2018 Planned 2016-2018 Total
Annual Energy MWh - - - - Lifetime Energy MWh - - - - Annual Natural Gas Therms - - - - Lifetime Natural Gas Therms - - - - Total Benefits 2016$ - - - - Total Program Costs nominal$ - - - - Total Resource Costs 2016$ - - - -
Benefit Cost Ratio B/C
C2c - C&I Multifamily Retrofit
C2d - C&I Upstream Lighting
C1 - C&I New Construction, 2016-2018 SummaryC1a - C&I New Buildings & Major Renovations
C1b - C&I Initial Purchase & End of Useful Life
C2 - C&I Retrofit, 2016-2018 SummaryC2a - C&I Existing Building Retrofit
C2b - C&I Small Business
Bay State Gas Company d/b/a Columbia Gas of Massachusetts 2016 Energy Efficiency Plan-Year Report D.P.U. 17-100 May 1, 2017 Page 35 of 37

Greenhouse Gas Reductions, Plan Year SummaryGHG reductions are provided for information purposes only. They are not included in the TRC test.CMAMay 1, 2017
Electric Energy Natural Gas Oil NOX SO2(MWh) (Therms) (MMBTU) Electric Energy Electric Energy Electric Energy Natural Gas Oil
A - Residential 1,516 1,878,223 0.000185578 0.000090138 0.396076 0.005850 0.080693 0.3 0.1 11,588 B - Low-Income 143 356,228 0.000185578 0.000090138 0.396076 0.005850 0.080693 0.0 0.0 2,140 C - Commercial & Industrial 3 2,242,223 0.000185578 0.000090138 0.396076 0.005850 0.080693 0.0 0.0 13,118 Grand Total 1,662 4,476,675 0.000185578 0.000090138 0.396076 0.005850 0.080693 0.3 0.1 26,847
Electric Energy Natural Gas Oil NOX SO2(MWh) (Therms) (MMBTU) Electric Energy Electric Energy Electric Energy Natural Gas Oil
A - Residential 1,341 2,122,428 - 0.000185578 0.000090138 0.396076 0.005850 0.080693 0.2 0.1 12,947 B - Low-Income 158 337,599 - 0.000185578 0.000090138 0.396076 0.005850 0.080693 0.0 0.0 2,037 C - Commercial & Industrial 1 1,488,654 - 0.000185578 0.000090138 0.396076 0.005850 0.080693 0.0 0.0 8,709 Grand Total 1,500 3,948,680 - 0.000185578 0.000090138 0.396076 0.005850 0.080693 0.3 0.1 23,694
Electric Energy Natural Gas Oil NOX SO2(MWh) (Therms) (MMBTU) Electric Energy Electric Energy Electric Energy Natural Gas Oil
A - Residential -12% 13% 0% 0% 0% 0% 0% -12% -12% 12%B - Low-Income 11% -5% 0% 0% 0% 0% 0% 11% 11% -5%C - Commercial & Industrial -68% -34% 0% 0% 0% 0% 0% -68% -68% -34%Grand Total -10% -12% 0% 0% 0% 0% 0% -10% -10% -12%
Notes• The GHG factors have been updated since the 2016-2018 Plan in coordination with the Department of Environmental Protection to reflect the most up to date information available.
2016 Planned v. Evaluated Greenhouse Gas Reductions Variances (%)
SectorAdjusted Gross Annual Savings GHG Factors Annual Emissions Reductions (Short Tons)
CO2NOX SO2 CO2
2016 Evaluated Greenhouse Gas Reductions
SectorAdjusted Gross Annual Savings GHG Factors Annual Emissions Reductions (Short Tons)
CO2NOX SO2 CO2
2016 Planned Greenhouse Gas Reductions
SectorAdjusted Gross Annual Savings GHG Factors Annual Emissions Reductions (Short Tons)
CO2NOX SO2 CO2
Bay State Gas Company d/b/a Columbia Gas of Massachusetts 2016 Energy Efficiency Plan-Year Report D.P.U. 17-100 May 1, 2017 Page 36 of 37

Greenhouse Gas Reductions, Three-Year TotalGHG reductions are provided for information purposes only. They are not included in the TRC test.CMAMay 1, 2017
Electric Energy Natural Gas Oil NOX SO2(MWh) (Therms) (MMBTU) Electric Energy Electric Energy Electric Energy Natural Gas Oil
A - Residential 1,341 2,122,428 - 0.000185578 0.000090138 0.396076 0.005850 0.080693 0.2 0.1 12,947 B - Low-Income 158 337,599 - 0.000185578 0.000090138 0.396076 0.005850 0.080693 0.0 0.0 2,037 C - Commercial & Industrial 1 1,488,654 - 0.000185578 0.000090138 0.396076 0.005850 0.080693 0.0 0.0 8,709 Grand Total 1,500 3,948,680 - 0.000185578 0.000090138 0.396076 0.005850 0.080693 0.3 0.1 23,694
Electric Energy Natural Gas Oil NOX SO2(MWh) (Therms) (MMBTU) Electric Energy Electric Energy Electric Energy Natural Gas Oil
A - Residential 1,519 1,882,061 0.000185578 0.000090138 0.396076 0.005850 0.080693 0.3 0.1 11,612 B - Low-Income 143 352,557 0.000185578 0.000090138 0.396076 0.005850 0.080693 0.0 0.0 2,119 C - Commercial & Industrial 3 2,248,245 0.000185578 0.000090138 0.396076 0.005850 0.080693 0.0 0.0 13,153 Grand Total 1,665 4,482,864 0.000185578 0.000090138 0.396076 0.005850 0.080693 0.3 0.2 26,884
Electric Energy Natural Gas Oil NOX SO2(MWh) (Therms) (MMBTU) Electric Energy Electric Energy Electric Energy Natural Gas Oil
A - Residential 1,520 1,920,289 0.000185578 0.000090138 0.396076 0.005850 0.080693 0.3 0.1 11,836 B - Low-Income 143 352,557 0.000185578 0.000090138 0.396076 0.005850 0.080693 0.0 0.0 2,119 C - Commercial & Industrial 3 2,267,146 0.000185578 0.000090138 0.396076 0.005850 0.080693 0.0 0.0 13,264 Grand Total 1,666 4,539,992 0.000185578 0.000090138 0.396076 0.005850 0.080693 0.3 0.2 27,219
Electric Energy Natural Gas Oil NOX SO2(MWh) (Therms) (MMBTU) Electric Energy Electric Energy Electric Energy Natural Gas Oil
A - Residential 4,380 5,924,779 - 0.000185578 0.000090138 0.396076 0.005850 0.080693 1 0 36,395 B - Low-Income 443 1,042,714 - 0.000185578 0.000090138 0.396076 0.005850 0.080693 0 0 6,275 C - Commercial & Industrial 7 6,004,044 - 0.000185578 0.000090138 0.396076 0.005850 0.080693 0 0 35,127 Grand Total 4,831 12,971,537 - 0.000185578 0.000090138 0.396076 0.005850 0.080693 1 0 77,797
Notes• The GHG factors have been updated since the 2016-2018 Plan in coordination with the Department of Environmental Protection to reflect the most up to date information available.
2018 Planned Greenhouse Gas Reductions
SectorAdjusted Gross Annual Savings GHG Factors Annual Emissions Reductions (Short Tons)
CO2NOX SO2 CO2
2016-2018 Greenhouse Gas Reductions
SectorAdjusted Gross Annual Savings GHG Factors Annual Emissions Reductions (Short Tons)
CO2NOX SO2 CO2
2017 Planned Greenhouse Gas Reductions
SectorAdjusted Gross Annual Savings GHG Factors Annual Emissions Reductions (Short Tons)
CO2NOX SO2 CO2
2016 Evaluated Greenhouse Gas Reductions
SectorAdjusted Gross Annual Savings GHG Factors Annual Emissions Reductions (Short Tons)
CO2NOX SO2 CO2
Bay State Gas Company d/b/a Columbia Gas of Massachusetts 2016 Energy Efficiency Plan-Year Report D.P.U. 17-100 May 1, 2017 Page 37 of 37

Bay State Gas Company d/b/a
Columbia Gas of Massachusetts
2016 Energy Efficiency Plan-Year Report
D.P.U. 17-100
May 1, 2017
APPENDICES
Bay State Gas Company d/b/a Columbia Gas of Massachusetts D.P.U. 17-100 2016 Energy Efficiency Plan-Year Report Appendix 1, Significant Variances & Cost-Effectiveness Page 1 of 10
APPENDIX 1
Significant Core Initiative Variances & Cost-Effectiveness Program Administrator-Specific Narrative Explanations for Bay State Gas Company d/b/a Columbia Gas of Massachusetts (the “Company”) are as follows.
I. RESIDENTIAL PROGRAMS
A. RESIDENTIAL WHOLE HOUSE
The actual 2016 benefit-cost ratio for the Residential Whole House program is 1.77. The projected benefit-cost ratio for the 2016-2018 plan term is 2.23 after accounting for actual results from 2016.
1. Residential New Construction
a. Significant Variances1 Significant variances exist between: planned and actual budget and between preliminary and evaluated total resource benefits. Actual expenditures for the Residential New Construction core initiative were 160.8 percent higher than the planned budget. This increase in spending is primarily due to substantially higher participation than planned – 82 percent higher than planned (792 actual participants vs. 435 planned). Higher participation resulted in an increase in participant incentives (actual spending in this budget category was $1,873,548 vs. planned spending of $593,040), and resulted in preliminary annual savings being 80 percent higher than planned. Evaluated total resource benefits were 60.6 percent less than preliminary total resource benefits. The decrease in benefits is due to the 2015-2016 Massachusetts Single-Family Code Compliance Baseline Study. The evaluation study updated the User Defined Reference Home (“UDRH”), last updated in 2011, based on current common installation practices for non-participating homes. This study found significant increases in energy efficiency for several measures in non-participating
1 Plan-year core initiative significant variances are defined in the D.P.U. 11-120, Phase II Plan-Year Report
Template as: (1) variances between planned and actual core initiative budget of 15 percent or greater; (2) variances between planned and preliminary core initiative total lifetime savings showing a decrease of 15 percent or greater; (3) variances between planned and preliminary core initiative total benefits showing a decrease of 15 percent or greater; and (4) variances between preliminary and evaluated core initiative total resource benefits showing a decrease of 15 percent or greater.

Bay State Gas Company d/b/a Columbia Gas of Massachusetts D.P.U. 17-100 2016 Energy Efficiency Plan-Year Report Appendix 1, Significant Variances & Cost-Effectiveness Page 2 of 10
homes, including insulation, air infiltration, heating, and water heating equipment. These updates decreased the total claimable benefits by approximately 40 percent for the Company’s residential new construction core initiative. The Program Administrators have designed a new performance-based incentive structure in this core initiative that, starting July 2017, will be utilized to enhance program savings and align builder incentives. This new Blended Savings Approach will enable the PAs to continue to offer builders incentives by encouraging them to implement higher efficiency building practices and technologies. The Company also plans to work with the statewide Residential New Construction vendor to implement broad marketing tactics to increase awareness among builders and raters about the program. In addition, the Blended Savings Approach incentive structure will ensure that the Company only pays for the specific savings each project achieves, rather than a set dollar amount for a range of savings. The Company is projecting to achieve its savings and benefits goals by the end of the Three-Year Plan term for this core initiative. b. Cost-Effectiveness The actual 2016 benefit-cost ratio for the Residential New Construction core initiative is 1.41. The projected benefit-cost ratio for the 2016-2018 plan term is 2.01 after accounting for actual results from 2016.
2. Residential Multi-Family
a. Significant Variances There are no significant variances to report for this core initiative. The Company is projecting to achieve its savings and benefits goals by the end of the Three-Year Plan term for this core initiative. b. Cost-Effectiveness The actual 2016 benefit-cost ratio for the Residential Multi-Family core initiative is 1.90. The projected benefit-cost ratio for the 2016-2018 plan term is 1.88 after accounting for actual results from 2016.

Bay State Gas Company d/b/a Columbia Gas of Massachusetts D.P.U. 17-100 2016 Energy Efficiency Plan-Year Report Appendix 1, Significant Variances & Cost-Effectiveness Page 3 of 10
3. Residential Home Energy Services
a. Significant Variances i. Home Energy Services – Measures
A significant variance exists between planned budget and actual expenditures for the Residential Home Energy Services - Measures core initiative. Actual expenditures were 42.1 percent higher than the planned budget. This increase in spending is due to substantially higher than forecasted measures installations, which resulted in an increase in participant incentives (actual spending in this budget category was $13,025,754 vs. planned spending of $7,597,517). Higher measure installation also resulted in higher annual savings (22 percent) and lifetime savings (20 percent) than planned. The Company is projecting to achieve its savings and benefits goals by the end of the Three-Year Plan term for this core initiative.
ii. Home Energy Services – RCS
A significant variance exists between planned budget and actual expenditures for the Residential Home Energy Services - RCS core initiative. Actual expenditures are 50.5 percent higher than planned, due to higher participation than planned. The increase in expenditures was primarily in the Sales, Technical Assistance, and Training (“STAT”) budget category, which includes all charges for audits. Actual STAT spending was $3,772,919 vs. planned spending of $2,358,091. The number of audits completed in 2016 was 17,894 vs. 9,433 in the Plan (an 89 percent increase).
b. Cost-Effectiveness
The actual 2016 benefit-cost ratio for the Home Energy Services – Measures core initiative is 2.16. The projected benefit-cost ratio for the 2016-2018 plan term is 2.70 after accounting for actual results from 2016
4. Residential Behavior/Feedback
a. Significant Variances As set forth in the Three-Year Plan, the Company does not offer a Residential Behavior/Feedback core initiative. b. Cost-Effectiveness N/A

Bay State Gas Company d/b/a Columbia Gas of Massachusetts D.P.U. 17-100 2016 Energy Efficiency Plan-Year Report Appendix 1, Significant Variances & Cost-Effectiveness Page 4 of 10
B. RESIDENTIAL PRODUCTS
1. Residential Heating & Cooling Equipment
a. Significant Variances There are no significant variances to report in 2016 for the Residential Heating & Cooling Equipment core initiative. The Company is projecting to achieve its savings and benefits goals by the end of the Three-Year Plan term for this core initiative. b. Cost-Effectiveness The actual 2016 benefit-cost ratio for the Residential Heating & Cooling core initiative is 1.48. The projected benefit-cost ratio for the 2016-2018 plan term is 1.47 after accounting for actual results from 2016.

Bay State Gas Company d/b/a Columbia Gas of Massachusetts D.P.U. 17-100 2016 Energy Efficiency Plan-Year Report Appendix 1, Significant Variances & Cost-Effectiveness Page 5 of 10
II. LOW-INCOME PROGRAMS
A. LOW-INCOME WHOLE HOUSE
The actual 2016 benefit-cost ratio for the Low-Income Whole House program is 2.23. The projected benefit-cost ratio for the 2016-2018 plan term is 1.78 after accounting for actual results from 2016.
1. Low-Income Single-Family Retrofit
a. Significant Variances There are no significant variances to report for the Low-Income Single-Family Retrofit core initiative. The Company is projecting to achieve its savings and benefits goals by the end of the Three-Year Plan term for this core initiative. b. Cost-Effectiveness The actual 2016 benefit-cost ratio for the Low-Income Single Family core initiative is 2.85. The projected benefit-cost ratio for the 2016-2018 plan term is 1.90 after accounting for actual results from 2016.
2. Low-Income Multi-Family Retrofit
a. Significant Variances There are no significant variances to report for the Low-Income Multi-Family Retrofit core initiative. The Company is projecting to achieve its savings and benefits goals by the end of the Three-Year Plan term for this core initiative. b. Cost-Effectiveness The actual 2016 benefit-cost ratio for the Low-Income Multi-Family core initiative is 1.55. The projected benefit-cost ratio for the 2016-2018 plan term is 1.64 after accounting for actual results from 2016.

Bay State Gas Company d/b/a Columbia Gas of Massachusetts D.P.U. 17-100 2016 Energy Efficiency Plan-Year Report Appendix 1, Significant Variances & Cost-Effectiveness Page 6 of 10
III. COMMERCIAL & INDUSTRIAL PROGRAMS
A. C&I NEW CONSTRUCTION
The actual 2016 benefit-cost ratio for the C&I New Construction program is 1.88. The projected benefit-cost ratio for the 2016-2018 plan term is 1.92 after accounting for actual results from 2016. 1. C&I New Buildings & Major Renovations
a. Significant Variances
Significant variances exist between: planned and actual budget; planned and preliminary total lifetime savings; and planned and preliminary total benefits. The actual budget was 60 percent less than planned, the preliminary lifetime savings were 77.1 percent lower than planned, and the total benefits were 80.7 percent lower than planned. All three variances were driven by significantly lower than planned participation across three major components of this core initiative. There were significantly fewer large ground-up/major renovation new construction projects (17 planned projects, only 7 completed). These planned projects were originally anticipated to comprise most of the savings in New Buildings & Major Renovations. No projects were completed in the second component of the initiative, the new high-rise new construction initiative, which accounted for nearly 30 percent of the planned savings in this core initiative. In the third component, even though overall commercial rebate participation was strong, a lower percentage of customers than planned sought rebates for new efficient commercial equipment installed as a portion of a new building or major renovation. When the Company developed the estimated savings and benefits included in its three-year plan, the Company assumed that a higher percentage of customers would install equipment as part of a new building or major renovation project. Due to a combination of economic factors, there continues to be less C&I new commercial construction in the Company’s territory. The Company works with architects and engineers to get more savings out of each new construction project that is completed and has increased marketing of prescriptive rebates in order to increase savings and benefits in this core initiative. The Company will monitor the rates of new commercial construction market in its service territory, and adjust the planning as necessary. The Company is projecting to achieve its savings and benefits goals by the end of the Three-Year Plan term for this core initiative.

Bay State Gas Company d/b/a Columbia Gas of Massachusetts D.P.U. 17-100 2016 Energy Efficiency Plan-Year Report Appendix 1, Significant Variances & Cost-Effectiveness Page 7 of 10
b. Cost-Effectiveness The actual 2016 benefit-cost ratio for the C&I New Buildings & Major Renovations core initiative is 1.50. The projected benefit-cost ratio for the 2016-2018 plan term is 2.18 after accounting for actual results from 2016.
2. C&I Initial Purchase & End of Useful Life
a. Significant Variances
A significant variance exists between preliminary and evaluated total resource benefits. Evaluated benefits were 23 percent less than preliminary results. This decrease in benefits was due to reductions in savings values for prescriptive boilers based on two evaluation studies: (1) Gas Boiler Market Characterization Study Phase II - Final Report, which is filed as Attachment 4D, Study 16-25; and (2) Recalculation of Prescriptive Program Gas Boiler Savings Using New Baseline, which is filed as Attachment 4D, Study 26. The Gas Boiler Market Characterization Study Phase II - Final Report determined that for boilers less than 2,000 MBH, the baseline efficiency should be increased from the current code standard to 85 percent efficiency. The Recalculation of Prescriptive Program Gas Boiler Savings Using New Baseline study supplied updated savings to quantify the new energy savings impacts from the baseline update. This update resulted in an approximately 50 percent reduction in the claimable annual therm savings depending on size and efficiency levels. Despite the notable decrease in claimable savings in 2016, the Company is projecting to achieve its savings and benefits goals by the end of the Three-Year Plan term for this core initiative. b. Cost-Effectiveness The actual 2016 benefit-cost ratio for the C&I Initial Purchase & End of Useful Life core initiative is 1.95. The projected benefit-cost ratio for the 2016-2018 plan term is 1.82 after accounting for actual results from 2016.
B. C&I RETROFIT
The actual 2016 benefit-cost ratio for the C&I Retrofit program is 3.10. The projected benefit-cost ratio for the 2016-2018 plan term is 3.18 after accounting for actual results from 2016.
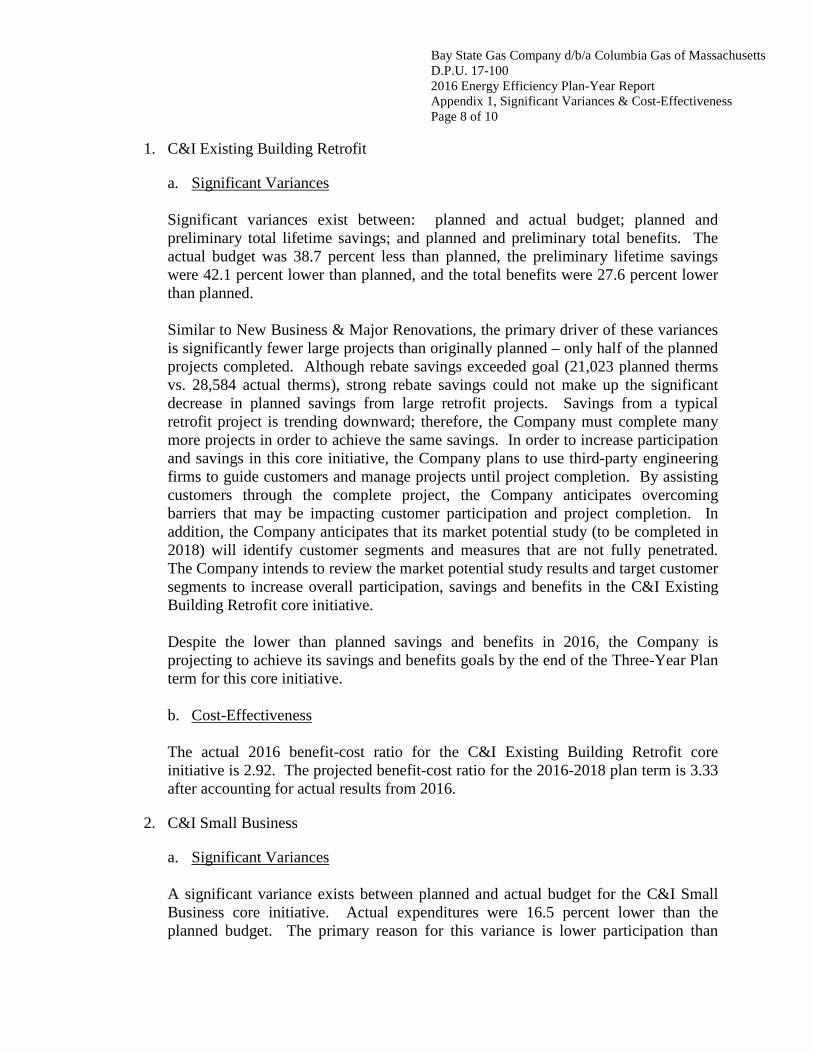
Bay State Gas Company d/b/a Columbia Gas of Massachusetts D.P.U. 17-100 2016 Energy Efficiency Plan-Year Report Appendix 1, Significant Variances & Cost-Effectiveness Page 8 of 10
1. C&I Existing Building Retrofit
a. Significant Variances Significant variances exist between: planned and actual budget; planned and preliminary total lifetime savings; and planned and preliminary total benefits. The actual budget was 38.7 percent less than planned, the preliminary lifetime savings were 42.1 percent lower than planned, and the total benefits were 27.6 percent lower than planned. Similar to New Business & Major Renovations, the primary driver of these variances is significantly fewer large projects than originally planned – only half of the planned projects completed. Although rebate savings exceeded goal (21,023 planned therms vs. 28,584 actual therms), strong rebate savings could not make up the significant decrease in planned savings from large retrofit projects. Savings from a typical retrofit project is trending downward; therefore, the Company must complete many more projects in order to achieve the same savings. In order to increase participation and savings in this core initiative, the Company plans to use third-party engineering firms to guide customers and manage projects until project completion. By assisting customers through the complete project, the Company anticipates overcoming barriers that may be impacting customer participation and project completion. In addition, the Company anticipates that its market potential study (to be completed in 2018) will identify customer segments and measures that are not fully penetrated. The Company intends to review the market potential study results and target customer segments to increase overall participation, savings and benefits in the C&I Existing Building Retrofit core initiative. Despite the lower than planned savings and benefits in 2016, the Company is projecting to achieve its savings and benefits goals by the end of the Three-Year Plan term for this core initiative. b. Cost-Effectiveness
The actual 2016 benefit-cost ratio for the C&I Existing Building Retrofit core initiative is 2.92. The projected benefit-cost ratio for the 2016-2018 plan term is 3.33 after accounting for actual results from 2016.
2. C&I Small Business
a. Significant Variances A significant variance exists between planned and actual budget for the C&I Small Business core initiative. Actual expenditures were 16.5 percent lower than the planned budget. The primary reason for this variance is lower participation than

Bay State Gas Company d/b/a Columbia Gas of Massachusetts D.P.U. 17-100 2016 Energy Efficiency Plan-Year Report Appendix 1, Significant Variances & Cost-Effectiveness Page 9 of 10
planned. The Company notes, however, that despite lower participation than planned, the Company achieved 91.4 percent of planned savings because the Company was able to increase the average savings per project. In 2016, the Company offered customers a package of measures based on business type, which resulted in an increase in the average savings per project. This strategy resulted in higher savings per project despite less participation than planned. The Company is projecting to achieve its savings and benefits goals by the end of the Three-Year Plan term for this core initiative.
b. Cost-Effectiveness The actual 2016 benefit-cost ratio for the C&I Small Business core initiative is 4.94. The projected benefit-cost ratio for the 2016-2018 plan term is 3.42 after accounting for actual results from 2016.
3. C&I Multi-Family Retrofit
a. Significant Variances Significant variances exist between: planned and actual budget; planned and preliminary total lifetime savings; and planned and preliminary total benefits. The actual budget was 63.6 percent less than planned, the preliminary lifetime savings were 76.6 percent lower than planned, and the total benefits were 78.7 percent lower than planned. These areas of variance were solely driven by significantly lower participation than planned. In developing the estimate of participation and savings (and corresponding budget) for this new core initiative (separated from the residential multi-family core initiative starting in 2016), the Company analyzed prior participation rates by this customer segment and, based on that analysis, developed an estimate for the participation rate for direct install measures in these projects. In 2016, however, the direct install measures participation rate did not match the historical data. Although there were fewer participants than planned, the Company achieved greater average savings per participant than anticipated. The Company plans to increase its marketing and sales efforts for this new core initiative, including utilizing targeted marketing strategies, to increase participation.
The Company is projecting to achieve its savings and benefits goals by the end of the Three-Year Plan term for this core initiative.

Bay State Gas Company d/b/a Columbia Gas of Massachusetts D.P.U. 17-100 2016 Energy Efficiency Plan-Year Report Appendix 1, Significant Variances & Cost-Effectiveness Page 10 of 10
b. Cost-Effectiveness
The actual 2016 benefit-cost ratio for the C&I Multi-Family core initiative is 0.95. The projected benefit-cost ratio for the 2016-2018 plan term is 1.53 after accounting for actual results from 2016. As discussed above, 2016 was the first year of the Company implemented the C&I Multi-Family Retrofit core imitative. Due to lower participation than planned, the benefits were not high enough to offset the core initiative’s administrative costs. The Company notes, however, that the completed projects as a whole were cost-effective. As the Company’s marketing and sales efforts ramp up and participation increases, the Company expects that this core initiative, as designed, will be cost effective over the term.

Bay State Gas Company d/b/a Columbia Gas of Massachusetts 2016 Energy Efficiency Plan-Year Report D.P.U. 17-100 May 1, 2017 Appendix 2, Benefit-Cost Ratio Screening Tool Page 1 of 1
APPENDIX 2
Benefit-Cost Ratio Screening Tool
Please see the CD-ROM accompanying this report for the Benefit-Cost Ratio Screening Tool in Microsoft Excel format. As part of ongoing discussions with the Department of Energy Resources initiated pursuant to the Department’s 2016-2018 Three-Year Plans Order, the electric Program Administrators have provided expanded information on C&I measures in this report version of the BCR Screening Tool. This does not alter the format of the BCR screening models (the measures can still be rolled up to end uses), but does provide additional details on actual C&I performance. Consistent with the Department’s Order, C&I data in planned models will continue to be presented at the end use level. There are no changes to the gas BCR models, which already present data at the measure level.

Bay State Gas Company d/b/a Columbia Gas of Massachusetts 2016 Energy Efficiency Plan-Year Report D.P.U. 17-100 May 1, 2017 Appendix 3, Technical Reference Manual Page 1 of 1
APPENDIX 3
Statewide Technical Reference Manual – 2016 Report Version
Please see Statewide Appendix 3: Technical Reference Manual – 2016 Report Version, filed under separate cover. The electronic version, the Technical Reference Library, is available at: http://www.masssavedata.com/Public/TechnicalReferenceLibrary.

Bay State Gas Company d/b/a Columbia Gas of Massachusetts 2016 Energy Efficiency Plan-Year Report D.P.U. 17-100 May 1, 2017 Appendix 4, Statewide Evaluation Studies Summary Page 1 of 1
APPENDIX 4
Statewide Evaluation Studies Summary Please see Statewide Evaluation Studies Summary, filed under separate cover.

Bay State Gas Company d/b/a Columbia Gas of Massachusetts 2016 Energy Efficiency Plan-Year Report D.P.U. 17-100 May 1, 2017 Appendix 5, Performance Incentives Page 1 of 1
APPENDIX 5
Performance Incentives
Please see the attached Performance Incentive calculation tables for calculations of performance incentives based on 2016 achievement.

Eversource Gas Total Comment
1 Plan Benefits 107,584,414$ D.P.U. 15-160 through 15-169, Exh. Comm-1, App. R (updated December 21, 2015)2 Threshold Benefits 80,688,311$ Line 1 * 75%3 Evaluated Benefits 111,226,750$ Cost-Effectiveness (2016$): Total Evaluated Benefits4 Savings Payout Rate 2016 - 2018 0.0067172$ D.P.U. 15-160 through 15-169, Exh. Comm-1, App. R (updated December 21, 2015)5 Plan Savings Incentives 722,666$ Line 1 * Line 46 Cap on Savings Incentives 903,333$ Line 5 * 125%7 Evaluated Savings Incentives 747,332$ Line 3 * Line 4 if Line 3 is greater than or equal to Line 2. Otherwise, $0.8 Claimed Savings Incentives 747,332$ Minimum of lines 6 and 7.
9 Plan Net Benefits Excluding PI 60,067,431$ D.P.U. 15-160 through 15-169, Exh. Comm-1, App. R (updated December 21, 2015)10 Threshold Benefits 45,050,573$ Line 9 * 75%11 Evaluated Total Costs 57,325,211$ Cost-Effectiveness (2016$): Total Resource Costs (which includes Line 12 below)12 PI (included in Line 11) -$ Estimated Performance Incentive before final 13 Evaluated Net Benefits Excluding PI 53,901,539$ Line 3 - (Line 11 - Line 12)14 Value Payout Rate 2016 - 2018 0.0089470$ D.P.U. 15-160 through 15-169, Exh. Comm-1, App. R (updated December 21, 2015)15 Plan Value Incentives 537,423$ Line 9 * Line 1416 Cap on Value Incentives 671,779$ Line 15 * 125%17 Evaluated Value Incentives 482,257$ Line 13 * Line 14 if Line 13 is greater than or equal to Line 10. Otherwise, $0.18 Claimed Value Incentives 482,257$ Minimum of lines 16 and 17.
19 Total Planned Peformance Incentive 1,260,089$ Line 5 + Line 1520 Total Claimed Peformance Incentive 1,229,589$ Line 8 + Line 1821 Percent Earned 98%
2016 Energy Effiency Performance Incentives (PI)($2016)
Bay State Gas Company d/b/a Columbia Gas of Massachusetts 2016 Energy Efficiency Plan-Year Report D.P.U. 17-100 May 1, 2017 Appendix 5, Performance Incentives Page 1 of 1

Bay State Gas Company d/b/a Columbia Gas of Massachusetts 2016 Energy Efficiency Plan-Year Report D.P.U. 17-100 May 1, 2017 Appendix 6, Demand Reduction Page 1 of 5
APPENDIX 6
Demand Reduction Update
A. Statewide Summary
In the 2016-2018 Massachusetts Joint Statewide Three-Year Electric and Gas Energy Efficiency Plan (“Plan”) the Program Administrators (“PAs”) committed to exploring creative new approaches to cost-effective demand reduction. These potential new approaches are in addition to the significant amount of demand savings planned to be achieved through energy efficiency programs in the 2016-2018 Three-Year Plan. See Plan at 19 (577 MW summer demand savings and 618 MW winter demand savings). Consistent with the Plan, in 2016 the Program Administrators assembled a Demand Savings Group (“DSG”) consisting of a small group of interested and qualified experts, to research potential electric and gas demand reduction efforts.
Through this highly collaborative and expert driven process, the PAs have considered various approaches to demand demonstration projects, and coordinated with each other to examine various innovative technologies and approaches that could potentially be successfully deployed to address unique opportunities in the Commonwealth. Below is a brief summary of the efforts undertaken by the PAs and DSG in 2016 to investigate potential cost-effective approaches to achieve active demand reduction.
The PAs developed the Initial Report on Scope, Task, and Timelines for the Demand Savings Group (“Initial Report”), which was filed with the Department on March 31, 2016. This Initial Report sets forth the structure, scope, milestones, tasks, and timeline for the PAs. Throughout the spring and summer of 2016, the Program Administrators held several productive formal and ad hoc meetings with subject matter experts, including vendors, evaluators, and industry experts. During this time, the PAs continued to analyze demand reduction reports and evaluations and review demand reduction strategies deployed in other jurisdictions. In order to fully assess potential demand reduction strategies beyond those used in other jurisdictions, the PAs issued a joint statewide Request for Information (“RFI”) in September 2016 to help assess potential technologies and solutions emerging in the market. The PAs also convened Demand Savings Group meetings, participated in meetings with the Energy Efficiency Advisory Council (“EEAC”) consultants (including a conference call with Council consultant Mary Ann Piette of Lawrence Berkeley National Lab), and supported the Demand Reduction Subcommittee of the EEAC by providing regular updates on the PAs’ progress, lessons learned, and draft proposals. Below is a list of the formal DSG and Demand Reduction Subcommittee meetings.

Bay State Gas Company d/b/a Columbia Gas of Massachusetts 2016 Energy Efficiency Plan-Year Report D.P.U. 17-100 May 1, 2017 Appendix 6, Demand Reduction Page 2 of 5
2016 Formal Demand Savings Group Meetings
Date Topic February 26, 2016 DSG structure, milestones, tasks, and AESC
Update March 1, 2016 Roundtable with demand response vendors:
Enernoc, Comverge, and Weatherbug March 7, 2016 Wholesale Markets at ISO-NE May 26, 2016 Distribution and Infrastructure August 15, 2016 Progress Update, Cost-Effectiveness, Lessons
Learned, Priorities, 2017 Demonstration Proposals
October 21, 2016 Demand Response Presentation by Mary Ann Piette of LBNL
December 2, 2016 Gas Capacity and Distribution, and potential for Gas Demand Response under GCA
2016 Demand Reduction Subcommittee Meetings
Date Topic February 18, 2016 Subcommittee Charter and Responsibilities,
Terminology, PA Analytical Framework, March Report
March 10, 2016 PA Report on Roundtable with demand response vendors, Draft Initial Report, AESC Update
June 1, 2016 Demonstration Project Update, Cost-Effectiveness, Preview of EEAC presentations
October 5, 2016 Demonstration Project Update and 2017 Demonstration Project Proposals
December 7, 2016 Milestones and Timelines, Matrix of Research Questions and Technologies
Details regarding the various subject matter expert and DSG meetings and/or lessons learned are outlined in the Initial Report, Matrix of Opportunities memorandum dated September 28, 2016, the December 2016 Overview of Proposed/Approved Peak Demand Reduction Demonstration Projections, and the numerous presentations provided to the DSG, the Demand Reduction Subcommittee, and the EEAC.

Bay State Gas Company d/b/a Columbia Gas of Massachusetts 2016 Energy Efficiency Plan-Year Report D.P.U. 17-100 May 1, 2017 Appendix 6, Demand Reduction Page 3 of 5
Statewide PA Reports and Presentations
Date Setting Topic Link 2/18/2016 Demand Reduction
Subcommittee Demand Reduction Subcommittee PA Framework & Updates
http://ma-eeac.org/wordpress/wp-content/uploads/Demand-SubCom-PA-Framework-Updates.pdf
2/26/2016 DSG DSG Coordination, Scope, Milestones, and Timeline
Appendix 6, Attachment A
2/26/2016 DSG Draft Milestones Appendix 6, Attachment B 3/10/2016 Demand Reduction
Subcommittee DSG Update and Draft PA Report
Appendix 6, Attachment C
3/31/2016 DPU Initial Report of the Demand Savings Group
http://ma-eeac.org/wordpress/wp-content/uploads/Initial-Report-of-the-Demand-Savings-Group-w-App-3-31-16-1.pdf
6/1/2016 Demand Reduction Subcommittee
Cost-Effectiveness Appendix 6, Attachment D
6/21/2016 EEAC Update from PAs on Demand Savings Group
http://ma-eeac.org/wordpress/wp-content/uploads/Update-from-PAs-on-Demand-Savings-Group.pdf
8/15/2016 DSG Lessons Learned and Priorities
Appendix 6, Attachment E
9/28/2016 Demand Reduction Subcommittee
Matrix of Opportunities
Appendix 6, Attachment F
10/5/2016 Demand Reduction Subcommittee
Seasonal and Load vs. Pricing Priorities
Appendix 6, Attachment G
10/19/2016 EEAC Review of Demand Priorities, Timeline Update, and Next Steps
http://ma-eeac.org/wordpress/wp-content/uploads/Demand-Priorities-PA-Analysis-1.pdf
10/21/2016 DSG New Directions in Demand Response by Mary Ann Piette
Appendix 6, Attachment H

Bay State Gas Company d/b/a Columbia Gas of Massachusetts 2016 Energy Efficiency Plan-Year Report D.P.U. 17-100 May 1, 2017 Appendix 6, Demand Reduction Page 4 of 5
12/2/2016 Demand Reduction
Subcommittee Overview of Proposed/Approved Demand Reduction Demonstration Projects
http://ma-eeac.org/wordpress/wp-content/uploads/Matrix-Memorandum-12-2-16.pdf
12/2/2016 DSG Natural Gas Systems Overview
Appendix 6, Attachment I
12/7/2016 Demand Reduction Subcommittee
Upcoming Milestones for Peak demand Reduction
http://ma-eeac.org/wordpress/wp-content/uploads/Milestones-for-PDR.pdf
2/23/2017 Demand Reduction Subcommittee
Demand Reduction Update & Milestones
http://ma-eeac.org/wordpress/wp-content/uploads/PDR-Timeline-2017.pdf
2/23/2017 Demand Reduction Subcommittee
Demand Reduction Projects Evaluation Plan Update
http://ma-eeac.org/wordpress/wp-content/uploads/MA-PAs-Demand-Reduction-Projects-Evaluation-Plan-Update-1.pdf
3/15/2017 EEAC Demand Reduction Update & Milestones
http://ma-eeac.org/wordpress/wp-content/uploads/Peak-Demand-Reduction-Updates-Milestones-3.13-1.pdf
Through research, the RFI, and meetings with industry experts, the PAs have sought to identify successful models and innovative demand reduction strategies that could potentially be cost-effectively implemented in Massachusetts. Each electric PA has developed its own demonstration projects designed to test potentially viable cost-effective peak demand reduction technologies/strategies. The gas PAs continue to seek potentially viable gas demand reduction programs that can be appropriately implemented under the GCA and do not rely on using other fuels, such as oil.
Similar to other energy efficiency efforts, individual PAs have developed PA-specific demonstrations or program enhancements to test new innovative approaches and share lessons learned with all PAs. This collaborative approach allows the PAs to collectively test a variety of potential initiatives and leverage each other’s results. Consistent with the Department approved Plan, National Grid and the Cape Light Compact deployed their approved demonstration projects in 2016 and worked to build the necessary capabilities for their 2017 demonstrations. National

Bay State Gas Company d/b/a Columbia Gas of Massachusetts 2016 Energy Efficiency Plan-Year Report D.P.U. 17-100 May 1, 2017 Appendix 6, Demand Reduction Page 5 of 5
Grid and the Cape Light Compact continuously shared lessons learned and evaluation results, as they became available, with the other PAs to ensure that the full PA team benefitted from these early demonstration projects. Leveraging the results of the RFI and lessons learned from collaboration among the PAs and from other pilots around the country, Eversource and Unitil developed their own demonstration projects in 2016, being conscious to minimize overlapping efforts in order to broaden the statewide scope of demonstration projects, and are currently seeking approval of the Department of Public Utilities to proceed with implementation.
As evidenced in the matrix below and the Statewide PA Reports and Presentations and Documents listed above, through collaboration, the PAs are able to use innovative approaches to collectively deploy and test several technologies in a strategic manner, while minimizing costs. The projects use various technologies and vendors, and include direct load control, energy management systems, battery storage, thermal storage, behavior, training, and permanent load shift approaches. The PAs plan to implement, evaluate and analyze these demonstration projects in order to inform potential designs of full scale demand reduction programs to be implemented at the earliest appropriate time (e.g., during the 2019-2021 term).
Matrix of Demonstration Projects PA Residential C&I
Small Mid Large National Grid
• WiFi Tstat DLC (Central A/C)
• WiFi Tstat DLC • WiFi Tstat DLC • Interruptible load approaches
Eversource • EMS • Lighting/HVAC
controls • WiFi Tstat DLC
• Software & Controls • Onsite training • Process audits • Batteries • Thermal storage
• Software & Controls • Onsite training • Process audits • Real time info • Batteries • Thermal storage • Demand response
CLC • WiFi Tstat DLC (Central A/C)
• Behavioral • DLC on
DMSHP
• BTM thermal storage • BTM thermal storage
Unitil
• Battery Storage for existing solar PV systems
• Operations Changes to Reduce Demand
Key DLC – Direct Load Control DMSHP – Ductless Mini-Split Heat Pumps BTM – Behind the Meter EMS – Energy Management System


