29
Bank Name Banca Monte dei Paschi di Siena S.p.A. LEI Code J4CP7MHCXR8DAQMKIL78 Country Code IT Ba 2016 EU-wide Stress Test
| Date post: | 07-May-2018 |
| Category: |
Documents |
| Upload: | truongdang |
| View: | 227 times |
| Download: | 5 times |

Bank Name Banca Monte dei Paschi di Siena S.p.A.
LEI Code J4CP7MHCXR8DAQMKIL78
Country Code ITBa
2016 EU-wide Stress Test

Actual
(starting year)Baseline Scenario Adverse Scenario
(mln EUR, %) 31/12/2015 31/12/2018 31/12/2018
Cumulative 3y: Net interest income 8,463.63 3,933.10
Cumulative 3y: Gains or (-) losses on financial assets and liabilities held for trading or designated at fair value through profit
and loss, net23.74 -206.10
Cumulative 3y: (Impairment or (-) reversal of impairment on financial assets not measured at fair value through profit or loss) -3,809.42 -7,684.89
Cumulative 3y: Profit or (-) loss for the year 1,496.65 -5,239.17
Coverage ratio - Default stock 48.03% 47.01% 50.42%
Common Equity Tier 1 capital 8,503.14 8,531.37 -1,604.41
Total Risk exposure amount 70,828.48 70,839.15 72,013.84
Common Equity Tier 1 ratio, % 12.0% 12.0% -2.2%
Fully loaded Common Equity Tier 1 ratio, % 12.1% 12.2% -2.4%
Tier 1 capital 9,101.45 9,001.15 -1,134.63
Total leverage ratio exposures 174,280.36 174,280.36 174,280.36
Leverage ratio, % 5.2% 5.2% -0.7%
Fully loaded leverage ratio, % 4.9% 5.0% -0.9%
Total amount of instruments with mandatory conversion into ordinary shares upon a fixed date in the 2016 -2018 period
(cumulative conversions)1 0
Total Additional Tier 1 and Tier 2 instruments eligible as regulatory capital under the CRR provisions that convert into Common
Equity Tier 1 or are written down upon a trigger event2 0
Of which: eligible instruments whose trigger is above CET1 capital ratio in the adverse scenario2 0
1 Conversions not considered for CET1 computation
2 Excluding instruments with mandatory conversion into ordinary shares upon a fixed date in the 2016 -2018 period
2016 EU-wide Stress Test: SummaryBanca Monte dei Paschi di Siena S.p.A.
Memorandum items

2016 EU-wide Stress Test:
Credit risk IRBBanca Monte dei Paschi di Siena S.p.A.
(mln EUR, %)
Non-defaulted Defaulted Non-defaulted Defaulted Non-defaulted Defaulted Non-defaulted Defaulted Non-defaulted Defaulted Non-defaulted Defaulted
Central banks and central governments 0 0 0 0 0 0 0 0 0 0 0 0 -
Institutions 0 0 0 0 0 0 0 0 0 0 0 0 -
Corporates 25,688 25,199 1,511 1,088 20,666 0 1,506 0 293 11,796 22 344 46.3%
Corporates - Of Which: Specialised Lending 0 0 1,511 1,088 0 0 1,506 0 0 0 22 344 31.6%
Corporates - Of Which: SME 14,280 19,919 0 0 10,698 0 0 0 187 9,168 0 0 46.2%
Retail 45,387 18,324 0 0 11,259 0 0 0 261 9,296 0 0 50.8%
Retail - Secured on real estate property 33,382 4,841 0 0 6,160 0 0 0 93 1,086 0 0 22.4%
Retail - Secured on real estate property - Of Which: SME 6,259 2,835 0 0 2,895 0 0 0 54 724 0 0 25.5%
Retail - Secured on real estate property - Of Which: non-SME 27,123 2,006 0 0 3,265 0 0 0 39 361 0 0 18.0%
Retail - Qualifying Revolving 7 0 0 0 1 0 0 0 0 0 0 0 31.8%
Retail - Other Retail 11,998 13,482 0 0 5,097 0 0 0 168 8,211 0 0 60.9%
Retail - Other Retail - Of Which: SME 10,480 10,079 0 0 4,658 0 0 0 158 6,416 0 0 63.7%
Retail - Other Retail - Of Which: non-SME 1,517 3,403 0 0 439 0 0 0 11 1,795 0 0 52.7%
Equity 0 0 0 0 0 0 0 0 0 0 0 0 -
Securitisation
Other non-credit obligation assets 0 0 0 0 0 0 0 0 0 0 0 0 -
IRB TOTAL 71,075 43,522 1,511 1,088 31,925 0 1,506 0 554 21,093 22 344 48.2%1 Computed as: Stock of provisions for defaulted stock / default stock (as defined in paragraphs 59 and 61 of the Methodological note)
(mln EUR, %)Non-defaulted Defaulted Non-defaulted Defaulted Non-defaulted Defaulted Non-defaulted Defaulted Non-defaulted Defaulted Non-defaulted Defaulted
Central banks and central governments 0 0 0 0 0 0 0 0 0 0 0 0 -
Institutions 0 0 0 0 0 0 0 0 0 0 0 0 -
Corporates 25,688 25,199 1,485 1,072 20,666 0 1,483 0 293 11,796 22 342 46.4%
Corporates - Of Which: Specialised Lending 0 0 1,485 1,072 0 0 1,483 0 0 0 22 342 31.9%
Corporates - Of Which: SME 14,280 19,919 0 0 10,698 0 0 0 187 9,168 0 0 46.2%
Retail 45,318 18,304 0 0 11,250 0 0 0 261 9,289 0 0 50.8%
Retail - Secured on real estate property 33,315 4,833 0 0 6,152 0 0 0 93 1,084 0 0 22.4%
Retail - Secured on real estate property - Of Which: SME 6,259 2,835 0 0 2,895 0 0 0 54 724 0 0 25.5%
Retail - Secured on real estate property - Of Which: non-SME 27,056 1,998 0 0 3,256 0 0 0 38 360 0 0 18.0%
Retail - Qualifying Revolving 7 0 0 0 1 0 0 0 0 0 0 0 31.8%
Retail - Other Retail 11,996 13,471 0 0 5,097 0 0 0 168 8,205 0 0 60.9%
Retail - Other Retail - Of Which: SME 10,480 10,079 0 0 4,658 0 0 0 158 6,416 0 0 63.7%
Retail - Other Retail - Of Which: non-SME 1,515 3,392 0 0 438 0 0 0 11 1,789 0 0 52.7%
Equity 0 0 0 0 0 0 0 0 0 0 0 0 -
Securitisation
Other non-credit obligation assets 0 0 0 0 0 0 0 0 0 0 0 0 -
IRB TOTAL 71,006 43,503 1,485 1,072 31,916 0 1,483 0 554 21,085 22 342 48.2%1 Computed as: Stock of provisions for defaulted stock / default stock (as defined in paragraphs 59 and 61 of the Methodological note)
(mln EUR, %)Non-defaulted Defaulted Non-defaulted Defaulted Non-defaulted Defaulted Non-defaulted Defaulted Non-defaulted Defaulted Non-defaulted Defaulted
Central banks and central governments 0 0 0 0 0 0 0 0 0 0 0 0 -
Institutions 0 0 0 0 0 0 0 0 0 0 0 0 -
Corporates 0 0 0 0 0 0 0 0 0 0 0 0 -
Corporates - Of Which: Specialised Lending 0 0 0 0 0 0 0 0 0 0 0 0 -
Corporates - Of Which: SME 0 0 0 0 0 0 0 0 0 0 0 0 -
Retail 0 0 0 0 0 0 0 0 0 0 0 0 -
Retail - Secured on real estate property 0 0 0 0 0 0 0 0 0 0 0 0 -
Retail - Secured on real estate property - Of Which: SME 0 0 0 0 0 0 0 0 0 0 0 0 -
Retail - Secured on real estate property - Of Which: non-SME 0 0 0 0 0 0 0 0 0 0 0 0 -
Retail - Qualifying Revolving 0 0 0 0 0 0 0 0 0 0 0 0 -
Retail - Other Retail 0 0 0 0 0 0 0 0 0 0 0 0 -
Retail - Other Retail - Of Which: SME 0 0 0 0 0 0 0 0 0 0 0 0 -
Retail - Other Retail - Of Which: non-SME 0 0 0 0 0 0 0 0 0 0 0 0 -
Equity 0 0 0 0 0 0 0 0 0 0 0 0 -
Securitisation
Other non-credit obligation assets 0 0 0 0 0 0 0 0 0 0 0 0 -
IRB TOTAL 0 0 0 0 0 0 0 0 0 0 0 0 -1 Computed as: Stock of provisions for defaulted stock / default stock (as defined in paragraphs 59 and 61 of the Methodological note)
0
A-IRB F-IRB A-IRB F-IRB
0
31/12/2015
Exposure values Risk exposure amounts Stock of provisions
Coverage Ratio -
Default Stock1
A-IRB F-IRB
Coverage Ratio -
Default Stock1
A-IRB F-IRB A-IRB F-IRB A-IRB F-IRB
Italy
31/12/2015
Exposure values Risk exposure amounts Stock of provisions
F-IRB A-IRB F-IRB
31/12/2015
Exposure values Risk exposure amounts Stock of provisions
Coverage Ratio -
Default Stock1
A-IRB F-IRB A-IRB
Banca Monte dei Paschi di Siena
S.p.A.
F-IRB A-IRB F-IRB A-IRB F-IRB
31/12/2015
Exposure values Risk exposure amounts Stock of provisions
Coverage Ratio -
Default Stock1
A-IRB
2016 EU-wide Stress Test:
Credit risk IRBBanca Monte dei Paschi di Siena S.p.A.
(mln EUR, %)Non-defaulted Defaulted Non-defaulted Defaulted Non-defaulted Defaulted Non-defaulted Defaulted Non-defaulted Defaulted Non-defaulted Defaulted
Central banks and central governments 0 0 0 0 0 0 0 0 0 0 0 0 -
Institutions 0 0 0 0 0 0 0 0 0 0 0 0 -
Corporates 0 0 0 0 0 0 0 0 0 0 0 0 -
Corporates - Of Which: Specialised Lending 0 0 0 0 0 0 0 0 0 0 0 0 -
Corporates - Of Which: SME 0 0 0 0 0 0 0 0 0 0 0 0 -
Retail 0 0 0 0 0 0 0 0 0 0 0 0 -
Retail - Secured on real estate property 0 0 0 0 0 0 0 0 0 0 0 0 -
Retail - Secured on real estate property - Of Which: SME 0 0 0 0 0 0 0 0 0 0 0 0 -
Retail - Secured on real estate property - Of Which: non-SME 0 0 0 0 0 0 0 0 0 0 0 0 -
Retail - Qualifying Revolving 0 0 0 0 0 0 0 0 0 0 0 0 -
Retail - Other Retail 0 0 0 0 0 0 0 0 0 0 0 0 -
Retail - Other Retail - Of Which: SME 0 0 0 0 0 0 0 0 0 0 0 0 -
Retail - Other Retail - Of Which: non-SME 0 0 0 0 0 0 0 0 0 0 0 0 -
Equity 0 0 0 0 0 0 0 0 0 0 0 0 -
Securitisation
Other non-credit obligation assets 0 0 0 0 0 0 0 0 0 0 0 0 -
IRB TOTAL 0 0 0 0 0 0 0 0 0 0 0 0 -1 Computed as: Stock of provisions for defaulted stock / default stock (as defined in paragraphs 59 and 61 of the Methodological note)
0
A-IRB F-IRB A-IRB F-IRB
0
31/12/2015
Exposure values Risk exposure amounts Stock of provisions
Coverage Ratio -
Default Stock1
A-IRB F-IRB
Stock of provisions
Coverage Ratio -
Default Stock1
A-IRB F-IRB A-IRB F-IRB A-IRB F-IRB
0
31/12/2015
Exposure values Risk exposure amounts
A-IRB F-IRB A-IRB F-IRB
0
31/12/2015
Exposure values Risk exposure amounts Stock of provisions
Coverage Ratio -
Default Stock1
A-IRB F-IRB
Stock of provisions
Coverage Ratio -
Default Stock1
A-IRB F-IRB A-IRB F-IRB A-IRB F-IRB
31/12/2015
Exposure values Risk exposure amounts
2016 EU-wide Stress Test:
Credit risk IRBBanca Monte dei Paschi di Siena S.p.A.
(mln EUR, %)Non-defaulted Defaulted Non-defaulted Defaulted Non-defaulted Defaulted Non-defaulted Defaulted Non-defaulted Defaulted Non-defaulted Defaulted
Central banks and central governments 0 0 0 0 0 0 0 0 0 0 0 0 -
Institutions 0 0 0 0 0 0 0 0 0 0 0 0 -
Corporates 0 0 0 0 0 0 0 0 0 0 0 0 -
Corporates - Of Which: Specialised Lending 0 0 0 0 0 0 0 0 0 0 0 0 -
Corporates - Of Which: SME 0 0 0 0 0 0 0 0 0 0 0 0 -
Retail 0 0 0 0 0 0 0 0 0 0 0 0 -
Retail - Secured on real estate property 0 0 0 0 0 0 0 0 0 0 0 0 -
Retail - Secured on real estate property - Of Which: SME 0 0 0 0 0 0 0 0 0 0 0 0 -
Retail - Secured on real estate property - Of Which: non-SME 0 0 0 0 0 0 0 0 0 0 0 0 -
Retail - Qualifying Revolving 0 0 0 0 0 0 0 0 0 0 0 0 -
Retail - Other Retail 0 0 0 0 0 0 0 0 0 0 0 0 -
Retail - Other Retail - Of Which: SME 0 0 0 0 0 0 0 0 0 0 0 0 -
Retail - Other Retail - Of Which: non-SME 0 0 0 0 0 0 0 0 0 0 0 0 -
Equity 0 0 0 0 0 0 0 0 0 0 0 0 -
Securitisation
Other non-credit obligation assets 0 0 0 0 0 0 0 0 0 0 0 0 -
IRB TOTAL 0 0 0 0 0 0 0 0 0 0 0 0 -1 Computed as: Stock of provisions for defaulted stock / default stock (as defined in paragraphs 59 and 61 of the Methodological note)
(mln EUR, %)Non-defaulted Defaulted Non-defaulted Defaulted Non-defaulted Defaulted Non-defaulted Defaulted Non-defaulted Defaulted Non-defaulted Defaulted
Central banks and central governments 0 0 0 0 0 0 0 0 0 0 0 0 -
Institutions 0 0 0 0 0 0 0 0 0 0 0 0 -
Corporates 0 0 0 0 0 0 0 0 0 0 0 0 -
Corporates - Of Which: Specialised Lending 0 0 0 0 0 0 0 0 0 0 0 0 -
Corporates - Of Which: SME 0 0 0 0 0 0 0 0 0 0 0 0 -
Retail 0 0 0 0 0 0 0 0 0 0 0 0 -
Retail - Secured on real estate property 0 0 0 0 0 0 0 0 0 0 0 0 -
Retail - Secured on real estate property - Of Which: SME 0 0 0 0 0 0 0 0 0 0 0 0 -
Retail - Secured on real estate property - Of Which: non-SME 0 0 0 0 0 0 0 0 0 0 0 0 -
Retail - Qualifying Revolving 0 0 0 0 0 0 0 0 0 0 0 0 -
Retail - Other Retail 0 0 0 0 0 0 0 0 0 0 0 0 -
Retail - Other Retail - Of Which: SME 0 0 0 0 0 0 0 0 0 0 0 0 -
Retail - Other Retail - Of Which: non-SME 0 0 0 0 0 0 0 0 0 0 0 0 -
Equity 0 0 0 0 0 0 0 0 0 0 0 0 -
Securitisation
Other non-credit obligation assets 0 0 0 0 0 0 0 0 0 0 0 0 -
IRB TOTAL 0 0 0 0 0 0 0 0 0 0 0 0 -1 Computed as: Stock of provisions for defaulted stock / default stock (as defined in paragraphs 59 and 61 of the Methodological note)
(mln EUR, %)Non-defaulted Defaulted Non-defaulted Defaulted Non-defaulted Defaulted Non-defaulted Defaulted Non-defaulted Defaulted Non-defaulted Defaulted
Central banks and central governments 0 0 0 0 0 0 0 0 0 0 0 0 -
Institutions 0 0 0 0 0 0 0 0 0 0 0 0 -
Corporates 0 0 0 0 0 0 0 0 0 0 0 0 -
Corporates - Of Which: Specialised Lending 0 0 0 0 0 0 0 0 0 0 0 0 -
Corporates - Of Which: SME 0 0 0 0 0 0 0 0 0 0 0 0 -
Retail 0 0 0 0 0 0 0 0 0 0 0 0 -
Retail - Secured on real estate property 0 0 0 0 0 0 0 0 0 0 0 0 -
Retail - Secured on real estate property - Of Which: SME 0 0 0 0 0 0 0 0 0 0 0 0 -
Retail - Secured on real estate property - Of Which: non-SME 0 0 0 0 0 0 0 0 0 0 0 0 -
Retail - Qualifying Revolving 0 0 0 0 0 0 0 0 0 0 0 0 -
Retail - Other Retail 0 0 0 0 0 0 0 0 0 0 0 0 -
Retail - Other Retail - Of Which: SME 0 0 0 0 0 0 0 0 0 0 0 0 -
Retail - Other Retail - Of Which: non-SME 0 0 0 0 0 0 0 0 0 0 0 0 -
Equity 0 0 0 0 0 0 0 0 0 0 0 0 -
Securitisation
Other non-credit obligation assets 0 0 0 0 0 0 0 0 0 0 0 0 -
IRB TOTAL 0 0 0 0 0 0 0 0 0 0 0 0 -1 Computed as: Stock of provisions for defaulted stock / default stock (as defined in paragraphs 59 and 61 of the Methodological note)
0
Stock of provisions
Coverage Ratio -
Default Stock1
A-IRB F-IRB A-IRB F-IRB A-IRB F-IRB
0
31/12/2015
Exposure values Risk exposure amounts
A-IRB F-IRB A-IRB F-IRB
0
31/12/2015
Exposure values Risk exposure amounts Stock of provisions
Coverage Ratio -
Default Stock1
A-IRB F-IRB
Stock of provisions
Coverage Ratio -
Default Stock1
A-IRB F-IRB A-IRB F-IRB A-IRB F-IRB
31/12/2015
Exposure values Risk exposure amounts
2016 EU-wide Stress Test:
Credit risk IRBBanca Monte dei Paschi di Siena S.p.A.
(mln EUR, %)
Central banks and central governments
Institutions
Corporates
Corporates - Of Which: Specialised Lending
Corporates - Of Which: SME
Retail
Retail - Secured on real estate property
Retail - Secured on real estate property - Of Which: SME
Retail - Secured on real estate property - Of Which: non-SME
Retail - Qualifying Revolving
Retail - Other Retail
Retail - Other Retail - Of Which: SME
Retail - Other Retail - Of Which: non-SME
Equity
Securitisation
Other non-credit obligation assets
IRB TOTAL1 Computed as: Stock of provisions for defaulted stock / default stock (as defined in paragraphs 59 and 61 of the Methodological note)
0
0
Italy
Banca Monte dei Paschi di Siena
S.p.A.
Impairment
rate
Stock of
Provisions
Coverage Ratio -
Default Stock1
Impairment
rate
Stock of
Provisions
Coverage Ratio -
Default Stock1
Impairment
rate
Stock of
Provisions
Coverage Ratio -
Default Stock1
Impairment
rate
Stock of
Provisions
Coverage Ratio -
Default Stock1
Impairment
rate
Stock of
Provisions
Coverage Ratio -
Default Stock1
Impairment
rate
Stock of
Provisions
Coverage Ratio -
Default Stock1
- 0 - - 0 - - 0 - - 0 - - 0 - - 0 -
- 0 - - 0 - - 0 - - 0 - - 0 - - 0 -
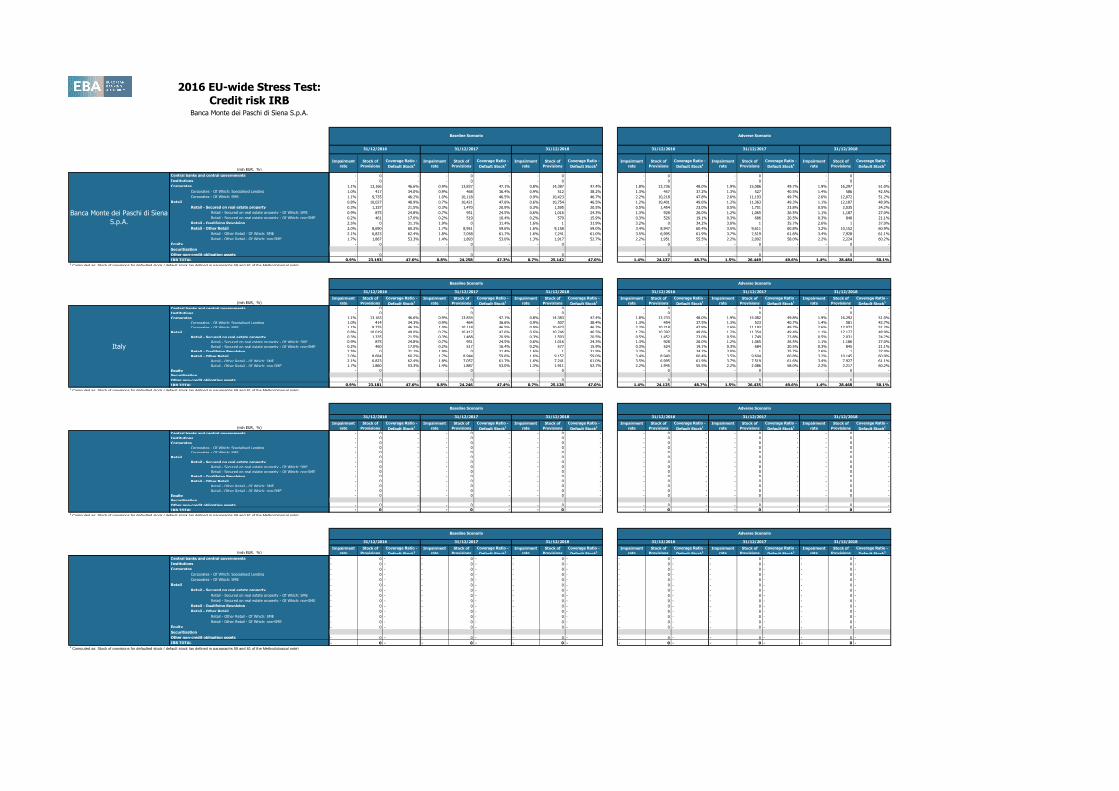
1.1% 13,166 46.6% 0.9% 13,837 47.1% 0.8% 14,387 47.4% 1.8% 13,736 48.0% 1.9% 15,086 49.7% 1.9% 16,297 51.0%
1.0% 417 34.0% 0.9% 468 36.4% 0.9% 512 38.2% 1.3% 457 37.2% 1.3% 527 40.5% 1.4% 586 42.5%
1.1% 9,735 46.2% 1.0% 10,118 46.5% 0.9% 10,423 46.7% 2.2% 10,218 47.8% 2.6% 11,193 49.7% 2.6% 12,072 51.2%
0.8% 10,027 48.9% 0.7% 10,421 47.6% 0.6% 10,754 46.5% 1.2% 10,401 49.6% 1.2% 11,363 49.3% 1.1% 12,187 48.9%
0.3% 1,337 21.5% 0.3% 1,470 20.9% 0.3% 1,595 20.5% 0.5% 1,454 23.0% 0.5% 1,751 23.8% 0.5% 2,035 24.2%
0.9% 875 24.8% 0.7% 951 24.5% 0.6% 1,016 24.3% 1.3% 928 26.0% 1.2% 1,065 26.5% 1.1% 1,187 27.0%
0.2% 461 17.0% 0.2% 519 16.4% 0.2% 579 15.9% 0.3% 526 19.1% 0.3% 686 20.5% 0.3% 848 21.1%
2.5% 0 31.1% 1.9% 0 31.4% 1.6% 1 31.9% 3.2% 0 34.2% 3.0% 1 35.7% 2.6% 1 37.0%
2.0% 8,690 60.2% 1.7% 8,951 59.6% 1.6% 9,158 59.0% 3.4% 8,947 60.4% 3.5% 9,611 60.8% 3.2% 10,152 60.9%
2.1% 6,823 62.4% 1.8% 7,058 61.7% 1.6% 7,241 61.0% 3.5% 6,995 61.9% 3.7% 7,519 61.6% 3.4% 7,928 61.1%
1.7% 1,867 53.3% 1.4% 1,893 53.0% 1.3% 1,917 52.7% 2.2% 1,951 55.5% 2.2% 2,092 58.0% 2.2% 2,224 60.2%
- 0 - - 0 - - 0 - - 0 - - 0 - - 0 -
- 0 - - 0 - - 0 - - 0 - - 0 - - 0 -
0.9% 23,193 47.6% 0.8% 24,258 47.3% 0.7% 25,142 47.0% 1.4% 24,137 48.7% 1.5% 26,449 49.6% 1.4% 28,484 50.1%
Impairment
rate
Stock of
Provisions
Coverage Ratio -
Default Stock1
Impairment
rate
Stock of
Provisions
Coverage Ratio -
Default Stock1
Impairment
rate
Stock of
Provisions
Coverage Ratio -
Default Stock1
Impairment
rate
Stock of
Provisions
Coverage Ratio -
Default Stock1
Impairment
rate
Stock of
Provisions
Coverage Ratio -
Default Stock1
Impairment
rate
Stock of
Provisions
Coverage Ratio -
Default Stock1
- 0 - - 0 - - 0 - - 0 - - 0 - - 0 -
- 0 - - 0 - - 0 - - 0 - - 0 - - 0 -
1.1% 13,163 46.6% 0.9% 13,834 47.1% 0.8% 14,383 47.4% 1.8% 13,733 48.0% 1.9% 15,082 49.8% 1.9% 16,292 51.0%
1.0% 414 34.3% 0.9% 464 36.6% 0.9% 507 38.4% 1.3% 454 37.5% 1.3% 523 40.7% 1.4% 581 42.7%
1.1% 9,735 46.2% 1.0% 10,118 46.5% 0.9% 10,423 46.7% 2.2% 10,218 47.8% 2.6% 11,193 49.7% 2.6% 12,072 51.2%
0.8% 10,019 49.0% 0.7% 10,412 47.6% 0.6% 10,746 46.5% 1.2% 10,392 49.6% 1.2% 11,354 49.4% 1.1% 12,177 48.9%
0.3% 1,335 21.5% 0.3% 1,468 20.9% 0.3% 1,593 20.5% 0.5% 1,452 23.0% 0.5% 1,749 23.8% 0.5% 2,031 24.2%
0.9% 875 24.8% 0.7% 951 24.5% 0.6% 1,016 24.3% 1.3% 928 26.0% 1.2% 1,065 26.5% 1.1% 1,186 27.0%
0.2% 460 17.0% 0.2% 517 16.4% 0.2% 577 15.9% 0.3% 524 19.1% 0.3% 684 20.5% 0.3% 845 21.1%
2.5% 0 31.1% 1.9% 0 31.4% 1.6% 1 31.9% 3.2% 0 34.2% 3.0% 1 35.7% 2.6% 1 37.0%
2.0% 8,684 60.2% 1.7% 8,944 59.6% 1.6% 9,152 59.0% 3.4% 8,940 60.4% 3.5% 9,604 60.8% 3.2% 10,145 60.9%
2.1% 6,823 62.4% 1.8% 7,057 61.7% 1.6% 7,241 61.0% 3.5% 6,995 61.9% 3.7% 7,519 61.6% 3.4% 7,927 61.1%
1.7% 1,860 53.3% 1.4% 1,887 53.0% 1.3% 1,911 52.7% 2.2% 1,945 55.5% 2.2% 2,086 58.0% 2.2% 2,217 60.2%
- 0 - - 0 - - 0 - - 0 - - 0 - - 0 -
- 0 - - 0 - - 0 - - 0 - - 0 - - 0 -
0.9% 23,181 47.6% 0.8% 24,246 47.4% 0.7% 25,128 47.0% 1.4% 24,125 48.7% 1.5% 26,435 49.6% 1.4% 28,468 50.1%
Impairment
rate
Stock of
Provisions
Coverage Ratio -
Default Stock1
Impairment
rate
Stock of
Provisions
Coverage Ratio -
Default Stock1
Impairment
rate
Stock of
Provisions
Coverage Ratio -
Default Stock1
Impairment
rate
Stock of
Provisions
Coverage Ratio -
Default Stock1
Impairment
rate
Stock of
Provisions
Coverage Ratio -
Default Stock1
Impairment
rate
Stock of
Provisions
Coverage Ratio -
Default Stock1
- 0 - - 0 - - 0 - - 0 - - 0 - - 0 -
- 0 - - 0 - - 0 - - 0 - - 0 - - 0 -
- 0 - - 0 - - 0 - - 0 - - 0 - - 0 -
- 0 - - 0 - - 0 - - 0 - - 0 - - 0 -
- 0 - - 0 - - 0 - - 0 - - 0 - - 0 -
- 0 - - 0 - - 0 - - 0 - - 0 - - 0 -
- 0 - - 0 - - 0 - - 0 - - 0 - - 0 -
- 0 - - 0 - - 0 - - 0 - - 0 - - 0 -
- 0 - - 0 - - 0 - - 0 - - 0 - - 0 -
- 0 - - 0 - - 0 - - 0 - - 0 - - 0 -
- 0 - - 0 - - 0 - - 0 - - 0 - - 0 -
- 0 - - 0 - - 0 - - 0 - - 0 - - 0 -
- 0 - - 0 - - 0 - - 0 - - 0 - - 0 -
- 0 - - 0 - - 0 - - 0 - - 0 - - 0 -
- 0 - - 0 - - 0 - - 0 - - 0 - - 0 -
- 0 - - 0 - - 0 - - 0 - - 0 - - 0 -
Impairment
rate
Stock of
Provisions
Coverage Ratio -
Default Stock1
Impairment
rate
Stock of
Provisions
Coverage Ratio -
Default Stock1
Impairment
rate
Stock of
Provisions
Coverage Ratio -
Default Stock1
Impairment
rate
Stock of
Provisions
Coverage Ratio -
Default Stock1
Impairment
rate
Stock of
Provisions
Coverage Ratio -
Default Stock1
Impairment
rate
Stock of
Provisions
Coverage Ratio -
Default Stock1
- 0 - - 0 - - 0 - - 0 - - 0 - - 0 -
- 0 - - 0 - - 0 - - 0 - - 0 - - 0 -
- 0 - - 0 - - 0 - - 0 - - 0 - - 0 -
- 0 - - 0 - - 0 - - 0 - - 0 - - 0 -
- 0 - - 0 - - 0 - - 0 - - 0 - - 0 -
- 0 - - 0 - - 0 - - 0 - - 0 - - 0 -
- 0 - - 0 - - 0 - - 0 - - 0 - - 0 -
- 0 - - 0 - - 0 - - 0 - - 0 - - 0 -
- 0 - - 0 - - 0 - - 0 - - 0 - - 0 -
- 0 - - 0 - - 0 - - 0 - - 0 - - 0 -
- 0 - - 0 - - 0 - - 0 - - 0 - - 0 -
- 0 - - 0 - - 0 - - 0 - - 0 - - 0 -
- 0 - - 0 - - 0 - - 0 - - 0 - - 0 -
- 0 - - 0 - - 0 - - 0 - - 0 - - 0 -
- 0 - - 0 - - 0 - - 0 - - 0 - - 0 -
- 0 - - 0 - - 0 - - 0 - - 0 - - 0 -
31/12/2016 31/12/2017
Baseline Scenario Adverse Scenario
31/12/2018 31/12/2016 31/12/2017 31/12/2018
31/12/2016 31/12/2017 31/12/2018 31/12/2016 31/12/2017 31/12/2018
Baseline Scenario Adverse Scenario
31/12/2016 31/12/2017 31/12/2018
Baseline Scenario Adverse Scenario
31/12/2016 31/12/2017 31/12/2018
31/12/2017 31/12/2018 31/12/2016 31/12/2017 31/12/201831/12/2016
Baseline Scenario Adverse Scenario

2016 EU-wide Stress Test:
Credit risk IRBBanca Monte dei Paschi di Siena S.p.A.
(mln EUR, %)
Central banks and central governments
Institutions
Corporates
Corporates - Of Which: Specialised Lending
Corporates - Of Which: SME
Retail
Retail - Secured on real estate property
Retail - Secured on real estate property - Of Which: SME
Retail - Secured on real estate property - Of Which: non-SME
Retail - Qualifying Revolving
Retail - Other Retail
Retail - Other Retail - Of Which: SME
Retail - Other Retail - Of Which: non-SME
Equity
Securitisation
Other non-credit obligation assets
IRB TOTAL1 Computed as: Stock of provisions for defaulted stock / default stock (as defined in paragraphs 59 and 61 of the Methodological note)
(mln EUR, %)
Central banks and central governments
Institutions
Corporates
Corporates - Of Which: Specialised Lending
Corporates - Of Which: SME
Retail
Retail - Secured on real estate property
Retail - Secured on real estate property - Of Which: SME
Retail - Secured on real estate property - Of Which: non-SME
Retail - Qualifying Revolving
Retail - Other Retail
Retail - Other Retail - Of Which: SME
Retail - Other Retail - Of Which: non-SME
Equity
Securitisation
Other non-credit obligation assets
IRB TOTAL1 Computed as: Stock of provisions for defaulted stock / default stock (as defined in paragraphs 59 and 61 of the Methodological note)
(mln EUR, %)
Central banks and central governments
Institutions
Corporates
Corporates - Of Which: Specialised Lending
Corporates - Of Which: SME
Retail
Retail - Secured on real estate property
Retail - Secured on real estate property - Of Which: SME
Retail - Secured on real estate property - Of Which: non-SME
Retail - Qualifying Revolving
Retail - Other Retail
Retail - Other Retail - Of Which: SME
Retail - Other Retail - Of Which: non-SME
Equity
Securitisation
Other non-credit obligation assets
IRB TOTAL1 Computed as: Stock of provisions for defaulted stock / default stock (as defined in paragraphs 59 and 61 of the Methodological note)
(mln EUR, %)
Central banks and central governments
Institutions
Corporates
Corporates - Of Which: Specialised Lending
Corporates - Of Which: SME
Retail
Retail - Secured on real estate property
Retail - Secured on real estate property - Of Which: SME
Retail - Secured on real estate property - Of Which: non-SME
Retail - Qualifying Revolving
Retail - Other Retail
Retail - Other Retail - Of Which: SME
Retail - Other Retail - Of Which: non-SME
Equity
Securitisation
Other non-credit obligation assets
IRB TOTAL1 Computed as: Stock of provisions for defaulted stock / default stock (as defined in paragraphs 59 and 61 of the Methodological note)
0
0
0
0
Impairment
rate
Stock of
Provisions
Coverage Ratio -
Default Stock1
Impairment
rate
Stock of
Provisions
Coverage Ratio -
Default Stock1
Impairment
rate
Stock of
Provisions
Coverage Ratio -
Default Stock1
Impairment
rate
Stock of
Provisions
Coverage Ratio -
Default Stock1
Impairment
rate
Stock of
Provisions
Coverage Ratio -
Default Stock1
Impairment
rate
Stock of
Provisions
Coverage Ratio -
Default Stock1
- 0 - - 0 - - 0 - - 0 - - 0 - - 0 -
- 0 - - 0 - - 0 - - 0 - - 0 - - 0 -
- 0 - - 0 - - 0 - - 0 - - 0 - - 0 -
- 0 - - 0 - - 0 - - 0 - - 0 - - 0 -
- 0 - - 0 - - 0 - - 0 - - 0 - - 0 -
- 0 - - 0 - - 0 - - 0 - - 0 - - 0 -
- 0 - - 0 - - 0 - - 0 - - 0 - - 0 -
- 0 - - 0 - - 0 - - 0 - - 0 - - 0 -
- 0 - - 0 - - 0 - - 0 - - 0 - - 0 -
- 0 - - 0 - - 0 - - 0 - - 0 - - 0 -
- 0 - - 0 - - 0 - - 0 - - 0 - - 0 -
- 0 - - 0 - - 0 - - 0 - - 0 - - 0 -
- 0 - - 0 - - 0 - - 0 - - 0 - - 0 -
- 0 - - 0 - - 0 - - 0 - - 0 - - 0 -
- 0 - - 0 - - 0 - - 0 - - 0 - - 0 -
- 0 - - 0 - - 0 - - 0 - - 0 - - 0 -
Impairment
rate
Stock of
Provisions
Coverage Ratio -
Default Stock1
Impairment
rate
Stock of
Provisions
Coverage Ratio -
Default Stock1
Impairment
rate
Stock of
Provisions
Coverage Ratio -
Default Stock1
Impairment
rate
Stock of
Provisions
Coverage Ratio -
Default Stock1
Impairment
rate
Stock of
Provisions
Coverage Ratio -
Default Stock1
Impairment
rate
Stock of
Provisions
Coverage Ratio -
Default Stock1
- 0 - - 0 - - 0 - - 0 - - 0 - - 0 -
- 0 - - 0 - - 0 - - 0 - - 0 - - 0 -
- 0 - - 0 - - 0 - - 0 - - 0 - - 0 -
- 0 - - 0 - - 0 - - 0 - - 0 - - 0 -
- 0 - - 0 - - 0 - - 0 - - 0 - - 0 -
- 0 - - 0 - - 0 - - 0 - - 0 - - 0 -
- 0 - - 0 - - 0 - - 0 - - 0 - - 0 -
- 0 - - 0 - - 0 - - 0 - - 0 - - 0 -
- 0 - - 0 - - 0 - - 0 - - 0 - - 0 -
- 0 - - 0 - - 0 - - 0 - - 0 - - 0 -
- 0 - - 0 - - 0 - - 0 - - 0 - - 0 -
- 0 - - 0 - - 0 - - 0 - - 0 - - 0 -
- 0 - - 0 - - 0 - - 0 - - 0 - - 0 -
- 0 - - 0 - - 0 - - 0 - - 0 - - 0 -
- 0 - - 0 - - 0 - - 0 - - 0 - - 0 -
- 0 - - 0 - - 0 - - 0 - - 0 - - 0 -
Impairment
rate
Stock of
Provisions
Coverage Ratio -
Default Stock1
Impairment
rate
Stock of
Provisions
Coverage Ratio -
Default Stock1
Impairment
rate
Stock of
Provisions
Coverage Ratio -
Default Stock1
Impairment
rate
Stock of
Provisions
Coverage Ratio -
Default Stock1
Impairment
rate
Stock of
Provisions
Coverage Ratio -
Default Stock1
Impairment
rate
Stock of
Provisions
Coverage Ratio -
Default Stock1
- 0 - - 0 - - 0 - - 0 - - 0 - - 0 -
- 0 - - 0 - - 0 - - 0 - - 0 - - 0 -
- 0 - - 0 - - 0 - - 0 - - 0 - - 0 -
- 0 - - 0 - - 0 - - 0 - - 0 - - 0 -
- 0 - - 0 - - 0 - - 0 - - 0 - - 0 -
- 0 - - 0 - - 0 - - 0 - - 0 - - 0 -
- 0 - - 0 - - 0 - - 0 - - 0 - - 0 -
- 0 - - 0 - - 0 - - 0 - - 0 - - 0 -
- 0 - - 0 - - 0 - - 0 - - 0 - - 0 -
- 0 - - 0 - - 0 - - 0 - - 0 - - 0 -
- 0 - - 0 - - 0 - - 0 - - 0 - - 0 -
- 0 - - 0 - - 0 - - 0 - - 0 - - 0 -
- 0 - - 0 - - 0 - - 0 - - 0 - - 0 -
- 0 - - 0 - - 0 - - 0 - - 0 - - 0 -
- 0 - - 0 - - 0 - - 0 - - 0 - - 0 -
- 0 - - 0 - - 0 - - 0 - - 0 - - 0 -
Impairment
rate
Stock of
Provisions
Coverage Ratio -
Default Stock1
Impairment
rate
Stock of
Provisions
Coverage Ratio -
Default Stock1
Impairment
rate
Stock of
Provisions
Coverage Ratio -
Default Stock1
Impairment
rate
Stock of
Provisions
Coverage Ratio -
Default Stock1
Impairment
rate
Stock of
Provisions
Coverage Ratio -
Default Stock1
Impairment
rate
Stock of
Provisions
Coverage Ratio -
Default Stock1
- 0 - - 0 - - 0 - - 0 - - 0 - - 0 -
- 0 - - 0 - - 0 - - 0 - - 0 - - 0 -
- 0 - - 0 - - 0 - - 0 - - 0 - - 0 -
- 0 - - 0 - - 0 - - 0 - - 0 - - 0 -
- 0 - - 0 - - 0 - - 0 - - 0 - - 0 -
- 0 - - 0 - - 0 - - 0 - - 0 - - 0 -
- 0 - - 0 - - 0 - - 0 - - 0 - - 0 -
- 0 - - 0 - - 0 - - 0 - - 0 - - 0 -
- 0 - - 0 - - 0 - - 0 - - 0 - - 0 -
- 0 - - 0 - - 0 - - 0 - - 0 - - 0 -
- 0 - - 0 - - 0 - - 0 - - 0 - - 0 -
- 0 - - 0 - - 0 - - 0 - - 0 - - 0 -
- 0 - - 0 - - 0 - - 0 - - 0 - - 0 -
- 0 - - 0 - - 0 - - 0 - - 0 - - 0 -
- 0 - - 0 - - 0 - - 0 - - 0 - - 0 -
- 0 - - 0 - - 0 - - 0 - - 0 - - 0 -
31/12/2016 31/12/2017
Baseline Scenario Adverse Scenario
31/12/2018 31/12/2016 31/12/2017 31/12/2018
31/12/2016 31/12/2017 31/12/2018 31/12/2016 31/12/2017 31/12/2018
Baseline Scenario Adverse Scenario
31/12/2016 31/12/2017
Baseline Scenario Adverse Scenario
31/12/2018 31/12/2016 31/12/2017 31/12/2018
31/12/2016 31/12/2017 31/12/2018 31/12/2016 31/12/2017 31/12/2018
Baseline Scenario Adverse Scenario

2016 EU-wide Stress Test:
Credit risk IRBBanca Monte dei Paschi di Siena S.p.A.
(mln EUR, %)
Central banks and central governments
Institutions
Corporates
Corporates - Of Which: Specialised Lending
Corporates - Of Which: SME
Retail
Retail - Secured on real estate property
Retail - Secured on real estate property - Of Which: SME
Retail - Secured on real estate property - Of Which: non-SME
Retail - Qualifying Revolving
Retail - Other Retail
Retail - Other Retail - Of Which: SME
Retail - Other Retail - Of Which: non-SME
Equity
Securitisation
Other non-credit obligation assets
IRB TOTAL1 Computed as: Stock of provisions for defaulted stock / default stock (as defined in paragraphs 59 and 61 of the Methodological note)
(mln EUR, %)
Central banks and central governments
Institutions
Corporates
Corporates - Of Which: Specialised Lending
Corporates - Of Which: SME
Retail
Retail - Secured on real estate property
Retail - Secured on real estate property - Of Which: SME
Retail - Secured on real estate property - Of Which: non-SME
Retail - Qualifying Revolving
Retail - Other Retail
Retail - Other Retail - Of Which: SME
Retail - Other Retail - Of Which: non-SME
Equity
Securitisation
Other non-credit obligation assets
IRB TOTAL1 Computed as: Stock of provisions for defaulted stock / default stock (as defined in paragraphs 59 and 61 of the Methodological note)
(mln EUR, %)
Central banks and central governments
Institutions
Corporates
Corporates - Of Which: Specialised Lending
Corporates - Of Which: SME
Retail
Retail - Secured on real estate property
Retail - Secured on real estate property - Of Which: SME
Retail - Secured on real estate property - Of Which: non-SME
Retail - Qualifying Revolving
Retail - Other Retail
Retail - Other Retail - Of Which: SME
Retail - Other Retail - Of Which: non-SME
Equity
Securitisation
Other non-credit obligation assets
IRB TOTAL1 Computed as: Stock of provisions for defaulted stock / default stock (as defined in paragraphs 59 and 61 of the Methodological note)
0
0
0
Impairment
rate
Stock of
Provisions
Coverage Ratio -
Default Stock1
Impairment
rate
Stock of
Provisions
Coverage Ratio -
Default Stock1
Impairment
rate
Stock of
Provisions
Coverage Ratio -
Default Stock1
Impairment
rate
Stock of
Provisions
Coverage Ratio -
Default Stock1
Impairment
rate
Stock of
Provisions
Coverage Ratio -
Default Stock1
Impairment
rate
Stock of
Provisions
Coverage Ratio -
Default Stock1
- 0 - - 0 - - 0 - - 0 - - 0 - - 0 -
- 0 - - 0 - - 0 - - 0 - - 0 - - 0 -
- 0 - - 0 - - 0 - - 0 - - 0 - - 0 -
- 0 - - 0 - - 0 - - 0 - - 0 - - 0 -
- 0 - - 0 - - 0 - - 0 - - 0 - - 0 -
- 0 - - 0 - - 0 - - 0 - - 0 - - 0 -
- 0 - - 0 - - 0 - - 0 - - 0 - - 0 -
- 0 - - 0 - - 0 - - 0 - - 0 - - 0 -
- 0 - - 0 - - 0 - - 0 - - 0 - - 0 -
- 0 - - 0 - - 0 - - 0 - - 0 - - 0 -
- 0 - - 0 - - 0 - - 0 - - 0 - - 0 -
- 0 - - 0 - - 0 - - 0 - - 0 - - 0 -
- 0 - - 0 - - 0 - - 0 - - 0 - - 0 -
- 0 - - 0 - - 0 - - 0 - - 0 - - 0 -
- 0 - - 0 - - 0 - - 0 - - 0 - - 0 -
- 0 - - 0 - - 0 - - 0 - - 0 - - 0 -
Impairment
rate
Stock of
Provisions
Coverage Ratio -
Default Stock1
Impairment
rate
Stock of
Provisions
Coverage Ratio -
Default Stock1
Impairment
rate
Stock of
Provisions
Coverage Ratio -
Default Stock1
Impairment
rate
Stock of
Provisions
Coverage Ratio -
Default Stock1
Impairment
rate
Stock of
Provisions
Coverage Ratio -
Default Stock1
Impairment
rate
Stock of
Provisions
Coverage Ratio -
Default Stock1
- 0 - - 0 - - 0 - - 0 - - 0 - - 0 -
- 0 - - 0 - - 0 - - 0 - - 0 - - 0 -
- 0 - - 0 - - 0 - - 0 - - 0 - - 0 -
- 0 - - 0 - - 0 - - 0 - - 0 - - 0 -
- 0 - - 0 - - 0 - - 0 - - 0 - - 0 -
- 0 - - 0 - - 0 - - 0 - - 0 - - 0 -
- 0 - - 0 - - 0 - - 0 - - 0 - - 0 -
- 0 - - 0 - - 0 - - 0 - - 0 - - 0 -
- 0 - - 0 - - 0 - - 0 - - 0 - - 0 -
- 0 - - 0 - - 0 - - 0 - - 0 - - 0 -
- 0 - - 0 - - 0 - - 0 - - 0 - - 0 -
- 0 - - 0 - - 0 - - 0 - - 0 - - 0 -
- 0 - - 0 - - 0 - - 0 - - 0 - - 0 -
- 0 - - 0 - - 0 - - 0 - - 0 - - 0 -
- 0 - - 0 - - 0 - - 0 - - 0 - - 0 -
- 0 - - 0 - - 0 - - 0 - - 0 - - 0 -
Impairment
rate
Stock of
Provisions
Coverage Ratio -
Default Stock1
Impairment
rate
Stock of
Provisions
Coverage Ratio -
Default Stock1
Impairment
rate
Stock of
Provisions
Coverage Ratio -
Default Stock1
Impairment
rate
Stock of
Provisions
Coverage Ratio -
Default Stock1
Impairment
rate
Stock of
Provisions
Coverage Ratio -
Default Stock1
Impairment
rate
Stock of
Provisions
Coverage Ratio -
Default Stock1
- 0 - - 0 - - 0 - - 0 - - 0 - - 0 -
- 0 - - 0 - - 0 - - 0 - - 0 - - 0 -
- 0 - - 0 - - 0 - - 0 - - 0 - - 0 -
- 0 - - 0 - - 0 - - 0 - - 0 - - 0 -
- 0 - - 0 - - 0 - - 0 - - 0 - - 0 -
- 0 - - 0 - - 0 - - 0 - - 0 - - 0 -
- 0 - - 0 - - 0 - - 0 - - 0 - - 0 -
- 0 - - 0 - - 0 - - 0 - - 0 - - 0 -
- 0 - - 0 - - 0 - - 0 - - 0 - - 0 -
- 0 - - 0 - - 0 - - 0 - - 0 - - 0 -
- 0 - - 0 - - 0 - - 0 - - 0 - - 0 -
- 0 - - 0 - - 0 - - 0 - - 0 - - 0 -
- 0 - - 0 - - 0 - - 0 - - 0 - - 0 -
- 0 - - 0 - - 0 - - 0 - - 0 - - 0 -
- 0 - - 0 - - 0 - - 0 - - 0 - - 0 -
- 0 - - 0 - - 0 - - 0 - - 0 - - 0 -
31/12/2016 31/12/2017 31/12/2018 31/12/2016 31/12/2017 31/12/2018
Baseline Scenario Adverse Scenario
31/12/2016 31/12/2017
Baseline Scenario Adverse Scenario
31/12/2018 31/12/2016 31/12/2017 31/12/2018
31/12/2016 31/12/2017 31/12/2018 31/12/2016 31/12/2017 31/12/2018
Baseline Scenario Adverse Scenario

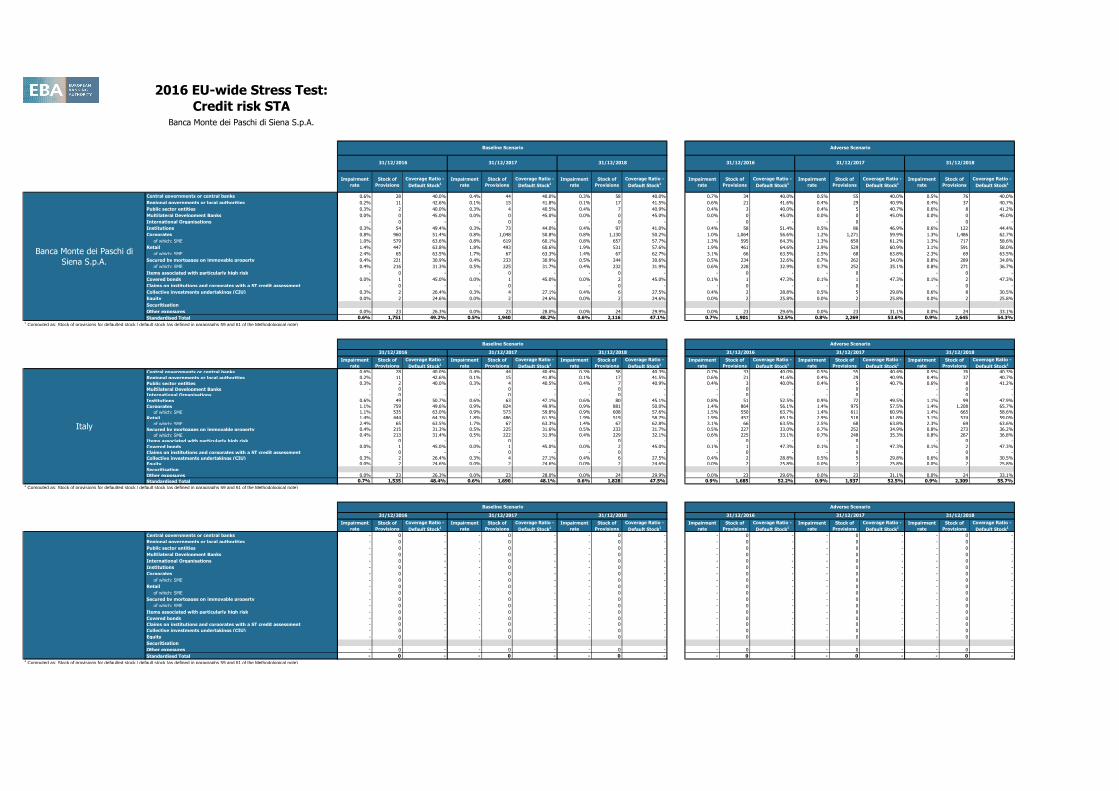
2016 EU-wide Stress Test:
Credit risk STABanca Monte dei Paschi di Siena S.p.A.
Non-defaulted Defaulted Non-defaulted Defaulted Non-defaulted Defaulted
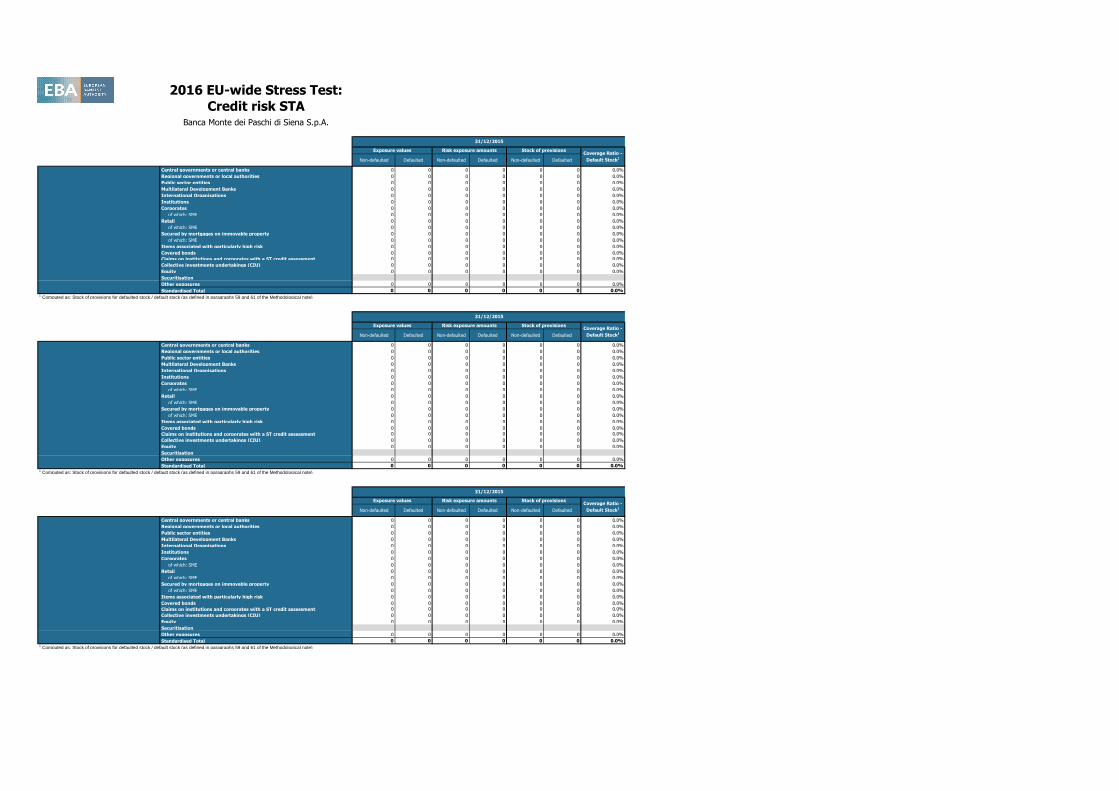
Central governments or central banks 26,617 0 3,623 0 1 0 0.0%
Regional governments or local authorities 2,140 11 427 7 3 4 44.9%
Public sector entities 580 0 396 0 1 0 0.0%
Multilateral Development Banks 42 0 0 0 0 0 0.0%
International Organisations 0 0 0 0 0 0 0.0%
Institutions 10,783 57 2,567 31 3 32 57.3%
Corporates 6,527 1,706 5,959 1,151 46 736 46.5%
of which: SME 3,943 847 3,515 399 32 419 57.8%
Retail 1,953 577 1,416 247 20 356 61.7%
of which: SME 41 98 23 42 1 61 61.8%
Secured by mortgages on immovable property 1,273 666 512 568 4 203 30.4%
of which: SME 516 665 229 567 3 202 30.4%
Items associated with particularly high risk 123 0 184 0 0 0 0.0%
Covered bonds 816 0 160 0 0 0 0.0%
Claims on institutions and corporates with a ST credit assessment 0 0 0 0 0 0 0.0%
Collective investments undertakings (CIU) 592 0 591 0 1 0 0.0%
Equity 1,630 0 2,720 0 1 0 0.0%
Securitisation
Other exposures 6,197 0 3,759 0 23 0 0.0%
Standardised Total 59,273 3,017 22,314 2,004 104 1,332 46.0%1 Computed as: Stock of provisions for defaulted stock / default stock (as defined in paragraphs 59 and 61 of the Methodological note)
Non-defaulted Defaulted Non-defaulted Defaulted Non-defaulted Defaulted
Central governments or central banks 25,722 0 3,408 0 1 0 0.0%
Regional governments or local authorities 2,140 11 427 7 3 4 44.9%
Public sector entities 542 0 385 0 1 0 0.0%
Multilateral Development Banks 0 0 0 0 0 0 0.0%
International Organisations 0 0 0 0 0 0 0.0%
Institutions 4,385 57 1,062 31 2 32 57.2%
Corporates 3,200 1,449 3,046 1,045 32 568 42.8%
of which: SME 2,816 807 2,692 395 24 383 55.9%
Retail 1,727 577 1,273 247 20 356 61.7%
of which: SME 40 98 23 42 1 61 61.8%
Secured by mortgages on immovable property 730 654 306 558 3 200 30.6%
of which: SME 513 653 228 557 3 200 30.6%
Items associated with particularly high risk 123 0 184 0 0 0 0.0%
Covered bonds 816 0 160 0 0 0 0.0%
Claims on institutions and corporates with a ST credit assessment 0 0 0 0 0 0 0.0%
Collective investments undertakings (CIU) 592 0 591 0 1 0 0.0%
Equity 1,630 0 2,720 0 1 0 0.0%
Securitisation
Other exposures 4,598 0 2,248 0 23 0 0.0%
Standardised Total 46,205 2,747 15,811 1,888 88 1,160 44.2%1 Computed as: Stock of provisions for defaulted stock / default stock (as defined in paragraphs 59 and 61 of the Methodological note)
Non-defaulted Defaulted Non-defaulted Defaulted Non-defaulted Defaulted
Central governments or central banks 0 0 0 0 0 0 0.0%
Regional governments or local authorities 0 0 0 0 0 0 0.0%
Public sector entities 0 0 0 0 0 0 0.0%
Multilateral Development Banks 0 0 0 0 0 0 0.0%
International Organisations 0 0 0 0 0 0 0.0%
Institutions 0 0 0 0 0 0 0.0%
Corporates 0 0 0 0 0 0 0.0%
of which: SME 0 0 0 0 0 0 0.0%
Retail 0 0 0 0 0 0 0.0%
of which: SME 0 0 0 0 0 0 0.0%
Secured by mortgages on immovable property 0 0 0 0 0 0 0.0%
of which: SME 0 0 0 0 0 0 0.0%
Items associated with particularly high risk 0 0 0 0 0 0 0.0%
Covered bonds 0 0 0 0 0 0 0.0%
Claims on institutions and corporates with a ST credit assessment 0 0 0 0 0 0 0.0%
Collective investments undertakings (CIU) 0 0 0 0 0 0 0.0%
Equity 0 0 0 0 0 0 0.0%
Securitisation
Other exposures 0 0 0 0 0 0 0.0%
Standardised Total 0 0 0 0 0 0 0.0%1 Computed as: Stock of provisions for defaulted stock / default stock (as defined in paragraphs 59 and 61 of the Methodological note)
0
Exposure values Risk exposure amounts Stock of provisionsCoverage Ratio -
Default Stock1
Italy
31/12/2015
31/12/2015
Exposure values Risk exposure amounts Stock of provisionsCoverage Ratio -
Default Stock1
Banca Monte dei Paschi di
Siena S.p.A.
31/12/2015
Exposure values Risk exposure amounts Stock of provisions
Coverage Ratio -
Default Stock1

2016 EU-wide Stress Test:
Credit risk STABanca Monte dei Paschi di Siena S.p.A.
Non-defaulted Defaulted Non-defaulted Defaulted Non-defaulted Defaulted
Central governments or central banks 0 0 0 0 0 0 0.0%
Regional governments or local authorities 0 0 0 0 0 0 0.0%
Public sector entities 0 0 0 0 0 0 0.0%
Multilateral Development Banks 0 0 0 0 0 0 0.0%
International Organisations 0 0 0 0 0 0 0.0%
Institutions 0 0 0 0 0 0 0.0%
Corporates 0 0 0 0 0 0 0.0%
of which: SME 0 0 0 0 0 0 0.0%
Retail 0 0 0 0 0 0 0.0%
of which: SME 0 0 0 0 0 0 0.0%
Secured by mortgages on immovable property 0 0 0 0 0 0 0.0%
of which: SME 0 0 0 0 0 0 0.0%
Items associated with particularly high risk 0 0 0 0 0 0 0.0%
Covered bonds 0 0 0 0 0 0 0.0%
Claims on institutions and corporates with a ST credit assessment 0 0 0 0 0 0 0.0%
Collective investments undertakings (CIU) 0 0 0 0 0 0 0.0%
Equity 0 0 0 0 0 0 0.0%
Securitisation
Other exposures 0 0 0 0 0 0 0.0%
Standardised Total 0 0 0 0 0 0 0.0%1 Computed as: Stock of provisions for defaulted stock / default stock (as defined in paragraphs 59 and 61 of the Methodological note)
0
Exposure values Risk exposure amounts Stock of provisionsCoverage Ratio -
Default Stock1
0
31/12/2015
Exposure values Risk exposure amounts Stock of provisionsCoverage Ratio -
Default Stock1
0
31/12/2015
Exposure values Risk exposure amounts Stock of provisionsCoverage Ratio -
Default Stock1
31/12/2015

2016 EU-wide Stress Test:
Credit risk STABanca Monte dei Paschi di Siena S.p.A.
Non-defaulted Defaulted Non-defaulted Defaulted Non-defaulted Defaulted
Central governments or central banks 0 0 0 0 0 0 0.0%
Regional governments or local authorities 0 0 0 0 0 0 0.0%
Public sector entities 0 0 0 0 0 0 0.0%
Multilateral Development Banks 0 0 0 0 0 0 0.0%
International Organisations 0 0 0 0 0 0 0.0%
Institutions 0 0 0 0 0 0 0.0%
Corporates 0 0 0 0 0 0 0.0%
of which: SME 0 0 0 0 0 0 0.0%
Retail 0 0 0 0 0 0 0.0%
of which: SME 0 0 0 0 0 0 0.0%
Secured by mortgages on immovable property 0 0 0 0 0 0 0.0%
of which: SME 0 0 0 0 0 0 0.0%
Items associated with particularly high risk 0 0 0 0 0 0 0.0%
Covered bonds 0 0 0 0 0 0 0.0%
Claims on institutions and corporates with a ST credit assessment 0 0 0 0 0 0 0.0%
Collective investments undertakings (CIU) 0 0 0 0 0 0 0.0%
Equity 0 0 0 0 0 0 0.0%
Securitisation
Other exposures 0 0 0 0 0 0 0.0%
Standardised Total 0 0 0 0 0 0 0.0%1 Computed as: Stock of provisions for defaulted stock / default stock (as defined in paragraphs 59 and 61 of the Methodological note)
Non-defaulted Defaulted Non-defaulted Defaulted Non-defaulted Defaulted
Central governments or central banks 0 0 0 0 0 0 0.0%
Regional governments or local authorities 0 0 0 0 0 0 0.0%
Public sector entities 0 0 0 0 0 0 0.0%
Multilateral Development Banks 0 0 0 0 0 0 0.0%
International Organisations 0 0 0 0 0 0 0.0%
Institutions 0 0 0 0 0 0 0.0%
Corporates 0 0 0 0 0 0 0.0%
of which: SME 0 0 0 0 0 0 0.0%
Retail 0 0 0 0 0 0 0.0%
of which: SME 0 0 0 0 0 0 0.0%
Secured by mortgages on immovable property 0 0 0 0 0 0 0.0%
of which: SME 0 0 0 0 0 0 0.0%
Items associated with particularly high risk 0 0 0 0 0 0 0.0%
Covered bonds 0 0 0 0 0 0 0.0%
Claims on institutions and corporates with a ST credit assessment 0 0 0 0 0 0 0.0%
Collective investments undertakings (CIU) 0 0 0 0 0 0 0.0%
Equity 0 0 0 0 0 0 0.0%
Securitisation
Other exposures 0 0 0 0 0 0 0.0%
Standardised Total 0 0 0 0 0 0 0.0%1 Computed as: Stock of provisions for defaulted stock / default stock (as defined in paragraphs 59 and 61 of the Methodological note)
0
Exposure values Risk exposure amounts Stock of provisionsCoverage Ratio -
Default Stock1
0
31/12/2015
Exposure values Risk exposure amounts Stock of provisionsCoverage Ratio -
Default Stock1
31/12/2015
2016 EU-wide Stress Test:
Credit risk STABanca Monte dei Paschi di Siena S.p.A.
Central governments or central banks
Regional governments or local authorities
Public sector entities
Multilateral Development Banks
International Organisations
Institutions
Corporates
of which: SME
Retail
of which: SME
Secured by mortgages on immovable property
of which: SME
Items associated with particularly high risk
Covered bonds
Claims on institutions and corporates with a ST credit assessment
Collective investments undertakings (CIU)
Equity
Securitisation
Other exposures
Standardised Total1 Computed as: Stock of provisions for defaulted stock / default stock (as defined in paragraphs 59 and 61 of the Methodological note)
0
Italy
Banca Monte dei Paschi di
Siena S.p.A.
Impairment
rate
Stock of
Provisions
Coverage Ratio -
Default Stock1
Impairment
rate
Stock of
Provisions
Coverage Ratio -
Default Stock1
Impairment
rate
Stock of
Provisions
Coverage Ratio -
Default Stock1
Impairment
rate
Stock of
Provisions
Coverage Ratio -
Default Stock1
Impairment
rate
Stock of
Provisions
Coverage Ratio -
Default Stock1
Impairment
rate
Stock of
Provisions
Coverage Ratio -
Default Stock1
0.6% 28 40.0% 0.4% 44 40.0% 0.3% 58 40.0% 0.7% 34 40.0% 0.5% 55 40.0% 0.5% 76 40.0%
0.2% 11 42.6% 0.1% 15 41.8% 0.1% 17 41.5% 0.6% 21 41.6% 0.4% 29 40.9% 0.4% 37 40.7%
0.3% 2 40.0% 0.3% 4 40.5% 0.4% 7 40.9% 0.4% 3 40.0% 0.4% 5 40.7% 0.6% 8 41.2%
0.0% 0 45.0% 0.0% 0 45.0% 0.0% 0 45.0% 0.0% 0 45.0% 0.0% 0 45.0% 0.0% 0 45.0%
- 0 - - 0 - - 0 - - 0 - - 0 - - 0 -
0.3% 54 49.4% 0.3% 73 44.0% 0.4% 97 41.0% 0.4% 58 51.4% 0.5% 86 46.9% 0.6% 122 44.4%
0.8% 960 51.4% 0.8% 1,048 50.8% 0.8% 1,130 50.2% 1.0% 1,064 56.6% 1.2% 1,271 59.9% 1.3% 1,486 62.7%
1.0% 579 63.6% 0.8% 619 60.1% 0.8% 657 57.7% 1.3% 595 64.3% 1.3% 659 61.2% 1.3% 717 58.6%
1.4% 447 63.8% 1.8% 493 60.6% 1.9% 531 57.6% 1.9% 461 64.6% 2.9% 529 60.9% 3.1% 591 58.0%
2.4% 65 63.5% 1.7% 67 63.3% 1.4% 67 62.7% 3.1% 66 63.5% 2.5% 68 63.8% 2.3% 69 63.5%
0.4% 221 30.9% 0.4% 233 30.9% 0.5% 244 30.6% 0.5% 234 32.6% 0.7% 262 34.0% 0.8% 289 34.8%
0.4% 216 31.3% 0.5% 225 31.7% 0.4% 232 31.9% 0.6% 228 32.9% 0.7% 252 35.1% 0.8% 271 36.7%
- 0 - - 0 - - 0 - - 0 - - 0 - - 0 -
0.0% 1 45.0% 0.0% 1 45.0% 0.0% 2 45.0% 0.1% 1 47.3% 0.1% 1 47.3% 0.1% 2 47.3%
- 0 - - 0 - - 0 - - 0 - - 0 - - 0 -
0.3% 2 26.4% 0.3% 4 27.1% 0.4% 6 27.5% 0.4% 2 28.8% 0.5% 5 29.8% 0.6% 8 30.5%
0.0% 2 24.6% 0.0% 2 24.6% 0.0% 2 24.6% 0.0% 2 25.8% 0.0% 2 25.8% 0.0% 2 25.8%
0.0% 23 26.3% 0.0% 23 28.0% 0.0% 24 29.9% 0.0% 23 29.6% 0.0% 23 31.1% 0.0% 24 33.1%
0.6% 1,751 49.2% 0.5% 1,940 48.2% 0.6% 2,116 47.1% 0.7% 1,901 52.5% 0.8% 2,269 53.6% 0.9% 2,645 54.3%
Impairment
rate
Stock of
Provisions
Coverage Ratio -
Default Stock1
Impairment
rate
Stock of
Provisions
Coverage Ratio -
Default Stock1
Impairment
rate
Stock of
Provisions
Coverage Ratio -
Default Stock1
Impairment
rate
Stock of
Provisions
Coverage Ratio -
Default Stock1
Impairment
rate
Stock of
Provisions
Coverage Ratio -
Default Stock1
Impairment
rate
Stock of
Provisions
Coverage Ratio -
Default Stock1
0.6% 28 40.0% 0.4% 44 40.4% 0.3% 58 40.3% 0.7% 33 40.0% 0.5% 55 40.4% 0.5% 76 40.3%
0.2% 11 42.6% 0.1% 15 41.8% 0.1% 17 41.5% 0.6% 21 41.6% 0.4% 29 40.9% 0.4% 37 40.7%
0.3% 2 40.0% 0.3% 4 40.5% 0.4% 7 40.9% 0.4% 3 40.0% 0.4% 5 40.7% 0.6% 8 41.2%
- 0 - - 0 - - 0 - - 0 - - 0 - - 0 -
- 0 - - 0 - - 0 - - 0 - - 0 - - 0 -
0.6% 49 50.7% 0.6% 63 47.1% 0.6% 80 45.1% 0.8% 51 52.5% 0.9% 72 49.5% 1.1% 99 47.9%
1.1% 759 49.6% 0.9% 824 49.9% 0.9% 881 50.0% 1.4% 864 56.1% 1.4% 975 57.5% 1.4% 1,208 65.7%
1.1% 535 63.0% 0.9% 573 59.8% 0.9% 608 57.6% 1.5% 550 63.7% 1.4% 611 60.9% 1.4% 665 58.6%
1.4% 444 64.3% 1.8% 486 61.5% 1.9% 519 58.7% 1.9% 457 65.1% 2.9% 518 61.8% 3.1% 574 59.0%
2.4% 65 63.5% 1.7% 67 63.3% 1.4% 67 62.8% 3.1% 66 63.5% 2.5% 68 63.8% 2.3% 69 63.6%
0.4% 215 31.3% 0.5% 225 31.6% 0.5% 233 31.7% 0.5% 227 33.0% 0.7% 252 34.9% 0.8% 273 36.2%
0.4% 213 31.4% 0.5% 222 31.9% 0.4% 229 32.1% 0.6% 225 33.1% 0.7% 248 35.3% 0.8% 267 36.8%
- 0 - - 0 - - 0 - - 0 - - 0 - - 0 -
0.0% 1 45.0% 0.0% 1 45.0% 0.0% 2 45.0% 0.1% 1 47.3% 0.1% 1 47.3% 0.1% 2 47.3%
- 0 - - 0 - - 0 - - 0 - - 0 - - 0 -
0.3% 2 26.4% 0.3% 4 27.1% 0.4% 6 27.5% 0.4% 2 28.8% 0.5% 5 29.8% 0.6% 8 30.5%
0.0% 2 24.6% 0.0% 2 24.6% 0.0% 2 24.6% 0.0% 2 25.8% 0.0% 2 25.8% 0.0% 2 25.8%
0.0% 23 26.3% 0.0% 23 28.0% 0.0% 24 29.9% 0.0% 23 29.6% 0.0% 23 31.1% 0.0% 24 33.1%0.7% 1,535 48.4% 0.6% 1,690 48.1% 0.6% 1,828 47.5% 0.9% 1,685 52.2% 0.9% 1,937 52.5% 0.9% 2,309 55.7%
Impairment
rate
Stock of
Provisions
Coverage Ratio -
Default Stock1
Impairment
rate
Stock of
Provisions
Coverage Ratio -
Default Stock1
Impairment
rate
Stock of
Provisions
Coverage Ratio -
Default Stock1
Impairment
rate
Stock of
Provisions
Coverage Ratio -
Default Stock1
Impairment
rate
Stock of
Provisions
Coverage Ratio -
Default Stock1
Impairment
rate
Stock of
Provisions
Coverage Ratio -
Default Stock1
- 0 - - 0 - - 0 - - 0 - - 0 - - 0 -
- 0 - - 0 - - 0 - - 0 - - 0 - - 0 -
- 0 - - 0 - - 0 - - 0 - - 0 - - 0 -
- 0 - - 0 - - 0 - - 0 - - 0 - - 0 -
- 0 - - 0 - - 0 - - 0 - - 0 - - 0 -
- 0 - - 0 - - 0 - - 0 - - 0 - - 0 -
- 0 - - 0 - - 0 - - 0 - - 0 - - 0 -
- 0 - - 0 - - 0 - - 0 - - 0 - - 0 -
- 0 - - 0 - - 0 - - 0 - - 0 - - 0 -
- 0 - - 0 - - 0 - - 0 - - 0 - - 0 -
- 0 - - 0 - - 0 - - 0 - - 0 - - 0 -
- 0 - - 0 - - 0 - - 0 - - 0 - - 0 -
- 0 - - 0 - - 0 - - 0 - - 0 - - 0 -
- 0 - - 0 - - 0 - - 0 - - 0 - - 0 -
- 0 - - 0 - - 0 - - 0 - - 0 - - 0 -
- 0 - - 0 - - 0 - - 0 - - 0 - - 0 -
- 0 - - 0 - - 0 - - 0 - - 0 - - 0 -
- 0 - - 0 - - 0 - - 0 - - 0 - - 0 -
- 0 - - 0 - - 0 - - 0 - - 0 - - 0 -
31/12/2018 31/12/2016 31/12/2017 31/12/201831/12/2016 31/12/2017
Baseline Scenario Adverse Scenario
Baseline Scenario Adverse Scenario
31/12/2016 31/12/2017 31/12/2018
31/12/2018
31/12/2016 31/12/2017 31/12/2018
Baseline Scenario Adverse Scenario
31/12/2016 31/12/2017 31/12/2018 31/12/2016 31/12/2017

2016 EU-wide Stress Test:
Credit risk STABanca Monte dei Paschi di Siena S.p.A.
Central governments or central banks
Regional governments or local authorities
Public sector entities
Multilateral Development Banks
International Organisations
Institutions
Corporates
of which: SME
Retail
of which: SME
Secured by mortgages on immovable property
of which: SME
Items associated with particularly high risk
Covered bonds
Claims on institutions and corporates with a ST credit assessment
Collective investments undertakings (CIU)
Equity
Securitisation
Other exposures
Standardised Total1 Computed as: Stock of provisions for defaulted stock / default stock (as defined in paragraphs 59 and 61 of the Methodological note)
Central governments or central banks
Regional governments or local authorities
Public sector entities
Multilateral Development Banks
International Organisations
Institutions
Corporates
of which: SME
Retail
of which: SME
Secured by mortgages on immovable property
of which: SME
Items associated with particularly high risk
Covered bonds
Claims on institutions and corporates with a ST credit assessment
Collective investments undertakings (CIU)
Equity
Securitisation
Other exposures
Standardised Total1 Computed as: Stock of provisions for defaulted stock / default stock (as defined in paragraphs 59 and 61 of the Methodological note)
Central governments or central banks
Regional governments or local authorities
Public sector entities
Multilateral Development Banks
International Organisations
Institutions
Corporates
of which: SME
Retail
of which: SME
Secured by mortgages on immovable property
of which: SME
Items associated with particularly high risk
Covered bonds
Claims on institutions and corporates with a ST credit assessment
Collective investments undertakings (CIU)
Equity
Securitisation
Other exposures
Standardised Total1 Computed as: Stock of provisions for defaulted stock / default stock (as defined in paragraphs 59 and 61 of the Methodological note)
0
0
0
Impairment
rate
Stock of
Provisions
Coverage Ratio -
Default Stock1
Impairment
rate
Stock of
Provisions
Coverage Ratio -
Default Stock1
Impairment
rate
Stock of
Provisions
Coverage Ratio -
Default Stock1
Impairment
rate
Stock of
Provisions
Coverage Ratio -
Default Stock1
Impairment
rate
Stock of
Provisions
Coverage Ratio -
Default Stock1
Impairment
rate
Stock of
Provisions
Coverage Ratio -
Default Stock1
- 0 - - 0 - - 0 - - 0 - - 0 - - 0 -
- 0 - - 0 - - 0 - - 0 - - 0 - - 0 -
- 0 - - 0 - - 0 - - 0 - - 0 - - 0 -
- 0 - - 0 - - 0 - - 0 - - 0 - - 0 -
- 0 - - 0 - - 0 - - 0 - - 0 - - 0 -
- 0 - - 0 - - 0 - - 0 - - 0 - - 0 -
- 0 - - 0 - - 0 - - 0 - - 0 - - 0 -
- 0 - - 0 - - 0 - - 0 - - 0 - - 0 -
- 0 - - 0 - - 0 - - 0 - - 0 - - 0 -
- 0 - - 0 - - 0 - - 0 - - 0 - - 0 -
- 0 - - 0 - - 0 - - 0 - - 0 - - 0 -
- 0 - - 0 - - 0 - - 0 - - 0 - - 0 -
- 0 - - 0 - - 0 - - 0 - - 0 - - 0 -
- 0 - - 0 - - 0 - - 0 - - 0 - - 0 -
- 0 - - 0 - - 0 - - 0 - - 0 - - 0 -
- 0 - - 0 - - 0 - - 0 - - 0 - - 0 -
- 0 - - 0 - - 0 - - 0 - - 0 - - 0 -
- 0 - - 0 - - 0 - - 0 - - 0 - - 0 -
- 0 - - 0 - - 0 - - 0 - - 0 - - 0 -
Impairment
rate
Stock of
Provisions
Coverage Ratio -
Default Stock1
Impairment
rate
Stock of
Provisions
Coverage Ratio -
Default Stock1
Impairment
rate
Stock of
Provisions
Coverage Ratio -
Default Stock1
Impairment
rate
Stock of
Provisions
Coverage Ratio -
Default Stock1
Impairment
rate
Stock of
Provisions
Coverage Ratio -
Default Stock1
Impairment
rate
Stock of
Provisions
Coverage Ratio -
Default Stock1
- 0 - - 0 - - 0 - - 0 - - 0 - - 0 -
- 0 - - 0 - - 0 - - 0 - - 0 - - 0 -
- 0 - - 0 - - 0 - - 0 - - 0 - - 0 -
- 0 - - 0 - - 0 - - 0 - - 0 - - 0 -
- 0 - - 0 - - 0 - - 0 - - 0 - - 0 -
- 0 - - 0 - - 0 - - 0 - - 0 - - 0 -
- 0 - - 0 - - 0 - - 0 - - 0 - - 0 -
- 0 - - 0 - - 0 - - 0 - - 0 - - 0 -
- 0 - - 0 - - 0 - - 0 - - 0 - - 0 -
- 0 - - 0 - - 0 - - 0 - - 0 - - 0 -
- 0 - - 0 - - 0 - - 0 - - 0 - - 0 -
- 0 - - 0 - - 0 - - 0 - - 0 - - 0 -
- 0 - - 0 - - 0 - - 0 - - 0 - - 0 -
- 0 - - 0 - - 0 - - 0 - - 0 - - 0 -
- 0 - - 0 - - 0 - - 0 - - 0 - - 0 -
- 0 - - 0 - - 0 - - 0 - - 0 - - 0 -
- 0 - - 0 - - 0 - - 0 - - 0 - - 0 -
- 0 - - 0 - - 0 - - 0 - - 0 - - 0 -
- 0 - - 0 - - 0 - - 0 - - 0 - - 0 -
Impairment
rate
Stock of
Provisions
Coverage Ratio -
Default Stock1
Impairment
rate
Stock of
Provisions
Coverage Ratio -
Default Stock1
Impairment
rate
Stock of
Provisions
Coverage Ratio -
Default Stock1
Impairment
rate
Stock of
Provisions
Coverage Ratio -
Default Stock1
Impairment
rate
Stock of
Provisions
Coverage Ratio -
Default Stock1
Impairment
rate
Stock of
Provisions
Coverage Ratio -
Default Stock1
- 0 - - 0 - - 0 - - 0 - - 0 - - 0 -
- 0 - - 0 - - 0 - - 0 - - 0 - - 0 -
- 0 - - 0 - - 0 - - 0 - - 0 - - 0 -
- 0 - - 0 - - 0 - - 0 - - 0 - - 0 -
- 0 - - 0 - - 0 - - 0 - - 0 - - 0 -
- 0 - - 0 - - 0 - - 0 - - 0 - - 0 -
- 0 - - 0 - - 0 - - 0 - - 0 - - 0 -
- 0 - - 0 - - 0 - - 0 - - 0 - - 0 -
- 0 - - 0 - - 0 - - 0 - - 0 - - 0 -
- 0 - - 0 - - 0 - - 0 - - 0 - - 0 -
- 0 - - 0 - - 0 - - 0 - - 0 - - 0 -
- 0 - - 0 - - 0 - - 0 - - 0 - - 0 -
- 0 - - 0 - - 0 - - 0 - - 0 - - 0 -
- 0 - - 0 - - 0 - - 0 - - 0 - - 0 -
- 0 - - 0 - - 0 - - 0 - - 0 - - 0 -
- 0 - - 0 - - 0 - - 0 - - 0 - - 0 -
- 0 - - 0 - - 0 - - 0 - - 0 - - 0 -
- 0 - - 0 - - 0 - - 0 - - 0 - - 0 -
- 0 - - 0 - - 0 - - 0 - - 0 - - 0 -
31/12/2018 31/12/2016 31/12/2017 31/12/201831/12/2016 31/12/2017
31/12/2018 31/12/2016 31/12/2017 31/12/2018
Baseline Scenario Adverse Scenario
31/12/2016 31/12/2017
31/12/2018 31/12/2016 31/12/2017 31/12/2018
Baseline Scenario Adverse Scenario
31/12/2016 31/12/2017
Baseline Scenario Adverse Scenario

2016 EU-wide Stress Test:
Credit risk STABanca Monte dei Paschi di Siena S.p.A.
Central governments or central banks
Regional governments or local authorities
Public sector entities
Multilateral Development Banks
International Organisations
Institutions
Corporates
of which: SME
Retail
of which: SME
Secured by mortgages on immovable property
of which: SME
Items associated with particularly high risk
Covered bonds
Claims on institutions and corporates with a ST credit assessment
Collective investments undertakings (CIU)
Equity
Securitisation
Other exposures
Standardised Total1 Computed as: Stock of provisions for defaulted stock / default stock (as defined in paragraphs 59 and 61 of the Methodological note)
Central governments or central banks
Regional governments or local authorities
Public sector entities
Multilateral Development Banks
International Organisations
Institutions
Corporates
of which: SME
Retail
of which: SME
Secured by mortgages on immovable property
of which: SME
Items associated with particularly high risk
Covered bonds
Claims on institutions and corporates with a ST credit assessment
Collective investments undertakings (CIU)
Equity
Securitisation
Other exposures
Standardised Total1 Computed as: Stock of provisions for defaulted stock / default stock (as defined in paragraphs 59 and 61 of the Methodological note)
0
0
Impairment
rate
Stock of
Provisions
Coverage Ratio -
Default Stock1
Impairment
rate
Stock of
Provisions
Coverage Ratio -
Default Stock1
Impairment
rate
Stock of
Provisions
Coverage Ratio -
Default Stock1
Impairment
rate
Stock of
Provisions
Coverage Ratio -
Default Stock1
Impairment
rate
Stock of
Provisions
Coverage Ratio -
Default Stock1
Impairment
rate
Stock of
Provisions
Coverage Ratio -
Default Stock1
- 0 - - 0 - - 0 - - 0 - - 0 - - 0 -
- 0 - - 0 - - 0 - - 0 - - 0 - - 0 -
- 0 - - 0 - - 0 - - 0 - - 0 - - 0 -
- 0 - - 0 - - 0 - - 0 - - 0 - - 0 -
- 0 - - 0 - - 0 - - 0 - - 0 - - 0 -
- 0 - - 0 - - 0 - - 0 - - 0 - - 0 -
- 0 - - 0 - - 0 - - 0 - - 0 - - 0 -
- 0 - - 0 - - 0 - - 0 - - 0 - - 0 -
- 0 - - 0 - - 0 - - 0 - - 0 - - 0 -
- 0 - - 0 - - 0 - - 0 - - 0 - - 0 -
- 0 - - 0 - - 0 - - 0 - - 0 - - 0 -
- 0 - - 0 - - 0 - - 0 - - 0 - - 0 -
- 0 - - 0 - - 0 - - 0 - - 0 - - 0 -
- 0 - - 0 - - 0 - - 0 - - 0 - - 0 -
- 0 - - 0 - - 0 - - 0 - - 0 - - 0 -
- 0 - - 0 - - 0 - - 0 - - 0 - - 0 -
- 0 - - 0 - - 0 - - 0 - - 0 - - 0 -
- 0 - - 0 - - 0 - - 0 - - 0 - - 0 -
- 0 - - 0 - - 0 - - 0 - - 0 - - 0 -
Impairment
rate
Stock of
Provisions
Coverage Ratio -
Default Stock1
Impairment
rate
Stock of
Provisions
Coverage Ratio -
Default Stock1
Impairment
rate
Stock of
Provisions
Coverage Ratio -
Default Stock1
Impairment
rate
Stock of
Provisions
Coverage Ratio -
Default Stock1
Impairment
rate
Stock of
Provisions
Coverage Ratio -
Default Stock1
Impairment
rate
Stock of
Provisions
Coverage Ratio -
Default Stock1
- 0 - - 0 - - 0 - - 0 - - 0 - - 0 -
- 0 - - 0 - - 0 - - 0 - - 0 - - 0 -
- 0 - - 0 - - 0 - - 0 - - 0 - - 0 -
- 0 - - 0 - - 0 - - 0 - - 0 - - 0 -
- 0 - - 0 - - 0 - - 0 - - 0 - - 0 -
- 0 - - 0 - - 0 - - 0 - - 0 - - 0 -
- 0 - - 0 - - 0 - - 0 - - 0 - - 0 -
- 0 - - 0 - - 0 - - 0 - - 0 - - 0 -
- 0 - - 0 - - 0 - - 0 - - 0 - - 0 -
- 0 - - 0 - - 0 - - 0 - - 0 - - 0 -
- 0 - - 0 - - 0 - - 0 - - 0 - - 0 -
- 0 - - 0 - - 0 - - 0 - - 0 - - 0 -
- 0 - - 0 - - 0 - - 0 - - 0 - - 0 -
- 0 - - 0 - - 0 - - 0 - - 0 - - 0 -
- 0 - - 0 - - 0 - - 0 - - 0 - - 0 -
- 0 - - 0 - - 0 - - 0 - - 0 - - 0 -
- 0 - - 0 - - 0 - - 0 - - 0 - - 0 -
- 0 - - 0 - - 0 - - 0 - - 0 - - 0 -
- 0 - - 0 - - 0 - - 0 - - 0 - - 0 -
31/12/2018 31/12/2016 31/12/2017 31/12/201831/12/2016 31/12/2017
31/12/2018 31/12/2016 31/12/2017 31/12/2018
Baseline Scenario Adverse Scenario
31/12/2016 31/12/2017
Baseline Scenario Adverse Scenario
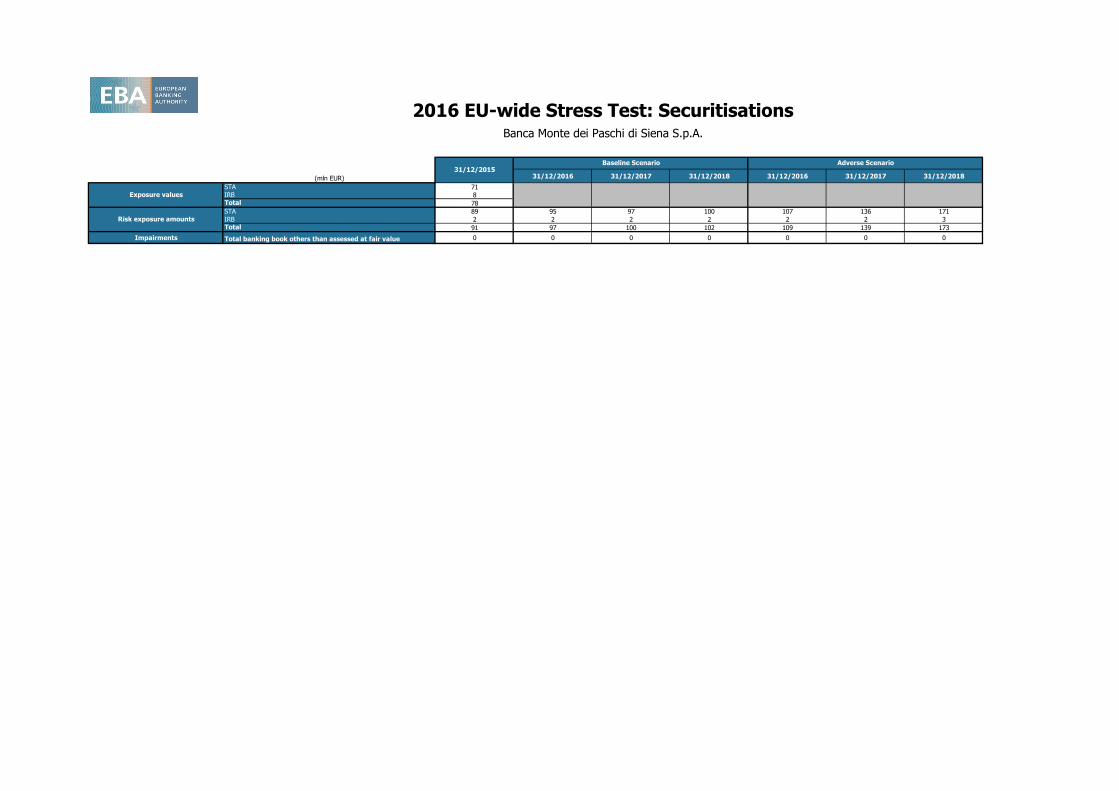
(mln EUR) 31/12/2016 31/12/2017 31/12/2018 31/12/2016 31/12/2017 31/12/2018
STA 71IRB 8Total 78
STA 89 95 97 100 107 136 171IRB 2 2 2 2 2 2 3Total 91 97 100 102 109 139 173
Impairments Total banking book others than assessed at fair value 0 0 0 0 0 0 0
2016 EU-wide Stress Test: SecuritisationsBanca Monte dei Paschi di Siena S.p.A.
Risk exposure amounts
31/12/2015Baseline Scenario Adverse Scenario
Exposure values

2016 EU-wide Stress Test: Sovereign
(mln EUR)
[ 0 - 3M [ 0 0 0 0 0 0 0 0 0 0 0 0 0 0 0
[ 3M - 1Y [ 0 0 0 0 0 0 0 0 0 0 0 23 0 0 0
[ 1Y - 2Y [ 0 0 0 0 0 0 0 0 0 0 0 0 0 0 0
[ 2Y - 3Y [ 0 0 0 0 0 0 0 0 0 0 0 0 0 0 0
[3Y - 5Y [ 0 0 0 0 0 0 0 0 0 0 0 0 0 0 0
[5Y - 10Y [ 0 0 0 0 0 0 0 0 0 0 0 0 0 0 0
[10Y - more 0 0 0 0 0 0 0 0 0 0 0 0 0 0 0Tot 0 0 0 0 0 0 0 0 0 0 0 23 0 0 0
[ 0 - 3M [ 25 25 25 0 0 0 0 0 0 0 0 0 0 0 0
[ 3M - 1Y [ 0 -8 0 0 -8 0 0 0 0 0 0 17 8 9 0
[ 1Y - 2Y [ 5 5 5 0 0 0 0 0 0 0 0 0 0 0 0
[ 2Y - 3Y [ 6 6 6 0 0 0 0 0 0 0 0 0 0 0 0
[3Y - 5Y [ 25 25 25 0 0 0 0 0 0 0 0 23 1 23 -1
[5Y - 10Y [ 0 0 0 0 0 0 0 0 0 0 0 0 0 0 0
[10Y - more 4 4 4 0 0 0 0 0 0 0 0 0 0 0 0Tot 65 56 64 0 -8 0 0 0 0 0 0 40 9 32 -1
[ 0 - 3M [ 0 0 0 0 0 0 0 0 0 0 0 5 0 5 0
[ 3M - 1Y [ 0 0 0 0 0 0 0 0 0 0 0 0 0 0 0
[ 1Y - 2Y [ 0 0 0 0 0 0 0 0 0 0 0 0 0 0 0
[ 2Y - 3Y [ 0 0 0 0 0 0 0 0 0 0 0 0 0 0 0
[3Y - 5Y [ 0 0 0 0 0 0 0 0 0 0 0 0 0 0 0
[5Y - 10Y [ 0 0 0 0 0 0 0 0 0 0 0 0 0 0 0
[10Y - more 0 0 0 0 0 0 0 0 0 0 0 0 0 0 0Tot 0 0 0 0 0 0 0 0 0 0 0 5 0 5 0
[ 0 - 3M [ 0 0 0 0 0 0 0 0 0 0 0 0 0 0 0
[ 3M - 1Y [ 0 0 0 0 0 0 0 0 0 0 0 0 0 0 0
[ 1Y - 2Y [ 0 0 0 0 0 0 0 0 0 0 0 0 0 0 0
[ 2Y - 3Y [ 0 0 0 0 0 0 0 0 0 0 0 0 0 0 0
[3Y - 5Y [ 0 0 0 0 0 0 0 0 0 0 0 0 0 0 0
[5Y - 10Y [ 0 0 0 0 0 0 0 0 0 0 0 0 0 0 0
[10Y - more 0 0 0 0 0 0 0 0 0 0 0 0 0 0 0Tot 0 0 0 0 0 0 0 0 0 0 0 0 0 0 0
[ 0 - 3M [ 0 0 0 0 0 0 0 0 0 0 0 0 0 0 0
[ 3M - 1Y [ 0 0 0 0 0 0 0 0 0 0 0 0 0 0 0
[ 1Y - 2Y [ 0 0 0 0 0 0 0 0 0 0 0 0 0 0 0
[ 2Y - 3Y [ 0 0 0 0 0 0 0 0 0 0 0 0 0 0 0
[3Y - 5Y [ 0 0 0 0 0 0 0 0 0 0 0 13 0 13 0
[5Y - 10Y [ 0 0 0 0 0 0 0 0 0 0 0 0 0 0 0
[10Y - more 0 0 0 0 0 0 0 0 0 0 0 0 0 0 0Tot 0 0 0 0 0 0 0 0 0 0 0 13 0 13 0
[ 0 - 3M [ 0 0 0 0 0 0 0 0 0 0 0 0 0 0 0
[ 3M - 1Y [ 0 0 0 0 0 0 0 0 0 0 0 0 0 0 0
[ 1Y - 2Y [ 0 0 0 0 0 0 0 0 0 0 0 0 0 0 0
[ 2Y - 3Y [ 0 0 0 0 0 0 0 0 0 0 0 0 0 0 0
[3Y - 5Y [ 0 0 0 0 0 0 0 0 0 0 0 0 0 0 0
[5Y - 10Y [ 0 0 0 0 0 0 0 0 0 0 0 0 0 0 0
[10Y - more 0 0 0 0 0 0 0 0 0 0 0 0 0 0 0Tot 0 0 0 0 0 0 0 0 0 0 0 0 0 0 0
[ 0 - 3M [ 0 0 0 0 0 0 0 0 0 0 0 0 0 0 0
[ 3M - 1Y [ 0 0 0 0 0 0 0 0 0 0 0 0 0 0 0
[ 1Y - 2Y [ 0 0 0 0 0 0 0 0 0 0 0 0 0 0 0
[ 2Y - 3Y [ 0 0 0 0 0 0 0 0 0 0 0 0 0 0 0
[3Y - 5Y [ 0 0 0 0 0 0 0 0 0 0 0 0 0 0 0
[5Y - 10Y [ 0 0 0 0 0 0 0 0 0 0 0 0 0 0 0
[10Y - more 0 0 0 0 0 0 0 0 0 0 0 0 0 0 0Tot 0 0 0 0 0 0 0 0 0 0 0 0 0 0 0
Banca Monte dei Paschi di Siena S.p.A.
31/12/2015
Residual Maturity Country / Region
GROSS DIRECT LONG
EXPOSURES
(accounting value gross
of provisions)
(1)
NET DIRECT EXPOSURES
(accounting value gross of provisions)
(1)
Notional value Fair-value (+) Fair-value (-) Notional value Fair-value (+)
DIRECT SOVEREIGN EXPOSURES IN DERIVATIVES (1) INDIRECT SOVEREIGN EXPOSURES (3) (on and off balance sheet)
Derivatives with positive fair value Derivatives with negative fair value Derivatives with positive fair value Derivatives with negative fair value
Notional value Fair-value (-)Notional value
Cyprus
Czech Republic
of which: Loans and
receivablesof which: AFS
of which: FVO
(designated at fair
value through
profit&loss)
of which: HFT
(2)of which: HTM
Austria
Belgium
Bulgaria
Denmark
Estonia

2016 EU-wide Stress Test: Sovereign
(mln EUR)
Banca Monte dei Paschi di Siena S.p.A.
31/12/2015
Residual Maturity Country / Region
GROSS DIRECT LONG
EXPOSURES
(accounting value gross
of provisions)
(1)
NET DIRECT EXPOSURES
(accounting value gross of provisions)
(1)
Notional value Fair-value (+) Fair-value (-) Notional value Fair-value (+)
DIRECT SOVEREIGN EXPOSURES IN DERIVATIVES (1) INDIRECT SOVEREIGN EXPOSURES (3) (on and off balance sheet)
Derivatives with positive fair value Derivatives with negative fair value Derivatives with positive fair value Derivatives with negative fair value
Notional value Fair-value (-)Notional valueof which: Loans and
receivablesof which: AFS
of which: FVO
(designated at fair
value through
profit&loss)
of which: HFT
(2)of which: HTM
Austria
[ 0 - 3M [ 0 0 0 0 0 0 0 0 0 0 0 0 0 0 0
[ 3M - 1Y [ 0 0 0 0 0 0 0 0 0 0 0 0 0 0 0
[ 1Y - 2Y [ 0 0 0 0 0 0 0 0 0 0 0 0 0 0 0
[ 2Y - 3Y [ 0 0 0 0 0 0 0 0 0 0 0 0 0 0 0
[3Y - 5Y [ 0 0 0 0 0 0 0 0 0 0 0 0 0 0 0
[5Y - 10Y [ 0 0 0 0 0 0 0 0 0 0 0 0 0 0 0
[10Y - more 0 0 0 0 0 0 0 0 0 0 0 0 0 0 0Tot 0 0 0 0 0 0 0 0 0 0 0 0 0 0 0
[ 0 - 3M [ 0 0 0 0 0 0 0 0 0 0 0 23 0 46 0
[ 3M - 1Y [ 4 4 0 0 4 0 0 0 0 0 0 197 0 230 0
[ 1Y - 2Y [ 0 -8 0 0 -8 0 0 0 0 0 0 138 0 92 0
[ 2Y - 3Y [ 0 0 0 0 0 0 0 0 0 0 0 0 0 0 0
[3Y - 5Y [ 0 0 0 0 0 0 0 0 0 0 0 69 0 59 0
[5Y - 10Y [ 4 4 4 0 0 0 0 0 0 0 0 14 0 13 0
[10Y - more 0 0 0 0 0 0 0 0 0 0 0 0 0 0 0Tot 8 0 4 0 -4 0 0 0 0 0 0 440 1 439 -1
[ 0 - 3M [ 0 0 0 0 0 0 0 0 0 0 0 21 0 175 0
[ 3M - 1Y [ 0 -8 0 0 -8 0 0 0 0 0 0 51 0 28 0
[ 1Y - 2Y [ 1 -1 0 0 -1 0 0 0 0 0 0 69 0 69 0
[ 2Y - 3Y [ 0 -4 0 0 -4 0 0 0 0 0 0 0 0 0 0
[3Y - 5Y [ 0 -17 0 0 -17 0 0 0 0 0 0 46 0 46 0
[5Y - 10Y [ 9 -8 0 0 -8 0 0 0 0 0 0 0 0 0 0
[10Y - more 13 9 0 0 9 0 0 0 0 0 0 0 0 0 0Tot 24 -28 0 0 -28 0 0 0 0 0 0 186 1 317 -1
[ 0 - 3M [ 0 0 0 0 0 0 0 0 0 0 0 0 0 0 0
[ 3M - 1Y [ 0 0 0 0 0 0 0 0 0 0 0 0 0 0 0
[ 1Y - 2Y [ 0 0 0 0 0 0 0 0 0 0 0 0 0 0 0
[ 2Y - 3Y [ 0 0 0 0 0 0 0 0 0 0 0 0 0 0 0
[3Y - 5Y [ 0 0 0 0 0 0 0 0 0 0 0 0 0 0 0
[5Y - 10Y [ 0 0 0 0 0 0 0 0 0 0 0 0 0 0 0
[10Y - more 0 0 0 0 0 0 0 0 0 0 0 0 0 0 0Tot 0 0 0 0 0 0 0 0 0 0 0 0 0 0 0
[ 0 - 3M [ 0 0 0 0 0 0 0 0 0 0 0 0 0 0 0
[ 3M - 1Y [ 0 0 0 0 0 0 0 0 0 0 0 0 0 0 0
[ 1Y - 2Y [ 0 0 0 0 0 0 0 0 0 0 0 0 0 0 0
[ 2Y - 3Y [ 0 0 0 0 0 0 0 0 0 0 0 0 0 0 0
[3Y - 5Y [ 1 1 0 0 1 0 0 0 0 0 0 0 0 0 0
[5Y - 10Y [ 0 0 0 0 0 0 0 0 0 0 0 0 0 0 0
[10Y - more 0 0 0 0 0 0 0 0 0 0 0 0 0 0 0Tot 1 1 0 0 1 0 0 0 0 0 0 0 0 0 0
[ 0 - 3M [ 0 0 0 0 0 0 0 0 0 0 0 0 0 0 0
[ 3M - 1Y [ 0 0 0 0 0 0 0 0 0 0 0 0 0 0 0
[ 1Y - 2Y [ 0 0 0 0 0 0 0 0 0 0 0 0 0 0 0
[ 2Y - 3Y [ 0 0 0 0 0 0 0 0 0 0 0 0 0 0 0
[3Y - 5Y [ 0 0 0 0 0 0 0 0 0 0 0 0 0 0 0
[5Y - 10Y [ 0 0 0 0 0 0 0 0 0 0 0 0 0 0 0
[10Y - more 0 0 0 0 0 0 0 0 0 0 0 0 0 0 0Tot 0 0 0 0 0 0 0 0 0 0 0 0 0 0 0
Greece
Ireland
Finland
France
Germany
Croatia
Hungary

2016 EU-wide Stress Test: Sovereign
(mln EUR)
Banca Monte dei Paschi di Siena S.p.A.
31/12/2015
Residual Maturity Country / Region
GROSS DIRECT LONG
EXPOSURES
(accounting value gross
of provisions)
(1)
NET DIRECT EXPOSURES
(accounting value gross of provisions)
(1)
Notional value Fair-value (+) Fair-value (-) Notional value Fair-value (+)
DIRECT SOVEREIGN EXPOSURES IN DERIVATIVES (1) INDIRECT SOVEREIGN EXPOSURES (3) (on and off balance sheet)
Derivatives with positive fair value Derivatives with negative fair value Derivatives with positive fair value Derivatives with negative fair value
Notional value Fair-value (-)Notional valueof which: Loans and
receivablesof which: AFS
of which: FVO
(designated at fair
value through
profit&loss)
of which: HFT
(2)of which: HTM
Austria
[ 0 - 3M [ 560 560 0 0 331 0 229 0 0 315 -8 69 0 745 -25
[ 3M - 1Y [ 2,467 2,459 6 0 2,400 0 53 0 0 0 0 50 1 0 0
[ 1Y - 2Y [ 3,656 3,600 3,011 0 453 0 137 25 1 3 0 0 0 188 0
[ 2Y - 3Y [ 4,199 4,182 3,377 0 592 0 213 6 1 2 0 0 0 0 0
[3Y - 5Y [ 3,814 3,201 2,376 0 328 0 497 1 0 0 0 0 0 274 -4
[5Y - 10Y [ 7,565 5,630 5,654 0 -307 0 283 2 0 0 0 0 0 2,604 -25
[10Y - more 3,899 3,746 1,887 0 18 0 1,841 60 13 8 0 260 14 0 0Tot 26,159 23,378 16,310 0 3,816 0 3,252 94 15 328 -8 379 15 3,812 -55
[ 0 - 3M [ 0 0 0 0 0 0 0 0 0 0 0 5 0 5 0
[ 3M - 1Y [ 0 0 0 0 0 0 0 0 0 0 0 0 0 0 0
[ 1Y - 2Y [ 0 0 0 0 0 0 0 0 0 0 0 0 0 0 0
[ 2Y - 3Y [ 0 0 0 0 0 0 0 0 0 0 0 0 0 0 0
[3Y - 5Y [ 0 0 0 0 0 0 0 0 0 0 0 0 0 0 0
[5Y - 10Y [ 0 0 0 0 0 0 0 0 0 0 0 0 0 0 0
[10Y - more 0 0 0 0 0 0 0 0 0 0 0 0 0 0 0Tot 0 0 0 0 0 0 0 0 0 0 0 5 0 5 0
[ 0 - 3M [ 0 0 0 0 0 0 0 0 0 0 0 0 0 0 0
[ 3M - 1Y [ 0 0 0 0 0 0 0 0 0 0 0 0 0 0 0
[ 1Y - 2Y [ 0 0 0 0 0 0 0 0 0 0 0 0 0 0 0
[ 2Y - 3Y [ 10 10 10 0 0 0 0 0 0 0 0 0 0 0 0
[3Y - 5Y [ 0 0 0 0 0 0 0 0 0 0 0 0 0 0 0
[5Y - 10Y [ 0 0 0 0 0 0 0 0 0 0 0 0 0 0 0
[10Y - more 0 0 0 0 0 0 0 0 0 0 0 0 0 0 0Tot 10 10 10 0 0 0 0 0 0 0 0 0 0 0 0
[ 0 - 3M [ 0 0 0 0 0 0 0 0 0 0 0 0 0 0 0
[ 3M - 1Y [ 0 0 0 0 0 0 0 0 0 0 0 0 0 0 0
[ 1Y - 2Y [ 0 0 0 0 0 0 0 0 0 0 0 0 0 0 0
[ 2Y - 3Y [ 0 0 0 0 0 0 0 0 0 0 0 0 0 0 0
[3Y - 5Y [ 0 0 0 0 0 0 0 0 0 0 0 0 0 0 0
[5Y - 10Y [ 0 0 0 0 0 0 0 0 0 0 0 0 0 0 0
[10Y - more 0 0 0 0 0 0 0 0 0 0 0 0 0 0 0Tot 0 0 0 0 0 0 0 0 0 0 0 0 0 0 0
[ 0 - 3M [ 0 0 0 0 0 0 0 0 0 0 0 0 0 0 0
[ 3M - 1Y [ 0 -8 0 0 -8 0 0 0 0 0 0 8 8 0 0
[ 1Y - 2Y [ 0 0 0 0 0 0 0 0 0 0 0 0 0 0 0
[ 2Y - 3Y [ 0 0 0 0 0 0 0 0 0 0 0 0 0 0 0
[3Y - 5Y [ 0 0 0 0 0 0 0 0 0 0 0 0 0 0 0
[5Y - 10Y [ 0 0 0 0 0 0 0 0 0 0 0 0 0 0 0
[10Y - more 0 0 0 0 0 0 0 0 0 0 0 0 0 0 0Tot 0 -8 0 0 -8 0 0 0 0 0 0 8 8 0 0
[ 0 - 3M [ 0 0 0 0 0 0 0 0 0 0 0 5 0 5 0
[ 3M - 1Y [ 0 0 0 0 0 0 0 0 0 0 0 0 0 0 0
[ 1Y - 2Y [ 11 11 11 0 0 0 0 0 0 0 0 0 0 0 0
[ 2Y - 3Y [ 0 0 0 0 0 0 0 0 0 0 0 0 0 0 0
[3Y - 5Y [ 0 0 0 0 0 0 0 0 0 0 0 0 0 0 0
[5Y - 10Y [ 1 1 0 0 1 0 0 0 0 0 0 0 0 0 0
[10Y - more 0 0 0 0 0 0 0 0 0 0 0 0 0 0 0Tot 12 12 11 0 1 0 0 0 0 0 0 5 0 5 0
Italy
Latvia
Lithuania
Malta
Netherlands
Poland
Luxembourg

2016 EU-wide Stress Test: Sovereign
(mln EUR)
Banca Monte dei Paschi di Siena S.p.A.
31/12/2015
Residual Maturity Country / Region
GROSS DIRECT LONG
EXPOSURES
(accounting value gross
of provisions)
(1)
NET DIRECT EXPOSURES
(accounting value gross of provisions)
(1)
Notional value Fair-value (+) Fair-value (-) Notional value Fair-value (+)
DIRECT SOVEREIGN EXPOSURES IN DERIVATIVES (1) INDIRECT SOVEREIGN EXPOSURES (3) (on and off balance sheet)
Derivatives with positive fair value Derivatives with negative fair value Derivatives with positive fair value Derivatives with negative fair value
Notional value Fair-value (-)Notional valueof which: Loans and
receivablesof which: AFS
of which: FVO
(designated at fair
value through
profit&loss)
of which: HFT
(2)of which: HTM
Austria
[ 0 - 3M [ 0 0 0 0 0 0 0 0 0 0 0 0 0 0 0
[ 3M - 1Y [ 0 0 0 0 0 0 0 0 0 0 0 3 0 0 0
[ 1Y - 2Y [ 0 0 0 0 0 0 0 0 0 0 0 0 0 0 0
[ 2Y - 3Y [ 0 0 0 0 0 0 0 0 0 0 0 0 0 0 0
[3Y - 5Y [ 2 2 2 0 0 0 0 0 0 0 0 142 3 142 -3
[5Y - 10Y [ 0 0 0 0 0 0 0 0 0 0 0 0 0 0 0
[10Y - more 0 0 0 0 0 0 0 0 0 0 0 0 0 0 0Tot 2 2 2 0 0 0 0 0 0 0 0 145 3 142 -3
[ 0 - 3M [ 0 0 0 0 0 0 0 0 0 0 0 0 0 0 0
[ 3M - 1Y [ 1 1 0 0 1 0 0 0 0 0 0 0 0 0 0
[ 1Y - 2Y [ 0 0 0 0 0 0 0 0 0 0 0 0 0 0 0
[ 2Y - 3Y [ 0 0 0 0 0 0 0 0 0 0 0 0 0 0 0
[3Y - 5Y [ 0 0 0 0 0 0 0 0 0 0 0 0 0 0 0
[5Y - 10Y [ 0 0 0 0 0 0 0 0 0 0 0 0 0 0 0
[10Y - more 0 0 0 0 0 0 0 0 0 0 0 0 0 0 0Tot 1 1 0 0 1 0 0 0 0 0 0 0 0 0 0
[ 0 - 3M [ 0 0 0 0 0 0 0 0 0 0 0 0 0 0 0
[ 3M - 1Y [ 0 0 0 0 0 0 0 0 0 0 0 0 0 0 0
[ 1Y - 2Y [ 0 0 0 0 0 0 0 0 0 0 0 0 0 0 0
[ 2Y - 3Y [ 0 0 0 0 0 0 0 0 0 0 0 0 0 0 0
[3Y - 5Y [ 0 0 0 0 0 0 0 0 0 0 0 0 0 0 0
[5Y - 10Y [ 0 0 0 0 0 0 0 0 0 0 0 0 0 0 0
[10Y - more 0 0 0 0 0 0 0 0 0 0 0 0 0 0 0Tot 0 0 0 0 0 0 0 0 0 0 0 0 0 0 0
[ 0 - 3M [ 0 0 0 0 0 0 0 0 0 0 0 0 0 0 0
[ 3M - 1Y [ 0 0 0 0 0 0 0 0 0 0 0 0 0 10 0
[ 1Y - 2Y [ 0 0 0 0 0 0 0 0 0 0 0 0 0 0 0
[ 2Y - 3Y [ 0 0 0 0 0 0 0 0 0 0 0 0 0 0 0
[3Y - 5Y [ 53 53 53 0 1 0 0 0 0 0 0 46 0 54 -1
[5Y - 10Y [ 1 1 0 0 1 0 0 0 0 0 0 5 0 0 0
[10Y - more 0 0 0 0 0 0 0 0 0 0 0 0 0 0 0Tot 54 54 53 0 2 0 0 0 0 0 0 51 1 64 -1
[ 0 - 3M [ 0 0 0 0 0 0 0 0 0 0 0 0 0 0 0
[ 3M - 1Y [ 0 0 0 0 0 0 0 0 0 0 0 0 0 0 0
[ 1Y - 2Y [ 0 0 0 0 0 0 0 0 0 0 0 0 0 0 0
[ 2Y - 3Y [ 0 0 0 0 0 0 0 0 0 0 0 0 0 0 0
[3Y - 5Y [ 0 0 0 0 0 0 0 0 0 0 0 0 0 0 0
[5Y - 10Y [ 0 0 0 0 0 0 0 0 0 0 0 0 0 0 0
[10Y - more 0 0 0 0 0 0 0 0 0 0 0 0 0 0 0Tot 0 0 0 0 0 0 0 0 0 0 0 0 0 0 0
[ 0 - 3M [ 0 0 0 0 0 0 0 0 0 0 0 0 0 0 0
[ 3M - 1Y [ 0 0 0 0 0 0 0 0 0 0 0 0 0 46 0
[ 1Y - 2Y [ 0 0 0 0 0 0 0 0 0 0 0 92 1 46 -1
[ 2Y - 3Y [ 0 0 0 0 0 0 0 0 0 0 0 0 0 0 0
[3Y - 5Y [ 0 0 0 0 0 0 0 0 0 0 0 23 1 23 -1
[5Y - 10Y [ 0 0 0 0 0 0 0 0 0 0 0 0 0 0 0
[10Y - more 0 0 0 0 0 0 0 0 0 0 0 0 0 0 0Tot 0 0 0 0 0 0 0 0 0 0 0 115 2 115 -2
Portugal
Romania
Slovakia
Slovenia
Spain
Sweden
United Kingdom

2016 EU-wide Stress Test: Sovereign
(mln EUR)
Banca Monte dei Paschi di Siena S.p.A.
31/12/2015
Residual Maturity Country / Region
GROSS DIRECT LONG
EXPOSURES
(accounting value gross
of provisions)
(1)
NET DIRECT EXPOSURES
(accounting value gross of provisions)
(1)
Notional value Fair-value (+) Fair-value (-) Notional value Fair-value (+)
DIRECT SOVEREIGN EXPOSURES IN DERIVATIVES (1) INDIRECT SOVEREIGN EXPOSURES (3) (on and off balance sheet)
Derivatives with positive fair value Derivatives with negative fair value Derivatives with positive fair value Derivatives with negative fair value
Notional value Fair-value (-)Notional valueof which: Loans and
receivablesof which: AFS
of which: FVO
(designated at fair
value through
profit&loss)
of which: HFT
(2)of which: HTM
Austria
[ 0 - 3M [ 0 0 0 0 0 0 0 0 0 0 0 0 0 0 0
[ 3M - 1Y [ 0 0 0 0 0 0 0 0 0 0 0 0 0 0 0
[ 1Y - 2Y [ 0 0 0 0 0 0 0 0 0 0 0 0 0 0 0
[ 2Y - 3Y [ 0 0 0 0 0 0 0 0 0 0 0 0 0 0 0
[3Y - 5Y [ 0 0 0 0 0 0 0 0 0 0 0 0 0 0 0
[5Y - 10Y [ 0 0 0 0 0 0 0 0 0 0 0 0 0 0 0
[10Y - more 0 0 0 0 0 0 0 0 0 0 0 0 0 0 0Tot 0 0 0 0 0 0 0 0 0 0 0 0 0 0 0
[ 0 - 3M [ 0 0 0 0 0 0 0 0 0 0 0 0 0 0 0
[ 3M - 1Y [ 0 0 0 0 0 0 0 0 0 0 0 0 0 0 0
[ 1Y - 2Y [ 0 0 0 0 0 0 0 0 0 0 0 0 0 0 0
[ 2Y - 3Y [ 0 0 0 0 0 0 0 0 0 0 0 0 0 0 0
[3Y - 5Y [ 0 0 0 0 0 0 0 0 0 0 0 0 0 0 0
[5Y - 10Y [ 0 0 0 0 0 0 0 0 0 0 0 0 0 0 0
[10Y - more 0 0 0 0 0 0 0 0 0 0 0 0 0 0 0Tot 0 0 0 0 0 0 0 0 0 0 0 0 0 0 0
[ 0 - 3M [ 18 18 18 0 0 0 0 0 0 0 0 0 0 0 0
[ 3M - 1Y [ 12 12 12 0 0 0 0 0 0 0 0 0 0 0 0
[ 1Y - 2Y [ 0 0 0 0 0 0 0 0 0 0 0 0 0 0 0
[ 2Y - 3Y [ 0 0 0 0 0 0 0 0 0 0 0 0 0 0 0
[3Y - 5Y [ 0 0 0 0 0 0 0 0 0 0 0 0 0 0 0
[5Y - 10Y [ 0 0 0 0 0 0 0 0 0 0 0 0 0 0 0
[10Y - more 0 0 0 0 0 0 0 0 0 0 0 0 0 0 0Tot 30 30 30 0 0 0 0 0 0 0 0 0 0 0 0
[ 0 - 3M [ 0 0 0 0 0 0 0 0 0 0 0 0 0 0 0
[ 3M - 1Y [ 0 0 0 0 0 0 0 0 0 0 0 0 0 0 0
[ 1Y - 2Y [ 0 0 0 0 0 0 0 0 0 0 0 0 0 0 0
[ 2Y - 3Y [ 0 0 0 0 0 0 0 0 0 0 0 0 0 0 0
[3Y - 5Y [ 0 0 0 0 0 0 0 0 0 0 0 0 0 0 0
[5Y - 10Y [ 0 0 0 0 0 0 0 0 0 0 0 0 0 0 0
[10Y - more 0 0 0 0 0 0 0 0 0 0 0 0 0 0 0Tot 0 0 0 0 0 0 0 0 0 0 0 0 0 0 0
Liechtenstein
Iceland
Norway
Australia
Canada
Hong Kong
Japan

2016 EU-wide Stress Test: Sovereign
(mln EUR)
Banca Monte dei Paschi di Siena S.p.A.
31/12/2015
Residual Maturity Country / Region
GROSS DIRECT LONG
EXPOSURES
(accounting value gross
of provisions)
(1)
NET DIRECT EXPOSURES
(accounting value gross of provisions)
(1)
Notional value Fair-value (+) Fair-value (-) Notional value Fair-value (+)
DIRECT SOVEREIGN EXPOSURES IN DERIVATIVES (1) INDIRECT SOVEREIGN EXPOSURES (3) (on and off balance sheet)
Derivatives with positive fair value Derivatives with negative fair value Derivatives with positive fair value Derivatives with negative fair value
Notional value Fair-value (-)Notional valueof which: Loans and
receivablesof which: AFS
of which: FVO
(designated at fair
value through
profit&loss)
of which: HFT
(2)of which: HTM
Austria
[ 0 - 3M [ 0 0 0 0 0 0 0 0 0 0 0 572 0 571 0
[ 3M - 1Y [ 0 0 0 0 0 0 0 0 0 0 0 0 0 0 0
[ 1Y - 2Y [ 0 0 0 0 0 0 0 0 0 0 0 0 0 0 0
[ 2Y - 3Y [ 0 0 0 0 0 0 0 0 0 0 0 0 0 0 0
[3Y - 5Y [ 0 0 0 0 0 0 0 0 0 0 0 0 0 0 0
[5Y - 10Y [ 0 0 0 0 0 0 0 0 0 0 0 0 0 0 0
[10Y - more 0 0 0 0 0 0 0 0 0 0 0 0 0 0 0Tot 0 0 0 0 0 0 0 0 0 0 0 572 0 571 0
[ 0 - 3M [ 0 0 0 0 0 0 0 0 0 0 0 0 0 9 0
[ 3M - 1Y [ 0 0 0 0 0 0 0 0 0 0 0 24 0 0 0
[ 1Y - 2Y [ 0 0 0 0 0 0 0 0 0 0 0 0 0 0 0
[ 2Y - 3Y [ 0 0 0 0 0 0 0 0 0 0 0 0 0 0 0
[3Y - 5Y [ 0 0 0 0 0 0 0 0 0 0 0 0 0 0 0
[5Y - 10Y [ 0 0 0 0 0 0 0 0 0 0 0 0 0 0 0
[10Y - more 0 0 0 0 0 0 0 0 0 0 0 0 0 0 0Tot 0 0 0 0 0 0 0 0 0 0 0 24 0 10 0
[ 0 - 3M [ 0 0 0 0 0 0 0 0 0 0 0 0 0 0 0
[ 3M - 1Y [ 0 0 0 0 0 0 0 0 0 0 0 0 0 0 0
[ 1Y - 2Y [ 0 0 0 0 0 0 0 0 0 0 0 0 0 0 0
[ 2Y - 3Y [ 0 0 0 0 0 0 0 0 0 0 0 0 0 0 0
[3Y - 5Y [ 0 0 0 0 0 0 0 0 0 0 0 0 0 0 0
[5Y - 10Y [ 0 0 0 0 0 0 0 0 0 0 0 0 0 0 0
[10Y - more 0 0 0 0 0 0 0 0 0 0 0 0 0 0 0Tot 0 0 0 0 0 0 0 0 0 0 0 0 0 0 0
[ 0 - 3M [ 0 0 0 0 0 0 0 0 0 0 0 32 0 32 0[ 3M - 1Y [ 0 0 0 0 0 0 0 0 0 0 0 5 0 5 0
[ 1Y - 2Y [ 0 0 0 0 0 0 0 0 0 0 0 0 0 0 0
[ 2Y - 3Y [ 0 0 0 0 0 0 0 0 0 0 0 0 0 0 0
[3Y - 5Y [ 0 0 0 0 0 0 0 0 0 0 0 0 0 0 0
[5Y - 10Y [ 0 0 0 0 0 0 0 0 0 0 0 0 0 0 0
[10Y - more 0 0 0 0 0 0 0 0 0 0 0 0 0 0 0Tot 0 0 0 0 0 0 0 0 0 0 0 37 0 37 0
[ 0 - 3M [ 11 11 11 0 0 0 0 0 0 0 0 9 0 9 0[ 3M - 1Y [ 0 0 0 0 0 0 0 0 0 0 0 9 0 9 0
[ 1Y - 2Y [ 0 0 0 0 0 0 0 0 0 0 0 0 0 0 0
[ 2Y - 3Y [ 0 0 0 0 0 0 0 0 0 0 0 0 0 0 0
[3Y - 5Y [ 0 0 0 0 0 0 0 0 0 0 0 0 0 0 0
[5Y - 10Y [ 0 0 0 0 0 0 0 0 0 0 0 0 0 0 0
[10Y - more 0 0 0 0 0 0 0 0 0 0 0 0 0 0 0Tot 11 11 11 0 0 0 0 0 0 0 0 18 0 18 0
[ 0 - 3M [ 0 0 0 0 0 0 0 0 0 0 0 0 0 0 0
[ 3M - 1Y [ 0 0 0 0 0 0 0 0 0 0 0 0 0 0 0
[ 1Y - 2Y [ 0 0 0 0 0 0 0 0 0 0 0 0 0 0 0
[ 2Y - 3Y [ 0 0 0 0 0 0 0 0 0 0 0 0 0 0 0
[3Y - 5Y [ 0 0 0 0 0 0 0 0 0 0 0 0 0 0 0
[5Y - 10Y [ 0 0 0 0 0 0 0 0 0 0 0 0 0 0 0
[10Y - more 0 0 0 0 0 0 0 0 0 0 0 0 0 0 0Tot 0 0 0 0 0 0 0 0 0 0 0 0 0 0 0
[ 0 - 3M [ 0 0 0 0 0 0 0 0 0 0 0 0 0 0 0[ 3M - 1Y [ 0 0 0 0 0 0 0 0 0 0 0 32 0 32 0
[ 1Y - 2Y [ 0 0 0 0 0 0 0 0 0 0 0 0 0 0 0
[ 2Y - 3Y [ 0 0 0 0 0 0 0 0 0 0 0 0 0 0 0
[3Y - 5Y [ 0 0 0 0 0 0 0 0 0 0 0 0 0 0 0
[5Y - 10Y [ 0 0 0 0 0 0 0 0 0 0 0 0 0 0 0
[10Y - more 7 7 0 0 7 0 0 0 0 0 0 0 0 0 0Tot 7 7 0 0 7 0 0 0 0 0 0 32 0 32 0
Latin America and the
Caribbean
Middle East
U.S.
China
Switzerland
Other advanced
economies non EEA
Other Central and eastern
Europe countries non EEA

2016 EU-wide Stress Test: Sovereign
(mln EUR)
Banca Monte dei Paschi di Siena S.p.A.
31/12/2015
Residual Maturity Country / Region
GROSS DIRECT LONG
EXPOSURES
(accounting value gross
of provisions)
(1)
NET DIRECT EXPOSURES
(accounting value gross of provisions)
(1)
Notional value Fair-value (+) Fair-value (-) Notional value Fair-value (+)
DIRECT SOVEREIGN EXPOSURES IN DERIVATIVES (1) INDIRECT SOVEREIGN EXPOSURES (3) (on and off balance sheet)
Derivatives with positive fair value Derivatives with negative fair value Derivatives with positive fair value Derivatives with negative fair value
Notional value Fair-value (-)Notional valueof which: Loans and
receivablesof which: AFS
of which: FVO
(designated at fair
value through
profit&loss)
of which: HFT
(2)of which: HTM
Austria
[ 0 - 3M [ 0 0 0 0 0 0 0 0 0 0 0 14 0 14 0
[ 3M - 1Y [ 0 0 0 0 0 0 0 0 0 0 0 0 0 0 0
[ 1Y - 2Y [ 0 0 0 0 0 0 0 0 0 0 0 0 0 0 0
[ 2Y - 3Y [ 0 0 0 0 0 0 0 0 0 0 0 0 0 0 0
[3Y - 5Y [ 0 0 0 0 0 0 0 0 0 0 0 0 0 0 0
[5Y - 10Y [ 0 0 0 0 0 0 0 0 0 0 0 0 0 0 0
[10Y - more 0 0 0 0 0 0 0 0 0 0 0 0 0 0 0Tot 0 0 0 0 0 0 0 0 0 0 0 14 0 14 0
[ 0 - 3M [ 0 0 0 0 0 0 0 0 0 0 0 0 0 0 0
[ 3M - 1Y [ 0 0 0 0 0 0 0 0 0 0 0 0 0 0 0
[ 1Y - 2Y [ 0 0 0 0 0 0 0 0 0 0 0 0 0 0 0
[ 2Y - 3Y [ 0 0 0 0 0 0 0 0 0 0 0 0 0 0 0
[3Y - 5Y [ 0 0 0 0 0 0 0 0 0 0 0 0 0 0 0
[5Y - 10Y [ 0 0 0 0 0 0 0 0 0 0 0 0 0 0 0
[10Y - more 0 0 0 0 0 0 0 0 0 0 0 0 0 0 0Tot 0 0 0 0 0 0 0 0 0 0 0 0 0 0 0
26,384 23,527 16,495 0 3,780 0 3,252 95 15 328 -8 2,110 39 5,630 -63
Notes, definitions and regions:
(1) The exposures reported cover only exposures to central, regional and local governments on immediate borrower basis, and do not include exposures to other counterparts with full or partial government guarantees. Exposures to central banks should not be included here.(2) For positions in HFT this should include gross exposures (long) net of cash short positions of sovereign debt to other counterpaties only where there is a maturity matching(3) The exposures reported include the positions towards counterparts (other than sovereign) on sovereign credit risk (i.e. CDS) booked in all the accounting portfolio (on-off balance sheet). Irrespective of the denomination and or accounting classification of the positions.Other advanced non EEA: Israel, Korea, New Zealand, San Marino, Singapore,Taiwan and RussiaOther CEE non EEA: Albania, Bosnia and Herzegovina, Kosovo, FYR Macedonia, Montenegro, Serbia, and Turkey.Middle East: Yemen,United Arab Emirates,Syrian ,Sudan,Saudi Arabia,Qatar ,Oman ,Mauritania ,Libya ,Lebanon ,Kuwait ,Jordan ,Iraq ,Iran,Djibouti and Bahrain.Latin America: Venezuela,Uruguay ,Trinidad and Tobago,Suriname ,St. Vincent and the Grenadines,St. Lucia,St. Kitts and Nevis,Peru ,Paraguay ,Panama ,Nicaragua ,Mexico ,Jamaica ,Honduras ,Haiti ,Guyana ,Guatemala ,Grenada ,El Salvador,Ecuador ,Dominican Republic,Dominica ,Costa Rica,Colombia ,Chile ,Brazil ,Bolivia and Belize.Africa: South Africa, Tunisia ,Morocco ,Egypt and Algeria.
Africa
Others
Total
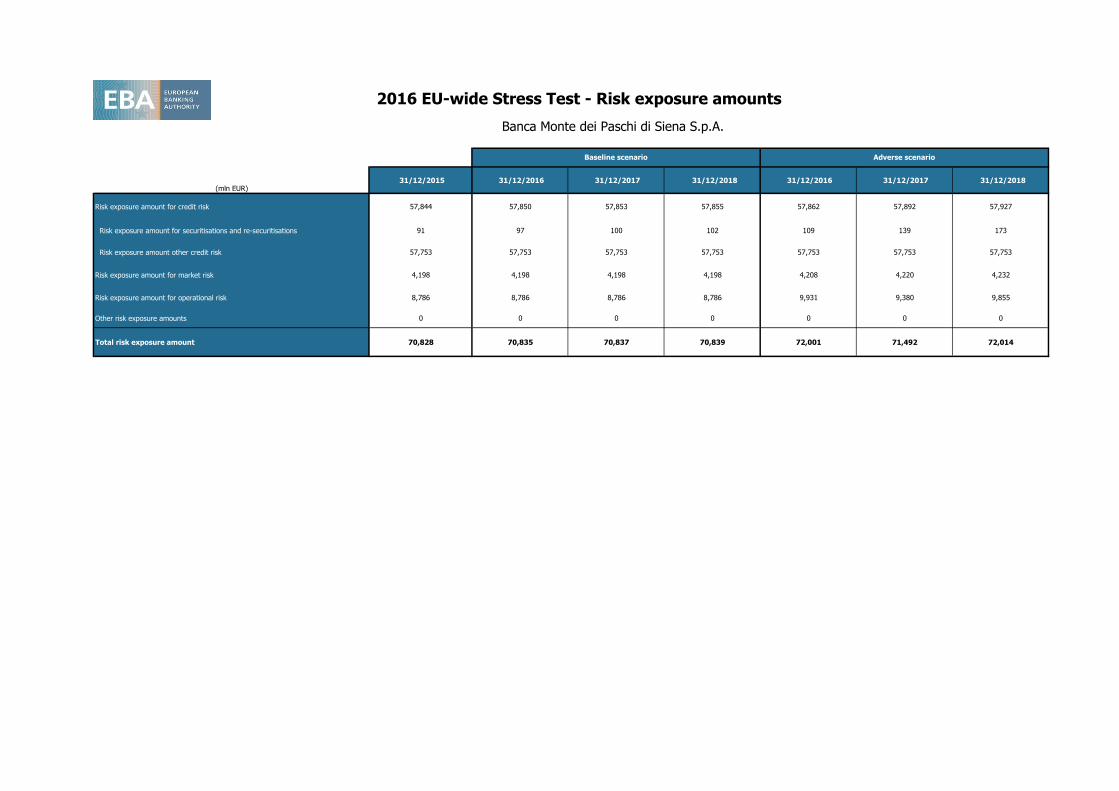
2016 EU-wide Stress Test - Risk exposure amounts
(mln EUR) 31/12/2015 31/12/2016 31/12/2017 31/12/2018 31/12/2016 31/12/2017 31/12/2018
Risk exposure amount for credit risk 57,844 57,850 57,853 57,855 57,862 57,892 57,927
Risk exposure amount for securitisations and re-securitisations 91 97 100 102 109 139 173
Risk exposure amount other credit risk 57,753 57,753 57,753 57,753 57,753 57,753 57,753
Risk exposure amount for market risk 4,198 4,198 4,198 4,198 4,208 4,220 4,232
Risk exposure amount for operational risk 8,786 8,786 8,786 8,786 9,931 9,380 9,855
Other risk exposure amounts 0 0 0 0 0 0 0
Total risk exposure amount 70,828 70,835 70,837 70,839 72,001 71,492 72,014
Baseline scenario Adverse scenario
Banca Monte dei Paschi di Siena S.p.A.

2016 EU-wide Stress Test - P&L
31/12/2015 31/12/2016 31/12/2017 31/12/2018 31/12/2016 31/12/2017 31/12/2018
Net interest income (1) 2,8722,720 2,872 2,872 1,479 1,275 1,179
Interest income 4,746 4,641 4,634 4,663 4,265 4,212 4,111
(Interest expense) -1,874 -1,921 -1,751 -1,679 -2,785 -2,937 -2,931
Dividend income 19 19 19 19 17 17 17
Net fee and commission income 1,810 1,810 1,810 1,810 1,692 1,692 1,692
Gains or (-) losses on financial assets and liabilities held for trading, net 66 8 8 8 -218 6 6
Gains or (-) losses on financial assets and liabilities designated at fair
value through profit and loss, net91 0
Other operating income not listed above, net 611 371 371 371 374 371 371
Total operating income, net 5,468 4,927 5,079 5,079 3,344 3,360 3,264
(Impairment or (-) reversal of impairment on financial assets not
measured at fair value through profit or loss)-2,668 -1,495 -1,255 -1,059 -2,592 -2,681 -2,412
Other income and expenses not listed above, net -3,031 -3,115 -3,098 -3,101 -3,301 -3,291 -3,274
Profit or (-) loss before tax from continuing operations -231 318 726 919 -2,548 -2,612 -2,421
(Tax expenses or (-) income related to profit or loss from continuing operations) 10 -59 -171 -235 787 806 749
Profit or (-) loss after tax from discontinued operations 1 0 0 0 0 0 0
Profit or (-) loss for the year (2) -220 258 554 684 -1,761 -1,805 -1,672
Attributable to owners of the parent -220 258 554 684 -1,761 -1,805 -1,672
Amount of dividends paid 0 78 166 205 0 0 0
Attributable to owners of the parent net of estimated dividends -220 181 388 479 -1,761 -1,805 -1,672
(2) Due to recognised one-off costs in 2015 in line with section 6.4.2 on the methodological note, projections include the impact of a reduction in one or several of administrative expenses; profit or loss from discontinued operations; other operating expenses. The
estimated impact of these one-off adjustments before tax is: 2016 Baseline €138mln; 2017 Baseline €138mln; 2018 Baseline €138mln; 2016 Adverse €138mln; 2017 Adverse €138mln; 2018 Adverse €138mln
(mln EUR)
Baseline Scenario Adverse Scenario
Banca Monte dei Paschi di Siena S.p.A.
(1) Projected NII may differ from the sum of interest income and interest expenses due to the application of the cap on NII (paragraphs 308 of the methodological note).

2016 EU-wide Stress Test: Capital
(mln EUR,%) 31/12/2015 31/12/2016 31/12/2017 31/12/2018 31/12/2016 31/12/2017 31/12/2018
A OWN FUNDS 11,298 10,971 11,070 11,155 8,042 4,689 739
A.1 COMMON EQUITY TIER 1 CAPITAL (net of deductions and after applying transitional adjustments) 8,503 8,412 8,537 8,531 5,898 2,432 -1,604
A.1.1 Capital instruments eligible as CET1 Capital (including share premium and net own capital instruments) 8,810 8,810 8,810 8,810 8,810 8,810 8,810
A.1.1.1 Of which: CET1 instruments subscribed by Government 0 0 0 0 0 0 0
A.1.2 Retained earnings 995 1,176 1,564 2,043 -766 -2,572 -4,244
A.1.3 Accumulated other comprehensive income -33 -33 -33 -33 -1,146 -1,146 -1,146
A.1.3.1 Of which: arising from unrealised gains/losses from Sovereign exposure in AFS portfolio 81 81 81 81 -931 -931 -931
A.1.3.2 Of which: arising from unrealised gains/losses from the rest of AFS portfolio 108 108 108 108 7 7 7
A.1.4 Other Reserves -358 -358 -358 -358 -358 -358 -358
A.1.5 Funds for general banking risk 0 0 0 0 0 0 0
A.1.6 Minority interest given recognition in CET1 capital 0 0 0 0 0 0 0
A.1.7 Adjustments to CET1 due to prudential filters -35 -35 -35 -35 -35 -35 -35
A.1.8 (-) Intangible assets (including Goodwill) -450 -450 -450 -450 -450 -450 -450
A.1.9 (-) DTAs that rely on future profitability and do not arise from temporary differences net of associated DTLs -267 -217 -78 0 -989 -1,768 -2,503
A.1.10 (-) IRB shortfall of credit risk adjustments to expected losses -13 -459 -825 -1,249 -41 -68 -122
A.1.11 (-) Defined benefit pension fund assets 0 0 0 0 0 0 0
A.1.12 (-) Reciprocal cross holdings in CET1 Capital 0 0 0 0 0 0 0
A.1.13 (-) Excess deduction from AT1 items over AT1 Capital 0 0 0 0 -193 0 0
A.1.14 (-) Deductions related to assets which can alternatively be subject to a 1.250% risk weight 0 0 0 0 0 0 0
A.1.14.1 Of which: from securitisation positions (-) 0 0 0 0 0 0 0
A.1.15(-) Holdings of CET1 capital instruments of financial sector entities where the institiution does not have a significant
investment0 0 0 0 0 -19 -53
A.1.16 (-) Deductible DTAs that rely on future profitability and arise from temporary differences 0 0 0 0 -9 -357 -683
A.1.17 (-) CET1 instruments of financial sector entities where the institiution has a significant investment 0 0 0 0 -126 -447 -760
A.1.18 (-) Amount exceding the 17.65% threshold -60 -62 -14 0 -317 -156 0
A.1.19 (-) Additional deductions of CET1 Capital due to Article 3 CRR 0 0 0 0 0 0 0
A.1.20 CET1 capital elements or deductions - other -215 -215 -215 -215 -215 -215 -215
A.1.21 Transitional adjustments 127 254 171 18 1,731 1,211 154
A.1.21.1 Transitional adjustments due to grandfathered CET1 Capital instruments (+/-) 0 0 0 0 0 0 0
A.1.21.2 Transitional adjustments due to additional minority interests (+/-) 0 0 0 0 0 0 0
A.1.21.3Transitional adjustments to CET1 Capital from unrealised gains/losses from Sovereign exposure in AFS portfolio (+/-
)-51 -32 -16 0 372 186 0
A.1.21.4 Transitional adjustments to CET1 Capital from unrealised gains/losses from the rest of AFS portfolio (+/-) -98 -65 -33 0 -13 -7 0
A.1.21.5 Other transitional adjustments to CET1 Capital 276 351 220 18 1,372 1,032 154
A.1.21.5.1 Of which: due to DTAs that rely on future profitability and do not arise from temporary differences 160 87 16 0 395 354 0
A.1.21.5.2Of which: due to DTAs that rely on future profitability and arise from temporary differences and CET1
instruments of financial sector entities where the institution has a significant investment18 14 2 0 89 159 136
A.2 ADDITIONAL TIER 1 CAPITAL (net of deductions and after transitional adjustments) 598 476 448 470 0 111 470
A.2.1 Additional Tier 1 Capital instruments 210 210 210 210 210 210 210
A.2.2 (-) Excess deduction from T2 items over T2 capital 0 0 0 0 0 0 0
A.2.3 Other Additional Tier 1 Capital components and deductions 0 0 0 0 193 0 0
A.2.4 Additional Tier 1 transitional adjustments 388 266 238 260 -403 -99 260
A.3 TIER 1 CAPITAL (net of deductions and after transitional adjustments) 9,101 8,888 8,985 9,001 5,898 2,543 -1,135
A.4 TIER 2 CAPITAL (net of deductions and after transitional adjustments) 2,196 2,083 2,084 2,154 2,145 2,147 1,874
A.4.1 Tier 2 Capital instruments 2,218 2,218 2,218 2,218 2,218 2,218 2,218
A.4.2 Other Tier 2 Capital components and deductions -49 -64 -64 -64 -64 -38 -344
A.4.3 Tier 2 transitional adjustments 28 -71 -70 0 -10 -32 0
B TOTAL RISK EXPOSURE AMOUNT 70,828 70,835 70,837 70,839 72,001 71,492 72,014
B.1 Of which: Transitional adjustments included 1,439 1,354 1,298 1,267 1,351 827 0
C.1 Common Equity Tier 1 Capital ratio 12.01% 11.88% 12.05% 12.04% 8.19% 3.40% -2.23%
C.2 Tier 1 Capital ratio 12.85% 12.55% 12.68% 12.71% 8.19% 3.56% -1.58%
C.3 Total Capital ratio 15.95% 15.49% 15.63% 15.75% 11.17% 6.56% 1.03%
D.1 Common Equity Tier 1 Capital ratio (1) 12.07% 11.74% 12.03% 12.24% 6.17% 1.73% -2.44%
D.2 Tier 1 Capital ratio (2) 12.37% 12.04% 12.33% 12.54% 6.47% 2.02% -2.15%
D.3 Total Capital ratio (3) 15.50% 15.14% 15.43% 15.63% 9.52% 5.11% 0.45%
ETotal amount of instruments with mandatory conversion into ordinary shares upon a fixed date in the 2016 -2018 period
(cumulative conversions) (4)0 0 0 0 0 0 0
FTotal Additional Tier 1 and Tier 2 instruments eligible as regulatory capital under the CRR provisions that convert into
Common Equity Tier 1 or are written down upon a trigger event (5)0 0 0
F.1 Of which: eligible instruments whose trigger is above CET1 capital ratio in the adverse scenario (5) 0 0 0
G.1 Total leverage ratio exposures (transitional) 174,280 174,280 174,280 174,280 174,280 174,280 174,280
G.2 Total leverage ratio exposures (fully loaded) 174,141 174,141 174,141 174,141 174,141 174,141 174,141
G.3 Leverage ratio (transitional) 5.22% 5.10% 5.16% 5.16% 3.38% 1.46% -0.65%
G.4 Leverage ratio (fully loaded) 4.93% 4.81% 4.92% 5.01% 2.62% 0.82% -0.89%
(1) Fully loaded CET1 capital ratio estimation: [A.1-A.1.13-A.1.21+MIN(A.2+A.1.13-A.2.2-A.2.4+MIN(A.4+A.2.2-A.4.3,0),0)]/[B-B.1]
(2) Fully loaded T1 capital ratio estimation: [A.1-A.1.21+A.2-A.2.2-A.2.4+MIN(A.4+A.2.2-A.4.3,0)]/[B-B.1]
(3) Fully loaded Total capital ratio estimation: [A.1-A.1.21+A.2-A.2.4+A.4-A.4.3)/[B-B.1]. This ratio does not include grandfathered AT1 capital instruments meeting the conditions laid down in Article 63 of CRR and, hence, eligible as fully loaded T2 capital. Therefore, the ratio could be underestimated for banks with material instruments of such kind.
(4) Conversions not considered for CET1 computation
(5) Excluding instruments included in row E
Memorandum items
Baseline Scenario Adverse Scenario
CAPITAL RATIOS (%)
Transitional period
Banca Monte dei Paschi di Siena S.p.A.
OWN FUNDS
CAPITAL RATIOS (%)
Fully loaded
TOTAL RISK EXPOSURE
AMOUNT
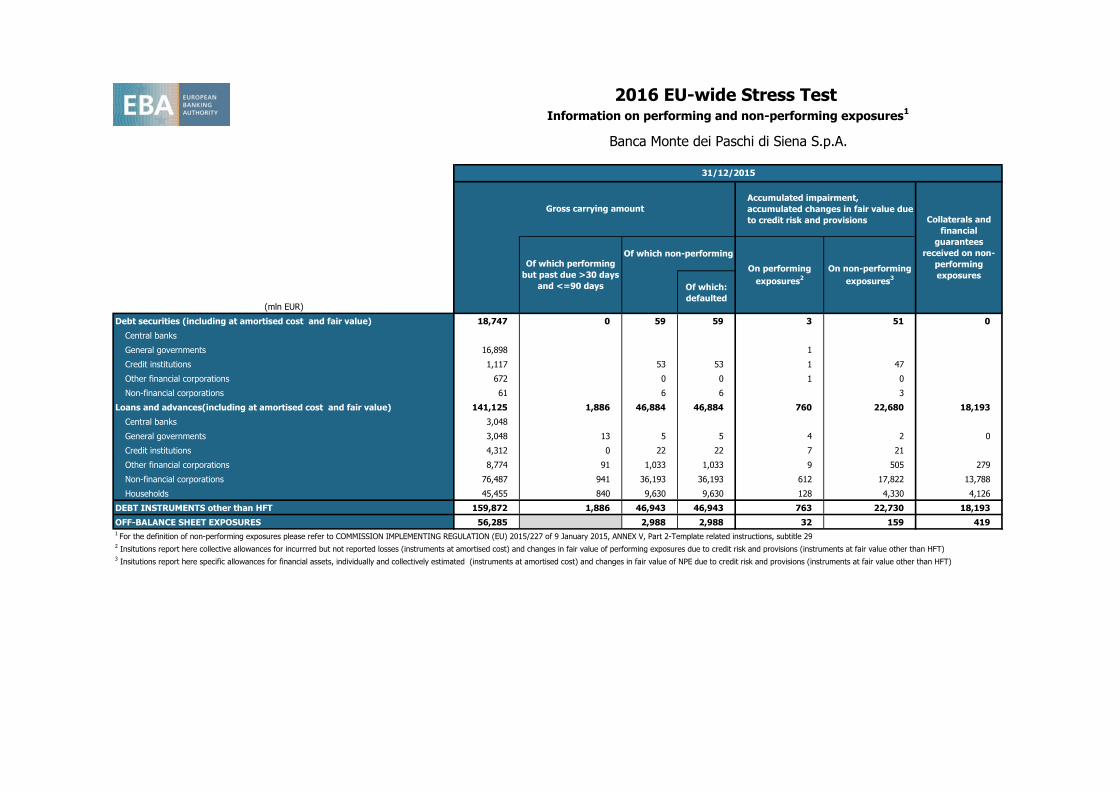
(mln EUR)
Of which:
defaulted
Debt securities (including at amortised cost and fair value) 18,747 0 59 59 3 51 0
Central banks
General governments 16,898 1
Credit institutions 1,117 53 53 1 47
Other financial corporations 672 0 0 1 0
Non-financial corporations 61 6 6 3
Loans and advances(including at amortised cost and fair value) 141,125 1,886 46,884 46,884 760 22,680 18,193
Central banks 3,048
General governments 3,048 13 5 5 4 2 0
Credit institutions 4,312 0 22 22 7 21
Other financial corporations 8,774 91 1,033 1,033 9 505 279
Non-financial corporations 76,487 941 36,193 36,193 612 17,822 13,788
Households 45,455 840 9,630 9,630 128 4,330 4,126
DEBT INSTRUMENTS other than HFT 159,872 1,886 46,943 46,943 763 22,730 18,193
OFF-BALANCE SHEET EXPOSURES 56,285 2,988 2,988 32 159 4191 For the definition of non-performing exposures please refer to COMMISSION IMPLEMENTING REGULATION (EU) 2015/227 of 9 January 2015, ANNEX V, Part 2-Template related instructions, subtitle 29
2 Insitutions report here collective allowances for incurrred but not reported losses (instruments at amortised cost) and changes in fair value of performing exposures due to credit risk and provisions (instruments at fair value other than HFT)
3 Insitutions report here specific allowances for financial assets, individually and collectively estimated (instruments at amortised cost) and changes in fair value of NPE due to credit risk and provisions (instruments at fair value other than HFT)
On non-performing
exposures3
2016 EU-wide Stress Test Information on performing and non-performing exposures
1
31/12/2015
Gross carrying amount
Accumulated impairment,
accumulated changes in fair value due
to credit risk and provisions Collaterals and
financial
guarantees
received on non-
performing
exposures
Of which performing
but past due >30 days
and <=90 days
Of which non-performing
On performing
exposures2
Banca Monte dei Paschi di Siena S.p.A.

(mln EUR)
Debt securities (including at amortised cost and fair value) 3 3 1 1 0
Central banks
General governments
Credit institutions 2 2 0 0
Other financial corporations
Non-financial corporations 1 1 1 1
Loans and advances (including at amortised cost and fair value) 13,487 9,630 2,580 2,453 7,471
Central banks
General governments 1 1 0 0
Credit institutions
Other financial corporations 349 209 59 59 195
Non-financial corporations 10,680 8,181 2,283 2,177 5,298
Households 2,457 1,239 237 217 1,978
DEBT INSTRUMENTS other than HFT 13,490 9,634 2,581 2,454 7,471
Loan commitments given 424 389 0 0 1481 For the definition of forborne exposures please refer to COMMISSION IMPLEMENTING REGULATION (EU) 2015/227 of 9 January 2015, ANNEX V, Part 2-Template related instructions, subtitle 30
2016 EU-wide Stress Test Information on forborne exposures
1
31/12/2015
Of which non-
performing
exposures with
forbearance
measures
Of which on non-
performing
exposures with
forbearance
measures
Gross carrying amount of exposures
with forbearance measures
Accumulated impairment, accumulated
changes in fair value due to credit risk
and provisions for exposures with
forbearance measures Collateral and financial
guarantees received on
exposures with forbearance
measures
Banca Monte dei Paschi di Siena S.p.A.


