19
2016 FINANCIAL RESULTS March 15, 2017 MAIRE TECNIMONT - 2016 FINANCIAL RESULTS

2016 FINANCIAL RESULTS
March 15, 2017
MA
IRE
TE
CN
IMO
NT
-20
16 F
INA
NC
IAL
RE
SU
LTS

DISCLAIMER
This document has been prepared by Maire Tecnimont S.p.A. (the “Company”) solely for use in the presentation of its financial results.
This document does not constitute or form part of any offer or invitation to sell, or any solicitation to purchase any shares in the Company.
The information contained and the opinions expressed in this document have not been independently verified. In particular, this document may contain forward-looking statements that are based on current estimates and assumptions made by the management of the Company to the best of its knowledge. Such forward-looking statements are subject to risks and uncertainties, the non-occurrence or occurrence of which could cause the actual results – including the financial condition and profitability of the Group – to differ materially from or be more negative than those expressed or implied by such forward-looking statements. This also applies to the forward-looking estimates and forecasts derived from third-party studies. Consequently, neither the Company nor its management can give any assurance regarding the future accuracy of the estimates of future performance set forth in this document or the actual occurrence of the predicted developments.
Dario Michelangeli, as Executive for Financial Reporting, declares - in accordance with paragraph 2, Article 154-bis of Legislative Decree No. 58/1998 (“Consolidated Finance Act”) - that the accounting information included in this presentation corresponds to the underlying accounting records.
The data and information contained in this document are subject to variations and integrations. Although the Company reserves the right to make such variations and integrations when it deems necessary or appropriate, the Company assumes no affirmative disclosure obligation to make such variations and integrations.
MA
IRE
TE
CN
IMO
NT
-20
16 F
INA
NC
IAL
RE
SU
LTS
2

KEY MESSAGES
• Strong growth in Consolidated Revenues, EBITDA and Net Income
− Revenues: €2.4bn (+45.9%)
− EBITDA: €160.0m (+22.3%)
− Net Income: €85.3m (+94.8%)
• Steady marginality throughout 2016
− EBITDA Margin: 6.6%
• Dividends 2016: €28.4m (+97%)
• Significant deleverage
− NFP: €42.8m (vs. €125.6m as of 31/12/15)
• Solid order intake supported by increasing commercial pipeline
− Order Intake of €1.8bn
− Commercial pipeline of €31.5bn (+€2.9bn vs. 31/12/15)
3
MA
IRE
TE
CN
IMO
NT
-20
16 F
INA
NC
IAL
RE
SU
LTS

KEY CONSOLIDATED FINANCIALS (€M)
130.8
160.0
2015 2016
1,669.6
2,435.4
2015 2016
43.8
85.3
2015 2016
126.2
184.7
Dec '15 Dec '16
125.6
42.8
Dec '15 Dec '16
Revenues EBITDA Net Income
NFP Net Worth
4
MA
IRE
TE
CN
IMO
NT
-20
16 F
INA
NC
IAL
RE
SU
LTS
+45.9% +22.3% +94.8%
+€58.5m- €82.8 m

SUMMARY
1. Operational Performance Pierroberto Folgiero, CEO
2. Financial Results
Alessandro Bernini, CFO
3. Looking Ahead
Pierroberto Folgiero, CEO

2016 ORDER INTAKE
Name Client Country Business Type Value (€m)
Liwa Plastic Complex ORPIC Oman Petrochemical EPC 786
Pengerang Integrated
ComplexPetronas Malaysia Petrochemical EPC 308
Clean Fuel ProjectPetro
RabighSaudi Arabia Oil & Gas EPC 134
SumgayitSOCAR
PolymerAzerbaijan Petrochemical EPC 111
Wind Farm Utility Mexico Renewable Energy EPC 84
Others Various Various O&G/Petchem/Fertilizers E/EP 354
Total €1.8bn
6
MA
IRE
TE
CN
IMO
NT
-20
16 F
INA
NC
IAL
RE
SU
LTS

BACKLOG
4,545
6,4556,065
406
438
451
31/12/14 31/12/15 31/12/16
TE&C Infrastructure
6,893
6,516
29%
39%
16%
13%
3%
Europe
Middle East
Others
Asia
Africa
Backlog by Geography(December 2016)
A Well Diversified Backlog that Provides a Solid Base to Future Revenues
Backlog by Business Unit(€m, 31/12/14-31/12/16)
7
TE&C
MA
IRE
TE
CN
IMO
NT
-20
16 F
INA
NC
IAL
RE
SU
LTS
4,951

BACKLOG ANALYSIS – TE&C BUSINESS UNIT
Good mix between E, EP, and EPC Excellent cover for increasing revenues
Book to Bill Ratio* (31/12/14-31/12/16)
3.1
4.2
2.7
31/12/14 31/12/15 31/12/16
126 80
846 681
5,4835,304
31/12/15 31/12/16
E EP EPC
6,4556,065
972 761
Backlog by Type (€m, 31/12/15-31/12/16)
*Defined as the ratio between Backlog and LTM Revenues
*Defined as the ratio between Backlog and LTM Revenues8
MA
IRE
TE
CN
IMO
NT
-20
16 F
INA
NC
IAL
RE
SU
LTS

OUTLOOK ON COMMERCIAL ACTIVITY (TE&C)
Commercial Activity (€bn, Dec ’13-Dec ‘16)
9.512.0
17.9 19.04.3
7.4
6.2 5.5
5.2
6.6
4.57.0
Dec '13 Dec '14 Dec '15 Dec '16
Prospect, Prequalification & Pre-Tendering Tendering Tendered
28.6
26.0
19.0
31.5
Our Commercial Pipeline Has Been Increasing since 2013
9
MA
IRE
TE
CN
IMO
NT
-20
16 F
INA
NC
IAL
RE
SU
LTS
&

COMMERCIAL ACTIVITY’S GEOGRAPHICAL BREAKDOWN (TE&C)*
North and CentralAmericaPOLYOLEFIN
South AmericaGAS TREATMENT
POLYOLEFIN AfricaFERTILIZER
POLYOLEFIN
GAS TREATMENT
REFINERY
Middle EastFERTILIZER
POLYOLEFIN
GAS TREATMENT
REFINERY
AsiaFERTILIZER
POLYOLEFIN
GAS TREATMENT
C.I.S.FERTILIZER
POLYOLEFIN
GAS TREATMENT
REFINERYEuropePOLYOLEFIN
REFINERY
Our commercial activity continues to be very focused on implementing our current strategic approach
*Figures include prospect prequalification and pre-tendering, tendering, and tendered
10
€1.3bn
€1.6bn
€0.5bn
€9.2bn
€8.8bn
€6.5bn
€3.6bn
MA
IRE
TE
CN
IMO
NT
-20
16 F
INA
NC
IAL
RE
SU
LTS

SUMMARY
1. Operational Performance
Pierroberto Folgiero, CEO
2. Financial Results Alessandro Bernini, CFO
3. Looking Ahead
Pierroberto Folgiero, CEO

CONSOLIDATED INCOME STATEMENT
€m 2015 2016 ∆%
Revenues 1,669.6 2,435.4 45.9%
Business Profit 211.2 241.2 14.2%
G&A (73.9) (76.2) 3.1%
R&D (6.4) (5.0) (21.9%)
EBITDA 130.8 160.0 22.3%
EBITDA % 7.8% 6.6%
EBIT 115.4 152.6 32.2%
Net Financial Charges (37.8) (18.8) (50.3%)
Profit Before Taxes 77.6 133.8 72.4%
Tax Provision (33.8) (48.5)
Effective Tax Rate 43.6% 36.3%
Net Income 43.8 85.3 94.8%
12MA
IRE
TE
CN
IMO
NT
-20
16 F
INA
NC
IAL
RE
SU
LTS

NET FINANCIAL POSITION AND CASH FLOW BRIDGE
125.6
20.6
18.8 42.8
Net Debt
Dec-2015
Operating
Cash Flows
Forex Dividends Capex Net Financial
Charges
Net Debt
Dec-2016
14.416.3
152.9
Cash Flow Bridge (€m)
11.9 28.2
73.175.1
40.6
-60.5
Net Bank DebtConv. BondDerivatives
Dec 2015 Dec 2016
-82.8
Net Financial Position (€m)
13
125.642.8
MA
IRE
TE
CN
IMO
NT
-20
16 F
INA
NC
IAL
RE
SU
LTS

SUMMARY
1. Operational Performance
Pierroberto Folgiero, CEO
2. Financial Results
Alessandro Bernini, CFO
3. Looking Ahead Pierroberto Folgiero, CEO

GLOBAL & TECHNOLOGICAL LEADERSHIP
163
30%
Ammonia and Urea Plants
Market share in polyolefin plants
MA
IRE
TE
CN
IMO
NT
-20
16 F
INA
NC
IAL
RE
SU
LTS
completed since 1924
40%Market share in
LDPE plants
PETROCHEMICALS FERTILIZERS
Well rooted technology orientation: market leader (#1)
for installed capacity
WORLD CLASS TRACK RECORD
in Large Gas Treatment Plants and Refinery
Process Units
OIL & GAS
WELL RECOGNIZED LEADERSHIP
in Licensing hydrogen technology and in licensing Sulphur Recovery and Tail Gas Treatment Technology
* Data are based on corporate analysis
54%Market share in
licensing urea plants technology
(#1 worldwide)*
34%Market share
in licensing urea granulation technology
(#2 worldwide)*
62 Polyethylene Plants
117 Polypropylene Plants
Since 1970
+1,100Individual Patents
Strong commitment to technology development
230Hydrogen and Sulphur Recovery
Unit Projects completed
Since 1971
15

OUR OPERATIONS ARE DRIVEN BY POSITIVE BUSINESS TRENDS
• Gas monetization: Cheap feedstock supports owner’s investment attractiveness
• Strong demand for plastics-based products
• Gas monetization
• Demography and agricultural modernization driving long term
demand for nitrogen-based fertilizers
• Technology barriers
• Midstream Oil and Gas Treatment
• Refining: Revamping & Capacity upgrade
• Integration between petchem and refining
16
FERTILIZERS
PETCHEM
OIL & GAS
MA
IRE
TE
CN
IMO
NT
–20
16 F
INA
NC
IAL
RE
SU
LTS

MAIRE TECNIMONT HAS BEEN OUTPERFORMING THE SECTOR
Maire Tecnimont’s Relative Performance, 6/20/14 – 3/13/17
Maire Tecnimont BEUOILS Index WTI Future
Correlation Coefficient MT – BEUOILS = — 0.26 MT – WTI Future = — 0.35 BEUOILS – WTI Future= + 0.97
Our Stock is Not Correlated to the Oil Price
20
40
60
80
100
120
140
Jun-14
Jul-14
Aug-14
Sep-14
Oct-14
Nov-14
Dec-14
Jan-15
Feb-15
Mar-15
Apr-15
May-15
Jun-15
Jul-15
Aug-15
Sep-15
Oct-15
Nov-15
Dec-15
Jan-16
Feb-16
Mar-16
Apr-16
May-16
Jun-16
Jul-16
Aug-16
Sep-16
Oct-16
Nov-16
Dec-16
Jan-17
Feb-17
17
MA
IRE
TE
CN
IMO
NT
-20
16 F
INA
NC
IAL
RE
SU
LTS
Mar-17
Source: Bloomberg. BEUOILS Index Components: Subsea 7, Saipem, Petrofac, John Wood Group, SBM, Amec FW, TGS
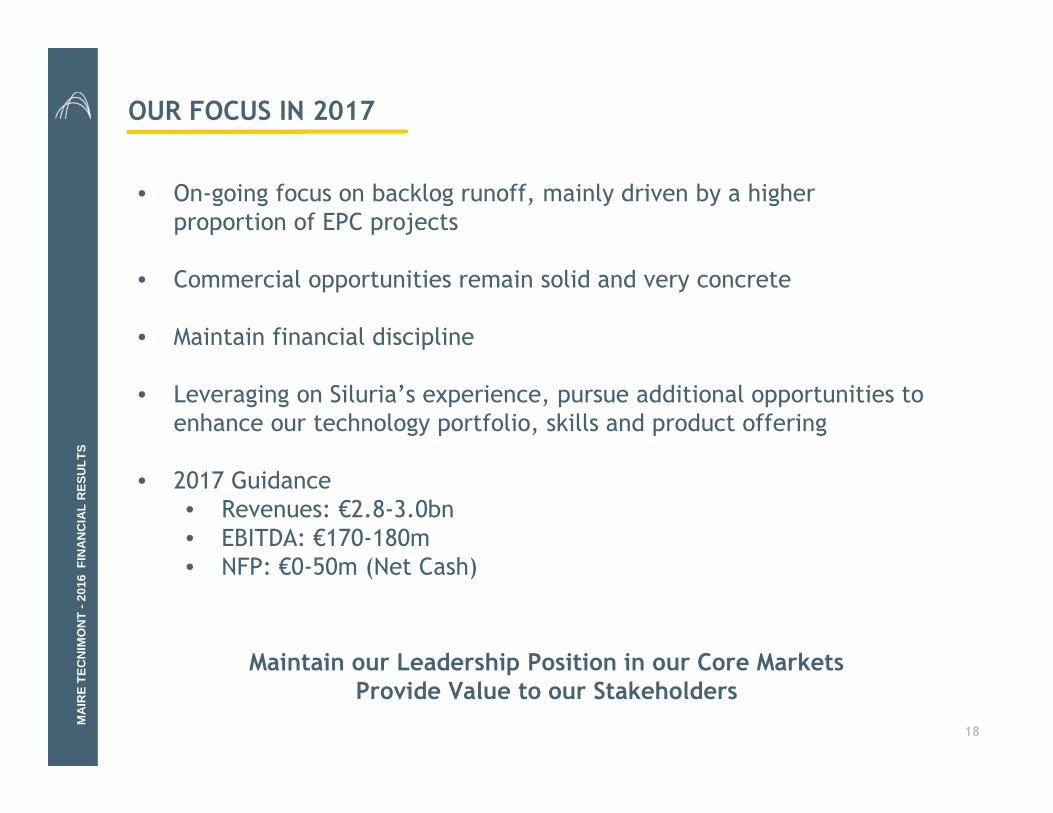
OUR FOCUS IN 2017
• On-going focus on backlog runoff, mainly driven by a higher
proportion of EPC projects
• Commercial opportunities remain solid and very concrete
• Maintain financial discipline
• Leveraging on Siluria’s experience, pursue additional opportunities to
enhance our technology portfolio, skills and product offering
• 2017 Guidance
• Revenues: €2.8-3.0bn
• EBITDA: €170-180m
• NFP: €0-50m (Net Cash)
18
Maintain our Leadership Position in our Core MarketsProvide Value to our Stakeholders
MA
IRE
TE
CN
IMO
NT
-20
16 F
INA
NC
IAL
RE
SU
LTS

Maire Tecnimont Group’s Headquarters
Via Gaetano De Castillia, 6A
20124 Milan
www.mairetecnimont.com
Investor Relations T +39 02 6313-7823 02 [email protected]
MA
IRE
TE
CN
IMO
NT
-20
16 F
INA
NC
IAL
RE
SU
LTS


