㜓岮㖀€ᾂ⎩俪Ə㉼岮ạㆰ⯐ㄵ俪憶㜓庒㉼岮Ḳ曧㰩凮梏暑ḍ婚斘⽳昫Ḳ憴奨偙㗵Ʋ 2016 First Quarter Briefing June 2016 Disclaimer 2 This document is provided by Cathay Financial Holding Co., Ltd. (the "Company"). Except for the numbers and information included in the Company's financial statements, the information contained in this document has not been audited or reviewed by any accountant or independent expert. The Company makes no express or implied representations or warranties as to the fairness, accuracy, completeness, or correctness of such information or opinions. This document is provided as of the date herein and will not be updated to reflect any changes hereafter. The Company, its affiliates and their representatives do not accept any responsibility or liability for any damage caused by their negligence or any other reasons, nor do they accept responsibility or liability for any loss or damages arising from the use of this document or the information contained herein or anything related to this document. This document may contain forward-looking statements, including but not limited to all statements that address activities, events or developments that the Company expects or anticipates to take place in the future based on the projections of the Company toward the future, and various factors and uncertainness beyond the Company's control. Therefore, the actual results may differ materially from those contained in the forward-looking statements. This document is not and cannot be construed as an offer to purchase or sell securities or other financial products or solicitation of an offer. This document may not be directly or indirectly reproduced, redistributed or forwarded to any other person and may not be published in whole or in part for any purpose.
Transcript
2016 First Quarter Briefing
June 2016
Disclaimer
2
This document is provided by Cathay Financial Holding Co., Ltd. (the "Company"). Except for the numbers and information included in the Company's financial statements, the information contained in this document has not been audited or reviewed by any accountant or independent expert. The Company makes no express or implied representations or warranties as to the fairness, accuracy, completeness, or correctness of such information or opinions. This document is provided as of the date herein and will not be updated to reflect any changes hereafter. The Company, its affiliates and their representatives do not accept any responsibility or liability for any damage caused by their negligence or any other reasons, nor do they accept responsibility or liability for any loss or damages arising from the use of this document or the information contained herein or anything related to this document. This document may contain forward-looking statements, including but not limited to all statements that address activities, events or developments that the Company expects or anticipates to take place in the future based on the projections of the Company toward the future, and various factors and uncertainness beyond the Company's control. Therefore, the actual results may differ materially from those contained in the forward-looking statements. This document is not and cannot be construed as an offer to purchase or sell securities or other financial products or solicitation of an offer. This document may not be directly or indirectly reproduced, redistributed or forwarded to any other person and may not be published in whole or in part for any purpose.
Introduction of Cathay FHC 1Q16 Business Overview Overseas Expansion Business Performance Summary
Cathay United Bank Cathay Life Cathay Century
Cathay’s CSR Efforts M&A Key Highlights Cathay Life Embedded Value & Appraisal Value Appendix
3
Agenda
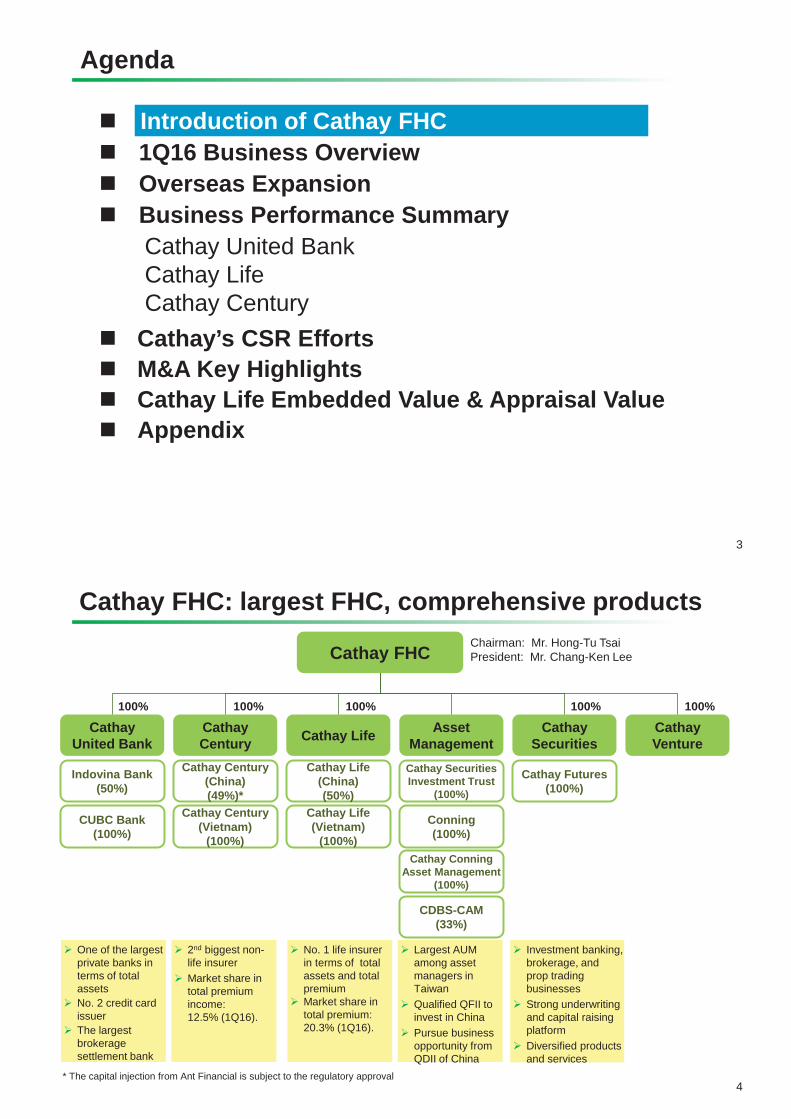
Cathay FHC: largest FHC, comprehensive products
4 * The capital injection from Ant Financial is subject to the regulatory approval
2nd biggest non-life insurer Market share in total premium income: 12.5% (1Q16).
Investment banking, brokerage, and prop trading businesses Strong underwriting and capital raising platform Diversified products and services
One of the largest private banks in terms of total assets No. 2 credit card issuer The largest brokerage settlement bank
No. 1 life insurer in terms of total assets and total premium Market share in total premium: 20.3% (1Q16).
Largest AUM among asset managers in Taiwan Qualified QFII to invest in China Pursue business opportunity from QDII of China
Cathay FHC
Cathay United Bank
100%
Cathay Century
100%
Cathay Life
100%
Asset Management
Cathay Securities
100%
Cathay Venture
100%
Indovina Bank (50%)
CUBC Bank (100%)
Cathay Century (China) (49%)*
Cathay Century (Vietnam)
(100%)
Cathay Life (China) (50%)
Cathay Life (Vietnam)
(100%)
Cathay Futures (100%)
Chairman: Mr. Hong-Tu Tsai President: Mr. Chang-Ken Lee
Note: (1) FY13 figures do not reflect the impact from applying fair value method on investment property.
(2) Since Cathay FHC has more subsidiaries other than Cathay Life and CUB, besides, due to affiliate transactions, the Cathay FHC net income might not equal to the sum of Cathay Life and CUB’s.
(3) EPS has been adjusted for stock dividend (stock split).
82%50% 36% 32%
16%53%
64% 66%
FY12 FY13 FY14 FY15
CUB Cathay Life
6
Market leader in Taiwan’s FIG sector Largest listed financials group by market capitalization and assets.
Ranking of total asset (US$bn)
231 183
14090
46
155104 99 76 72
Cathay Fubon Taiwan CTBC Mega Cooperative Shin Kong First Hua Nan Taishin
Privately owned Government-run
Note: Total assets as of Dec.31, 2015
Ranking of market cap (US$bn) R
Note: Market capitalization as of Apr.15, 2016
38.049.6
57.9
FY13 FY14 FY15
29.0
31% 17%
(1)
7
Cathay FHC – Net income & EPS
Net income (NT$BN) Adjusted EPS (NT$)
Impact to net income from fair value method on investment property
Impact to EPS from fair value method on investment property
Note: (1) FY13 figures reflected the impact from applying fair value method on investment property, starting 2014/1/1. The impact to FY13 net income and EPS of Cathay FHC was NT$9.0BN and NT$0.74, respectively.
(2) EPS has been adjusted for stock dividend (stock split).
29.0
3.123.93
4.58
FY13 FY14 FY15
2.38
(1)
18.1
8.3
1Q15 1Q16
-54% 1.43
0.65
1Q15 1Q16
8
Cathay FHC – Financial results of subsidiaries Net income of primary subsidiaries ROE
1Q15 1Q16 1Q15 1Q16 (NT$BN)
(NT$BN) FY14 FY15 FY14 FY15
12.1% 12.7%10.5% 10.7%
16.4%12.9%
12.3% 11.4% 11.4%14.5%
CathayFHC
CUB CathayLife
CathayCentury
CathaySITE
17.8
31.7
0.7 0.3 0.4
18.8
38.4
0.8 0.3 0.5
CUB CathayLife
CathayCentury
CathaySITE
CathaySecurities
5.512.5
0.2 0.1 0.25.6 2.7 0.1 0.1 0.1
CUB Cathay Life CathayCentury
CathaySITE
CathaySecurities
16.1% 14.7% 14.9% 13.8%
20.8%
7.2%
14.2%
3.1%
7.2%
16.3%
CathayFHC
CUB CathayLife
CathayCentury
CathaySITE
Introduction of Cathay FHC 1Q16 Business Overview Overseas Expansion Business Performance Summary
Cathay United Bank Cathay Life Cathay Century
Cathay’s CSR Efforts M&A Key Highlights Cathay Life Embedded Value & Appraisal Value Appendix
9
Agenda
1Q16 Business overview
10
Cathay United
Bank
Cathay Life
Cathay SITE
Cathay Century
Premium income grew by 26% YoY Market share reached 12.5%, maintained No.2 market position Offshore business continued to grow
Cathay Securities
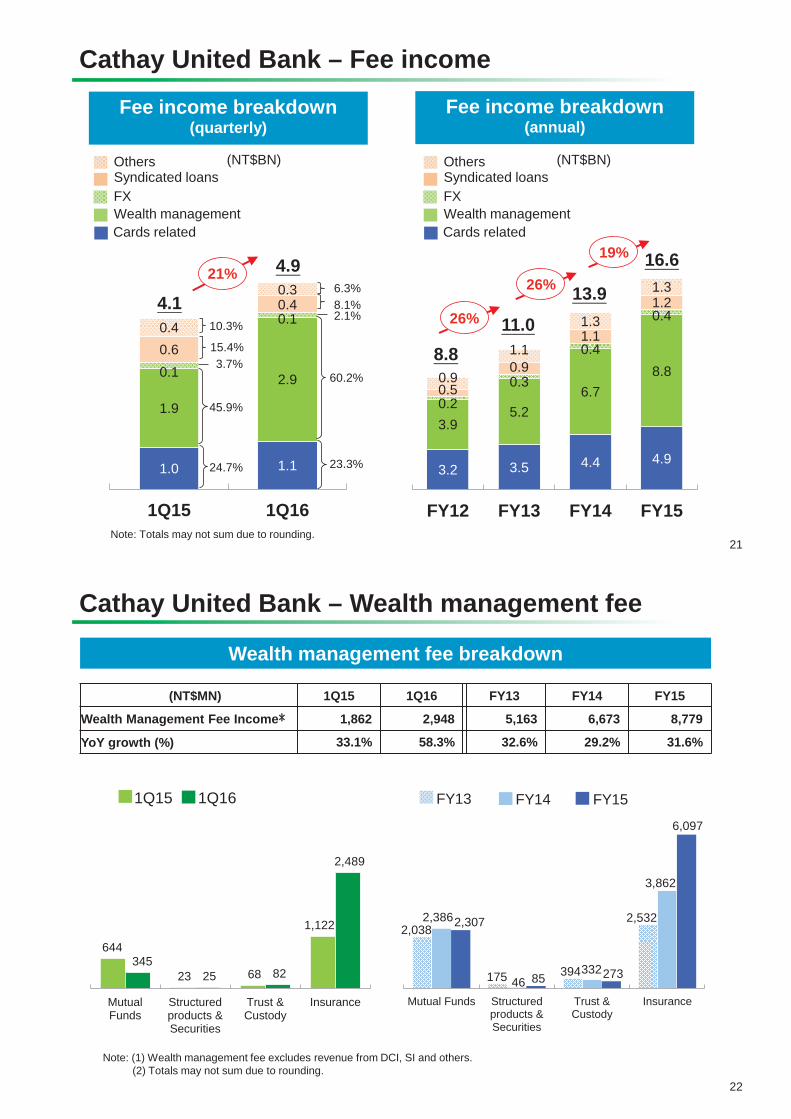
Delivered 5% loan growth with benign credit quality Fee income grew by 21% YoY, wealth management fee grew by 58% Continued to expand overseas business; planned to open Shenzhen branch in 3Q16
Ranked No.1 in terms of AUM, which amounted to NT$433BN Taiwan Futures Exchange, Lipper and Smart rewarded Cathay Mandarin Fund and Cathay Global Infrastructure Fund with “Taiwan Fund Award” in 2016, and Asia Investors rewarded Cathay SITE with “Market Award - Taiwan” in 2015
Sub-brokerage business ranked No.1 in the industry Deepened digital technology applications and enhanced business efficiency
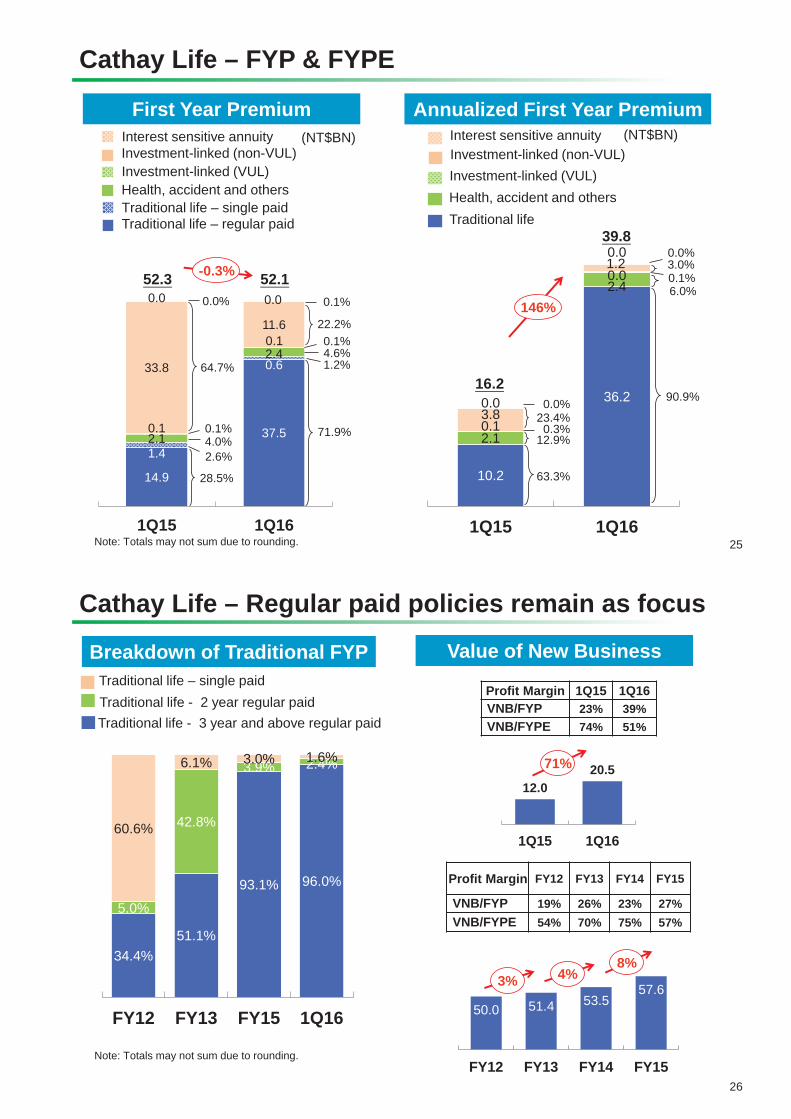
FYPE grew by 146% YoY, ranked No.1 by FYPE Value of New Business grew by 71% YoY, VNB margin increased substantially Overseas investment reached 58%; pre-hedging recurring yield improved gradually
11
Book value
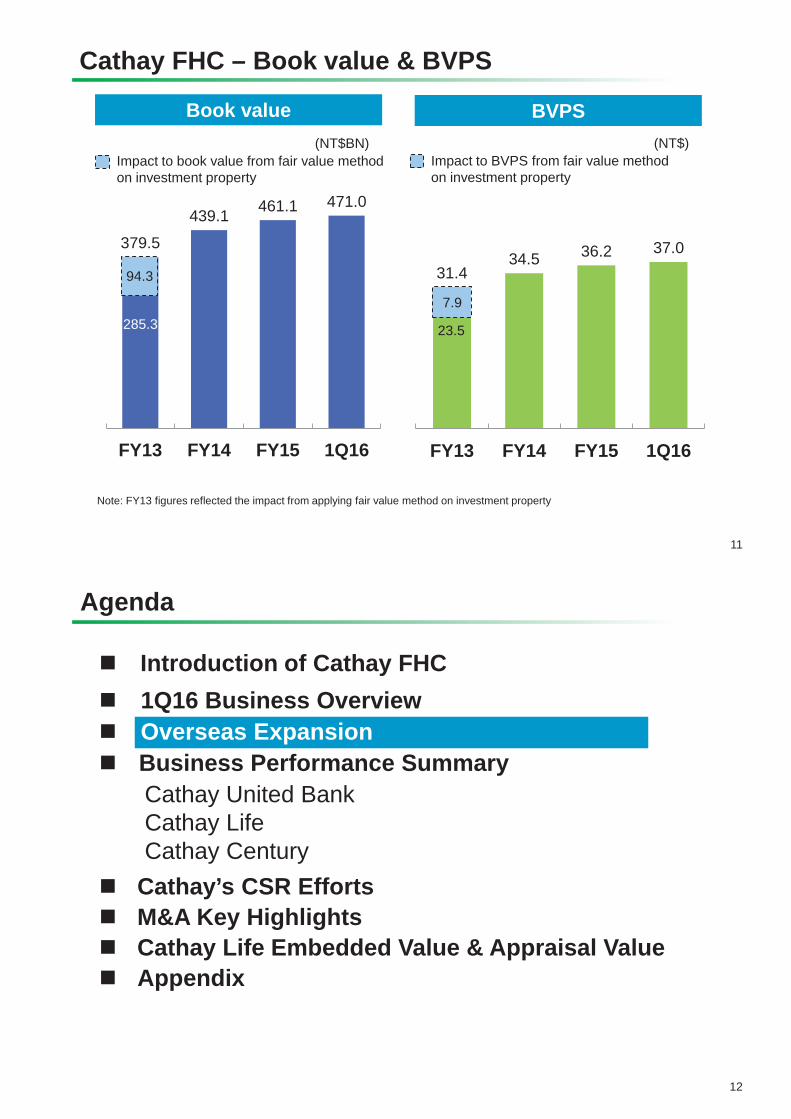
Cathay FHC – Book value & BVPS
BVPS
Impact to book value from fair value method on investment property
Impact to BVPS from fair value method on investment property
Note: FY13 figures reflected the impact from applying fair value method on investment property
(NT$BN) (NT$)
379.5
439.1 461.1 471.0
FY13 FY14 FY15 1Q16
94.3
285.3
31.434.5 36.2 37.0
FY13 FY14 FY15 1Q16
7.9
23.5
Introduction of Cathay FHC 1Q16 Business Overview Overseas Expansion Business Performance Summary
Cathay United Bank Cathay Life Cathay Century
Cathay’s CSR Efforts M&A Key Highlights Cathay Life Embedded Value & Appraisal Value Appendix
12
Agenda
Cathay FHC in South East Asia
13
Thailand Vietnam Cambodia
Indonesia
Malaysia
Cathay United Bank
Cathay Life Cathay Century
Philippines
Banking - Vietnam: Business has performed steadily with solid financial performance and superior asset quality
- Cambodia: Owns most footprints among Taiwanese banks
- Philippines: Invest 22.3% stake in RCBC* - Indonesia: Invest 24.9% stake in Bank Mayapada*
Cathay Life - Cathay Life (Vietnam) has performed steadily.
Continue to expand agent force.
Cathay Century - Continue to expand local channels to enhance growth
momentum
Note: Footprints in Thailand, Myanmar and Indonesia are representative offices. CUB obtained the approval to set up Shenzhen branch.
Laos Myanmar
Singapore
Note: Investments in RCBC and Bank Mayapada are funded by Cathay Life.
China Vietnam Cambodia Hong Kong Singapore Malaysia Laos Philippines Thailand Myanmar Indonesia
Bank 6* 37 16 1 1 1 1 1 1 1 1
Life 30 10 P&C 26 2 Asset Mgt 1 1 Securities 1
Cathay FHC in China
14
Cathay Century (China) Cathay United Bank Cathay Life (China)
Conning Asia Pacific Limited CDBS Cathay Asset Management Company
Cathay Securities
Beijing Liaoning Tianjin
Shandong Jiangsu
Shanghai Zhejiang
Fujian Guangdong
Hong Kong
Hubei Szechwan
Cathay United Bank - Each business line has performed steadily in Shanghai
branch. - Plan to open Shenzhen branch in 3Q16
Cathay Life (China) - 1Q16 solvency ratio 284% - Reported pre-tax profits of 31MN RMB in 1Q16
Cathay Century (China) - Strong premium income growth of 12% YoY - Increase footprints to extend offshore business - Capital injection from Ant Financial is subject to
regulatory approval
Cathay Securities (HK) - Each business line has performed steadily
JV with China Development Bank Securities (CDBS Cathay Asset Management)
- Continue to launch new products, mainly focus on fixed income funds
Conning - Continue to expand asset management business
Introduction of Cathay FHC 1Q16 Business Overview Overseas Expansion Business Performance Summary
Cathay United Bank Cathay Life Cathay Century
Cathay’s CSR Efforts M&A Key Highlights Cathay Life Embedded Value & Appraisal Value Appendix
15
Agenda
16
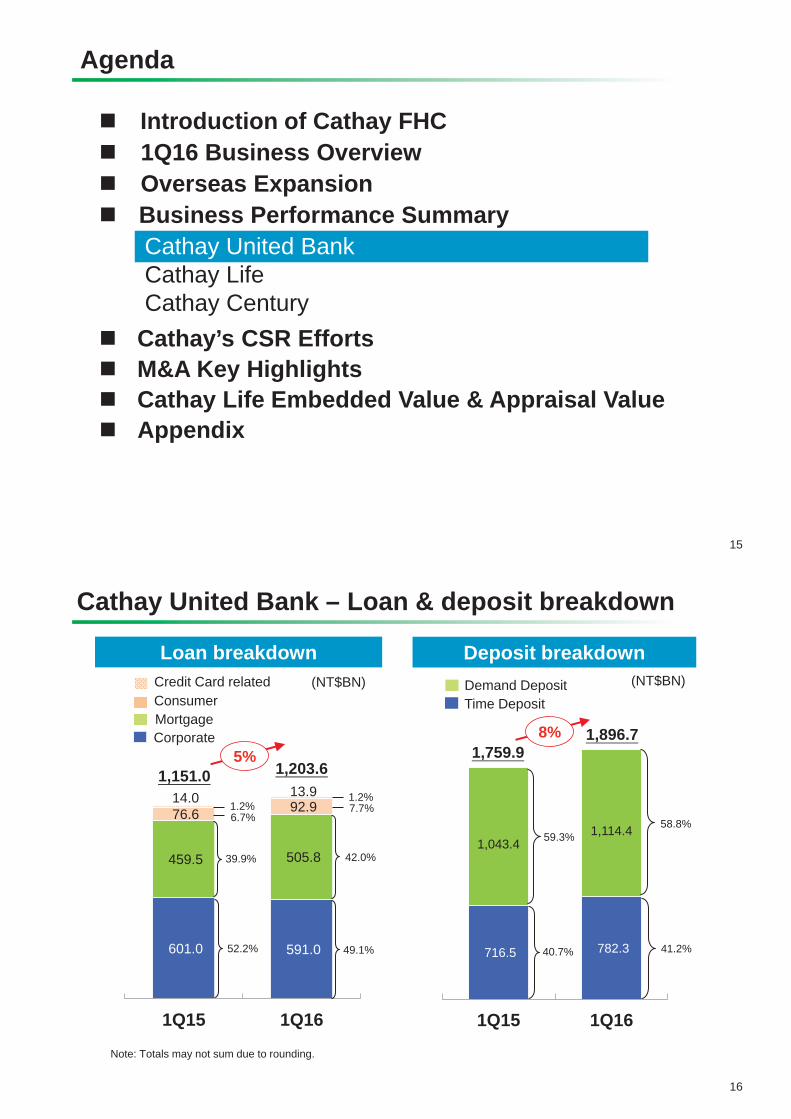
Cathay United Bank – Loan & deposit breakdown
Deposit breakdown
Time Deposit Demand Deposit (NT$BN)
Loan breakdown
Corporate Mortgage Consumer Credit Card related (NT$BN)
Note: Totals may not sum due to rounding.
716.5 782.3
1,043.4 1,114.4
1Q15 1Q16
601.0 591.0
459.5 505.8
76.6 92.9 14.0 13.9
1Q15 1Q16
1,759.9 1,896.7
59.3%
40.7%
58.8%
41.2%
1.2% 1.2%
49.1%
7.7% 6.7%
39.9%
52.2%
5%
42.0%
1,151.0 1,203.6
8%
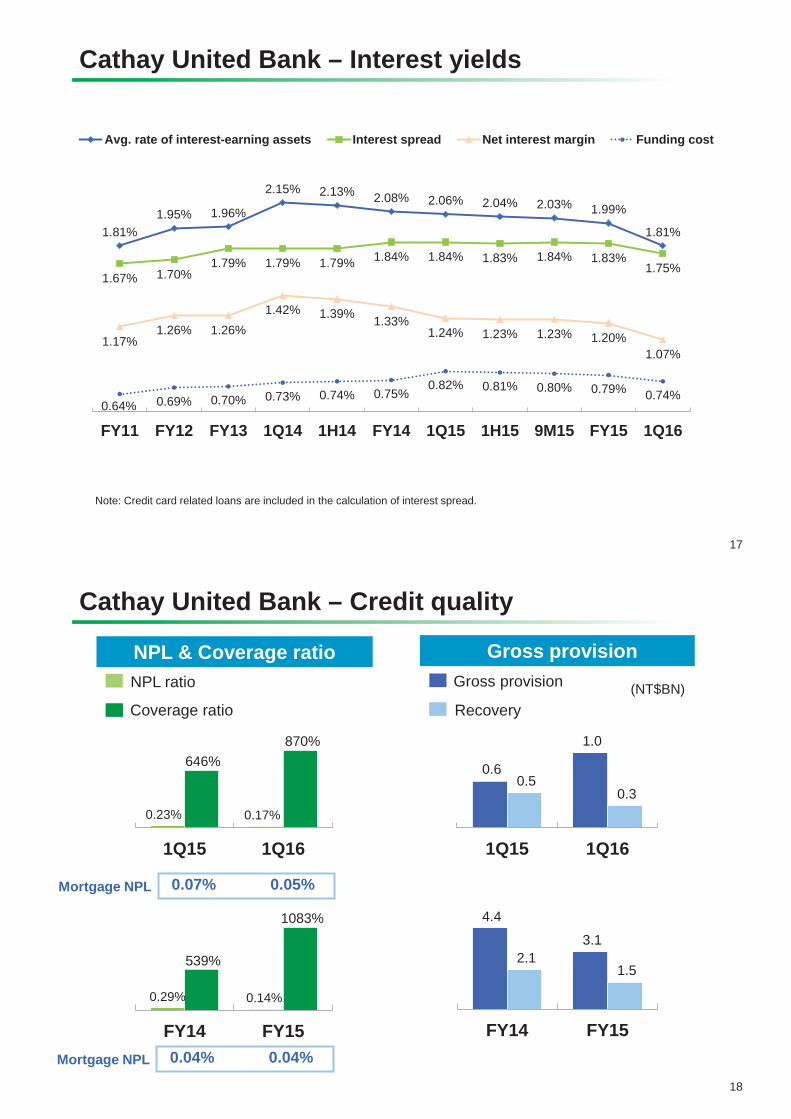
Cathay United Bank – Interest yields
17
Note: Credit card related loans are included in the calculation of interest spread.
Real estate 10.6% 10.5% 10.5% 489.0 10.4% 489.4 2.6%
Others 1.7% 1.6% 2.1% 95.8 2.0% 94.7
Note: (1) Total assets excluded separate account assets; international bond includes foreign currency deposit and related adjustments (2) Yields of international equity and international bond are pre-hedge investment yields.
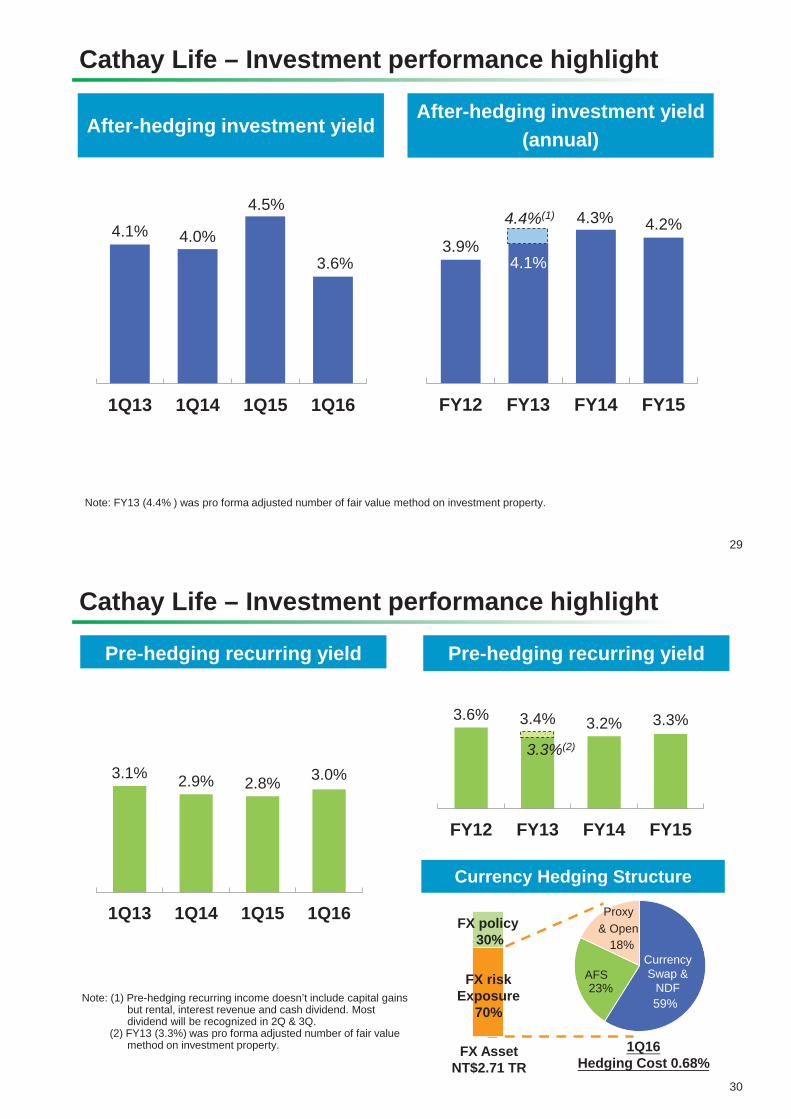
Note: (1) Pre-hedging recurring income doesn’t include capital gains but rental, interest revenue and cash dividend. Most dividend will be recognized in 2Q & 3Q.
(2) FY13 (3.3%) was pro forma adjusted number of fair value method on investment property.
Currency Hedging Structure
3.6% 3.4% 3.2% 3.3%
FY12 FY13 FY14 FY15
3.3%(2)
1Q16 Hedging Cost 0.68%
FX Asset NT$2.71 TR
FX risk Exposure
70%
FX policy 30%
AFS Currency Swap &
NDF
Proxy & Open
3.1% 2.9% 2.8% 3.0%
1Q13 1Q14 1Q15 1Q16
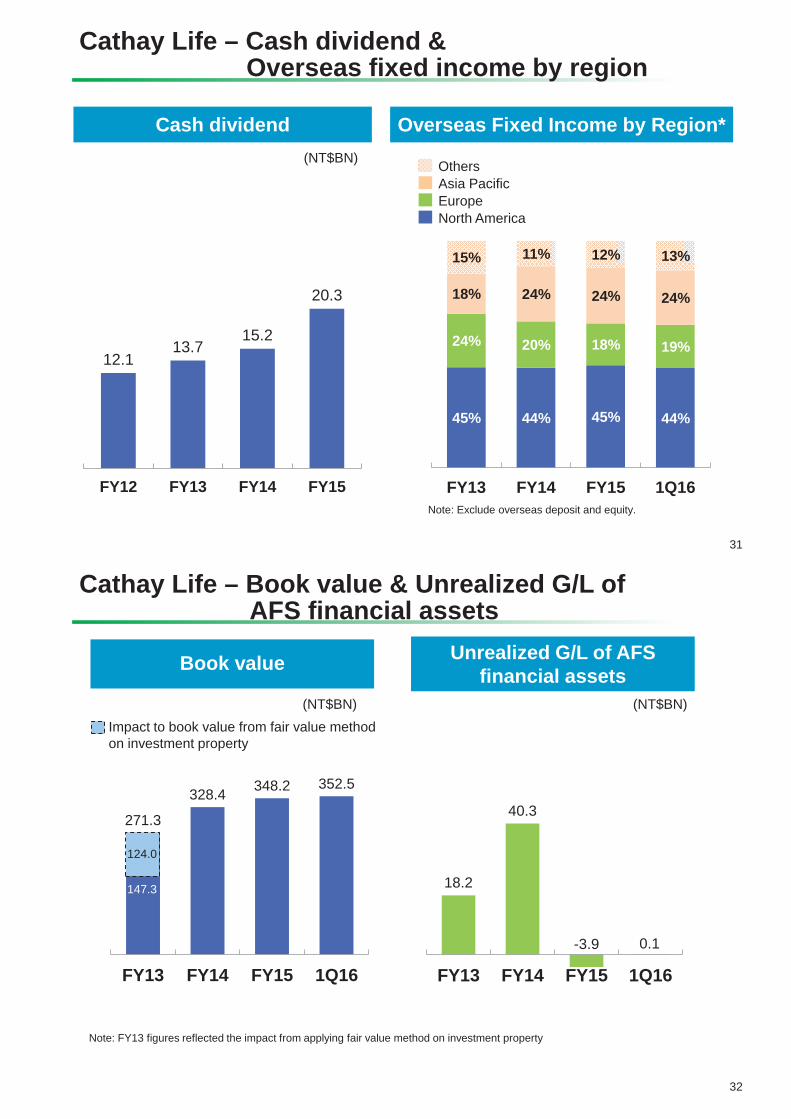
45% 44% 45% 44%
24% 20% 18% 19%
18% 24% 24% 24%
15% 11% 12% 13%
FY13 FY14 FY15 1Q16
12.113.7
15.2
20.3
FY12 FY13 FY14 FY15
Cathay Life – Cash dividend & Overseas fixed income by region
31
Overseas Fixed Income by Region*
Asia Pacific Europe North America
Others
Cash dividend (NT$BN)
Note: Exclude overseas deposit and equity.
Cathay Life – Book value & Unrealized G/L of AFS financial assets
32
Unrealized G/L of AFS financial assets Book value
Impact to book value from fair value method on investment property
Note: FY13 figures reflected the impact from applying fair value method on investment property
(NT$BN) (NT$BN)
271.3
328.4 348.2 352.5
FY13 FY14 FY15 1Q16
124.0
147.3 18.2
40.3
-3.9 0.1
FY13 FY14 FY15 1Q16
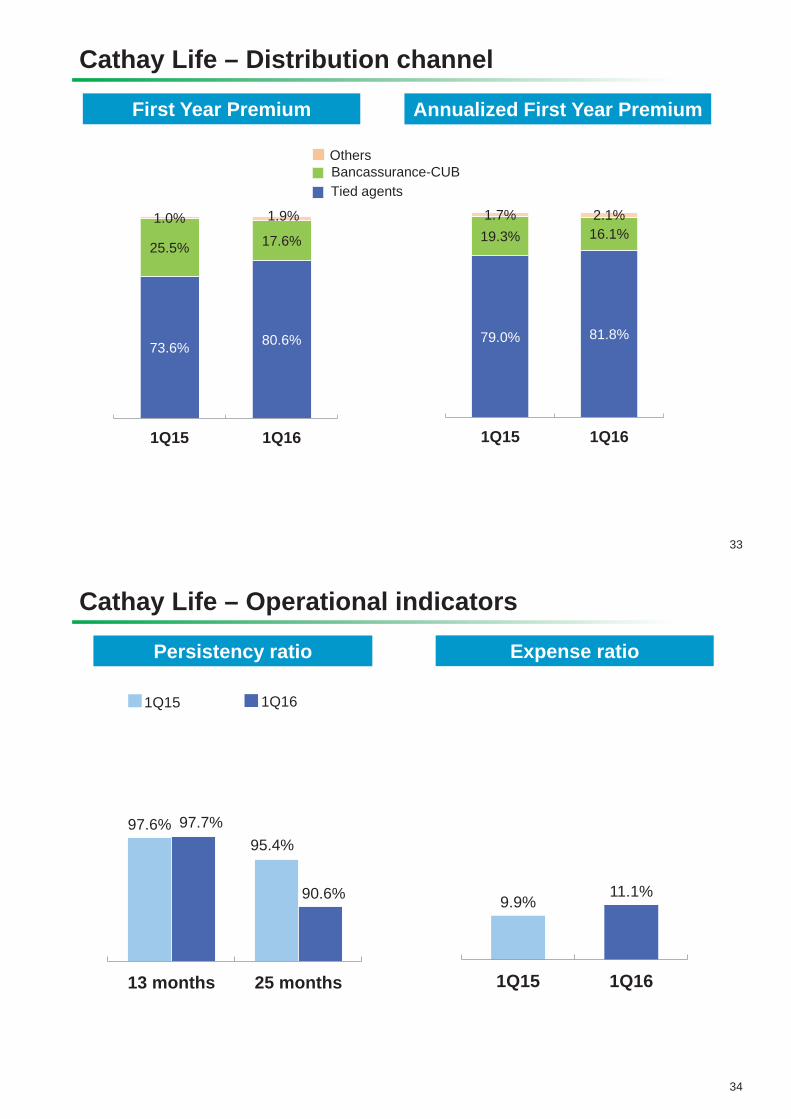
Cathay Life – Distribution channel
33
Tied agents Bancassurance-CUB Others
73.6% 80.6%
25.5% 17.6%1.0% 1.9%
1Q15 1Q16
79.0% 81.8%
19.3% 16.1%1.7% 2.1%
1Q15 1Q16
First Year Premium Annualized First Year Premium
Cathay Life – Operational indicators
34
Persistency ratio Expense ratio
1Q15 1Q16
97.6%95.4%
97.7%
90.6%
13 months 25 months
9.9%11.1%
1Q15 1Q16
Introduction of Cathay FHC 1Q16 Business Overview Overseas Expansion Business Performance Summary
Cathay United Bank Cathay Life Cathay Century
Cathay’s CSR Efforts M&A Key Highlights Cathay Life Embedded Value & Appraisal Value Appendix
35
Agenda
9.1 10.4 11.5 11.8
2.72.7
2.9 2.80.90.7
0.8 0.80.6
0.60.5 0.5
2.42.6
2.83.1
FY12 FY13 FY14 FY15
2.33.2
0.5
0.5
0.2
0.2
0.1
0.10.7
0.8
1Q15 1Q16
3.1%
13.9%
66.2%
18.7%
4.6%
3.2% 10.5%
2.7% 17.4%
59.7%
4.8 26%
3.8
Cathay Century – Premium income
36
Premium income
Note: Totals may not sum due to rounding.
(NT$BN)
Premium income (annual)
Auto
Fire
Marine Engineering Others
(NT$BN)
11.1% 12.5% Market share 74.1% 76.6% Retention
13.6% 13.3% 76.9% 74.9%
13.4% 76.1%
12.7% 74.3%
19.0 18.5 17.1
15.7
3.7%
17.5%
62.2%
15.4%
5.8%
4.3% 14.6%
2.6% 16.3%
57.7%
Cathay Century –Distribution
37
Distribution channel (annual)
Note: Totals may not sum due to rounding.
61.3% 64.5%
38.5% 35.3%
0.2% 0.2%
1Q15 1Q16
Distribution channel
Cathay P&C agents Cathay group channel
Affiliate channels
62.1% 62.4% 61.9% 61.4%
37.6% 37.3% 37.8% 38.3%
0.3% 0.3% 0.3% 0.3%
FY12 FY13 FY14 FY15
50.5% 58.2%
40.6% 34.8%
1Q15 1Q16
51.3% 84.9%33.9%
31.2%
1Q15 1Q16
Cathay Century – Combined ratio
38
Gross combined ratio Retained combined ratio
Gross expense ratio Gross loss ratio
Retained expense ratio Retained loss ratio
116.1% 85.2%
93.0% 91.1%
59.6% 53.0%
31.1% 32.3%
FY14 FY15
63.5% 56.1%
35.8% 37.1%
FY14 FY15
85.3% 90.7% 93.2% 99.3%
Introduction of Cathay FHC 1Q16 Business Overview Overseas Expansion Business Performance Summary
Cathay United Bank Cathay Life Cathay Century
Cathay’s CSR Efforts M&A Key Highlights Cathay Life Embedded Value & Appraisal Value Appendix
39
Agenda
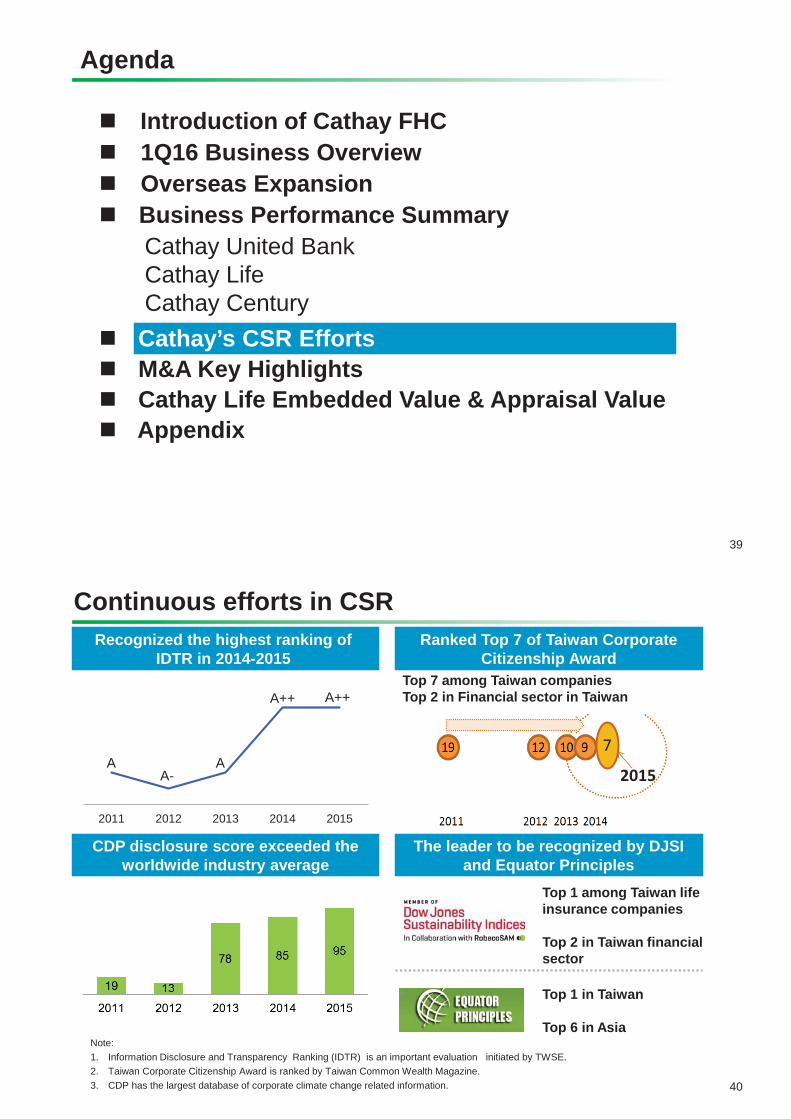
Note: 1. Information Disclosure and Transparency Ranking (IDTR) is an important evaluation initiated by TWSE. 2. Taiwan Corporate Citizenship Award is ranked by Taiwan Common Wealth Magazine. 3. CDP has the largest database of corporate climate change related information. 40
Continuous efforts in CSR Recognized the highest ranking of
IDTR in 2014-2015 Ranked Top 7 of Taiwan Corporate
Citizenship Award Top 7 among Taiwan companies Top 2 in Financial sector in Taiwan
7
2015
CDP disclosure score exceeded the worldwide industry average
The leader to be recognized by DJSI and Equator Principles
Top 1 among Taiwan life insurance companies Top 2 in Taiwan financial sector
Top 1 in Taiwan Top 6 in Asia
2011 2012 2013 2014 2015
A A-
A
A++ A++
Cathay FHC has been selected as a DJSI Emerging Markets Component in Sep. 2015 Cathay FHC is committed to develop ESG in the long term. The company attained the highest rating of A++ from TWSE Information Disclosure and Transparency Ranking, and became one of the top 5% of listed companies in Corporate Governance Evaluation of Taiwan
Incorporate in the DJSI emerging markets index
41
Dow Jones Sustainability Index (DJSI) launched in 1999, which is based on an analysis of corporate economic, environmental and social performance and select top 10% performers in each industry as its index components. The DJSI now is the most recognized sustainability index in the world.
DJSI in the World
CUB is the first EPFI in Taiwan
42
82 Equator Principles Financial Institutions (EPFIs) in 36 countries have officially adopted the EP as of March 2016 . 8 of EPFIs are Asian financial institutions.
Region Europe North
America Latin
America Africa Oceania Asia Middle East
EPFIs no. 33 14 10 9 5 8 3
Japan - 4
India - 1
China - 1
Taiwan - 2
EPFIs in the World
Introduction of Cathay FHC 1Q16 Business Overview Overseas Expansion Business Performance Summary
Cathay United Bank Cathay Life Cathay Century
Cathay’s CSR Efforts M&A Key Highlights Cathay Life Embedded Value & Appraisal Value Appendix
43
Agenda
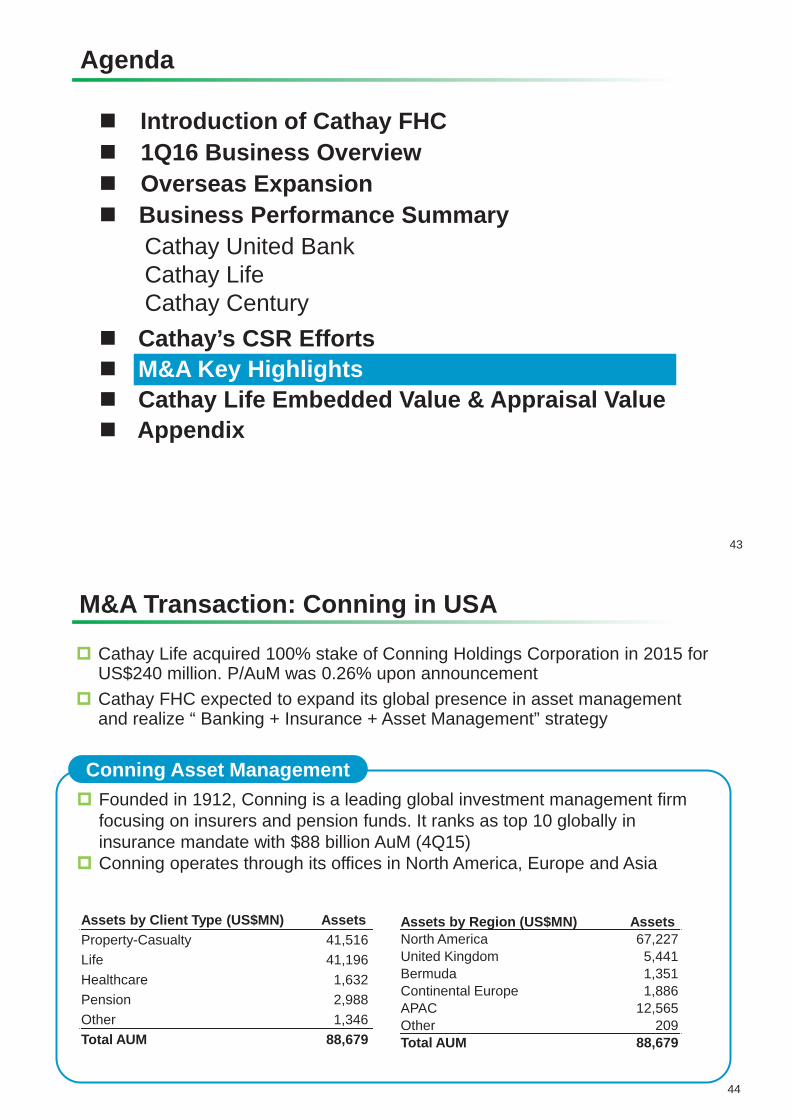
Founded in 1912, Conning is a leading global investment management firm focusing on insurers and pension funds. It ranks as top 10 globally in insurance mandate with $88 billion AuM (4Q15) Conning operates through its offices in North America, Europe and Asia
44
M&A Transaction: Conning in USA
Cathay Life acquired 100% stake of Conning Holdings Corporation in 2015 for US$240 million. P/AuM was 0.26% upon announcement Cathay FHC expected to expand its global presence in asset management and realize “ Banking + Insurance + Asset Management” strategy
Conning Asset Management
Assets by Client Type (US$MN) Assets Property-Casualty 41,516 Life 41,196 Healthcare 1,632 Pension 2,988 Other 1,346 Total AUM 88,679
Assets by Region (US$MN) Assets North America 67,227 United Kingdom 5,441 Bermuda 1,351 Continental Europe 1,886 APAC 12,565 Other 209 Total AUM 88,679
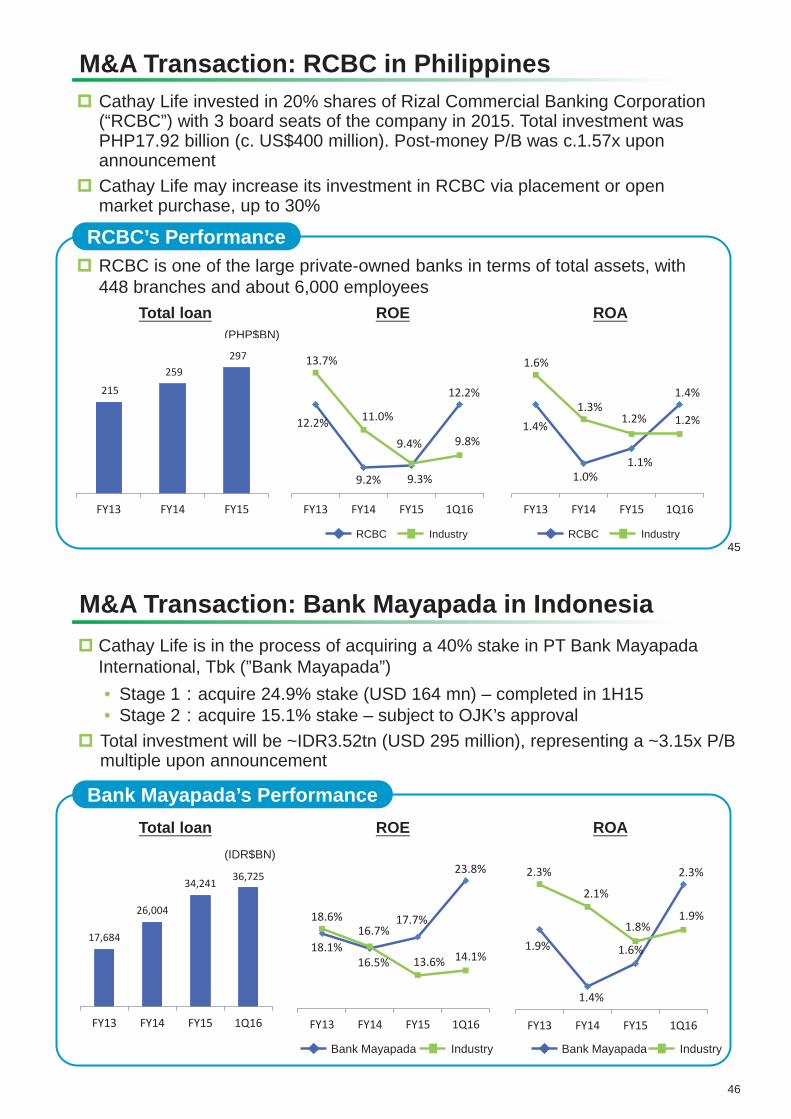
Cathay Life invested in 20% shares of Rizal Commercial Banking Corporation (“RCBC”) with 3 board seats of the company in 2015. Total investment was PHP17.92 billion (c. US$400 million). Post-money P/B was c.1.57x upon announcement Cathay Life may increase its investment in RCBC via placement or open market purchase, up to 30%
M&A Transaction: RCBC in Philippines
45
RCBC Industry
ROE ROA Total loan
RCBC Industry
12.2%
9.2% 9.3%
12.2%
13.7%
11.0%
9.4% 9.8%
FY13 FY14 FY15 1Q16
1.4%
1.0%1.1%
1.4%
1.6%
1.3%1.2% 1.2%
FY13 FY14 FY15 1Q16
RCBC Industry RCBC Industry
(PHP$BN)
215
259 297
FY13 FY14 FY15
RCBC is one of the large private-owned banks in terms of total assets, with 448 branches and about 6,000 employees
RCBC’s Performance
Cathay Life is in the process of acquiring a 40% stake in PT Bank Mayapada International, Tbk (”Bank Mayapada”) • Stage 1 acquire 24.9% stake (USD 164 mn) – completed in 1H15 • Stage 2 acquire 15.1% stake – subject to OJK’s approval Total investment will be ~IDR3.52tn (USD 295 million), representing a ~3.15x P/B multiple upon announcement
M&A Transaction: Bank Mayapada in Indonesia
46
Bank Mayapada Industry Bank Mayapada Industry
ROE ROA Total loan
17,684
26,004
34,241 36,725
FY13 FY14 FY15 1Q16
(IDR$BN)
18.1%16.5%
17.7%
23.8%
18.6%16.7%
13.6% 14.1%
FY13 FY14 FY15 1Q16
1.9%
1.4%
1.6%
2.3%2.3%
2.1%
1.8%1.9%
FY13 FY14 FY15 1Q16
Bank Mayapada’s Performance
Embedded Value & Appraisal Value
47
Note: (1) EV/AV calculation does not include business of Cathay Life in China and Vietnam. (2) per share = per share of Cathay Life; (per share) = per share of Cathay FHC (3) The outstanding shares of Cathay Life and Cathay FHC are 5.3bn and 12.6bn ,respectively. (4) May not sum to total due to rounding.
Valuation date 2014/12/31 2015/12/31
In-force business investment yield
4.01% ~ Year 2034 5.05% for NTD policies
4.40% ~ Year 2034 6.07% for USD policies
2.75% ~ Year 2034 3.02% for Interest crediting annuity
(Equivalent investment yield: 4.46% rolling over to 2015: 4.49%)
3.95% ~ Year 2035 5.02% for NTD policies
4.67% ~ Year 2035 5.81% for USD policies
2.77% ~ Year 2035 3.00% for Interest crediting annuity
(Equivalent investment yield: 4.40%)
Future one year’s new business investment yield
2.54%~ Year 2034 5.03% for NTD policies
4.47% ~ Year 2034 6.07% for USD policies
2.19% ~ Year 2034 2.62% for Interest crediting annuity
2.96%~ Year 2035 4.90% for NTD policies
4.37% ~ Year 2035 5.81% for USD policies
1.98% ~ Year 2035 2.28% for Interest crediting annuity
Risk discount rate 10% 10% Adjusted net worth 403 393
Value of in-force business 434 490 Cost of capital (CoC) -128 -148
Value of in-force business (After CoC) 306 342 Embedded Value (EV) 709 735
EV / per share 133.6 (56.4) 138.5 (58.5) Appraisal Value (AV) 1,191 1,249
Value of future one year’s new business (After CoC) 55.5 59.0
AV / per share 224.4 (94.8) 235.3 (99.4)
(NT$BN)
48
Summary
Valuation date 2014 2015 Growth rate 1Q16
Embedded value
Equity 325 346 6% -- Adjusted net worth 403 393 -2% -- Value of in-force business 434 490 13% -- Cost of capital (CoC) -128 -148 16% --
Value in-force business (after CoC) 306 342 12% --
Embedded value 709 735 4% --
Value of one year’s new business
First year premium (FYP) 233.4 217.4 -7% 52.1 First year premium equivalent (FYPE) 71.1 102.0 43% 39.8 Value of one year’s new business (V1NB) 53.5 57.6 8% 20.5 Profit margin (V1NB/FYP) 23% 27% -- 39% Profit margin (V1NB/FYPE) 75% 57% -- 51% Profit margin (V1NB/FYP)(investment-linked(non-VUL)is excluded)
EV / per share of Cathay FHC 56.4 58.5 4% -- AV / per share of Cathay FHC 94.8 99.4 5% --
Note: (1) Basic EV and AV per share is based on weighted average of outstanding shares 12.6bn. (2) Totals may not sum due to rounding.
(NT$BN)
49
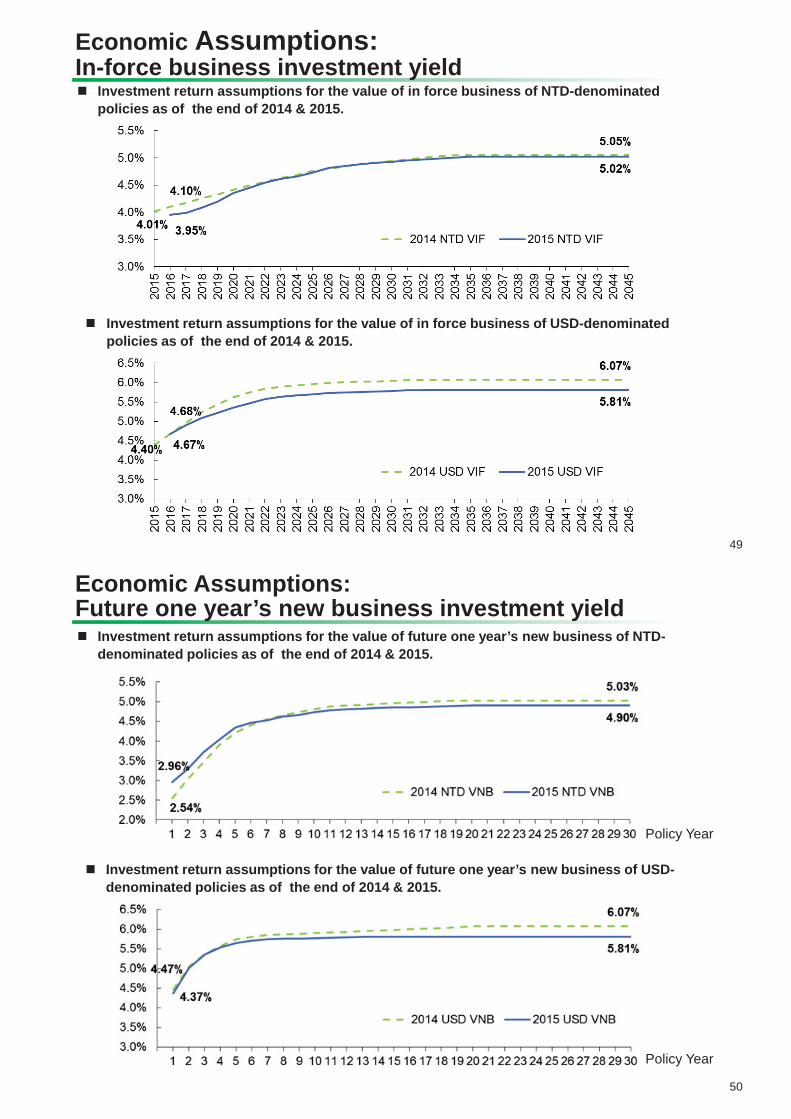
Economic Assumptions: In-force business investment yield
Investment return assumptions for the value of in force business of NTD-denominated policies as of the end of 2014 & 2015.
Investment return assumptions for the value of in force business of USD-denominated policies as of the end of 2014 & 2015.
50
Economic Assumptions: Future one year’s new business investment yield
Investment return assumptions for the value of future one year’s new business of NTD-denominated policies as of the end of 2014 & 2015.
Investment return assumptions for the value of future one year’s new business of USD-denominated policies as of the end of 2014 & 2015.
Policy Year
Policy Year
51
Cost of Capital Projection and Non-economic Assumptions
PricewaterhouseCoopers Asia Actuarial Services provides an independent review of the actuarial assumptions on EV.
Experience Rate Assumptions
Mortality Rate In accordance with Cathay’s most updated mortality trends.
Morbidity Rate In accordance with Cathay’s most updated morbidity trends and varied by product type.
Lapse Rate In accordance with Cathay’s most updated lapse rate trends and varied by product type.
Expenses assumption
In accordance with Cathay’s most updated expense analysis and varied by product type; commissions are based on the actual commission rates.
Experience rate:
RBC capital requirement: Apply 2015 RBC formula announced by Insurance Bureau to project future capital requirement. 1. Capital Requirement = 200% RBC. 2. Risk-based capital calculation reflects company’s current and future operation status. 3. C3 risk capital of traditional products includes 30% of its previous year’s C3 risk capital in all projection
years. 4. In 2015, the base risk factors of domestic listed stocks (not served as directors or supervisors), equity
funds, and balanced funds are adjusted from 0.2411 to 0.2274. Considering this is a temporary measure only applied in 2015, we do not reflect this change in COC estimate.
52
Analysis of change in Adjusted Net Worth (ANW)
Note: 1.The profit of 2015 is 38.2 billion. However, 10 billion is recovered from special reserve of unrealized gains on property, which is already reflected in ANW of 2014. Thus, reflect 28.2 billion in the item “2015 Profits”.
2.Others include revision of IFRS19,change of foreign exchange volatility reserve and goodwill.
(NT$BN)
53
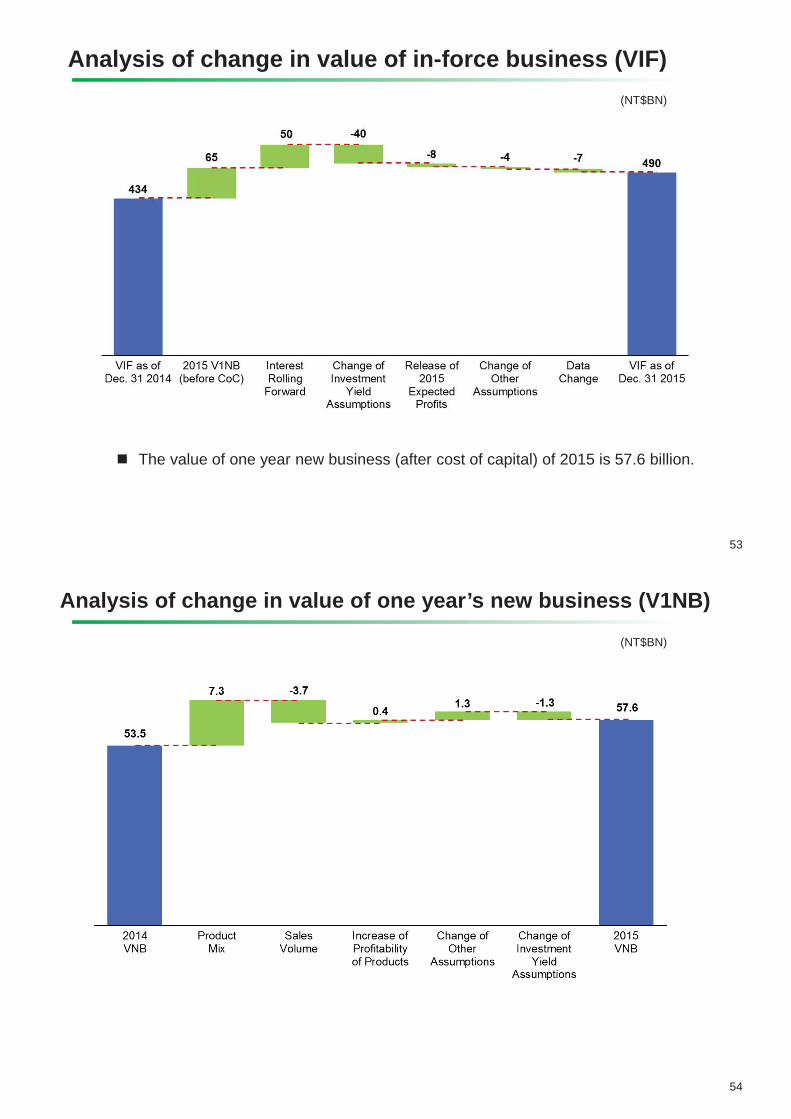
Analysis of change in value of in-force business (VIF)
The value of one year new business (after cost of capital) of 2015 is 57.6 billion.
(NT$BN)
54
Analysis of change in value of one year’s new business (V1NB)
(NT$BN)
55
Sensitivity Analysis NT$BN, except for per share figures
Valuation date 2015/12/31
Assumption Investment
yield - 0.25%
Investment yield
+ 0.25%
Investment yield
+ 0.25% (capped)(1)
Base Case
Discount rate
– 0.5%
Discount rate
+ 0.5%
Adjusted net worth 393 393 393 393 393 393 Value of in-force
business 380 600 563 490 524 459
Cost of capital (CoC) -155 -141 -143 -148 -143 -153 Value of in-force
business (After CoC)
225 459 419 342 381 307
Embedded Value 618 852 812 735 774 700
EV / per share 116.4 (49.2)
160.5 (67.8)
153.0 (64.6)
138.5 (58.5)
145.8 (61.6)
131.9 (55.7)
Appraisal Value 1,078 1,418 1,356 1,249 1,323 1,182 Value of future one
year’s new business (After CoC)
51.8 66.3 62.7 59.0 63.9 54.6
AV / per share 203.1 (85.8)
267.2 (112.9)
255.5 (107.9)
235.3 (99.4)
249.3 (105.3)
222.7 (94.1)
Note: (1) “Investment yield +0.25% (capped)” : the investment return is capped by 5.02% for NTD policies, 5.81% for USD policies, and 3.00% for interest crediting annuity.
(2) May not sum to total due to rounding.
56
YoY Comparison
Valuation date 2014/12/31 2015/12/31
Embedded Value 676~745 700~774
Value of future one year’s new business 51.6~59.8 54.6~63.9
Appraisal Value 1,137~1,250 1,182~1,323
Under the different discount rate assumption (9.5%~10.5%), the results of the Year 2014 & 2015 go as follows.
(NT$BN)
Introduction of Cathay FHC 1Q16 Business Overview Overseas Expansion Business Performance Summary
Cathay United Bank Cathay Life Cathay Century
Cathay’s CSR Efforts M&A Key Highlights Cathay Life Embedded Value & Appraisal Value Appendix
57
Agenda
58
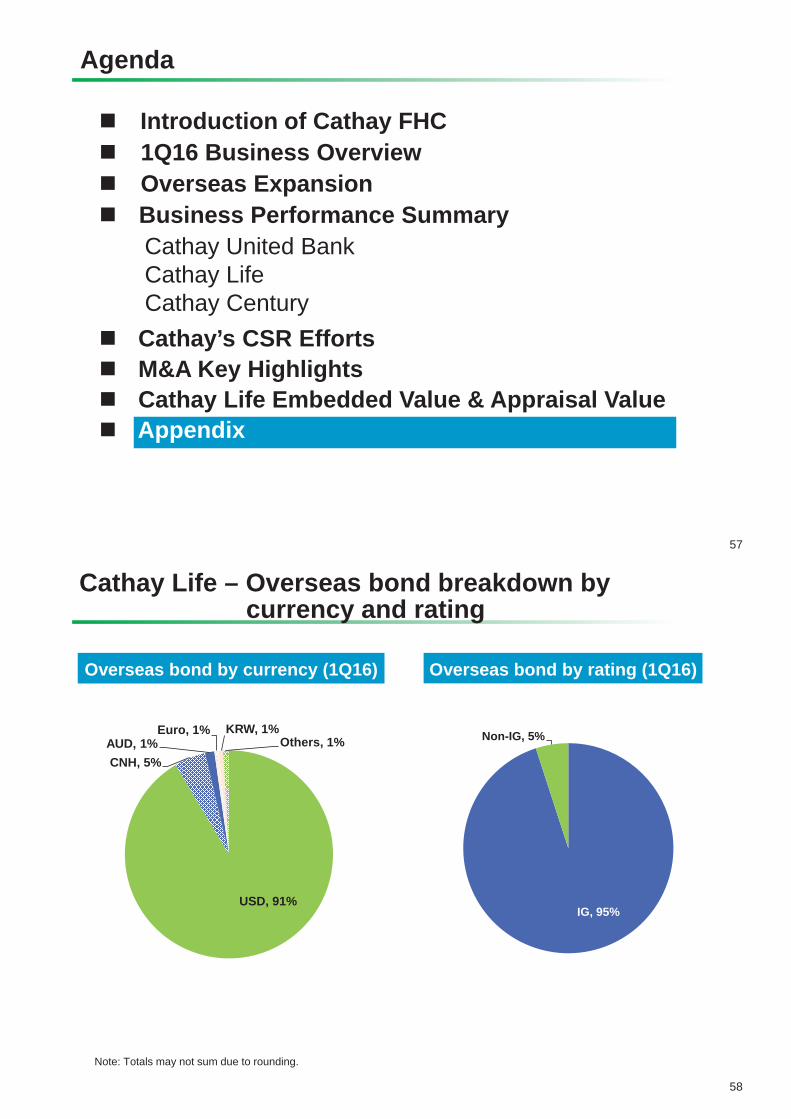
Cathay Life – Overseas bond breakdown by currency and rating
Note: Totals may not sum due to rounding.
IG, 95%
Non-IG, 5%
USD, 91%
CNH, 5%AUD, 1%
Euro, 1% KRW, 1%Others, 1%
Overseas bond by currency (1Q16) Overseas bond by rating (1Q16)
0.00%
0.50%
1.00%
1.50%
2.00%
2.50%
3.00%
3.50%
4.00%
4.50%
5.00%
1 11 21 31 41 51 61 71 81 91 101
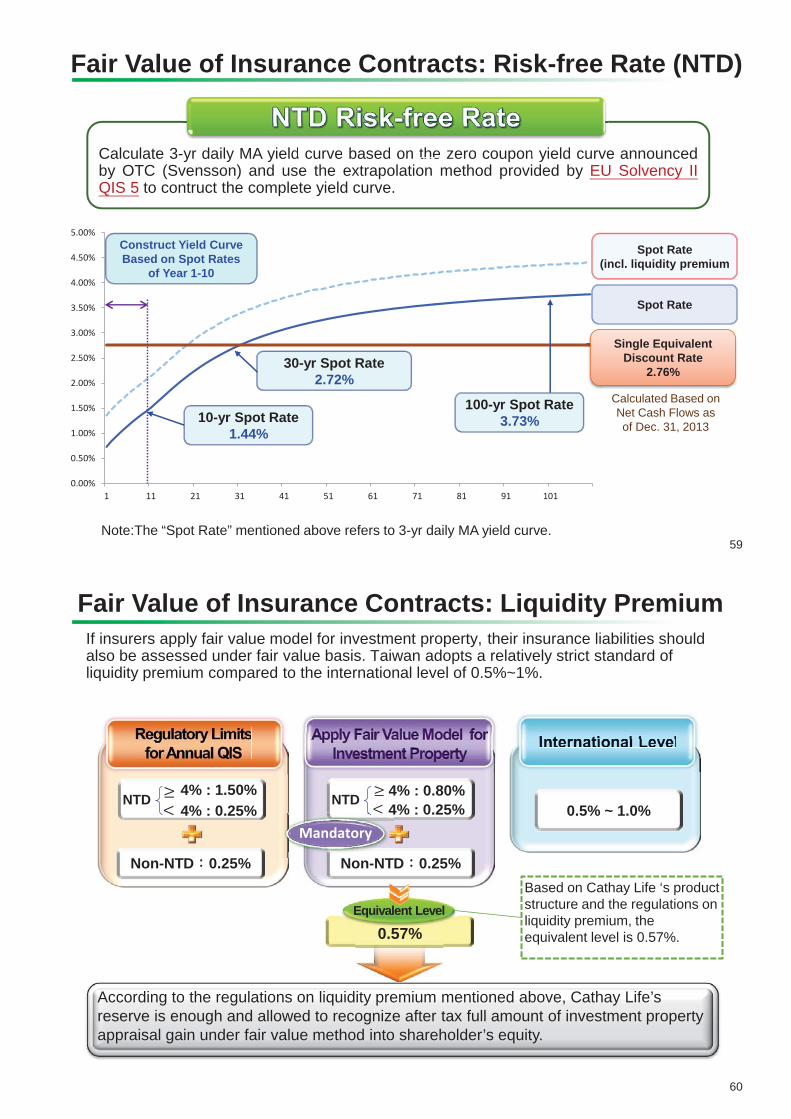
Fair Value of Insurance Contracts: Risk-free Rate (NTD)
Calculate 3-yr daily MA yield curve based on the zero coupon yield curve announced by OTC (Svensson) and use the extrapolation method provided by EU Solvency II QIS 5 to contruct the complete yield curve.
yr daily MA yield curve based on the zero coupon yield curve
Spot Rate (incl. liquidity premium
Single Equivalent Discount Rate
2.76%
Calculated Based on Net Cash Flows as of Dec. 31, 2013
Construct Yield Curve Based on Spot Rates
of Year 1-10
100-yr Spot Rate 3.73%
Spot Rate
Note:The “Spot Rate” mentioned above refers to 3-yr daily MA yield curve.
10-yr Spot Rate 1.44%
30-yr Spot Rate 2.72%
59
Fair Value of Insurance Contracts: Liquidity Premium
0.57% 0 57%
0.5% ~ 1.0%
According to the regulations on liquidity premium mentioned above, Cathay Life’s reserve is enough and allowed to recognize after tax full amount of investment property appraisal gain under fair value method into shareholder’s equity.
Non-NTD 0.25%
NTD
Non-NTD 0.25%
NTD
0.57%
N NT
Mandatory
Equivalent Level
If insurers apply fair value model for investment property, their insurance liabilities should also be assessed under fair value basis. Taiwan adopts a relatively strict standard of liquidity premium compared to the international level of 0.5%~1%.
4% : 0.25% 4% : 1.50%
4% : 0.25% 4% : 0.80%
Based on Cathay Life ‘s product structure and the regulations on liquidity premium, the equivalent level is 0.57%.
60
61
Special reserve of unrealized gains on property
67.9
Net unrealized gains on investment property (1)
Negative impact of first adoption
-12.5
Special reserve of unrealized gains on property
55.4
Net unrealized gains on investment property is calculated by discounting rental income at industry average WACC(3.29%), net of related taxes. The amount is therefore well below the property market value.
11.1 (20%)
44.3 (80%)
Retained as special reserve in liability
Recovered over 5 years (capped at NT$10bn per year). Such accounting profit is restricted from dividend payout.(2)
(NT$BN)
The recovery of such special reserve is subject to regulatory approval each year. Hence, the actual recovery depends on the fair valuation results each year.
Note: (1)
(2)
Illustration of 2013 pro forma BV of Cathay FHC
Cathay Financial Holdings Cathay Life Cathay United Bank
Appraisal gain based on fair value method
on 2013/1/1
Appraisal gain from property reclassification
Additional property
appraisal gain in 2013
Consolidated impact to
Cathay FHC
Impact to CUB from fair value method
Inter- company
adjustments
(Original) Cathay FHC book value
(New) Pro forma
FHC book value
Note: Totals may not sum due to rounding. 62
248.3
95.6
1.9
16.3 12.1
124.0
31.7
342.5
285.3
379.5
285.3
94.3 94.3
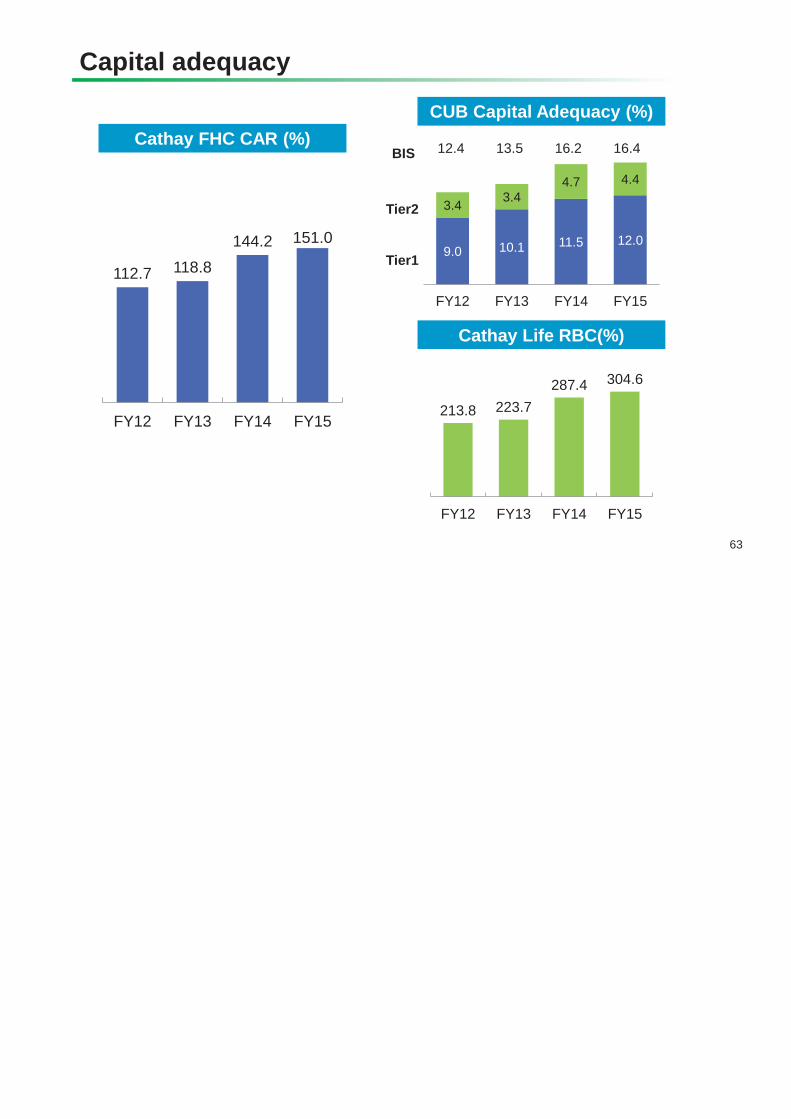
Capital adequacy
63
9.0 10.1 11.5 12.0
3.4 3.44.7 4.4
FY12 FY13 FY14 FY15
Cathay Life RBC(%)
CUB Capital Adequacy (%) Cathay FHC CAR (%) 13.5 16.2 12.4
Balance Sheet DataTotal assets 4,704,976 5,180,081 4,756,210 5,211,934 General account 4,242,710 4,699,512 4,290,988 4,732,379 Separate account 462,267 480,568 465,222 479,554 Reserves for life insurance liabilities 3,770,679 4,228,117 3,827,665 4,287,444 Total liabilities 4,376,595 4,831,846 4,413,256 4,859,444 Total shareholders' equity 328,382 348,235 342,954 352,490
Operating MetricsFirst Year Premium(FYP) 233,379 217,378 52,270 52,111First Year Premium Equivalent(FYPE) 71,147 102,002 16,172 39,821Expense ratio 9.9% 10.3% 9.9% 11.1%13-M persistency ratio 97.9% 97.6% 97.6% 97.7%25-M persistency ratio 94.9% 91.8% 95.4% 90.6%ROAE 10.54% 11.36% 14.90% 3.06%ROAA 0.71% 0.78% 1.06% 0.21%
Capital Adequacy MetricsRBC ratio (Standalone) 287% 305%
Notes:
(1) All data and information on this page is provided for informational purposes only, and may subject to adjustment.
For more details, please refer to our official financial reports.(2) Starting from 2015/1/1, Cathay Life adopted IFRS 2013 version and has adjusted FY14 financial data to pro-forma basis.
FY14 total assets, liabilities, and shareholders' equity have also been adjusted accordingly.
(3) Total may not sum due to rounding.
Cathay United BankFY15/ 1Q16/
(NT$MN) FY14 1Q15Income Statement Data (Consolidated) FY14 FY15 % Chg 1Q15 1Q16 % ChgOperating Income
Net interest income 25,779 26,729 4% 6,645 6,210 -7%Fee income 11,806 14,344 21% 3,570 4,302 21%Investment income 7,326 5,599 -24% 1,477 2,254 53%other income 1,064 1,380 30% 498 561 13%
Net operating income 45,975 48,052 5% 12,190 13,327 9%Operating expenses (22,804) (24,851) 9% (5,601) (6,166) 10%Pre-provision profit 23,170 23,201 0% 6,589 7,161 9%Net provisions for possible losses (2,471) (1,922) -22% (186) (720) 288%Income before taxes 20,700 21,279 3% 6,404 6,441 1%Income tax (2,885) (2,513) -13% (871) (796) -9%Net income 17,814 18,767 5% 5,532 5,645 2%