41
2016 First Quarter revenue 21 April 2016 2020 Full-year results February 17, 2021

2016
First Quarter
revenue
21 April 2016 2020 Full-year results
February 17, 2021

DISCLAIMER
This presentation does not constitute an offer of securities for sale in the United States of America or any other jurisdiction.
Certain information contained in this document may include projections and forecasts. They express objectives based on current assessments and
estimates of the Group’s executive management which are subject to numerous factors, risks and uncertainties. Consequently, reported figures and
assessments may differ significantly from projected figures. The following factors among others set out in the Universal Registration Document (Document
d’Enregistrement Universel) filed with the French Financial Markets Authority (Autorité des Marchés Financiers - AMF) on March 26, 2020 which is
available on Kering’s website at www.kering.com may cause actual figures to differ materially from projected figures: any unfavourable development
affecting consumer spending in the activities of the Group in France and abroad, notably for products and services sold by our Luxury brands, the events,
crises, fears, and resulting costs of complying with environmental, health and safety regulations and all other regulations with which Group companies are
required to comply; the competitive situation on each of our markets; exchange rate and other risks related to international activities; risks arising from
current or future litigation. Kering gives no commitment to updating and/or revising and/or commenting any projections and forecasts, or their impact on the
results and perspectives of the Group, which may be contained in this presentation.
The information contained in this document has been selected by the Group’s executive management to present Kering’s FY2020 results. This document
has not been independently verified. Kering makes no representation or undertaking as to the accuracy or completeness of such information. None of the
Kering or any of its affiliates representatives shall bear any liability (in negligence or otherwise) for any loss arising from any use of this presentation or its
contents or otherwise arising in connection with this presentation.
IN NO WAY DOES KERING ASSUME ANY RESPONSIBILITY FOR ANY INVESTMENT OR OTHER DECISIONS MADE BASED UPON THE INFORMATION
PROVIDED IN THIS PRESENTATION. INFORMATION IN THIS PRESENTATION, INCLUDING FORECAST FINANCIAL INFORMATION, SHOULD NOT BE
CONSIDERED AS ADVICE OR A RECOMMENDATION TO INVESTORS OR POTENTIAL INVESTORS IN RELATION TO HOLDING, PURCHASING OR
SELLING SECURITIES OR OTHER FINANCIAL PRODUCTS OR INSTRUMENTS AND DOES NOT TAKE INTO ACCOUNT YOUR PARTICULAR
INVESTMENT OBJECTIVES, FINANCIAL SITUATION OR NEEDS. BEFORE ACTING ON ANY INFORMATION YOU SHOULD CONSIDER THE
APPROPRIATENESS OF THE INFORMATION HAVING REGARD TO THESE MATTERS, ANY RELEVANT OFFER DOCUMENT AND IN PARTICULAR,
YOU SHOULD SEEK INDEPENDENT FINANCIAL ADVICE. ALL SECURITIES AND FINANCIAL PRODUCT OR INSTRUMENT TRANSACTIONS INVOLVE
RISKS, WHICH INCLUDE (AMONG OTHERS) THE RISK OF ADVERSE OR UNANTICIPATED MARKET, FINANCIAL OR POLITICAL DEVELOPMENTS
AND, IN INTERNATIONAL TRANSACTIONS, CURRENCY RISK. READERS ARE ADVISED TO REVIEW THE COMPANY’S UNIVERSAL REGISTRATION
DOCUMENT AND THE COMPANY'S APPLICABLE AMF FILINGS BEFORE MAKING ANY INVESTMENT OR OTHER DECISION.

INTRODUCTION
FRANÇ OIS-HENRI PINAULT
CHAIRMAN & CEO

4
2020 FULL-YEAR RESULTS
A YEAR OF
YIELDING RESILIENT
FINANCIAL PERFORMANCES
REINFORCING OUR VISION
OF LUXURY
CONFIRMING OUR STRATEGY
& BUSINESS MODEL
READY TO COME OUT OF THE CRISIS WITH STRENGTHENED POSITIONS
TO LEVERAGE THE REBOUND AND MAXIMIZE BRAND POTENTIAL
DISRUPTION
INTRODUCTION
February 17, 2021

ANALYSIS OF RESULTS
JEAN-MARC DUPLAIX
GROUP CHIEF F INANCIAL OFFICER

6
RESILIENCE THANKS TO SCALE & AGILITY
Western Europe
28% (-28%)
North America
21% (-8%)
Asia Pacific
38% (-7%)
RoW
6% (-16%)
Japan
7% (-29%)
€3,135m
-34.4% vs. last year
EBIT margin: 23.9%
FCF AND NET DEBT (€m)
• Group CAPEX: €787m, 6.0% of revenue
• Strong FCF +38% YoY: €2,105m, WCR tightly managed with inventories undercontrol
• Net debt down at €2.1bn (excl.leaseliabilities)
€13,100m
-17.5% reported
-16.4% comparable*
o/w Q4 -5% comparable
GROUP REVENUE (€m)
As a % of FY20 revenue and (% comparable growth)
NET DEBTFCF FROM OPERATIONS
• Balancing profitability protection & investment priorities
• Solid H2 margin: Luxury Houses at 30.7%
• Yielding resilient FY EBIT margin
GROUP RECURRING OPERATING INCOME (€m)
7,6385,378
8,246
7,722
FY19 FY20
H2
H1
15,884
FY20FY19
1,521
2,105
YE 19 YE 20
2,812
2,149
13,100
-30.1% comp
-3.2% comp
* At constant scope and exchange rates
2,253952
2,525
2,183
FY19 FY20
H2
H1
4,778
3,135
28.3% margin
17.7% margin
30.6% margin
29.5% margin
February 17, 2021

7
OVERVIEW
-19%
-42%
0% -3%
Q1 Q2 Q3 Q4
12%
42%
5% 10%
Q1 Q2 Q3 Q4
WHOLESALE AND OTHER (COMPARABLE)RETAIL (COMPARABLE)
78% 22%
-16%
INCL. E-COMMERCE UP 67%,
REACHING 13% OF RETAIL SALES
-17%
WHOLESALE
-29%
ROYALTIES & OTHER
%
OF WW STORES CLOSED
-7%
-48%
-5% -12%
Q1 Q2 Q3 Q4
REVENUE
LUXURY HOUSES FY20 REVENUE BY CHANNEL
February 17, 2021

LUXURY HOUSES
FOCUS ON RETAIL
WESTERN
EUROPE-14%
-66%
-41% -40% -41%
Q1 Q2 Q3 Q4 FY
-7%
-49%
+44%
+13%0%
-17%
-62%
-23%-10%
-28%
Q1 Q2 Q3 Q4 FY
-30%-12%
+18% +17%
-2%
Q1 Q2 Q3 Q4 FY
-9%
-70%
+20%+8%
-13%
BY REGION (COMPARABLE GROWTH)
NORTH
AMERICA
JAPAN
ASIA
PACIFIC
ROW
8February 17, 2021

+42%
+89% +89%
+35%
Western Europe North America APAC Japan
9
LUXURY HOUSES
DIGITAL PENETRATION CONTINUING TO RISE
IN ALL REGIONS
INCREASED PENETRATION
E-COMMERCE COMPARABLE REVENUE GROWTH E-COMMERCE REVENUE AS A % OF RETAIL SALES
FY 2020 E-COMMERCE COMPARABLE REVENUE GROWTH E-COMMERCE REVENUE AS A % OF RETAIL SALES
ONLINE ACCELERATION
+21%
+72%
+102%
+72%
Q1 20 Q2 20 Q3 20 Q4 20
7%
13%
FY 2019 FY 2020
9%
13%
3% 3%
22%24%
6% 6%
Western Europe North America APAC Japan
FY 2019 FY 2020
February 17, 2021

10
GUCCI
BUILDING SUSTAINABLE GROWTH
• H2 revenue trend improving
– Q4 reta i l -7%, dr ivers unchanged. 9 net s tore c losures in quar ter and 4 in FY
– W holesale rat ional izat ion ongoing
• Cost discipline and brand reinvestment: H2 EBIT margin 38.6%
• CAPEX adapted to the environment and project prioritization
Asia
Pacific
2020Royalties
and others
Japan
-8%
Wholesale2019 Western
Europe
RoWNorth
America
9,628
-47% 0% -32%-26%
-33%
7,441
-29%
Retail (87% of sales): -19% In €m 2020 2019 Change
Revenue
% comparable
7,441 9,628 -22.7%
-21.5%
Recurring operating income
Margin (%)
2,615
35.1%
3,947
41.0%
-33.8%
-5.9pt
Gross CAPEX
As % of revenue
206
2.8%
337
3.5%
-39.0%
-0.7pt
-45% +13% -20% +8% -2% -31% -3%of which Q4 20
comp growthTOTAL
-10%
REVENUE CHANGE BY REGION AND CHANNEL
(in €m, and comparable growth in %)
FULL-YEAR KEY FIGURES
February 17, 2021

11
SAINT LAURENT
-2%-20%
1,744
2,049
-34% -2% +1%-14%
-24%
In €m 2020 2019 Change
Revenue
% comparable
1,744 2,049 -14.9%
-13.8%
Recurring operating income
Margin (%)
400
22.9%
562
27.4%
-28.9%
-4.5pt
Gross CAPEX
As % of revenue
53
3.0%
98
4.8%
-46.2%
-1.8pt
DEMONSTRATING RESILIENCE AND POTENTIAL
• FY20 revenue decline limited to H1 with H2 at +2% comp
– Q4 reta i l +5%; wholesale down on scheduled later Spr ing shipments and s tar t of rat ional izat ion
– Successful W inter 20 col lec t ion, cont inued development in APAC
– Fast-growing e-commerce fur ther propel led by m igrat ion on fu l ly owned plat form in Q4
• Pursuing ambitious growth investment plans (communications, store expansion)
• CAPEX dedicated to footprint expansion with a focus on Mainland China and Korea
REVENUE CHANGE BY REGION AND CHANNEL
(in €m, and comparable growth in %)
Asia
Pacific
2020Royalties
and others
Japan Wholesale2019 Western
Europe
RoWNorth
America
-31% +19% +4% +30% +26% -14% -8%of which Q4 20
comp growthTOTAL
+1%
Retail (69% of sales): -13%
February 17, 2021
FULL-YEAR KEY FIGURES
12
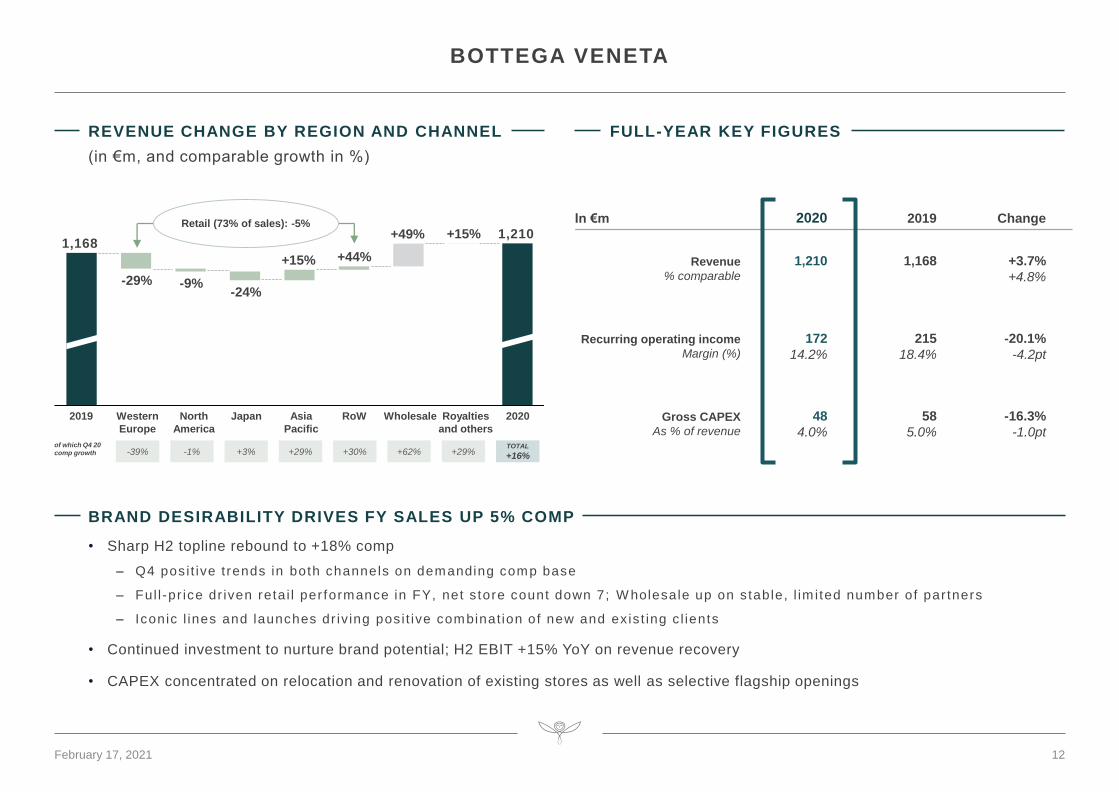
BOTTEGA VENETA
+49%1,168
-29% -9%-24%
+15% +44%
+15% 1,210
In €m 2020 2019 Change
Revenue
% comparable
1,210 1,168 +3.7%
+4.8%
Recurring operating income
Margin (%)
172
14.2%
215
18.4%
-20.1%
-4.2pt
Gross CAPEX
As % of revenue
48
4.0%
58
5.0%
-16.3%
-1.0pt
BRAND DESIRABILITY DRIVES FY SALES UP 5% COMP
• Sharp H2 topline rebound to +18% comp
– Q4 pos i t ive t rends in both channels on demanding comp base
– Ful l -pr ice dr iven reta i l per formance in FY, net s tore count down 7; W holesale up on s table, l im i ted number of par tners
– Iconic l ines and launches dr iv ing pos i t ive combinat ion of new and ex is t ing c l ients
• Continued investment to nurture brand potential; H2 EBIT +15% YoY on revenue recovery
• CAPEX concentrated on relocation and renovation of existing stores as well as selective flagship openings
REVENUE CHANGE BY REGION AND CHANNEL
(in €m, and comparable growth in %)
Asia
Pacific
2020Royalties
and others
Japan Wholesale2019 Western
Europe
RoWNorth
America
-39% -1% +3% +29% +30% +62% +29%of which Q4 20
comp growthTOTAL
+16%
Retail (73% of sales): -5%
February 17, 2021
FULL-YEAR KEY FIGURES
13
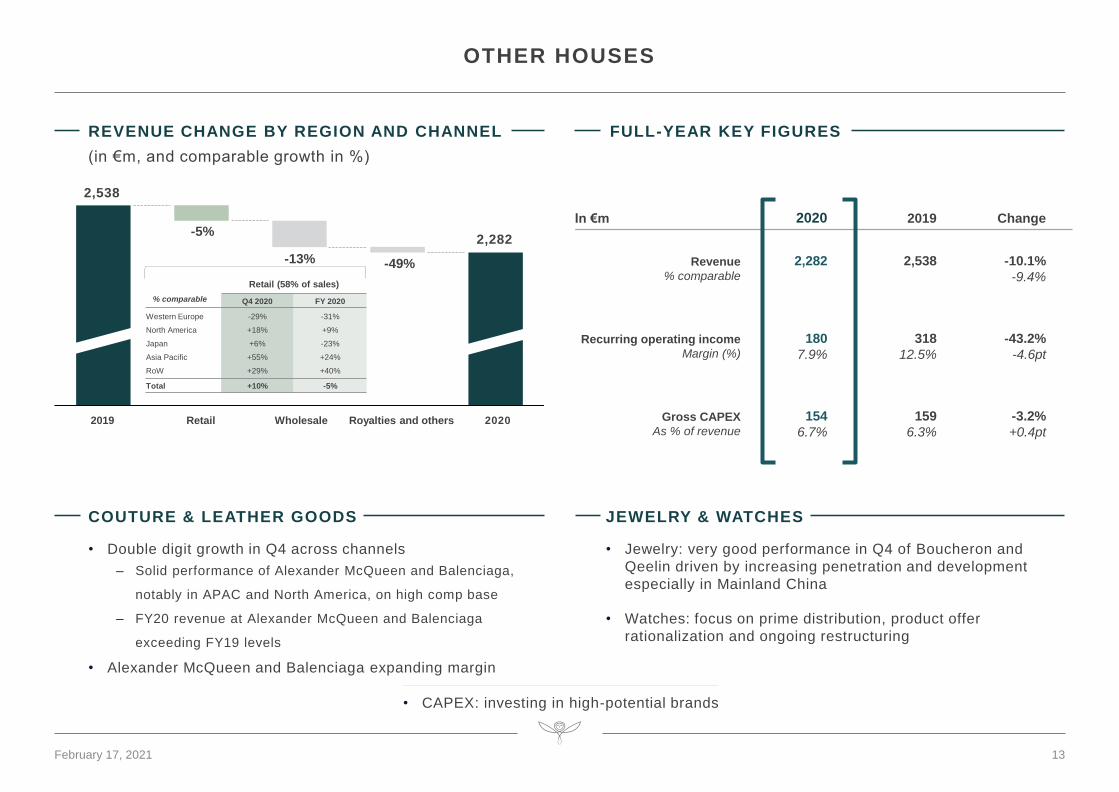
OTHER HOUSES
COUTURE & LEATHER GOODS
• Double digit growth in Q4 across channels
– Solid performance of Alexander McQueen and Balenciaga,
notably in APAC and North America, on high comp base
– FY20 revenue at Alexander McQueen and Balenciaga
exceeding FY19 levels
• Alexander McQueen and Balenciaga expanding margin
Royalties and othersRetail2019 2020Wholesale
-49%
2,538
-5%
-13%
2,282
JEWELRY & WATCHES
• Jewelry: very good performance in Q4 of Boucheron and
Qeelin driven by increasing penetration and development
especially in Mainland China
• Watches: focus on prime distribution, product offer
rationalization and ongoing restructuring
In €m 2020 2019 Change
Revenue
% comparable
2,282 2,538 -10.1%
-9.4%
Recurring operating income
Margin (%)
180
7.9%
318
12.5%
-43.2%
-4.6pt
Gross CAPEX
As % of revenue
154
6.7%
159
6.3%
-3.2%
+0.4pt
• CAPEX: investing in high-potential brands
REVENUE CHANGE BY REGION AND CHANNEL
(in €m, and comparable growth in %)
% comparable
Retail (58% of sales)
Q4 2020 FY 2020
Western Europe
North America
Japan
Asia Pacific
RoW
-29%
+18%
+6%
+55%
+29%
-31%
+9%
-23%
+24%
+40%
Total +10% -5%
February 17, 2021
FULL-YEAR KEY FIGURES

24
14
CORPORATE & OTHER
In €m 2020 2019
Recurring operating income
Underlying result
Corporate Long-term incentive plan
(232)
(185)
(47)
(264)
(196)
(68)
Gross CAPEX 326 304
REVENUE REBOUND IN H2 AND EBIT CONTRIBUTION IMPROVING
• Kering Eyewear revenue improving in H2
– Fur ther extens ion of brand por t fol io wi th the addi t ion of Chloé and Dunhi l l , SS 2021 f i rs t co l lec t ion avai lable s ince January
– Launch of F lagship s tore on Tmal l to fur ther establ ish Ker ing Eyewear on Chinese market
• Strict discipline on corporate costs, Kering Eyewear EBIT contribution increasing
• CAPEX driven by continued investment in logistics & technology
Royalties and
intragroup
eliminations
487
FY20 Total
Corporate
and Other
FY20 Kering
Eyewear
total sales
Other revenueFY20 Kering
Eyewear
consolidated
sales
423
FY19 Total
Corporate
and Other
-88
399
501
-15% comp
-18% comp
REVENUE CHANGE BY REGION AND CHANNEL
(in €m, and comparable growth in %)
February 17, 2021
FULL-YEAR KEY FIGURES
15
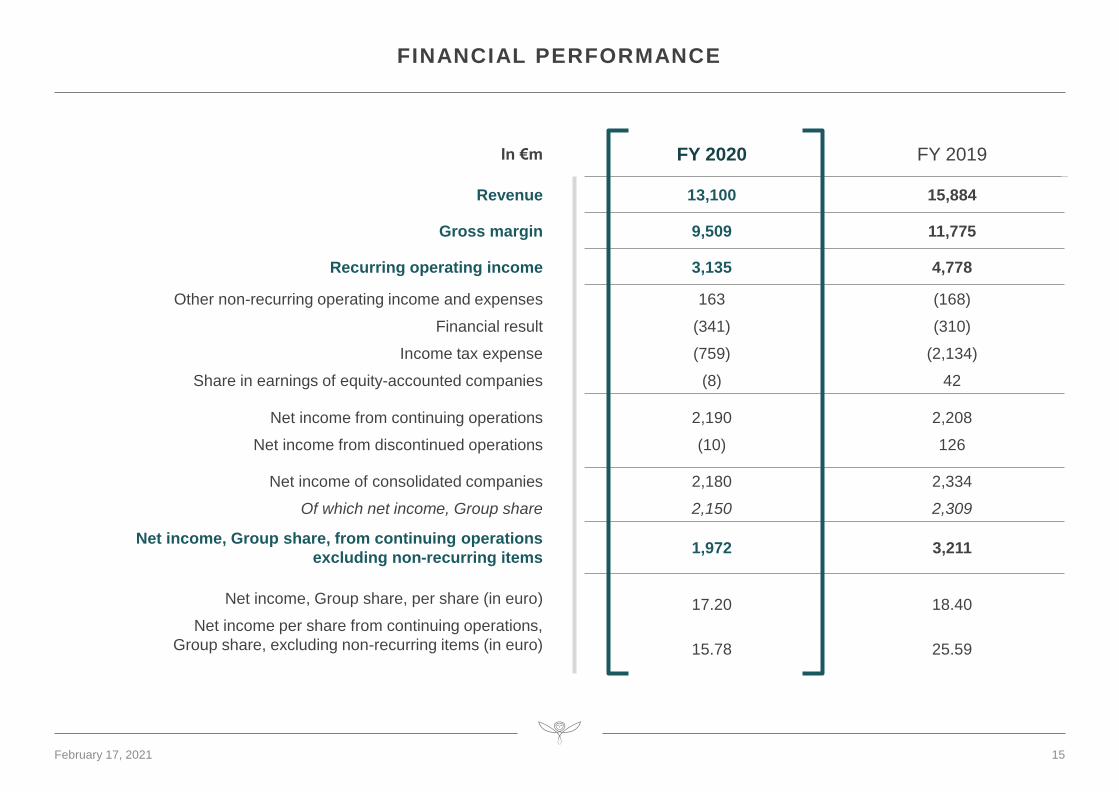
FINANCIAL PERFORMANCE
In €m FY 2020 FY 2019
Revenue 13,100 15,884
Gross margin 9,509 11,775
Recurring operating income 3,135 4,778
Other non-recurring operating income and expenses
Financial result
Income tax expense
Share in earnings of equity-accounted companies
163
(341)
(759)
(8)
(168)
(310)
(2,134)
42
Net income from continuing operations
Net income from discontinued operations
2,190
(10)
2,208
126
Net income of consolidated companies
Of which net income, Group share
2,180
2,150
2,334
2,309
Net income, Group share, from continuing operations
excluding non-recurring items 1,972 3,211
Net income, Group share, per share (in euro)
Net income per share from continuing operations,
Group share, excluding non-recurring items (in euro)
17.20
15.78
18.40
25.59
February 17, 2021

In €m FY 2020 FY 2019
Cash flow before taxes, dividends and interests
Change in working capital requirement
Income tax paid
4,280
45
(1,436)
5,936
(557)
(2,903)
Net cash flow from operating activities 2,889 2,476
Acquisition of fixed operating assets, net (784) (955)
Free cash flow from operations 2,105 1,521
16
FREE CASH FLOW FROM OPERATIONS
February 17, 2021

17
CAPITAL EMPLOYED AND OPERATING WORKING CAPITAL
EQUITY
€12,035M
NETDEBT
€2,149M
INVENTORIES
€2,846M
RECEIVABLES
€824M
DEBT-TO-EQUITY RATIO
17.8%
CAPITAL EMPLOYED
€14,184M
OPERATING WORKING CAP
€3,004M22.9%*
PAYABLES
€666M
* of FY20 group revenue
February 17, 2021

FY 2020 NET DEBT BRIDGE
18
CHANGE IN NET FINANCIAL DEBT
16754
900
1,009
-32
Net debt at
December
31, 2019
FCF from
operations
Dividend paid Disposal of
5.83% of Puma
Net financial
investments
and other
Net interest paid
and dividends
received
Acquisition of
Kering shares
Lease
repayment and
related interests
Net debt at
December
31, 2020
2,812
-2,105
-656
2,149
In €m and Net Debt / EBITDA ratio
February 17, 2021
0.5x
0.5x

STRENGTHENED POSITIONS TO LEVERAGE THE REBOUND
FRANÇOIS-HENRI PINAULT CHAIRMAN & CEO
JEAN-FRANÇOIS PALUS GROUP MANAGING DIRECTOR

A DEMAND-DRIVEN
SUPPLY CHAIN
OMNICHANNEL
AS A MUST
NUMEROUS
TOUCHPOINTS
NEW TECHNOLOGIES
20
KERING IS WELL POSITIONED TO LEVERAGE THE NEW LUXURY ENVIRONMENT
WE CARE,
WE COLLABORATE,
WE CREATE
WE INCREASE
CONTROL OVER
DISTRIBUTION
WE INVESTIN GROWTH PLATFORMS
OUR BRANDS DEPLOY INNOVATIVE MARKET
APPROACHES
YOUNG AND GLOBAL
CONSUMERS
INCREASED DEMAND
FOR TRANSPARENCY
ACCELERATING TRENDS COMFORTING OUR STRATEGY
February 17, 2021

21
PROGRESSING ON OUR SUSTAINABILITY COMMITMENTS
• 29% reduction in our environmental footprint (EP&L intensity 2015-19)
• 91% traceability for our key raw materials
• Biodiversity commitments to protect 2 million hectares (6x our total land footprint)
• Fashion Pact commitments: 3 pillars, 7 key objectives
• 55% women managers within the Group
• D&I committees in each house/entity with Management Committee sponsors
• Fully mobilized against Covid-19 pandemic: financial donations, ensuring safety and well-being of our employees worldwide, supporting our suppliers
• Anti-domestic violence policy to protect women and families
• New collections from recycled or sustainably sourced materials: Gucci Off the Grid, Balenciaga Archetypes
• Adherence to the “Vision of a circular economy for fashion” of the Ellen MacArthur Foundation
• New business models
2021• CONTINUED TRANSPARENCY WITH STAKEHOLDERS
• EXTENSION OF OUR ENVIRONMENTAL FOOTPRINT TO THE CONSUMER USE AND END-OF-LIFE PHASES OF OUR PRODUCTS
• ALIGNMENT OF OUR CLIMATE STRATEGY WITH THE 1.5° SCENARIO
CARE
COLLABORATE
CREATE
WE…
February 17, 2021

22
DEPLOYING INNOVATIVE MARKET APPROACHES
COLLECTIONS& PRODUCTS
• New calendars and Fashion Show expressions
• Adaptation of collections, phasing& merchandising structure
ASSETDIGITIZATION
• Design, prototyping, content
• Virtual Showrooms
CLIENTEXPERIENCE
• Immersive experiences: virtual fitting, Augmented Reality, gaming
• Pop up & pop in
• Clienteling actions & events
• Distant selling
• Personalized & localized CRM & AI programs
BRANDENGAGEMENT
• Increase brand visibility, nurture desirability on relevant platforms
& networks
• Adapted marketing & comms strategy, social commerce,
livestreaming
February 17, 2021

23
INCREASING CONTROL OVER DISTRIBUTION
• Wider range of services
• Improved depth and breadth of assortment
• Leveraging a single view of the client
OMNICHANNEL
February 17, 2021
STRATEGICWHOLESALE REDUCTION
• Beyond short-term impacts of Covid, notably Travel Retail
• Long-term strategy to reduce Wholesale through management
of orders, downsizing of number of doorsand retailization of offline and online partners
• Focus on brand.com
• Successful internalization ongoing
• Shift to e-concessions and opening of new e-concessions
FAST-GROWING
ONLINE RETAIL
RETAIL FOOTPRINT POTENTIAL
• # DOS at YE: 1,433 (+52 net)
• Constant assessment to identify new opportunities and adapt network
• # DOS roughly stable at Gucci & BV
• Large potential at YSL, AMQ, BAL & Boucheron

24
INVESTING IN GROWTH PLATFORMS
YE 2019New Wayne, NJ (USA) Distribution Center
PRODUCTION & MANUFACTURING
• Investing in production footprint in Italy to increase capacity and raise control over value chain
A DEMAND-DRIVEN SUPPLY CHAIN INFORMATION SYSTEMS
• AI powered models to improve short-term forecast and long-term demand planning: roll-out in regions and expansion to new product categories
• Logistics transformation program ongoing as planned
• Real-time access to a single sourceof data thanks to ERP rollout
• State-of-the art and integrated IT solutions
• Cybersecurity
2021-23 (tbc)APACand Middle-East
H1 2020Trecate (Italy) DC Phase I
Q3 2021Trecate (Italy) DC Phase II
2019-2021SAP rolloutin EMEA
2020-2022SAP rollout in AMER and APAC
February 17, 2021

STRONGCASH FLOW GENERATION
• Optimize Working Capital
• Pursue Group investments withCapex-to-sales ratioat c.6-7%
• Continued optimization of ROCE
UNCHANGED FINANCIAL PRIORITIES
BALANCEDCAPITALALLOCATION
• Consistent dividend policy
• Ability to seize M&A opportunities
• Agile in returning additional cashto shareholders
SUSTAINORGANIC GROWTH…
• Creative brands resonating with customers
• Market share gains
• Unleash potentialof our Houses according to their maturity level
… AT SOLID PROFITABILITY LEVEL
• Invest for growth: products, stores,client experience and engagement, talents, digital and omnichannel capabilities, communications
• Operating leverage thanks to optimizationof cost base relativeto scale
25February 17, 2021
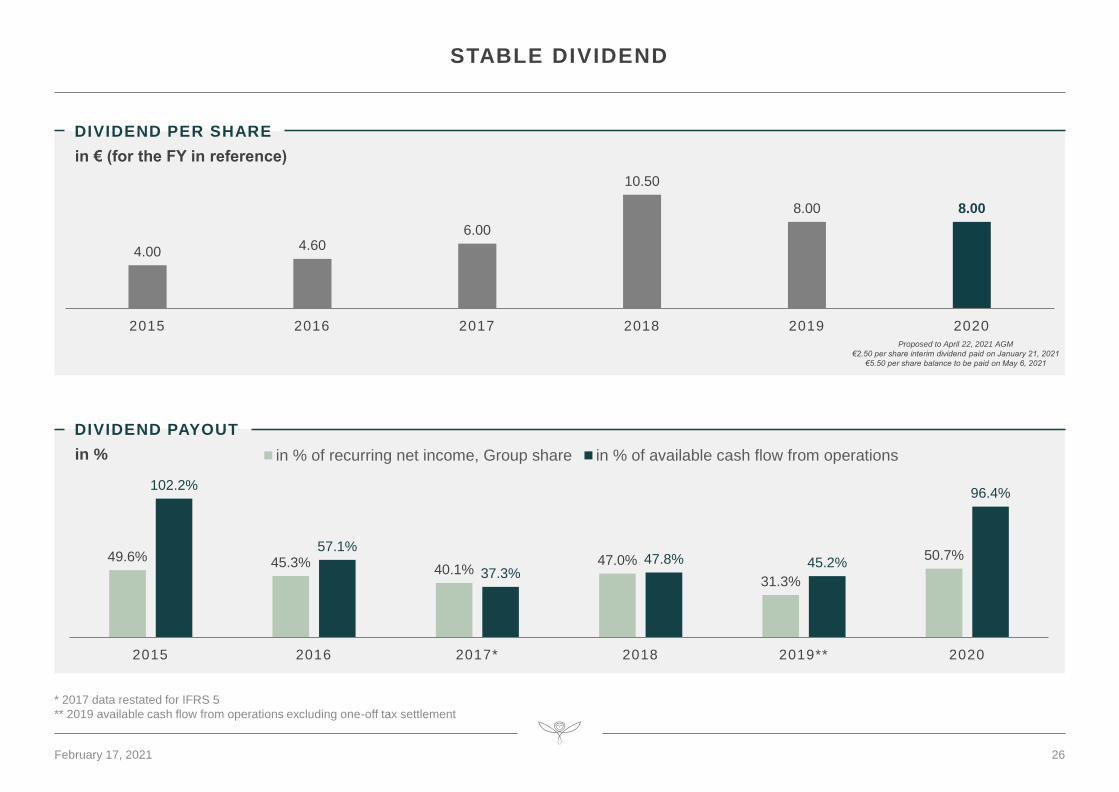
in %
DIVIDEND PAYOUT
in € (for the FY in reference)
DIVIDEND PER SHARE
STABLE DIVIDEND
4.00 4.606.00
10.50
8.00 8.00
2015 2016 2017 2018 2019 2020Proposed to April 22, 2021 AGM
€2.50 per share interim dividend paid on January 21, 2021
€5.50 per share balance to be paid on May 6, 2021
49.6% 45.3%40.1%
47.0%
31.3%
50.7%
102.2%
57.1%
37.3%47.8% 45.2%
96.4%
2015 2016 2017* 2018 2019** 2020
in % of recurring net income, Group share in % of available cash flow from operations
* 2017 data restated for IFRS 5
** 2019 available cash flow from operations excluding one-off tax settlement
26February 17, 2021

27
CONCLUSION
NURTURING
OUR CULTURE
OF INNOVATION,
CREATIVITY
AND CARING
FOCUS ON THE
EXECUTION OF
OUR STRATEGY
CONTINUING
TO INVEST
IN OUR
HOUSES AND
PLATFORMS
FURTHER
POTENTIAL &
OPPORTUNITIES
BACK ON
PROFITABLE
GROWTH
TRAJECTORY
HEALTHY
FINANCIAL
SITUATION
STRENGTHENED POSITIONS TO LEVERAGE THE REBOUND
February 17, 2021

Q&A

APPENDIX

30
REVENUE
Reported change
in €m FY 2020 FY 2019 €m %
Gucci
Saint Laurent
Bottega Veneta
Other Houses
7,440.6
1,744.4
1,210.3
2,281.3
9,628.4
2,049.1
1,167.6
2,537.5
(2,187.8)
(304.7)
+42.7
(256.2)
-22.7%
-14.9%
+3.7%
-10.1%
Luxury – Total Houses 12,676.6 15,382.6 (2,706.0) -17.6%
Corporate & Other 423.6 500.9 (77.3) -15.4%
Kering 13,100.2 15,883.5 (2,783.3) -17.5%
February 17, 2021

Japan
7%
NUMBER OF DIRECTLY OPERATED STORES
y-o-y change
in €m % comparable % reported
Q1 20
Q2 20
Q3 20
Q4 20
3,066
2,110
3,600
3,901
-16.9%
-43.4%
-1.6%
-4.8%
-16.0%
-43.2%
-4.7%
-8.0%
31
LUXURY HOUSES
Revenue breakdown by region
Western Europe
27%
North America
21%
Asia Pacific
39%
RoW
6%
FY 2020 REVENUE€12,677m -17.6% REPORTED, -16.5% COMPARABLE
313229 228
663
324226 220
611
W es te rn Eu rope Nor th Amer i ca Japan Emerg ing marke ts
YE 2020: 1,433 YE 2019: 1,381
February 17, 2021

NUMBER OF DIRECTLY OPERATED STORES
Western Europe
22%
North America
22%
Japan
7%
Asia Pacific
44%
RoW
5%
FY 2020 REVENUE€7,441m -22.7% REPORTED, -21.5% COMPARABLE
105 9967
212
106 107
65
209
W es te rn Eu rope Nor th Amer i ca Japan Emerg ing marke ts
YE 2020: 483 YE 2019: 487
Revenue breakdown by region
y-o-y change
in €m % comparable % reported
Q1 20
Q2 20
Q3 20
Q4 20
1,804
1,268
2,088
2,281
-23.2%
-44.7%
-8.9%
-10.3%
-22.4%
-44.7%
-12.1%
-13.5%
32February 17, 2021

NUMBER OF DIRECTLY OPERATED STORES
Western Europe
32%
North America
25%
Japan
7%
Asia Pacific
30%
RoW
6%
FY 2020 REVENUE€1,744m -14.9% REPORTED, -13.8% COMPARABLE
47 4732
113
46 4331
102
W es te rn Eu rope Nor th Amer i ca Japan Emerg ing marke ts
YE 2020: 239 YE 2019: 222
Revenue breakdown by region
y-o-y change
in €m % comparable % reported
Q1 20
Q2 20
Q3 20
Q4 20
435
247
510
552
-13.8%
-48.4%
+3.9%
+0.5%
-12.6%
-48.2%
+0.8%
-3.0%
33February 17, 2021

NUMBER OF DIRECTLY OPERATED STORES
Western Europe
27%
North America
13%
Japan
11%
Asia Pacific
40%
RoW
9%
FY 2020 REVENUE€1,210m +3.7% REPORTED, +4.8% COMPARABLE
5435
50
122
60
3548
125
W es te rn Eu rope Nor th Amer i ca Japan Emerg ing marke ts
YE 2020: 261 YE 2019: 268
Revenue breakdown by region
y-o-y change
in €m % comparable % reported
Q1 20
Q2 20
Q3 20
Q4 20
274
229
332
375
+8.5%
-24.4%
+20.7%
+15.7%
+10.3%
-23.8%
+17.0%
+12.1%
34February 17, 2021

107
4879
216
112
4176
175
W es te rn Eu rope Nor th Amer i ca Japan Emerg ing marke ts
YE 2020: 450 YE 2019: 404
NUMBER OF DIRECTLY OPERATED STORES
Western Europe
41%
Japan
8%
Asia Pacific
28%
RoW
7%
35
OTHER HOUSES
FY 2020 REVENUE€2,282m -10.1% REPORTED, -9.4% COMPARABLE
Revenue breakdown by region
North America
16%
y-o-y change
in €m % comparable % reported
Q1 20
Q2 20
Q3 20
Q4 20
553
366
669
694
-5.4%
-44.0%
+11.7%
+1.7%
-4.1%
-43.6%
+9.3%
-1.0%
February 17, 2021

36
RECURRING OPERATING INCOME
in €m FY 2020 FY 2019 Reported change %
Gucci
Saint Laurent
Bottega Veneta
Other Houses
2,614.5
400.0
172.0
180.6
3,946.9
562.2
215.2
317.7
-33.8%
-28.9%
-20.1%
-43.2%
Luxury – Total Houses 3,367.1 5,042.0 -33.2%
Corporate & Other (231.9) (263.7) -12.1%
Kering 3,135.2 4,778.3 -34.4%
February 17, 2021

37
EBITDA
in €m FY 2020 FY 2019 Reported change %
Gucci
Saint Laurent
Bottega Veneta
Other Houses
3,224.9
589.9
333.6
457.2
4,463.6
733.7
374.3
550.0
-27.8%
-19.6%
-10.9%
-16.9%
Luxury – Total Houses 4,605.6 6,121.6 -24.8%
Corporate & Other (31.4) (98.0) -68.0%
Kering 4,574.2 6,023.6 -24.1%
EBITDA: defined as recurring operating income + net charges to depreciation, amortisation and provisions on non-current operating assets, recognised in recurring operating income
February 17, 2021

in €m FY 2020 FY 2019
Cost of net debt
Other financial income and expenses
(43.3)
(185.5)
(52.3)
(147.6)
Total Financial result (excluding leases) (228.8) (199.9)
Interest expense on lease liabilities (112.9) (109.6)
Financial result (341.7) (309.5)
38
FINANCIAL RESULT AND INCOME TAX
in €m FY 2020 FY 2019
Tax on recurring income
Tax on non-recurring items
Italian tax settlement
(784.2)
25.0
n.a.
(1,257.6)
27.9
(904.0)
Total tax charge (759.2) (2,133.7)
Effective tax rate 25.7% 49.6%
Tax rate on recurring income 28.1% 28.1%
February 17, 2021

39
BALANCE SHEET
Dec. 31, 2020 Dec. 31, 2019
Intangible Assets
RoU assets on lease contracts
Tangible Assets
Net other Non-current Assets (Liabilities)
Non-current lease Liabilities
Total net Non-current Assets (Liabilities)
Operating Working Capital
Net other Current Assets (Liabilities)
Current lease Liabilities
Total net Current Assets (Liabilities)
Net Assets held for sale
Provisions
9,438
3,957
2,670
1,170
(3,546)
13,689
3,004
(1,622)
(538)
843
1
(350)
9,787
4,247
2,619
1,231
(3,599)
14,285
3,146
(3,118)
(720)
(692)
5
(347)
Capital employed 14,184 13,251
Equity
Net Debt
12,035
2,149
10,439
2,812
Total Sources 14,184 13,251
In €m
February 17, 2021

Gucci • Saint Laurent • Bottega Veneta • Balenciaga • Alexander McQueen • Brioni
Boucheron • Pomellato • Dodo • Qeelin • Ulysse Nardin • Girard -Perregaux
Kering Eyewear


