10 November 2015 | TD Securities 2016 Global Outlook Rates, FX and Commodities Research Contents Market Outlook 2 View From the Top 3 Summary of Trades 4 Global Macro Themes Tracing the Terms of 5 Shock The Turn in Global Inflation 6 Central Bank Regime Shift 6 Regional Risks 8 Global Rates 9 US Rates 11 Canada Rates 14 Australia/NZ Rates 16 Europe Rates 18 Foreign Exchange 20 Emerging Markets 22 Commodities 25 Forecasts 27 Strategy Team 30 https://www.tdsresearch.com/ currency-rates 2016 Global Outlook Don't fight the Fed, ignore it. Position for moves premised on a Fed which will tighten in the coming months and look for stops that can ride the volatility of precisely how it is delivered. We think the bar has been met for a December hike and 100bps of tightening by September 2016, furthering 5s30s flattening in the US, driving convergence in NZ-US-GE 10s, and divergence in US-GE 5s and CA-US 30yr breakevens. We do not expect Fed tightening will be USD-positive much beyond the initial knee-jerk and look for its strength to peter out early in 2016. That implies only somewhat more pressure on EMs and commodities and, in fact, less downside than seems discounted in EM assets at this point. This presents opportunities which will likely grow larger through the year as each passing month of 2016 will mean falling risks of an imminent EM or Chinese crisis. Core Views Bias Asset Allocation G10 Rates Policy divergence to create opportunities in front-end; long-end rates to remain pinned. Underweight 2-5yr Treasuries against EU, NZ. Risk Assets Moderate growth and low inflation keeps us cautiously optimistic, though upside should be limited with Fed hikes and risk of USD strength. Neutral equities Foreign Exchange USD on last up-leg but pressure for EUR to persist on divergent policy. USDJPY may have already peaked while GBP poised for gains vs. commodity FX. LONG SHORT USD/CAD/JPY EUR GBP EUR/NZD/CAD CAD/SEK NZD EM 2016 will be transitional as external risks weigh in H1 but ease into H2, allowing local factors to drive relative performance. Long BRL Short TRY; Long MXN Short CAD; MXN TIIE 2s5s Flattener. Commodities Oversupply to keep oil moderating, until balanced mkt takes over H2 2016. Silver/gold to perk up later in H2 2016. Base metals dependent on China to do better in 2016. Long Au/Ag then reverse at target; Short WTI for now but reverse at target; Long Zn-Al spread. Volatility Realized vol to remain high due to regulation and increasing cost of balance sheet. High vol within a range.
Transcript
10 November 2015 | TD Securities
2016 Global Outlook Rates, FX and Commodities Research
Contents
Market Outlook 2
View From the Top 3
Summary of Trades 4
Global Macro Themes
Tracing the Terms of 5
Shock
The Turn in Global Inflation 6
Central Bank Regime Shift 6
Regional Risks 8
Global Rates 9
US Rates 11
Canada Rates 14
Australia/NZ Rates 16
Europe Rates 18
Foreign Exchange 20
Emerging Markets 22
Commodities 25
Forecasts 27
Strategy Team 30
https://www.tdsresearch.com/currency-rates
2016 Global Outlook
Don't fight the Fed, ignore it. Position for moves premised on a Fed which will tighten in the
coming months and look for stops that can ride the volatility of precisely how it is delivered.
We think the bar has been met for a December hike and 100bps of tightening by September
2016, furthering 5s30s flattening in the US, driving convergence in NZ-US-GE 10s, and
divergence in US-GE 5s and CA-US 30yr breakevens. We do not expect Fed tightening will
be USD-positive much beyond the initial knee-jerk and look for its strength to peter out early
in 2016. That implies only somewhat more pressure on EMs and commodities and, in fact,
less downside than seems discounted in EM assets at this point. This presents opportunities
which will likely grow larger through the year as each passing month of 2016 will mean
falling risks of an imminent EM or Chinese crisis.
Core Views
Bias Asset Allocation
G10 Rates Policy divergence to create opportunities in front-end; long-end rates to remain pinned.
Underweight 2-5yr
Treasuries against EU, NZ.
Risk Assets
Moderate growth and low inflation keeps us cautiously optimistic, though upside should be limited with Fed hikes and risk of USD strength.
Neutral equities
Foreign
Exchange
USD on last up-leg but pressure for EUR to persist on divergent policy. USDJPY may have already peaked while GBP poised for gains vs. commodity FX.
LONG SHORT
USD/CAD/JPY EUR
GBP EUR/NZD/CAD
CAD/SEK NZD
EM
2016 will be transitional as external risks weigh in H1 but ease into H2, allowing local factors to drive relative performance.
Long BRL Short TRY; Long MXN Short CAD; MXN TIIE
2s5s Flattener.
Commodities
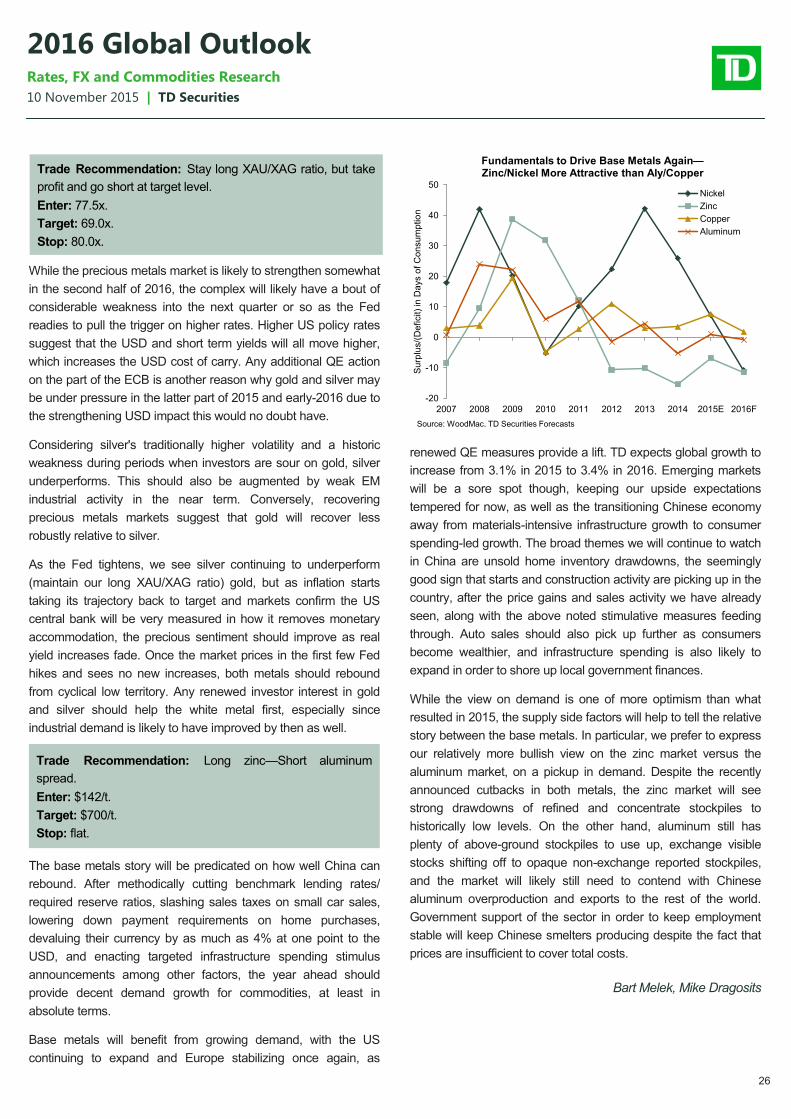
Oversupply to keep oil moderating, until balanced mkt takes over H2 2016. Silver/gold to perk up later in H2 2016. Base metals dependent on China to do better in 2016.
Long Au/Ag then reverse at
target; Short WTI for now but reverse at target; Long Zn-Al
spread.
Volatility Realized vol to remain high due to regulation and increasing cost of balance sheet.
High vol within a range.
10 November 2015 | TD Securities
2016 Global Outlook Rates, FX and Commodities Research
The TD View
Trading Bias
Macro Outlook Rates FX Key Risks
USAfter faltering due to inventory correction
and global headwinds, growth should re-
accelerate to an above-trend pace.
A faster Fed hiking cycle should flatten
5s30s. Global factors and a low terminal
rate should keep 10s relatively pinned.
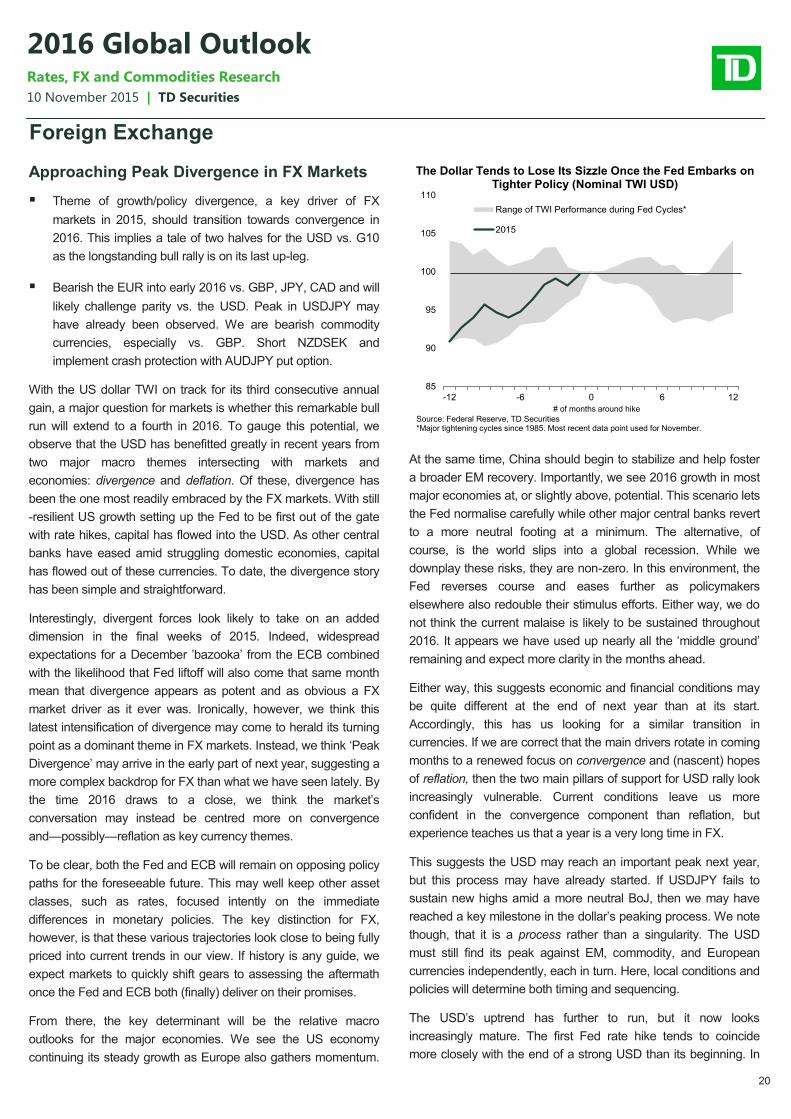
The USD bull rally is nearly mature. Very
selective USD long versus G10 in 2016 with
JPY poised for position-driven rebound.
A sharp deterioration in financial conditions
would dent confidence, stall private sector
spending, and delay Fed hikes.
Canada
Recovery from negative terms of trade
shock with rising growth offsets. Muted
domestic demand and more imported
inflation.
Canadian rates will rise in sympathy with
the US. Look for steeper 2s5s and 2s10s,
while 10s30s flatten.
Remain long USDCAD, target 1.40. Get
long GBPCAD. Relative outperformance
versus its commodity peers.
Further commodity price washout
impacting investment or a significant
downturn in US growth represents key
downside risks.
Europe
Growth is around trend but central banks
are divergent: ECB and Norges Bank
easing, Riksbank on hold, and BoE
tightening.
More ECB QE/depo cuts. 10yr UST-bund
spread to tighten from 190bps lvl, rec 5yr
EURUSD basis as ECB excess liquidity
rises.
EURUSD to challenge parity and bearish
EUR vs. GBP, CAD and JPY for early
2016. Bullish GBP vs. commodities. Short
NZDSEK.
Inflation may fail to pick up and inflation
expectations drift lower. Downside EM
risks remain acute across all of Europe.
Asia-PacThe RBA and RBNZ easing bias is
consistent with respective central banks'
lower growth and inflation forecasts.
Our bias for AUD rates is to keep duration
short, for the curve to steepen, and for
swap spreads to narrow.
AUD and NZD to lose ground vs the USD.
Disposed to sell rallies, US$0.72 for AUD
and US$0.68 for NZD.
China remains the risk for both commodity
producers. Weak house prices raise odds
of rate cuts.
LatamBrazil’s recession, CPI and political risks
improving. Mexico gaining steady traction
while CPI remains tame.
In Brazil biased to receive as we expect
rates to have peaked. In Mexico, TIIE 2s5s
flattening as Banxico hikes with Fed.
BRL carry trade attractive, but risks
suggest short TRYBRL. Short CADMXN on
widening short-term rate differentials.
Political risks and downgrades are major
risks for Brazil. Fed hikes faster than we
expect. Faltering risk appetite.
EMEACE3 growth still solid while CPI rises
slowly. High political risks in Turkey and
Russia. S. Africa growth still sluggish.
Steeper curves in Poland and Hungary;
higher rates in Turkey; Russia CBR easing
more; too many hikes priced in S. Africa.
We prefer EMFX vs EUR in H1 2016, then
look for appreciation vs USD. Biased for
much weaker TRY and ZAR.
Fed rate hikes faster than expected.
Politics, particularly in Russia, Turkey and
less so Poland. ECB policy missteps.
China.
Asia Monetary easing to help growth in India and
Indonesia, while politics and low oil prices
remain a major drag for Malaysia.
The bias is for lower rates and a steeper
curve in India and Indonesia. Malaysia rates
higher in 2016 on BNM tightening.
INR to remain low vol currency; IDR to pick
up in H2 2016; MYR weaker vs USD on
political noise and low oil prices.
Fed tightening faster than expected.
Corporate leverage, but not in India. China
slowdown and political risks.
EnergyOversupply to continue moderating oil
prices in coming quarter, but non-OPEC
production cuts to lift prices in H2 2016.
Non-OPEC production declines are much
more modest than expected and Iran
produce more and earlier.
Precious
metal
Nearing Fed hike keeping prices subdued
into 2016, with rising inflation and waning
USD serving as an upside catalyst later.
Stronger US data and unexpected inflation
prompts Fed to be more aggressive in
removing monetary accommodation in
2016.
Other
metals
Stabilizing China economy, supply cuts
along with muted USD rally should help
base metals to show some upside.
China stimulus is ineffective and demand
growth does not materialize as expected,
prompting metals to correct further.
G
1
0
E
M
C
O
M
M
O
D
I
T
Y
Short bias for now, long WTI later into 2016.
Long gold/silver ratio now, reversing once target reached.
Long Zinc - short Aluminum spread.
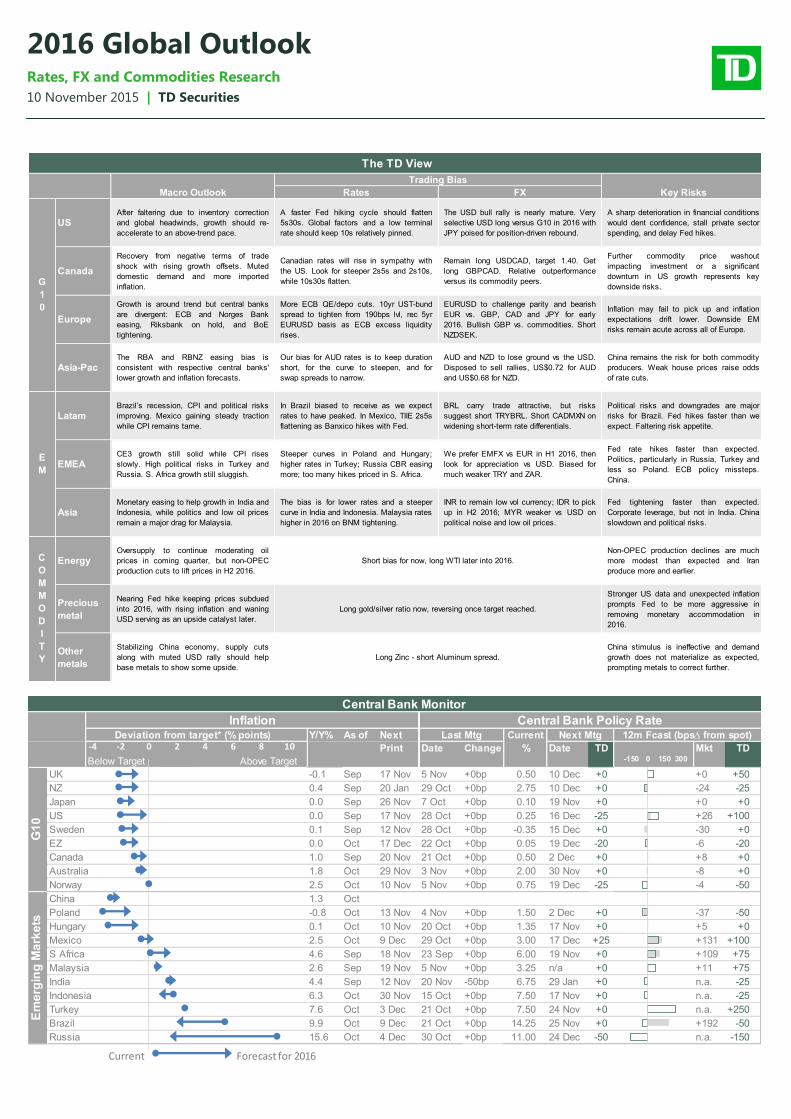
Central Bank Monitor
Inflation Central Bank Policy RateDeviation from target* (% points) Y/Y% As of Next Last Mtg Current Next Mtg 12m Fcast (bps∆ from spot)
Print Date Change % Date TD Mkt TD
Below Target Above Target
n.a. -150
-50
+250
n.a. -25
+109 +75
+5
-37
Russia 15.6 Oct 4 Dec 30 Oct +0bp 11.00 24 Dec -50
14.25 25 Nov +0 +192
n.a.7.50 24 Nov +0
Brazil 9.9 Oct 9 Dec 21 Oct +0bp
Turkey 7.6 Oct 3 Dec 21 Oct +0bp
Indonesia 6.3 Oct 30 Nov 15 Oct +0bp -257.50 17 Nov +0 n.a.
India 4.4 Sep 12 Nov 20 Nov -50bp 6.75 29 Jan +0
Malaysia 2.6 Sep 19 Nov 5 Nov +0bp +753.25 n/a +0 +11
S Africa 4.6 Sep 18 Nov 23 Sep
+0
Mexico 2.5 Oct 9 Dec 29 Oct +0bp +1003.00 17 Dec +25 +131
Hungary 0.1 Oct
+0
10 Nov 20 Oct +0bp 1.35 17 Nov +0
Poland -0.8 Oct 13 Nov 4 Nov +0bp
+0bp 6.00 19 Nov
1.50 2 Dec +0
-4 -50
Em
erg
ing
Ma
rke
ts
China 1.3 Oct
+0bp 0.75 19 Dec -25
G1
0
-50
+0 -8 +02.00 30 Nov
+0bp 0.50 2 Dec
-20
Norway 2.5 Oct 10 Nov 5 Nov
Australia 1.8 Oct 29 Nov 3 Nov
US 0.0 Sep 17 Nov 28 Oct +0bp
-6 -20
Canada 1.0 Sep 20 Nov 21 Oct +8 +0+0
EZ 0.0 Oct 17 Dec 22 Oct +0bp
Sweden 0.1 Sep 12 Nov 28 Oct -30 +0+0
Japan 0.0 Sep 26 Nov 7 Oct +0 +0+0
0.25 16 Dec
+0bp 0.10 19 Nov
-24 -25+0
+0bp -0.35 15 Dec
-25 +26 +100
0.05 19 Dec
+0bp
+0 +50
NZ 0.4 Sep 20 Jan 29 Oct +0bp 2.75 10 Dec
+0bp 0.50 10 Dec +0UK -0.1 Sep 17 Nov 5 Nov
-4 -2 0 2 4 6 8 10
Forecast for 2016Current
-150 0 150 300
3
10 November 2015 | TD Securities
2016 Global Outlook Rates, FX and Commodities Research
Inflation, the Boogeyman, the Tooth Fairy and
Other Things That Still Won't Exist in 2016
Don't fight the Fed, ignore it. Position for moves premised on a
Fed which will tighten in the coming months and look for stops
that can ride the volatility of precisely how it is delivered. We think
the bar has been met for a December hike and 100bps of
tightening by September 2016. We do not expect Fed tightening
will be USD-positive and look for its strength to peter out early in
2016. That implies only somewhat more pressure on EMs and
commodities and, in fact, less downside than seems discounted in
EM assets at this point. This presents opportunities which will
likely grow larger through the year as each passing month of 2016
will mean falling risks of an imminent EM or Chinese crisis.
We see no reason to question that 2016 will be a world of
moderate growth and low inflation. We find it hard to generate
broad upside risks to inflation, and Fed tightening will be yet
another reason to think inflation more likely disappoints than
surprises higher. It is easier to generate upside risks to growth,
though, as the downside drags from terms of trade shocks wane
and upside benefits may yet prove stronger than expected. But
we also see apprehension as the largest immediate issue holding
back markets. That can, does, and is having a real effect on
economies and markets by limiting investment and liquidity, but it
is also an environment that can reverse more quickly.
The 2016 cycle is based on removing emergency rates and
limiting the potential for future financial imbalances—it has less to
do with inflation. This means the hurdle to raise rates to 1.25% is
lower than the hurdle will be to get to 2.25%, when the Fed will
want to see some active risk of above-trend growth and above-
target inflation to justify the next leg. Even if Fed tightening is
unnecessary this soon, fallout from premature Fed tightening
would be a story for 2017, not 2016, so we do not see scope to try
and find trades there.
In fact, fear of the Fed is misplaced. 100bps of tightening would
typically shave 10bps off US inflation and 30bps off output growth
within the first year. The ex-post impact on the dollar is generally
negligible to the extent that it has been anticipated by the market.
This is hardly the makings of a market rout and end of days
scenario—even if the Fed is comfortable killing Christmas.
So the Fed simply isn’t that important. Central banks moderate
growth and liquidity, but it is still the macro environment that
determines market direction. This leaves monetary policy to
determine what level asset prices can realistically reach within
that trend. So as the modalities of Fed tightening and further
divergence in global monetary policy pass through new regulatory
constraints and shifting global investor preferences in 2016, this
will present numerous tactical opportunities across US and global
rates. But it is hard to say there will be a big overall trend across
rates markets—middling macro makes for middling volatility.
In EM, fear may be reasonable, but we also think the risks may
already be reasonably priced. If there is large downside to growth
in 2016, it is much more likely be because of an EM collapse, not
the Fed. But as that is only a risk to what is looking like an
environment that can be more pro-risk, we prefer to hedge that
downside risk by being long an AUDJPY put and maintaining WTI
shorts for now, where excess supply is an additional factor which
will weigh on any rally.
For this story, the biggest question will be the direction of the
dollar. Typically, a reflationary environment is USD-negative and
EMFX positive. Typically, a tightening global monetary policy
cycle is EMFX-positive. And typically, the dollar tends to peak
shortly after the Fed begins to raise rates. All of this provides
reasonable support to our assumption for a top in the dollar.
But three complications point to a risk that USD strength might
linger. The Fed is likely to get further ahead of global central
banks than in previous cycles, so rate differentials might be more
USD-positive than usual. Global CPI will move higher, but this
reflation will still leave inflation running at some of its lowest, non-
recessionary levels. And the need for EM credit adjustment
suggests that risk appetite may be less than usual. If the dollar
does not turn lower, and especially if the dollar strengthens
materially, that would pose a significant complication to the 2016
outlook. While most G10 policymakers might think they would
prefer a strong dollar trend that gives their own currencies relief,
significant dollar strength would still weigh on EMs, and delay the
ability of EM credit adjustment to lessen and risk to rally.
View From the Top
Richard Kelly
4
10 November 2015 | TD Securities
2016 Global Outlook Rates, FX and Commodities Research
Summary of Trade Recommendations
* Note: All levels as of November 9, 2015.
Global Rates
● Sell 5yr US against Germany: Policy divergence between a faster-than-priced in pace of Fed hikes and an easing ECB (depo cut and QE extension).
We enter at 179bp, targeting 200bp and with a stop at 160bp.
● Own 30yr CAD inflation breakevens against US: Canadian core CPI has been running above US core CPI all year and a stronger USD should put
upward pressure on Canadian inflation relative to the US. We enter at -29bp, targeting -5bp and with a stop at -40bp.
United States
Canada
● Short EUR vs. FX basket (into early 2016): The combination of ECB QE-infinity and Fed hike in December will see EURUSD challenge parity. Short
EURJPY as BOJ has no appetite to pursue further unorthodox policy (enter 132.40, target 119, stop 137). Wait for a bounce to implement EURGBP (enter
● Long GBP vs. CAD & NZD: Policy divergence will still exist between the UK and commodity regions and posit. Long GBPCAD - enter 1.96, target 2.15,
stop 1.90. Long GBPNZD - enter 2.30, target 2.80, stop 2.10.
● Short NZD vs. SEK & CAD: RBNZ easing in 2016 is nontrivial as housing slows, ToT shock intensifies and El Nino undermine economy. Riksbank is
doubling down on a policy error. Enter 5.80, target 5.08, stop 5.98.NZDCAD entry 0.8650, target 0.8000, stop 0.8850.
● Long AUDJPY put option: Implement crash protection. Spot / vol ref 87.00 / 21.7%, expiry 30-Apr-16, strike 64.00, cost 0.107% of AUD.
Foreign Exchange
Commodities
● 5s30s flatteners: We believe that the Fed will signal subsequent hikes after liftoff and the market should price in 3-4 hikes in the first year of the hiking
cycle. Meanwhile reinvestments are likely to continue during all of 2016 and the backdrop of a lower terminal FF rate and low global bond yields keep the
long end more pinned. We enter at 137bp, targeting 105bp and our stop is 150bp.
● Long TIPS breakevens: We expect headline inflation to turn due to base effects and stabilization in energy prices. Core inflation to remain high due to
owners’ equivalent rent. Breakevens look cheap relative to fundamentals. We look to enter at 150bp, targeting 185bp and our stop is 135bp.
● 10s30s flatteners: Higher policy rates in the US will cause 10s to underperform in Canada. Entry levels look less compelling for 2s10s steepening
trades. We target a move to 52bps.
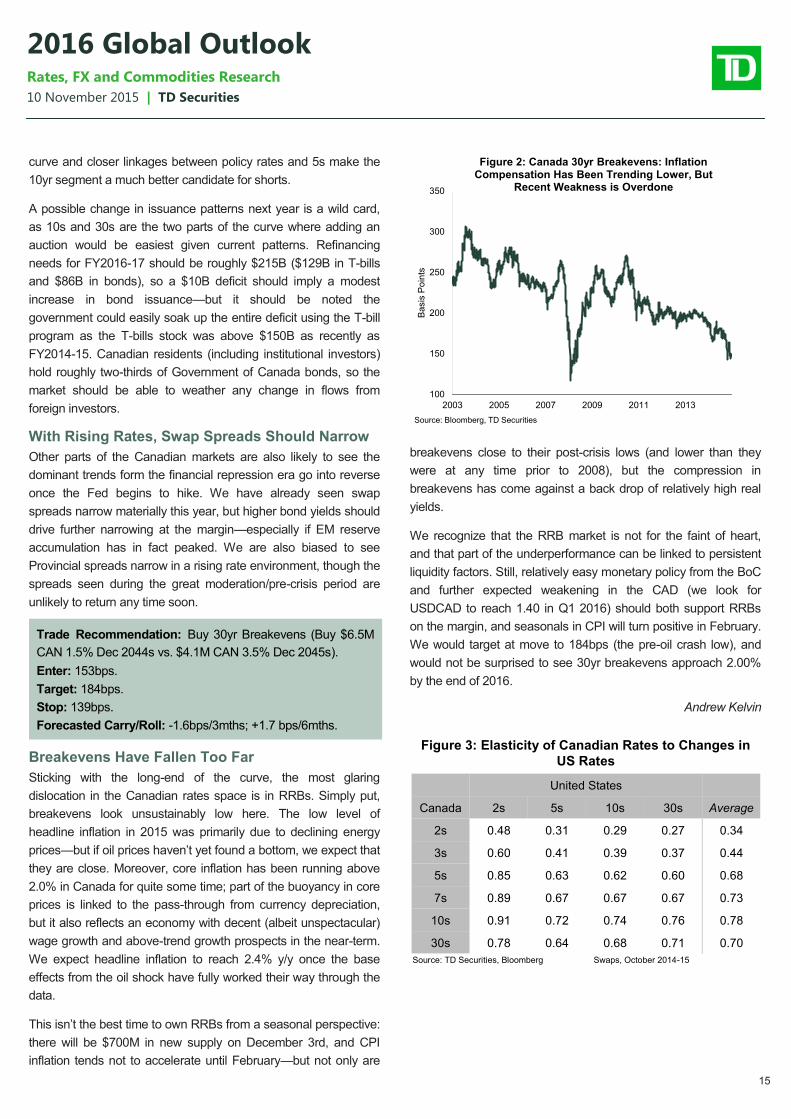
● Buy 30yr breakevens (D44s vs D45s) with a target of 184 bps. Oil prices are likely to trend marginally higher next year, which should push headline
inflation to above 2.0%. Easy monetary policy also argues for higher breakevens on the margin.
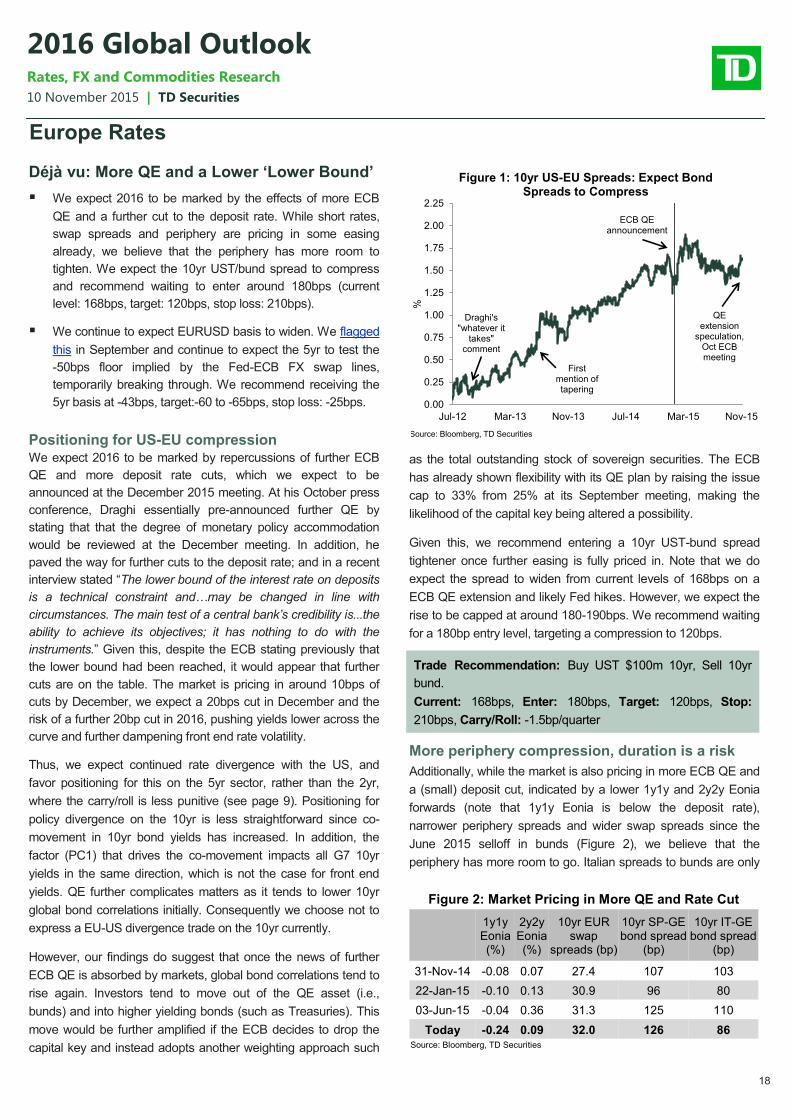
● Buy 10yr UST, Sell 10yr bund: We expect the spread to move higher to around 180/190bps on an ECB announcement effect and on expectations of
earlier Fed hikes. We would then expect the spread to tighten as the market fully absorbs the impact of ECB easing, as investors sell bunds and buy
USTs in search for higher yields. Enter 180bps, target 120bps, stop loss at 210bps.
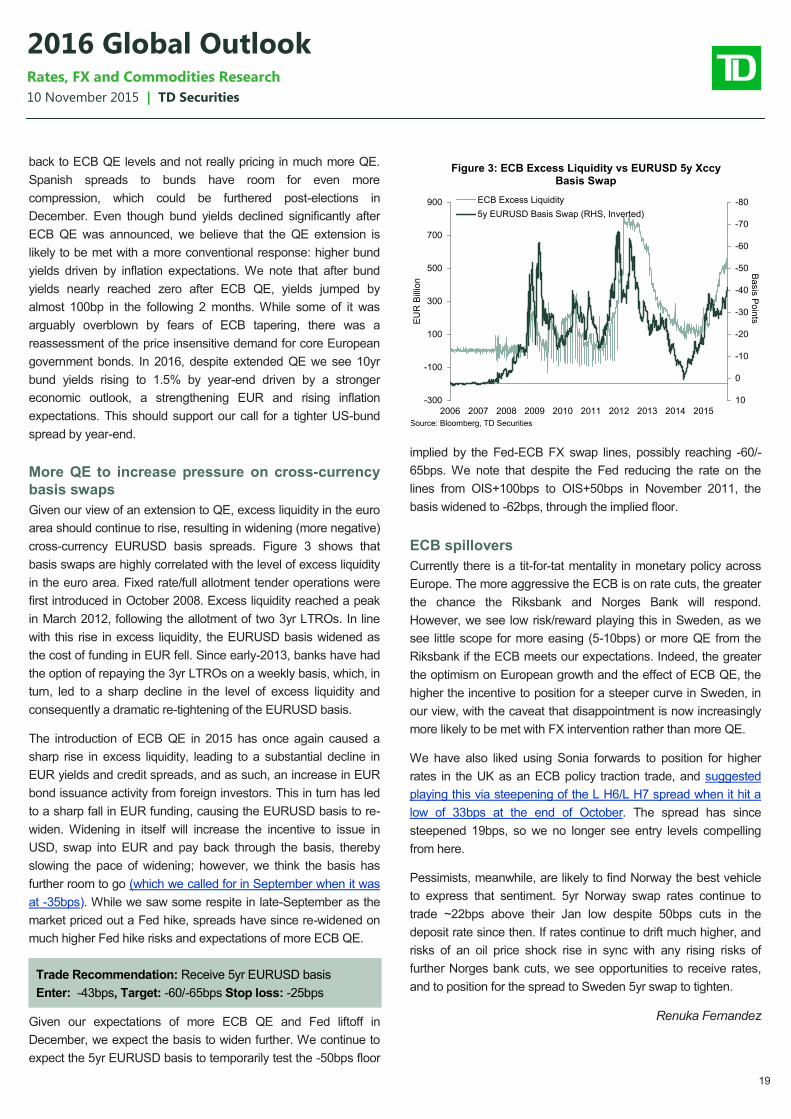
● Receive 5yr EURUSD basis: We look to receive at current levels of -43bps as ECB excess liquidity rises on a QE extension, cheapening EUR funding.
We expect the basis to temporarily test the -50bps floor implied by the Fed-ECB FX swap lines and would target a -60/-65bps level, stop loss -25bps.
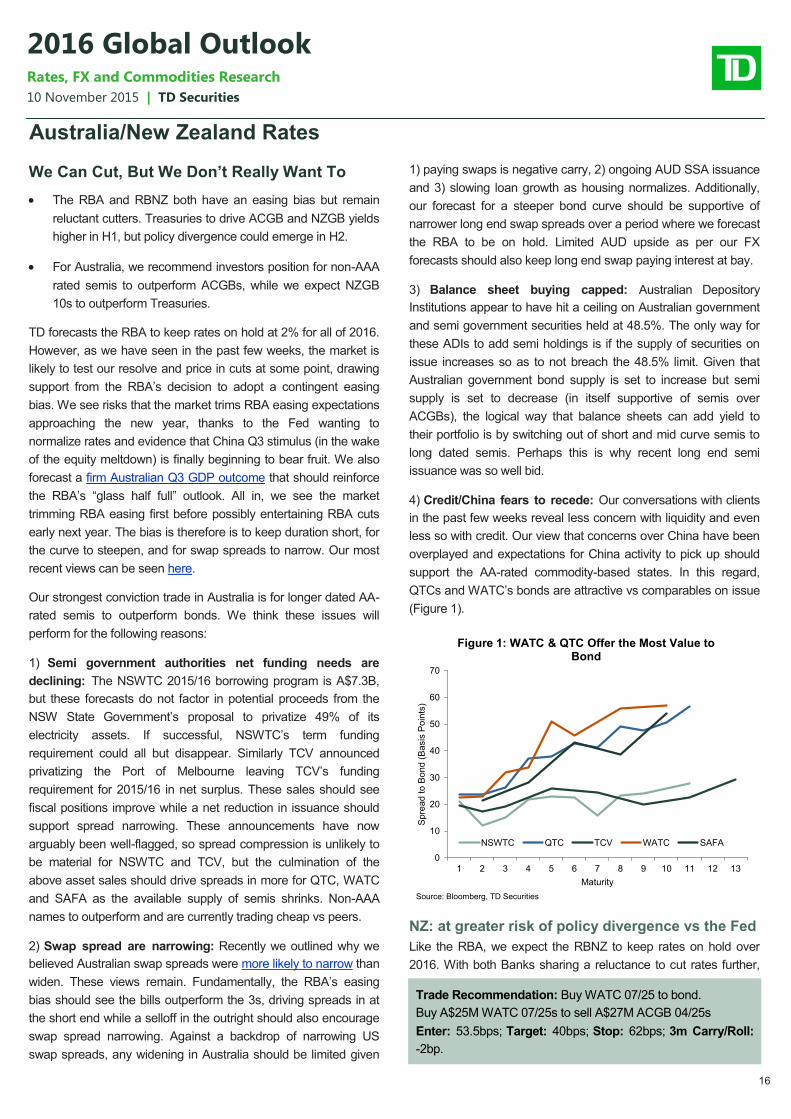
● Non-AAA rated AUD semis to outperform ACGBs: The supply of semi government bonds could shrink materially should asset sales by the AAA-
rated states materialise. This should leave non-AAA semis as beneficaries with ongoing ACGB supply to drive relative outperformance. Enter: 53.5bps,
target: 40bps, stop: 60bps.
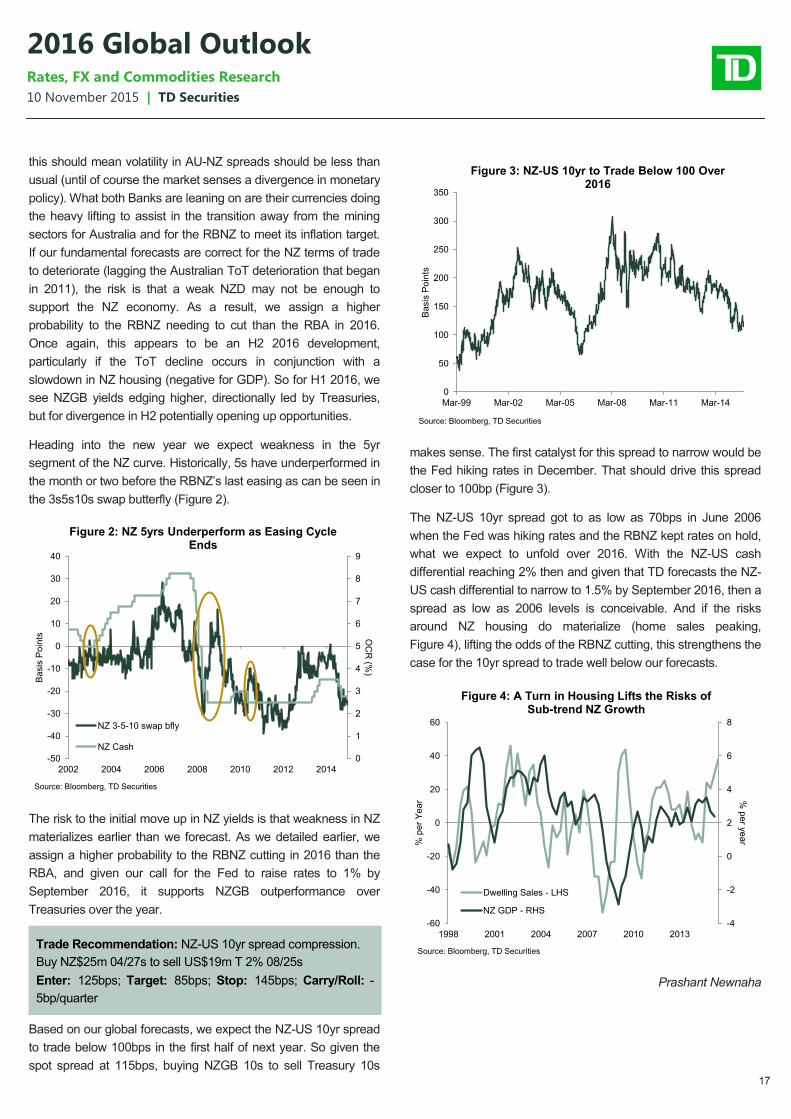
● NZ-US 10yr spread compression: NZGBs are attractive, trading at 115bps above USTs, above our forecasts for the spread to range between 90-
100bps over 2016. The first catalyst for spread narrowing should be a Fed hike as early as next month followed by the RBNZ rate cut risk. Enter 125bps,
target 85bps, stop 145bps.
● Short TRYBRL: Brazilian problems are well known and highly discounted, while the market continues to exhibit complacency against Turkish political
and macro risks. Enter at 1.32 with target at 1.10. Stop at 1.40. The trade has carry of +29bps/month.
● Short CADMXN: Canada and Mexico are similarly reliant of a US economic pickup; however, monetary policies in Mexico and Canada are set to
diverge on Banxico matching every Fed hike with tightening of its own. Enter at 12.65 with target at 11.85. Stop at 12.90. The trade has carry of
+21bps/month.
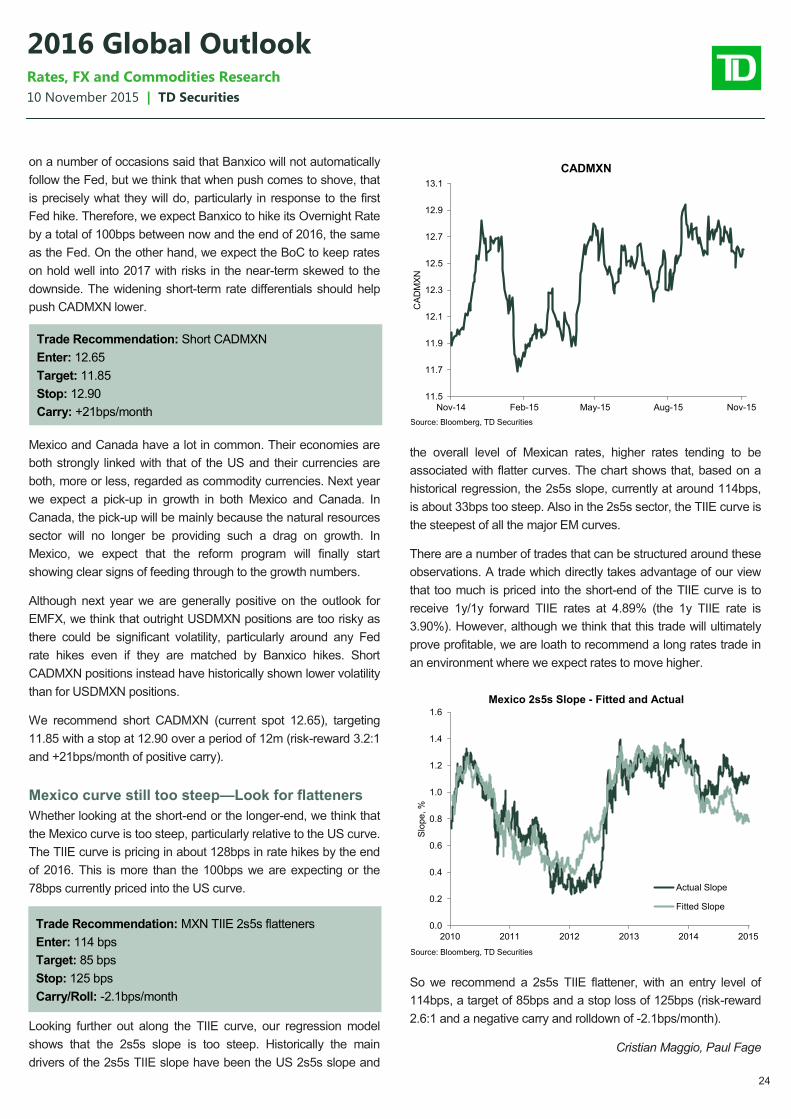
● MXN TIIE 2s5s flatteners: We think the Mexico curve is too steep, particularly in relation to US 2s5s and the level of Mexico's rates. Enter at 114bps
with target at 85bps. Stop at 125bps. The trade has a negative carry/roll of -2.1bps/month.
● Maintain long XAU/XAG ratio bias, then reverse: Precious metals should remain under pressure into technical support lows heading into the
December FOMC meeting, where rates will be hiked for the first time, and then 3 more times in 2016. However, a continued stance on easy monetary
policy and gaining inflation expectations should help to lift precious metals once again—silver more than gold. Enter: 77.5x; Target: 69.0x; Stop: 80.0x.
● Long Zinc - Short Aluminum spread: A bounce in China, continued growth in the US, and a stabilized Europe after renewed ECB easing measures
will lift most base metal boats, but the continued overproduction and export of aluminum by China will overhang prices versus the zinc market tightness,
which has seen some additional supply capitulation in a market already woefully undersupplied. Enter: $144/t; Target: $700/t; Stop: flat.
● Maintain short bias then get long WTI at target price: Global oversupply of oil will persist well beyond the first half of 2016, before a non-OPEC
supply response and inventory drawdowns can offset the return of Iranian oil—remain biased short WTI until price hits our target, where we suggest
building longs. Enter: $42.50/bbl; Target: $60.00/bb; Stop: $32.50/bbl.
Emerging Markets
Australia / New Zealand
Europe
5
10 November 2015 | TD Securities
2016 Global Outlook Rates, FX and Commodities Research
Global Macro Themes for the New Year
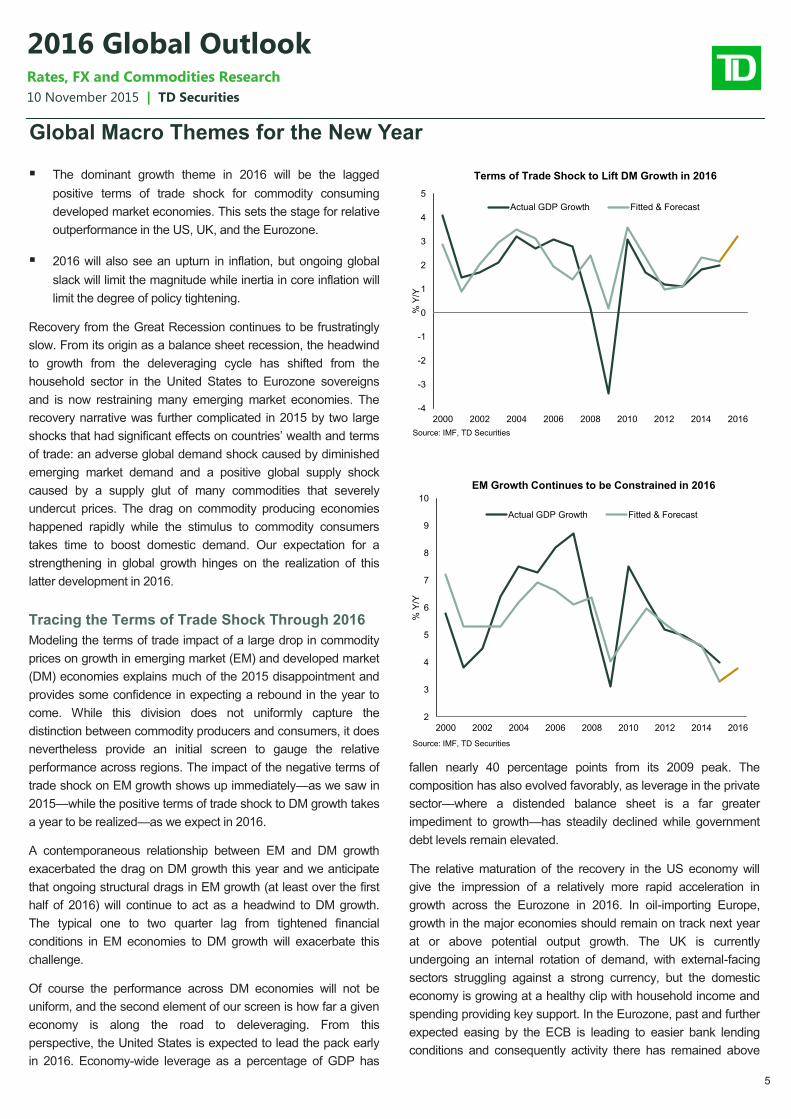
The dominant growth theme in 2016 will be the lagged
positive terms of trade shock for commodity consuming
developed market economies. This sets the stage for relative
outperformance in the US, UK, and the Eurozone.
2016 will also see an upturn in inflation, but ongoing global
slack will limit the magnitude while inertia in core inflation will
limit the degree of policy tightening.
Recovery from the Great Recession continues to be frustratingly
slow. From its origin as a balance sheet recession, the headwind
to growth from the deleveraging cycle has shifted from the
household sector in the United States to Eurozone sovereigns
and is now restraining many emerging market economies. The
recovery narrative was further complicated in 2015 by two large
shocks that had significant effects on countries’ wealth and terms
of trade: an adverse global demand shock caused by diminished
emerging market demand and a positive global supply shock
caused by a supply glut of many commodities that severely
undercut prices. The drag on commodity producing economies
happened rapidly while the stimulus to commodity consumers
takes time to boost domestic demand. Our expectation for a
strengthening in global growth hinges on the realization of this
latter development in 2016.
Tracing the Terms of Trade Shock Through 2016
Modeling the terms of trade impact of a large drop in commodity
prices on growth in emerging market (EM) and developed market
(DM) economies explains much of the 2015 disappointment and
provides some confidence in expecting a rebound in the year to
come. While this division does not uniformly capture the
distinction between commodity producers and consumers, it does
nevertheless provide an initial screen to gauge the relative
performance across regions. The impact of the negative terms of
trade shock on EM growth shows up immediately—as we saw in
2015—while the positive terms of trade shock to DM growth takes
a year to be realized—as we expect in 2016.
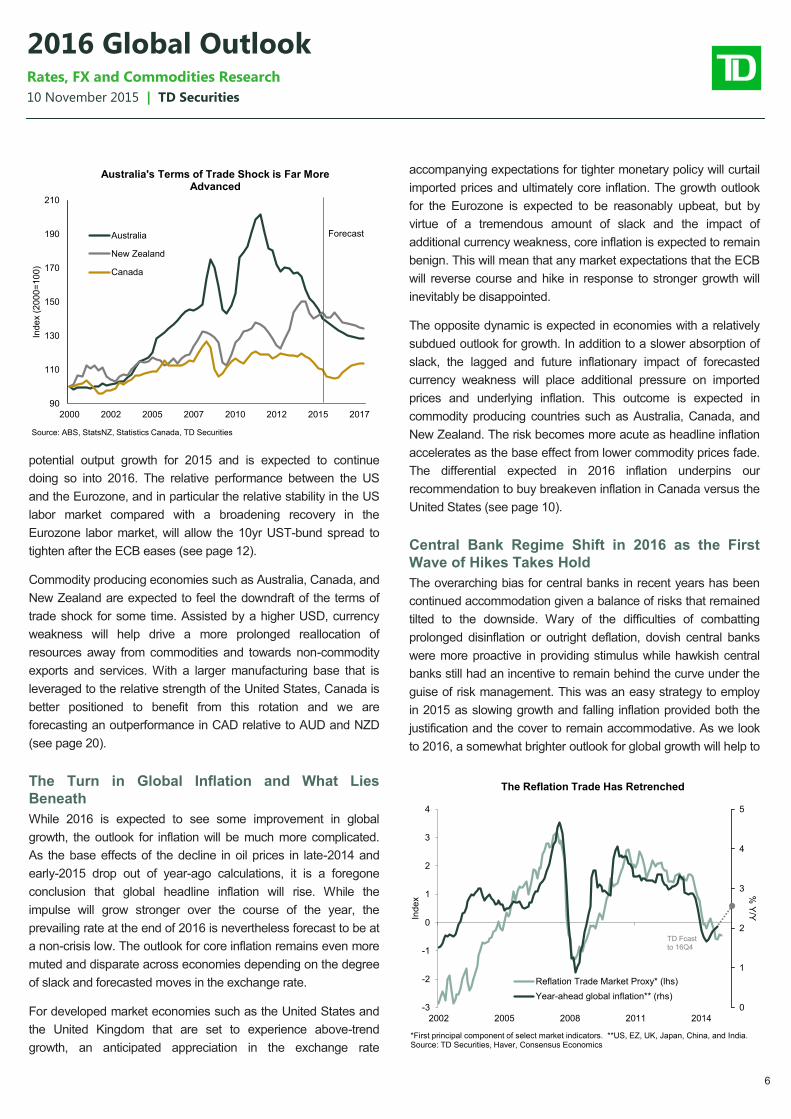
A contemporaneous relationship between EM and DM growth
exacerbated the drag on DM growth this year and we anticipate
that ongoing structural drags in EM growth (at least over the first
half of 2016) will continue to act as a headwind to DM growth.
The typical one to two quarter lag from tightened financial
conditions in EM economies to DM growth will exacerbate this
challenge.
Of course the performance across DM economies will not be
uniform, and the second element of our screen is how far a given
economy is along the road to deleveraging. From this
perspective, the United States is expected to lead the pack early
in 2016. Economy-wide leverage as a percentage of GDP has
fallen nearly 40 percentage points from its 2009 peak. The
composition has also evolved favorably, as leverage in the private
sector—where a distended balance sheet is a far greater
impediment to growth—has steadily declined while government
debt levels remain elevated.
The relative maturation of the recovery in the US economy will
give the impression of a relatively more rapid acceleration in
growth across the Eurozone in 2016. In oil-importing Europe,
growth in the major economies should remain on track next year
at or above potential output growth. The UK is currently
undergoing an internal rotation of demand, with external-facing
sectors struggling against a strong currency, but the domestic
economy is growing at a healthy clip with household income and
spending providing key support. In the Eurozone, past and further
expected easing by the ECB is leading to easier bank lending
conditions and consequently activity there has remained above
-4
-3
-2
-1
0
1
2
3
4
5
2000 2002 2004 2006 2008 2010 2012 2014 2016%
Y/Y
Source: IMF, TD Securities
Terms of Trade Shock to Lift DM Growth in 2016
Actual GDP Growth Fitted & Forecast
2
3
4
5
6
7
8
9
10
2000 2002 2004 2006 2008 2010 2012 2014 2016
% Y
/Y
Source: IMF, TD Securities
EM Growth Continues to be Constrained in 2016
Actual GDP Growth Fitted & Forecast
6
10 November 2015 | TD Securities
2016 Global Outlook Rates, FX and Commodities Research
potential output growth for 2015 and is expected to continue
doing so into 2016. The relative performance between the US
and the Eurozone, and in particular the relative stability in the US
labor market compared with a broadening recovery in the
Eurozone labor market, will allow the 10yr UST-bund spread to
tighten after the ECB eases (see page 12).
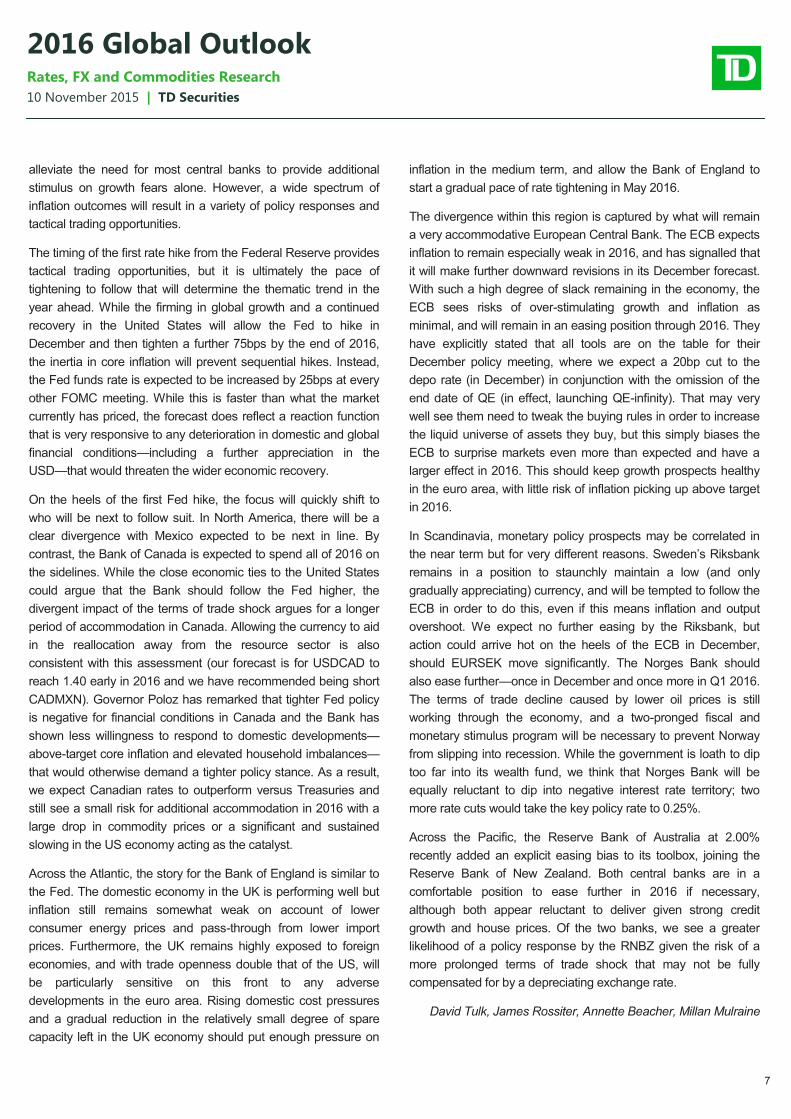
Commodity producing economies such as Australia, Canada, and
New Zealand are expected to feel the downdraft of the terms of
trade shock for some time. Assisted by a higher USD, currency
weakness will help drive a more prolonged reallocation of
resources away from commodities and towards non-commodity
exports and services. With a larger manufacturing base that is
leveraged to the relative strength of the United States, Canada is
better positioned to benefit from this rotation and we are
forecasting an outperformance in CAD relative to AUD and NZD
(see page 20).
The Turn in Global Inflation and What Lies
Beneath
While 2016 is expected to see some improvement in global
growth, the outlook for inflation will be much more complicated.
As the base effects of the decline in oil prices in late-2014 and
early-2015 drop out of year-ago calculations, it is a foregone
conclusion that global headline inflation will rise. While the
impulse will grow stronger over the course of the year, the
prevailing rate at the end of 2016 is nevertheless forecast to be at
a non-crisis low. The outlook for core inflation remains even more
muted and disparate across economies depending on the degree
of slack and forecasted moves in the exchange rate.
For developed market economies such as the United States and
the United Kingdom that are set to experience above-trend
growth, an anticipated appreciation in the exchange rate
accompanying expectations for tighter monetary policy will curtail
imported prices and ultimately core inflation. The growth outlook
for the Eurozone is expected to be reasonably upbeat, but by
virtue of a tremendous amount of slack and the impact of
additional currency weakness, core inflation is expected to remain
benign. This will mean that any market expectations that the ECB
will reverse course and hike in response to stronger growth will
inevitably be disappointed.
The opposite dynamic is expected in economies with a relatively
subdued outlook for growth. In addition to a slower absorption of
slack, the lagged and future inflationary impact of forecasted
currency weakness will place additional pressure on imported
prices and underlying inflation. This outcome is expected in
commodity producing countries such as Australia, Canada, and
New Zealand. The risk becomes more acute as headline inflation
accelerates as the base effect from lower commodity prices fade.
The differential expected in 2016 inflation underpins our
recommendation to buy breakeven inflation in Canada versus the
United States (see page 10).
Central Bank Regime Shift in 2016 as the First
Wave of Hikes Takes Hold
The overarching bias for central banks in recent years has been
continued accommodation given a balance of risks that remained
tilted to the downside. Wary of the difficulties of combatting
prolonged disinflation or outright deflation, dovish central banks
were more proactive in providing stimulus while hawkish central
banks still had an incentive to remain behind the curve under the
guise of risk management. This was an easy strategy to employ
in 2015 as slowing growth and falling inflation provided both the
justification and the cover to remain accommodative. As we look
to 2016, a somewhat brighter outlook for global growth will help to
0
1
2
3
4
5
-3
-2
-1
0
1
2
3
4
2002 2005 2008 2011 2014
% Y
/Y
Ind
ex
The Reflation Trade Has Retrenched
Reflation Trade Market Proxy* (lhs)
Year-ahead global inflation** (rhs)
*First principal component of select market indicators. **US, EZ, UK, Japan, China, and India. Source: TD Securities, Haver, Consensus Economics
Australia's Terms of Trade Shock is Far More Advanced
Australia
New Zealand
Canada
Forecast
7
10 November 2015 | TD Securities
2016 Global Outlook Rates, FX and Commodities Research
alleviate the need for most central banks to provide additional
stimulus on growth fears alone. However, a wide spectrum of
inflation outcomes will result in a variety of policy responses and
tactical trading opportunities.
The timing of the first rate hike from the Federal Reserve provides
tactical trading opportunities, but it is ultimately the pace of
tightening to follow that will determine the thematic trend in the
year ahead. While the firming in global growth and a continued
recovery in the United States will allow the Fed to hike in
December and then tighten a further 75bps by the end of 2016,
the inertia in core inflation will prevent sequential hikes. Instead,
the Fed funds rate is expected to be increased by 25bps at every
other FOMC meeting. While this is faster than what the market
currently has priced, the forecast does reflect a reaction function
that is very responsive to any deterioration in domestic and global
financial conditions—including a further appreciation in the
USD—that would threaten the wider economic recovery.
On the heels of the first Fed hike, the focus will quickly shift to
who will be next to follow suit. In North America, there will be a
clear divergence with Mexico expected to be next in line. By
contrast, the Bank of Canada is expected to spend all of 2016 on
the sidelines. While the close economic ties to the United States
could argue that the Bank should follow the Fed higher, the
divergent impact of the terms of trade shock argues for a longer
period of accommodation in Canada. Allowing the currency to aid
in the reallocation away from the resource sector is also
consistent with this assessment (our forecast is for USDCAD to
reach 1.40 early in 2016 and we have recommended being short
CADMXN). Governor Poloz has remarked that tighter Fed policy
is negative for financial conditions in Canada and the Bank has
shown less willingness to respond to domestic developments—
above-target core inflation and elevated household imbalances—
that would otherwise demand a tighter policy stance. As a result,
we expect Canadian rates to outperform versus Treasuries and
still see a small risk for additional accommodation in 2016 with a
large drop in commodity prices or a significant and sustained
slowing in the US economy acting as the catalyst.
Across the Atlantic, the story for the Bank of England is similar to
the Fed. The domestic economy in the UK is performing well but
inflation still remains somewhat weak on account of lower
consumer energy prices and pass-through from lower import
prices. Furthermore, the UK remains highly exposed to foreign
economies, and with trade openness double that of the US, will
be particularly sensitive on this front to any adverse
developments in the euro area. Rising domestic cost pressures
and a gradual reduction in the relatively small degree of spare
capacity left in the UK economy should put enough pressure on
inflation in the medium term, and allow the Bank of England to
start a gradual pace of rate tightening in May 2016.
The divergence within this region is captured by what will remain
a very accommodative European Central Bank. The ECB expects
inflation to remain especially weak in 2016, and has signalled that
it will make further downward revisions in its December forecast.
With such a high degree of slack remaining in the economy, the
ECB sees risks of over-stimulating growth and inflation as
minimal, and will remain in an easing position through 2016. They
have explicitly stated that all tools are on the table for their
December policy meeting, where we expect a 20bp cut to the
depo rate (in December) in conjunction with the omission of the
end date of QE (in effect, launching QE-infinity). That may very
well see them need to tweak the buying rules in order to increase
the liquid universe of assets they buy, but this simply biases the
ECB to surprise markets even more than expected and have a
larger effect in 2016. This should keep growth prospects healthy
in the euro area, with little risk of inflation picking up above target
in 2016.
In Scandinavia, monetary policy prospects may be correlated in
the near term but for very different reasons. Sweden’s Riksbank
remains in a position to staunchly maintain a low (and only
gradually appreciating) currency, and will be tempted to follow the
ECB in order to do this, even if this means inflation and output
overshoot. We expect no further easing by the Riksbank, but
action could arrive hot on the heels of the ECB in December,
should EURSEK move significantly. The Norges Bank should
also ease further—once in December and once more in Q1 2016.
The terms of trade decline caused by lower oil prices is still
working through the economy, and a two-pronged fiscal and
monetary stimulus program will be necessary to prevent Norway
from slipping into recession. While the government is loath to dip
too far into its wealth fund, we think that Norges Bank will be
equally reluctant to dip into negative interest rate territory; two
more rate cuts would take the key policy rate to 0.25%.
Across the Pacific, the Reserve Bank of Australia at 2.00%
recently added an explicit easing bias to its toolbox, joining the
Reserve Bank of New Zealand. Both central banks are in a
comfortable position to ease further in 2016 if necessary,
although both appear reluctant to deliver given strong credit
growth and house prices. Of the two banks, we see a greater
likelihood of a policy response by the RNBZ given the risk of a
more prolonged terms of trade shock that may not be fully
compensated for by a depreciating exchange rate.
David Tulk, James Rossiter, Annette Beacher, Millan Mulraine
8
10 November 2015 | TD Securities
2016 Global Outlook Rates, FX and Commodities Research
Regional Risks
● A significant and sustained drop in commodity prices is a clear downside risk to 2016 growth. The primary channel will again be through business investment. If prices fall below their production breakevens, then the shock would spread to other parts of the domestic economy and place additional pressure on fiscal and monetary policy to respond. While the former is willing, the latter has little room to maneuver. ● A downturn in US growth would imperil the nascent recovery in non-energy exports and leave the growth outlook without a positive offset to the ongoing terms of trade shock.
● Concerns about a China-led slowdown remain, but there are silver linings. While manufacturing and construction are in decline, keeping commodity prices under pressure, there are opportunities elsewhere. Non-core-commodity exports jump in Australia and New Zealand, and with even lower currencies in the cards for 2016, expect more of this rotation.
● Financial market contagion remains the major tail risk, as Chinese debt restructuring, the experimental CNY
fixing regime and the opening up of capital markets rarely go smoothly.
● A risk for the RBA/RBNZ is that the Fed doesn’t hike by March, boosting the currencies and potentially forcing both to act on their easing biases.
● Alternatively, hot housing markets could prompt hikes by year-end.
● Risks are that Eurozone disinflation persists, and no matter how much the ECB eases, price pressures remain weak on such large spare capacity. Downside risks to the EM recovery pose significant risks for Eurozone (in particular German) growth. ● Weaker foreign demand risks (in both EMs and the Eurozone) are important to the very open UK economy. If productivity continues to disappoint, domestic cost pressures may build more quickly than anticipated, but conversely, inflation expectations could fall with the BoE forecasting sub-1% inflation in 2016. ● Risks lay only to the downside for Norway, where the non-energy economy has yet to show the full impact of lower oil prices. Conversely, Sweden risks over-heating as policy remains overly aggressive to keep SEK weak.
● The two major external risks affecting EMs are Fed tightening and the prospects for China growth and FX policy. ● Volatility in EM asset prices should start falling once the first couple of Fed rate hikes are out of the way, but before
then we could have a bumpy ride. ● Poor growth prospects are likely to continue to plague a sizeable portion of the EM asset class. The biggest growth pick-ups will be in Russia and Brazil, but these are two economies recovering from deep recessions. The best growth stories remain in Asia and we continue to like India and Indonesia. ● Political risks continue to be a major issue in a number of EM countries, particularly in Russia, Turkey, Brazil, and Malaysia.
● The US economic recovery is expected to regain its footing in 2016, as the combination of diminished global headwinds and a favorable domestic fundamental backdrop provides the platform for the recovery to shift back to an above-trend 2.5% or better pace. Despite this relatively constructive growth outlook, the risks to this view are tilted slightly to the downside as further missteps in China or the absence of the long-awaited rotation in the driver for growth from fatigued US consumers—who continue to carry the heavy load of the recovery—to business investment activity could add further strains for the recovery. ● A disorderly global financial market response to the expected liftoff in rates in December could also present an obstacle to the ongoing economic recovery. The response of the dollar will be particularly key to assessing the extent of the fallout. However, even if the Fed delivers on the current expectation for a December hike, the subsequent path of tightening should be sufficiently shallow to mitigate the risks of a disruptive feedback loop from financial markets to the real economy.
Canada Asia-Pacific
EMs Europe
United States
9
10 November 2015 | TD Securities
2016 Global Outlook Rates, FX and Commodities Research
Global Rates
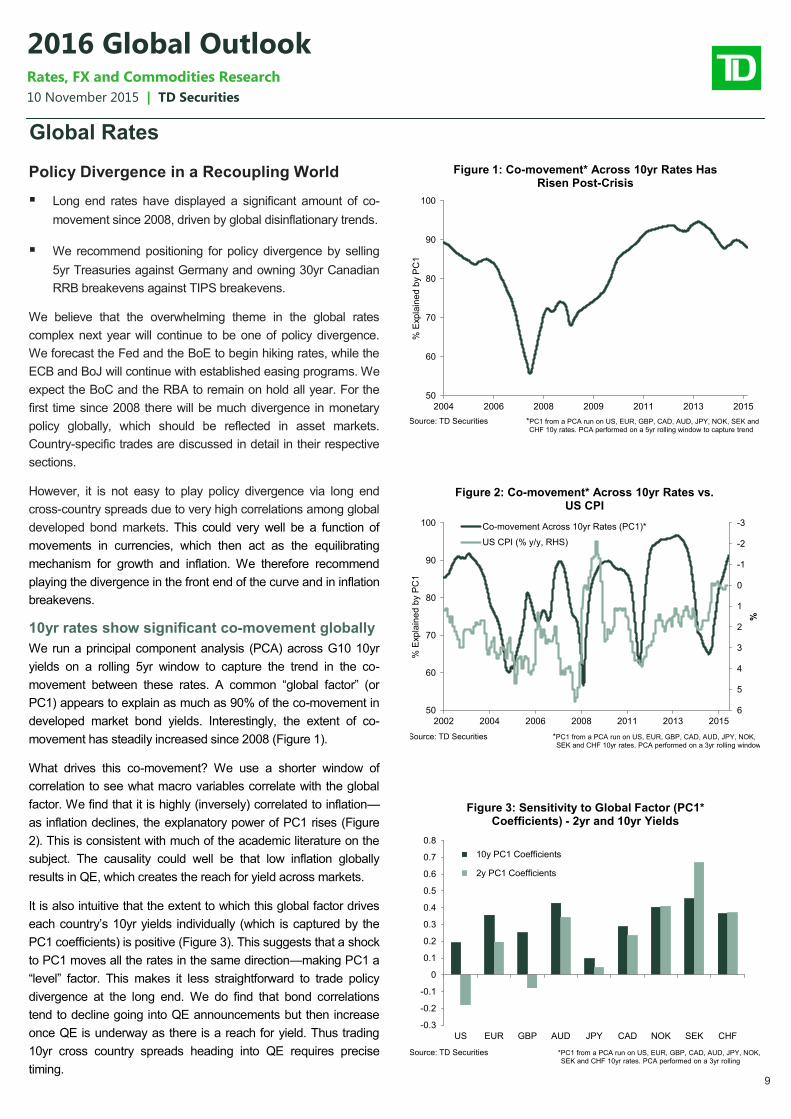
Policy Divergence in a Recoupling World
Long end rates have displayed a significant amount of co-
movement since 2008, driven by global disinflationary trends.
We recommend positioning for policy divergence by selling
5yr Treasuries against Germany and owning 30yr Canadian
RRB breakevens against TIPS breakevens.
We believe that the overwhelming theme in the global rates
complex next year will continue to be one of policy divergence.
We forecast the Fed and the BoE to begin hiking rates, while the
ECB and BoJ will continue with established easing programs. We
expect the BoC and the RBA to remain on hold all year. For the
first time since 2008 there will be much divergence in monetary
policy globally, which should be reflected in asset markets.
Country-specific trades are discussed in detail in their respective
sections.
However, it is not easy to play policy divergence via long end
cross-country spreads due to very high correlations among global
developed bond markets. This could very well be a function of
movements in currencies, which then act as the equilibrating
mechanism for growth and inflation. We therefore recommend
playing the divergence in the front end of the curve and in inflation
breakevens.
10yr rates show significant co-movement globally
We run a principal component analysis (PCA) across G10 10yr
yields on a rolling 5yr window to capture the trend in the co-
movement between these rates. A common “global factor” (or
PC1) appears to explain as much as 90% of the co-movement in
developed market bond yields. Interestingly, the extent of co-
movement has steadily increased since 2008 (Figure 1).
What drives this co-movement? We use a shorter window of
correlation to see what macro variables correlate with the global
factor. We find that it is highly (inversely) correlated to inflation—
as inflation declines, the explanatory power of PC1 rises (Figure
2). This is consistent with much of the academic literature on the
subject. The causality could well be that low inflation globally
results in QE, which creates the reach for yield across markets.
It is also intuitive that the extent to which this global factor drives
each country’s 10yr yields individually (which is captured by the
PC1 coefficients) is positive (Figure 3). This suggests that a shock
to PC1 moves all the rates in the same direction—making PC1 a
“level” factor. This makes it less straightforward to trade policy
divergence at the long end. We do find that bond correlations
tend to decline going into QE announcements but then increase
once QE is underway as there is a reach for yield. Thus trading
10yr cross country spreads heading into QE requires precise
timing.
50
60
70
80
90
100
2004 2006 2008 2009 2011 2013 2015%
Exp
lain
ed
by P
C1
Figure 1: Co-movement* Across 10yr Rates Has Risen Post-Crisis
Source: TD Securities *PC1 from a PCA run on US, EUR, GBP, CAD, AUD, JPY, NOK, SEK and
CHF 10y rates. PCA performed on a 5yr rolling window to capture trend
-3
-2
-1
0
1
2
3
4
5
650
60
70
80
90
100
2002 2004 2006 2008 2011 2013 2015
%
% E
xp
lain
ed
by P
C1
Figure 2: Co-movement* Across 10yr Rates vs. US CPI
Co-movement Across 10yr Rates (PC1)*
US CPI (% y/y, RHS)
Source: TD Securities *PC1 from a PCA run on US, EUR, GBP, CAD, AUD, JPY, NOK,
SEK and CHF 10yr rates. PCA performed on a 3yr rolling window
-0.3
-0.2
-0.1
0
0.1
0.2
0.3
0.4
0.5
0.6
0.7
0.8
US EUR GBP AUD JPY CAD NOK SEK CHF
Figure 3: Sensitivity to Global Factor (PC1* Coefficients) - 2yr and 10yr Yields
10y PC1 Coefficients
2y PC1 Coefficients
Source: TD Securities *PC1 from a PCA run on US, EUR, GBP, CAD, AUD, JPY, NOK, SEK and CHF 10yr rates. PCA performed on a 3yr rolling
10
10 November 2015 | TD Securities
2016 Global Outlook Rates, FX and Commodities Research
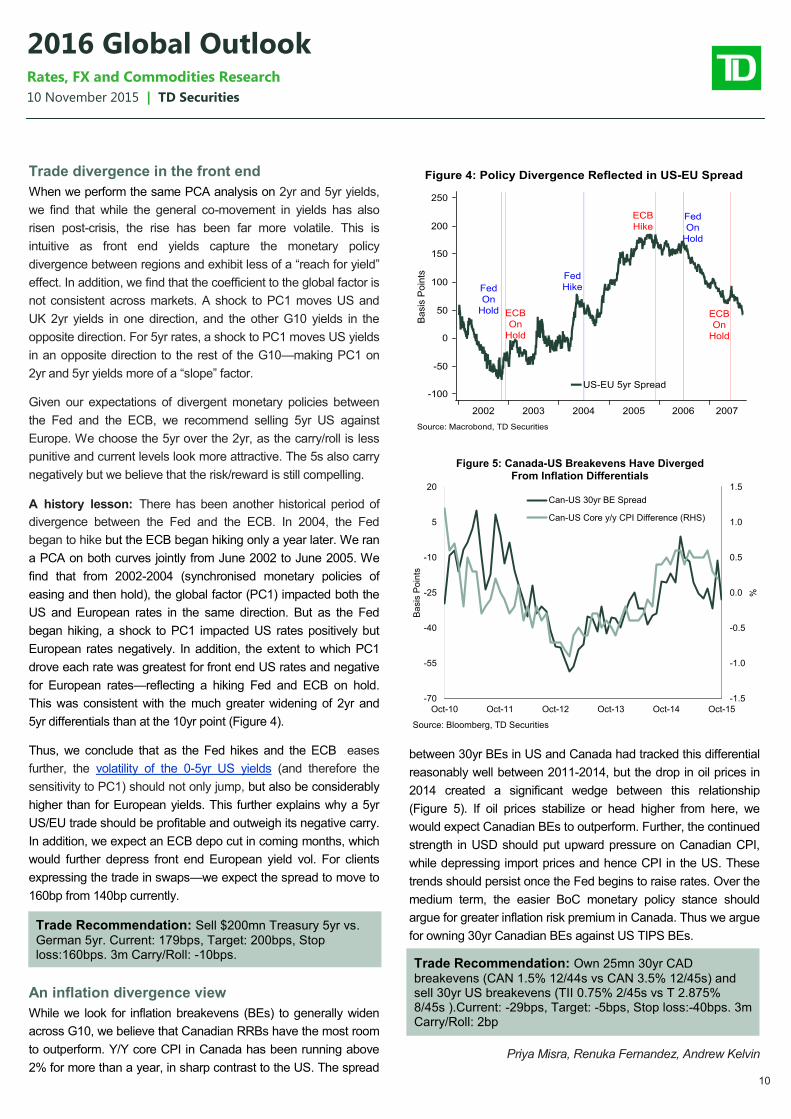
Trade divergence in the front end
When we perform the same PCA analysis on 2yr and 5yr yields,
we find that while the general co-movement in yields has also
risen post-crisis, the rise has been far more volatile. This is
intuitive as front end yields capture the monetary policy
divergence between regions and exhibit less of a “reach for yield”
effect. In addition, we find that the coefficient to the global factor is
not consistent across markets. A shock to PC1 moves US and
UK 2yr yields in one direction, and the other G10 yields in the
opposite direction. For 5yr rates, a shock to PC1 moves US yields
in an opposite direction to the rest of the G10—making PC1 on
2yr and 5yr yields more of a “slope” factor.
Given our expectations of divergent monetary policies between
the Fed and the ECB, we recommend selling 5yr US against
Europe. We choose the 5yr over the 2yr, as the carry/roll is less
punitive and current levels look more attractive. The 5s also carry
negatively but we believe that the risk/reward is still compelling.
A history lesson: There has been another historical period of
divergence between the Fed and the ECB. In 2004, the Fed
began to hike but the ECB began hiking only a year later. We ran
a PCA on both curves jointly from June 2002 to June 2005. We
find that from 2002-2004 (synchronised monetary policies of
easing and then hold), the global factor (PC1) impacted both the
US and European rates in the same direction. But as the Fed
began hiking, a shock to PC1 impacted US rates positively but
European rates negatively. In addition, the extent to which PC1
drove each rate was greatest for front end US rates and negative
for European rates—reflecting a hiking Fed and ECB on hold.
This was consistent with the much greater widening of 2yr and
5yr differentials than at the 10yr point (Figure 4).
Thus, we conclude that as the Fed hikes and the ECB eases
further, the volatility of the 0-5yr US yields (and therefore the
sensitivity to PC1) should not only jump, but also be considerably
higher than for European yields. This further explains why a 5yr
US/EU trade should be profitable and outweigh its negative carry.
In addition, we expect an ECB depo cut in coming months, which
would further depress front end European yield vol. For clients
expressing the trade in swaps—we expect the spread to move to
160bp from 140bp currently.
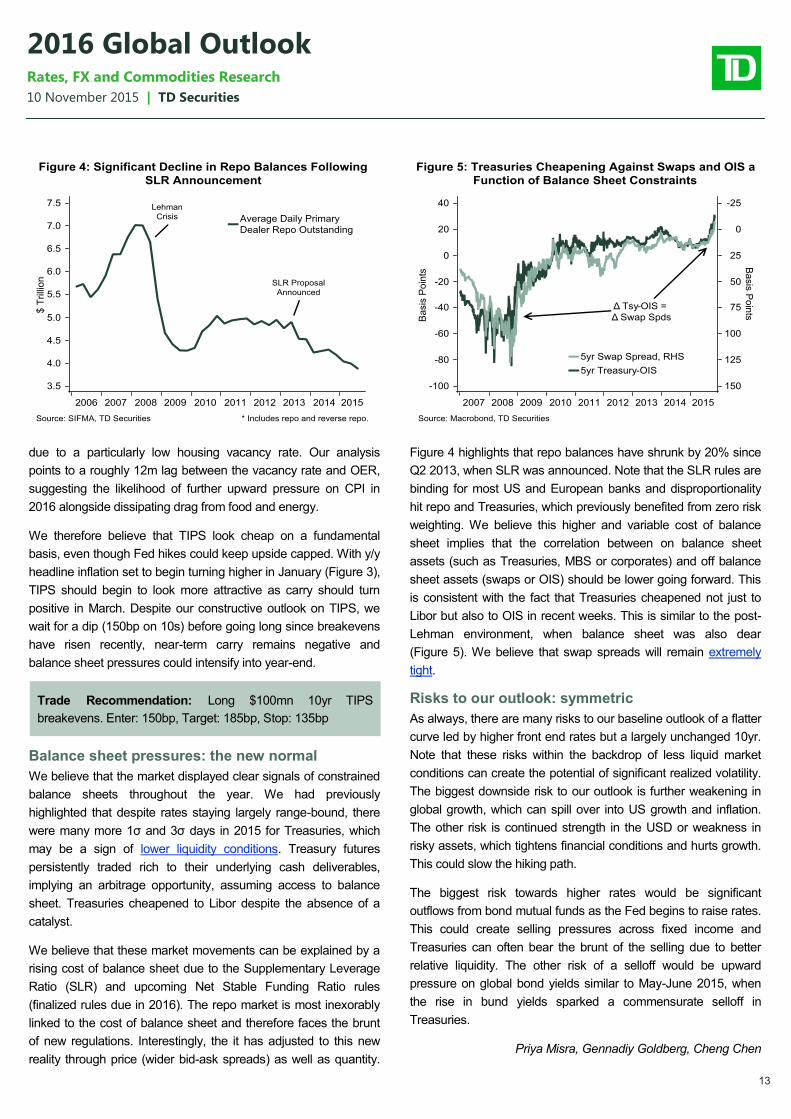
An inflation divergence view
While we look for inflation breakevens (BEs) to generally widen
across G10, we believe that Canadian RRBs have the most room
to outperform. Y/Y core CPI in Canada has been running above
2% for more than a year, in sharp contrast to the US. The spread
between 30yr BEs in US and Canada had tracked this differential
reasonably well between 2011-2014, but the drop in oil prices in
2014 created a significant wedge between this relationship
(Figure 5). If oil prices stabilize or head higher from here, we
would expect Canadian BEs to outperform. Further, the continued
strength in USD should put upward pressure on Canadian CPI,
while depressing import prices and hence CPI in the US. These
trends should persist once the Fed begins to raise rates. Over the
medium term, the easier BoC monetary policy stance should
argue for greater inflation risk premium in Canada. Thus we argue
for owning 30yr Canadian BEs against US TIPS BEs.
Priya Misra, Renuka Fernandez, Andrew Kelvin
Trade Recommendation: Own 25mn 30yr CAD
breakevens (CAN 1.5% 12/44s vs CAN 3.5% 12/45s) and sell 30yr US breakevens (TII 0.75% 2/45s vs T 2.875% 8/45s ).Current: -29bps, Target: -5bps, Stop loss:-40bps. 3m Carry/Roll: 2bp
Trade Recommendation: Sell $200mn Treasury 5yr vs.
2016 Global Outlook Rates, FX and Commodities Research
Global Disclaimer This material is for general informational purposes only and is not investment advice nor does it constitute an offer, recommendation or solicitation to buy or sell a particular financial instrument. It does not have regard to the specific investment objectives, financial situation, risk profile or the particular needs of any specific person who may receive this material. No representation is made that the information contained herein is accurate in all material respects, complete or up to date, nor that it has been independently verified by TD Securities. Recipients of this analysis or report are to contact the representative in their local jurisdiction with regards to any matters or questions arising from, or in connection with, the analysis or report. Historic information regarding performance is not indicative of future results and investors should understand that statements regarding future prospects may not be realized. All investments entail risk, including potential loss of principal invested. Performance analysis is based on certain assumptions, the results of which may vary significantly depending on the modelling inputs assumed. This material, including all opinions, estimates and other information, constitute TD Securities’ judgment as of the date hereof and is subject to change without notice. The price, value of and income from any of the securities mentioned in this material can fall as well as rise. Any market valuations contained herein are indicative values as of the time and date indicated. Such market valuations are believed to be reliable, but TD Securities does not warrant their completeness or accuracy. Different prices and/or valuations may be available elsewhere and TD Securities suggests that valuations from other sources be obtained for comparison purposes. Any price or valuation constitutes TD Securities’ judgment and is subject to change without notice. Actual quotations could differ subject to market conditions and other factors. TD Securities disclaims any and all liability relating to the information herein, including without limitation any express or implied representations or warranties for, statements contained in, and omissions from, the information. TD Securities is not liable for any errors or omissions in such information or for any loss or damage suffered, directly or indirectly, from the use of this information. TD Securities may have effected or may effect transactions for its own account in the securities described herein. No proposed customer or counterparty relationship is intended or implied between TD Securities and a recipient of this document. TD Securities makes no representation as to any tax, accounting, legal or regulatory issues. Investors should seek their own legal, financial and tax advice regarding the appropriateness of investing in any securities or pursuing any strategies discussed herein. Investors should also carefully consider any risks involved. Any transaction entered into is in reliance only upon the investor’s judgment as to financial, suitability and risk criteria. TD Securities does not hold itself out to be an advisor in these circumstances, nor do any of its representatives have the authority to do so. The information contained herein is not intended for distribution to, or use by, any person in any jurisdiction where such distribution or use would be contrary to applicable law or regulation or which would subject TD Securities to additional licensing or registration requirements. It may not be copied, reproduced, posted, transmitted or redistributed in any without the prior written consent of TD Securities. If you would like to unsubscribe from our email distribution lists at any time, please contact your TD Securities Sales Contact or email us at [email protected]. You can access our Privacy Policy here (http://www.tdsecurities.com/tds/content/AU_Privacy_EandAP_en_CA).
Australia: If you receive this document and you are domiciled in Australia, please note that TD Securities is not a registered bank in Australia, is not a holder of an Australian Financial Services License (AFSL), and is exempt from the requirement to hold an Australian Financial Services License under the Corporations Act 2001 in respect of the financial services provided by the Singapore branch of The Toronto-Dominion Bank (“TD Bank”) as part of its operations in Singapore and the UK. TD Bank is regulated by the Monetary Authority of Singapore under the laws of Singapore and the Financial Conduct Authority under UK laws, which differ from Australian laws. TD Securities Limited is providing financial services to wholesale clients in Australia in reliance on Class Order CO 03/1099. Canada: Canadian clients wishing to effect transactions in any security discussed herein should do so through a qualified salesperson of TD Securities or TD Securities Inc. TD Securities Inc. is a member of the Canadian Investor Protection Fund. Hong Kong: This document, which is intended to be issued in Hong Kong only to Professional Investors within the meaning of the Securities and Futures Ordinance (the "SFO") and the Securities and Futures (Professional Investor) Rules made under the SFO, has been distributed through TD Bank, Hong Kong Branch, which is regulated by the Hong Kong Monetary Authority. India, South Korea and Other Locations in Asia: TD Bank has representative offices in Mumbai and Singapore which should be contacted for any general enquiry related to TD Securities. In locations in Asia where TD Securities does not hold a license to conduct business in financial services, it is not TD Securities’ intention to, and the information contained in this document should not be construed as conducting any regulated financial activity, including dealing in, or the provision of advice in relation to, any regulated instrument or product. Japan: For Japanese residents, please note that TD Securities is not licensed in Japan and this is being provided to you under a relevant exemption to the Financial Instruments and Exchange Law. People's Republic of China: Insofar as the document is received by any persons in the People's Republic of China (which, for such purposes, does not include Hong Kong, Macau or Taiwan), it is intended only to be issued to persons who have the relevant qualifications to engage in the investment activity mentioned in this document. The recipient is responsible for obtaining all relevant government regulatory approvals and licenses themselves, and represents and warrants to TD Securities that the recipient's investments in those securities do not violate any PRC law or regulation, including, but not limited to, any relevant foreign exchange regulations or overseas investment regulations. TD Bank has a representative office in Shanghai, which should be contacted for any general enquiry related to TD Securities. However, neither TD Securities nor the Shanghai representative office of TD Bank is permitted to conduct substantial business within the borders of the People's Republic of China. Singapore: This document is intended to be issued in Singapore only to Institutional Investors or Accredited Investors as defined under the Securities and Futures Act. Recipients of the analysis or report are to contact the financial adviser in Singapore in respect of any matters arising from, or in connection with, the analysis or report. Recommendations are intended for general circulation and do not take into account the specific investment objectives, financial situation or particular needs of any particular person. Advice should be sought from a financial adviser regarding the suitability of the investment product, taking into account the specific investment objectives, financial situation or particular needs of any person in receipt of the recommendation, before the person makes a commitment to purchase the investment product. TD Bank, Singapore Branch, is regulated by the Monetary Authority of Singapore. United Kingdom and Europe: This document is prepared, issued or approved for issuance in the UK and Europe by TD Securities Limited in respect of investment business