20
2016: Issue 534, Week: 4th - 7th July Brand smc 358

2016: Issue 534, Week: 4th - 7th July
Bra
nd
sm
c 3
58


Contents
Equity 4-7
Derivatives 8-9
Commodity 10-13
Currency 14
IPO 15
FD Monitor 16
Insurance 17
Mutual Fund 18
SMC RESEARCH TEAMREGISTERED OFFICES:
11 / 6B, Shanti Chamber, Pusa Road, New Delhi 110005.
Tel: 91-11-30111000, Fax: 91-11-25754365
MUMBAI OFFICE:
Dheeraj Sagar, 1st Floor, Opp. Goregaon sports Club, Link Road
Malad (West), Mumbai 400064
Tel: 91-22-67341600, Fax: 91-22-28805606
KOLKATA OFFICE:
18,Rabindra Sarani, Poddar Court, Gate No-4,5th Floor, Kolkata-700001
Tel : 91-33-39847000 Fax No : 91-33-39847004
AHMEDABAD OFFICE :
10/A, 4th Floor, Kalapurnam Building, Near Municipal Market,
C G Road, Ahmedabad-380009, Gujarat
Tel : 91-79-26424801 - 05, 40049801 - 03
CHENNAI OFFICE:
Salzburg Square, Flat No.1, III rd Floor, Door No.107, Harrington Road,
Chetpet, Chennai - 600031.
Tel: 044-39109100, Fax -044- 39109111
SECUNDERABAD OFFICE:
206, 3rd Floor, above CMR Exclusive, Bhuvana Towers, S.D.Road,
Secunderabad - 500003
Tel: 91-40-30780298/99, 39109536
DUBAI OFFICE:
312, Belshalat Building, Al Karama, Dubai, P.O. Box 117210, U.A.E.
Tel: 97143963120, Mobile : 971502612483
Fax : 9714 3963122
Email ID : [email protected]
Printed and Published on behalf of
Mr. Saurabh Jain @ Publication Address
11/6B, Shanti Chamber, Pusa Road, New Delhi-110005
Website: www.smcindiaonline.com
Investor Grievance : [email protected]
Printed at: S&S MARKETING
102, Mahavirji Complex LSC-3, Rishabh Vihar, New Delhi - 110092 (India)
Ph.: +91-11- 43035012, 43035014, Email: [email protected]
n the week gone by, global stock markets regained their poise after a short bout of
volatility following last to last week's so-called Brexit vote; however, concerns Iremain about the longer-term global economic outlook and the potential for
renewed turmoil. Risk appetite buying prompted on speculation that central banks in
the UK, Japan and the European Central Bank may boost monetary stimulus to counter
a potential drag on the global economy from the Brexit. The mainland China stock
market also advanced, as risk appetite buying encouraged after Chinese authorities
pledged to keep its financial and capital market stable.
On the domestic market front, it is largely expected that Indian markets will continue
to take clue from the global markets; however, we expect market to remain positive.
The monsoon session of Parliament will commence from July 18 to August 12 and the
government is hopeful of passing of GST in this monsoon session. Market participants
will closely watch the progress of monsoon rains. Recently, the Union Cabinet has
cleared the National Mineral Exploration Policy (NMEP) that would allow private
companies to carry out standalone exploration for the first time and this boosted the
metal stocks. While, Realty and auto stocks moved higher on reports the Union
Cabinet has approved 7th Pay Commission's proposal to raise salaries and pensions for
central government employees. Going forward, macroeconomic data, trend in global
markets, investment by foreign portfolio investors (FPIs) and domestic institutional
investors (DIIs), the movement of rupee against the dollar and crude oil price
movement will dictate the trend of the market.
On the commodity market, safe haven buying may continue in the bullion counter and
base metal counter is expected to move higher on hope of stimulus from China.
Further, investors believe that given the latest event that has caused jitters and
uncertainty in the markets, the US Feds ambitions for two rate rises this year may be
placed on hold. Weather concerns will continue to propel natural gas higher as
according to NOAA, weather forecast for 6-10 days and 8-14 days shows extreme hot
condition. European leaders have asked Britain to act quickly to resolve the political
and economic confusion unleashed by the so-called Brexit vote. Now markets will
continue to monitor U.S. economic data for clues on the timing of the next rise in U.S.
interest rates. In the coming week, key data which can affect the metal and energy
complex are US factory orders, ISM Non-Manufacturing PMI (US), US Nonfarm payroll
data and US unemployment rate.
From The Desk Of Editor
(Saurabh Jain)
SMC Global Securities Limited is proposing, subject to receipt of requisite approvals, market conditions and other considerations, a further public offering of its equity shares and has filed the Draft Red Herring Prospectus with the Securities and Exchange Board of India (“SEBI”) and the Stock Exchanges. The Draft Red Herring Prospectus is available on the website of SEBI at www.sebi.gov.in and on the websites of the Book Running Lead Manager i.e., ICICI Securities Limited at www.icicisecurities.com and the Co- Book Running Lead Manager i.e., Elara Capital (India) Private Limited at www.elaracapital.com . Investors should note that investment in equity shares involves a high degree of risk and for details relating to the same, please see the section titled “Risk Factors” of the aforementioned offer document.
SMC Global Securities Ltd. (hereinafter referred to as “SMC”) is a registered Member of National Stock Exchange of India Limited, Bombay Stock Exchange Limited and its associate is member of MCX stock Exchange Limited. It is also registered as a Depository Participant with CDSL and NSDL. Its associates merchant banker and Portfolio Manager are registered with SEBI and NBFC registered with RBI. It also has registration with AMFI as a Mutual Fund Distributor.
SMC has applied with SEBI for registering as a Research Entity in terms of SEBI (Research Analyst) Regulations, 2014. SMC or its associates has not been debarred/ suspended by SEBI or any other regulatory authority for accessing /dealing in securities Market.
SMC or its associates including its relatives/analyst do not hold any financial interest/beneficial ownership of more than 1% in the company covered by Analyst. SMC or its associates and relatives does not have any material conflict of interest. SMC or its associates/analyst has not received any compensation from the company covered by Analyst during the past twelve months. The subject company has not been a client of SMC during the past twelve months. SMC or its associates has not received any compensation or other benefits from the company covered by analyst or third party in connection with the research report. The Analyst has not served as an officer, director or employee of company covered by Analyst and SMC has not been engaged in market making activity of the company covered by Analyst.
The views expressed are based solely on information available publicly available/internal data/ other reliable sources believed to be true.
SMC does not represent/ provide any warranty express or implied to the accuracy, contents or views expressed herein and investors are advised to independently evaluate the market conditions/risks involved before making any investment decision.

NEWS
DOMESTIC NEWS
Economy
• India's eight core industries, which have a weight of 37.90 percent in the Index of Industrial Production (IIP), grew by 2.8 percent in May 2016 as compared to the same month of the previous year. The core sector had grown by 8.5 percent in April 2016, by 6.4 percent in March 2016, by 5.7 percent in February and 2.9 percent in January.
• Petrol price was cut by 89 paise a litre and diesel by 49 paise a litre, the first decrease in rates in two months.
Mining
• Coal India and Solar Energy Corporation of India have signed two agreements for implementation of 200 MW Solar Power Project in the State of Madhya Pradesh for the beneficial utilisation of solar power by Northern Coalfields 100 MW and South Eastern Coalfields 100 MW two subsidiaries of Coal India each at an estimated cost of ̀ 650 crore.
Pharmaceuticals
• Suven Life Sciences has been granted one (1) product patent from Europe (2507225) and two (2) product patents from Eurasia (023293 and 023260) corresponding to the New Chemical Entities (NCEs) for the treatment of disorders associated with Neurodegenerative diseases and these Patents are valid through 2029, 2030 and 2031 respectively.
• RPG Life Sciences has forayed into the cosmetic market. The company has entered into a technical collaboration with Italian cosmetic leader Labo Cospropher. It is in-licensing two research -based products to be launched in the Indian cosmetic market in the month of July.
• Torrent Pharmaceuticals has entered into an agreement with Hyderabad based Glochem Industries to acquire the latter's bulk drug manufacturing unit at Vishakhapatnam along with a few drug master files as a going concern on slump sale basis.
Realty/ Infra
• Sobha will launch its first luxury apartment project, Sobha City in Delhi-NCR on 29 June 2016. The project is one of the largest group housing projects in Gurgaon which will offer best-in-class living experience to the customers.
Shipping
• Great Eastern Shipping Company has signed an MoA to purchase a secondhand capesize dry bulk carrier (2011 built) of about 179,250 dwt. The ship built at Hyundai Heavy Industries, is likely to join the Company's fleet in Q2 of FY 2017.
FMCG
• ITC will invest Rs 4,000 crore over the next 2-3 years to set up 8-9 factories across the country for manufacturing of food products.
Capital Goods
• Bharat Heavy Electricals Ltd (BHEL) has commissioned two units of 14 Megawatts each at Salma Hydro Electric Project in Afghanistan.
Information Technology
• Majesco announced that iSign Solutions Inc. has joined Majesco's partner ecosystem. Through this partnership, Majesco will use iSign's electronic signature solution to deliver Majesco's solutions to its insurance customers enhancing their digital footprint.
INTERNATIONAL NEWS
• Economic activity in the U.S. increased faster than previously estimated in the first quarter of 2016. The Commerce Department said the pace of growth in gross domestic product was upwardly revised to 1.1 percent from the previous estimate of 0.8 percent. The revised GDP growth in the first quarter compares to the 1.4 percent jump seen in the fourth quarter and the 1.0 percent increase expected by economists.
• US pending home sales index slid 3.7 percent to 110.8 in May from a downwardly revised 115.0 in April. Economists had expected the index to drop by 1.0 percent.
• US durable goods orders fell 2.2 percent in May. This followed a revised 3.3 percent increase in the previous month. Economists had expected a drop, but they had generally predicted a more modest retreat.
• US jobless claims rose to 268,000, an increase of 10,000 from the previous week's revised level of 258,000. Economists had expected jobless claims to edge up to 266,000 from the 259,000 originally reported for the previous week.
• Eurozone Consumer prices edged up 0.1 percent in June from prior year, offsetting a 0.1 percent fall in May. Prices increased for the first time in five months. Prices were expected to remain flat in June.
• The U.K. economy expanded as previously estimated in the first quarter. Gross domestic product grew 0.4 percent in the first quarter from previous three months, unrevised from the estimate published on May 26. It was slower than the 0.7 percent expansion seen in the fourth quarter of 2015.
Ex-Date Company Purpose
4-Jul-16 JSW Steel Dividend - Rs 7.50/- Per Share4-Jul-16 UltraTech Cement Dividend -Rs 9.50/- Per Share5-Jul-16 Sundaram Finance Dividend - Re 1/- Per Share5-Jul-16 LG Balakrishnan & Bros Dividend - Re 1/- Per Share7-Jul-16 Axis Bank Dividend-Rs 5/- Per Share7-Jul-16 Swaraj Engines Final Dividend - Rs 15/- And Special
Dividend - Rs. 18/-8-Jul-16 Cairn India Dividend - Rs 3/- Per Share8-Jul-16 Dewan Housing Finance
Corporation Final Dividend - Rs 2/- Per Share8-Jul-16 Abbott India Divided - Rs 35/- Per Share8-Jul-16 Tata Coffee Dividend Rs 1.30 Per Share8-Jul-16 MindTree Dividend Rs 3/- Per Share11-Jul-16 Exide Industries Dividend - Re 0.80/- Per Share11-Jul-16 GHCL Dividend - Rs 3.50/- Per Share11-Jul-16 Wipro Dividend - Re 1/- Per Share11-Jul-16 JSW Energy Dividend - Rs 2/- Per Share 11-Jul-16 The Jammu & Kashmir Bank Dividend - Rs 1.75/- Per Share12-Jul-16 Karur Vysya Bank Dividend -Rs 4/- Per Share13-Jul-16 Bharat Petroleum
Corporation Bonus 1:113-Jul-16 Ashok Leyland Dividend Re 0.95 Per Share14-Jul-16 Sun Pharmaceuticals
Industries Buy Back14-Jul-16 Bajaj Auto Dividend - Rs 5/- Per Share14-Jul-16 Kotak Mahindra Bank Divdend - Re 0.50/- Per Share15-Jul-16 Berger Paints (I) Bonus 2:515-Jul-16 Housing Development
Finance Corporation Dividend - Rs 14/- Per Share
Meeting Date Company Purpose
6-Jul-16 JBF Industries Results7-Jul-16 Zee Learn Results8-Jul-16 The South Indian Bank Results11-Jul-16 IndusInd Bank Results/Others14-Jul-16 Cyient Results15-Jul-16 Steel Strips Wheels Results
FORTHCOMING EVENTS
NOTES:1) These levels should not be confused with the daily trend sheet, which is sent every morning by e-mail in the name
of "Morning Mantra ".2) Sometimes you will find the stop loss to be too far but if we change the stop loss once, we will find more strength
coming into the stock. At the moment, the stop loss will be far as we are seeing the graphs on weekly basis and taking a long-term view and not a short-term view.
TREND SHEET
Stocks *Closing Trend Date Rate SUPPORT RESISTANCE Closing
Price Trend Trend
Changed Changed
S&P BSE SENSEX 27145 UP 13.04.16 25627 25600 25100
NIFTY50 8328 UP 13.04.16 7850 7900 7700
NIFTY IT 11098 UP 23.03.16 11207 10900 10700
NIFTY BANK 17986 UP 18.03.16 15655 17000 16400
ACC 1617 UP 18.03.16 1337 1550 1520
BHARTIAIRTEL 368 UP 04.03.16 332 350 340
BHEL* 132 DOWN 13.08.15 259 - 135
CIPLA 509 DOWN 03.09.15 691 520 530
DLF 151 UP 04.03.16 108 130 120
HINDALCO 125 UP 11.03.16 84 110 105
ICICI BANK 240 UP 10.06.16 253 235 230
INFOSYS** 1172 UP 04.03.16 1173 - 1150
ITC 252 UP 18.03.16 325 230 220
L&T 1543 UP 22.04.16 1265 1410 1380
MARUTI 4165 UP 20.05.16 3927 3980 3900
NTPC 157 UP 13.04.16 137 145 140
ONGC 225 DOWN 17.10.14 397 225 235
RELIANCE 973 DOWN 29.04.16 983 980 1000
TATASTEEL 328 UP 04.03.16 289 315 300
S/l
4
®
Closing as on 01-07-2016*BHEL has broken the resistance of 125**INFY has broken the support of 1180The price of ITC has been adjusted according to bonus of 1:2

BSE SENSEX GAINERS & LOSERS TOP (% Change) NSE NIFTY GAINERS TOP & LOSERS (% Change)
SECTORAL INDICES (% Change)
SMC Trend
FMCGHealthcare
Auto BankRealty
Cap GoodsCons Durable
Oil & GasPower
ITMetal
Down SidewaysUp
GLOBAL INDICES (% Change)
INDIAN INDICES (% Change)
5
®
SMC Trend
Nifty Sensex BSE Midcap BSE Smallcap Nifty Junior S&P CNX 500
SMC Trend
FTSE 100CAC 40
NasdaqDow jonesS&P 500
NikkeiStrait times
Hang SengShanghai
8.73
7.99
7.24 7.08 7.04
-2.18 -1.99-1.54
-0.81-0.26
-4.00
-2.00
0.00
2.00
4.00
6.00
8.00
10.00
Grasim Inds B H E L Dr Reddy's Labs
Idea Cellular Bosch Tata Motors-DVR
Infosys HCL Technologies
TCS Tech Mahindra
8.497.95
7.40
5.24 4.90
-1.99
-0.77
-4.00
-2.00
0.00
2.00
4.00
6.00
8.00
10.00
Jindal Steel B H E L Dr Reddy's Labs
Cipla NTPC Infosys TCS
-632.60
1611.80
602.92343.56
19.6680.40
54.00130.20
-1000.00
-500.00
0.00
500.00
1000.00
1500.00
2000.00
Friday Monday Tuesday Wednesday Thursday
FII / FPI Activity MF Activity
2.462.28
3.57
4.63
4.20
3.03
0.00
0.50
1.00
1.50
2.00
2.50
3.00
3.50
4.00
4.50
5.00
Nifty Sensex BSE Midcap BSE Smallcap
Nifty Next 50
S&P CNX 500
-0.94
2.96 3.12
4.043.72 3.79 3.80
4.03
3.62
4.55
7.68
-2.00
-1.00
0.00
1.00
2.00
3.00
4.00
5.00
6.00
7.00
8.00
9.00
Auto Index Bankex Cap Goods Index
Cons Durable Index
FMCG Index Healthcare Index
IT Index Metal Index Oil & Gas Index
Power Index Realty Index
2.863.04 3.02
4.17
3.86
2.64 2.64
5.96
3.18
0.00
1.00
2.00
3.00
4.00
5.00
6.00
7.00
Nasdaq Comp. Dow Jones S&P 500 Nikkei Strait Times Hang Seng Shanghai Comp.
FTSE 100 CAC 40
INSTITUTIONAL ACTIVITY (Equity) (` Crore)

Beat the street - Fundamental Analysis
Above calls are recommended with a time horizon of 8 to 10 months. Source: Company Website Reuters Capitaline
6
®
TRIVENI TURBINES LIMITED CMP: 119.55 Upside: 18%Target Price: 141.00
Investment Rationale with a keen focus on delivered product and life-?Triveni Turbine Limited offers steam turbine cycle cost has allowed Triveni Turbines to set
solutions for Industrial Captive and Renewable benchmarks for efficiency, robustness and up-Power. The Company manufactures world class time of the turbine.steam turbines up to 100 MW that enable ?Currently the exports of the company spread customers to achieve unhindered performance across various geographies Europe, turkey, SEA, and power self-sufficiency at an optimal cost South African Development region. while minimising environmental impact. ?The company believes the various Government
?The company has a capex for FY17 will be around initiatives should help to turn-around the capital `45-50 crore. goods sector and the domestic market is expected to
?Consolidated order book of the company as end of show some growth towards the second half of FY 17. March 2016 stood at `802.6 crore. Consolidated Valuationorder book includes the order booked by With a strong order book for execution and a strong international subsidiaries of the company as well enquiry pipeline from international market both for as that of GE Triveni (GETL). The standalone order product and aftermarket, it is believed that the book as end of March 2016 stood at `664 crore, a growth rate in consolidated performance of the growth of 10%. Strong growth in order booking Company in coming year will be good, thus it is despite subdued domestic market is due to higher expected that the stock will see a price target of ̀ 141 export order bookings. Higher export order in 8 to 10 months time frame on a three year average bookings is largely due to company's expanded P/E of 36.06x and FY17 (E) earnings of ̀ 3.9.market reach with the company entering newer markets as well as strategy of it to cater to all the major user segments.
?The progress in the joint venture with GE, GE Triveni Ltd. (GETL), has been encouraging. The JV successfully despatched its first large sized turbine which enabled the JV to achieve higher turnover in comparison to the previous year. The execution of orders in the international territories during FY 17 will help the JV to have references for future orders. The outlook of the Joint Venture going forward is positive.
?The customer centric approach to R&D, along
Face Value (`) 1.00
52 Week High/Low 133.20/87.50
M.Cap (`Cr.) 3944.82
EPS (`) 2.61
P/E Ratio (times) 45.80
P/B Ratio (times) 17.25
Dividend Yield (%) 0.92
Stock Exchange BSE
% OF SHARE HOLDING
P/E Chart
` in cr
Actual EstimateFY Mar-15 FY Mar-16 FY Mar-17
Revenue 645.70 786.00 910.70
EBITDA 122.50 169.80 197.60
EBIT 106.80 153.70 191.10
Net Income 93.33 107.60 129.00
EPS 2.82 3.26 3.90
BVPS 6.93 8.87 11.27
ROE (%) 46.22 36.80 37.90
VALUE PARAMETERS
Investment Rationale driven by better volume growth and operational performance despite lower other income for •The management of the company has given a quarter ended March 2016. Revenue increased 14% guidance of 4.6 million units for total volumes in to `5,411.4 crore in January-March quarter. FY 16-17 vis a vis volume of 3.9 million units in FY Revenue increased 14% to `5,411.4 crore in 15-16, a growth of around 18%.January-March quarter against `4,739.3 crore in •The company expects the overall domestic corresponding period of last fiscal, supported by motorcycle market to grow @ around 6-7% in sales volume that was up 11.5% (at 8.72 lakh units).FY16-17. The company expects the total industry
Valuation(2 and 3W together) to grow @ around 7-10% in FY16-17. The company has set an ambitious With strong volume growth expected in the next two target for its domestic motorcycle volumes at years, management expects the volume run-rate for ~2.6 million in FY17E (from 1.9 million in FY16E). Avenger to improve from 25,000 units per month to It plans to achieve this mainly through Avenger & 30,000 in coming quarters. V15 is also expected to V15, whose monthly run rate is expected at touch 30,000 units per month and the company is in a 25,000-30,000 units. The company is also going to position to increase capacity given fungibility launch refreshed versions of Platina/Pulsar & between products, thus it is expected that the stock ~400 cc Pulsar. will see a price target of ̀ 3122 in 8 to 10 months time
frame on a three year average P/E of 22.02x and FY17 •The company aims to create a new segment 'M3' (E) earnings of ̀ 141.76.with its recently launched V15 (150 cc). The
strategy will be to move consumers from the M2 segment to either M1 or M3.
•It has given a volume guidance of 3-W exports at ~250,000 units for FY16-17 vis a vis FY 15-16 figure of 281,719 units. Domestic 3-W volumes are expected to increase to ~ 300,000 units in FY16-17 from 253,610 units). The company has given a guidance of ~10,000 units for quadricycle exports in FY17. The growth in domestic 3W is expected to be on the back of new permits (~54,000 permits in FY17), entry in cargo 3-W in Q4FY16 & ongoing success in diesel segment.
•Company's net profit jumped 29% to `803 crore
P/E Chart
BAJAJ AUTO LIMITED CMP: 2686.25 Upside: 16%Target Price: 3122.00
Face Value (`) 10.00
52 Week High/Low 2702.55/2133.15
M.Cap (`Cr.) 77732.02
EPS (`) 98.41
P/E Ratio (times) 27.30
P/B Ratio (times) 7.01
Dividend Yield (%) 2.05
Stock Exchange BSE
` in cr
% OF SHARE HOLDING
VALUE PARAMETERS
Actual EstimateFY Mar-15 FY Mar-16 FY Mar-17
Revenue 21,103.90 22,252.80 25,517.20EBITDA 4,116.60 4,779.60 5,427.00EBIT 3,849.20 4,472.40 5,228.80Pre-Tax Profit 4,425.10 5,385.20 6,032.50Net Income 3,154.00 3,652.40 4,096.20EPS 108.96 126.20 141.76BVPS 369.50 424.78 496.88ROE (%) 31.10 31.80 30.20
17.67
8.65
6.95
49.29
17.45
Foreign
Institutions
Non Promoter Corporate Holding
Promoters
Public & Others
20.3 3.84
0
70.01
5.86 Foreign
Institutions
Non Promoter Corporate Holding
Promoters
Public & Others

Charts by Spider Software India Ltd
7
EQUITY
Above calls are recommended with a time horizon of 1-2 months
Disclaimer : The analyst and its affiliates companies make no representation or warranty in relation to the accuracy, completeness or reliability of the information contained in its research. The analysis contained in the analyst research is based on numerous assumptions. Different assumptions could result in materially different results.The analyst, not any of its affiliated companies, not any of their members, directors, employees or agents accepts any liability for any loss or damage arising out of the use of all or any part of the analysis research.
SOURCE: CAPITAL LINE
®
The stock closed at `37.95 on 01stJuly 2016. It made a 52-week low at `16 on
12th February 2016 and a 52-week high at `38.25 on 29th June 2016. The 200
days Exponential Moving Average (EMA) of the stock on the daily chart is
currently at ̀ 25.80.
It has formed double bottom at lower levels and then it never looked back which
shows its potential to move further upwards in near term. Moreover, with the
increase in price and volume has also increased which further shows its
inclination to move northwards. One can buy in the range of 34-35 levels for the
target of 40-43 levels with SL of 32 levels.
Mercator Limited
The stock closed at ̀ 50.60 on 01st July 2016. It made a 52-week low at ̀ 35.15 on
12th February 2016 and a 52-week high of ̀ 61.35 on 03rd July 2015. The 200 days
Exponential Moving Average (EMA) of the stock on the daily chart is currently at
`45.95.
It has formed Inverted head and shoulder pattern which is bullish in nature. One
can buy in the range of 48-49 levels for the target of 57-60 levels with strict SL of
45 levels.
Rashtriya Chemicals and Fertilizers Limited

DERIVATIVES
CHANGE IN NIFTY OPTION OI (IN QTY)
WEEKLY VIEW OF THE MARKET
NIFTY OPTION OI CONCENTRATION (IN QTY)
CHANGE IN BANKNIFTY OPTION OI (IN QTY)BANKNIFTY OPTION OI CONCENTRATION (IN QTY)
®
Nifty regained strength with FII's buying, short covering and improved sentiments. This week, Nifty bounced more than 300 points from weekly lows of 8040 and closed near the highest point of week. Weekly closing above resistance of 8300 levels helped nifty to regain fresh momentum. The July series started with average rollover of 77.74 % via 3 month average of 74.83% and Market wide rollover was at 82.98% via 3 month average of 84.01%. The Nifty future started the series with OI of 1.95 crore shares with premium of 33 points. Hereafter, the range of 8200-8500 will remain crucial for coming week, and the move is expected to remain positive as indicated by option open interest concentration and positive rollovers. If Nifty crosses over the 8350 mark, it could surge to 8500 levels due to increased buying pressure. On the flip side, the index has strong buying support at 8200 levels. The put-call ratio of open interest closed up at 0.97. The options open interest concentration continued to be at the 8500-strike call with the highest open interest of above 44 lakh shares. Among put options, the 8000-strike taking the total open interest to 45 lakh shares, with the highest open interest among put options. The implied volatility (IV) of call options closed at 14.80%, while the average IV of put options closed at 14.87%. VIX Index, declined to 17.36 from 18.28. For coming week, market is likely to trade in positive trend, but as Nifty is overbought hence some profit booking cannot be ruled out. Every dip should be used to initiate fresh longs. Banks, NBFC, FMCG and Oil & gas sectors are likely to outperform in coming week.
In lakhs
In 10000 In 10000
MARICO (JUL FUTURE)
Buy: Above `269
Target: `279
Stop loss: `265
JETAIRWAYS
Buy JUL 540. PUT 20.00
Sell JUL 520. PUT 12.00
Lot size: 1000
BEP: 532.00
Max. Profit: 12000.00 (12.00*1000)
Max. Loss: 8000.00 (8.00*1000)
OPTIONSTRATEGY
FUTURE
BHEL
Buy JUL 135. CALL 4.65
Sell JUL 140. CALL 2.95
Lot size: 5000
BEP: 136.70
Max. Profit: 16500.00 (3.30*5000)
Max. Loss: 8500.00 (1.70*5000)
TCS
Buy JUL 2450. PUT 47.00
Sell JUL 2400. PUT 32.00
Lot size: 250
BEP: 2435.00
Max. Profit: 8750.00 (35.00*250)
Max. Loss: 3750.00 (15.00*250)
DERIVATIVE STRATEGIES
M&MFIN (JUL FUTURE)
Buy: Above `359
Target: `369
Stop loss: `354
BAJAJ-AUTO (JUL FUTURE)
Buy: Above `2715
Target: `2795
Stop loss: `2675
BULLISH STRATEGY BEARISH STRATEGY
Call Put
11
.32
7.3
2
8.6
1
15
.06
13
.11
14
.83 1
9.2
1
29
.28
38
.02
27
.23
12
.77
24
.46
21
.56
18
.99
38
.12
25
.25
21
.79
10
.92
7.1
1 11
.02
1.2
5
9.8
3
0.00
5.00
10.00
15.00
20.00
25.00
30.00
35.00
40.00
45.00
7500 7800 7900 8000 8100 8200 8300 8400 8500 8700 9000
Call Put
5.4
4
2.6
0
4.9
5
8.1
2
5.6
6
4.7
1
8.1
3
8.4
5
9.0
1
20
.03
6.6
58.0
9
8.2
9 9.7
4
18
.65
19
.01
15
.94
8.1
7
3.9
2
2.5
2
1.1
9
7.5
1
0.00
5.00
10.00
15.00
20.00
25.00
7500 7800 7900 8000 8100 8200 8300 8400 8500 8700 9000
Call Put
6.1
3
1.1
2 3.2
0
2.3
9
8.8
1
8.9
0
1.2
1
19
.94
14
.81
8.4
7
1.9
0
6.0
8
2.7
2
7.9
1
12
.72
20
.48
17
.30
1.1
0
10
.56
1.8
3
2.6
7
0.1
8
0.00
5.00
10.00
15.00
20.00
25.00
15000 15500 16000 16500 17000 17500 17800 18000 18500 19000 19500
Call Put
5.7
9
1.0
6 2.4
0
2.0
7
6.0
3
4.8
8
1.1
3
11
.53
8.6
1
5.2
0
1.2
8
5.4
3
1.2
6
3.6
4
6.6
1
14
.77
13
.70
1.0
9
9.0
0
1.0
6
2.6
1
0.1
8
0.00
2.00
4.00
6.00
8.00
10.00
12.00
14.00
16.00
15000 15500 16000 16500 17000 17500 17800 18000 18500 19000 19500
8
In lakhs

9
DERIVATIVES
®
FII’s ACTIVITY IN DERIVATIVE SEGMENT
SENTIMENT INDICATOR (NIFTY)
30-Jun 29-Jun 28-Jun 27-Jun 24-Jun
Discount/Premium 33.30 32.65 38.70 39.80 29.75
PCR(OI) 0.97 0.99 0.94 0.91 0.88
PCR(VOL) 1.08 1.12 1.15 1.00 0.87
A/D RATIO(Nifty 50) 7.17 5.25 1.45 1.63 0.19
A/D RATIO(All FO Stock)* 5.12 4.70 2.73 3.67 0.18
Implied Volatality 14.80 14.21 16.23 16.74 16.92
VIX 16.29 16.16 17.73 18.53 18.53
HISTORY. VOL 17.36 17.23 17.31 17.75 18.28
*All Future Stock
SENTIMENT INDICATOR (BANKNIFTY)
30-Jun 29-Jun 28-Jun 27-Jun 24-Jun
Discount/Premium 67.20 90.25 69.80 49.60 45.85
PCR(OI) 1.09 1.09 1.07 1.01 0.91
PCR(VOL) 1.02 1.15 1.17 0.81 0.64
A/D RATIO(BANKNIFTY) 11.00 5.00 2.00 3.00 0.09
#A/D RATIO 18.00 5.33 3.75 5.33 0.12
Implied Volatality 18.34 17.95 20.32 21.12 20.97
HISTORY. VOL 21.76 21.49 21.81 22.43 22.98
FII’S ACTIVITY IN NIFTY FUTURE
**The highest call open interest acts as resistance and highest put open interest acts as support.# Price rise with rise in open interest suggests long buildup | Price fall with rise in open interest suggests short buildup # Price fall with fall in open interest suggests long unwinding | Price rise with fall in open interest suggests short covering
# All BANKING Future Stock
Top 10 short build up
In Cr. In Cr.
Top 10 long build up
LTP % Price Change Open interest %OI Chng
BEL 1262.3 1.22% 1436850 47.55%
DHFL 203.4 4.15% 11745000 44.76%
ABIRLANUVO 1228.5 16.29% 1889250 44.44%
DISHTV 98.5 6.09% 27888000 40.96%
OIL 355.15 1.59% 853400 36.76%
JPASSOCIAT 8.95 21.77% 193256000 36.71%
JSWENERGY 82.65 3.25% 18184000 35.24%
BIOCON 747.1 4.86% 3176800 34.45%
ICIL 975.1 5.31% 468600 33.69%
CAIRN 138.45 4.18% 13422500 33.56%
LTP % Price Change Open interest %OI Chng
TATAELXSI 1697.25 -1.12% 1031100 37.21%
TATAMTRDVR 293.8 -1.39% 18249000 23.31%
JUSTDIAL 610.15 -2.22% 1840800 10.43%
HCLTECH 735.95 -1.13% 7100800 6.82%
HEXAWARE 230.6 -0.19% 4770000 6.66%
- 43
9
- 13
36
- 57
0
- 49
7
32
0
-17
68
- 28
7
- 79
2
68
3
28
40
-2000
-1000
0
1000
2000
3000
4000
17-Jun 20-Jun 21-Jun 22-Jun 23-Jun 24-Jun 27-Jun 28-Jun 29-Jun 30-Jun
- 12
73
-2
10
7 - 11
93 - 5
06
11
29
56
7
- 76
7
26
8
16
71
51
64
-3000
-2000
-1000
0
1000
2000
3000
4000
5000
6000
17-Jun 20-Jun 21-Jun 22-Jun 23-Jun 24-Jun 27-Jun 28-Jun 29-Jun 30-Jun

10
®
Turmeric futures (July) is expected to trade in the range of 8200-8450. Lack of domestic demand and good rainfall in turmeric growing belts may weigh on market sentiments. The sowing is now picking up in Andhra Pradesh, Karnataka and Telangana after the progress of monsoon. But other side rainfall is slowing down the turmeric supply and dwindling arrivals of quality turmeric may support the prices. Cardamom futures (July) is likely to trade in the range of 830-890 levels on mixed fundamentals. Lower production estimate and expectation of delayed arrivals of new crop in august may support the prices. But heavy rain falls in Kerala, which can improve the output condition, may weigh negative sentiments on the market. Jeera futures (July) is likely to remain higher side and the prices may test 18500 levels. The supply of cumin seed in the coming days is likely to drop due to lower production in this season and this has prompted big consumers to stock up the commodity for their long term requirements. However, some correction due to profit booking at higher level as daily arrivals may rise in coming days after better price realization because the prices rose over 11 percent in last month due to strong domestic and exports demand. Coriander futures (July) is likely to gain towards 7500 levels due to supply shortage, improved overseas demand and quality seed availability. Most of the stocks are now in the hands of stockists and they are reluctant to offload their produce at the lowest level, which may later on led to short supply and may spur prices.
SPICES
Soybean futures (July) is expected to take support near 3600 levels. Increasing sowing in key regions in Maharashtra and Madhya Pradesh amid progress of monsoon and lackluster demand of oil meals in the domestic market may hurt the sentiments. But soybean and other kharif oilseed production may be less this year as after two successive drought farmers may shift to pulses. Farmers are still worried about the slow progress of monsoon. As per Ministry of Agriculture, Soybean cultivation in the country as on June 24 was just at 2 lakh hectares, sharply down from 20 lakh hectares last year, which may support market sentiments. Mustard futures (July) is likely to trade sideways in the range of 4600-4800 levels. The lower production estimate of 42-45 lakh tonnes against the earlier estimate of 48-52 lakh tonnes and dwindling arrivals may support the prices. The prices are also getting support on reports of late sowing for Kharif crops like soybean while lower prices of rival veg oil in the domestic market may restrict any major gains. Refined soy oil futures (July) is expected to trade in the range of 625-650. Adequate stock position on higher supplies from producing regions and weak trend in overseas rival veg oil markets is fuelling the downtrend. But demand for edible oil may pick up during the monsoon, when temperature drops. CPO futures (July) is expected to move in the range of 490-520 with downside bias sue to sluggish demand in the spot market and overseas cues. The sentiments of edible oil counters are bearish on the international market owing to lower Malaysian palm oil export. According to Cargo surveyor Intertek Agri Services, Malaysia's palm oil exports during the June 1-30 period are estimated down 8.35% on the month at 1,130,127 metric tons.
OIL AND OILSEEDS
OTHER COMMODITIES
Maize futures (July) is expected to trade sideways with negative bias as Additional margin of 5% (in Cash) on Long side and Short side and Special Margin of 10% (in Cash) on the Long side has been imposed on all running contracts of Maize Rabi with effect from July 4, 2016. But prices can take support near 1480 level. Lower maize production in the country in 2015-16 and Lower acreage due to back-to-back droughts may support the counter. Farmers have already sold most of their crops. So the Lower availability in spot market till October may remain bullish when the new kharif crop hits the markets. Kapas futures (April) is likely to remain stable in the range of 890-970 levels. The prices may get support from lower acreage in this season. As on June 27, 2016, cotton sowing was complete on 2.53 lakh hectares of land in Punjab 25 percent lower than 3.39 lakh hectares in the corresponding year ago period, according to data released by the agriculture department of Punjab. However the counter may pressurized due to lower buying and higher import by domestic mills. The uptrend in sugar futures (July) is likely to test 3750 level on global cues. Raw sugar futures on the ICE rallied to the highest in more than 3-1/2 years on concerns over heavy rainfall in Brazilian growing areas. But in domestic market, producers are also easing their stocks considering cost and parity, keeping the flow of the commodity ample in the markets. Guar complex is likely to trade higher on concern of decline in sowing area due to lower realization in last season. Any major upside in crude oil price will be push Guar prices higher. Guarseed (July) is likely to test 3300 while guargum (July) may reach at 5800 level.
Bullion counter is expected to continue its bullish momentum amid safe haven buying after Brexit and slow growth in China. Recently silver outperformed gold and gold, silver ratio dropped from 75 levels to below 69.5 levels. This ratio can further dip towards 68 levels in the near term. Meanwhile, SPDR gold trust holdings and physical demand will also give further direction to the prices. Recently, an increase in investment demand has supported its prices. Meanwhile weaker local currency rupee can also support the domestic prices as it can move in the range of 67-68 levels in MCX. Gold can trade in the range of 31000-32000 while silver (Sep) can move in the range of 44000-47000 in the near term. In Brussels, European Council president Donald Tusk stated in the EU Summit that it will not start the divorce process on any future negotiations with the U.K. until the country invokes Article 50 of the Lisbon Treaty. It came one day after U.K. Prime Minister David Cameron said he will leave the task to his successor when he steps down from the position by early-September. Holdings in SPDR Gold Trust, the world's largest gold-backed exchange-traded fund, rose to 950.05 tonnes in the last week the highest since July 2013, suggesting strong confidence of the investors in gold despite being up by nearly 20 % from the start of the year. The widespread expectations of fresh stimulus announcements from some central banks to ensure the growth post Brexit, is likely to keep the investors inclined towards the gold. The emerging expectations of no rate hike till 2018 and even a rate cut by the Federal reserve in the next meetings has suddenly changed the dynamics for gold and started to make it more attractive even at higher prices.
BULLIONS
Crude oil prices can trade on a volatile path. Recently it dipped lower after Britain exited from euro zone, but supply disruptions and improved demand outlook have lifted the prices higher. Overall, it can move in the range of 3100-3400 in MCX. According to the DoE, crude oil inventories for the week ended 24th June 2016, decline by 4.053 million barrels and API data shows decline in inventory by 3.86 million barrels. Iraq's oil exports are set to decline in June for a second month, according to loading data and an industry source, adding to signs that supply growth from OPEC's second-largest producer is slowing this year. Iraq in 2015 provided the biggest rise in supply from the Organization of the Petroleum Exporting Countries. Strike by workers in Norway and the political crisis in Venezuela are push factors for oil prices to trade higher. Traders, however, have been concerned about a potential slowdown in energy demand in the wake of the U.K.'s vote to leave the European Union, and a likely recovery in global output levels. Natural gas may trade on upside path as it can move in the range of 185-215 in MCX. The combination of hot weather and higher gas usage per degree of demand has been practically made-to-order for the oversupplied gas market, and has led to record power burn in June to date. The energy department expects production will grow by 1 per cent in 2016, the slowest pace in years. The gas market is now in the midst of “injection season”, when surplus supplies are pumped underground. Heat in some regions has driven up gas use in power plants, slowing the pace of injections.
ENERGY COMPLEX
Base metal counter can trade higher as lower than expected PMI data last week raised stimulus hopes from China. China manufacturing Purchasing Managers' Index (PMI), came in at 50.0 last month, versus 50.1 logged in May and April. Caixin's China June manufacturing PMI reported a 48.6 reading for June, compared with 49.2 in May. Copper may move in the range of 315-340. China may add 4% refined copper production at a slower pace than in 2015 and also planning to increase the global supply by 2020 to 43.5%. Peru's shipment in first 3 months of China's copper surged 93% of total imports crossing Chile. Lead can hover in the range of 115-125. Zinc can move in the range of 134-150. Zinc hit 11-1/2 month highs of above its $2,105 top as shrinking mine supply flags a shortfall in future metal, after several big mines closed last year. Aluminum can move in the range of 106-115. Xinjiang's primary aluminum output jumped 44% to 6.12 million tonnes last year; accounting 20% of China's production and is expected to increase more in this year. Nickel may remain in the range of 610-670. Philippines review of mining claims may lead to a large fall in Nickel ore production which results shortage in China's nickel pig iron (NPI). Indonesia's ban on ore exports led many to believe the volatile metal is entering a bull market. Meanwhile the prospects for the steelmaking ingredient Nickel “the market will gradually begin to tighten as elevated Chinese imports start to erode global stockpiles, but investor sentiment towards industrial metals will remain cautious as Chinese economic data will continue to disappoint.”
BASE METALS
11
TECHNICAL RECOMMENDATIONS
COMMODITY
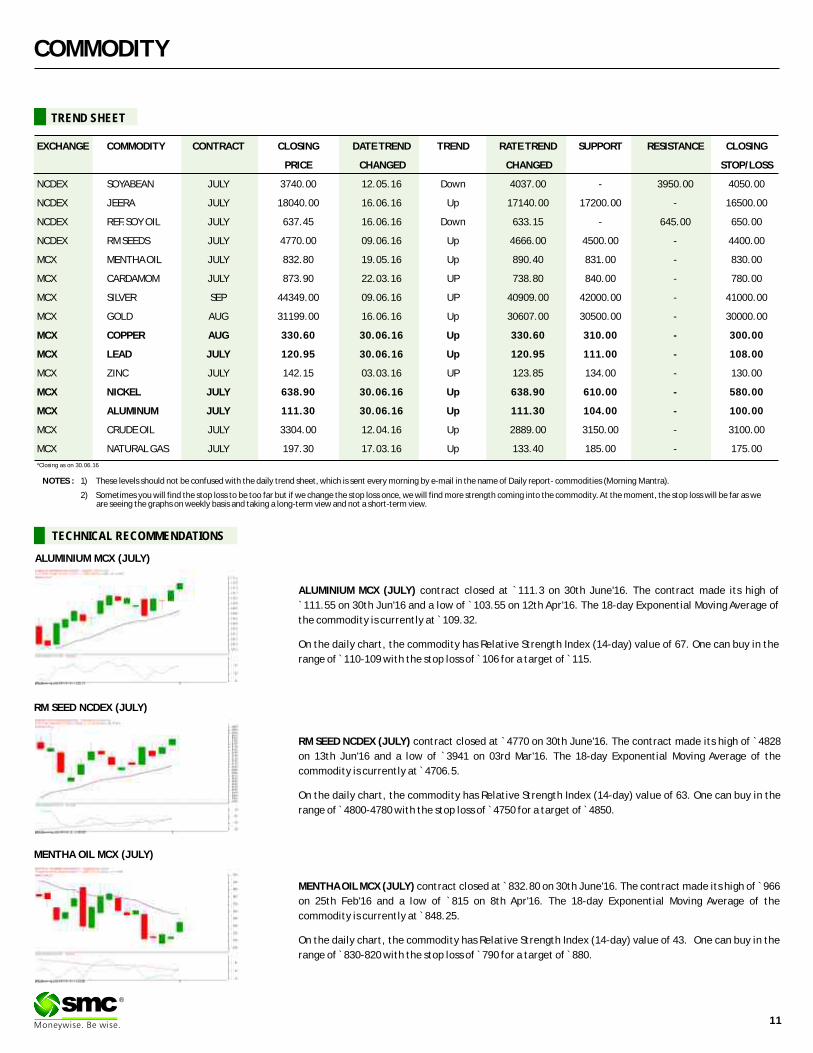
ALUMINIUM MCX (JULY) contract closed at `111.3 on 30th June'16. The contract made its high of
`111.55 on 30th Jun'16 and a low of ̀ 103.55 on 12th Apr'16. The 18-day Exponential Moving Average of
the commodity is currently at ̀ 109.32.
On the daily chart, the commodity has Relative Strength Index (14-day) value of 67. One can buy in the
range of ̀ 110-109 with the stop loss of ̀ 106 for a target of ̀ 115.
RM SEED NCDEX (JULY) contract closed at 4770 on 30th June'16. The contract made its high of 4828
on 13th Jun'16 and a low of `3941 on 03rd Mar'16. The 18-day Exponential Moving Average of the
commodity is currently at ̀ 4706.5.
On the daily chart, the commodity has Relative Strength Index (14-day) value of 63. One can buy in the
range of ̀ 4800-4780 with the stop loss of ̀ 4750 for a target of ̀ 4850.
` `
MENTHA OIL MCX (JULY) contract closed at 832.80 on 30th June'16. The contract made its high of 966
on 25th Feb'16 and a low of `815 on 8th Apr'16. The 18-day Exponential Moving Average of the
commodity is currently at ̀ 848.25.
On the daily chart, the commodity has Relative Strength Index (14-day) value of 43. One can buy in the
range of ̀ 830-820 with the stop loss of ̀ 790 for a target of ̀ 880.
` `
®
ALUMINIUM MCX (JULY)
RM SEED NCDEX (JULY)
MENTHA OIL MCX (JULY)
NOTES : 1) These levels should not be confused with the daily trend sheet, which is sent every morning by e-mail in the name of Daily report- commodities (Morning Mantra).
2) Sometimes you will find the stop loss to be too far but if we change the stop loss once, we will find more strength coming into the commodity. At the moment, the stop loss will be far as we are seeing the graphs on weekly basis and taking a long-term view and not a short-term view.
EXCHANGE COMMODITY CONTRACT CLOSING DATE TREND TREND RATE TREND SUPPORT RESISTANCE CLOSING
PRICE CHANGED CHANGED STOP/LOSS
NCDEX SOYABEAN JULY 3740.00 12.05.16 Down 4037.00 - 3950.00 4050.00
NCDEX JEERA JULY 18040.00 16.06.16 Up 17140.00 17200.00 - 16500.00
NCDEX REF.SOY OIL JULY 637.45 16.06.16 Down 633.15 - 645.00 650.00
NCDEX RM SEEDS JULY 4770.00 09.06.16 Up 4666.00 4500.00 - 4400.00
MCX MENTHA OIL JULY 832.80 19.05.16 Up 890.40 831.00 - 830.00
MCX CARDAMOM JULY 873.90 22.03.16 UP 738.80 840.00 - 780.00
MCX SILVER SEP 44349.00 09.06.16 UP 40909.00 42000.00 - 41000.00
MCX GOLD AUG 31199.00 16.06.16 Up 30607.00 30500.00 - 30000.00
MCX COPPER AUG 330.60 30.06.16 Up 330.60 310.00 - 300.00
MCX LEAD JULY 120.95 30.06.16 Up 120.95 111.00 - 108.00
MCX ZINC JULY 142.15 03.03.16 UP 123.85 134.00 - 130.00
MCX NICKEL JULY 638.90 30.06.16 Up 638.90 610.00 - 580.00
MCX ALUMINUM JULY 111.30 30.06.16 Up 111.30 104.00 - 100.00
MCX CRUDE OIL JULY 3304.00 12.04.16 Up 2889.00 3150.00 - 3100.00
MCX NATURAL GAS JULY 197.30 17.03.16 Up 133.40 185.00 - 175.00
TREND SHEET
*Closing as on 30.06.16
COMMODITY
NEWS DIGEST
In the week gone by, bullion counter extended its upside momentum amid safe haven buying
after Brexit. Base metal counter also accelerated higher last week as China's infrastructure
investment in the first five months of 2016 grew 19.8 percent year on year, accelerating
slightly from Jan-April and faster than 17.3 percent in 2015. China's economy rebounded in the
second quarter, with capital expenditures recovering from 5-year lows, as higher government
spending helped boost the property and construction sectors. U.S. consumer spending rose for
a second straight month in May on increased demand for automobiles and other goods, but
there are fears Britain's vote to exit the EU could hurt confidence and prompt households to
cut back on consumption. Meanwhile Peru's shipment in first 3 months of China's copper surged
93% of total imports crossing Chile. China's refined copper imports in May fell by 7% to 319,255
tonnes while its first 5 months imports rose by 24.5% to 1.77 million tonnes. Natural gas tested
the key level of 200 amid hot weather concerns. While Crude oil traded on a volatile path.
According to EIA, the global supply demand for crude oil is in balance.
In Agri counter, sugar traded sideways last week. Government and industrial bodies have
pegged lower production in upcoming season due to lower crop size in Maharashtra and
Karnataka. Domestic Sugar production in current season has tumbled from 283 lakh tonnes to
near about 246 lakh tonnes whereas it likely to drop up to 230 lakh tonnes in upcoming season
as per different industrial sources. Soya counter recovered in later part of the week while RM
seed hold on to its gains. According to Solvent Extractors Association, in May'16 soyoil imports
in India were around 178,064 MT down by 38.4% on y/y and 48.9% on m/m. As per NOPA,
soybean crushing for the month of May'16 was at 152.28 million bushels a year ago during the
same time it was 148.416 million bushels. According to Solvent Extractors' Association around
3090 MT of RM Seed Oil meals were exported in May'16 down by 92% on y/y. Guar complex
ended on a positive note. Emerging export enquires from US may spur millers from fresh buying
in coming days, which helped futures prices to move up. Total arrivals were reported around 72
MT in key market in Rajasthan, whereas spot price for guar seed quoted at `3,015/quintal in
Barmer market.
WEEKLY COMMENTARY
COMMODITY UNIT 30.06.16 DIFFERENCEQTY. QTY.
29MM COTTON NEW BALES 17800.00 5500.00 -12300.00BARLEY MT 10755.00 10745.00 -10.00CASTOR SEED MT 2563.00 20.00 -2543.00CHANA MT 1094.00 473.00 -621.00CORIANDER NEW MT 3667.00 4056.00 389.00COTTON SEED OILCAKE MT 36156.00 36086.00 -70.00GUARGUM MT 35564.00 33529.00 -2035.00GUARSEED MT 30681.00 29553.00 -1128.00JEERA NEW MT 3358.00 3104.00 -254.00MAIZE MT 90.00 6706.00 6616.00RM SEED MT 52568.00 53571.00 1003.00SOYABEAN MT 23067.00 21507.00 -1560.00SUGAR MT 10710.00 11399.00 689.00TURMERIC MT 5735.00 5592.00 -143.00WHEAT MT 18893.00 18892.00 -1.00
23.06.16 COMMODITY UNIT 30.06.16 DIFFERENCE
QTY. QTY.
CARDAMOM MT 20.30 80.00 59.70
COTTON BALES 52200.00 115535.00 63335.00
GOLD KGS 62.00 94.00 32.00
GOLD MINI KGS 126.00 507.20 381.20
GOLD GUINEA KGS 13.74 13.74 0.00
MENTHA OIL KGS 1279653.13 1982720.49 703067.36
SILVER (30 KG Bar) KGS 104353.26 105382.09 1028.83
23.06.16
•China Hongqiao group ltd, world's largest aluminium producer will expand its production capacity by 1 million tonnes this year.
•Atlanta Federal Reserve's GDP forecast model showed that U.S. economy is on track to grow by a 2.7 percent annualized rate in the second quarter.
•Japan's retail sales fell more than expected in May in a third straight month of annual declines.
•Statoil will initially keep oil fields operating even if negotiations set for June 30 to July 1 fail to avert a strike that would halt output at others, the Norwegian Oil and Gas Association (NOG).
•Governor Jerome Powell reinforced market expectations that the Fed will have to slow down its rate hike pace this year.
•Between November 2015 and May this year, the first seven months of the current oil year, India imported 85.94 lakh tonnes of vegetable oils 10% higher compared to 78.34 lakh tonnes in the year-ago period- Solvent Extractors' Association of India (SEA).
•Additional margin of 5% (in Cash) on Long side and Short side and Special Margin of 10% (in Cash) on Long side will be imposed on all running contracts of Maize Rabi (SYMBOL: MAIZERABI) expiring in July 2016, August 2016 and September 2016 with effect from beginning of day Monday, July 4, 2016.
•Special Margin of 40% (in Cash) on Long side (in addition to the existing special cash margin) will be imposed on all running contracts of Chana (SYMBOL: CHARJDDEL and CHANA2MT) with effect from beginning of day Monday, July 4, 2016.
•Malaysia's palm oil exports during the June 1-30 period are estimated down 8.35% on month at 1,130,127 metric tons, cargo surveyor Intertek Agri Services
WEEKLY STOCK POSITIONS IN WAREHOUSE (MCX)
12
®
WEEKLY STOCK POSITIONS IN WAREHOUSE (NCDEX)
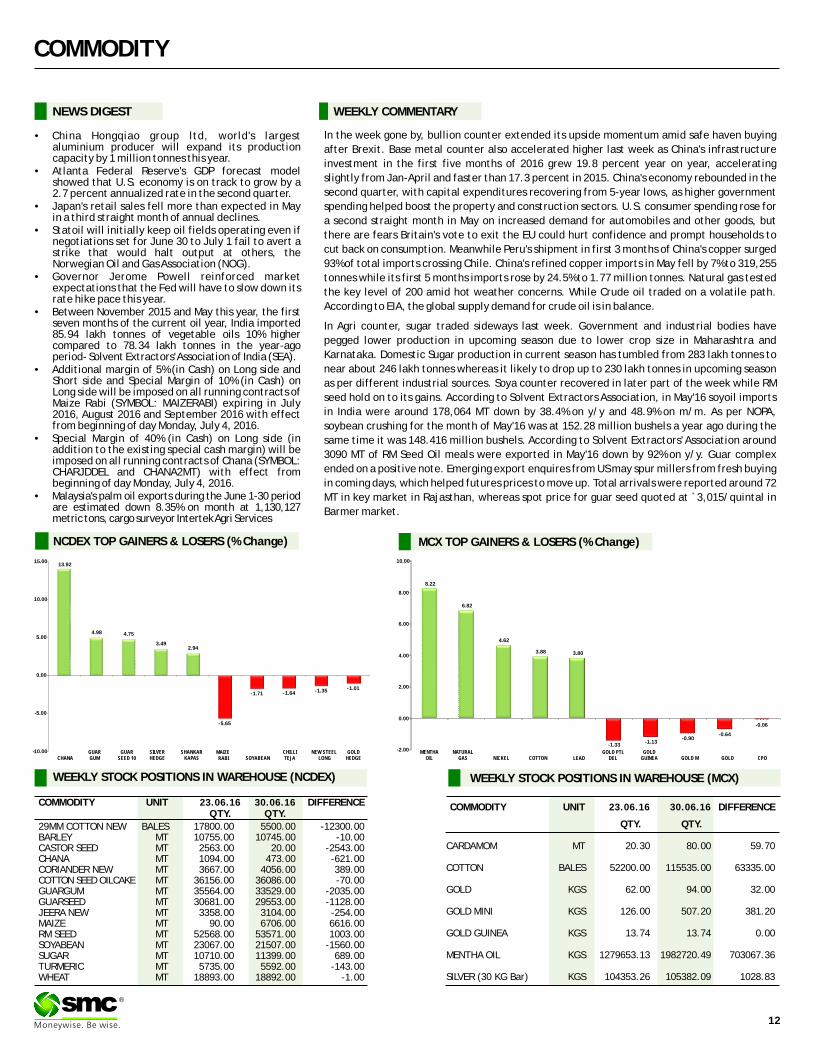
NCDEX TOP GAINERS & LOSERS (% Change) MCX TOP GAINERS & LOSERS (% Change)
8.22
6.82
4.62
3.88 3.80
-1.33-1.13
-0.90-0.64
-0.06
-2.00
0.00
2.00
4.00
6.00
8.00
10.00
MENTHAOIL
NATURALGAS NICKEL COTTON LEAD
GOLD PTL DEL
GOLD GUINEA GOLD M GOLD CPO
13.92
4.98 4.75
3.492.94
-5.65
-1.71 -1.64 -1.35 -1.01
-10.00
-5.00
0.00
5.00
10.00
15.00
CHANAGUAR GUM
GUAR SEED 10
SILVER HEDGE
SHANKAR KAPAS
MAIZE RABI SOYABEAN
CHILLI TEJA
NEW STEEL LONG
GOLD HEDGE

COMMODITY
COMMODITY EXCHANGE CONTRACT 24 30.06.16 CHANGE%
ALUMINIUM LME 3 MONTHS 1617.50 1649.00 1.95
COPPER LME 3 MONTHS 4698.00 4845.00 3.13
LEAD LME 3 MONTHS 1710.50 1788.00 4.53
NICKEL LME 3 MONTHS 9020.00 9445.00 4.71
ZINC LME 3 MONTHS 2018.00 2104.50 4.29
GOLD COMEX AUG 1322.40 1320.60 -0.14
SILVER COMEX SEP 17.83 18.62 4.43
LIGHT CRUDE OIL NYMEX AUG 47.64 48.33 1.45
NATURAL GAS NYMEX AUG 2.67 2.92 9.40
.06.16
PRICES OF METALS IN LME/ COMEX/ NYMEX (in US $)
WEEKLY STOCK POSITIONS IN LME (IN TONNES)
COMMODITY STOCK POSITION STOCK POSITION DIFFERENCE
23.06.16 30.06.16
ALUMINIUM 2427950 2393600 -34350
COPPER 190700 194200 3500
NICKEL 385566 380286 -5280
LEAD 185675 186250 575
ZINC 395075 426225 31150
INTERNATIONAL COMMODITY PRICES
COMMODITY EXCHANGE CONTRACT UNIT 24.06.16 30.06.16 CHANGE(%)
Soybean CBOT AUG Cent per Bushel 1101.50 1174.25 6.60
Maize CBOT SEP Cent per Bushel 389.00 365.50 -6.04
CPO BMD AUG MYR per MT 2379.00 2353.00 -1.09
Sugar LIFFE AUG 10 cents per MT 531.90 552.50 3.87
13
®
SPOT PRICES (% change) SPDR Gold Trust……...Gaining investor's faith
SPDR Gold Trust is one of the most popular ETFs in the world, offering exposure to an asset class that has become increasingly important to the asset allocation process. It can be used in a number of different ways; some may establish short term positions as a way of hedging against equity market volatility, dollar weakness, or inflation. Some may also include gold exposure as part of a long-term investment strategy.Holdings of the SPDR Gold Trust, the world's largest exchange-traded product backed by the metal, was 947.38 ton on June 28, 2016 highest since July 2013. The fund's value is more than $39.88 billion. Inflows into SPDR Gold Trust, the top gold ETF, since the beginning of the year have already surpassed outflows for the whole of 2015. The increase in assets so far is also the highest since 2010. SPDR Gold Trust, the largest gold ETF in the world, saw holdings rise by 11 per cent in the March quarter to 819 tonnes. SPDR Gold Trust holdings have hit a record at 1,353.35 tonnes in December 10, 2012 since its inception. Nowadays it is the world's ninth-largest holder of gold after the United States, Germany, the International Monetary Fund, Italy, France, Russia, china and Switzerland. Billionaire John Paulson is the biggest investor in the fund.FACTORS BEHIND RISINGThe SPDR Gold Trust tracks the performance of the price of gold. Normally, when the price of gold goes up, the holding of trust also rises. The ETFs are a good indicator that money is definitely flowing into gold. Nowadays gold prices are on uptrend as uncertainty about the Euro zone after Brexit as well as global economy and investor risk aversion have been a supporting the gold this year. Volatility in stock markets is stoking safe-haven demand, with bullion funds seeing fresh buying from investors. Uncertainty about hike of interest rate after FOMC meeting june and after Brexit are also supporting the gold investment and holding also.
About SPDR Gold TrustSPDR Gold Trust is a largest gold ETF, originally listed on the New York Stock Exchange. It is one of the fastest growing ETFs in the US. Started in November of 2004 and traded on NYSE Arca since December 13, 2007, the Trust holds physical gold and from time to time, issues SPDR Gold Shares in Baskets, in exchange for deposits of gold. SPDR Gold Shares offer investors an innovative, relatively cost efficient and secure way to access the gold market. A basket equals to a block of 100,000 Shares. It means the shares may be purchased from the trust only in one or more blocks of 100,000 Shares.Many Investors See Gold as a Safe-Haven InvestmentGold is widely perceived as a safe-haven investment. Gold retains its value despite movements in the stock market. At the time of economic uncertainty, political unrest and high inflation gold offers investors an attractive opportunity to diversify their portfolios-potentially reducing overall portfolio risk and ultimately preserving portfolio wealth.
-1.69
-0.93
-0.35
-0.17
0.10
0.18
0.39
0.81
1.05
1.26
1.43
2.28
2.39
2.55
2.98
4.19
8.89
12.04
-4.00 -2.00 0.00 2.00 4.00 6.00 8.00 10.00 12.00 14.00
SOYABEAN (INDORE)
PEPPER MALABAR GAR (KOCHI)
RAW JUTE (KOLKATA)
BARLEY (JAIPUR)
WHEAT (DELHI)
CRUDE PALM OIL (KANDLA)
GUR (MUZAFFARNGR.)
CORIANDER (KOTA)
SUGAR (KOLKATA)
MUSTARD (JAIPUR)
TURMERIC (NIZAMABAD)
GUAR GUM (JODHPUR)
JEERA (UNJHA)
GUAR SEED (JODHPUR)
COTTON SEED OIL CAKE (AKOLA)
COTTON (KADI)
SILVER 5 KG (DELHI)
CHANA (DELHI )

CURRENCY
Currency Table
Currency Pair Open High Low Close
USD/INR 67.97 68.17 67.71 67.77
EUR/INR 75.00 75.91 74.75 75.52
GBP/INR 91.30 91.61 89.76 91.52
JPY/INR 66.76 66.97 65.85 65.89
(Source: Reliable Software, Open: Monday 9.00 AM IST, Close: Thursday (5.00 PM IST)
News Flows of last week
28th June U.S. pending home sales dropped 3.7 percent in May
29th June Japan factory output hit three year-low on weak domestic
demand, export slump
29th June Consumer prices rose in the euro zone during June for the first
time in five months,
30th June German retail sales rose more than expected in May and jobless
numbers fell further in June
30th June S&P cut rating on EU to 'AA' after Brexit
30th June China's manufacturing activity shrank more than expected in June
EUR/INR (JULY) contract closed at 75.52 on 30thJune'16. The contract made its high of 75.96 on 24th June'16 and a low of 74.32 on 24th June '16 (Weekly Basis). The 14-day Exponential Moving Average of the EUR/INR is currently at 75.64.
On the daily chart, EUR/INR has Relative Strength Index (14-day) value of 47.63. One can sell below 75.10 for a target of 74.20 with the stop loss of 75.55.
JPY/NR (JULY) contract closed at 65.89 on 30thJune'16. The contract made its high of 68.07 on 24th June '16 and a low of 64.50 on 24th June'16 (Weekly Basis). The 14-day Exponential Moving Average of the JPY/INR is currently at 64.98
On the daily chart, JPY/INR has Relative Strength Index (14-day) value of 64.92. One can buy above 66.25 for a target of 67.30 with the stop loss of 65.70.
Market Stance
Surging off Brexit blues, Indian currency returned to normal and settled in
green zone as against the greenback on the back of persistent capital inflows
into local equities. Moreover, rupee also took cues from stronger Asian
currencies, which moved up on optimism owing to expectations of more
stimulus from UK and China. Rupee has fallen for eight out of nine quarters. In
the June quarter, rupee fell (approx.) 1.89%, its steepest fall since September
2015 quarter. Furthermore, June marked the third straight month of declines
for the domestic currency, due to the biggest daily loss in 10 months on June
24 after Britons voted to quit the European Union. However, concern of
Rajan's departure also weighed on the rupee. Positive news also came for
rupee as the prospect of good monsoon rains eased concern about higher food
costs. Investors are drawing comfort from this year's forecast for the highest
rains since 1994 after the nation's first back-to-back drought in almost two
decades hurt crops.
EUR/INR
USD/INR (JULY) contract closed at 67.77 on 30thJune'16. The contract made its high of 68.22 on 24thJune'16 and a low of 67.71 on 28thJune'16 (Weekly Basis). The 14-day Exponential Moving Average of the USD/INR is currently at 67.62.
On the daily chart, the USD/INR has Relative Strength Index (14-day) value of 56.39. One can sell around 67.80 for the target of 67.20 with the stop loss of 68.15.
GBP/INR (JULY) contract closed at 91.52 on 30th June'16. The contract made its high of 99.02 on 24th June'16 and a low of 89.76 on 27th June '16 (Weekly Basis). The 14-day Exponential Moving Average of the GBP/INR is currently at 94.44.
On the daily chart, GBP/INR has Relative Strength Index (14-day) value of 35.99. One can sell around 90.25 for a target of 89.00 with the stop loss of 90.80.
USD/INRTechnical Recommendation
Economic gauge for the next week
Date Currency Event Previous
04th July EUR Producer Price Index (MoM) -0.304th July EUR Producer Price Index (YoY) -4.404th July EUR ECB President Draghi's Speech06th July EUR Non-monetary policy's ECB meeting06th July USD ADP Employment Change 17306th July USD Markit PMI Composite 51.206th July USD ISM Non-Manufacturing PMI 52.906th July USD FOMC Minutes07th July GBP Industrial Production (MoM) 207th July GBP Manufacturing Production (MoM) 2.307th July GBP Industrial Production (YoY) 1.607th July USD Initial Jobless Claims 26807th July GBP NIESR GDP Estimate (3M) 0.508th July USD Unemployment Rate 4.708th July USD Nonfarm Payrolls 38
GBP/INR JPY/INR
14
®

IPO
IPO NEWSIPO NEWS
Mahanagar Gas lists at 540/share, up 28% from issue price Mahanagar Gas is listed on the exchanges at ̀ 540 per share, up 28 percent from its issue price of Rs 421 per share. The country's second largest CNG retailer had raised `1040 crore through its IPO with price band at `380-421. The initial share sale of Mahanagar Gas was oversubscribed 64.54 times last week. The IPO was open for subscription between June 21-23. Mahanagar Gas, promoted by state-run GAIL and British Gas Asia Pacific Holdings, made an offer for sale of up to 24,694,500 equity shares of ̀ 10 each. The money raised through the IPO would accrue to the promoters who are selling their stake. Mahanagar Gas, a major distributor of compressed natural gas (CNG) and piped natural gas (PNG) in Mumbai and adjoining areas, receives gas at its stations located at Wadala, Mahape, Ambernath and Taloja through pipelines owned by GAIL. It has a city gas infrastructure network of 188 CNG filling stations with a compression capacity of 3.1 million kg/day in FY16, providing CNG to over 0.47 million vehicles. The company supplied PNG to 9 lakh domestic customers, 2866 commercial and 60 industrial customers in FY16, through an integrated pipeline network of over 4686 km that includes 415 km of steel and 4231 of polyethylene pipeline. It has exclusive gas distribution rights in Mumbai till 2020,adjoining areas of Thane & Navi Mumbai till 2030 and Raigad district till 2040. MGL's sales volume and revenue grew at the CAGR of 5.7 percent and 12.3 percent, respectively over FY12-FY16.
L&T Infotech to float IPO in JulyDiversified firm Larsen & Toubro Ltd has said that its technology services arm L&T Infotech Ltd would open its initial public offering (IPO) on July 11. It would become the third group firm to go public. While parent L&T has been a public firm for decades, the group's financial services arm L&T Finance Holdings Ltd floated its IPO five years ago. L&T Infotech, the sixth-largest Indian IT firm by export revenues that reported ̀ 4,968 crore revenues and ̀ 510 crore net profit for the financial year ended March 31, 2015, had received the green signal from capital markets regulator Securities and Exchange Board of India (SEBI) last month after refiling its documents. Earlier in April, L&T Infotech had refiled its draft red herring prospects (DRHP) a day after L&T said the unit had decided to withdraw it due to a change in the offer structure and “other considerations”. L&T Infotech had first filed its DRHP with the capital markets regulator in September. SEBI cleared the IPO proposal in January. The issue comprises an offer for sale of 17.5 million shares; the DRHP filed in September mentioned the same number of shares.
NSE to file for IPO in January, plans overseas listing tooNational Stock Exchange of India Ltd (NSE), the operator of India's largest bourse, said on Monday that it would file documents in January for an initial public offering (IPO) that would given an exit opportunity to its institutional investors. The exchange, which is valued at ̀ 17,500–18,000 crore (according to recent trades), will also seek an overseas listing by April 2017, said NSE. “For domestic listing, the board of directors of the exchange—subject to shareholders' approval—has expressed desire to file the DRHP (draft red herring prospectus) latest by January 2017, after addressing restructuring needs of the exchange and the regulatory requirements for listing,” it said. The development comes after sustained pressure from shareholder institutions, led by State Bank of India (SBI), on NSE to seek an IPO. SBI holds a 10.19% stake in NSE; other shareholders include Life Insurance Corporation of India (10.51%), Goldman Sachs (5%), Tiger Global (3%) and Citigroup Strategic Holdings Mauritius (2%). The Securities and Exchange Board of India (Sebi) had notified amendments to the Stock Exchange and Clearing Corporations Regulations on 1 January, paving the way for the listing of stock exchanges. BSE Ltd has already secured in-principle approval from Sebi for an IPO.
BSE shareholders okay IPO planShareholders of the BSE stock exchange have approved its proposed plan to sell up to 30 per cent of its equity, in a much-awaited Initial Public Offer (IPO). It is expected to hit the market this financial year. The exchange plans to file draft papers next month with the Securities and Exchange Board of India (Sebi). The exchange said it was a unanimous e-vote of around 9,000 shareholders at the annual general meeting last week. BSE has appointed Edelweiss Financial Services as lead merchant banker, and AZB & Partners and Nishith Desai Associates as legal advisors to the issue. The proposed IPO could be a combination of an Offer for Sale by existing equity holders and a fresh issue, for up to a maximum of 30 per cent of the post-issue share capital. The shareholders also approved the audited and consolidated financial statement for 2015-16. The exchange initiated the IPO process from January, when Sebi notified amendments in its clearing corporation regulations, allowing exchanges to list.
Vodafone plans to file for India IPO in August, listing seen in Q4: reportVodafone Group is likely to file a draft prospectus for the planned IPO of its Indian business in August with the listing expected in the fourth quarter, in a deal seen raising as much as $2.5 billion. The British telecoms group, India's largest mobile operator after Bharti Airtel, has begun work on the prospectus that would incorporate the Indian unit's financials for the first half of the calendar year. Vodafone hired Bank of America Corp, India's Kotak Investment Banking, UBS AG in April as global coordinators for the IPO, set to be India's biggest stock market listing since 2010. A London-based Vodafone spokesman declined to comment on the timeline, saying the potential India IPO was a “lengthy process” and no decision would be made until the company was at the end of it. Sources declined to be identified as the information is not public.
Metropolis Healthcare plans IPO to raise around ̀ 1,000 croreMetropolis Healthcare Ltd, one of the three largest diagnostic chains in India, plans to sell shares in an initial public offering (IPO) to raise around `1,000 crore, seeking to tap investor interest in the healthcare sector. An IPO would give existing private equity investor Carlyle Group an opportunity to make a part exit from Metropolis, whose promoters, the Shah family, will sell a small minority stake, said two people aware of the development. The IPO size is expected to be in the range of `1,000 crore. Metropolis competes with other leading diagnostic chains such as SRL Diagnostics Pvt. Ltd and Dr Lal PathLabs. The Shah family—chairman Sushil Shah and his daughter Ameera Shah, managing director and chief executive officer—holds a 63% stake and Carlyle owns 37% in Metropolis. In April last year, the Shah family acquired the 27% stake in Metropolis held by US-based private equity (PE) firm Warburg Pincus for ̀ 550 crore with the backing of KKR India, the local arm of PE firm KKR and Co. The deal increased the family's stake in the company to 63% from 36%. In September, Carlyle Group purchased 37% stake in Metropolis from G.S.K. Velu, former promoter of Metropolis Healthcare, for an undisclosed amount. Metropolis conducts over 30 million medical tests a year through 20,000 laboratories, hospitals and nursing homes, and 200,000 consultants. It has 130 laboratories in India and six other emerging markets, 750 collection centres and at least 3,500 employees.
®
15
Parag Milk Foods Dairy 2325.77 767.00 19-May-16 215.00 215.70 278.10 29.35
Ujjivan Fin.Ser. Finance 4724.92 870.00 10-May-16 210.00 227.00 399.60 90.29
Thyrocare Tech. Healthcare 3071.37 480.00 9-May-16 446.00 662.00 571.70 28.18
Equitas Holdings NBFC 6176.96 2177.00 21-Apr-16 110.00 144.00 177.70 61.55
Infibeam Incorp. IT - Software 3718.25 450.00 4-Apr-16 432.00 458.00 700.35 62.12
Bharat Wire Metal 199.81 70.00 1-Apr-16 45.00 47.35 44.45 -1.22
IPO TRACKER
Company Sector M.Cap(In `Cr.) Issue Size(in `Cr.) List Date Issue Price List Price Last Price %Gain/Loss(from Issue price)
*
*Closing prices as on 30-06-2016

®
17
FIXED DEPOSIT MONITOR
• Interest structure may be revised by company from time to time. Pls confirm Interest rates before submitting the application.
* For Application Greater Than Rs. Fifty Lakhs Or equal to Fifty Lakhs, Please Contact to Head Office.
* Email us at [email protected]
FIXED DEPOSIT COMPANIES
PERIOD MIN.ADDITIONAL RATE OF INTEREST (%)
S.NO (NBFC COMPANY -NAME)12M 18M 24M 36M 45M 48M 60M 84M INVESTMENT
1 BAJAJ FINANCE LTD.(UPTO RS. 5 CR.) 8.55 8.65 8.65 8.65 - 8.65 8.65 - 0.25% FOR SR. CITIZEN, 0.10% FOR DELHI NCR &
EXISTING LOAN CUSTOMER AND ON MUMBAI-75000,
RENEWAL UPTO RS. 1CRORE OTHER-50000/-
2 DEWAN HOUSING FINANCE CORPORATION LTD 13M=8.75% 14M=8.75% 18M=8.85% 40M=8.90% 0.25% EXTRA FOR SR. CITIZEN,WIDOW, 13M=50000;
ARMED, PERSONNEL, EXISTING DHFL HOME 14M=10000;
BORROWERS, 0.25% EXTRA FOR DEPOSIT 40M=2000
50 LAC AND ABOVE
3 DEWAN HOUSING FINANCE CORPORATION LTD (AASHRAY) 8.50 - 8.75 8.75 - 8.75 - 8.75 10,000/-
4 GRUH FINANCE LTD. 7.50 13M=7.50 7.75 8.00 - 8.00 8.00 8.00 96-120M=8.00%; 0.25% FOR FEMALE, 1000/-
SR. CITIZEN & TRUST
5 HDFC PREMIUM DEPOSIT FOR INDIVIUAL (UPTO RS. 2 CR.) 15M=8.35 22M=8.40 30M=8.35 44M=8.40 - 0.25% FOR SR. CITIZEN UPTO RS. 1 CR. 20000/-, 40000/-
IN MONTHLY
6 HDFC PREMIUM DEPOSIT FOR TRUST & INSTITUTION (UPTO RS. 10 CR.) 20M=8.30 - 40M=8.30 -
7 HDFC LTD FOR INDIVIDUAL & TRUST (UPTO RS.5 CR.) 8.25 - 8.25 8.25 - 8.25 8.25 - 0.25% FOR SR. CITIZEN UPTO RS. 1 CR.
8 HDFC LTD FOR INDIVIDUAL & TRUST (ABOVE RS.5 CR. TO RS.10 CR.) 8.15 - 8.15 8.15 - 8.15 8.15 - 0.25% FOR SR. CITIZEN UPTO RS. 1 CR.
9 HUDCO LTD.(IND & HUF) 7.70 - 7.70 7.70 - 7.70 7.55 7.55 0.25% FOR SR. CITIZEN 10000/-
10 HUDCO LTD.(TRUST/CO/INSTITUTION) 7.50 - 7.50 7.50 - 7.50 7.50 7.50 - 10000/-
11 LIC HOUSING FINANCE LTD.(UPTO RS. 5 CR.) 8.25 8.25 8.35 8.40 - - 8.50 - 0.25% FOR SR. CITIZEN IF APP ABOVE 10000/-
RS. 50,000/- & 0.10% IF APP UPTO RS. 50,000/-
12 M&M FINANCIAL SERVICES LTD (FOR BELOW RS. 1 CRORE) 8.45 8.45 8.45 8.45 - 8.45 8.45 - 0.25% FOR SR. CITIZEN 10000/-
13 PNB HOUSING FINANCE LTD.(UPTO RS. 5 CR.) 8.00 - 8.00 8.25 - 8.25 8.25 8.25 0.25% EXTRA FOR SR. CITIZEN UPTO RS.1 CRORE 20000/-
14 PNB HOUSING FINANCE LTD.(UPTO RS. 5 CR.) 15M=8.05 22M=8.05 30M=8.35 44M=8.45 - 0.25% FOR SR. CITIZEN
15 SHRIRAM TRANSPORT FINANCE-UNNATI SCHEME 8.25 - 8.25 8.50 - 8.75 8.75 - 0.25% FOR SR. CITIZEN 5000/-
16 SHRIRAM CITY UNION SCHEME 8.25 - 8.25 8.50 - 8.75 8.75 - 0.25% FOR SR. CITIZEN 5000/-
(FOR TRUST ONLY) (FOR WOMEN ONLY)


Returns (%) Risk Market Cap (%)
Scheme Name NAV Launch QAAUM 3M 6M 1Y 3Y Since Std.Dev Jenson LARGE MID SMALL DEBT &
(`) Date (` Cr.) Launch CAP CAP CAP OTHER
Birla Sun Life Balanced 95 - Growth 598.97 10-Feb-1995 2341.69 8.81 6.70 7.73 20.90 21.08 1.79 0.17 46.49 22.12 0.02 31.38
ICICI Prudential Balanced - Growth 97.25 03-Nov-1999 2515.51 8.63 5.94 6.69 20.77 14.62 1.72 0.13 57.85 16.98 1.22 23.95
L&T India Prudence Fund - Reg - Growth 20.43 07-Feb-2011 1493.54 6.30 3.08 6.49 22.25 14.15 1.60 0.19 47.63 18.57 3.74 30.06
Franklin India Balanced Fund - Growth 96.12 10-Dec-1999 848.42 6.57 6.69 6.41 20.68 14.64 1.59 0.21 57.30 11.27 N.A 31.42
Reliance RSF - Balanced - Growth 41.94 08-Jun-2005 1931.57 6.48 2.40 6.26 20.14 13.83 1.79 0.13 53.31 10.90 2.95 32.84
UTI Balanced Fund - Growth 133.95 20-Jan-1995 1246.29 9.61 5.71 6.26 16.76 16.01 1.66 0.07 47.07 23.53 1.92 27.48
HDFC Balanced Fund - Growth 113.57 11-Sep-2000 4879.06 7.11 4.80 5.95 23.17 16.61 1.77 0.14 42.82 24.21 1.48 31.50
Annualised
Returns (%) RiskAverage Yield till
Scheme Name NAV Launch QAAUM Since Std. SharpeMaturity (Days) Maturity
1W 2W 1M 6M 1Y 3Y(`) Date (`Cr.) Launch Dev.
ICICI Prudential Dynamic Bond F - Prem Plus - G 17.80 14-Jan-2010 805.72 26.73 20.81 12.38 13.03 12.07 9.77 9.33 22.83 0.24 2857.95 8.33
ICICI Prudential LTP - Growth 18.48 20-Jan-2010 842.03 42.34 30.42 15.48 13.25 11.04 12.27 10.00 28.45 0.18 5391.05 7.89
BOI AXA Corporate Credit Spectrum F - Reg - G 11.33 27-Feb-2015 348.03 9.96 9.68 9.28 10.94 10.56 N.A 9.75 7.00 0.49 744.60 11.43
ICICI Prudential Income Fund -Growth 47.80 09-Jul-1998 3482.19 44.21 29.02 15.12 12.65 10.40 7.36 9.09 28.96 0.14 5712.25 8.16
SBI Dynamic Bond Fund - Growth 18.74 09-Feb-2004 3639.15 18.63 15.16 20.35 11.61 10.29 6.94 5.20 25.91 0.15 3361.64 7.38
DHFL Pramerica Credit Opportunities F - Reg - G 11.99 29-Sep-2014 277.07 11.07 9.73 9.73 9.32 10.16 N.A 10.93 7.99 0.56 730.00 10.62
L&T Resurgent India Corporate Bond F - Reg - G 11.35 02-Feb-2015 359.33 14.28 11.72 8.65 9.50 9.89 N.A 9.41 12.80 0.25 2200.95 9.28
Returns (%) Risk Average Yield tillScheme Name NAV Launch QAAUM Since Std. Sharpe Maturity (Days) Maturity
1W 2W 1M 6M 1Y 3Y(`) Date (`Cr.) Launch Dev.
Birla Sun Life Dynamic Bond Fund - Ret - DAP 18.81 08-Apr-2009 14963.80 59.24 35.10 18.10 12.73 10.46 9.83 9.13 23.46 0.20 7493.45 7.97
HDFC HIF - Dynamic - Growth 52.42 27-Apr-1997 2057.60 38.13 27.01 14.39 12.07 10.00 8.64 9.02 27.40 0.15 4996.86 7.80
Kotak Flexi Debt Scheme - Plan A - Reg - G 19.30 27-May-2008 337.03 16.43 11.90 9.72 10.50 10.50 9.16 8.46 17.32 0.19 956.30 8.23
ICICI Prudential Banking & PSU Debt F - Reg - G 17.32 01-Jan-2010 3735.30 17.06 13.34 9.59 10.48 10.18 8.89 8.82 11.44 0.28 1679.00 8.04
Birla Sun Life Treasury Optimizer Plan - DAP 179.40 22-Jun-2009 5157.70 15.54 13.72 9.89 10.43 10.12 10.24 8.67 12.37 0.30 1912.61 8.12
Birla Sun Life Medium Term Plan - Reg - G 19.12 25-Mar-2009 5098.79 20.98 15.93 11.02 10.31 10.18 10.07 9.32 9.86 0.38 1638.86 9.38
Birla Sun Life Short Term Opportunities F - Reg - G 25.37 24-Apr-2003 3391.23 13.77 12.52 9.18 9.79 9.36 9.47 7.31 9.82 0.32 1748.36 8.50
Returns (%) Risk Average Yield tillScheme Name NAV Launch QAAUM Since Std. Sharpe Maturity (Days) Maturity
1W 2W 1M 3M 1Y 3Y(`) Date (`Cr.) Launch Dev.
Franklin India Low Duration Fund - G 17.17 26-Jul-2010 2071.52 9.68 9.54 9.35 10.67 9.32 9.65 9.54 4.80 0.66 357.70 9.90
Birla Sun Life Floating Rate F - LTP - Ret - G 269.41 05-Jun-2003 1377.55 7.10 7.54 7.75 10.08 8.85 9.19 7.87 3.71 0.73 452.60 7.69
ICICI Prudential Ultra Short Term Plan - Ret - G 17.00 12-Jun-2009 5948.18 11.53 9.76 8.75 9.88 8.87 8.86 7.81 5.69 0.46 795.70 8.01
Baroda Pioneer Treasury Advantage F - Plan A - G 1776.55 24-Jun-2009 1382.69 8.22 8.68 8.55 9.84 9.01 9.21 8.53 3.04 0.93 268.92 8.67
Principal Low Duration Fund - Growth 2431.95 14-Sep-2004 373.01 8.14 8.27 8.15 9.60 8.38 8.49 7.82 2.68 0.78 291.00 8.57
Birla Sun Life Savings Fund - Ret - G 289.69 27-Nov-2001 11854.60 7.56 7.10 7.84 9.55 8.88 9.26 7.56 2.94 0.93 419.75 8.06
IDFC Money Manager - Invest Plan - Plan A - G 23.31 09-Aug-2004 1603.85 10.18 8.20 7.81 9.40 8.73 8.65 7.37 6.21 0.37 686.20 8.01
Returns (%) Risk Market Cap (%)
Scheme Name NAV Launch QAAUM 3M 6M 1Y 3Y Since Std.Dev Beta Jenson LARGE MID SMALL DEBT &
(`) Date (` Cr.) Launch CAP CAP CAP OTHER
Sundaram Rural India Fund - Reg - G 30.81 12-May-2006 476.33 18.56 16.48 20.27 25.93 11.73 2.38 0.91 0.30 42.76 37.99 7.91 11.34
DSP BlackRock Micro Cap Fund - Reg - G 47.54 14-Jun-2007 2213.86 16.59 8.27 19.07 46.87 18.80 2.73 0.93 0.49 N.A 71.63 20.86 7.51
Birla Sun Life Small & Midcap Fund - G 27.99 31-May-2007 175.35 17.18 8.34 17.63 32.51 11.99 2.58 0.89 0.30 3.23 73.58 9.95 13.24
L&T Emerging Businesses Fund - Reg - G 16.22 12-May-2014 339.06 15.67 3.95 15.69 N.A 25.39 2.60 0.88 0.24 N.A 69.09 21.78 9.13
Reliance Small Cap Fund - Growth 27.46 16-Sep-2010 1831.89 12.78 -0.49 15.36 44.09 19.06 2.82 0.93 0.29 7.89 46.78 37.73 7.60
Franklin India Smaller Companies F - G 43.60 13-Jan-2006 2502.29 14.67 9.05 14.70 38.93 15.10 2.28 0.82 0.36 11.37 60.20 12.54 15.89
DSP BlackRock Small and Midcap F - Reg - G 40.61 14-Nov-2006 1751.65 15.98 8.48 13.43 34.66 15.66 2.75 0.95 0.28 18.13 70.89 6.21 4.77
Note: Indicative corpus are including Growth & Dividend option. The above mentioned data is on the basis of 30/06/2016Beta, Sharpe and Standard Deviation are calculated on the basis of period: 1 year, frequency: Weekly Friday, RF: 7%
Annualised
18
MUTUAL FUND Performance Charts
EQUITY (Diversified)
INCOME FUND
ULTRA SHORT TERM
SHORT TERM FUND
Due to their inherent long term nature, the following 3 categories have been sorted on the basis of 1 year returns
Due to their inherent short term nature, Short term funds and Ultra short term funds have been sorted on the basis of 6month and 3month returns respectively
Annualised
®
BALANCED


![ResearchReports … · 2019. 11. 12. · ResearchReports InterculturalProfilesandAdaptationAmongImmigrantandAutochthonous Adolescents CristianoInguglia*a,PasqualeMussoa [a]DepartmentofPsychological](https://static.documents.pub/doc/80x56/60817c6fdf091e14725176e4/researchreports-2019-11-12-researchreports-interculturalprofilesandadaptationamongimmigrantandautochthonous.jpg)


