24
May 7, 2014 2016 Economic and Construction Outlook Presented by: Bernard M. Markstein, Ph.D. Markstein Advisors Automated Logic Open House Harrisburg PA September 30, 2016
| Date post: | 17-Jan-2017 |
| Category: |
Economy & Finance |
| Upload: | bernard-bernie-markstein-phd |
| View: | 203 times |
| Download: | 1 times |

May 7, 2014
2016 Economic and
Construction Outlook
Presented by:
Bernard M. Markstein, Ph.D.
Markstein Advisors
Automated Logic Open House
Harrisburg PA
September 30, 2016

Markstein Advisors2
The U.S.
Economy
Markstein Advisors3
Economy growing, but should be better
Employment growing, but should be faster
Inflation remains moderate (too low?)
Federal Reserve raising interest rates: how high,
how fast?
Strong dollar: pluses & minuses
Energy (oil) prices
Overview of the Economy

Markstein Advisors4
Washington less of an obstacle, but how much real
cooperation are we seeing?
China: slow(er) economic growth impact on world
economy
Europe showing signs of improvement but total
impact of Brexit is an unknown
Overview of the Economy

Markstein Advisors5
Risks to the Economy
Failure to pass needed legislation leads to reduced
federal government spending/shut down
The election
China
EU – Brexit?
Energy (oil) prices
Interest rates (the Fed)
European government debt default (Greece)
The euro (Greece)
Russia?

Markstein Advisors6
Construction
Overview

Markstein Advisors7
47%
32%
20%
2002
Residential
Nonresidential Building
Heavy Construction
53%
29%
18%
2006
Residential
Nonresidential Building
Heavy Construction
2002 Total - $848 Billion 2006 Total - $1,167 Billion
Construction Spending Components
Source: U.S. Census Bureau
Overview of Construction

Markstein Advisors8
53%
29%
18%
2006
Residential
Nonresidential Building
Heavy Construction
31%
36%
33%
2010
Residential
Nonresidential Building
Heavy Construction
2006 Total - $1,167 Billion 2010 Total - $809 Billion
Construction Spending Components
Source: U.S. Census Bureau
Overview of Construction

Markstein Advisors9
53%
29%
18%
2006
Residential
Nonresidential Building
Heavy Construction
40%
34%
26%
2015
Residential
Nonresidential Building
Heavy Construction
2006 Total - $1,167 Billion 2015 Total - $1,112 Billion
Construction Spending Components
Source: U.S. Census Bureau
Overview of Construction

Markstein Advisors10
47%
32%
20%
2002
Residential
Nonresidential Building
Heavy Construction
40%
34%
26%
2015
Residential
Nonresidential Building
Heavy Construction
2002 Total - $848 Billion 2015 Total - $1,112 Billion
Construction Spending Components
Source: U.S. Census Bureau
Overview of Construction

Markstein Advisors11
0
200
400
600
800
1,000
1,200
1,400
1,600
02 03 04 05 06 07 08 09 10 11 12 13 14 15 16 17
Residential Nonresidential Building Heavy Construction
$ Billions
History
Source: History – U.S. Census Bureau; Forecast – Markstein Advisors
Forecast
Forecast: The Rebound ContinuesConstruction Spending and its Components
Overview of Construction

Markstein Advisors12
Residential
Construction

Markstein Advisors13
0
250
500
750
1,000
1,250
1,500
1,750
2,000
2,250
2,500
2000 2001 2002 2003 2004 2005 2006 2007 2008 2009 2010 2011 2012 2013 2014 2015 2016
Thousands of Units, SAAR
Nation’s long-run (trend)
need for the next decade
Low Estimate
(1.4 million starts per year)
Nation’s long-run (trend)
need for the next decade
High Estimate
(1.8 million starts per year)
1.18 million
Total Housing Starts(3-Month Moving Average)
Source: U.S. Census Bureau
Shaded areas represent recession
Overview of Housing

Markstein Advisors14
0
50
100
150
200
250
300
350
400
450
500
2000 2001 2002 2003 2004 2005 2006 2007 2008 2009 2010 2011 2012 2013 2014 2015 2016
Thousands of Units, SAAR
Nation’s long-run (trend)
need for the next decade
Low Estimate
(250,000 starts per year)
Nation’s long-run (trend)
need for the next decade
High Estimate
(350,000 starts per year)
432k
Multifamily Housing Starts(3-Month Moving Average)
Source: U.S. Census Bureau
Shaded areas represent recession
Overview of Housing

Markstein Advisors15
0
200
400
600
800
1,000
1,200
1,400
1,600
1,800
2,000
2000 2001 2002 2003 2004 2005 2006 2007 2008 2009 2010 2011 2012 2013 2014 2015 2016
Thousands of Units, SAAR
Nation’s long-run (trend)
need for the next decade
Low Estimate
(1.15 million starts per year)
Nation’s long-run (trend)
need for the next decade
High Estimate
(1.45 million starts per year)
751k
Single-Family Housing Starts(3-Month Moving Average)
Source: U.S. Census Bureau
Shaded areas represent recession
Overview of Housing
Markstein Advisors16
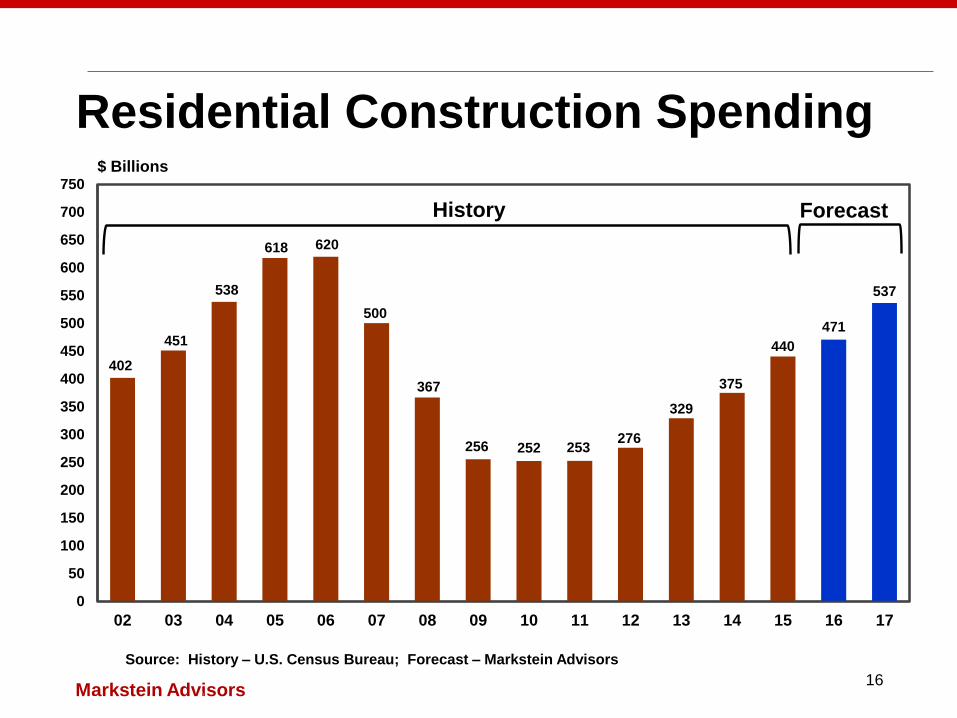
402
451
538
618 620
500
367
256 252 253276
329
375
440
471
537
0
50
100
150
200
250
300
350
400
450
500
550
600
650
700
750
02 03 04 05 06 07 08 09 10 11 12 13 14 15 16 17
$ Billions
History Forecast
Source: History – U.S. Census Bureau; Forecast – Markstein Advisors
Residential Construction Spending

Markstein Advisors17
0
50
100
150
200
250
300
350
400
450
Single-Family Multifamily Improvements
$ Billions
2006 to 2015 ’16 ’17
Residential Construction Spending
Source: History – U.S. Census Bureau; Forecast – Markstein Advisors

Markstein Advisors18
Nonresidential
Building
Construction

Markstein Advisors19
275 269283
302
340
404
439
377
292284
301 303
333
379
405426
0
50
100
150
200
250
300
350
400
450
500
550
02 03 04 05 06 07 08 09 10 11 12 13 14 15 16 17
$ Billions
History Forecast
Source: History – U.S. Census Bureau; Forecast – Markstein Advisors
Nonresidential Construction Spending
Nonresidential Construction
Markstein Advisors20
0
10
20
30
40
50
60
70
80
90
100
110
120
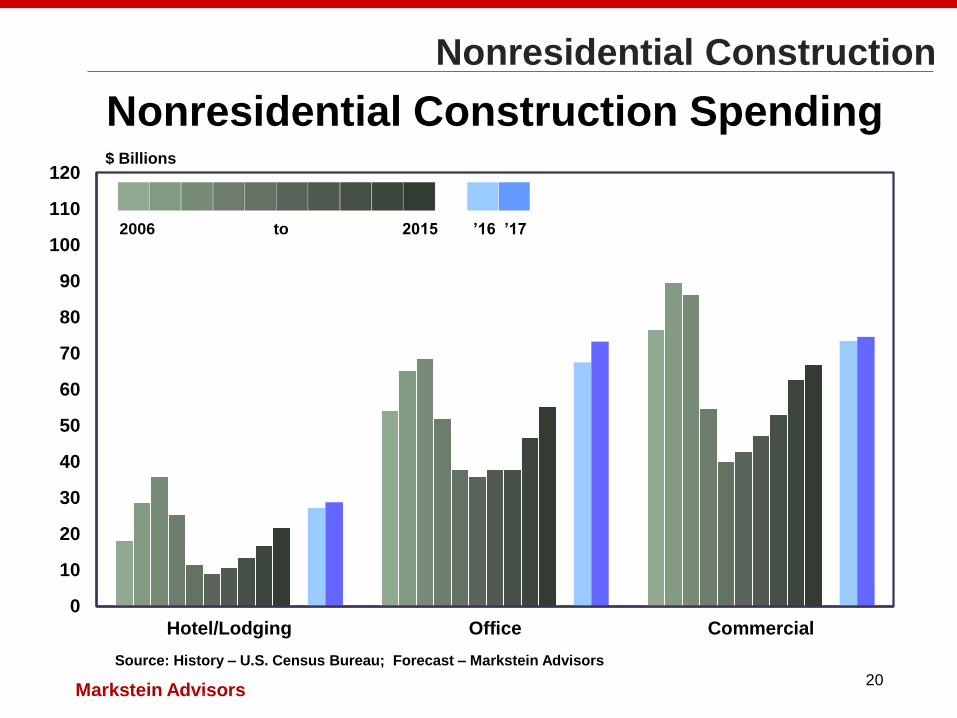
Hotel/Lodging Office Commercial
$ Billions
2006 to 2015 ’16 ’17
Nonresidential Construction Spending
Source: History – U.S. Census Bureau; Forecast – Markstein Advisors
Nonresidential Construction
Markstein Advisors21
0
10
20
30
40
50
60
70
80
90
100
110
120
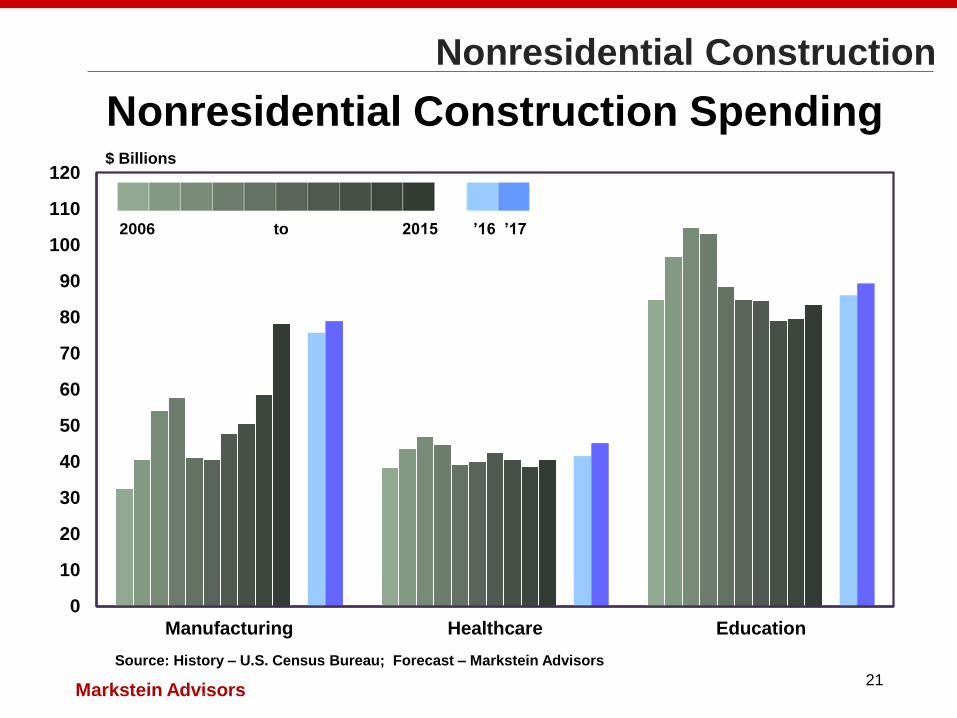
Manufacturing Healthcare Education
$ Billions
2006 to 2015 ’16 ’17
Nonresidential Construction Spending
Source: History – U.S. Census Bureau; Forecast – Markstein Advisors
Nonresidential Construction

Markstein Advisors22
Heavy Engineering
Construction

Markstein Advisors23
171 171 169185
208
248
272 274265
251
274 274
298 294 296
312
0
50
100
150
200
250
300
350
400
02 03 04 05 06 07 08 09 10 11 12 13 14 15 16 17
$ Billions
History Forecast
Source: History – U.S. Census Bureau; Forecast – Markstein Advisors
Heavy Engineering Construction Spending
Heavy Engineering Construction
Markstein Advisors24
Contact Info and Links
Bernard M. Markstein
Office: 301-588-5190
www.linkedin.com/in/markstein3
@BMarkstein


