A COLLABORATION OF The National Association of State Directors of Developmental Disabilities Services and Human Services Research Institute www.nationalcoreindicators.org 2016 Staff Stability Survey Report January 2018
Transcript
A COLLABORATION OF
The National Association of State Directors of Developmental Disabilities Services and
APPENDIX D: LIVING WAGE TABLE BY STATE ..................................................................................... 57
APPENDIX E: INSTRUCTIONS PROVIDED TO SURVEY RESPONDENTS .................................................. 58
2
Introduction Around the country, state developmental disability agencies focus on improving the quality and stability
of the workforce of direct support professionals (DSPs) who assist adults with intellectual and
developmental disabilities. These efforts come at a time of escalating demand for long-term services
and supports in home and community-based settings. Importantly, states also seek to reduce the costs
associated with staff turnover at provider agencies1 and to reduce the impact of turnover on the quality
of supports and outcomes for consumers2,3.
National Core Indicators™ (NCI™) works with member states to collect comprehensive data on the
workforce of DSPs providing supports to adults (age 18 and over) with intellectual and developmental
disabilities. The goal is to help states benchmark their workforce data to those of other states so they
can measure improvements made through policy or programmatic changes. (For a detailed history of
the project, please see Appendix A.)
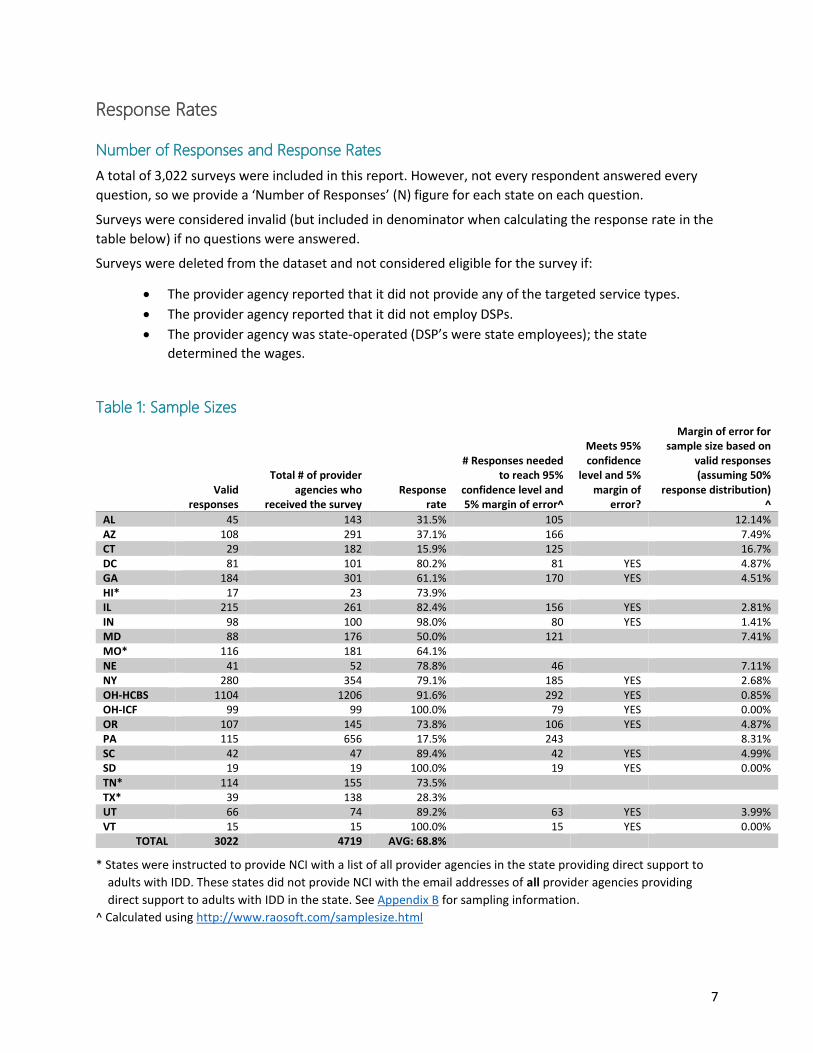
A few notes about the survey results...
When comparing results from year to year, please keep in mind that the survey questions may have
changed. For example, in 2016, we added descriptive text to many questions to assist respondents
in selecting the correct response. This may complicate comparisons to previous years.
Take into account the margin of error (see the table on page 8), particularly when making state-to-
state comparisons.
Consider the Ns (number of responding provider agencies for each question); these vary by state
and by survey question.
Keep in mind that “NCI Average” refers to the average of the state averages.
Ohio Data – Ohio opted to examine DSPs providing supports in ICF/ID facilities separately from
DSPs providing HCBS waiver funded supports. Therefore, the report considers the two groups
separate entities (OH_ICF and OH_HCBS). If an agency provided both ICF and HCBS supports, they
were asked to respond to the survey twice—once in reference to DSPs providing ICF/ID funded
supports and once in reference to DSPs providing HCBS waiver funded supports. Thirty-three
agencies in Ohio reported separately on their ICF-and Waiver-funded DSP workforce. Some agencies
providing both ICF-and Waiver-funded supports were unable to differentiate between these for the
purposes of this survey.
1 U.S. Department of Health and Human Services (2006). The supply of direct support professionals serving individuals with intellectual
disabilities and other developmental disabilities: Report to Congress. Retrieved from
http://aspe.hhs.gov/daltcp/reports/2006/DSPsupply.htm 2 Ibid. 3 Larson, S.A., Hewitt, A. & Lakin, K.C. (2004). A multi-perspective analysis of effects on recruitment and retention challenges on outcomes
for persons with intellectual and developmental disabilities and their families. American Journal on Mental Retardation.
PA 33.9% 16.5% 10.4% 39.1% 132.70 223.841 40.00 115
SC 4.8% 14.3% 7.1% 73.8% 139.26 114.634 104.00 42
SD 5.3% 0.0% 21.1% 73.7% 124.42 106.180 106.00 19
TN 28.9% 5.3% 7.9% 57.9% 115.60 167.974 74.00 114
TX 38.5% 10.3% 10.3% 41.0% 90.79 116.198 51.00 39
UT 53.0% 19.7% 6.1% 21.2% 67.86 178.601 18.50 66
VT 0.0% 20.0% 20.0% 60.0% 100.67 83.921 83.00 15
NCI Average
30.9% 14.5% 10.0% 44.6% 102.5 54.3 Total: 3022
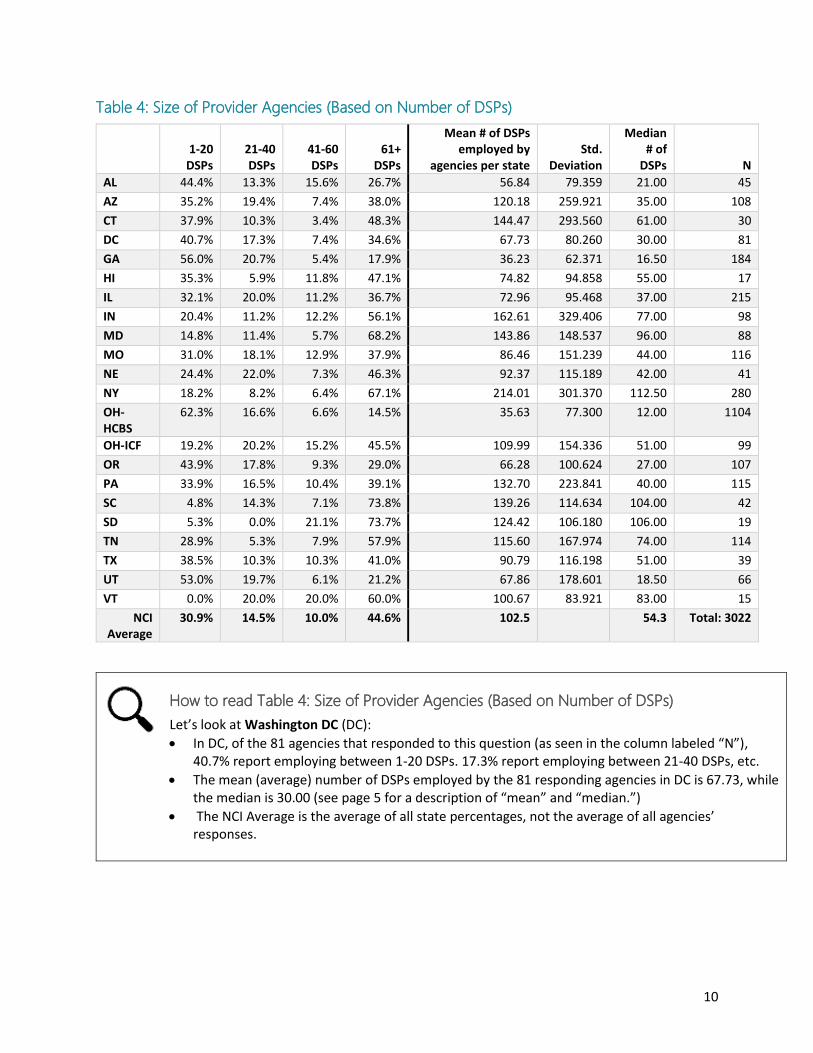
How to read Table 4: Size of Provider Agencies (Based on Number of DSPs)
Let’s look at Washington DC (DC):
In DC, of the 81 agencies that responded to this question (as seen in the column labeled “N”), 40.7% report employing between 1-20 DSPs. 17.3% report employing between 21-40 DSPs, etc.
The mean (average) number of DSPs employed by the 81 responding agencies in DC is 67.73, while the median is 30.00 (see page 5 for a description of “mean” and “median.”)
The NCI Average is the average of all state percentages, not the average of all agencies’ responses.
11
Types of Supports Provided
Of the respondents to the survey, 70.7% reported providing residential supports—supports provided to
a person who is living outside of the family home. This can include 24-hour supports such as a group
home or ICF/ID. It can also include people living in supported housing or supported living getting less
than 24 hours of support (if the provider agency owns the residential setting or operates the lease).
Residential Supports
Table 5: Does your agency provide residential supports to adults with IDD?
Yes No N
AL 82.2% 17.8% 45
AZ 36.1% 63.9% 108
CT 65.5% 34.5% 29
DC 66.7% 33.3% 81
GA 65.8% 34.2% 184
HI 23.5% 76.5% 17
IL 81.9% 18.1% 215
IN 73.5% 26.5% 98
MD 73.9% 26.1% 88
MO 81.0% 19.0% 116
NE 87.8% 12.2% 41
NY 67.5% 32.5% 280
OH-HCBS 43.4% 56.6% 1103
OH-ICF 99.0% 1.0% 99
OR 58.5% 41.5% 106
PA 55.7% 44.3% 115
SC 95.2% 4.8% 42
SD 100.0% 0.0% 19
TN 85.0% 15.0% 113
TX 74.4% 25.6% 39
UT 51.5% 48.5% 66
VT 86.7% 13.3% 15
NCI Average 70.7% 29.3% Total: 3019
12
Table 6: Residential Services: Breakout by State and Type*
Community-based 24-hr residential supports and services (e.g., group home, supported living
arrangement, supervised living facility)—not including nursing home, ICF
Less than 24-hr
residential supports
(agency owns home or operates
lease)
Foster Care/Host
Home (agency owns home or operates
lease)
Other residential supports
24-hour residential supports and services in a private institution, ICF-IID
* Not all those who reported providing residential supports specified the type of residential supports provided.
**Percentages edited to reflect services provided in the state.
***Ohio has a number of agencies that provide both ICF- and Waiver-funded services. Some of these agencies were unable to differentiate between ICF- and Waiver-funded
services for this survey.
^State policy does not pay for waiver services in community settings over 7 people.
13
In-Home Supports
Of the provider agencies that responded to the survey, 58.6% provide In-Home Supports—supports
provided to a person in their home (only if their home is not owned or leased by the provider agency).
Table 7: Does your agency provide in-home supports to individuals in their family home?
Yes No Total
AL 40.0% 60.0% 45
AZ 62.6% 37.4% 107
CT 44.8% 55.2% 29
DC 44.4% 55.6% 81
GA 46.4% 53.6% 183
HI 76.5% 23.5% 17
IL 36.9% 63.1% 214
IN 82.3% 17.7% 96
MD 62.8% 37.2% 86
MO 44.8% 55.2% 116
NE 80.5% 19.5% 41
NY 63.2% 36.8% 280
OH-HCBS 68.8% 31.2% 1101
OH-ICF 21.4%* 78.6% 98
OR 41.3% 58.7% 104
PA 55.7% 44.3% 115
SC 47.6% 52.4% 42
SD 68.4% 31.6% 19
TN 68.8% 31.3% 112
TX 84.6% 15.4% 39
UT 54.5% 45.5% 66
VT 93.3% 6.7% 15
NCI Average
58.6% 41.4% Total: 3006
*Ohio has a number of agencies that provide both ICF- and Waiver-funded services. Some of these agencies were
unable to differentiate between ICF- and Waiver-funded services for this survey.
14
Table 8: In-Home Supports: Breakout by State and Type
Homemaker Services
Personal Care
Services
In-Home Habilitation/Supported
Living (home is
not owned or leased
by agency) Family
Support
Foster Care/Host
Home (home is
not owned or leased
by agency) Other N
AL 5.6% 88.9% 5.6% 0.0% 0.0% 0.0% 18
AZ 34.3% 76.1% 91.0% 25.4% 11.9% 17.9% 67
CT 7.7% 61.5% 84.6% 15.4% 23.1% 38.5% 13
DC 11.1% 33.3% 86.1% 11.1% 13.9% 2.8% 36
GA 21.2% 78.8% 37.6% 27.1% 27.1% 12.9% 85
HI 38.5% 69.2% 76.9% 15.4% 15.4% 30.8% 13
IL 12.7% 43.0% 53.2% 35.4% 10.1% 26.6% 79
IN 20.3% 48.1% 83.5% 55.7% 15.2% 7.6% 79
MD 9.3% 61.1% 68.5% 31.5% 16.7% 16.7% 54
MO 7.7% 71.2% 44.2% 5.8% 11.5% 13.5% 52
NE 6.1% 12.1% 93.9% 6.1% 57.6% 0.0% 33
NY 5.1% 10.7% 81.4% 52.5% 2.8% 18.6% 177
OH-HCBS
92.1% 88.5% 29.0% 11.2% 9.2% 4.0% 758
OH-ICF 90.5%* 71.4%* 57.1%* 4.8%* 4.8%* 4.8%* 21
OR 30.2% 72.1% 79.1% 14.0% 0.0% 7.0% 43
PA 23.4% 29.7% 78.1% 6.3% 26.6% 15.6% 64
SC 5.0% 30.0% 45.0% 55.0% 20.0% 20.0% 20
SD 15.4% 23.1% 76.9% 30.8% 7.7% 15.4% 13
TN 22.1% 83.1% 46.8% 14.3% 6.5% 14.3% 77
TX 6.1% 39.4% 75.8% 9.1% 84.8% 18.2% 33
UT 33.3% 30.6% 80.6% 30.6% 30.6% 11.1% 36
VT 0.0% 57.1% 92.9% 35.7% 35.7% 7.1% 14
NCI Average
22.6% 53.6% 66.7% 22.4% 19.6% 13.8% Total: 1785
*Ohio has a number of agencies that provide both ICF- and Waiver-funded services. Some of these agencies were
unable to differentiate between ICF- and Waiver-funded services for this survey.
15
Non-Residential Supports
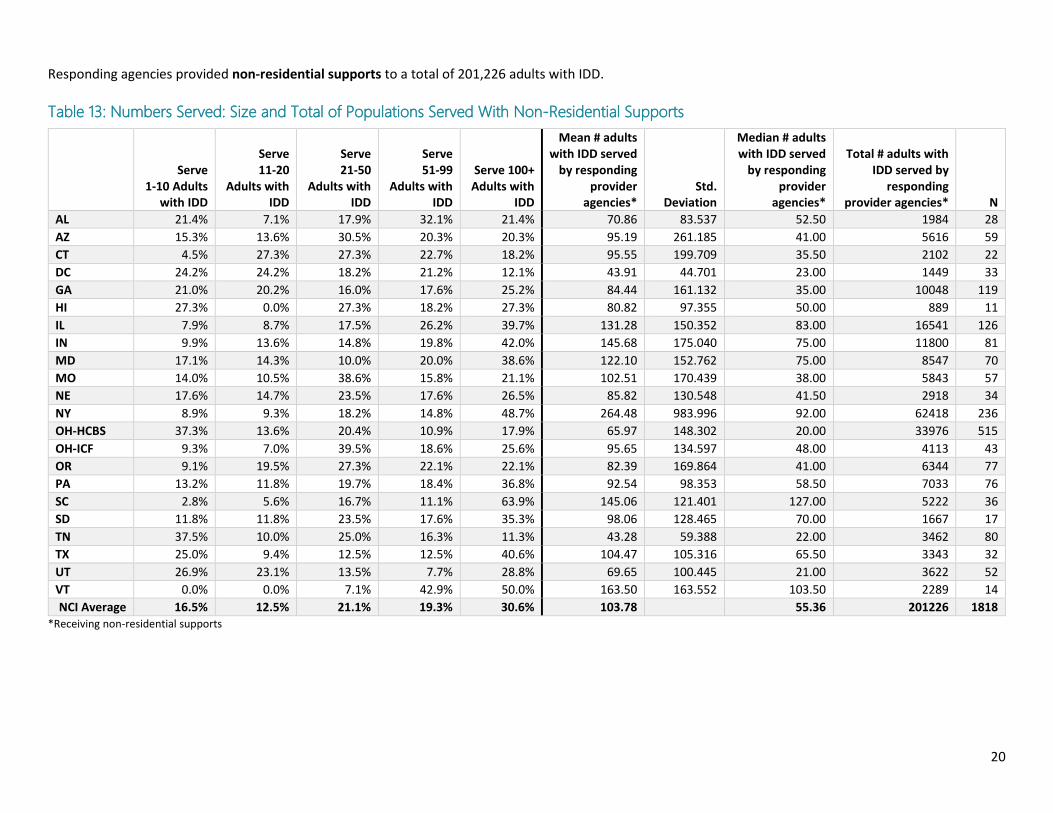
Of the provider agencies that responded to the survey, 75.4% provide non-residential supports and
services outside of the home.
Non-residential supports can include:
Day programs and community support programs (supports provided outside an individual’s
home such as adult day program services and community supports)
Job or vocational services (supports to help individuals who are looking for work or on the
job for which they are paid, e.g., work supports)
Table 9: Does your agency provide non-residential supports and services outside of the home?
Yes No N
AL 62.2% 37.8% 45
AZ 60.4% 39.6% 106
CT 79.3% 20.7% 29
DC 45.7% 54.3% 81
GA 67.4% 32.6% 184
HI 82.4% 17.6% 17
IL 64.0% 36.0% 214
IN 88.8% 11.2% 98
MD 85.2% 14.8% 88
MO 52.6% 47.4% 114
NE 90.2% 9.8% 41
NY 92.9% 7.1% 280
OH-HCBS 50.5% 49.5% 1102
OH-ICF 49.0% 51.0% 96
OR 76.4% 23.6% 106
PA 72.2% 27.8% 115
SC 90.5% 9.5% 42
SD 100.0% 0.0% 19
TN 80.0% 20.0% 110
TX 82.1% 17.9% 39
UT 86.2% 13.8% 65
VT 100.0% 0.0% 15
NCI Average 75.4% 24.6% Total: 3006
16
Of those providing non-residential supports, the following table presents the percentages that provide each type. These categories are not mutually exclusive.
Table 10: Non-residential Supports: Breakout by State and Type
Community-based supported
employment (individual or
group/enclave)
Community-based non-work, such as “community
integration” or “community
participation”
Community-based job
training (individual is
unpaid)
Facility-based employment, such as a sheltered
workshop in which the person with IDD gets paid
Facility-based non-work, such as a day
program or day training Other N
AL 50.0% 50.0% 17.9% 14.3% 85.7% 0.0% 28
AZ 48.4% 35.9% 18.8% 20.3% 78.1% 3.1% 64
CT 73.9% 73.9% 52.2% 21.7% 78.3% 17.4% 23
DC 51.4% 81.1% 29.7% 0.0%* 54.1% 10.8% 37
GA 58.9% 79.0% 29.8% 23.4% 64.5% 3.2% 124
HI 35.7% 71.4% 35.7% 21.4% 50.0% 21.4% 14
IL 53.3% 54.0% 27.7% 67.2% 85.4% 5.8% 137
IN 51.7% 78.2% 31.0% 40.2% 69.0% 2.3% 87
MD 77.3% 82.7% 49.3% 33.3% 62.7% 2.7% 75
MO 43.3% 75.0% 23.3% 20.0% 58.3% 6.7% 60
NE 86.5% 78.4% 59.5% 54.1% 67.6% 0.0% 37
NY 59.6% 67.7% 41.9% 24.2% 64.6% 16.5% 260
OH-HCBS 42.7% 57.3% 22.3% 37.0% 67.5% 6.1% 557
OH-ICF 38.3% 46.8% 29.8% 51.1% 83.0% 4.3% 47
OR 72.8% 80.2% 40.7% 38.3% 48.1% 8.6% 81
PA 41.0% 54.2% 21.7% 31.3% 62.7% 12.0% 83
SC 78.9% 60.5% 31.6% 86.8% 89.5% 2.6% 38
SD 94.7% 89.5% 57.9% 89.5% 100.0% 5.3% 19
TN 65.9% 80.7% 21.6% 19.3% 36.4% 5.7% 88
TX 43.8% 59.4% 25.0% 34.4% 87.5% 9.4% 32
UT 64.3% 53.6% 23.2% 21.4% 57.1% 1.8% 56
VT 100.0% 100.0% 33.3% 0.0%* 26.7% 6.7% 15
NCI Average 60.6% 68.6% 32.9% 34.1% 67.1% 6.9% Total: 1962
*Percentage edited to reflect services provided in VT and DC.
17
Numbers of Adults with IDD Supported
Responding agencies provided residential supports to 99,673 adults with IDD.
How to read Tables 11, 12 and 13: Numbers Served: Size and Total of Populations Served with Residential, In-Home and Non-
Residential supports
For example, let’s look at Table 11 and refer to Washington DC (DC):
51 agencies from DC responded to this question, as seen in the column labeled “N.”
Of the 51 agencies in DC that reported providing residential supports and responded to this question, 45.1% reported providing residential supports to 1-10 adults with IDD. Of those same 51 agencies that reported providing residential supports, 9.8% reported providing residential supports to 11-20 adults with IDD, etc.
27.88 is the mean (average) number of adults with IDD receiving residential supports from the 51 responding agencies, while the median is 18.00. (See page 5 for a description of “mean” and “median.”)
The 51 provider agencies in DC who responded to this question together provided residential supports to 1,422 adults with IDD.
18
Table 11: Numbers Served: Size and Total of Populations Served With Residential Supports
Of the provider agencies that responded to the survey, 47.4% provided respite services.
Respite
Table 14: Does your agency provide respite services?
Yes No N
AL 34.9% 65.1% 43
AZ 71.8% 28.2% 103
CT 46.4% 53.6% 28
DC 46.8% 53.2% 79
GA 18.1% 81.9% 182
HI 43.8% 56.3% 16
IL 16.4% 83.6% 213
IN 82.7% 17.3% 98
MD 55.2% 44.8% 87
MO 33.3% 66.7% 114
NE 47.5% 52.5% 40
NY 67.7% 32.3% 279
OH-HCBS 34.8% 65.2% 1078
OH-ICF 52.6% 47.4% 97
OR 16.3% 83.7% 104
PA 50.0% 50.0% 114
SC 63.4% 36.6% 41
SD 27.8% 72.2% 18
TN 65.1% 34.9% 109
TX 66.7% 33.3% 39
UT 45.3% 54.7% 64
VT 57.1% 42.9% 14
NCI Average
47.4% 52.6% Total: 2960
22
Agency Characteristics
Agencies that Distinguish Between Full-Time and Part-Time DSP Positions
This table demonstrates the percentage of provider agencies that differentiate between positions that
are full time and positions that are part time.
Table 15: Does your agency distinguish between full-time and part-time positions?
Yes No N
AL 86.4% 13.6% 44
AZ 75.5% 24.5% 106
CT 93.1% 6.9% 29
DC 81.3% 18.8% 80
GA 72.5% 27.5% 182
HI 94.1% 5.9% 17
IL 89.2% 10.8% 212
IN 93.9% 6.1% 98
MD 98.9% 1.1% 87
MO 86.0% 14.0% 114
NE 92.7% 7.3% 41
NY 98.2% 1.8% 279
OH-HCBS 67.2% 32.8% 1096
OH-ICF 100.0% 0.0% 98
OR 83.0% 17.0% 106
PA 81.6% 18.4% 114
SC 95.2% 4.8% 42
SD 100.0% 0.0% 19
TN 85.5% 14.5% 110
TX 84.6% 15.4% 39
UT 72.7% 27.3% 66
VT 100.0% 0.0% 15
NCI Average 87.8% 12.2% Total: 2994
23
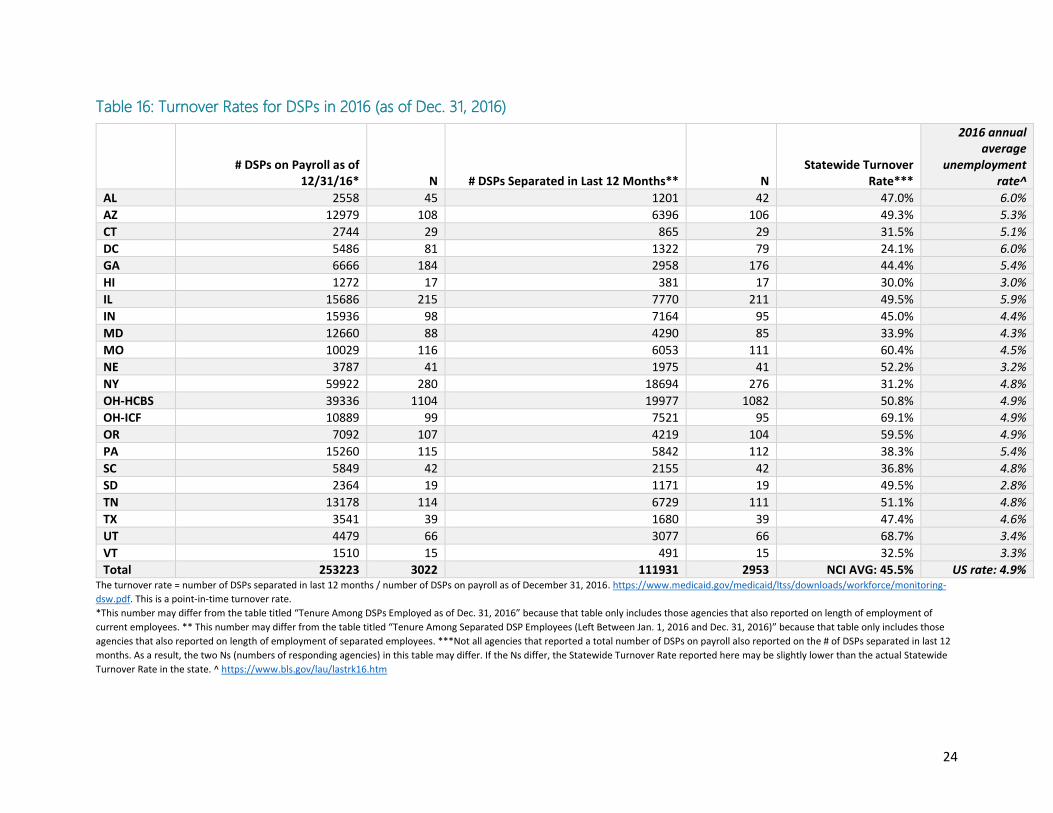
Turnover Rates
How to read Table 16: Turnover Rates for DSPs in 2016 (as of Dec. 31, 2016)
For example, let’s look at Table 16 and refer to Washington DC (DC):
A different number of agencies responded to each of the two questions that make up this table. The number of responding agencies to each question is represented in the columns labeled “N.”
As of December 31, 2016, the agencies from DC who responded to the questions included in this table had a total of 5,486 DSPs on payroll.
As of December 31, 2016, the agencies from DC who responded to the questions included in this table had a total of 1,322 DSPs that had left (separated from) their agency in the past 12 months.
This results in a turnover rate of 24.1% (1,322 divided by 5,486) as of December 31, 2016
The final column demonstrates the 2016 average annual unemployment rate in DC: 6.0%
24
Table 16: Turnover Rates for DSPs in 2016 (as of Dec. 31, 2016)
# DSPs on Payroll as of 12/31/16* N # DSPs Separated in Last 12 Months** N
Statewide Turnover Rate***
2016 annual average
unemployment rate^
AL 2558 45 1201 42 47.0% 6.0%
AZ 12979 108 6396 106 49.3% 5.3%
CT 2744 29 865 29 31.5% 5.1%
DC 5486 81 1322 79 24.1% 6.0%
GA 6666 184 2958 176 44.4% 5.4%
HI 1272 17 381 17 30.0% 3.0%
IL 15686 215 7770 211 49.5% 5.9%
IN 15936 98 7164 95 45.0% 4.4%
MD 12660 88 4290 85 33.9% 4.3%
MO 10029 116 6053 111 60.4% 4.5%
NE 3787 41 1975 41 52.2% 3.2%
NY 59922 280 18694 276 31.2% 4.8%
OH-HCBS 39336 1104 19977 1082 50.8% 4.9%
OH-ICF 10889 99 7521 95 69.1% 4.9%
OR 7092 107 4219 104 59.5% 4.9%
PA 15260 115 5842 112 38.3% 5.4%
SC 5849 42 2155 42 36.8% 4.8%
SD 2364 19 1171 19 49.5% 2.8%
TN 13178 114 6729 111 51.1% 4.8%
TX 3541 39 1680 39 47.4% 4.6%
UT 4479 66 3077 66 68.7% 3.4%
VT 1510 15 491 15 32.5% 3.3%
Total 253223 3022 111931 2953 NCI AVG: 45.5% US rate: 4.9% The turnover rate = number of DSPs separated in last 12 months / number of DSPs on payroll as of December 31, 2016. https://www.medicaid.gov/medicaid/ltss/downloads/workforce/monitoring-
dsw.pdf. This is a point-in-time turnover rate.
*This number may differ from the table titled “Tenure Among DSPs Employed as of Dec. 31, 2016” because that table only includes those agencies that also reported on length of employment of
current employees. ** This number may differ from the table titled “Tenure Among Separated DSP Employees (Left Between Jan. 1, 2016 and Dec. 31, 2016)” because that table only includes those
agencies that also reported on length of employment of separated employees. ***Not all agencies that reported a total number of DSPs on payroll also reported on the # of DSPs separated in last 12
months. As a result, the two Ns (numbers of responding agencies) in this table may differ. If the Ns differ, the Statewide Turnover Rate reported here may be slightly lower than the actual Statewide
Turnover Rate in the state. ^ https://www.bls.gov/lau/lastrk16.htm
Table 17: Tenure Among DSPs Employed as of Dec. 31, 2016*
*New for 2016: This table only includes agencies that provided information on both the total number of DSPs and the tenure of employees.
Total # DSPs
employed as of 12/31/16 N
DSPs on staff employed for
< 6 months
DSPs on staff employed for 6-12 months
DSPs on staff employed for
12+ months
AL 2357 39 17.9% 17.7% 64.4%
AZ 12454 100 31.2% 15.8% 52.9%
CT 2345 27 11.9% 13.9% 74.2%
DC 4591 70 15.7% 17.1% 67.2%
GA 6243 164 17.6% 17.8% 64.6%
HI 1244 16 20.3% 23.3% 56.4%
IL 14517 199 17.9% 14.1% 68.0%
IN 15610 91 19.6% 17.3% 63.1%
MD 11788 81 14.2% 12.3% 73.5%
MO 9679 108 23.2% 15.3% 61.5%
NE 3331 37 16.5% 13.4% 70.0%
NY 58781 272 14.5% 13.9% 71.6%
OH-HCBS 37219 996 19.9% 18.3% 61.8%
OH-ICF 10812 97 19.8% 15.5% 64.7%
OR 6827 94 26.0% 18.0% 56.1%
PA 15094 109 15.4% 12.9% 71.6%
SC 5485 40 14.0% 11.3% 74.7%
SD 2364 19 20.2% 12.2% 67.6%
TN 12534 103 19.2% 18.0% 62.8%
TX 3504 35 21.5% 13.5% 65.1%
UT 4444 64 28.7% 21.0% 50.3%
VT 1510 15 14.5% 12.5% 73.0%
Total 242733 2776 AVG: 19.1% AVG: 15.7% AVG: 65.2%
How to read Table 17: Tenure Among DSPs
Employed as of Dec. 31, 2016
For example, let’s look at Table 17 and refer to Washington DC (DC):
This table only includes the 70 agencies in DC that provided information on both the total number of DSPs and the tenure of those DSPs; DC’s N for this question is 70.
As of December 31, 2016, the 70 DC agencies included in this table had 4,591 DSPs on payroll.
Of those 4,591 DSPs on payroll, 15.7% had been employed for less than 6
months 17.1% had been employed for 6-12 months 67.2% had been employed for over 12
months.
26
Table 18: Tenure Among Separated DSP Employees (Left Between Jan. 1, 2016 and Dec. 31, 2016) *
*New for 2016: This table only includes agencies that provided information on both the total number of separated DSPs and the tenure of separated DSPs.
Total # DSPs
separated from agency between
1/1/16 and 12/31/16 N
DSPs separating from employment
who were employed < 6 months
DSPs separating from
employment who were employed 6-
12 months
DSPs separating from employment
who were employed 12+ months
AL 1188 32 37.6% 24.8% 37.5%
AZ 6062 86 49.5% 19.0% 31.5%
CT 697 24 28.8% 21.8% 49.4%
DC 1263 56 26.3% 26.8% 46.9%
GA 2833 123 36.4% 20.0% 43.6%
HI 363 10 41.9% 23.4% 34.7%
IL 7397 182 46.4% 18.1% 35.5%
IN 7042 84 34.5% 24.6% 40.9%
MD 4055 75 24.7% 19.1% 56.2%
MO 5738 98 50.4% 20.7% 28.9%
NE 1829 35 41.0% 17.9% 41.1%
NY 18303 252 27.4% 19.3% 53.3%
OH-HCBS
19323 720 47.6% 21.0% 31.4%
OH-ICF 7511 91 49.6% 17.2% 33.2%
OR 4201 89 41.5% 23.7% 34.8%
PA 5827 89 32.0% 18.8% 49.2%
SC 2080 39 28.9% 17.9% 53.1%
SD 1171 19 41.6% 17.3% 41.1%
TN 6364 91 42.6% 24.7% 32.7%
TX 1678 30 38.6% 23.3% 38.1%
UT 3065 51 49.5% 22.8% 27.7%
VT 483 14 23.2% 20.5% 56.3%
Total 108473 2290 NCI AVERAGE: 38.2% NCI AVERAGE: 21.0%
NCI AVERAGE: 40.8%
How to read Table 18: Tenure
Among Separated DSP Employees (Left
Between Jan. 1, 2016 and Dec. 31, 2016)
For example, let’s look at Table 18 and refer to
Washington DC (DC)
This table only includes the 56 agencies in DC that provided information on both the total number of separated DSPs and the tenure of those separated DSPs
Between 1/1/16 and 12/31/16, the 56 DC agencies included in this table had a total of 1,263 DSPs separate from their agencies.
Of those 1,263 separated DSPs, 26.3% had been employed for less
than 6 months 26.8% had been employed for 6-
12 months 46.9% had been employed for
over 12 months.
27
Vacancy Rates
Tables 19 and 20 include only those provider agencies that indicated they differentiated between full-time and part-time employees.
How to read Table 19 and 20: Full- and Part-time DSP Positions and Vacancy Rates (as of Dec. 31, 2016)
For example, let’s look at Table 19 and refer to Washington DC (DC):
Tables 19 and 20 include only those provider agencies that indicated they differentiated between full-time and part-time employees.
A different number of agencies responded to each of the three questions that make up this table. The number of responding agencies to each question is represented in the columns labeled “N.”
The responding agencies from DC reported employing a total of 3,528 full-time DSPs.
They also reported that there were 164 full-time positions vacant.
This adds up to 3,692 total full-time positions (filled positions and vacant positions together)
This represents an 4.4% full-time vacancy rate (164 full-time position vacancies out of 3,692 full time positions)
28
Table 19: Full-time DSP Positions and Vacancy Rates (as of Dec. 31, 2016)
# Full-Time DSPs
Employed N # Full-Time Position Vacancies N Total # Full-Time DSP Positions N Statewide Full-Time Vacancy Rate*
AL 1697 38 155 38 1852 38 8.4%
AZ 4078 78 581 77 4659 79 12.5%
CT 1538 27 125 27 1663 27 7.5%
DC 3528 64 164 65 3692 65 4.4%
GA 3614 132 365 130 3979 132 9.2%
HI 284 15 14 13 298 15 4.7%
IL 10615 185 1809 182 12424 186 14.6%
IN 9844 90 1324 86 11168 90 11.9%
MD 7938 83 696 82 8634 83 8.1%
MO 6517 95 581 94 7098 95 8.2%
NE 2472 36 236 32 2708 37 8.7%
NY 36568 271 4848 267 41416 272 11.7%
OH-HCBS 19811 732 1896 720 21707 732 8.7%
OH-ICF 6802 97 960 95 7762 97 12.4%
OR 5076 85 631 82 5707 85 11.1%
PA 10340 92 1303 89 11643 92 11.2%
SC 4277 40 396 39 4673 40 8.5%
SD 1612 19 196 19 1808 19 10.8%
TN 6910 92 1137 91 8047 92 14.1%
TX 1943 33 262 32 2205 33 11.9%
UT 2119 48 197 47 2316 48 8.5%
VT 938 15 77 15 1015 15 7.6%
Total 148521 2367 17953 2322 166474 2372 NCI AVERAGE: 9.8%
*This is a point-in-time vacancy rate, not cumulative or an average across the year. Vacancy rates are calculated as follows: Vacant positions/total number of full-time direct support positions.
29
Table 20: Part-Time DSP Positions and Vacancy Rates (as of Dec. 31, 2016)
# Part-time DSPs Employed
N # Part-time Position Vacancies
N Total # Part-time DSP Positions
N Statewide Part-time Vacancy Rate*
AL 572 38 180 36 752 38 23.9%
AZ 6280 78 342 77 6622 79 5.2%
CT 965 27 165 27 1130 27 14.6%
DC 1281 63 214 64 1495 64 14.3%
GA 1826 132 348 129 2174 132 16.0%
HI 797 15 43 13 840 15 5.1%
IL 3424 183 1062 182 4486 184 23.7%
IN 5217 90 626 86 5843 90 10.7%
MD 4055 83 848 82 4903 83 17.3%
MO 2787 95 570 93 3357 95 17.0%
NE 761 36 80 32 841 37 9.5%
NY 19691 270 4331 264 24022 271 18.0%
OH-HCBS 11706 731 1791 711 13497 732 13.3%
OH-ICF 3724 97 1017 94 4741 97 21.5%
OR 1495 85 170 81 1665 85 10.2%
PA 3687 92 695 87 4382 92 15.9%
SC 1433 40 375 38 1808 40 20.7%
SD 594 19 229 18 823 19 27.8%
TN 2765 92 591 91 3356 92 17.6%
TX 747 33 98 32 845 33 11.6%
UT 2015 48 263 48 2278 48 11.5%
VT 472 15 78 15 550 15 14.2%
Total 76294 2362 14116 2300 90410 2368 NCI AVERAGE: 15.4%
*This is a point-in-time vacancy rate, not cumulative or an average across the year. Vacancy rates are calculated as follows: Vacant positions/total number of part-time direct support positions.
30
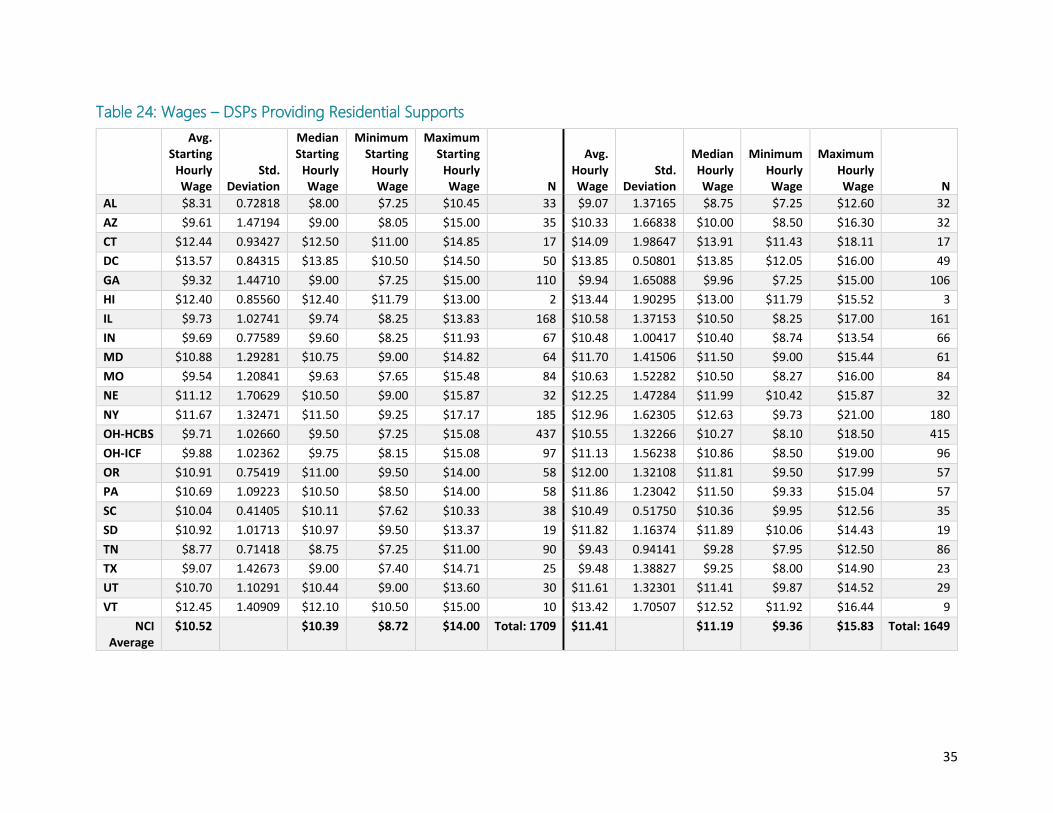
Wages
This section provides data on hourly wages5. The wage tables demonstrate the average starting wage (the average hourly wage paid to new
DSPs), the median starting wage, as well as the minimum and maximum starting hourly wages as reported by provider agencies. The table also
demonstrates the average wage (the average hourly wage paid to all DSPs regardless of how long they’ve been working), median wage and the
minimum and maximum hourly wages as reported by provider agencies.
Please Note: In the calculation of average and median hourly wages, reported wages less than $4 or greater than or equal to $30/hour were
excluded.
5 For all wage tables, we deleted all values of $0, <$4 and over $30
31
Table 21: Average Hourly Wage - All DSPs
State Minimum Wage6 Avg. Hourly Wage Std. Deviation Median Hourly Wage Minimum hourly wage Maximum hourly wage N
**In 2016 OR had two minimum wages: $9.75/hour for those living in Portland Urban Growth Boundary (UGB); Nonurban areas had a $9.50/hour minimum wage; and “other
**In 2016 OR had two minimum wages: $9.75/hour for those living in Portland Urban Growth Boundary (UGB); Nonurban areas had a $9.50/hour minimum wage; and “other
Table 28: Frequency of Bonuses between Jan. 1, 2016 and Dec. 31, 2016
Quarterly Twice a year Once a year Other N
AL 5.6% 16.7% 77.8% 0.0% 18
AZ 6.1% 0.0% 72.7% 21.2% 33
CT 0.0% 23.1% 69.2% 7.7% 13
DC 4.2% 12.5% 79.2% 4.2% 24
GA 6.6% 8.2% 80.3% 4.9% 61
HI 0.0% 0.0% 75.0% 25.0% 4
IL 4.0% 14.1% 75.8% 6.1% 99
IN 10.8% 5.4% 51.4% 32.4% 37
MD 2.0% 20.4% 57.1% 20.4% 49
MO 5.9% 11.8% 62.7% 19.6% 51
NE 0.0% 11.1% 66.7% 22.2% 9
NY 1.8% 15.2% 72.3% 10.7% 112
OH-HCBS 5.4% 13.4% 65.3% 15.8% 404
OH-ICF 5.8% 7.7% 63.5% 23.1% 52
OR 3.4% 5.2% 69.0% 22.4% 58
PA 2.6% 13.2% 71.1% 13.2% 38
SC 0.0% 0.0% 77.8% 22.2% 9
SD 11.1% 22.2% 55.6% 11.1% 9
TN 3.8% 11.5% 75.0% 9.6% 52
TX 0.0% 7.7% 84.6% 7.7% 13
UT 7.1% 17.9% 53.6% 21.4% 28
VT 0.0% 33.3% 66.7% 0.0% 6
NCI Average 3.9% 12.3% 69.2% 14.6% Total: 1179
“Other” responses included: referral, performance based, employee of the month, longevity, as funds allow, more frequently than quarterly.
39
Benefits
Table 29: Offer Pooled Paid Time Off
(These responses include only those provider agencies that indicated they differentiated between full-time and part-time
employees (N=2,400).) “Pooled Paid time off” is defined as a bank of hours in which the employer pools sick days, vacation days, and
personal days together and the agency doesn’t distinguish between category of time off.
To All DSPs To FT DSPs Only To PT DSPs Only Do Not Offer Don't Know N
AL 21.2% 36.4% 0.0% 30.3% 12.1% 33
AZ 28.8% 30.1% 0.0% 32.9% 8.2% 73
CT 68.0% 16.0% 0.0% 8.0% 8.0% 25
DC 37.7% 26.2% 0.0% 27.9% 8.2% 61
GA 16.3% 43.1% 0.0% 36.6% 4.1% 123
HI 25.0% 25.0% 0.0% 31.3% 18.8% 16
IL 35.2% 32.4% 0.0% 28.5% 3.9% 179
IN 31.9% 42.9% 1.1% 20.9% 3.3% 91
MD 39.0% 40.2% 0.0% 19.5% 1.2% 82
MO 30.2% 45.3% 0.0% 23.3% 1.2% 86
NE 26.3% 47.4% 0.0% 18.4% 7.9% 38
NY 50.6% 23.3% 0.8% 21.0% 4.3% 257
OH-HCBS 31.8% 27.4% 0.1% 36.4% 4.3% 720
OH-ICF 71.3% 22.3% 0.0% 6.4% 0.0% 94
OR 63.0% 9.9% 0.0% 19.8% 7.4% 81
PA 38.1% 39.3% 1.2% 14.3% 7.1% 84
SC 25.0% 44.4% 0.0% 22.2% 8.3% 36
SD 29.4% 29.4% 5.9% 35.3% 0.0% 17
TN 16.3% 46.5% 0.0% 33.7% 3.5% 86
TX 24.1% 58.6% 0.0% 10.3% 6.9% 29
UT 24.4% 26.7% 0.0% 37.8% 11.1% 45
VT 40.0% 20.0% 0.0% 40.0% 0.0% 15
NCI Average 35.2% 33.3% 0.4% 25.2% 5.9% Total: 2271
How to read Table 29: Offer Pooled Paid Time Off For example, let’s look at Table 29 and refer to Washington DC (DC): “Pooled Paid time off” is defined as a bank of hours in which the employer pools sick days, vacation days, and personal days together and the agency doesn’t distinguish between category of time off.
Of the 61 DC agencies that responded to this question (represented in the column
labeled “N”), 63.9% reported providing pooled paid time off to at least some DSPs.
37.7%% reported providing pooled paid time off to all DSPs
26.2% reported providing paid pooled time off to FT DSPs only
27.9% reported that they didn’t provide paid pooled time off at all, and
8.2% didn’t know whether pooled paid time off was offered.
40
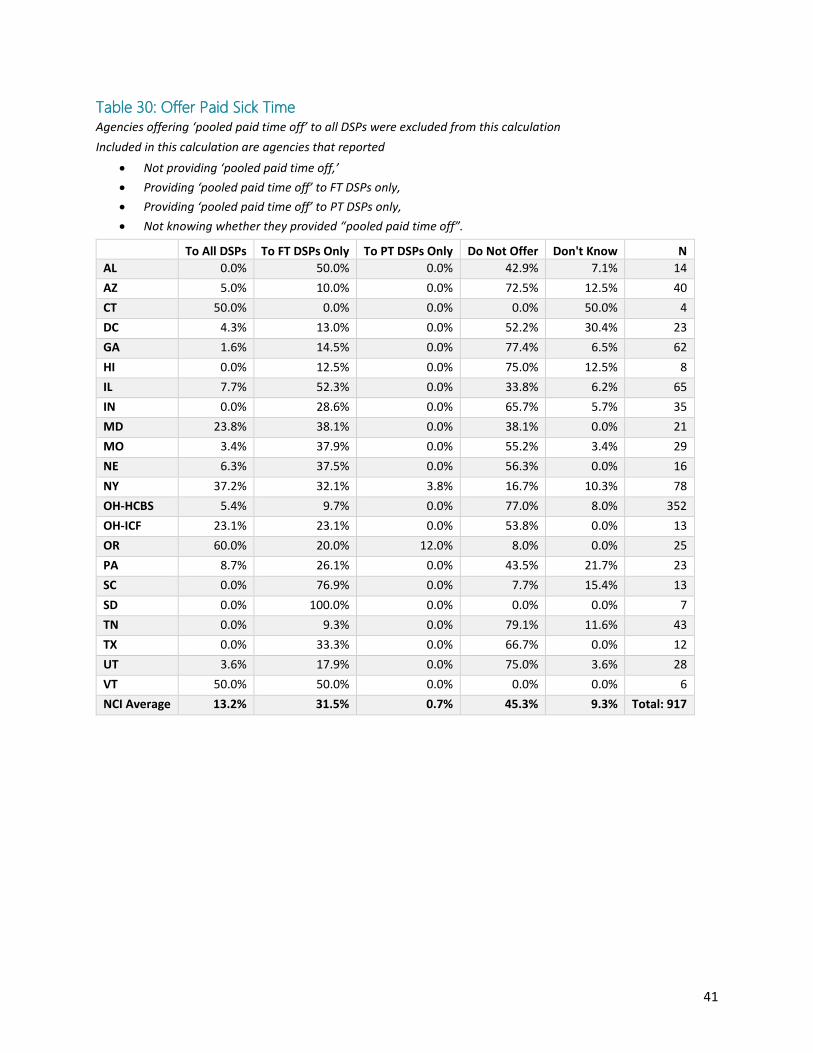
How to read Tables 30, 31 and 32: Offer Paid Sick Time, Paid Vacation Time, Paid Personal Time
For example, let’s look at Table 30 and refer to Washington DC (DC):
This table demonstrates only responses from DC agencies that reported:
o Not providing ‘pooled paid time off,’
o Providing ‘pooled paid time off’ to FT DSPs only,
o Providing ‘pooled paid time off’ to PT DSPs only,
o Not knowing whether they provided “pooled paid time off”.
Of those agencies, 23 responded to this question
17.3% of the 23 DC provider agencies who responded to this question reported
providing paid sick time to some DSPs.
4.3% provided paid sick time to ALL DSPs
13.0% provided paid sick time to FT DSPs only
52.2% did not offer paid sick time to any DSPs
30.4% did not know whether paid sick time was offered.
41
Table 30: Offer Paid Sick Time Agencies offering ‘pooled paid time off’ to all DSPs were excluded from this calculation
Included in this calculation are agencies that reported
Not providing ‘pooled paid time off,’
Providing ‘pooled paid time off’ to FT DSPs only,
Providing ‘pooled paid time off’ to PT DSPs only,
Not knowing whether they provided “pooled paid time off”.
To All DSPs To FT DSPs Only To PT DSPs Only Do Not Offer Don't Know N
AL 0.0% 50.0% 0.0% 42.9% 7.1% 14
AZ 5.0% 10.0% 0.0% 72.5% 12.5% 40
CT 50.0% 0.0% 0.0% 0.0% 50.0% 4
DC 4.3% 13.0% 0.0% 52.2% 30.4% 23
GA 1.6% 14.5% 0.0% 77.4% 6.5% 62
HI 0.0% 12.5% 0.0% 75.0% 12.5% 8
IL 7.7% 52.3% 0.0% 33.8% 6.2% 65
IN 0.0% 28.6% 0.0% 65.7% 5.7% 35
MD 23.8% 38.1% 0.0% 38.1% 0.0% 21
MO 3.4% 37.9% 0.0% 55.2% 3.4% 29
NE 6.3% 37.5% 0.0% 56.3% 0.0% 16
NY 37.2% 32.1% 3.8% 16.7% 10.3% 78
OH-HCBS 5.4% 9.7% 0.0% 77.0% 8.0% 352
OH-ICF 23.1% 23.1% 0.0% 53.8% 0.0% 13
OR 60.0% 20.0% 12.0% 8.0% 0.0% 25
PA 8.7% 26.1% 0.0% 43.5% 21.7% 23
SC 0.0% 76.9% 0.0% 7.7% 15.4% 13
SD 0.0% 100.0% 0.0% 0.0% 0.0% 7
TN 0.0% 9.3% 0.0% 79.1% 11.6% 43
TX 0.0% 33.3% 0.0% 66.7% 0.0% 12
UT 3.6% 17.9% 0.0% 75.0% 3.6% 28
VT 50.0% 50.0% 0.0% 0.0% 0.0% 6
NCI Average 13.2% 31.5% 0.7% 45.3% 9.3% Total: 917
42
Table 31: Offer Paid Vacation Time
Agencies offering ‘pooled paid time off’ to all DSPs were excluded from this calculation
Included in this calculation are agencies that reported
Not providing ‘pooled paid time off,’
Providing ‘paid time off’ to FT DSPs only,
Providing ‘paid time off’ to PT DSPs only,
Not knowing whether they provided “paid time off”.
To All DSPs To FT DSPs Only To PT DSPs Only Do Not Offer Don't Know N
AL 7.1% 42.9% 0.0% 42.9% 7.1% 14
AZ 0.0% 11.4% 0.0% 74.3% 14.3% 35
CT 50.0% 25.0% 0.0% 0.0% 25.0% 4
DC 8.7% 13.0% 0.0% 47.8% 30.4% 23
GA 1.7% 15.0% 0.0% 76.7% 6.7% 60
HI 0.0% 12.5% 0.0% 75.0% 12.5% 8
IL 14.3% 61.9% 0.0% 17.5% 6.3% 63
IN 6.5% 35.5% 0.0% 54.8% 3.2% 31
MD 22.7% 40.9% 0.0% 36.4% 0.0% 22
MO 3.7% 51.9% 0.0% 40.7% 3.7% 27
NE 6.3% 37.5% 0.0% 50.0% 6.3% 16
NY 24.7% 41.6% 0.0% 22.1% 11.7% 77
OH-HCBS 6.4% 20.9% 0.0% 63.6% 9.1% 330
OH-ICF 9.1% 45.5% 0.0% 45.5% 0.0% 11
OR 8.7% 60.9% 0.0% 26.1% 4.3% 23
PA 10.0% 35.0% 0.0% 30.0% 25.0% 20
SC 0.0% 76.9% 0.0% 7.7% 15.4% 13
SD 14.3% 85.7% 0.0% 0.0% 0.0% 7
TN 2.4% 14.3% 0.0% 71.4% 11.9% 42
TX 0.0% 36.4% 0.0% 63.6% 0.0% 11
UT 3.6% 32.1% 3.6% 57.1% 3.6% 28
VT 33.3% 66.7% 0.0% 0.0% 0.0% 6
NCI Average 10.6% 39.2% 0.2% 41.1% 8.9% Total: 871
43
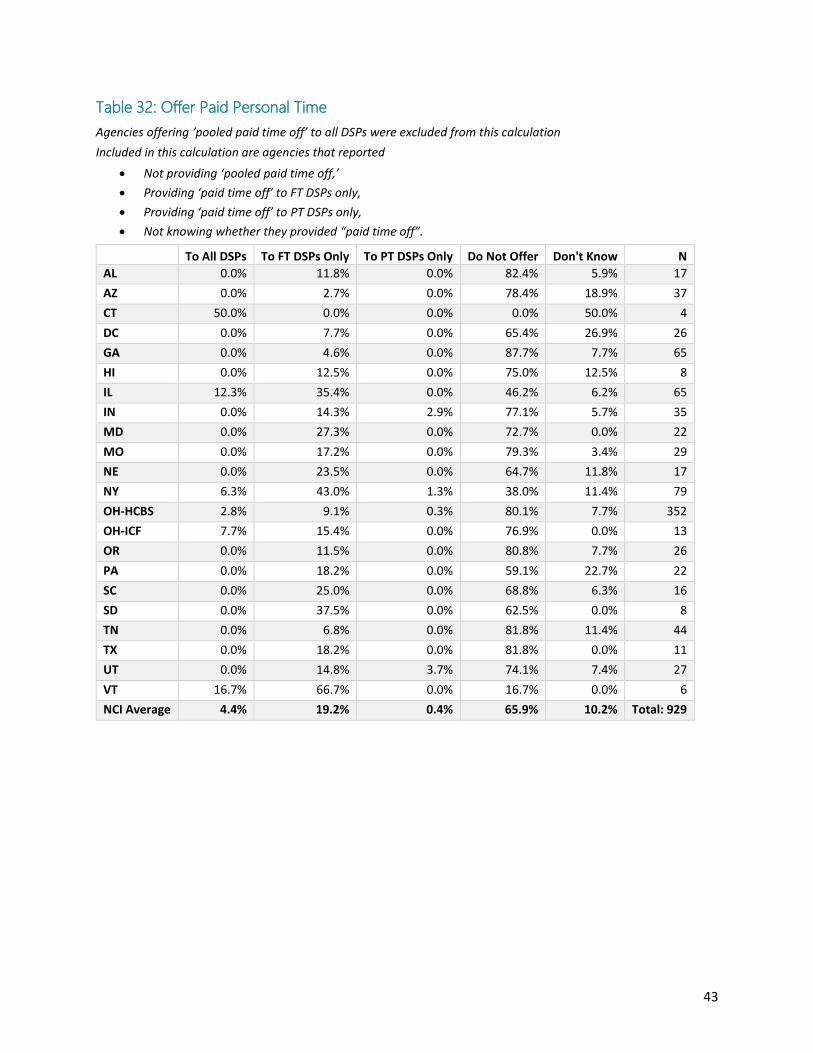
Table 32: Offer Paid Personal Time
Agencies offering ‘pooled paid time off’ to all DSPs were excluded from this calculation
Included in this calculation are agencies that reported
Not providing ‘pooled paid time off,’
Providing ‘paid time off’ to FT DSPs only,
Providing ‘paid time off’ to PT DSPs only,
Not knowing whether they provided “paid time off”.
To All DSPs To FT DSPs Only To PT DSPs Only Do Not Offer Don't Know N
AL 0.0% 11.8% 0.0% 82.4% 5.9% 17
AZ 0.0% 2.7% 0.0% 78.4% 18.9% 37
CT 50.0% 0.0% 0.0% 0.0% 50.0% 4
DC 0.0% 7.7% 0.0% 65.4% 26.9% 26
GA 0.0% 4.6% 0.0% 87.7% 7.7% 65
HI 0.0% 12.5% 0.0% 75.0% 12.5% 8
IL 12.3% 35.4% 0.0% 46.2% 6.2% 65
IN 0.0% 14.3% 2.9% 77.1% 5.7% 35
MD 0.0% 27.3% 0.0% 72.7% 0.0% 22
MO 0.0% 17.2% 0.0% 79.3% 3.4% 29
NE 0.0% 23.5% 0.0% 64.7% 11.8% 17
NY 6.3% 43.0% 1.3% 38.0% 11.4% 79
OH-HCBS 2.8% 9.1% 0.3% 80.1% 7.7% 352
OH-ICF 7.7% 15.4% 0.0% 76.9% 0.0% 13
OR 0.0% 11.5% 0.0% 80.8% 7.7% 26
PA 0.0% 18.2% 0.0% 59.1% 22.7% 22
SC 0.0% 25.0% 0.0% 68.8% 6.3% 16
SD 0.0% 37.5% 0.0% 62.5% 0.0% 8
TN 0.0% 6.8% 0.0% 81.8% 11.4% 44
TX 0.0% 18.2% 0.0% 81.8% 0.0% 11
UT 0.0% 14.8% 3.7% 74.1% 7.4% 27
VT 16.7% 66.7% 0.0% 16.7% 0.0% 6
NCI Average 4.4% 19.2% 0.4% 65.9% 10.2% Total: 929
44
Table 33: Offer Health Insurance
To All DSPs To FT DSPs Only To PT DSPs Only Do Not Offer Don't Know N
AL 12.1% 60.6% 0.0% 24.2% 3.0% 33
AZ 11.0% 56.2% 0.0% 27.4% 5.5% 73
CT 11.5% 80.8% 0.0% 3.8% 3.8% 26
DC 18.8% 48.4% 0.0% 25.0% 7.8% 64
GA 8.1% 43.9% 0.0% 44.7% 3.3% 123
HI 50.0% 43.8% 0.0% 6.3% 0.0% 16
IL 6.1% 72.6% 0.0% 19.6% 1.7% 179
IN 8.9% 68.9% 0.0% 21.1% 1.1% 90
MD 17.1% 79.3% 0.0% 3.7% 0.0% 82
MO 4.5% 75.3% 0.0% 20.2% 0.0% 89
NE 13.5% 73.0% 0.0% 10.8% 2.7% 37
NY 26.1% 69.7% 0.8% 3.0% 0.4% 264
OH-HCBS 8.5% 43.0% 0.0% 45.9% 2.6% 726
OH-ICF 24.5% 71.4% 0.0% 3.1% 1.0% 98
OR 10.5% 73.3% 1.2% 15.1% 0.0% 86
PA 9.2% 81.6% 1.1% 5.7% 2.3% 87
SC 12.8% 82.1% 0.0% 5.1% 0.0% 39
SD 15.8% 84.2% 0.0% 0.0% 0.0% 19
TN 13.5% 57.3% 1.1% 24.7% 3.4% 89
TX 16.7% 53.3% 0.0% 30.0% 0.0% 30
UT 6.5% 54.3% 0.0% 37.0% 2.2% 46
VT 14.3% 78.6% 7.1% 0.0% 0.0% 14
NCI Average 14.5% 66.0% 0.5% 17.1% 1.9% Total: 2310
45
Table 34: Offer Dental Insurance
To All DSPs To FT DSPs Only To PT DSPs Only Do Not Offer Don't Know N
AL 12.1% 60.6% 0.0% 24.2% 3.0% 33
AZ 20.8% 45.8% 0.0% 30.6% 2.8% 72
CT 7.7% 80.8% 0.0% 11.5% 0.0% 26
DC 16.1% 50.0% 0.0% 27.4% 6.5% 62
GA 9.8% 42.6% 0.0% 44.3% 3.3% 122
HI 40.0% 46.7% 0.0% 13.3% 0.0% 15
IL 10.1% 63.1% 0.0% 24.6% 2.2% 179
IN 18.7% 58.2% 0.0% 22.0% 1.1% 91
MD 18.5% 71.6% 0.0% 8.6% 1.2% 81
MO 14.4% 54.4% 0.0% 30.0% 1.1% 90
NE 18.4% 63.2% 0.0% 15.8% 2.6% 38
NY 28.0% 64.0% 1.1% 5.7% 1.1% 264
OH-HCBS 12.2% 35.8% 0.1% 49.5% 2.4% 721
OH-ICF 21.6% 72.2% 0.0% 5.2% 1.0% 97
OR 20.0% 60.0% 0.0% 20.0% 0.0% 85
PA 17.2% 66.7% 0.0% 13.8% 2.3% 87
SC 15.4% 82.1% 0.0% 2.6% 0.0% 39
SD 21.1% 73.7% 0.0% 5.3% 0.0% 19
TN 26.7% 48.9% 0.0% 22.2% 2.2% 90
TX 13.3% 53.3% 0.0% 33.3% 0.0% 30
UT 8.7% 52.2% 0.0% 37.0% 2.2% 46
VT 14.3% 85.7% 0.0% 0.0% 0.0% 14
NCI Average 17.5% 60.5% 0.1% 20.3% 1.6% Total: 2301
46
Table 35: Offer Vision Insurance
To All DSPs To FT DSPs Only To PT DSPs Only Do Not Offer Don't Know N
AL 9.1% 42.4% 0.0% 42.4% 6.1% 33
AZ 16.2% 43.2% 0.0% 37.8% 2.7% 74
CT 3.7% 55.6% 0.0% 33.3% 7.4% 27
DC 12.5% 43.8% 0.0% 34.4% 9.4% 64
GA 10.4% 36.0% 0.8% 48.8% 4.0% 125
HI 43.8% 43.8% 0.0% 12.5% 0.0% 16
IL 10.1% 48.0% 0.0% 40.2% 1.7% 179
IN 17.8% 53.3% 0.0% 27.8% 1.1% 90
MD 18.5% 71.6% 1.2% 7.4% 1.2% 81
MO 12.2% 48.9% 0.0% 36.7% 2.2% 90
NE 16.2% 37.8% 0.0% 40.5% 5.4% 37
NY 26.1% 52.3% 0.8% 18.2% 2.7% 264
OH-HCBS 11.3% 30.9% 0.1% 54.9% 2.8% 727
OH-ICF 22.1% 62.1% 0.0% 14.7% 1.1% 95
OR 14.1% 57.6% 0.0% 28.2% 0.0% 85
PA 18.4% 67.8% 0.0% 11.5% 2.3% 87
SC 15.4% 79.5% 0.0% 5.1% 0.0% 39
SD 15.8% 52.6% 0.0% 31.6% 0.0% 19
TN 27.0% 44.9% 0.0% 25.8% 2.2% 89
TX 13.3% 50.0% 0.0% 36.7% 0.0% 30
UT 8.7% 37.0% 0.0% 52.2% 2.2% 46
VT 14.3% 71.4% 0.0% 14.3% 0.0% 14
NCI Average 16.2% 51.4% 0.1% 29.8% 2.5% Total: 2311
Supports/Workforce/Workforce-Initiative.html 10 Edelstein, S., Seavey, D. (2009). The need for monitoring the long-term care direct service workforce and
recommendations for data collection. Retrieved from http://phinational.org/sites/phinational.org/files/research-
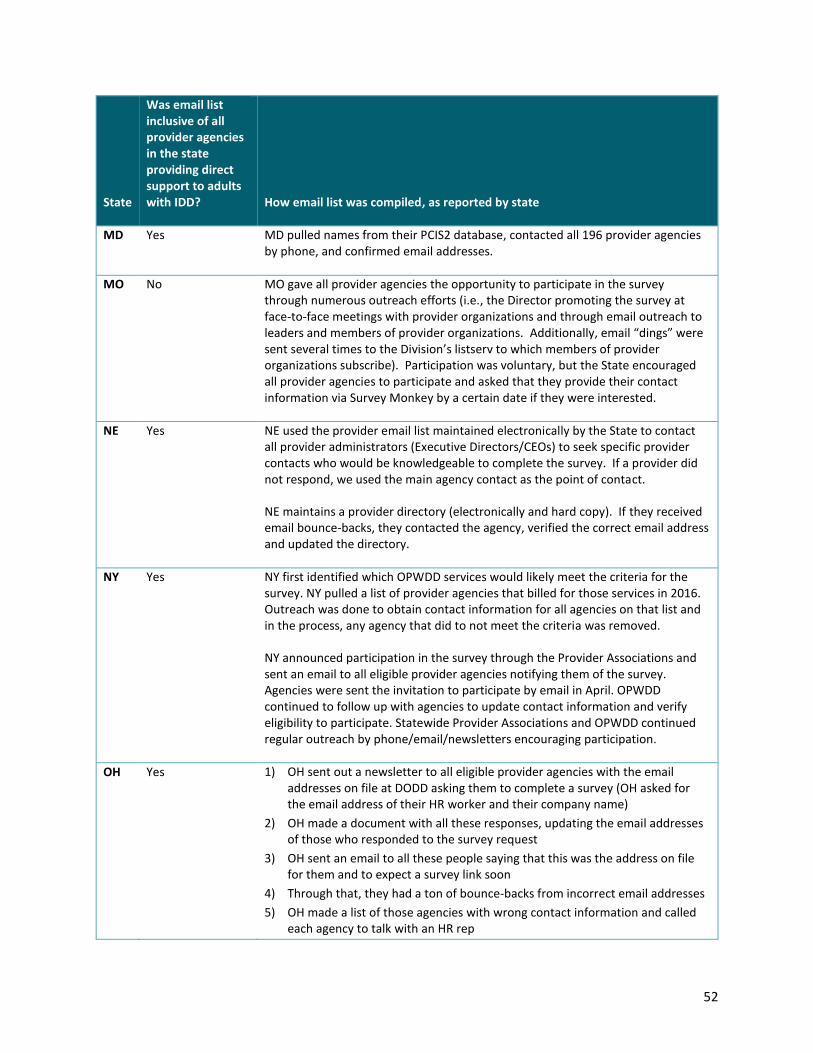
Appendix B: Sampling Methods as Reported by States
State
Was email list inclusive of all provider agencies in the state providing direct support to adults with IDD? How email list was compiled, as reported by state
AL Yes AL maintains, on an ongoing basis, an email list of all current provider agencies and newly approved provider agencies. This is the list that was included in the Staff Stability sample.
AZ Yes AZ’s central office was given the parameters of the survey. They then ran a report that identified just those agencies providing those services. As survey emails bounced, more in-depth investigation was done to identify the contact person at each agency.
CT Yes CT generated a list by pulling contact information for all provider agencies in its Qualified Provider Database.
DC Yes DC collects the provider’s e-mail when they develop the provider profile in their consumer database.
Provider agencies that are active in the database and have provided services/supports to people served by the District of Columbia Department on Disability Services are included in the sample.
GA Yes GA used the email list from the Provider Network Management Unit in its central office. This list included all provider agencies enrolled for IDD services. Provider agencies only providing services that did not meet the parameters of the survey were deleted from the list. Emails were updated based on information from provider organizations on preferred contacts for the survey.
HI No The HI State Department of Health-Community Resources Branch collected the email addresses from provider agencies interested in participating in the survey. During this survey cycle, participation from the agencies was voluntary.
IL Yes IL maintains, on an ongoing basis, an email list of all current provider agencies and newly approved provider agencies. This is the list that was included in the Staff Stability sample. In addition, prior to providing the list to NCI/HSRI for the sample, Illinois sent test emails to the list and provided notice to all provider agencies through its semi-monthly newsletter concerning the test emails, asking that those who did not receive the email should contact the office to correct their email address.
IN Yes IN listed all provider agencies that serve individuals in specified funding sources (e.g., waiver and ICF/ID) throughout the state. As survey emails bounced, more in-depth investigation was done to identify the contact person at each agency.
52
State
Was email list inclusive of all provider agencies in the state providing direct support to adults with IDD? How email list was compiled, as reported by state
MD Yes MD pulled names from their PCIS2 database, contacted all 196 provider agencies by phone, and confirmed email addresses.
MO No MO gave all provider agencies the opportunity to participate in the survey through numerous outreach efforts (i.e., the Director promoting the survey at face-to-face meetings with provider organizations and through email outreach to leaders and members of provider organizations. Additionally, email “dings” were sent several times to the Division’s listserv to which members of provider organizations subscribe). Participation was voluntary, but the State encouraged all provider agencies to participate and asked that they provide their contact information via Survey Monkey by a certain date if they were interested.
NE Yes NE used the provider email list maintained electronically by the State to contact all provider administrators (Executive Directors/CEOs) to seek specific provider contacts who would be knowledgeable to complete the survey. If a provider did not respond, we used the main agency contact as the point of contact.
NE maintains a provider directory (electronically and hard copy). If they received email bounce-backs, they contacted the agency, verified the correct email address and updated the directory.
NY Yes NY first identified which OPWDD services would likely meet the criteria for the survey. NY pulled a list of provider agencies that billed for those services in 2016. Outreach was done to obtain contact information for all agencies on that list and in the process, any agency that did to not meet the criteria was removed.
NY announced participation in the survey through the Provider Associations and sent an email to all eligible provider agencies notifying them of the survey. Agencies were sent the invitation to participate by email in April. OPWDD continued to follow up with agencies to update contact information and verify eligibility to participate. Statewide Provider Associations and OPWDD continued regular outreach by phone/email/newsletters encouraging participation.
OH Yes 1) OH sent out a newsletter to all eligible provider agencies with the email addresses on file at DODD asking them to complete a survey (OH asked for the email address of their HR worker and their company name)
2) OH made a document with all these responses, updating the email addresses of those who responded to the survey request
3) OH sent an email to all these people saying that this was the address on file for them and to expect a survey link soon
4) Through that, they had a ton of bounce-backs from incorrect email addresses
5) OH made a list of those agencies with wrong contact information and called each agency to talk with an HR rep
53
State
Was email list inclusive of all provider agencies in the state providing direct support to adults with IDD? How email list was compiled, as reported by state
6) Step # 5 was routinely updated over the months this survey was administered
7) OH sent this list to HSRI who then uploaded it in the Staff Stability program
8) OH then began sending out the official staff stability emails though the online application
9) Every 2 or 3 weeks OH would send out a separate mail merge letter asking people to check their inboxes for the Survey email
10) In the beginning of June participants who had yet to complete the survey were reminded they would be issued a citation if the survey was not completed
11) Through this method, OH got many responses in which the email address to the HR or payroll department would be identified
12) OH kept doing this until the deadline passed
13) Citations are given to those who did not complete the survey
OR Yes OR went to the licensing unit and gathered agency names of all agencies in OR providing the supports specified in the survey parameters. There was an additional database of provider agencies who received a 4% increase over the last year, which was cross referenced against the NCI list. Several additional provider agencies were added. State operated Stabilization and Crisis Unit were not included in the agency data pull. Initially an email was sent to all provider agencies about every two weeks. Personal emails were sent after the survey had been out for 2 months, targeting those who had not clicked on the link or who had opened it but nothing further. Reminders and follow up personal emails increased in frequency during the last month of the survey.
PA Yes PA's HCBS Waiver provider agencies are subject to monitoring to ensure compliance with waiver requirements. Provider agencies' email addresses are collected as part of the monitoring process; this list of emails was used for the Staff Stability Survey invitations. Additionally, nearly all HCBS provider agencies also operate private Intermediate Care Facilities for Individuals with an Intellectual Disability (ICF/ID). Prior to the release of the invitation to participate, Pennsylvania sent an announcement to “all Office of Developmental Programs (ODP)-enrolled provider agencies that employ direct-support professionals” encouraging them to participate in the survey. Following release of the invitation, some provider agencies responded that they do not employ direct-support professionals. These provider agencies were removed from the total population of potential respondents to ensure the integrity of the response rate.
SC Yes SC used a listing of all service provider agencies, then backed-out those that did not provide services to adults. The listing includes all adult services provider agencies contracted with DDSN. There may be other provider agencies that contract with DHHS (Medicaid agency), but do not have a contract with SC DDSN.
54
State
Was email list inclusive of all provider agencies in the state providing direct support to adults with IDD? How email list was compiled, as reported by state
SD Yes SD got the list from the Community Support Provider Association Director. The list includes all 19 Community Support Provider agencies as well as the South Dakota Developmental Center and the Private Children’s ICF.
TN No For TN all eligible provider agencies were contacted and those that volunteered to participate contacted TN for the survey. Tennessee DIDD staff notified all provider agencies in each of the three regions of Tennessee by presenting at quarterly regional meetings. Tennessee addressed the upcoming survey in a DIDD online weekly newsletter, indicated the benefits of the survey, and documented progress of agencies’ completions throughout the survey.
TX No The data was accumulated using a variety of methods. 1. TX used the list from the prior year, which did not include all provider
agencies in the state
2. TX sent an appeal out on the DADS website stating that if they did not receive a request to complete the survey to contact DADS
3. TX notified the provider association who sent out emails
4. TX got the email addresses from its contracts department
TX then put the list together, de-duplicated the list, and attempted to eliminate individual agencies that operate under larger provider agency umbrellas. DADS cannot guarantee that the list includes all provider agencies in TX.
UT Yes UT collected email addresses initially through contract records. Email inquiries that were not responded to were followed up with a phone call to obtain the correct email address. Every contracted provider that provides services with the direct support staff element were included in the list.
VT Yes VT obtained the email addresses for the key agency contacts from the DDS Directors of each agency in Vermont. The list includes all provider agencies.
55
Appendix C: Comparable Wage Tables From the Bureau of Labor Statistics Occupational Employment Statistics, May 2016
Residential Advisors
Coordinate activities in resident facilities in secondary and college dormitories, group homes, or similar
establishments. Order supplies and determine need for maintenance, repairs, and furnishings. May
maintain household records and assign rooms. May assist residents with problem solving or refer them
to counseling resources.
Mean Hourly Wage Estimate: $13.31
Percentile 10% 25% 50% (Median)
75% 90%
Hourly Wage $8.81 $10.11 $12.29 $15.25 $19.21
http://www.bls.gov/oes/current/oes399041.htm
Personal Care Aides
Assist the elderly, convalescents, or persons with disabilities with daily living activities at the person's
home or in a care facility. Duties performed at a place of residence may include keeping house (making
beds, doing laundry, washing dishes) and preparing meals. May provide assistance at non-residential
care facilities. May advise families, the elderly, convalescents, and persons with disabilities regarding
such things as nutrition, cleanliness, and household activities.
Mean Hourly Wage Estimate: $10.92
Percentile 10% 25% 50% (Median)
75% 90%
Hourly Wage $8.32 $9.22 $10.54 $11.95 $14.31
http://www.bls.gov/oes/current/oes399021.htm
Home Health Aides
Provide routine individualized healthcare such as changing bandages and dressing wounds, and applying
topical medications to the elderly, convalescents, or persons with disabilities at the patient's home or in a
care facility. Monitor or report changes in health status. May also provide personal care such as bathing,
Appendix E: Instructions Provided to Survey Respondents
STAFF STABILITY
SURVEY 2016 November 2016
Survey must be completed in the online data entry system by June 30, 2017
BEFORE YOU START
Your agency has been asked to complete this survey because you provide supports to adults (18 and
over) with intellectual and developmental disabilities. We are interested in learning about your state’s
Direct Support Professional (DSP) workforce—individuals who provide direct hands-on services and
support.
This survey is part of the National Core Indicators (NCI) project, and the information you provide—on
staffing levels, job stability, wages, and compensation—will be used by policymakers and advocates to:
• Inform policy and program development regarding DSP workforce improvement initiatives
• Monitor and evaluate the impact of workforce initiatives
• Compare state workforce outcomes with those of other states
• Provide context for consumer and family outcomes
• Build systems to more effectively collect, analyze, and use DSP workforce data
Notice of Privacy: Filling out this survey is voluntary. Your answers to these questions will be kept
private and will not affect your status as a [state] provider. Results of this survey will be reported only in
the aggregate; your agency will not be identified in any way.
TYPES OF AGENCIES THAT SHOULD NOT PARTICIPATE
If your agency works EXCLUSIVELY with children (under age 18), please do not reply to this survey.
However, if your agency provides services and supports to adults and children, please refer to staff
whose primary job is to provide supports to adults with IDD age 18 and over.
If your agency provides the following supports EXCLUSIVELY, please do not reply to this survey:
● transportation services ● home modifications ● meal delivery ● social work
● fiscal intermediary/employer of record services ● therapy services, such as occupational therapy
Instead, please email [your state contact] and let him/her know.
PLEASE NOTE: For host/foster/family home arrangements: Please respond only about DSPs who are working in addition to the primary shared living/foster care provider.
59
DIRECTIONS
OVERVIEW
This survey is best completed by employees from your Human Resources or Payroll departments.
The survey will ask about the following information for all DSPs who were on payroll for any length of
time during the period of January 1, 2016 to December 31, 2016:
• Date of hire
• Whether they are current staff or separated staff
• Date of termination (if applicable)
• Whether they work full-time or part-time (current staff only)
• Hours and wages
• Benefits, such as paid time off, health insurance, etc.
IMPORTANT DEFINITIONS
TYPES OF WORKERS TO CONSIDER
This survey is about people who are employed as Direct Support Professionals. This includes all paid
workers whose primary job responsibility is direct support work. Please consider all DSPs, not only
those with a credential or job-specific training.
For example, the DSP workforce includes the following job titles and those in similar roles (this list is
NOT exhaustive):
Personal Support Specialists (PSSs)
Home Health Aides (HHAs)
Certified Nursing Assistants (CNAs)
Homemakers
Residential Support Workers (RSWs)
Community Habilitation Specialists
Personal Attendants/Personal Care Aides
DSPs working in job or vocational services
DSPs working at day programs or community support programs
Please respond about the following workers:
All people whose primary job responsibility is to provide support, training, supervision, and personal
assistance to adults with intellectual/developmental disabilities.
All full-time and part-time DSPs.
All paid staff members who spend at least 50% of their hours doing direct service tasks. These
people may do some supervisory tasks, but their primary job responsibility and more than 50% of
their hours are spent doing direct support work.
Only include supervisors if more than 50% of their hours are spent doing direct support tasks.
60
Do not include these workers in your responses:
PRN workers
Temporary workers
Licensed health care staff (nurses, social workers, psychologists, etc.)
Administrative staff, or full-time managers or directors, unless they spend 50% or more of
their hours providing direct hands-on support and personal assistance or supervision to
individuals with disabilities
Regarding host/foster/family home arrangements: Please respond only about DSPs who are working in addition to the primary shared living/foster care provider.
WORKPLACE SETTINGS/SERVICES
Please include in your responses DSPs for whom your agency has control over setting wages and
determining benefits. Please include DSPs working in the following settings:
a) Residential supports—Supports provided to a person who is living outside of the family home.
This can include 24-hour supports such as a group home or ICF/ID. It can also include people
living in supported housing or supported living getting less than 24 hours of support (if your
agency owns the residential setting or operates the lease). If a person is in a shared living, host
home or foster home, please include only those DSPs who are working in addition to the shared
living/foster provider.
b) In-home supports—Supports provided to a person in their home (only if their home is not
owned or leased by your agency. If the mortgage or lease of the home is the financial
responsibility of your agency, the services you provide in the home would be considered
residential supports).
c) Non-residential supports such as:
Day programs and community support programs—Supports provided outside an
individual’s home such as adult day program services, developmental training, and
community supports.
Job or vocational services—Supports to help individuals who are looking for work or on the
job for which they are paid (e.g., work supports).
Do not include employees in the following settings:
People working on services such as home modifications, transportation, meal delivery,
social work or others who are not providing direct hands-on support and personal
assistance or supervision to individuals with disabilities.
People who are hired directly by the person or the person’s family for whom your
agency’s role is limited to being a fiscal intermediary/employer of record.
People only working in school settings for children through 12th grade.
People providing therapy services, such as occupational therapists.
People providing seasonal services, such as summer camp counselors.
61
LENGTH OF EMPLOYMENT
For the purposes of this survey, please use the following definitions:
Current staff: Direct support staff (both full-time and part-time) on your payroll as of December 31,
2016.
Separated staff: Direct support staff who left your agency for any reason during the period of [January
1, 2016 to December 31, 2016]. Do not include workers who were promoted or transferred within the