Page 1
cra.org/crn 3
2016 Taulbee SurveyGeneration CS Continues to Produce Record Undergrad Enrollment; Graduate Degree Production Rises at both Master’s and Doctoral Levels
This article and the accompanying figures and tables present
the results from the 46th annual CRA Taulbee Survey1. The
survey, conducted annually by the Computing Research
Association, documents trends in student enrollment,
degree production, employment of graduates, and faculty
salaries in academic units in the United States and Canada
that grant the Ph.D. in computer science (CS), computer
engineering (CE), or information (I)2. Most of these academic
units are departments, but some are colleges or schools of
information or computing. In this report, we will use the term
“department” to refer to the unit offering the program.
CRA gathers survey data during the fall. Responses received
by February 17, 2017 are included in the analysis. The period
covered by the data varies from table to table. Degree
production and enrollment (Ph.D., Master’s, and Bachelor’s)
refer to the previous academic year (2015-16). Data for new
students in all categories refer to the current academic
year (2016-17). Projected student production and information
on faculty salaries are also for the current academic year;
salaries are those effective January 1, 2017.
We surveyed a total of 268 Ph.D.-granting departments;
we received salary responses from 173 and main survey
responses from 168, for a total of 183 departments responding
to one or both parts of the survey. The response rate was
68 percent, similar to last year’s 67 percent. The response
rates from CE and Canadian departments continue to
be rather low, and this year the CE response rate is the
same as last year’s unusually low rate. U.S. CS, U.S. I, and
Canadian response rates were similar to last year, with U.S.
CS slightly up and Canadian slightly down. Figure 1 shows
the history of the survey’s response rates. Response rates
are inexact because some departments provide only partial
data, and some institutions provide a single joint response
for multiple departments. Thus, in some tables the number
of departments shown as reporting will not equal the overall
total number of respondents shown in Figure 1 for that
category of department.
To account for the changes in response rate, we will
comment not only on aggregate totals but also on averages
per department reporting or data from those departments
that responded to both 2015 and 2016 surveys. This is a
more meaningful indication of the one-year changes affecting
the data.
Departments that responded to the survey were sent
preliminary results about faculty salaries in December 2016;
these results included additional distributional information
not contained in this report. The CRA Board views this as a
benefit of participating in the survey.
Degree, enrollment, and faculty salary data for the U.S CS
departments are stratified according to: a) whether the
institution is public or private; and b) the tenure-track faculty
size of the reporting department. The faculty size strata
deliberately overlap, so that data from most departments
affect multiple strata. This may be especially useful to
departments near the boundary of one stratum. Salary data
is also stratified according to the population of the locale
in which the institution is located.3 These stratifications
allow our readers to see multiple views of important data,
and hopefully gain new insights from them. In addition to
tabular presentations of data, we will use “box and whisker”
diagrams to show medians, quartiles, and the range between
the 10th and 90th percentile data points.
In this year’s survey, we made some modifications to the
list of research areas for doctoral degree graduates in order
to better reflect current areas of focus. We also began to
By Stuart Zweben and Betsy Bizot
COMPUTING RESEARCH NEWS, MAY 2017Vol. 29 / No. 5
Page 2
cra.org/crn 4
collect enrollment data from certain key undergraduate CS
courses, in a format similar to what was used in last year’s
CRA Enrollment Survey, the results of which can be found
at www.cra.org/data/generation-cs. This will enable some
ongoing tracking of enrollment changes at a finer level of
detail than is now possible with the Taulbee Survey. Finally,
this year we asked departments about their interest in
getting additional data about the employment of teaching
faculty as part of the survey. The responses will guide
decisions that will be implemented in future Taulbee Surveys.
We thank all of the respondents to this year’s questionnaire.
The participating departments are listed at the end of
this article. CRA member respondents will again be given
the opportunity to obtain certain survey information for a
self-selected peer group. Instructions for doing this will be
emailed to all such departments.
Doctoral Degree Production, Enrollment, and Employment
(Tables D1-D10; Figures D1-D6)
Degree Production
Doctoral degree production rose this year, after last year’s
dip. This year’s respondents produced 1,888 doctoral degrees
in 2015-16, an increase of 6.1 percent overall and 6.7 percent
on a per department basis. Total production is still below
the record of 1,991 set in 2012-13. There were increases, on
average, for all department types (Table D1).
Among all departments reporting both this year and last year,
the number of total doctoral degrees increased by 7.4 percent,
but among U.S. CS departments reporting both years, the
increase was 6.3 percent.
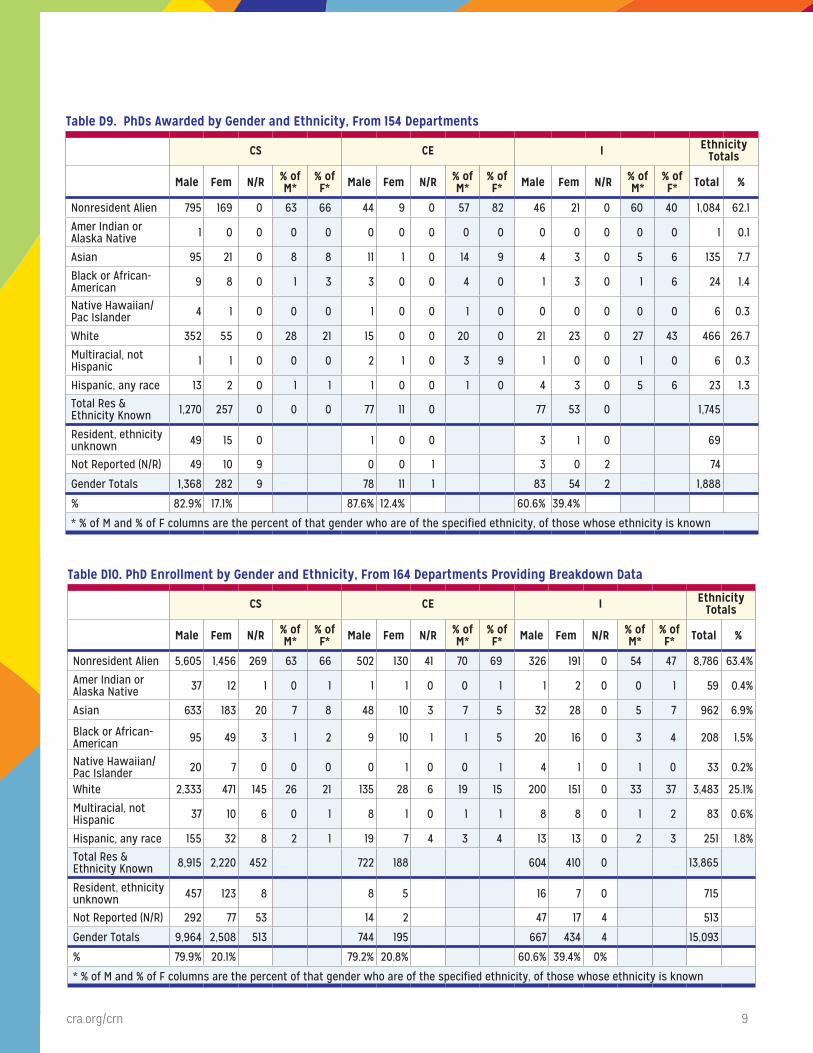
Women comprised 17.1 percent of CS doctoral graduates and
18.5 percent of all doctoral computing graduates (Table D2).
Figure 1. Number of Respondents to the Taulbee Survey
Year US CS Depts. US CE Depts. Canadian US Information Total
1995 110/133 (83%) 9/13 (69%) 11/16 (69%) 130/162 (80%)
1996 98/131 (75%) 8/13 (62%) 9/16 (56%) 115/160 (72%)
1997 111/133 (83%) 6/13 (46%) 13/17 (76%) 130/163 (80%)
1998 122/145 (84%) 7/19 (37%) 12/18 (67%) 141/182 (77%)
1999 132/156 (85%) 5/24 (21%) 19/23 (83%) 156/203 (77%)
2000 148/163 (91%) 6/28 (21%) 19/23 (83%) 173/214 (81%)
2001 142/164 (87%) 8/28 (29%) 23/23 (100%) 173/215 (80%)
2002 150/170 (88%) 10/28 (36%) 22/27 (82%) 182/225 (80%)
2003 148/170 (87%) 6/28 (21%) 19/27 (70%) 173/225 (77%)
2004 158/172 (92%) 10/30 (33%) 21/27 (78%) 189/229 (83%)
2005 156/174 (90%) 10/31 (32%) 22/27 (81%) 188/232 (81%)
2006 156/175 (89%) 12/33 (36%) 20/28 (71%) 188/235 (80%)
2007 155/176 (88%) 10/30 (33%) 21/28 (75%) 186/234 (79%)
2008 151/181 (83%) 12/32 (38%) 20/30 (67%) 9/19 (47%) 192/264 (73%)
2009 147/184 (80%) 13/31 (42%) 16/30 (53.3%) 12/20 (60%) 188/265 (71%)
2010 150/184 (82%) 12/30 (40%) 18/29 (62%) 15/22 (68%) 195/265 (74%)
2011 142/185 (77%) 13/31 (42%) 13/30 (43%) 16/21 (76%) 184/267 (69%)
2012 152/189 (80%) 11/32 (34%) 14/30 (47%) 16/26 (62%) 193/277 (70%)
2013 144/188 (77%) 10/30 (33%) 14/26 (54%) 11/22 (50%) 179/266 (67%)
2014 143/188 (76%) 13/31 (42%) 12/26 (46%) 13/19 (68%) 181/268 (68%)
2015 146/190 (77%) 8/32 (25%) 12/26 (46%) 12/18 (67%) 178/266 (67%)
2016 150/188 (80%) 8/33 (24%) 11/26 (42%) 14/21 (67%) 183/268 (68%)
Page 3
cra.org/crn 5
Both values are lower than those reported last year (last
year’s values were 18.3 and 20.2 percent, respectively). The
percentage of CS doctoral degrees that went to Non-resident
Aliens continued to rise, to 63.1 percent compared with last
year’s reported 60.7 percent, while the percentage that went
to resident Asians rose to 7.6 percent from 6.4 percent. CE
had a similar percentage of Non-resident Aliens to CS, and
was less gender diverse. Among I doctoral degrees, Non-
resident Aliens now comprise more than 50 percent of the
doctoral graduates, though a smaller percentage than for
CS or CE; the fraction of I doctoral degrees going to Whites
remained at 33.8 percent.
The percentage of CS doctoral graduates who were American
Indian or Alaska Native, Black or African American, Native
Hawaiian/Pacific Islander, Hispanic, or Multiracial Non-
Hispanic was just 2.6 percent, down from 4.0 percent and to
the same level reported in 2013-14. In aggregate across CS,
Table D1. PhD Production and Pipeline by Department Type
Department Type # Depts
PhDs Awarded PhDs Next Year Passed Qualifier Passed Thesis (if dept has)
# Avg/ Dept # Avg/ Dept # Avg/ Dept # # Dept Avg/ Dept
US CS Public 95 1,211 12.7 1,337 14.1 1,289 14.5 906 76 11.8
US CS Private 34 444 13.5 593 17.4 409 12.4 158 22 8.8
US CS Total 129 1,655 12.9 1,930 15.0 1,698 13.9 1,064 98 11.1
US CE 5 28 4.7 69 13.8 90 18.0 60 3 28.9
US Info 12 83 8.3 95 7.9 119 9.2 64 10 8.0
Canadian 11 122 12.2 154 14.0 118 11.8 95 7 12.8
Grand Total 157 1,888 12.3 2,248 14.3 2,025 13.5 1,283 118 12.0
Table D2. PhDs Awarded by Gender
CS CE I Total
Male 1,368 82.9% 78 87.6% 83 60.6% 1,529 81.5%
Female 282 17.1% 11 12.4% 54 39.4% 347 18.5%
Total Known Gender 1,650 89 137 1,876
Gender Unknown 9 1 2 12
Grand Total 1,659 90 139 1,888
Table D3. PhDs Awarded by Ethnicity
CS CE I Total
Nonresident Alien 964 63.1% 53 60.2% 67 51.5% 1084 62.1%
Amer Indian or Alaska Native 1 0.1% 0 0.0% 0 0.0% 1 0.1%
Asian 116 7.6% 12 13.6% 7 5.4% 135 7.7%
Black or African-American 17 1.1% 3 3.4% 4 3.1% 24 1.4%
Native Hawaiian/Pac Islander 5 0.3% 1 1.1% 0 0.0% 6 0.3%
White 407 26.7% 15 17.0% 44 33.8% 466 26.7%
Multiracial, not Hispanic 2 0.1% 3 3.4% 1 0.8% 6 0.3%
Hispanic, any race 15 1.0% 1 1.1% 7 5.4% 23 1.3%
Total Residency & Ethnicity Known 1,527 88 130 1,745
Resident, ethnicity unknown 64 1 4 69
Residency unknown 68 1 5 74
Grand Total 1,659 90 139 1,888
Page 4
cra.org/crn 6
Table D4. Employment of New PhD Recipients By Specialty
Arti
ficia
l Int
ellig
ence
Com
puti
ng E
duca
tion
Data
base
s/In
form
atio
n Re
trie
val
Grap
hics
/Vis
ualiz
atio
n
Hard
war
e/Ar
chit
ectu
re
Hum
an-C
ompu
ter I
nter
acti
on
High
-Per
form
ance
Com
puti
ng
Info
rmat
ics:
Bio
med
ica/
Oth
er S
cien
ce
Info
rmat
ion
Scie
nce
Info
rmat
ion
Syst
ems
Netw
orks
Oper
atin
g Sy
stem
s
Prog
ram
min
g La
ngua
ges/
Com
pile
rs
Robo
tics
/Vis
ion
Scie
ntifi
c/Nu
mer
ical
Com
puti
ng
Secu
rity
/Info
rmat
ion
Assu
ranc
e
Soci
al C
ompu
ting
/Soc
ial I
nfor
mat
ics
Soft
war
e En
gine
erin
g
Theo
ry a
nd A
lgor
ithm
s
Othe
r
Tota
l
North American PhD Granting Depts.
Tenure-track 7 2 8 5 1 7 10 4 16 2 6 9 8 4 1 11 5 8 9 12 135 9.0%
Researcher 2 0 0 3 0 0 1 9 0 1 3 0 0 1 1 2 1 2 0 2 28 1.9%
Postdoc 44 4 9 13 3 2 12 17 6 0 9 5 6 13 2 10 2 7 23 27 214 14.3%
Teaching Faculty 6 5 3 3 0 1 1 1 0 0 6 2 3 1 1 2 4 4 2 11 56 3.7%
North American, Other Academic
Other CS/CE/I Dept. 2 0 1 0 0 0 0 0 0 2 4 0 1 1 1 0 1 1 4 6 24 1.6%
Non-CS/CE/I Dept 2 0 0 0 0 0 0 0 0 0 0 0 0 0 0 0 0 0 0 1 3 0.2%
North American, Non-Academic
Industry 134 3 65 51 39 26 21 22 13 11 54 32 30 45 11 53 10 84 39 115 858 57.2%
Government 4 0 3 1 3 4 2 2 1 1 0 1 1 1 1 4 0 3 0 1 33 2.2%
Self-Employed 5 0 0 2 0 0 0 1 0 1 0 0 1 2 1 3 1 0 1 0 18 1.2%
Unemployed 3 0 1 0 2 0 0 1 0 0 0 0 1 0 1 1 0 0 0 4 14 0.9%
Other 1 0 1 0 0 0 2 0 0 0 1 0 0 0 0 1 0 0 1 0 7 0.5%
Total Inside North America
210 14 91 78 48 40 49 57 36 18 83 49 51 68 20 87 24 109 79 179 1,390 92.7%
Outside North America
Ten-Track in PhD 4 2 2 4 0 2 2 1 1 0 3 0 0 1 1 2 0 3 1 7 36 2.4%
Researcher in PhD 1 0 0 0 0 0 0 0 0 0 0 0 0 0 0 0 0 0 2 0 3 0.2%
Postdoc in PhD 1 0 0 0 0 0 1 2 0 0 3 1 0 1 0 1 0 1 3 2 16 1.1%
Teaching in PhD 1 0 0 1 0 1 0 0 0 0 0 0 0 0 0 0 0 1 0 1 5 0.3%
Other Academic 0 0 0 0 2 0 0 0 0 0 1 1 0 0 0 1 1 2 0 1 9 0.6%
Industry 8 0 1 0 3 0 0 1 0 1 1 2 5 0 1 3 0 2 1 2 31 2.1%
Government 0 0 0 0 0 0 0 1 0 0 0 0 0 1 0 0 0 0 0 0 2 0.1%
Self-Employed 1 0 0 0 0 0 0 0 0 0 0 0 1 0 0 0 0 0 0 0 2 0.1%
Unemployed 0 0 0 0 0 0 0 0 0 0 0 0 0 0 0 0 0 0 0 0 0 0.0%
Other 0 0 0 0 0 0 0 0 0 0 0 0 0 0 0 0 0 0 0 6 6 0.4%
Total Outside NA 16 2 3 5 5 3 3 5 1 1 8 4 6 3 2 7 1 9 7 19 110 7.3%
Total with Employment Data, Inside North America plus Outside North America
226 16 94 83 53 43 52 62 37 19 91 53 57 71 22 94 25 118 86 198 1,500
Employment Type & Location Unknown
30 3 17 11 14 4 9 9 5 4 11 3 6 6 3 12 3 13 12 213 388
Grand Total 256 19 111 94 67 47 61 71 42 23 102 56 63 77 25 106 28 131 98 411 1,888
Page 5
cra.org/crn 7
CE, and I graduated 3.4 percent from these categories (vs. 4.5
percent in 2014-15). As we have found in previous years, Non-
resident Aliens again comprised a higher percentage of the CS
female doctoral graduates than they did CS male graduates,
while Whites comprised a lower percentage of the female
graduates as compared with male graduates. This year’s
respondents reported that Resident Asians comprised an
equal percentage of male CS doctoral graduates and female
CS doctoral graduates; in previous years, Asians comprised a
higher percentage of female graduates (Table D9).
Table D4a. Detail of Industry Employment
Arti
ficia
l Int
ellig
ence
Com
puti
ng E
duca
tion
Data
base
s /In
form
atio
n Re
trie
val
Grap
hics
/Vis
ualiz
atio
n
Hard
war
e/Ar
chit
ectu
re
Hum
an-C
ompu
ter I
nter
acti
on
High
-Per
form
ance
Com
puti
ng
Info
rmat
ics:
Bio
med
ica/
Oth
er S
cien
ce
Info
rmat
ion
Assu
ranc
e/Se
curi
ty
Info
rmat
ion
Scie
nce
Info
rmat
ion
Syst
ems
Netw
orks
Oper
atin
g Sy
stem
s
Prog
ram
min
g La
ngua
ges/
Com
pile
rs
Robo
tics
/Vis
ion
Scie
ntifi
c/ N
umer
ical
Com
puti
ng
Soci
al C
ompu
ting
/Soc
ial I
nfor
mat
ics
Soft
war
e En
gine
erin
g
Theo
ry a
nd A
lgor
ithm
s
Unkn
own
Othe
r
Tota
l
Inside North America
Research 84 0 43 20 20 11 15 14 8 5 29 23 16 31 6 33 5 30 20 11 49 473 55.1%
Non-Research 37 1 18 24 16 14 6 4 3 5 21 8 12 12 2 15 5 49 13 12 17 294 34.3%
Postdoctorate 5 0 0 2 1 1 0 2 0 0 0 0 0 2 1 2 0 1 0 0 0 17 2.0%
Type Not Specified 8 2 4 5 2 0 0 2 2 1 4 1 2 0 2 3 0 4 6 20 6 74 8.6%
Total Inside NA 134 3 65 51 39 26 21 22 13 11 54 32 30 45 11 53 10 84 39 43 72 858
Outside North America
Research 6 0 1 0 2 0 0 1 0 0 1 1 5 0 1 2 0 2 0 0 0 22 71.0%
Non-Research 1 0 0 0 1 0 0 0 0 1 0 1 0 0 0 1 0 0 0 1 0 6 19.4%
Postdoctorate 1 0 0 0 0 0 0 0 0 0 0 0 0 0 0 0 0 0 1 0 0 2 6.5%
Type Not Specified 0 0 0 0 0 0 0 0 0 0 0 0 0 0 0 0 0 0 0 0 1 1 3.2%
Total Outside NA 8 0 1 0 3 0 0 1 0 1 1 2 5 0 1 3 0 2 1 1 1 31
Table D5. New PhD Students by Department Type
CS CE I Total
Department Type
New Admit
MS to
PhDTotal
Avg. per
Dept.New
AdmitMS to PhD Total
Avg. per
Dept.New
AdmitMS to PhD Total
Avg. per
Dept.Total
Avg. per
Dept
US CS Public 1,512 228 1,740 18.3 84 20 104 5.2 94 2 96 12.0 1,940 20.2
US CS Private 685 22 707 20.8 13 1 14 2.8 11 0 11 3.7 732 21.5
US CS Total 2,197 250 2,447 19.0 97 21 118 4.7 105 2 107 9.7 2,672 20.6
US CE 0 0 0 0.0 54 3 57 9.5 0 0 0 0.0 57 9.5
US Information 6 1 7 7.0 0 0 0 0.0 121 17 138 9.9 145 10.4
Canadian 105 17 122 11.1 0 0 0 0.0 0 0 0 0.0 122 11.1
Grand Total 2,308 268 2,576 18.3 151 24 175 5.6 226 19 245 9.8 2,996 18.6
Page 6
cra.org/crn 8
Table D5a. New PhD Students from Outside North America
Department Type CS CE I Total New
Outside Total New% outside
North America
US CS Public 1,148 71 56 1,275 1,940 65.7%
US CS Private 381 11 9 401 732 54.8%
Total US CS 1,529 82 65 1,676 2,672 62.7%
US CE 0 32 0 32 57 56.1%
US Info 5 0 73 78 145 53.8%
Canadian 73 0 0 73 122 59.8%
Grand Total 1,607 114 138 1,859 2,996 62.0%
Table D6. PhD Enrollment by Department Type
Department Type # Depts CS CE I Total
US CS Public 100 8,903 66.2% 636 66.2% 386 66.2% 9,925 66.2%
US CS Private 37 3,206 24.2% 74 24.2% 38 24.2% 3,318 24.2%
Total US CS 137 12,109 90.3% 710 90.3% 424 90.3% 13,243 90.3%
US CE 6 0 0.1% 293 0.1% 16 0.1% 309 0.1%
US Info 12 28 0.2% 0 0.2% 643 0.2% 671 0.2%
Canadian 11 848 9.3% 0 9.3% 22 9.3% 870 9.3%
Grand Total 166 12,985 1,003 1,105 15,093
Table D7. PhD Enrollment by Gender
CS CE I Total
Male 9,964 79.9% 744 79.2% 667 60.6% 11,375 78.4%
Female 2,508 20.1% 195 20.8% 434 39.4% 3,137 21.6%
Total Known Gender
12,472 939 1,101 14,512
Gender Unknown 513 64 4 581
Grand Total 12,985 1,003 1,105 15,093
Table D8. PhD Enrollment by Ethnicity
CS CE I Total
Nonresident Alien 7,596 63.9% 673 69.7% 517 51.0% 8,786 63.4%
Amer Indian or Alaska Native 54 0.5% 2 0.2% 3 0.3% 59 0.4%
Asian 841 7.1% 61 6.3% 60 5.9% 962 6.9%
Black or African-American 152 1.3% 20 2.1% 36 3.6% 208 1.5%
Native Hawaiian/Pac Islander 27 0.2% 1 0.1% 5 0.5% 33 0.2%
White 2,963 24.9% 169 17.5% 351 34.6% 3,483 25.1%
Multiracial, not Hispanic 58 0.5% 9 0.9% 16 1.6% 83 0.6%
Hispanic, any race 195 1.6% 30 3.1% 26 2.6% 251 1.8%
Total Known 11,886 965 1,014 13,865
Resident, ethnicity unknown 677 15 23 715
Residency unknown 422 23 68 513
Grand Total 12,985 1,003 1,105 15,093
Page 7
cra.org/crn 9
Table D9. PhDs Awarded by Gender and Ethnicity, From 154 Departments
CS CE I Ethnicity Totals
Male Fem N/R % of M*
% of F* Male Fem N/R % of
M*% of F* Male Fem N/R % of
M*% of F* Total %
Nonresident Alien 795 169 0 63 66 44 9 0 57 82 46 21 0 60 40 1,084 62.1
Amer Indian or Alaska Native 1 0 0 0 0 0 0 0 0 0 0 0 0 0 0 1 0.1
Asian 95 21 0 8 8 11 1 0 14 9 4 3 0 5 6 135 7.7
Black or African-American 9 8 0 1 3 3 0 0 4 0 1 3 0 1 6 24 1.4
Native Hawaiian/ Pac Islander 4 1 0 0 0 1 0 0 1 0 0 0 0 0 0 6 0.3
White 352 55 0 28 21 15 0 0 20 0 21 23 0 27 43 466 26.7
Multiracial, not Hispanic 1 1 0 0 0 2 1 0 3 9 1 0 0 1 0 6 0.3
Hispanic, any race 13 2 0 1 1 1 0 0 1 0 4 3 0 5 6 23 1.3Total Res & Ethnicity Known 1,270 257 0 0 0 77 11 0 77 53 0 1,745
Resident, ethnicity unknown 49 15 0 1 0 0 3 1 0 69
Not Reported (N/R) 49 10 9 0 0 1 3 0 2 74
Gender Totals 1,368 282 9 78 11 1 83 54 2 1,888
% 82.9% 17.1% 87.6% 12.4% 60.6% 39.4%
* % of M and % of F columns are the percent of that gender who are of the specified ethnicity, of those whose ethnicity is known
Table D10. PhD Enrollment by Gender and Ethnicity, From 164 Departments Providing Breakdown Data
CS CE I Ethnicity Totals
Male Fem N/R % of M*
% of F* Male Fem N/R % of
M*% of F* Male Fem N/R % of
M*% of F* Total %
Nonresident Alien 5,605 1,456 269 63 66 502 130 41 70 69 326 191 0 54 47 8,786 63.4%
Amer Indian or Alaska Native 37 12 1 0 1 1 1 0 0 1 1 2 0 0 1 59 0.4%
Asian 633 183 20 7 8 48 10 3 7 5 32 28 0 5 7 962 6.9%
Black or African-American 95 49 3 1 2 9 10 1 1 5 20 16 0 3 4 208 1.5%
Native Hawaiian/ Pac Islander 20 7 0 0 0 0 1 0 0 1 4 1 0 1 0 33 0.2%
White 2,333 471 145 26 21 135 28 6 19 15 200 151 0 33 37 3,483 25.1%
Multiracial, not Hispanic 37 10 6 0 1 8 1 0 1 1 8 8 0 1 2 83 0.6%
Hispanic, any race 155 32 8 2 1 19 7 4 3 4 13 13 0 2 3 251 1.8%Total Res & Ethnicity Known 8,915 2,220 452 722 188 604 410 0 13,865
Resident, ethnicity unknown 457 123 8 8 5 16 7 0 715
Not Reported (N/R) 292 77 53 14 2 47 17 4 513
Gender Totals 9,964 2,508 513 744 195 667 434 4 15,093
% 79.9% 20.1% 79.2% 20.8% 60.6% 39.4% 0%
* % of M and % of F columns are the percent of that gender who are of the specified ethnicity, of those whose ethnicity is known
Page 8
cra.org/crn 10
0!
500!
1000!
1500!
2000!
2500!
1995!
1996!
1997!
1998!
1999!
2000!
2001!
2002!
2003!
2004!
2005!
2006!
2007!
2008!
2009!
2010!
2011!
2012!
2013!
2014!
2015!
2016!
Num
ber o
f PhD
s!
Academic Year ending in June of Year!
Figure D1. PhD Production!CRA Taulbee Survey 2016!
Canadian!
US I!
US CE!
US CS!
30!
35!
40!
45!
50!
55!
60!
65!
1993
/94!
1994
/95!
1995
/96!
1996
/97!
1997
/98!
1998
/99!
1999
/00!
2000
/01!
2001
/02!
2002
/03!
2003
/04!
2004
/05!
2005
/06!
2006
/07!
2007
/08!
2008
/09!
2009
/10!
2010
/11!
2011
/12!
2012
/13!
2013
/14!
2014
/15!
2015
/16!
Perc
ent!
Year!
Figure D2. Nonresident Aliens as Fraction of PhD Enrollments!CRA Taulbee Survey 2016!
Figure D1. PhD Production
CRA Taulbee Survey 2016
Figure D2. Nonresident Aliens as Fraction of PhD Enrollments
CRA Taulbee Survey 2016
Year
Perc
ent
Page 9
cra.org/crn 11
-0.1
0.0
0.1
0.2
0.3
0.4
0.5
0.6
0.7
0.8
0.9
Publ
ic siz
e <=
15!
Publ
ic 10
< si
ze <
= 20!
Publ
ic 15
< si
ze <
=25!
Publ
ic 20
< si
ze <
= 35!
Publ
ic siz
e >
30!
Priva
te si
ze <
= 20!
Priva
te 1
5 <
size
<=30!
Priva
te si
ze >
20!
US C
E!
US In
fo!
Cana
dian!
Deg
rees
Gra
nted
per
Fac
ulty
Mem
ber!
Figure D3. PhD Degrees Granted by Tenure-Track Size!CRA Taulbee Survey 2016!
!
Whiskers show 90th and 10th %iles! Lighter box 25th %ile to median! Darker box median to 75th %ile!
US CS Public by Tenure-Track Faculty Size! US CS Private by Size! US Other! Can!
0.0!
1.0!
2.0!
3.0!
4.0!
5.0!
6.0!
Publ
ic siz
e <=
15!
Publ
ic 10
< si
ze <
= 20!
Publ
ic 15
< si
ze <
=25!
Publ
ic 20
< si
ze <
= 35!
Publ
ic siz
e >
30!
Priva
te si
ze <
= 20!
Priva
te 1
5 <
size
<=30!
Priva
te si
ze >
20!
US C
E!
US In
fo!
Cana
dian!
Stu
dent
s pe
r Fac
ulty
Mem
ber!
Figure D4. PhD Enrollment Normalized by Tenure-Track Size!CRA Taulbee Survey 2016!
!
Whiskers show 90th and 10th %iles! Lighter box 25th %ile to median! Darker box median to 75th %ile!
US CS Public by Tenure-Track Faculty Size! US CS Private by Size! US Other! Can!
Figure D3. PhD Degrees Granted by Tenure-Track Size
CRA Taulbee Survey 2016
Figure D4. PhD Enrollment Normalized by Tenure-Track Size
CRA Taulbee Survey 2016
Page 10
cra.org/crn 12
0.00!
5.00!
10.00 !
15.00 !
20.00 !
25.00 !
84-8
5!85
-86!
86-8
7!87
-88!
88-8
9!89
-90!
90-9
1!91
-92!
92-9
3!93
-94!
94-9
5!95
-96!
96-9
7!97
-98!
98-9
9!99
-00!
00-0
1!01
-02!
02-0
3!03
-04!
04-0
5!05
-06!
06-0
7!07
-08!
08-0
9!09
-10!
10-1
1!11
-12!
12-1
3!13
-14!
14-1
5!15
-16!
Year of entry!
Figure D5. CS Pipeline corrected for year of entry!
Passed qualifier per dept!
Ph.D. production per dept!
New Ph.D. students per dept!
0%!
10%!
20%!
30%!
40%!
50%!
60%!
70%!
89-9
0!90
-91!
91-9
2!92
-93!
93-9
4!94
-95!
95-9
6!96
-97!
97-9
8!98
-99!
99-0
0!00
-01!
01-0
2!02
-03!
03-0
4!04
-05!
05-0
6!06
-07!
07-0
8!08
-09!
09-1
0!10
-11!
11-1
2!12
-13!
13-1
4!14
-15!
15-1
6!
Figure D6. Employment Trends for New Ph.D.s!
Academia (North America)!
Industry (North America)!
Non-PhD Dept among those going to Academia (North America)!Abroad!
Figure D5. CS Pipeline corrected for year of entry
CRA Taulbee Survey 2016
Figure D6. Employment Trends for New Ph.D.s
CRA Taulbee Survey 2016
Year of entry
Page 11
cra.org/crn 13
Doctoral Program Enrollment
Among programs that reported both years, total doctoral
enrollment decreased slightly, by 1.4 percent. If only U.S.
computer science departments are considered, there was
a very slight increase of 0.7 percent (Table 1). Total doctoral
enrollment by gender is more diverse compared with last
year, with increases in diversity in all department areas (CS,
CE, and I). The overall fraction of current doctoral students
who are women is 21.6 percent, versus 20.2 percent last
year (Table D7). The fraction of doctoral students who are not
either Non-resident Aliens, Asian, or White remains below 5
percent (Table D8).
Among currently enrolled CS doctoral students whose
ethnicity is known, we see the same direction of difference
among Non-resident Aliens and Whites; Non-resident Aliens
comprise a higher percent of the enrolled women than they
do the enrolled men, and Whites comprise a lower percentage
of enrolled women. This is similar to previous years’
observations, and suggests that these directional differences
among Non-resident aliens and Whites will continue to be
seen in future years’ graduation statistics. Resident Asians
comprise a similar percentage of enrolled Asian men and
Asian women (Table D10).
Among those pursuing I degrees, 59 percent of the men
and 54 percent of the women are Non-resident Aliens or
Resident Asians. Last year these percentages were 62
and 55, respectively. This year, Whites comprise a slightly
higher percentage of women than they do men among those
pursuing I degrees.
At U.S. CS departments, the average number of students per
department who passed qualifier exams declined from 14.3
in 2014-15, to 13.9 in 2015-16. The 13.9 average is the same
as it was in 2013-14. The drop was due to departments in
public institutions; there was a slight increase in private
institutions. The average number per department who
passed thesis candidacy exams in 2015-16 (most, but not all,
departments have such exams) decreased from 2014-15 at
both public and private U.S. CS departments (Table D1).
The number of new Ph.D. students per department reporting
increased slightly this year compared with the total from last
year’s reporting departments (Tables 1 and D5). This reflects
increases in all categories of departments (CS, CE, I, and
Canadian). Among all departments that reported both years,
the number of new Ph.D. students increased 5.5 percent.
If only U.S. CS departments that reported both years are
considered, the increase was 4.2 percent.
Table 1. Degree Production and Enrollment Change From Previous Year
Total Only Departments Responding Both Years
US CS Only All Departments US CS Only All Departments
PhDs 2015 2016 % chg 2015 2016 % chg 2015 2016 % chg 2015 2016 % chg
PhD Awarded 1,570 1,655 5.4% 1,780 1,888 6.1% 1,482 1,569 5.9% 1,650 1,756 6.4%
#Units PhD Awd 136 128 164 154 117 117 138 138
PhD Enrollment 13,063 13,243 1.4% 15,397 15,093 -2.0% 12,439 12,531 0.7% 14,395 14,196 -1.4%
#Units PhD Enr 137 134 166 164 123 123 149 149
New PhD Enroll 2,475 2,672 8.0% 2,752 2,996 8.9% 2,307 2,395 3.8% 2,552 2,684 5.2%
#Units New PhD 133 130 162 161 114 114 140 140
Bachelor’s 2015 2016 % chg 2015 2016 % chg 2014 2015 % chg 2014 2015 % chg
BS Awarded 17,401 20,709 19.0% 21,880 25,508 16.6% 16,467 19,219 16.7% 20,290 23,972 18.1%
#Units BS Awd 137 131 165 156 120 120 144 144
BS Enrollment 98,377 114,607 16.5% 119,919 136,589 13.9% 91,595 107,536 17.4% 110,777 129,362 16.8%
#Units BS Enr 138 131 165 155 121 121 144 144
New BS Majors 25,256 27,266 8.0% 30,147 32,216 6.9% 21,906 23,344 6.6% 26,289 27,694 5.3%
#Units New BS 123 112 147 137 97 97 117 117
BS Enroll/Dept 712.9 874.9 22.7% 726.8 881.2 21.2% 757.0 888.7 17.4% 769.3 898.3 16.8%
Page 12
cra.org/crn 14
The proportion of new doctoral students from outside North
America fell this year. It is now slightly lower than it was two
years ago. This year’s overall proportion is 62.0 percent while
last year’s was 65.7 percent. There were decreases in all
categories of departments (Table D5a).
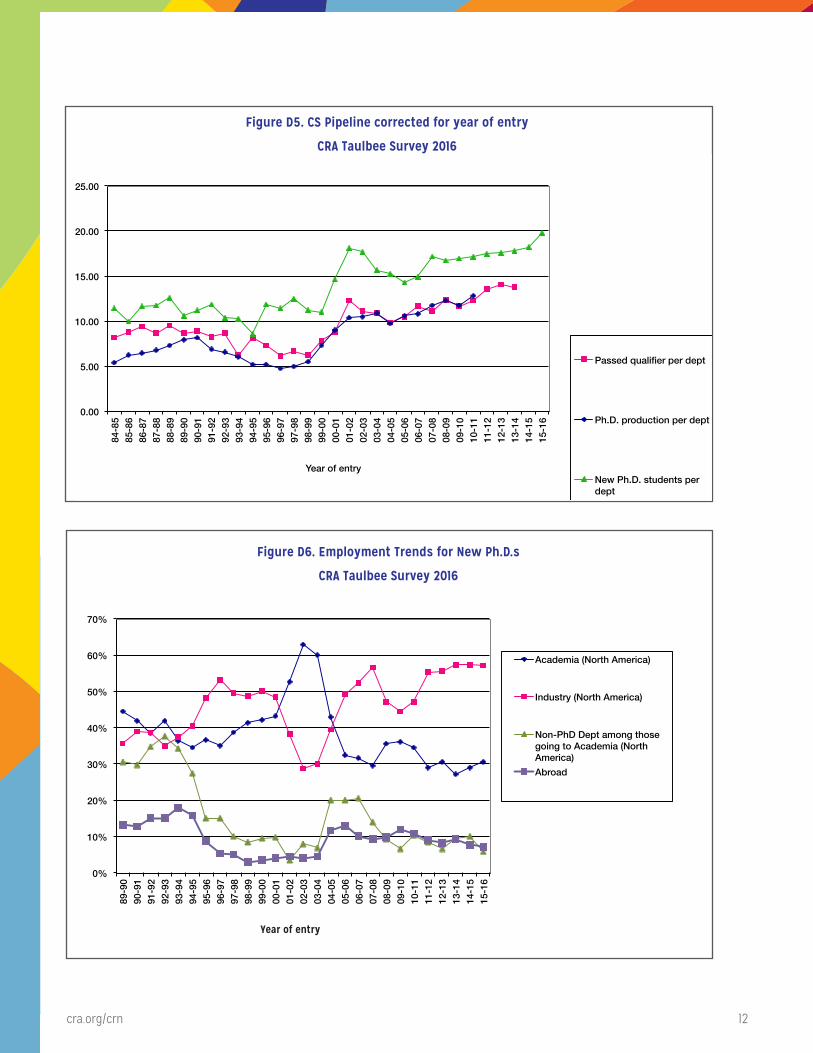
Figure D5 shows a graphical view of the Ph.D. pipeline for
U.S. computer science and Canadian departments, the main
producers of CS doctoral degrees. The data in this graph are
normalized by the number of reporting departments. The
graph offsets the qualifier data by two years from the data
for new students, and offsets the graduation data by five
years from the data for new students. These data have been
useful in estimating the timing of changes in production
rates. The graph suggests that there may be some further
rise in doctoral production during the next few years. The
departments are, in fact, forecasting a considerable increase
in production during 2016-17 (Table D1).
Ph.D. Employment
Figure D6 shows the employment trend of new Ph.D.s
in academia and industry within North America, those
taking employment outside of North America, and those
going to academia in North America who took positions
in departments other than Ph.D.-granting CS and CE
departments. Table D4 shows a more detailed breakdown of
the employment data for new Ph.D.s. The percentage of new
Ph.D.s who took positions in North American industry was
57.2 percent, similar to the percentage reported last year.
Among those doctoral graduates who went to North American
industry and for whom the type of industry position was
known, about 60 percent took research positions (Table D4a).
This is higher than the 57 percent reported in 2015. This year,
definitive data was provided for 91 percent of the graduates
who went to North American industry.
The percentage of Ph.D. graduates who took North American
academic jobs rose in 2015-16 for the second straight year,
to 30.7 from 29.0 last year. However, the percentage of
graduates taking tenure-track positions in North American
doctoral-granting computing departments fell from to 10.0 in
2014-15 to 9.0 in 2015-16. The percentage taking positions in
North American non-Ph.D.-granting computing departments
fell from 2.3 percent to 1.6 percent, while the percentage
taking North American academic postdoctoral positions
jumped from 9.7 percent to 14.3 percent.
Among those whose employment is known, the proportion of
Ph.D. graduates who were reported taking positions outside
of North America fell from 7.8 percent to 7.3 percent. In 2015-
16, 28 percent of those employed outside of North America
went to industry compared to 24 percent reported last year.
About 33 percent went to tenure-track academic positions,
almost doubling last year’s 17 percent, while approximately 15
percent went to academic postdoctoral positions, down from
20 percent last year. Of the doctoral graduates who went to
non-North American industry positions, the positions were in
research by more than a three-to-one margin. Definitive data
was provided for 97 percent of these graduates.
Employment in industry postdoctoral positions is included in
the overall industry numbers. When academic and industry
postdocs are combined, the result is that 16.6 percent of
2015-16 doctoral graduates took some type of postdoctoral
position, up from 12.6 percent last year and greater than the
15.6 percent in 2013-14. Only about 8 percent of these were
industry postdocs, continuing a downward trend.
The unemployment rate for new Ph.D.s again this year was
below 1 percent. In 2015-16, 20.6 percent of new Ph.D.s’
employment status was unknown; in 2014-15 it was 21.0
percent. The lack of information about the employment of
more than one in five graduates may skew the real overall
percentages for certain employment categories.
Table D4 also indicates the areas of specialty of new
Ph.D.s, using this year’s slightly modified category names.
Artificial intelligence/machine learning, software engineering,
databases, security/information assurance, and networks
are the most popular areas of specialization for doctoral
graduates, in that order. Security/information assurance
made the biggest gain of any area this past year. There
are many Ph.D.s categorized as “other,” which includes
“unknown.” It is unclear how many of these are really “other”
and how many were just not categorized.
Page 13
cra.org/crn 15
Master’s and Bachelor’s Degree Production and Enrollments
This section reports data about enrollment and degree
production for master’s and bachelor’s programs in the
doctoral-granting departments. Although the absolute number
of degrees and enrolled students reported herein only reflect
departments that offer the doctoral degree, the trends
observed in the master’s and bachelor’s data from these
departments tend to strongly reflect trends in the larger
population of programs that offer such degrees.
Master’s (Tables M1-M8; Figures M1-M2)
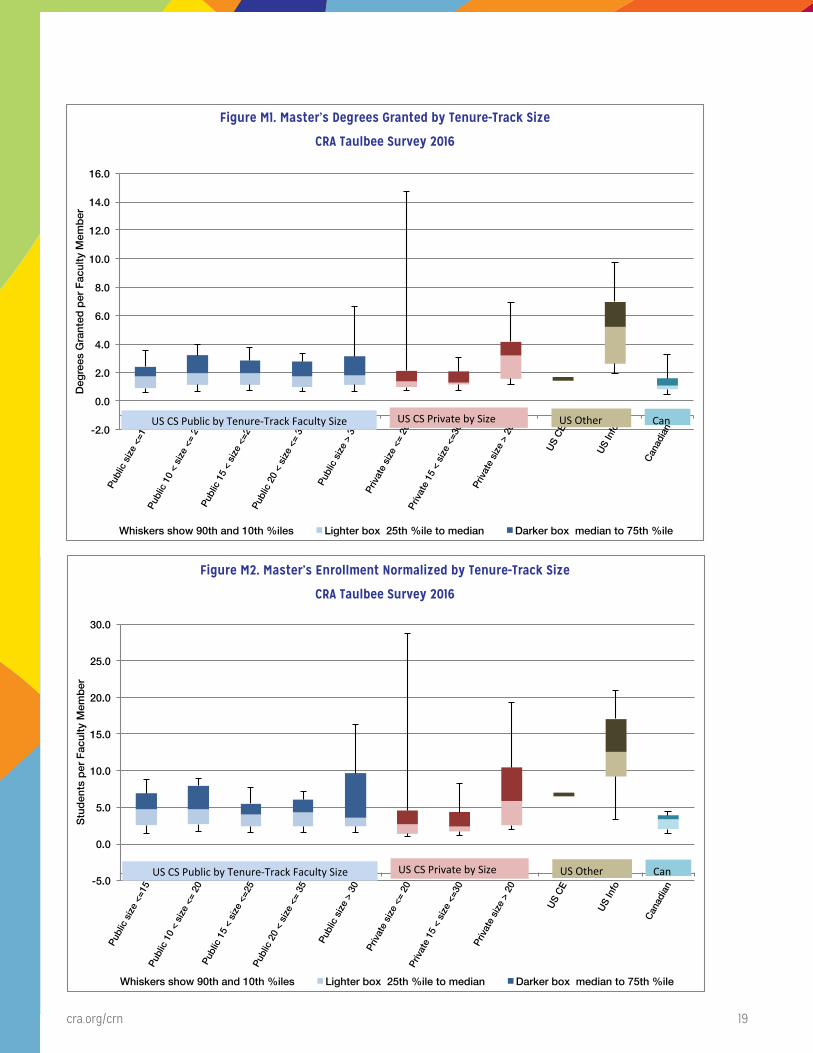
On a per department basis, CS master’s degree production
in U.S. CS departments rose nearly 17 percent in 2015-16; this
follows a nearly 25 percent increase in 2014-15. Both public
and private departments again reported large increases.
Overall production of master’s degrees in the CE and
Information areas also rose in 2015-16. U.S. CS departments,
both public and private, showed an increased production
of information master’s degrees, as did U.S. I departments
(Table M1).
The proportion of female graduates among CS master’s
degree recipients rose very slightly, from 24.9 percent to
25.2 percent. The overall percentage of master’s degrees to
women increased only 0.1 to 29.4 percent, due to a drop in
CE from 23.9 percent to 21.4 percent while the I area was
fairly constant with just a change of 0.1 percent downward
(Table M2).
In CS, 75.6 percent of master’s degrees went to Non-resident
Aliens, a large increase over the 68.1 percent in 2014-15. In the
Information area, the percentage of the master’s recipients
that were Non-resident Aliens also showed a large increase
in 2015-16, to 49.9 percent as compared with 33.3 percent
in 2014-15 and 28.1 percent 2013-14. In both CS and I, the
fraction of master’s degrees going to Whites and domestic
Asians declined. The percentage of master’s recipients among
American Indian/Alaska Native, Black/African-American, Native
Hawaiian/Pacific Islander, Hispanic, and Multiracial dropped
in CS from nearly 4 percent in 2014-15 to under 3 percent in
2015-16. This percentage also dropped in I from 13.2 percent to
10.6 percent (Table M3).
Non-resident Aliens comprised a much larger proportion of
female CS degree recipients than male CS degree recipients,
while Whites comprised a larger percentage of male CS
degree recipients than female CS degree recipients (Table M7).
With somewhat differing percentages, the same observations
Table M1. Master’s Degrees Awarded by Department Type
Department Type # Depts CS CE I Total
US CS Public 100 6,500 57.8% 418 56.7% 832 30.2% 7,750 52.6%
US CS Private 34 4,098 36.5% 78 10.6% 392 14.2% 4,568 31.0%
Total US CS 134 10,598 94.3% 496 67.3% 1,224 44.4% 12,318 83.6%
US CE 6 0 0.0% 236 32.0% 0 0.0% 236 1.6%
US Info 12 34 0.3% 0 0.0% 1,516 55.0% 1,550 10.5%
Canadian 11 607 5.4% 5 0.7% 15 0.5% 627 4.3%
Grand Total 163 11,239 737 2,755 14,731
Table M2. Master’s Degrees Awarded by Gender
CS CE I Total
Male 8,041 74.8% 562 78.6% 1,401 52.1% 10,004 70.6%
Female 2,715 25.2% 153 21.4% 1,288 47.9% 4,156 29.4%
Total Known Gender 10,756 715 2,689 14,160
Gender Unknown 483 22 66 571
Grand Total 11,239 737 2,755 14,731
Page 14
cra.org/crn 16
held for CE master’s graduates. In the I area, Non-resident
Aliens comprised a larger percentage of male master’s
graduates than female master’s graduates, and Whites
comprised a smaller fraction of male master’s graduates
than female master’s graduates. These observations are
consistent with those of previous years, and the current
enrollment breakdown by gender and ethnicity (Table
M8) suggests that these observations will continue to be
reflected in master’s recipients in the near future.
Table M3. Master’s Degrees Awarded by Ethnicity
CS CE I Total
Nonresident Alien 7,883 75.6% 526 73.6% 1,256 49.9% 9,665 70.8%
Amer Indian or Alaska Native 14 0.1% 3 0.4% 9 0.4% 26 0.2%
Asian 731 7.0% 44 6.2% 132 5.2% 907 6.6%
Black or African-American 78 0.7% 4 0.6% 117 4.6% 199 1.5%
Native Hawaiian/Pac Island 8 0.1% 0 0.0% 1 0.0% 9 0.1%
White 1,536 14.7% 111 15.5% 863 34.3% 2,510 18.4%
Multiracial, not Hispanic 48 0.5% 9 1.3% 42 1.7% 99 0.7%
Hispanic, any race 126 1.2% 18 2.5% 97 3.9% 241 1.8%
Total Residency & Ethnicity Known 10,424 715 2,517 13,656
Resident, ethnicity unknown 285 10 86 381
Residency unknown 530 12 152 694
Grand Total 11,239 737 2,755 14,731
Table M4. Master’s Degrees Expected Next Year by Department Type
Department Type
# Depts CS CE I Total
US CS Public 97 5,807 62.7% 308 49.8% 624 24.8% 6,739 54.4%
US CS Private 27 2,866 30.9% 74 12.0% 353 14.0% 3,293 26.6%
Total US CS 124 8,673 93.7% 382 61.8% 977 38.8% 10,032 80.9%
US CE 6 0 0.0% 226 36.6% 0 0.0% 226 1.8%
US Info 12 35 0.4% 0 0.0% 1,538 61.2% 1,573 12.7%
Canadian 11 553 6.0% 10 1.6% 0 0.0% 563 4.5%
Grand Total 153 9,261 618 2,515 12,394
Table M5. New Master’s Students by Department Type
Department Type
CS CE I Total Outside North America
Total # Depts
Avg. per
Dept.Total #
DeptsAvg. per
Dept.Total #
DeptsAvg. per
Dept.Total #
DeptsAvg. per
Dept.#
Depts %
US CS Public 6,735 98 68.7 326 19 17.2 886 15 59.1 7,947 98 81.1 5,612 70.6%
US CS Private 3,275 32 102.3 113 5 22.6 252 3 84.0 3,640 32 113.8 2,213 60.8%
Total US CS 10,010 130 77.0 439 24 18.3 1,138 18 63.2 11,587 130 89.1 7,825 67.5%
US CE 0 0 0.0 259 6 43.2 0 0 0.0 259 6 43.2 203 78.4%
US Info 18 1 18.0 0 0 0.0 1,160 11 105.5 1,178 11 107.1 581 49.3%
Canadian 468 11 42.5 6 1 6.0 0 0 0.0 474 11 43.1 319 67.3%
Grand Total 10,496 142 73.9 704 31 22.7 2,298 29 79.2 13,498 158 85.4 8,928 66.1%
Page 15
cra.org/crn 17
There were increases once again in the number of new
master’s students enrolled in U.S. CS departments, from an
average of 80.7 per department in 2015 to 89.1 in 2016 (an
increase of slightly over 10 percent). U.S. CS departments
at both public and private institutions experienced similar
increases (Table M5).
The fraction of new master’s students in U.S. CS departments
that is reported to be from outside North America rose from
63.3 percent in 2015-16 to 67.5 percent in 2016-17 (Table M5).
The increase was in departments at public institutions;
private institutions showed a slight decrease, from 61.3
percent to 60.8 percent. At U.S. Information departments,
the fraction of new master’s students from outside North
America rose from 32.4 percent to 49.3 percent, following a
decrease last year.
Table M6. Total Master’s Enrollment by Department Type
Department Type
CS CE I Total
Total # Depts
Avg. per
Dept.Total #
DeptsAvg. per
Dept.Total #
DeptsAvg. per
Dept.Total #
DeptsAvg. per
Dept.
US CS Public 16,999 100 170.0 881 26 33.9 2,291 16 143.2 20,171 100 201.7
US CS Private 10,424 34 306.6 151 6 25.2 1,105 3 368.3 11,680 34 343.5
Total US CS 27,423 134 204.6 1,032 32 32.3 3,396 19 178.7 31,851 134 237.7
US CE 0 0 0.0 679 6 113.2 0 0 0.0 679 6 113.2
US Info 88 1 88.0 0 0 0.0 3,334 11 303.1 3,422 11 311.1
Canadian 1,164 11 105.8 17 1 17.0 48 1 48.0 1,229 11 111.7
Grand Total 28,675 146 196.4 1,728 39 44.3 6,778 31 218.6 37,181 162 229.5
Table M7. Masters Degrees Awarded by Gender and Ethnicity, From 163 Departments Providing Breakdown Data
CS CE I Ethnicity Totals
Male Fem N/R % of M*
% of F*
Male Fem N/R % of M*
% of F*
Male Fem N/R % of M*
% of F*
Total %
Nonresident Alien 5,652 2,086 92 74 81 390 124 12 72 83 689 528 39 54 44 9,665 70.8
Amer Indian or Alaska Native
5 8 1 0 0 3 0 0 1 0 6 3 0 1 0 26 0.2
Asian 508 211 6 7 8 31 11 2 6 7 73 55 4 6 5 907 6.6
Black or African-American
52 25 1 1 1 3 1 0 1 1 65 49 3 5 4 199 1.5
Native Hawaiian/ Pac Islander
7 1 0 0 0 0 0 0 0 0 1 0 0 0 0 9 0.1
White 1,262 227 44 17 9 95 10 6 17 7 382 475 6 30 40 2,510 18.4
Multiracial, not Hispanic
33 12 2 0 1 7 2 0 1 1 9 33 0 1 3 99 0.7
Hispanic, any race 105 19 2 1 1 16 2 0 3 1 44 53 0 4 4 241 1.8
Total Res & Ethnicity Known
7,624 2,589 148 545 150 20 1,269 1,196 52 13,656
Resident, ethnicity unknown
223 59 3 8 1 1 43 43 0 381
Not Reported (N/R) 151 47 332 9 2 1 89 49 14 694
Gender Totals 8,041 2,715 483 562 153 22 1,401 1,288 66 14,731
% 74.8% 25.2% 78.6% 21.4% 52.1% 47.9%
* % of M and % of F columns are the percent of that gender who are of the specified ethnicity, of those whose ethnicity is known
Page 16
cra.org/crn 18
Table M8. Masters Enrollment by Gender and Ethnicity, From 162 Departments Providing Breakdown Data
CS CE I Ethnicity Totals
Male Fem N/R % of M*
% of F* Male Fem N/R % of
M*% of F* Male Fem N/R % of
M*% of F* Total %
Nonresident Alien 11,486 5,169 886 63 78 955 328 29 76 86 1,784 1,275 13 51 45 22,211 65.0
Amer Indian or Alaska Native
19 5 0 0 0 6 0 0 1 0 1 4 0 0 0 36 0.1
Asian 1,619 610 11 9 9 50 15 6 4 4 261 167 0 8 6 2,742 8.0
Black or African-American
284 85 2 2 1 10 5 0 1 1 191 131 0 6 5 711 2.1
Native Hawaiian/ Pac Islander
16 3 0 0 0 0 0 0 0 0 5 3 0 0 0 27 0.1
White 4,178 626 94 23 10 180 27 13 14 7 1,051 1,112 20 30 39 7,309 21.4
Multiracial, not Hispanic
137 31 0 1 1 9 1 0 1 0 44 62 0 1 2 285 0.8
Hispanic, any race 491 76 6 3 1 41 7 3 3 2 139 100 0 4 4 865 2.5
Total Res & Ethnicity Known
18,230 6,605 999 1,251 383 51 3,476 2,854 33 34,186
Resident, ethnicity unknown
874 229 12 13 2 3 188 143 2 1558
Not Reported (N/R) 694 246 390 6 1 18 53 15 14 1,437
Gender Totals 20,108 7,166 1401 1,270 386 72 3,717 3,012 49 37,181
% 73.7% 26.3% 76.7% 23.3% 55.2% 44.8%
* % of M and % of F columns are the percent of that gender who are of the specified ethnicity, of those whose ethnicity is known
Page 17
cra.org/crn 19
-2.0!
0.0!
2.0!
4.0!
6.0!
8.0!
10.0!
12.0!
14.0!
16.0!
Publ
ic siz
e <=
15!
Publ
ic 10
< si
ze <
= 20!
Publ
ic 15
< si
ze <
=25!
Publ
ic 20
< si
ze <
= 35!
Publ
ic siz
e >
30!
Priva
te si
ze <
= 20!
Priva
te 1
5 <
size
<=30!
Priva
te si
ze >
20!
US C
E!
US In
fo!
Cana
dian!
Deg
rees
Gra
nted
per
Fac
ulty
Mem
ber!
Figure M1. Master's Degrees Granted by Tenure-Track Size!CRA Taulbee Survey 2016!
!
Whiskers show 90th and 10th %iles! Lighter box 25th %ile to median! Darker box median to 75th %ile!
USCSPublicbyTenure-TrackFacultySize USCSPrivatebySize USOther Can
-5.0!
0.0!
5.0!
10.0!
15.0!
20.0!
25.0!
30.0!
Publ
ic siz
e <=
15!
Publ
ic 10
< si
ze <
= 20!
Publ
ic 15
< si
ze <
=25!
Publ
ic 20
< si
ze <
= 35!
Publ
ic siz
e >
30!
Priva
te si
ze <
= 20!
Priva
te 1
5 <
size
<=30!
Priva
te si
ze >
20!
US C
E!
US In
fo!
Cana
dian!
Stud
ents
per
Fac
ulty
Mem
ber!
Figure M2. Master's Enrollment Normalized by Tenure-Track Size!CRA Taulbee Survey 2016!
!
Whiskers show 90th and 10th %iles! Lighter box 25th %ile to median! Darker box median to 75th %ile!
USCSPublicbyTenure-TrackFacultySize USCSPrivatebySize USOther Can
Figure M1. Master’s Degrees Granted by Tenure-Track Size
CRA Taulbee Survey 2016
Figure M2. Master’s Enrollment Normalized by Tenure-Track Size
CRA Taulbee Survey 2016
Page 18
cra.org/crn 20
Table B1. Bachelor’s Degrees Awarded by Department Type
Department Type # Depts CS CE I Total
US CS Public 98 12,630 66.6% 1,858 71.2% 1,835 46.5% 16,323 64.0%
US CS Private 33 3,800 20.0% 254 9.7% 332 8.4% 4,386 17.2%
Total US CS 131 16,430 86.7% 2,112 80.9% 2,167 55.0% 20,709 81.2%
US CE 6 0 0.0% 431 16.5% 201 5.1% 632 2.5%
US Info 9 98 0.5% 0 0.0% 1,208 30.6% 1,306 5.1%
Canadian 10 2,426 12.8% 68 2.6% 367 9.3% 2,861 11.2%
Grand Total 156 18,954 2,611 3,943 25,508
Table B2. Bachelor’s Degrees Awarded by Gender
CS CE I Total
Male 14,259 82.1% 2,103 87.4% 2,830 77.1% 19,192 81.9%
Female 3,107 17.9% 304 12.6% 840 22.9% 4,251 18.1%
Total Known Gender 17,366 2,407 3,670 23,443
Gender Unknown 1,588 204 273 2,065
Grand Total 18,954 2,611 3,943 25,508
Table B3. Bachelor’s Degrees Awarded by Ethnicity
CS CE I Total
Nonresident Alien 1,493 10.4% 214 9.0% 188 5.6% 1,895 9.4%
Amer Indian or Alaska Native 53 0.4% 6 0.3% 7 0.2% 66 0.3%
Asian 3,625 25.3% 630 26.4% 596 17.8% 4,851 24.2%
Black or African-American 440 3.1% 99 4.1% 256 7.6% 795 4.0%
Native Hawaiian/Pac Islander 26 0.2% 2 0.1% 18 0.5% 46 0.2%
White 7,202 50.3% 1,172 49.1% 1,760 52.4% 10,134 50.5%
Multiracial, not Hispanic 409 2.9% 59 2.5% 119 3.5% 587 2.9%
Hispanic, any race 1,069 7.5% 205 8.6% 412 12.3% 1,686 8.4%
Total Residency & Ethnicity Known 14,317 2,387 3,356 20,060
Resident, ethnicity unknown 677 59 116 852
Residency unknown 3,960 165 471 4,596
Grand Total 18,954 2,611 3,943 25,508
Bachelor’s (Tables 1, B1-B8; Figures B1-B4)
When comparing bachelor’s degree production reported by
all departments this year to that reported by all departments
last year, there was an overall increase in of 16.6 percent,
and an increase of 23.3 percent per department. When
considering only those departments that reported both years,
the increase was 18.1 percent (Table 1). Among U.S. computer
science departments, the increases in overall bachelor’s
degree production were 19.0 percent overall and 24.5 percent
per department. The increase was 16.7 percent for those U.S. CS
departments that reported both years. When only the CS area
is considered, bachelor’s degree production per department
increased 26.2 percent at U.S. CS departments, and it increased
30.6 percent among all reporting departments (Table B1).
This marks the third consecutive year of double-digit
percentage increases in bachelor’s degree production. It is a
natural outgrowth of the bachelor’s enrollments surge reported
for the past several years. Sizeable increases in bachelor’s
Page 19
cra.org/crn 21
degree production are likely to continue for the next few years
based on current enrollments. Figure B1 shows the trend in
total computing bachelor’s degree production since 1995 for all
departments reporting to the Taulbee Survey.
For the ninth consecutive year, there was an increase in the
number of new undergraduate computing majors. This year’s
respondents reported 6.9 percent more new majors (but 14.7
percent more per department) than did last year’s respondents.
The increase is only 5.3 percent when considering only those
departments reporting both this year and last year. Among
U.S. computer science departments, the increase was 10.1
percent overall (18.6 percent per department), and 6.6 percent
among departments reporting both this year and last year.
If only increases in new CS majors at U.S. CS departments
are considered, the average increase is 19.9 percent per
Table B5. New Bachelor’s Students by Department Type
CS CE I Total
Department Type Major Pre-
Major#
DeptsAvg.
Major /Dept
Total Pre-Major
# Depts
Avg. Major /Dept
Total Pre-Major
# Depts
Avg. Major /Dept
Total Major
Avg. Major /Dept
US CS Public 18,302 8,450 85 215.3 2,217 849 27 82.1 836 234 21 39.8 21,355 251.2
US CS Private 5,239 1,771 27 194.0 353 15 8 44.1 319 13 4 79.8 5,911 218.9
US CS Total 23,541 10,221 112 210.2 2,570 864 35 73.4 1,155 247 25 46.2 27,266 243.4
US CE 0 0 0 0.0 470 363 6 78.3 0 0 0 0.0 470 78.3
US Information 200 0 1 200.0 0 0 0 0.0 935 150 10 93.5 1,135 113.5
Canadian 3,178 782 9 353.1 167 0 2 83.5 0 0 0 0.0 3,345 371.7
Grand Total 26,919 11,003 122 220.6 3,207 1,227 43 74.6 2,090 397 35 59.7 32,216 235.2
Table B6. Total Bachelor’s Enrollment by Department Type
CS CE I Total
Department Type Major Pre-
Major#
DeptsAvg.
Major /Dept
Total Pre-Major
# Depts
Avg. Major /Dept
Total Pre-Major
# Dept
Avg. Major /Dept
Total Major
Avg. Major /Dept
US CS Public 72,159 15,347 98 736.3 9,646 1,570 36 267.9 7,989 698 26 307.3 89,794 916.3
US CS Private 22,342 2,397 33 677.0 1,120 18 9 124.4 1,351 9 4 337.8 24,813 751.9
US CS Total 94,501 17,744 131 721.4 10,766 1,588 45 239.2 9,340 707 30 311.3 114,607 874.9
US CE 0 0 0 0.0 2,244 1,098 6 374.0 837 0 1 837.0 3,081 513.5
US Info 802 0 1 802.0 0 0 0 0.0 3,919 679 9 435.4 4,721 524.6
Canadian 9,845 3,042 9 1,093.9 216 499 1 216.0 4,119 0 4 1,029.8 14,180 1,575.6
Grand Total 105,148 20,786 141 745.7 13,226 3,185 52 254.3 18,215 1,386 44 414.0 136,589 881.2
Table B4. Bachelor’s Degrees Expected Next Year by Department Type
Department Type # Depts CS CE I Total
US CS Public 91 13,140 67.4% 1,800 64.4% 1,430 51.0% 16,370 65.3%
US CS Private 27 3,830 19.7% 294 10.5% 23 0.8% 4,147 16.5%
Total US CS 118 16,970 87.1% 2,094 75.0% 1,453 51.8% 20,517 81.8%
US CE 6 0 0.0% 607 21.7% 0 0.0% 607 2.4%
US Info 8 0 0.0% 0 0.0% 1,344 47.9% 1,344 5.4%
Canadian 10 2,513 12.9% 92 3.3% 7 0.2% 2,612 10.4%
Grand Total 142 19,483 2,793 2,804 25,080
Page 20
cra.org/crn 22
department. Figure B2 illustrates the trend in the total number
of newly declared computing undergraduate majors as
reported in the Taulbee Survey.
Total undergraduate enrollment in computing majors among
U.S. CS departments (i.e., the sum of the number of majors in
CS, CE, and I at these departments) increased 16.4 percent (21.2
percent per department) when all respondents are compared,
and increased 16.8 percent among U.S. CS departments
reporting both this year and last year. Aggregate total
enrollment (which combines CS departments, CE departments, I
departments, and Canadian departments) once again increased
in all three computing areas (CS, CE, and I), although the
increase in CE was less than 1 percent and actually decreased
slightly on a per-department basis (Table B6).
Per-department averages smooth out comparisons from year
to year when there are differences in the number of reporting
departments, but the averages include both very large and very
small departments. Figures B3 and B4 show the distribution of
number of degrees awarded (Figure B3) and total enrollment
(Figure B4) per tenured or tenure-track faculty member, in
department size groupings for the U.S. CS departments.
The enrollment increases in CS are of particular interest to
our community, and the recent CRA Enrollment Report (www.
cra.org/data/generation-cs) discusses the current surge in
considerable detail. This year’s Taulbee Survey data shows
that the per-department enrollment of CS bachelor’s majors
in U.S. CS departments increased by 24.8 percent over last
year. Figure B5 shows the enrollment trend from Taulbee
Survey data since this surge began a decade ago. The average
enrollment per U.S. CS department has increased approximately
275 percent during this period; that is, it has nearly quadrupled.
For the past three years, it has exceeded the previous peak
reached during the dot-com enrollment surge. Analysis of the
newly collected course-level enrollment data will be presented
in future Taulbee Survey reports.
Table B7. Bachelors Degrees Awarded by Gender and Ethnicity, From 156 Departments Providing Breakdown Data
CS CE I Ethnicity Totals
Male Fem N/R % of M*
% of F* Male Fem N/R % of
M*% of F* Male Fem N/R % of
M*% of F* Total %
Nonresident Alien 1,141 344 3 10 14 171 41 2 9 14 140 43 5 6 6 1,895 9.4
Amer Indian or Alaska Native
46 5 2 0 0 5 1 0 0 0 7 0 0 0 0 66 0.3
Asian 2,738 870 8 24 35 522 97 11 26 33 398 181 17 16 24 4,851 24.2
Black or African-American
350 79 5 3 3 73 19 7 4 7 174 62 20 7 8 795 4.0
Native Hawaiian/ Pac Islander
22 4 0 0 0 2 0 0 0 0 12 6 0 1 1 46 0.2
White 6,120 931 121 53 38 1,015 103 54 51 35 1,349 336 75 55 45 10,134 50.5
Multiracial, not Hispanic
322 75 6 3 3 49 10 0 3 3 75 41 3 3 6 587 2.9
Hispanic, any race
875 173 21 8 7 153 23 29 8 8 312 79 21 13 11 1,686 8.4
Total Res & Ethnicity Known
11,614 2,481 166 1,990 294 103 2,467 748 141 20,060
Resident, ethnicity unknown
540 125 8 55 4 0 98 18 0 852
Not Reported (N/R)
2,058 488 1,414 58 6 101 265 74 132 4,596
Gender Totals 14,259 3,107 1,588 2,103 304 204 2,830 840 273 25,508
% 82.1% 17.9% 87.4% 12.6% 77.1% 22.9%
* % of M and % of F columns are the percent of that gender who are of the specified ethnicity, of those whose ethnicity is known
Page 21
cra.org/crn 23
Table B8. Bachelors Enrollment by Gender and Ethnicity, From 155 Departments Providing Breakdown Data
CS CE I Ethnicity Totals
Male Fem N/R % of M*
% of F* Male Fem N/R % of
M*% of F* Male Fem N/R % of
M*% of F* Total %
Nonresident Alien 6,717 1,916 20 11 14 866 176 11 9 11 451 177 12 5 7 10,360 10.0
Amer Indian or Alaska Native
221 40 5 0 0 19 10 0 0 1 34 6 2 0 0 337 0.3
Asian 14,175 4,312 128 22 32 2,390 589 38 24 36 1,675 668 72 17 26 24,175 23.2
Black or African-American
2,874 787 93 5 6 485 97 43 5 6 833 248 85 8 10 5,601 5.4
Native Hawaiian/ Pac Islander
168 34 5 0 0 16 3 0 0 0 43 11 0 0 0 280 0.3
White 31,707 4,627 770 50 35 4,821 556 193 49 34 5,231 1,093 381 53 43 49,633 47.7
Multiracial, not Hispanic
1,849 423 55 3 3 289 36 9 3 2 324 87 22 3 3 3,114 3.0
Hispanic, any race 5,998 1,150 264 9 9 1,058 184 107 11 11 1,359 282 148 14 11 10,567 10.2
Total Res & Ethnicity Known
63,709 13,289 1,340 9,944 1,651 401 9,950 2,572 722 104,067
Resident, ethnicity unknown
3,477 888 2,130 337 50 8 433 86 11 7,445
Not Reported (N/R) 11,245 3,435 5,121 362 59 414 3,272 966 203 25,077
Gender Totals 78,853 17,704 8,591 10,643 1,760 823 13,655 3,624 936 136,589
% 81.7% 18.3% 85.8% 14.2% 79.0% 21.0%
* % of M and % of F columns are the percent of that gender who are of the specified ethnicity, of those whose ethnicity is known
6,000 !
8,000 !
10,000 !
12,000 !
14,000 !
16,000 !
18,000 !
20,000 !
22,000 !
24,000 !
1995!
1996!
1997!
1998!
1999!
2000!
2001!
2002!
2003!
2004!
2005!
2006!
2007!
2008!
2009!
2010!
2011!
2012!
2013!
2014!
2015!
2016!
2017
proj!
Num
ber o
f Deg
rees!
Year!
Figure B1. BS Production (CS & CE)!CRA Taulbee Survey 2016!Figure B1. BS Production (CS & CE)
CRA Taulbee Survey 2016
Year
Page 22
cra.org/crn 24
10,000 !
15,000 !
20,000 !
25,000 !
30,000 !
35,000 !
1995!
1996!
1997!
1998!
1999!
2000!
2001!
2002!
2003!
2004!
2005!
2006!
2007!
2008!
2009!
2010!
2011!
2012!
2013!
2014!
2015!
2016!
Num
ber o
f Stu
dent
s!
Year!
Figure B2. Newly Declared Undergraduate Majors: CS, CE, and I (beginning in 2008) !CRA Taulbee Survey 2016!
-1.0!
0.0!
1.0!
2.0!
3.0!
4.0!
5.0!
6.0!
7.0!
8.0!
9.0!
10.0!
11.0!
12.0!
Publ
ic siz
e <=
15!
Publ
ic 10
< si
ze <
= 20!
Publ
ic 15
< si
ze <
=25!
Publ
ic 20
< si
ze <
= 35!
Publ
ic siz
e >
30!
Priva
te si
ze <
= 20!
Priva
te 1
5 <
size
<=30!
Priva
te si
ze >
20!
US C
E!
US In
fo!
Cana
dian!
Deg
rees
per
Fac
ulty
Mem
ber!
Figure B3. Bachelor's Degrees Granted by Tenure-Track Size!CRA Taulbee Survey 2016!
!
Whiskers show 90th and 10th %iles! Lighter box 25th %ile to median! Darker box median to 75th %ile!
USCSPublicbyTenure-TrackFacultySize USCSPrivatebySize USOther Can
Figure B3. Bachelor’s Degrees Granted by Tenure-Track Size
CRA Taulbee Survey 2016
Figure B2. Newly Declared Undergraduate Majors: CS, CE, and I (beginning in 2008)
CRA Taulbee Survey 2016
Year
Page 23
cra.org/crn 25
-5.0!
5.0!
15.0!
25.0!
35.0!
45.0!
55.0!
65.0!
Publ
ic siz
e <=
15!
Publ
ic 10
< si
ze <
= 20!
Publ
ic 15
< si
ze <
=25!
Publ
ic 20
< si
ze <
= 35!
Publ
ic siz
e >
30!
Priva
te si
ze <
= 20!
Priva
te 1
5 <
size
<=30!
Priva
te si
ze >
20!
US C
E!
US In
fo!
Cana
dian!
Stud
ents
per
Fac
ulty
Mem
ber!
Figure B4. Bachelor's Enrollment Normalized by Tenure-Track Size!CRA Taulbee Survey 2016!
!
Whiskers show 90th and 10th %iles! Lighter box 25th %ile to median! Darker box median to 75th %ile!
USCSPublicbyTenure-TrackFacultySize USCSPrivatebySize USOther Can
0!
100!
200!
300!
400!
500!
600!
700!
800!
2006! 2007! 2008! 2009! 2010! 2011! 2012! 2013! 2014! 2015! 2016!Academic Year Beginning!
Figure B5. Average New and Continuing CS Majors per Academic Unit (U.S. CS Programs Only)!
Average Continuing Majors!
Average New Majors Fall!
Figure B5. Average New and Continuing CS Majors perAcademic Unit (U.S. CS Programs Only)
CRA Taulbee Survey 2016
Figure B4. Bachelor’s Enrollment Normalized by Tenure-Track Size
CRA Taulbee Survey 2016
Page 24
cra.org/crn 26
Table F1. Actual and Anticipated Faculty Size by Position and Department Type
Actual ProjectedExpected 2-Yr Growth
2015-2016 2016-2017 2017-2018
US CS Public Total Average Total Average Total Average # %
TenureTrack 2,858 28.9 3,027 30.6 3,148 31.8 290 10.1%
Teaching 635 7.4 708 8.0 756 8.7 121 19.1%
Research 237 4.8 267 5.3 283 5.7 46 19.4%
Postdoc 282 5.2 321 5.7 339 6.1 57 20.2%
Total 4,002 40.4 4,315 43.6 4,519 45.6 517 12.9%
US CS Private
TenureTrack 1,113 30.9 1,186 32.9 1,248 34.7 135 12.1%
Teaching 269 8.7 288 9.3 302 9.7 33 12.3%
Research 127 8.5 133 8.9 133 8.9 6 4.7%
Postdoc 209 10.0 233 10.1 254 11.0 45 21.5%
Total 1,716 47.7 1,839 51.1 1,935 53.8 219 12.8%
All US CS
TenureTrack 3,971 29.4 4,212 31.2 4,396 32.6 425 10.7%
Teaching 903 7.7 996 8.4 1,057 9.0 154 17.1%
Research 364 5.7 400 6.1 416 6.4 52 14.3%
Postdoc 491 6.5 554 7.0 593 7.5 102 20.8%
Total 5,718 42.4 6,154 45.6 6,454 47.8 736 12.9%
US CE
TenureTrack 82 13.7 86 14.4 89 14.9 7 8.5%
Teaching 10 2.1 11 2.2 12 2.3 2 20.0%
Research 3 3.0 4 1.8 4 2.0 1 33.3%
Postdoc 6 2.0 7 2.2 7 2.3 1 16.7%
Total 101 16.8 107 17.8 111 18.5 10 9.9%
US I
TenureTrack 329 23.5 356 25.4 365 26.1 36 10.9%
Teaching 148 11.4 158 12.1 158 12.1 10 6.8%
Research 17 1.9 13 1.7 13 1.9 -4 -23.5%
Postdoc 42 3.9 48 4.8 51 5.1 9 21.4%
Total 535 38.2 574 41.0 585 41.8 50 9.3%
Canadian
TenureTrack 403 36.6 431 39.1 443 40.2 40 9.9%
Teaching 61 6.1 61 6.1 57 5.7 -4 -6.6%
Research 5 1.7 8 2.7 9 3.0 4 80.0%
Postdoc 50 8.3 48 8.0 50 8.3 0 0.0%
Total 517 47.0 546 49.6 557 50.6 40 7.7%
Grand Total
TenureTrack 4,786 28.8 5,085 30.6 5,293 31.9 507 10.6%
Teaching 1,122 7.7 1,226 8.3 1,283 8.8 161 14.3%
Research 390 5.1 424 5.4 442 5.7 52 13.3%
Postdoc 589 6.2 656 6.7 701 7.2 112 19.0%
Total 6,871 41.4 7,381 44.5 7,707 46.4 836 12.2%
Page 25
cra.org/crn 27
The proportion of women among bachelor’s graduates in CS
rose once again, from 15.7 percent in 2014-15 to 17.9 percent in
2015-16. This is the highest percentage of female CS graduates
among Taulbee Survey respondents since 2002-03. In CE,
the percentage of female bachelor’s graduates rose from 11.6
percent to 12.6 percent and the percentage of female bachelor’s
graduates in I rose from 21.7 percent to 22.9 percent (Table B2).
The percentage of CS bachelor’s degrees awarded to Whites
again declined from 55.0 percent in 2013-14 to 50.3 percent
in 2014-15, while the percentage awarded to Asians rose
again, from 22.8 percent to 25.3 percent and the percentage
awarded to Non-resident Aliens rose from 8.8 percent to 10.4
percent. Changes in other ethnicity categories were less than 1
percent in CS. In aggregate across the three degree areas, 50.5
percent of the graduates were White, 24.2 percent Asian, 9.4
percent Non-resident Aliens, and 15.8 percent all other ethnicity
categories combined. However, in I programs, the other
ethnicity categories accounted for more than 24 percent of the
graduates (Table B3).
In all three computing areas (CS, CE, and I), Resident Asians
and Non-resident Aliens comprise a larger fraction of female
enrollment than male enrollment, while Whites comprise a
larger fraction of male enrollment than female enrollment
(Table B8). Table B7 indicates that the same comparisons hold
true for degree awardees with the exception of I degrees to
Non-resident Aliens, whose relative percentages of men and
women are equal.
Faculty Demographics (Tables F1-F9)4
Table F1 shows the current and anticipated sizes, in FTE, for
tenure-track, teaching, and research faculty, and postdocs.
The total tenure-track faculty count in U.S. CS departments
(3,971) represents only a 2.3 percent increase over last year.
However, the average tenure-track faculty size per U.S. CS
department grew from 28.1 to 29.4 during this period, a 4.6
percent increase. In these departments, the average number
of teaching faculty increased from 6.9 to 7.7 and the average
number of research faculty increased from 5.4 to 5.7, while the
average number of postdocs remained at 6.5. Canadian, CE, and
I departments have much more volatile data due to the small
number of departments reporting in each of these categories.
As noted in previous Taulbee reports, Canadian universities,
on average, have several more tenure-track faculty members
per department than do U.S. universities, while U.S. I and CE
Table F2. Vacant Positions 2014-2015 by Position and Department Type
Tried to fill Filled
US CS Public
TenureTrack 302 221
Teaching 121 104
Research 46 45
Postdoc 96 115
Total 565 485
US CS Private
TenureTrack 116 83
Teaching 48 39
Research 22 24
Postdoc 90 84
Total 276 230
All US CS
TenureTrack 418 304
Teaching 169 143
Research 68 69
Postdoc 186 199
Total 841 715
US CE
TenureTrack 7 9
Teaching 18 18
Research 3 3
Postdoc 8 8
Total 36 38
US I
TenureTrack 39 26
Teaching 16 11
Research 1 1
Postdoc 9 8
Total 65 45
Canadian
TenureTrack 38 22
Teaching 11 11
Research 4 4
Postdoc 27 26
Total 80 63
Grand Total
TenureTrack 502 361
Teaching 214 183
Research 76 77
Postdoc 230 241
Total 1,022 861
Page 26
cra.org/crn 28
departments, on average, are somewhat smaller than
U.S. CS departments. The observations about U.S. CE and I
departments may reflect the fact that we ask departments
to report only computing-related faculty, so departments
with Library Science or EE programs may report only part of
their faculty.
Among U.S. CS departments, those at private universities have
more of each category of faculty, including postdocs, than do
those at public universities on average. This has held true for
the past two years except for tenure-track faculty, where last
year the average size at public universities was slightly larger
than that at private universities. The average tenure-track
size at private universities jumped from 27.6 to 30.9 while the
average at public universities showed a slim increase, from
28.3 to 28.9. The specific set of departments reporting from
one year to the next can impact these figures.
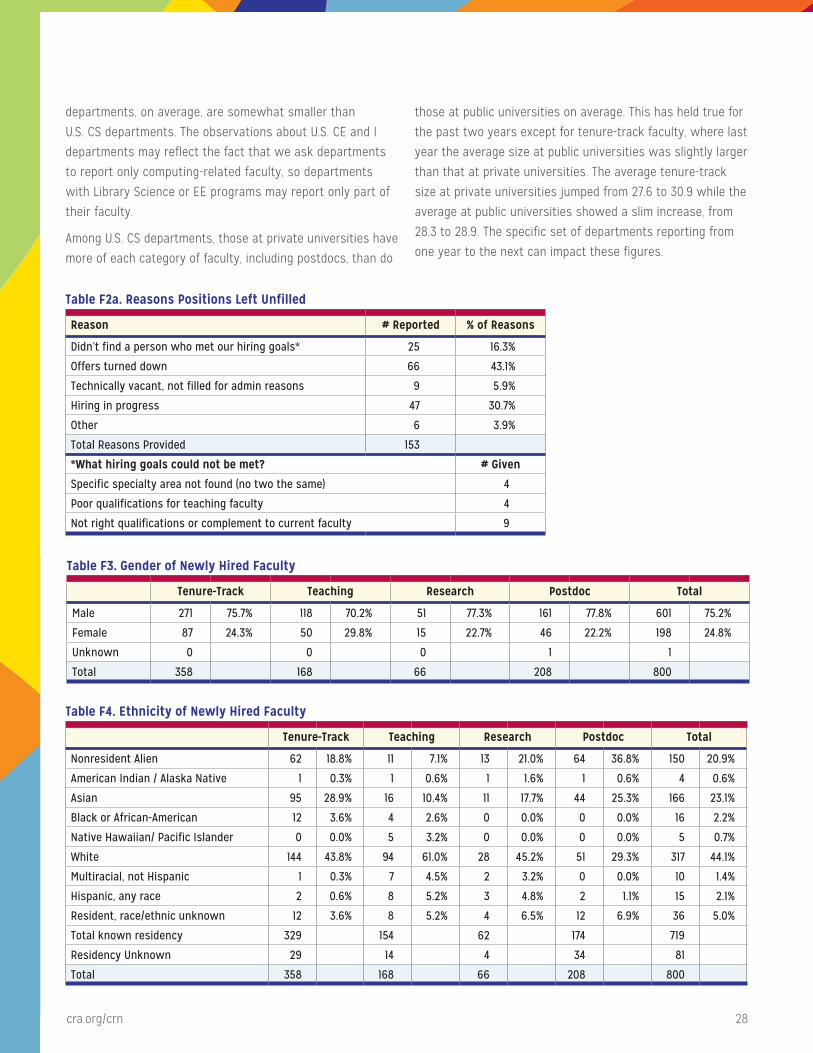
Table F2a. Reasons Positions Left Unfilled
Reason # Reported % of Reasons
Didn’t find a person who met our hiring goals* 25 16.3%
Offers turned down 66 43.1%
Technically vacant, not filled for admin reasons 9 5.9%
Hiring in progress 47 30.7%
Other 6 3.9%
Total Reasons Provided 153
*What hiring goals could not be met? # Given
Specific specialty area not found (no two the same) 4
Poor qualifications for teaching faculty 4
Not right qualifications or complement to current faculty 9
Table F3. Gender of Newly Hired Faculty
Tenure-Track Teaching Research Postdoc Total
Male 271 75.7% 118 70.2% 51 77.3% 161 77.8% 601 75.2%
Female 87 24.3% 50 29.8% 15 22.7% 46 22.2% 198 24.8%
Unknown 0 0 0 1 1
Total 358 168 66 208 800
Table F4. Ethnicity of Newly Hired Faculty
Tenure-Track Teaching Research Postdoc Total
Nonresident Alien 62 18.8% 11 7.1% 13 21.0% 64 36.8% 150 20.9%
American Indian / Alaska Native 1 0.3% 1 0.6% 1 1.6% 1 0.6% 4 0.6%
Asian 95 28.9% 16 10.4% 11 17.7% 44 25.3% 166 23.1%
Black or African-American 12 3.6% 4 2.6% 0 0.0% 0 0.0% 16 2.2%
Native Hawaiian/ Pacific Islander 0 0.0% 5 3.2% 0 0.0% 0 0.0% 5 0.7%
White 144 43.8% 94 61.0% 28 45.2% 51 29.3% 317 44.1%
Multiracial, not Hispanic 1 0.3% 7 4.5% 2 3.2% 0 0.0% 10 1.4%
Hispanic, any race 2 0.6% 8 5.2% 3 4.8% 2 1.1% 15 2.1%
Resident, race/ethnic unknown 12 3.6% 8 5.2% 4 6.5% 12 6.9% 36 5.0%
Total known residency 329 154 62 174 719
Residency Unknown 29 14 4 34 81
Total 358 168 66 208 800
Page 27
cra.org/crn 29
Table F2 summarizes faculty hiring this past year. The
success rate for hiring tenure-track faculty at U.S. CS
departments rose slightly, from 70.8 percent last year to 72.7
percent this year. The success rate was similar at public
(73.2 percent) and private (71.2 percent) departments. Again
this year, Canadian departments had lower success rates, on
average, than did U.S. CS, CE, and I departments. In aggregate,
the tenure-track hiring success rate increased from 70.6
percent to 71.9 percent.
Among those hired into all categories of academic positions
(tenure-track, teaching faculty, research faculty, and postdoc)
for 2016-17, 24.8 percent were women, higher than the 21.6
percent newly hired for 2015-16 (Table F3). Considering only
tenure-track positions, the proportion of women among those
newly hired rose from 20.3 percent last year to 24.3 percent
this year. Only among research faculty positions was there
a decrease in the percentage of positions going to women
as compared with those reported last year. This is the exact
opposite from what happened last year. The percentage of
women among new tenure-track and faculty hires and among
newly hired faculty overall are higher than the percentage of
new female Ph.D.s produced this past year.
Among new tenure-track faculty, the fraction who are White
declined slightly, from 44.8 percent to 43.8 percent, while
the fraction who are Non-resident Alien or Asian new hires
rose from 43.5 percent to 47.7 percent. Once again, Whites
dominated the newly hired teaching faculty, with Asians and
Non-resident Aliens accounting for much of the remainder.
Among research faculty, Whites comprised 45.2 percent of new
Table F5. Faculty Losses
Died 13
Retired 90
Took Academic Position Elsewhere 89
Took Nonacademic Position 42
Remained, but Changed to Part Time 13
Other 22
Unknown 1
Total 270
Table F6. Gender of Current Faculty
Full Associate Assistant Teaching Research Postdoc Total
Male 1,979 85.2% 1,040 77.6% 843 76.2% 893 72.5% 366 81.5% 534 79.7% 5,655 79.4%
Female 345 14.8% 301 22.4% 263 23.8% 339 27.5% 83 18.5% 136 20.3% 1,467 20.6%
Unknown 29 10 0 15 1 35 90
Total 2,353 1,351 1,106 1,247 450 705 7,212
Table F7. Ethnicity of Current Faculty
Full Associate Assistant Teaching Research Postdoc Total
Nonresident Alien 26 1.2% 11 0.9% 153 15.0% 40 3.6% 58 13.5% 220 36.0% 508 7.8%
American Indian / Alaska Native
3 0.1% 1 0.1% 3 0.3% 1 0.1% 1 0.2% 0 0.0% 9 0.1%
Asian 583 26.8% 375 31.8% 301 29.5% 113 10.0% 78 18.2% 135 22.1% 1,585 24.2%
Black or African-American 15 0.7% 33 2.8% 26 2.5% 57 5.1% 3 0.7% 7 1.1% 141 2.2%
Native Hawaiian / Pacific Islander
2 0.1% 1 0.1% 1 0.1% 14 1.2% 0 0.0% 1 0.2% 19 0.3%
White 1,411 64.8% 685 58.1% 487 47.7% 820 72.9% 265 61.8% 199 32.6% 3,867 59.1%
Multiracial, not Hispanic 11 0.5% 5 0.4% 4 0.4% 4 0.4% 1 0.2% 1 0.2% 26 0.4%
Hispanic, any race 46 2.1% 31 2.6% 20 2.0% 26 2.3% 11 2.6% 13 2.1% 147 2.2%
Resident, race/ethnic unknown
82 3.8% 36 3.1% 26 2.5% 50 4.4% 12 2.8% 35 5.7% 241 3.7%
Total known residency 2,179 1,178 1,021 1,125 429 611 6,543
Residency Unknown 174 173 85 122 21 94 669
Total 2,353 1,351 1,106 1,247 450 705 7,212
Page 28
cra.org/crn 30
Table F8. Current Tenured and Tenure-Track Faculty by Gender and Ethnicity, From 163 Departments
Full Professor Associate Professor Assistant Professor Ethnicity Totals
Male Fem N/R % of M*
% of F* Male Fem N/R % of
M*% of F* Male Fem N/R % of
M*% of F* Total %
Nonresident Alien 19 7 0 1 2 9 2 0 1 1 122 31 0 16 13 190 4.5
Amer Indian or Alaska Native
2 1 0 0 0 1 0 0 0 0 2 1 0 0 0 7 0.2
Asian 511 65 7 29 21 282 92 1 32 36 232 69 0 31 29 1,259 29.7
Black or African-American
12 3 0 1 1 19 14 0 2 5 15 11 0 2 5 74 1.7
Native Hawaiian/ Pac Islander
2 0 0 0 0 1 0 0 0 0 1 0 0 0 0 4 0.1
White 1,175 219 17 67 72 537 144 4 61 56 369 118 0 49 50 2,583 61.0
Multiracial, not Hispanic
11 0 0 1 0 5 0 0 1 0 2 2 0 0 1 20 0.5
Hispanic, any race 34 10 2 2 3 25 5 1 3 2 14 6 0 2 3 97 2.3
Total Res & Ethnicity Known
1,766 305 26 879 257 6 757 238 0 4,234
Resident, ethnicity unknown
66 13 3 22 10 4 18 8 0 144
Not Reported (N/R) 147 27 0 139 34 0 68 17 0 432
Gender Totals 1,979 345 29 1,040 301 10 843 263 0 4,810
% 85.2% 14.8% 77.6% 22.4% 76.2% 23.8%
* %M and %F columns are the percent of that gender who are of the specified ethnicity, of those whose ethnicity is known
Table F9. Current Non-Tenure-Track Faculty and Postdoctorates by Gender and Ethnicity, From 160 Departments
Non-Tenure-Track Teaching Non-Tenure-Track Research Postdoctorates Ethnicity Totals
Male Fem N/R % of M*
% of F* Male Fem N/R % of
M*% of F* Male Fem N/R % of
M*% of F* Total %
Nonresident Alien 27 11 2 4 4 41 16 1 12 21 186 30 4 40 28 318 15
Amer Indian or Alaska Native 1 0 0 0 0 0 1 0 0 1 0 0 0 0 0 2 0
Asian 75 38 0 10 13 66 12 0 19 16 100 30 5 22 28 326 16
Black or African-American 37 20 0 5 7 1 2 0 0 3 4 3 0 1 3 67 3
Native Hawaiian/ Pac Islander 8 6 0 1 2 0 0 0 0 0 0 1 0 0 1 15 1
White 599 221 0 78 73 225 40 0 66 53 160 39 0 35 36 1,284 62
Multiracial, not Hispanic 4 0 0 1 0 1 0 0 0 0 1 0 0 0 0 6 0
Hispanic, any race 19 7 0 3 2 7 4 0 2 5 9 4 0 2 4 50 2
Total Res & Ethnicity Known 770 303 2 341 75 1 460 107 9 2,068
Resident, ethnicity unknown 36 14 0 11 1 0 28 6 1 97
Not Reported (N/R) 87 22 13 14 7 0 46 23 25 237
Gender Totals 893 339 15 366 83 1 534 136 35 2,402
% 72.5% 27.5% 81.5% 18.5% 79.7% 20.3%
* %M and %F columns are the percent of that gender who are of the specified ethnicity, of those whose ethnicity is known
Page 29
cra.org/crn 31
hires, while Non-resident Aliens or resident Asians in aggregate
comprised 38.7 percent of new hires. The latter figure is much
lower than last year’s 53.8 percent, in part due to hires in other
ethnicity categories where there were none last year. Among
postdoc new hires, Whites comprised 29.3 percent, compared
to 19.8 percent last year, with Non-resident Aliens and resident
Asians collectively comprising 62.1 percent compared with just
more than 75 percent last year (Table F4).
The Taulbee Survey recently began collecting information on
the number of new faculty hires who had been postdocs in
the previous year. In 2015, the departments reporting to the
survey hired 233 new assistant professors. Of those, 78 (33
percent) had received their Ph.D. in the previous academic
year, and 72 (31 percent) had previously been in a postdoc. In
2016, 279 new assistant professors were hired, 87 of whom
were new Ph.D.s (31 percent) and 86 of whom were recent
postdocs (also 31 percent).
There were slightly more faculty losses reported this year
as compared with last year (Table F5). Retirements were
comparable to last year, but there was increased movement
from one academic position to another, and from an academic
position to a nonacademic position. The latter category took
the biggest jump, from 24 reported last year to 42 reported
this year. Although the movement is not yet at the level seen
during the height of the dot-com boom era, this increase
bears watching. Are increased faculty workloads due to
the large enrollment increases starting to affect faculty
employment choices?
The proportion of women at the full professor rank rose
slightly from 14.3 percent last year to 14.8 percent this year,
while the proportion at the associate professor level rose from
22.1 percent to 22.4 percent. The proportion at the assistant
professor level was 23.8 percent, which is about the same as
last year (Table F6). There were also slight increases in the
proportion of women among teaching faculty and postdocs,
while there was a slight decrease in the proportion of women
among research faculty. This is the reverse of what happened
last year. Whites, Asians, and Non-resident Aliens account for
more than 90 percent of each category of faculty members
except for teaching faculty, where they account for more than
85 percent of the total (Table F7).
Among the departments who report gender by ethnicity
breakdowns (which the vast majority of departments do),
Whites again comprised a greater percentage of female
full professors than they do male full professors, while
the reverse is true at the associate professor level. Asians
comprise a greater percentage of male full professors than
they do female full professors while the reverse is true at the
associate professor level.
For next year, U.S. CS departments forecast a 6.1 percent
growth in tenure-track faculty and an 9.1 percent growth in
teaching faculty. They also forecast a 7.7 percent growth in
postdocs. It should be noted that these departments missed
last year’s expectations for both tenure-track and postdoc
hiring. They met their expectations for teaching faculty.
Non-Tenure-Track Teaching Faculty
The 2016 Taulbee Survey contained several questions about
non-tenure-track teaching faculty to help us decide what,
if anything, the survey should collect differently about
those faculty. This is potentially a concern to many doctoral
departments; in 2016, 87 percent of departments reporting
faculty data to the Taulbee Survey indicated at least one non-
tenure-track teaching faculty member. Of those, 80 percent
have multiple titles and/or levels of teaching faculty and 20
percent have a single title and level.
There were 120 responses to an open-ended question about
titles and levels used within an academic unit. As expected,
units varied widely in the number of titles and the specific
titles they used. The titles included:
◗ Multiple levels of Lecturer, reported by 49 units (41 percent).
Examples are Lecturer and Senior Lecturer; Lecturer, Senior
Lecturer, and Principal Lecturer; Lecturer I - IV; or Lecturer
with or without Security of Employment.
◗ An Assistant-Associate or Assistant-Associate-Full pattern,
reported by 39 (33 percent). There were many variations
on the complete title (e.g., Teaching, Clinical, Instructional,
Collegiate, or Professor of Practice).
◗ A single level of Lecturer, reported by 36 (30 percent). In
some units this was the only non-tenure-track teaching
title, but in others there were, for example, both Lecturers
and Professors of the Practice.
◗ Professor of the Practice with no levels given, reported by
20 (17 percent).
◗ A single level of Instructor, reported by 12 (10 percent)
Page 30
cra.org/crn 32
◗ Multiple levels of Instructor, reported by 9, (8 percent)
◗ Other, reported by 18 (15 percent), which included Fellow,
Faculty Associate, Teaching Professor (without Assistant
/ Associate levels), Teaching Specialist, Security of
Employment, and Visiting Faculty.
The majority of responding units (61 percent) were interested
in having the Taulbee Survey provide more fine-grained
information about non-tenure-track teaching faculty. Eighteen
percent of units were not interested in the Taulbee Survey
reporting more on this subject, and 21 percent had no opinion.
The survey committee will review these responses and
determine what form any additional information should take
before data collection begins in fall 2017.
Research Expenditures (Table R1; Figures R1-R2)
Table R1 shows the distribution of departments’ total
expenditure (including indirect costs or “overhead” as stated
on project budgets) from external sources of support. Figures
R1 and R2 show the per capita expenditure, where capitation
is computed two ways. The first (Figure R1) is relative to the
number of tenure-track faculty members. The second (Figure R2)
Table R1. Total Expenditure from External Sources for Computing Research
Department Type # Depts 10th 25th 50th 75th 90th
US CS Public 83 $630,675 $1,487,632 $3,729,141 $8,584,860 $15,154,063
US CS Private 27 $1,673,644 $2,376,724 $6,242,489 $10,629,352 $18,776,986
US CE 5 $1,748,209
US Information 11 $941,347 $2,027,403 $2,820,124 $3,747,854 $4,083,321
Canadian 6 $804,225 $1,852,028 $4,622,617
-50,000!
50,000!
150,000!
250,000!
350,000!
450,000!
550,000!
Public
size
<=15!
Public
10 < si
ze <= 20
!
Public
15 < si
ze <=25
!
Public
20 < si
ze <= 35
!
Public
size
> 30!
Private
size
<= 20!
Private
15 < si
ze <=30
!
Private
size
> 20!
US CE!
US Info!
Canad
ian!
Figure R1. Research Expenditures Normalized by Tenure-Track Size!CRA Taulbee Survey 2016!
!
Whiskers show 90th and 10th %iles! Lighter box 25th %ile to median! Darker box median to 75th %ile!
US CS Public by Tenure-Track Faculty Size! US CS Private by Size! US Other! Can!
Too little data in group to show distribution; bar at median! Outlier: Value outside chart range!
Figure R1. Research Expenditures Normalized by Tenure-Track Size
CRA Taulbee Survey 2016
Page 31
cra.org/crn 33
is relative to research faculty and postdocs as well as tenure-
track faculty. Canadian levels are shown in Canadian dollars.
Overall median research expenditures for 2015-16 at U.S. CS
public departments increased 5.7 percent in comparison
with 2014-15. At U.S. CS departments in private institutions,
median expenditures fell 9.3 percent. The direction of change
in each case was the reverse of what was experienced
last year. The median research expenditure at U.S. CS
departments in private institutions is considerably higher
that of public institutions. Median expenditures fell slightly at
U.S. I departments. Fewer I departments provided research
expenditure data this year than did so last year and the
sample size is small, which makes these comparisons subject
to more volatility. Due to an insufficient number of Canadian
and CE departments reporting data, we are unable to provide
any meaningful comparative results.
The U.S. CS data show a tendency for larger departments
to have more external funding per capita than smaller
departments. The effect of size of the department on
research expenditures per capita at private institutions is
more clearly seen when capitation includes research faculty
and postdocs as well as tenure-track faculty.
-50,000!
0!
50,000!
100,000!
150,000!
200,000!
250,000!
300,000!
350,000!
400,000!
450,000!
500,000!
Public
size
<=15!
Public
10 < si
ze <= 20
!
Public
15 < si
ze <=25
!
Public
20 < si
ze <= 35
!
Public
size
> 30!
Private
size
<= 20!
Private
15 < si
ze <=30
!
Private
size
> 20!
US CE!
US Info!
Canad
ian!
Figure R2. Research Expenditures Normalized by !Tenure-Track + Research Faculty + Postdoctorates!
CRA Taulbee Survey 2016!!
Whiskers show 90th and 10th %iles Lighter box 25th %ile to median Darker box median to 75th %ile
US CS Public by Tenure-Track Faculty Size! US CS Private by Size! US Other! Can!
Tooli&ledataingrouptoshowdistribu4on;baratmedian Outlier: Value outside chart range
Figure R2. Research Expenditures Normalized by Tenure-Track + Research Faculty + Postdoctorates
CRA Taulbee Survey 2016
Page 32
cra.org/crn 34
Graduate Student Support (Tables G1-G2; Figures G1-G3)
Table G1 shows the number of graduate students supported
as full-time students as of fall 2016, further categorized as
teaching assistants (TAs), research assistants (RAs), and
full-support fellows. The table also shows the split between
those on institutional vs. external funds. The average number
of TAs on institutional funds in U.S. CS departments was
within 1 percent of its value last year. Public universities
reported a slight increase, while the average at private
universities declined by 7.6 percent after almost doubling last
year. The reported values at private universities have been
somewhat volatile in recent years. Since there are many less
of them, compared with public universities, they are more
sensitive to the specific units reporting in a given year. The
small number of CE, I, and Canadian departments also make
these comparative averages subject to volatility.
The average number of RAs on external funding stayed fairly
constant at both public and private U.S. CS departments,
while the average number of RAs supported on institutional
funds declined sharply. The average number of full-
support fellows on internal funds rose at in U.S. CS public
departments and stayed fairly steady at U.S. private
Table G1. Graduate Students Supported as Full-Time Students by Department Type
On Institutional Funds On External Funds Total
Department Type
# Dept
Teaching Assistants
Research Assistants
Full-Support Fellows
Teaching Assistants
Research Assistants
Full-Support Fellows
US CS Public 89 3,225.4 41.7% 751.9 9.7% 432.4 5.6% 34.0 0.4% 3,127.5 40.4% 165.9 2.1% 7,737.1
US CS Private 32 1,044.0 27.7% 517.2 13.7% 232.0 6.1% 0.0 0.0% 1,838.9 48.7% 143.5 3.8% 3,775.5
US CS Total 121 4,269.4 37.1% 1,269.1 11.0% 664.4 5.8% 34.0 0.3% 4,966.4 43.1% 309.4 2.7% 11,512.6
US CE 5 180.0 34.6% 23.0 4.4% 13.0 2.5% 0.0 0.0% 299.5 57.7% 4.0 0.8% 519.5
US I 12 154.1 34.9% 82.6 18.7% 19.0 4.3% 0.9 0.2% 172.6 39.1% 12.0 2.7% 441.2
Canadian 7 257.5 57.2% 45.0 10.0% 0.0 0.0% 0.0 0.0% 148.0 32.9% 0.0 0.0% 450.5
Grand Total 145 4,861.0 37.6% 1,419.7 11.0% 696.4 5.4% 34.9 0.3% 5,586.4 43.2% 325.4 2.5% 12,923.8
5,000!
10,000!
15,000!
20,000!
25,000!
30,000!
35,000!
Public
size
<=15!
Public
10 < si
ze <= 20
!
Public
15 < si
ze <=25
!
Public
20 < si
ze <= 35
!
Public
size
> 30!
Public
Large C
ity!
Public
Midsiz
e City!
Public
Town/
Rural!
Private
size
<= 20!
Private
15 < si
ze <=30
!
Private
size
> 20!
Private
Large C
ity!
Private
Smaller
Loca
le!
US CE!
US Info!
Figure G1. Teaching Assistantship Stipends!CRA Taulbee Survey 2016!
!
Whiskers show 90th and 10th percentiles ! Lighter bar shows 25th percentile to median ! Darker bar shows median to 75th percentile!
US CS Public by Tenure-Track Faculty Size! US CS Public by Locale! US CS Private by Size! US CS Priv Locale! US Other!
Figure G1. Teaching Assistantship Stipends
CRA Taulbee Survey 2016
Page 33
cra.org/crn 35
Table G2. Fall 2016 Academic-Year Graduate Stipends by Department Type and Support Type
Teaching Assistantships
Percentiles of Department Averages
Department Type # Depts 10th 25th 50th 75th 90th
US CS Public 98 $13,522 $15,300 $18,000 $19,901 $23,225
US CS Private 26 $18,900 $21,508 $23,963 $26,858 $28,900
US CE 6 $14,695 $17,665 $21,744
US Info 12 $16,856 $19,180 $20,979 $23,375 $25,087
Canadian 8 $10,924 $14,044 $17,657
Research Assistantships
Percentiles of Department Averages
Department Type # Depts 10th 25th 50th 75th 90th
US CS Public 96 $14,240 $16,285 $18,737 $22,041 $24,702
US CS Private 33 $20,731 $22,419 $24,855 $27,330 $30,468
US CE 6 $17,286 $18,634 $21,699
US Information 13 $18,641 $19,690 $21,939 $24,500 $25,000
Canadian 7 $8,600 $13,000 $18,000
Full-Support Fellows
Percentiles of Department Averages
Department Type # Depts 10th 25th 50th 75th 90th
US CS Public 64 $14,463 $18,936 $22,143 $25,200 $30,900
US CS Private 33 $21,896 $23,625 $25,685 $30,000 $32,000
US CE 5 $25,000
US Information 10 $23,000
Canadian 3 $18,000
departments. The average number of full-support fellows on
external funds declined at U.S. CS departments in both public
and private universities.
Table G2 shows the distribution of stipends for TAs, RAs, and
full-support fellows. U.S. CS data are further broken down
in this table by public and private institution. Figures G1-G3
further break down the U.S. CS data by size of department
and by geographic location of the university.
The median TA salaries at U.S. CS departments increased
1.8 percent at public universities and increased 4.4 percent
at private universities. Median salaries of RAs rose 3.4
percent at public universities but rose 2.3 percent at private
universities. For full-support fellows, median salaries rose
0.6 percent at U.S. public universities and 4.0 percent at U.S.
private universities.
Stipends tend to be higher at private U.S. CS departments,
compared with public U.S. CS departments, in each of the
three stipend categories. Stipends at U.S. I schools fall in
between those at public and private U.S. CS departments.
These relationships are unchanged from last year.
Page 34
cra.org/crn 36
0!
5,000!
10,000!
15,000!
20,000!
25,000!
30,000!
35,000!
40,000!
Public
size
<=15!
Public
10 < si
ze <= 20
!
Public
15 < si
ze <=25
!
Public
20 < si
ze <= 35
!
Public
size
> 30!
Public
Large C
ity!
Public
Midsiz
e City!
Public
Town/
Rural!
Private
size
<= 20!
Private
15 < si
ze <=30
!
Private
size
> 20!
Private
Large C
ity!
Private
Smaller
Loca
le!
US CE!
US Info!
Figure G3. Full Support Fellows Stipends!CRA Taulbee Survey 2016!
!
Whiskers show 90th and 10th percentiles ! Lighter bar shows 25th percentile to median ! Darker bar shows median to 75th percentile!
USCSPublicbyTenure-TrackFacultySize USCSPublicbyLocale USCSPrivatebySize USCSPrivLocale USOther
5,000!
10,000!
15,000!
20,000!
25,000!
30,000!
35,000!
Public
size
<=15!
Public
10 < si
ze <= 20
!
Public
15 < si
ze <=25
!
Public
20 < si
ze <= 35
!
Public
size
> 30!
Public
Large C
ity!
Public
Midsiz
e City!
Public
Town/
Rural!
Private
size
<= 20!
Private
15 < si
ze <=30
!
Private
size
> 20!
Private
Large C
ity!
Private
Smaller
Loca
le!
US CE!
US Info!
Figure G2. Research Assistantship Stipends!CRA Taulbee Survey 2016!
!
Whiskers show 90th and 10th percentiles ! Lighter bar shows 25th percentile to median ! Darker bar shows median to 75th percentile!
US CS Public by Tenure-Track Faculty Size! US CS Public by Locale! US CS Private by Size! US CS Priv Locale! US Other!
Figure G3. Full Support Fellows Stipends
CRA Taulbee Survey 2016
Figure G2. Research Assistantship Stipends
CRA Taulbee Survey 2016
Page 35
cra.org/crn 37
Faculty Salaries (Tables S1-S21; Figures S1-S9)
Each department was asked to report individual (but
anonymous) faculty salaries if possible; otherwise, the
department was requested to provide the mean salary
for each rank (full, associate, and assistant professors
and non-tenure-track teaching faculty, research faculty,
and post-doctorates) and the number of persons at each
rank. The salaries are those in effect on January 1, 2017 for
U.S. departments; nine-month salaries are reported in U.S.
dollars. For Canadian departments, twelve-month salaries
are reported in Canadian dollars. Respondents were asked
to include salary supplements such as salary monies from
endowed positions.
U.S. CS data are reported in Tables S1-S16 and in the box and
whiskers diagrams. Data for CE, I, Canadian, and new Ph.D.s
are reported in Tables S17-S20. The tables and diagrams
contain distributional data (first decile, quartiles, and ninth
decile) computed from the department averages only.
Thus, for example, a table row labeled “50” or the median
line in a diagram is the median of the averages for the
departments that reported within the stratum (the number
of such departments reporting is shown in the “depts” row).
Therefore, it is not a true median of all of the salaries.
We also report salary data for senior faculty based on time
in rank, for more meaningful comparison of individual or
departmental faculty salaries with national averages. We
report associate professor salaries for time in rank of 7 years
or less, and of more than 7 years. For full professors, we
report time in rank of 7 years or less, 8 to 15 years, and more
than 15 years.
Those departments reporting salary data were provided a
summary report in December 2016. Those departments that
provided individual salaries were additionally provided more
comprehensive distributional information based on these
individual salaries. This year, 72 percent of those reporting
salary data provided salaries at the individual level.
The remainder of this section summarizes the basic report
provided in December 2016 to all departments that provided
salary data. No additional salary data was received since the
deadline for that report.
Table S1. Nine-month Salaries, 143 Responses of 191 US CS Departments, Percentiles from Department Averages
Full Professor Associate Assistant Non-Tenure Track
In rank 16+ yrs
In rank 8-15 yrs
In rank 0-7 years
All years in rank
In rank 8+ years
In rank 0-7 years
All years in rank
Teach Research Postdoc
Depts 111 119 118 142 111 125 139 136 100 48 51
Indiv 614 540 686 1,954 431 593 1,092 919 756 292 347
10 $131,900 $125,455 $118,918 $125,328 $98,667 $102,717 $100,567 $89,702 $61,106 $62,877 $44,219
25 $148,551 $139,687 $130,921 $139,456 $105,679 $107,412 $107,363 $95,199 $69,168 $73,205 $48,363
50 $166,634 $158,214 $146,572 $158,966 $112,392 $115,915 $113,953 $101,160 $78,313 $89,991 $55,780
75 $189,069 $178,386 $161,980 $175,421 $125,121 $125,569 $123,905 $107,764 $89,880 $116,344 $62,711
90 $203,836 $206,721 $189,070 $185,995 $135,050 $138,139 $137,805 $115,559 $107,088 $151,118 $67,019
Table S2. Nine-month Salaries, 105 Responses of 138 US CS Public (All Public), Percentiles from Department Averages
Full Professor Associate Assistant Non-Tenure Track
In rank 16+ yrs
In rank 8-15 yrs
In rank 0-7 years
All years in rank
In rank 8+ years
In rank 0-7 years
All years in rank
Teach Research Postdoc
Depts 83 90 93 105 86 95 102 100 71 31 36
Indiv 437 388 520 1,408 324 445 807 674 505 175 172
10 $132,325 $119,744 $115,233 $122,407 $98,649 $100,644 $100,397 $88,962 $60,000 $47,848 $44,406
25 $145,099 $139,371 $129,530 $136,210 $104,949 $106,548 $106,488 $92,206 $67,028 $66,233 $47,986
50 $160,800 $153,565 $144,669 $154,365 $110,987 $113,723 $112,636 $99,945 $75,336 $80,000 $54,284
75 $178,396 $170,132 $159,354 $168,642 $121,564 $121,851 $120,709 $104,393 $82,908 $101,816 $56,696
90 $189,634 $184,901 $171,525 $177,246 $129,681 $129,258 $130,907 $108,520 $94,202 $111,700 $66,167
Page 36
cra.org/crn 38
Table S3. Nine-month Salaries, 38 Responses of 53 US CS Private (All Private), Percentiles from Department Averages
Full Professor Associate Assistant Non-Tenure Track
In rank 16+ yrs
In rank 8-15 yrs
In rank 0-7 years
All years in rank
In rank 8+ years
In rank 0-7 years
All years in rank
Teach Research Postdoc
Depts 28 29 25 37 25 30 37 36 29 17 15
Indiv 177 152 166 546 107 148 285 245 251 117 175
10 $140,348 $132,222 $130,646 $134,527 $105,047 $106,167 $105,734 $97,411 $77,412 $74,750 $47,884
25 $163,840 $155,025 $140,413 $155,665 $108,722 $115,195 $112,533 $101,516 $81,275 $105,653 $55,877
50 $194,698 $184,379 $160,156 $181,700 $125,459 $127,200 $122,441 $111,083 $90,680 $127,872 $61,191
75 $212,205 $221,082 $189,332 $198,985 $131,250 $138,424 $137,667 $120,920 $103,883 $153,198 $65,062
90 $236,181 $232,099 $212,918 $216,827 $139,455 $146,162 $143,908 $124,530 $114,123 $181,250 $66,865
Table S4. Nine-month Salaries, 28 Responses of US CS Public With <=15 Tenure-Track Faculty, Percentiles from Department Averages
Full Professor Associate Assistant Non-Tenure Track
In rank 16+ yrs
In rank 8-15 yrs
In rank 0-7 years
All years in rank
In rank 8+ years
In rank 0-7 years
All years in rank
Teach Research Postdoc
Depts 15 19 23 28 23 21 26 26 13 2 2
Indiv 35 38 53 132 68 52 133 80 55
10 $107,945 $115,104 $111,783 $115,066 $95,414 $95,019 $94,369 $85,105 $54,678
25 $132,107 $118,496 $114,556 $121,243 $99,659 $99,655 $100,849 $86,921 $58,862
50 $143,802 $140,489 $130,515 $135,100 $107,808 $105,434 $106,725 $91,969 $68,986
75 $156,695 $149,810 $145,564 $148,974 $116,274 $115,562 $114,409 $96,095 $75,396
90 $164,102 $167,213 $161,619 $159,988 $130,803 $121,282 $125,428 $98,585 $81,459
Salaries at private institutions tend to be higher than those
at public institutions for all faculty types (Tables S2 and S3).
This pattern is consistent with data from previous years.
When viewed relative to faculty size, salaries at each tenure-
track rank tend to be higher for larger departments at both
public (Tables S4-S8) and private (Tables S9-S11) institutions.
This pattern is consistent with last year’s pattern. Salaries
for teaching faculty also exhibit this pattern at both public
and private institutions.
When viewed relative to type of locale, public institution
salaries appear to be generally lower in smaller locales
than in mid-size or large cities for all tenure-track faculty
ranks (Tables S12-S14), Private institution salaries tend to be
slightly higher in smaller locales, except for full professors
in rank 8-15 years and associate professors in rank 8+ years
(Tables S15-S16). In previous years, public institution salaries
only were lower in smaller locales for more junior faculty,
and private institution salaries exhibited no consistent
pattern relative to type of locale. Teaching faculty salaries
exhibit no pattern relative to locale size among public
institutions, while among private institutions the salaries are
higher at smaller locales.
Page 37
cra.org/crn 39
Table S6. Nine-month Salaries, 28 Responses of US CS Public With 15 < Tenure-Track Faculty <=25, Percentiles from Department Averages
Full Professor Associate Assistant Non-Tenure Track
In rank 16+ yrs
In rank 8-15 yrs
In rank 0-7 years
All years in rank
In rank 8+ years
In rank 0-7 years
All years in rank
Teach Research Postdoc
Depts 23 25 23 28 24 25 27 26 20 6 7
Indiv 82 74 88 253 79 90 173 117 83 28 11
10 $129,476 $116,252 $120,260 $126,038 $97,314 $99,737 $95,854 $90,083 $58,502
25 $139,348 $127,613 $124,946 $134,581 $102,346 $106,000 $106,082 $91,195 $65,395 $44,796
50 $154,300 $148,518 $132,714 $144,676 $109,779 $111,791 $109,372 $99,723 $73,260 $78,812 $48,000
75 $174,035 $174,394 $151,972 $162,830 $116,480 $116,630 $113,917 $102,785 $76,811 $60,205
90 $187,781 $184,543 $166,173 $174,436 $123,602 $120,953 $119,104 $106,579 $81,420
Table S5. Nine-month Salaries, 35 Responses of US CS Public With 10 < Tenure-Track Faculty <=20, Percentiles from Department Averages
Full Professor Associate Assistant Non-Tenure Track
In rank 16+ yrs
In rank 8-15 yrs
In rank 0-7 years
All years in rank
In rank 8+ years
In rank 0-7 years
All years in rank
Teach Research Postdoc
Depts 23 28 28 35 32 31 35 34 18 3 4
Indiv 64 63 73 211 95 83 192 125 63 8
10 $127,753 $114,960 $113,654 $118,647 $96,032 $95,019 $95,278 $85,065 $53,732
25 $132,661 $122,591 $117,900 $126,413 $98,872 $99,974 $101,083 $88,400 $59,147
50 $143,802 $139,214 $132,237 $135,825 $106,676 $106,178 $107,330 $92,683 $68,839 $50,500
75 $159,757 $150,821 $146,515 $153,432 $113,739 $115,781 $113,316 $96,940 $74,718
90 $186,681 $178,092 $163,208 $167,728 $127,183 $122,965 $123,920 $99,867 $80,559
Our analysis of faculty salary changes from one year to the
next uses only those departments that reported both years;
otherwise, the departments that reported during only one
year can skew the comparison. Because some departments
that reported both years provided only aggregate salaries
for their full and associate professors during one year
and in the other year reported them by years in rank, we
only report salary changes for all full professors and for
all associate professors in the year-to-year comparison.
Table S21 shows, by type of faculty and type of department,
the change in the median of the average salaries from
departments that reported both years (the number of
departments being compared is indicated in parentheses
in each column heading). Using the cell showing full
professors at U.S. CS departments as an example, the table
indicates that the median of the 124 average salaries for
full professors was 2.4 percent higher in 2016 than was the
median of the average full professor salaries in 2015 from
these same 124 departments.
Page 38
cra.org/crn 40
When interpreting these changes, it is important to remember
the effect that promotions have on the departmental data
from one year to the next, since a promotion causes an
individual faculty member to move from one rank to another.
Thus, a department with a small number of faculty members
in a particular rank can have its average salary in that rank
change appreciably (in either direction) by a single promotion
to or from that rank. Departures via resignation or retirement
also impact these figures, particularly in the non-tenure-track
categories. Because of the small number of Canadian, CE,
and I departments reporting, the values in those columns are
considerably more volatile; this is evident in several of the
entries in Table S21.
For new Ph.D.s in tenure-track positions at U.S. CS, CE, and I
school departments (Table S20) the median of the averages
was $100,000, an increase of 1.5 percent vs. last year. This
year there are not enough new tenure-track faculty salaries
from Canadian institutions to report a salary distribution, so
year-to-year comparisons cannot be made.
Table S7. Nine-month Salaries, 35 Responses of US CS Public With 20 < Tenure-Track Faculty <=35, Percentiles from Department Averages
Full Professor Associate Assistant Non-Tenure Track
In rank 16+ yrs
In rank 8-15 yrs
In rank 0-7 years
All years in rank
In rank 8+ years
In rank 0-7 years
All years in rank
Teach Research Postdoc
Depts 30 32 32 35 28 33 34 32 25 11 11
Indiv 150 125 166 458 102 135 257 184 153 28 31
10 $136,081 $129,506 $120,991 $134,849 $101,406 $102,881 $103,702 $90,873 $61,077 $37,923 $44,592
25 $148,475 $144,715 $128,230 $142,271 $106,845 $110,083 $109,267 $95,832 $65,678 $52,854 $46,472
50 $159,609 $155,150 $142,664 $154,279 $111,734 $113,562 $112,421 $102,729 $72,723 $77,623 $50,000
75 $178,879 $170,115 $158,481 $170,252 $118,539 $118,567 $118,461 $106,751 $77,418 $91,566 $66,167
90 $188,836 $176,840 $169,517 $178,803 $124,561 $123,079 $123,257 $108,300 $90,426 $105,293 $70,000
Table S8. Nine-month Salaries, 39 Responses of US CS Public With Tenure-Track Faculty >30, Percentiles from Department Averages
Full Professor Associate Assistant Non-Tenure Track
In rank 16+ yrs
In rank 8-15 yrs
In rank 0-7 years
All years in rank
In rank 8+ years
In rank 0-7 years
All years in rank
Teach Research Postdoc
Depts 36 37 37 39 31 39 39 39 33 19 25
Indiv 281 237 315 881 143 262 426 411 318 131 149
10 $148,006 $146,850 $133,559 $148,649 $101,715 $107,004 $105,577 $95,959 $66,634 $63,103 $46,011
25 $159,044 $149,985 $138,093 $154,954 $107,955 $112,571 $111,984 $100,099 $73,631 $73,951 $49,469
50 $171,098 $163,758 $152,695 $162,516 $112,610 $117,554 $117,554 $103,685 $80,997 $86,151 $55,701
75 $181,498 $171,377 $159,354 $171,149 $125,411 $128,467 $127,000 $107,455 $89,000 $105,218 $57,542
90 $191,825 $195,304 $174,573 $183,556 $141,070 $131,717 $133,767 $112,645 $106,075 $113,308 $65,777
Page 39
cra.org/crn 41
Table S11. Nine-month Salaries, 21 Responses of US CS Private With Tenure-Track Faculty >20, Percentiles from Department Averages
Full Professor Associate Assistant Non-Tenure Track
In rank 16+ yrs
In rank 8-15 yrs
In rank 0-7 years
All years in rank
In rank 8+ years
In rank 0-7 years
All years in rank
Teach Research Postdoc
Depts 17 18 18 21 14 17 21 21 18 11 10
Indiv 130 118 145 423 81 113 213 198 205 90 137
10 $163,814 $149,525 $131,787 $141,825 $105,213 $111,010 $109,726 $97,581 $80,075 $77,125 $43,833
25 $194,252 $166,972 $144,951 $171,993 $115,881 $115,954 $113,201 $101,924 $88,317 $106,561 $55,610
50 $205,975 $183,714 $165,875 $184,355 $126,932 $129,022 $128,333 $112,049 $98,963 $127,872 $64,100
75 $231,717 $217,333 $189,238 $204,342 $135,020 $138,898 $140,160 $121,430 $106,402 $151,713 $66,415
90 $242,085 $223,302 $212,790 $216,882 $139,531 $153,875 $147,014 $124,967 $114,601 $158,991 $67,219
Table S9. Nine-month Salaries, 17 Responses of US CS Private With <=20 Tenure-Track Faculty, Percentiles from Department Averages
Full Professor Associate Assistant Non-Tenure Track
In rank 16+ yrs
In rank 8-15 yrs
In rank 0-7 years
All years in rank
In rank 8+ years
In rank 0-7 years
All years in rank n
Teach Research Postdoc
Depts 11 11 7 16 11 13 16 15 11 6 5
Indiv 45 34 17 117 27 37 75 47 46 27 38
10 $130,076 $131,956 $126,446 $105,204 $104,837 $102,796 $96,724 $71,828
25 $152,371 $134,310 $131,596 $145,786 $107,776 $114,942 $110,002 $101,372 $78,851
50 $165,000 $181,667 $144,632 $163,160 $117,725 $120,977 $118,404 $104,250 $81,577 $121,662 $60,000
75 $195,606 $221,035 $180,450 $186,741 $131,125 $129,324 $126,556 $114,298 $88,707
90 $203,230 $239,873 $202,146 $136,639 $139,517 $138,940 $124,007 $90,680
Table S10. Nine-month Salaries, 16 Responses of US CS Private With 15 < Tenure-Track Faculty <=30, Percentiles from Department Averages
Full Professor Associate Assistant Non-Tenure Track
In rank 16+ yrs
In rank 8-15 yrs
In rank 0-7 years
All years in rank
In rank 8+ years
In rank 0-7 years
All years in rank
Teach Research Postdoc
Depts 11 12 11 16 10 11 16 16 13 7 8
Indiv 53 57 54 194 26 28 62 88 61 23 76
10 $179,850 $155,466 $133,190 $146,491 $104,711 $115,954 $110,311 $99,559 $74,041
25 $184,908 $164,913 $142,523 $169,124 $106,627 $117,762 $112,445 $103,016 $79,165 $106,561 $59,188
50 $202,296 $182,358 $157,583 $179,756 $127,250 $121,500 $121,971 $107,192 $90,680 $111,731 $61,096
75 $222,609 $206,073 $184,325 $193,714 $131,188 $130,417 $128,233 $121,019 $104,366 $135,970 $64,714
90 $236,077 $229,252 $213,088 $209,757 $141,930 $137,000 $134,692 $123,347 $118,639
Page 40
cra.org/crn 42
Table S12. Nine-month Salaries, 40 Responses of US CS Public In Large City or Suburbs, Percentiles from Department Averages
Full Professor Associate Assistant Non-Tenure Track
In rank 16+ yrs
In rank 8-15 yrs
In rank 0-7 years
All years in rank
In rank 8+ years
In rank 0-7 years
All years in rank
Teach Research Postdoc
Depts 35 35 37 40 34 38 40 39 28 14 14
Indiv 190 154 211 570 133 193 345 268 207 80 92
10 $137,002 $139,397 $118,935 $139,095 $99,050 $105,424 $103,900 $90,810 $63,727 $44,935 $42,617
25 $150,868 $147,765 $132,848 $144,264 $105,655 $110,151 $109,049 $96,149 $68,586 $67,219 $45,105
50 $166,634 $158,214 $144,669 $158,946 $110,938 $115,401 $114,219 $102,129 $76,851 $93,259 $52,775
75 $176,104 $169,793 $158,403 $168,492 $123,626 $119,880 $122,079 $105,679 $86,381 $104,570 $56,363
90 $185,844 $178,023 $167,555 $177,580 $131,192 $127,018 $126,734 $109,220 $107,635 $116,229 $62,424
Table S13. Nine-month Salaries, 25 Responses of US CS Public In Midsize City or Suburbs, Percentiles from Department Averages
Full Professor Associate Assistant Non-Tenure Track
In rank 16+ yrs
In rank 8-15 yrs
In rank 0-7 years
All years in rank
In rank 8+ years
In rank 0-7 years
All years in rank
Teach Research Postdoc
Depts 21 22 20 25 19 23 25 22 17 6 6
Indiv 131 107 141 386 74 108 185 161 114 28 22
10 $130,718 $114,804 $128,662 $124,676 $98,282 $102,867 $99,356 $91,115 $54,156
25 $151,589 $134,292 $141,607 $137,203 $107,459 $110,962 $107,602 $93,723 $65,678
50 $164,895 $153,965 $150,787 $156,874 $111,647 $116,000 $113,110 $100,457 $72,019 $79,373 $55,976
75 $185,093 $167,430 $162,338 $171,912 $117,500 $128,467 $122,896 $106,251 $80,997
90 $194,109 $189,213 $184,508 $180,681 $127,704 $137,771 $135,876 $112,097 $87,923
Table S14. Nine-month Salaries, 40 Responses of US CS Public in Small City, Town, or Rural, Percentiles from Department Averages
Full Professor Associate Assistant Non-Tenure Track
In rank 16+ yrs
In rank 8-15 yrs
In rank 0-7 years
All years in rank
In rank 8+ years
In rank 0-7 years
All years in rank
Teach Research Postdoc
Depts 27 33 36 40 33 34 37 39 26 11 16
Indiv 116 127 168 452 117 144 277 245 184 67 58
10 $129,432 $118,295 $114,135 $118,241 $98,712 $98,437 $100,009 $86,255 $59,540 $63,554 $47,421
25 $140,126 $125,894 $122,358 $130,187 $102,010 $102,698 $102,409 $89,702 $66,994 $66,233 $49,102
50 $156,254 $146,876 $135,587 $142,810 $110,656 $110,633 $111,183 $95,230 $74,645 $77,391 $54,000
75 $175,632 $171,377 $158,157 $161,808 $117,736 $120,609 $118,203 $100,695 $83,344 $84,026 $58,829
90 $187,024 $186,978 $170,319 $173,208 $126,356 $124,644 $127,813 $106,974 $90,546 $88,375 $65,389
Page 41
cra.org/crn 43
Table S15. Nine-month Salaries, 26 Responses of US CS Private in Large City or Suburbs, Percentiles from Department Averages
Full Professor Associate Assistant Non-Tenure Track
In rank 16+ yrs
In rank 8-15 yrs
In rank 0-7 years
All years in rank
In rank 8+ years
In rank 0-7 years
All years in rank
Teach Research Postdoc
Depts 20 20 19 26 18 21 25 25 22 13 10
Indiv 111 108 129 387 96 116 233 187 225 103 113
10 $129,922 $132,161 $130,496 $134,129 $105,572 $106,357 $105,344 $97,376 $73,479 $72,950 $43,833
25 $160,267 $146,673 $136,336 $156,392 $109,265 $113,409 $112,842 $101,924 $79,693 $105,653 $54,063
50 $194,698 $187,517 $157,583 $175,606 $126,842 $126,200 $122,441 $110,764 $90,047 $127,872 $58,377
75 $207,425 $213,272 $189,145 $198,453 $130,950 $139,507 $138,360 $121,430 $100,660 $158,991 $61,517
90 $236,112 $224,526 $213,506 $216,836 $136,444 $152,340 $144,944 $124,617 $106,809 $190,671 $64,351
Table S16. Nine-month Salaries, 12 Responses of US CS Private in Other than Large City, Percentiles from Department Averages
Full Professor Associate Assistant Non-Tenure Track
In rank 16+ yrs
In rank 8-15 yrs
In rank 0-7 years
All years in rank
In rank 8+ years
In rank 0-7 years
All years in rank
Teach Research Postdoc
Depts 8 9 6 11 7 9 12 11 7 4 5
Indiv 66 44 37 159 11 32 52 58 26 14 62
10 $141,825 $107,808 $99,258
25 $187,258 $167,667 $159,693 $111,465 $118,615 $112,445 $101,082 $86,154
50 $196,084 $184,379 $173,304 $183,369 $123,700 $128,200 $121,158 $112,049 $102,999 $126,040 $65,757
75 $218,054 $221,082 $198,987 $142,735 $137,000 $135,802 $115,835 $116,587
90 $214,206 $139,911 $122,813
Table S17. Nine-month Salaries, 8 Responses of 34 US Computer Engineering Departments, Percentiles from Department Averages
Full Professor Associate Assistant Non-Tenure Track
In rank 16+ yrs
In rank 8-15 yrs
In rank 0-7 years
All years in rank
In rank 8+ years
In rank 0-7 years
All years in rank
Teach Research Postdoc
Depts 5 6 6 8 5 6 8 7 6 2 2
Indiv 26 11 30 78 10 32 48 25 18
10
25 $144,269 $106,939 $92,074
50 $185,000 $141,825 $131,063 $161,993 $116,265 $111,059 $116,876 $101,000 $81,421
75 $177,519 $119,843 $102,689
90
Page 42
cra.org/crn 44
Table S18. Nine-month Salaries, 15 Responses of 20 US Information Departments, Percentiles from Department Averages
Full Professor Associate Assistant Non-Tenure Track
In rank 16+ yrs
In rank 8-15 yrs
In rank 0-7 years
All years in rank
In rank 8+ years
In rank 0-7 years
All years in rank
Teach Research Postdoc
Depts 12 14 13 15 12 15 15 15 12 10 7
Indiv 33 47 75 155 55 93 148 135 145 51 38
10 $130,728 $136,037 $128,743 $137,719 $92,208 $95,549 $93,689 $83,558 $54,977 $66,535
25 $139,639 $155,332 $135,829 $147,118 $108,244 $98,574 $103,962 $89,274 $80,413 $67,436 $47,950
50 $165,568 $173,153 $143,305 $161,167 $111,863 $113,780 $115,067 $98,250 $91,306 $75,758 $59,333
75 $180,172 $191,903 $157,438 $168,134 $120,296 $125,344 $123,013 $104,765 $100,051 $93,390 $61,722
90 $191,591 $211,035 $174,234 $183,408 $135,124 $137,964 $137,341 $110,323 $118,636 $99,487
Table S19. Twelve-month Salaries, 9 Responses of 30 Canadian Departments, Percentiles from Department Averages
Full Professor Associate Assistant Non-Tenure Track
In rank 16+ yrs
In rank 8-15 yrs
In rank 0-7 years
All years in rank
In rank 8+ years
In rank 0-7 years
All years in rank
Teach Research Postdoc
Depts 9 9 9 9 9 8 9 9 7 3 5
Indiv 53 56 62 171 62 31 93 45 65 53
10
25 $166,443 $158,430 $141,655 $153,031 $136,771 $121,156 $134,026 $102,328 $104,106
50 $203,564 $179,768 $161,422 $175,912 $146,088 $136,177 $145,177 $112,798 $124,968 $54,588
75 $214,459 $190,308 $175,405 $190,211 $157,144 $152,681 $155,631 $125,414 $131,249
90
Table S20. Nine-month Salaries for New PhDs (Twelve-month for Canadian)
US (CS, CE, and Info Combined) Canadian
Tenure-Track Non-ten Teaching
Non-ten Research
Postdoc Tenure-Track Non-ten Teaching
Non-ten Research
Postdoc
Depts 72 27 9 25 2 0 0 3
Indiv 131 52 17 89 2 5
10 $88,000 $58,100 $33,733 $54,500
25 $91,000 $62,750 $33,733 $59,108
50 $100,000 $75,528 $65,040 $63,333
75 $105,600 $82,357 $88,000 $67,714
90 $110,000 $84,809 $90,300 $69,017
Page 43
cra.org/crn 45
Table S21. Change in Salary Median for Departments that Reported in Both 2015 and 2016
U.S. CS U.S. CE U.S. I Canadian
Departments 124 6 10 9
Full Profs 2.4% 7.2% 1.8% 0.2%
Assoc. Profs. 2.8% 4.2% -0.3% 1.5%
Asst. Profs. 2.6% 3.6% 2.5% -2.5%
Non-ten-track teaching faculty 4.0% -1.4% 3.8% 12.5%
Research faculty 0.3% 0.0% -14.2% -36.3%
Post doctorates 4.4% 4.6% 5.2%
90,000
110,000
130,000
150,000
170,000
190,000
210,000
230,000
250,000
Publicsize<
=15
Public10<size<
=20
Public15<size<
=25
Public20<size<
=35
Publicsize>
30
PublicLargeC
ity
PublicMidsizeC
ity
PublicTown
/Rural
Privatesize<=
20
Private15<size<=
30
Privatesize>20
PrivateLargeC
ity
PrivateSm
allerLocale
FigureS1.USCSDepartmentAverageSalary,FullProfessorinRank16+YearsCRATaulbeeSurvey2016
Whiskersshow90thand10thpercenLles Lighterbarshows25thpercenLletomedian Darkerbarshowsmedianto75thpercenLle
PublicbyTenure-TrackFacultySize PublicbyUrbanLocale PrivatebySize PrivateLocale
Figure S1. US CS Department Average Salary, Full Professor in Rank 16+ Years
CRA Taulbee Survey 2016
Page 44
cra.org/crn 46
95,000
115,000
135,000
155,000
175,000
195,000
215,000
235,000
Publicsize<
=15
Public10<size<
=20
Public15<size<
=25
Public20<size<
=35
Publicsize>
30
PublicLargeC
ity
PublicMidsizeC
ity
PublicTown
/Rural
Privatesize<=
20
Private15<size<=
30
Privatesize>20
PrivateLargeC
ity
PrivateSm
allerLocale
FigureS2.USCSDepartmentAverageSalary,FullProfessorinRank8-15YearsCRATaulbeeSurvey2016
Whiskersshow90thand10thpercenLles Lighterbarshows25thpercenLletomedian Darkerbarshowsmedianto75thpercenLle
PublicbyTenure-TrackFacultySize PublicbyUrbanLocale PrivatebySize PrivateLocale
80,000
95,000
110,000
125,000
140,000
155,000
170,000
185,000
200,000
215,000
Publicsize<
=15
Public10<size<
=20
Public15<size<
=25
Public20<size<
=35
Publicsize>
30
PublicLargeC
ity
PublicMidsizeC
ity
PublicTown
/Rural
Privatesize<=
20
Private15<size<=
30
Privatesize>20
PrivateLargeC
ity
PrivateSm
allerLocale
FigureS3.USCSDepartmentAverageSalary,FullProfessorinRank0-7YearsCRATaulbeeSurvey2016
Whiskersshow90thand10thpercenNles Lighterbarshows25thpercenNletomedian Darkerbarshowsmedianto75thpercenNle
PublicbyTenure-TrackFacultySize PublicbyUrbanLocale PrivatebySize PrivateLocale
Figure S2. US CS Department Average Salary, Full Professor in Rank 8-15 Years
CRA Taulbee Survey 2016
Figure S3. US CS Department Average Salary, Full Professor in Rank 0-7 Years
CRA Taulbee Survey 2016
Page 45
cra.org/crn 47
85,000
95,000
105,000
115,000
125,000
135,000
145,000
Publicsize<
=15
Public10<size<
=20
Public15<size<
=25
Public20<size<
=35
Publicsize>
30
PublicLargeC
ity
PublicMidsizeC
ity
PublicTown
/Rural
Privatesize<=
20
Private15<size<=
30
Privatesize>20
PrivateLargeC
ity
PrivateSm
allerLocale
FigureS4.USCSDepartmentAverageSalary,AssociateProfessorinRank8+YearsCRATaulbeeSurvey2016
Whiskersshow90thand10thpercenMles Lighterbarshows25thpercenMletomedian Darkerbarshowsmedianto75thpercenMle
PublicbyTenure-TrackFacultySize PublicbyUrbanLocale PrivatebySize PrivateLocale
80,000
90,000
100,000
110,000
120,000
130,000
140,000
150,000
160,000
Publicsize<
=15
Public10<size<
=20
Public15<size<
=25
Public20<size<
=35
Publicsize>
30
PublicLargeC
ity
PublicMidsizeC
ity
PublicTown
/Rural
Privatesize<=
20
Private15<size<=
30
Privatesize>20
PrivateLargeC
ity
PrivateSm
allerLocale
FigureS5.USCSDepartmentAverageSalary,AssociateProfessorinRank0-7YearsCRATaulbeeSurvey2016
Whiskersshow90thand10thpercenNles Lighterbarshows25thpercenNletomedian Darkerbarshowsmedianto75thpercenNle
PublicbyTenure-TrackFacultySize PublicbyUrbanLocale PrivatebySize PrivateLocale
Figure S4. US CS Department Average Salary, Associate Professor in Rank 8+ Years
CRA Taulbee Survey 2016
Figure S5. US CS Department Average Salary, Associate Professor in Rank 0-7 Years
CRA Taulbee Survey 2016
Page 46
cra.org/crn 48
80,000
85,000
90,000
95,000
100,000
105,000
110,000
115,000
120,000
125,000
Publicsize<
=15
Public10<size<
=20
Public15<size<
=25
Public20<size<
=35
Publicsize>
30
PublicLargeC
ity
PublicMidsizeC
ity
PublicTown
/Rural
Privatesize<=
20
Private15<size<=
30
Privatesize>20
PrivateLargeC
ity
PrivateSm
allerLocale
FigureS6.USCSDepartmentAverageSalary,AssistantProfessorCRATaulbeeSurvey2016
Whiskersshow90thand10thpercenLles Lighterbarshows25thpercenLletomedian Darkerbarshowsmedianto75thpercenLle
PublicbyTenure-TrackFacultySize PublicbyUrbanLocale PrivatebySize PrivateLocale
40,000
50,000
60,000
70,000
80,000
90,000
100,000
110,000
120,000
Publicsize<
=15
Public10<size<
=20
Public15<size<
=25
Public20<size<
=35
Publicsize>
30
PublicLargeC
ity
PublicMidsizeC
ity
PublicTown
/Rural
Privatesize<=
20
Private15<size<=
30
Privatesize>20
PrivateLargeC
ity
PrivateSm
allerLocale
FigureS7.USCSDepartmentAverageSalary,Non-TenureTrackTeachingFacultyCRATaulbeeSurvey2016
Whiskersshow90thand10thpercenOles Lighterbarshows25thpercenOletomedian Darkerbarshowsmedianto75thpercenOle
PublicbyTenure-TrackFacultySize PublicbyUrbanLocale PrivatebySize PrivateLocale
Figure S6. US CS Department Average Salary, Assistant Professor
CRA Taulbee Survey 2016
Figure S7. US CS Department Average Salary, Non-Tenure Track Teaching Faculty
CRA Taulbee Survey 2016
Page 47
cra.org/crn 49
20,000
45,000
70,000
95,000
120,000
145,000
170,000
195,000
Publicsize<
=15
Public10<size<
=20
Public15<size<
=25
Public20<size<
=35
Publicsize>
30
PublicLargeC
ity
PublicMidsizeC
ity
PublicTown
/Rural
Privatesize<=
20
Private15<size<=
30
Privatesize>20
PrivateLargeC
ity
PrivateSm
allerLocale
FigureS8.USCSDepartmentAverageSalary,Non-TenureTrackResearchFacultyCRATaulbeeSurvey2016
Whiskersshow90thand10thpercenMles Lighterbarshows25thpercenMletomedian Darkerbarshowsmedianto75thpercenMle
PublicbyTenure-TrackFacultySize PublicbyUrbanLocale PrivatebySize PrivateLocale
35,000
45,000
55,000
65,000
75,000
Publicsize<
=15
Public10<size<
=20
Public15<size<
=25
Public20<size<
=35
Publicsize>
30
PublicLargeC
ity
PublicMidsizeC
ity
PublicTown
/Rural
Privatesize<=
20
Private15<size<=
30
Privatesize>20
PrivateLargeC
ity
PrivateSm
allerLocale
FigureS9.USCSDepartmentAverageSalary,PostdoctoratesCRATaulbeeSurvey2016
Whiskersshow90thand10thpercenNles Lighterbarshows25thpercenNletomedian Darkerbarshowsmedianto75thpercenNle
PublicbyTenure-TrackFacultySize PublicbyUrbanLocale PrivatebySize PrivateLocale
Figure S8. US CS Department Average Salary, Non-Tenure Track Research Faculty
CRA Taulbee Survey 2016
Figure S9. US CS Department Average Salary, Postdoctorates
CRA Taulbee Survey 2016
Page 48
cra.org/crn 50
Concluding Observations
The undergraduate enrollment surge continues in U.S.
doctoral-granting computer science programs. At the same
time, master’s and doctoral production rose and the number
of new students in the departments’ graduate programs
rose. Increases in tenure-track and teaching faculty are not
keeping pace with the increases in students, and there was a
sharp increase this year in the number of faculty moving from
academic to non-academic positions. Departments and their
administrations need to find sustainable solutions to both the
student surge and the workload pressures being placed on
their faculty.
Participating CS, CE, I and Canadian Departments
U.S. CS Public (111): Arizona State, Auburn, Binghamton,
Clemson, College of William & Mary, Colorado School of Mines,
Colorado State, Florida International, George Mason, Georgia
Tech, Georgia State, Indiana, Iowa State, Kansas State, Kent
State, Michigan State, Michigan Technological University,
Mississippi State, Montana State, Naval Postgraduate School,
New Jersey Institute of Technology, New Mexico State,
North Carolina State, North Dakota State, Ohio State, Ohio,
Oklahoma State, Old Dominion, Oregon State, Pennsylvania
State, Portland State, Purdue, Rutgers, Southern Illinois
(Carbondale), Stony Brook (SUNY), Texas A&M, Texas Tech,
Universities at Albany and Buffalo, Universities of: Alabama
(Birmingham and Tuscaloosa), Arizona, Arkansas, Arkansas
at Little Rock, California (Berkeley, Davis, Irvine, Los Angeles,
Riverside, San Diego, Santa Barbara, and Santa Cruz), Central
Florida, Colorado (Boulder), Connecticut, Delaware, Florida,
Georgia, Hawaii, Houston, Illinois (Chicago and Urbana-
Champaign), Iowa, Kansas, Kentucky, Louisiana at Lafayette,
Maryland (College Park and Baltimore County), Massachusetts
(Amherst, Boston, and Lowell), Memphis, Michigan, Minnesota,
Mississippi, Missouri (Columbia), Nebraska (Omaha and
Lincoln), Nevada (Las Vegas and Reno), New Hampshire, New
Mexico, North Carolina (Chapel Hill and Charlotte), North Texas,
Oklahoma, Oregon, Pittsburgh, Rhode Island, South Carolina,
South Florida, Southern Mississippi, Tennessee (Knoxville),
Texas (Arlington, Austin, Dallas, and El Paso), Utah, Vermont,
Virginia, Washington, Wisconsin (Madison and Milwaukee),
Wyoming, Virginia Commonwealth, Virginia Tech, Washington
State, Wayne State, Western Michigan, and Wright State.
U.S. CS Private (39): Boston University, Brandeis, Brown,
Carnegie Mellon, Case Western Reserve, Clarkson, Columbia,
Cornell, DePaul, Drexel, Duke, Emory, Florida Institute of
Technology, George Washington, Georgetown, Harvard,
Illinois Institute of Technology, Johns Hopkins, Lehigh,
MIT, New York University, Northeastern, Northwestern,
Polytechnic, Princeton, Rensselaer, Rice, Rochester Institute
of Technology, Stanford, Stevens Institute of Technology,
Toyota Technological Institute at Chicago, Tufts, Universities
of: Chicago, Notre Dame, Pennsylvania, Rochester, Southern
California, and Tulsa, Washington in St. Louis, Worcester
Polytechnic Institute, and Yale.
U.S. CE (8): Iowa State, North Carolina State, Northeastern,
Universities of: California (Santa Cruz), Central Florida, Illinois
(Urbana-Champaign), New Mexico, and Southern California.
U.S. Information (14): Cornell, Drexel, Indiana, Penn State,
Syracuse, Universities of: California (Berkeley), Illinois (Urbana-
Champaign), Maryland (College Park CLIS and Baltimore
County), Michigan, North Carolina (Chapel Hill), Pittsburgh,
Texas (Austin), and Washington.
Canadian (11): Concordia, Simon Fraser, Universities of:
British Columbia, Calgary, Manitoba, New Brunswick, Toronto,
Victoria, Waterloo, Western Ontario, and York.
Page 49
cra.org/crn 51
1 The title of the survey honors Orrin E. Taulbee of the University of Pittsburgh, who conducted these surveys for the Computer
Science Board until 1984, with retrospective annual data going back to 1970.
2 Information (I) programs included here are Information Science, Information Systems, Information Technology, Informatics, and
related disciplines with a strong computing component. Surveys were sent to CRA members, the CRA Deans group members,
and participants in the iSchools Caucus (www.ischools.org) who met the criteria of granting Ph.D.s and being located in North
America. Other I programs who meet these criteria and would like to participate in the survey in future years are invited to
contact [email protected] for inclusion.
3 Classification of the population of an institution’s locale is in accordance with the Carnegie Classification database. Large
cities are those with population >= 250,000. Mid-size cities have population between 100,000 and 250,000. Town/rural
populations are less than 100,000.
4 All faculty tables: The survey makes no distinction between faculty specializing in CS vs. CE programs. Every effort is made to
minimize the inclusion of faculty in electrical engineering who are not computer engineers.