ABSTRACT is paper analyses empirically how increasingly close trade relations between China and Russia might affect the European Union (EU). We show that EU countries are complementary to Russia on the Chinese market. However, Chinese exports are increasingly relevant substitutes for EU exports on the Russian market. is means that an increase in China-Russia economic cooperation should have a negative impact on European exports. We simulate a scenario in which trade tariffs between Russia and China are eliminated, which is found to reduce EU exports to Russia. Finally, a more granular approach to the question analyses which sectors in Europe will be more affected by the increasing economic links between China and Russia, and finds that electronic machinery, equipment and machinery, and nuclear reactors will be particularly affected. Such findings obviously show quickly China is moving up the ladder in terms of export structure and how strategically important it is for Europe to continue upgrading its industry to compete at the highest level of that ladder. The China-Russia trade relationship and its impact on Europe Alicia Garcia Herrero ([email protected]) is a Senior Fellow at Bruegel. Jianwei Xu ([email protected]) is a Visiting Fellow at Bruegel. WORKING PAPER | ISSUE 4 | 2016 ALICIA GARCIA HERRERO AND JIANWEI XU
Transcript
ABSTRACTThis paper analyses empirically how increasingly close trade relations
between China and Russia might affect the European Union (EU).
We show that EU countries are complementary to Russia on the
Chinese market. However, Chinese exports are increasingly relevant
substitutes for EU exports on the Russian market. This means that
an increase in China-Russia economic cooperation should have a
negative impact on European exports. We simulate a scenario in
which trade tariffs between Russia and China are eliminated, which
is found to reduce EU exports to Russia. Finally, a more granular
approach to the question analyses which sectors in Europe will be
more affected by the increasing economic links between China
and Russia, and finds that electronic machinery, equipment and
machinery, and nuclear reactors will be particularly affected. Such
findings obviously show quickly China is moving up the ladder in
terms of export structure and how strategically important it is for
Europe to continue upgrading its industry to compete at the highest
level of that ladder.
The China-Russia trade relationship and its impact on Europe
Alicia Garcia Herrero ([email protected]) is a Senior Fellow at Bruegel.
The China-Russia trade relationship and its impact on Europe
Alicia Garcia Herrero and Jianwei Xu
1. Introduction
China and Russia are key strategic partners for Europe. China and Russia have moved from a very difficult bilateral relationship to a much closer relationship recently. This is, at least partially, a consequence of China’s increasing role globally and its thirst for commodities, particularly energy. Meanwhile, Russia’s worsened relationship with the west after the annexation of Crimea, and the ensuing sanctions, have further pushed Russia’s leadership into China’s arms. As if this were not enough, Russia’s recent economic woes resulting from much lower oil prices, makes China’s financing strength even more appealing to Russia’s leadership.
The improved Russia-China economic relationship seems to have largely gone unnoticed in an increasingly inward-looking European Union, which is saddled with its own problems. The China-Russia relationship is, however, a very relevant issue for the EU, considering that both Russia and China are key EU strategic partners for different reasons. First, the EU is the largest trading partner for Russia, which has an economy that remains quite large and is increasingly dependent on imports. China is already the world’s largest economy in purchasing power parity. While less dependent on imports than Russia and increasingly less accessible, according to surveys by the EU-China Chamber of Commerce (European Chamber, 2016), the Chinese market is too large not to be extremely strategic for the EU.
Since Russia’s integration into the global economy after the collapse of the Soviet Union, the EU has endeavoured to promote economic cooperation with Russia, first through the signature of the Partnership and Cooperation Agreement in 1994 (in force in 1997) and by creating the Four Common Spaces1 (created in May 2003 at the St. Petersburg Summit) to maintain a leading role in trade with Russia. However, the two-decade effort to improve economic relations was challenged by the Russia-Ukraine gas dispute and Russia’s annexation of Crimea in 2014. The EU’s sanctions against Russia are estimated to have cost $100 billion in lost exports to Russia, most of which was coming from the EU (ie commodity exports from the EU to Russia dropped by 28.4 percent during 2014-152 according to an EU Commission report on trade in goods).
In the meantime, China has continued to increase its global market share, surpassing Japan and more recently the EU, and becoming the world’s largest exporter. China’s economic relationship with Russia has deepened since China’s accession to the World Trade Organisation, especially after 2014, which coincides with the period in which the west has imposed sanctions on Russia after the annexation of Crimea. As shown by Figure 1, the share of Russia’s imports that came from China increased from less than 5 percent in 2000 to nearly 20 percent in 2014.
1 The four common spaces includes (1) a common economic space, (2) a common space of freedom, security and justice, (3) a space of co-operation in the field of external security, and (4) a space of research, education, and cultural exchange. 2 http://trade.ec.europa.eu/doclib/docs/2006/september/tradoc_113440.pdf.
At the same time, Russia constitutes a relatively small share of China’s total exports or imports (less than 0.4 percent in 2015), which is a consequence of the two economies’ very different sizes nowadays. Moreover, the sectoral structure of Russia’s exports is very concentrated on oil and gas. This is even more the case for Russia’s exports to China. In contrast, the EU is now one of China’s main sources of imports, with a trade value exceeding €1 billion per day. Unlike Russia, the EU’s exports to China are diversified.
The question of whether the EU’s, China’s and Russia’s exports are substitutable or complementary is at the core of assessing the competitive stances of these three economies and, more importantly for the objective of this paper, how much EU trade relations with China and Russia might be affected by the increasingly close bilateral relationship between the two. We thus estimate trade elasticities for the different pairs of countries involved both at the aggregate and the sectoral level in order to reach conclusions on the EU’s competitive stance.
2. Estimating the EU’s competitive stance vis-à-vis China and Russia Reflecting on the economic development of China and Russia since the 1990s, there are clear differences in their exposure to globalisation. China has undoubtedly been a fast-growing exporting machine over the past decade, whereas Russia’s exporting capacity has only gradually increased but remains low. Figure 3 shows that China’s share in global exports has increased from 6.68 percent to 16.63 percent, gradually becoming a leading exporter of goods, outpacing Japan in 2002, and the US in 2010. Russia’s global export share also doubled from 1.92 percent to 3.09 percent from 1998-2014, but it is still substantially lower than nearly all the other major economies. Furthermore, it started to come down in 2014 as oil prices plummeted in the fourth quarter of 2014 and presumably even more so in 2015 although data is not yet available. In the meantime, the export share for the EU28 (excluding exports to member countries) has come down only marginally from 18.55 percent in 1990 to 15.04 percent in 2014.
4
Figure 3: The world export share for major economies
Source: Bruegel based on the BACI-CEPII Database.
The difference in trade competitiveness also manifests in China and Russia’s market exposure to importing global goods. Though at first sight there is no significant difference in the import shares of GDP in China and Russia, which are 18.9 percent and 22.9 percent respectively, the figure is largely driven by the fact that the share of the service sector is larger in Russia (60 percent) than China (48 percent) and the service sector is intrinsically less tradable. Once we focus on the tradable sector only, China appears to be much less dependent on imports than Russia (Figure 4). In fact, only 10 percent of China’s domestic demand for goods is served by imports. Though there is higher penetration of imports for a few industries in China, such as electrical and optical equipment, for which imports make up 38 percent of the market, these imports are typically targeted at different groups of consumers (ie those that demand higher quality) and can only be viewed as incomplete substitutes for local Chinese domestic brands. By comparison, Russia’s share of imports of goods increased from 12.04 percent in 1998 to 17.22 percent. The import penetration has skyrocketed for some products, such as equipment, for which 62 percent of the total market is imported.
In sum, over the past decade, the rise of Chinese exporters and the openness of Russia’s domestic consumer market to imports are two important transformations that the EU faces for two of its strategic trading partners.
Figure 4: Chinese and Russian exposure to globalisation in the tradable sector
Source: Bruegel based on the BACI-CEPII Database and WIOD database.
3. The EU’s competitive position on the Chinese and Russian markets To assess the effect on the EU of a closer economic relationship between China and Russia, we need to evaluate how the EU’s competitive stance in each of the two markets might be affected by the other. In other words, we focus on two questions: first, how Russia might affect the EU competitive stance in China and, second, how China might affect the EU competitive stance in Russia. On the Chinese market, the EU has maintained a greater competitive advantage than Russia since 1991. Figure 2 shows that, over the past seventeen years, Chinese imports from the EU have hovered at about 20 percent of China’s total imports, while those from Russia make up less than 5 percent of total imports.
On the Russian market, by contrast, the EU’s relative comparative advantage is being chipped away as it continues to lose market share, and the question really is how much this might be related to China’s increasing export capacity. As shown in Figure 1, China has moved from supplying only 3.9 percent of Russia’s imports in 1998 to more than 21 percent in 2014. In the meantime the EU’s share has gradually decreased from nearly 70 percent to 55 percent.
To obtain a quantitative evaluation of the substitutability of the EU’s, China’s and Russia’s exports to one another, we estimate the Allen-Hicks (also called p-substitutes for short) elasticity of substitution for the three economies. The method is particularly useful when applied to a multiple country economic environment. Since a market can import from at least three countries, contrary to the two-factor market models, the variation of relative prices between any two factors will not only alter the relative demand for the two factors but can also set off a domino effect of substitutions among all the other factors, provoking indirect repercussions on the demand for the two original factors. In other words, following the Allen-Hicks model for the estimation of elasticities of substitution allows as to come up with direct effects while controlling for these indirect effects. (See Appendix 2 for more technical details of the method).
The estimation results are reported in table 1. On the first question, how Russia affects the EU’s competitive stance on the Chinese market, the first column shows that the EU and Russia are complementary on the Chinese market as shown by the negative and significant elasticity. This supports the view expressed in our previous descriptive section that Russia, which supplies mainly energy and natural resources to China, overlaps to a very limited degree with EU exports to China. In addition, the EU would seem to exhibit some degree of substitution with the rest of the world but the elasticity is less than 1 and not significant. As for our second query, whether China affects Europe’s competitive stance in the Russian market, the result in the second column confirms that the EU and China are substitutes, ie they compete on the Russian market, as shown by a positive and significant elasticity. Furthermore, the estimated coefficient is greater than 1, meaning that a reduction in the relative export price between China and the EU would lead to a larger increase in relative demand for Chinese imports compared to EU imports, thus benefiting China in terms of export value. The estimated elasticity of the EU relative to the rest of the world for the Russian market is not significant. The immediate conclusion of our estimation is that China and the EU are undoubtedly two major competitors on the Russia market.
6
Table 1: Main results for elasticity of substitution Country pair Chinese market Russian market
** indicates that the estimates are significant at the 95 percent confidence level.
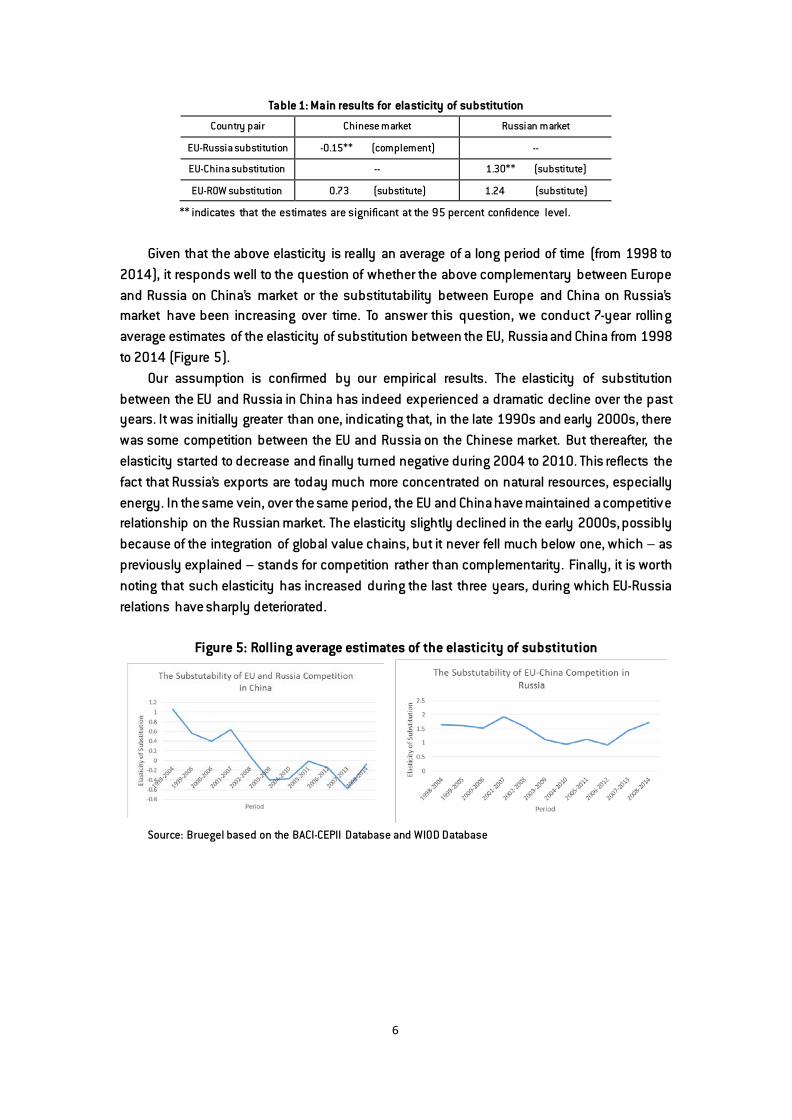
Given that the above elasticity is really an average of a long period of time (from 1998 to 2014), it responds well to the question of whether the above complementary between Europe and Russia on China’s market or the substitutability between Europe and China on Russia’s market have been increasing over time. To answer this question, we conduct 7-year rolling average estimates of the elasticity of substitution between the EU, Russia and China from 1998 to 2014 (Figure 5).
Our assumption is confirmed by our empirical results. The elasticity of substitution between the EU and Russia in China has indeed experienced a dramatic decline over the past years. It was initially greater than one, indicating that, in the late 1990s and early 2000s, there was some competition between the EU and Russia on the Chinese market. But thereafter, the elasticity started to decrease and finally turned negative during 2004 to 2010. This reflects the fact that Russia’s exports are today much more concentrated on natural resources, especially energy. In the same vein, over the same period, the EU and China have maintained a competitive relationship on the Russian market. The elasticity slightly declined in the early 2000s, possibly because of the integration of global value chains, but it never fell much below one, which – as previously explained – stands for competition rather than complementarity. Finally, it is worth noting that such elasticity has increased during the last three years, during which EU-Russia relations have sharply deteriorated.
Figure 5: Rolling average estimates of the elasticity of substitution
Source: Bruegel based on the BACI-CEPII Database and WIOD Database
7
4. Sectoral competition While there is strong substitution between the EU and China on Russia’s market, and some complementarity between the EU and Russia on the Chinese market, the degree of competition can vary across sectors. Producers from different sectors might also share vertical connections through the use of intermediated inputs. A widely cited paper by Broda and Weinstein (2006) has shown that 2-digit level trade elasticity has exhibited tremendous differences. To check the heterogeneity of trade elasticities among the three countries in our analysis, we also break down our analysis at the product level. To compare the cross-sector difference for the three countries, we first report the top 10 exporting goods in the market. Figure 6 illustrate China’s product-level imports from the EU and Russia. It is apparent that exports from EU countries into China are well diversified in the different sectors, while Russia’s exports to China are mainly made up of the specific category of ‘Mineral fuels, mineral oils and products of their distillation’3 . The concentration of Russia’s exports can also be attributed to the rising oil price since 2000, by which Russia has gained more comparative advantage from its endowment (Figure 8).
By comparison, Russia’s imports from both China and the EU are significantly diversified and share great similarities (see Figure 7). The competition between the EU and China on the Russian market is most evident in their supply of ‘84 Nuclear reactors, boilers, machinery and mechanical appliances’, which ranks as the top export category from the EU and the second from China. ‘85 Electric machinery and equipment’ also ranks third among the EU’s exports and first among China’s exports.
3 We provide data for the current EU28 countries for the whole sample period, although some countries only became EU members during the sample period. For example, Hungary joined the EU in 2004. In order to guarantee that cross-time comparison is not affected by country coverage, we also include Hungary in the ‘EU’ sample before 2004.
8
Figure 6: Top ten imports from EU and Russia in China
Source: Bruegel based on the BACI-CEPII Database.
Figure 7: Top ten imports from EU and China in Russia
Source: Bruegel based on the BACI-CEPII Database.
Figure 8: Brent Crude oil price in US dollars per barrel (2000-2015)
Source: Bruegel based on EIA. Note: The chart has been compiled using the daily price from 4 January 2000 to 12
January 2015.
To get a grasp of the within-sector competition, we then estimate the elasticity of
substitution at the sector level. The results are reported in Figure 9. It is not surprising that competition between countries is more pronounced within each sector. The within-sector substitution for the three areas is positive for most sectors. Still, there are a few sectors that exhibit complementarity, half of which are statistically insignificant. The pattern is particularly clear for some Russian and European sectors when competing in China. More specifically, the
9
EU and Russia are actually competing in most sectors (14 out of 15) but there is one in which they are highly complementary, which is driving the result at the aggregate level. In other words, the complementarity of Russia and the EU on the Chinese market is driven by cross-sector complementarity. For the EU and China on the Russian market, there are also two significantly complementary sectors, namely: ‘mineral products’ and ‘raw hides, skins, leather, & furs’, but neither is quantitatively important, accounting for only 1.03 percent and 1.65 percent of Russia’s total imports from the EU and China.
Figure 9: The elasticity of substitution at the sector level
Source: Bruegel based on the BACI-CEPII Database and WIOD database. Note: * indicates that the estimates are
significant at the 90 percent confidence level. ** indicates that the estimates are significant at the 95 percent
confidence level. *** indicates that the estimates are significant at the 99 percent confidence level.
5. What if China and Russia engage in a trade agreement? Simulating the impact for Europe We use the previously estimated elasticities to investigate what could be the impact on EU exports of further China-Russia trade cooperation. To operationalise the scenario, we consider a hypothetical case of tariff union between the two countries. According to the World Bank WDI dataset, the simple average tariffs in China and Russia are 7.6 percent and 6.8 percent respectively. If the tariff union reduces the tariffs to zero, and these effects are completely passed through to prices, the bilateral price between the two countries can be reduced by 7 percent. Taking the estimated elasticity from Table 1 and the market share data of 2011, it is straightforward to derive a 0.35 percent decrease in the EU’s export share on the Russian market, while the EU’s share of the Chinese market would increase by 0.05 percent. The latter result is direct consequence of the EU’s complementarity with Russia. Overall, the net effect would be a reduction of 1.5 percent in EU exports to Russia and China. This is obviously just a rough estimate. First, it is conducted ceteris paribus, as if the rest of the world did not change behaviour. Second, if EU-Russia relations continue to deteriorate, the elasticity between China and the EU may move upwards, strengthening the negative impact of the China-Russia relationship on the EU economies. Third, both Russia and China could see their market size reduced because they are undergoing a structural slowdown, which would mitigate the impact on the EU’s exports of their potential trade agreement.
10
6. Conclusion
This paper analyses how increasingly close trade relations between China and Russia might affect the EU. By estimating the elasticity of substitution, we show that EU countries are complementary to Russia on the Chinese market. However, Chinese exports are increasingly relevant substitutes for EU exports on the Russian market. We simulate closer trade cooperation between Russia and China by reducing their bilateral import tariffs to zero and find that such a trade agreement would indeed reduce EU exports into Russia in a significant way.
Finally, a more granular approach to the question analyses which sectors in Europe will be more affected by the increasing economic links between China and Russia. We found that electronic machinery, equipment and machinery, as well as nuclear reactors, will be particularly affected. Such findings obviously show quickly China is moving up the ladder in terms of export structure and how strategically important is for Europe to keep upgrading its industry to compete at the highest level of that ladder.
References Broda, C. and D. Weinstein (2006) ‘Globalization and the Gains from Variety’, Quarterly Journal of Economics 121: 541-585 Diewert, W.E. (1976) ‘Exact and Superlative Index Numbers’, Journal of Econometrics 4: 115- 145 European Chamber, Business Confidence Survey 2016, available at http://www.europeanchamber.com.cn/en/publications-business-confidence-survey#download-table-274. Feenstra, R. (2003) ‘A Homothetic Utility Function for Monopolistic Competition Models, without Constant Price Elasticity’, Economics Letters 78: 79-86 McGuirk, A.K. (1986) ‘Measuring Price Competitiveness for Industrial Country Trade in Manufactures’, Working Paper 87/34, International Monetary Fund Zanello, A. and D. Desruelle (1997) ‘A Primer on the IMF’s Information Notice System’, IMF Working Paper 97/71, International Monetary Fund
Appendix 1: Data sources and variable construction
This paper uses two major data sources. One is the CEPII BACI trade data covering almost 150 countries from 1998 to 2014, a detailed description of which can be found at: http://www.cepii.fr/cepii/en/bdd_modele/presentation.asp?id=1. However, to estimate the elasticity of substitution we also needed domestic consumption data. For this purpose we use the WIOD input-output table, which covers 40 major economies, as a supplement.
For empirical estimation for elasticity of substitution we merged the two data sets, so the final data covers the following 40 major economies from 1998 to 2011: Australia, Austria, Belgium, Brazil, Bulgaria, Canada, China, Cyprus, Czech Republic, Denmark, Estonia, Finland, France, Germany, Greece, Hungary, India, Indonesia, Ireland, Ireland, Italy, Japan, Korea, Latvia, Lithuania, Luxembourg, Malta, Mexico, Netherlands, Poland, Portugal, Romania, Russia, Slovak Republic, Slovenia, Spain, Sweden, Taiwan, Turkey, United Kingdom, United States. Note that for conducting rolling average estimates after 2011, we assume that the domestic market share remain the same as in 2011.
Because the classification in the BACI trade data is different from that of the WIOD data, we follow the method by Zanello and Desruelle (1997) to conduct concordance and calculate internal market share. The procedure is as follows: by using WIOD input-output table, the share of internal trade was calculated as the difference between the gross output (GO) and export (X) of product, and the ratio of internal trade in the destination market was then obtained by dividing internal trade to total purchase (internal trade(INT) plus import(M)) of each product. To guarantee that our analysis can be extended to each HS2 product, we make the implicit assumption as in McGuirk (1986) that the internal share obtained from WIOD sector can be applied to each product in the detailed HS-2 digit classifications.
Appendix 2: Translog methodology for the estimation of elasticity of substitution Since a market can import from at least three countries, contrary to the two-factor market
case, the variation of relative price between any two factors will not only alter the relative demand for the two factors but can also set off a domino effect of substitutions among all the other factors, provoking indirectly repercussive impacts on the demand for the two original factors. In other words, the effect of relative price on the relative demand depends on the adjustment of all factors. Moreover, the symmetry condition of cross-price effects may fail: it is possible that the effect of a variation in the price of factor j on conditional demand for factor i does not necessarily equal that of a variation in the price i on the demand for factor j.
To address these issues it is standard in the literature to make an alternative definition of the elasticity of substitution in the Allen-Hicks sense, that is, to weight the traditional cross-elasticity by the inverse of the share of the concerning factor in trade cost. The elasticity of substitution thus defined is symmetrical and can be estimated with simple reduced-form regressions. Following Diewert (1976) and Feenstra (2003), we choose a translog utility function for our estimation. Technical details of the estimation method can be found in Appendix 2.
Following Diewert (1979) and Feenstra (2003), we assume a translog expenditure function,
0ln( ) ln( ) ln( ) ln( ) ln( )i i i j ji j ji kij j k
E U p p pα α λ= + + +∑ ∑∑
Where Ui is the utility level of country i, and pji, pki corresponds to the price from country j and k when delivered in country i. By some reasonable assumptions as in Feenstra (2003), we can obtain a tractable function for estimation,
ln( )mj m km kjk
s pα λ= +∑
Accordingly, we specify the empirical equations as follows for Russia and China market respectively,
, 0 1 , 2 , 3 ,ln( ) ln( ) ln( )EU Russia it a a EU Russia it a China Russia it a ROW Russia it i t itMarketShare p p pβ β β β µ λ ε− − − −= + + + + + +
, 0 1 , 2 , 3 ,ln( ) ln( ) ln( )EU China it b b EU China it b Russia China it b ROW China it i t itMarketShare p p pβ β β β µ λ ε− − − −= + + + + + +
Where MarketSharemj is the share of exporting from country m in market j, and pk-j are import prices from country k in market j. μi, λt represents product and year dummies, which is in particular captures sector-specific business cycle conditions and time-specific common trends. We are especially interested in changes in China-Russia trade and estimate its impact on EU exports as
1aβ and 1bβ .
It can be shown that the Hicks-Allen elasticity between two factors is proportional to the estimated coefficient