Wood Energy Technical Assistance Team Northeastern Area WERC Wood Energy Technical Assistance Team Wood Education and Resource Center 310 Hardwood Lane Princeton, WV 24720 (304) 487‐1510 Memorandum DATE: November 28, 2016 TO: Maine State Wood Energy Team FROM: Lew McCreery, WERC; Steve Knobeloch, WES CC: RE: Maine Woody Biomass Thermal Potential 1.0 EXECUTIVE SUMMARY Recently a number of major forest products industry facilities in Maine have closed. These closures present a host of environmental and economic issues for Maine. A key issue is the impact to markets for woody biomass residuals from the forest products industry and from forest management activities. Given the impact to this market the US Forest Service Wood Education and Resource Center (WERC) Woody Biomass Utilization Technical Assistance Team evaluated the potential to use these residuals to meet thermal energy needs in the State. WERC’s approach to develop a basic assessment of the potential is twofold. The first step was to make a general estimate of conversion potential based on available permit data for minor source facilities that have boilers. This is a sample of the facilities in the State that could be converted, but allows for an assessment of the basic economics for conversions with current energy pricing. It is important to note that the specific facilities considered in this memorandum only represent a small portion of the thermal energy use in the State. As a result, the second step of the approach compared the facility specific data to EIA data on thermal energy use in the State to identify an upper bound on the potential for conversion. WERC found that, in aggregate, conversion at the 240 existing and identified facilities with fossil fuel boilers would require an investment of approximately $220,000,000, and this would save approximately $21,000,000 on energy annually even given the relatively low cost of fossil fuels today. These facilities would require the equivalent of 359,000 green tons of wood chips annually. Some of these facilities would be large enough to use bark and whole tree chips, and some facilities would be of a size where wood pellets would be the most effective woody biomass product. These specific facilities represent about 3,000,000 mmBtu of fossil fuel input annually, and this fossil fuel use is a mix of natural gas, fuel oil and propane. In evaluating EIA data on the total fossil fuel use, WERC found that over 69,000,000 mmBtu of fossil fuel is used for thermal energy annually in the State of Maine. Thus, as would be expected, the 240 facilities represent a small percentage (~4%) of the potential for conversions. Through systems at individual facilities, as well as district energy systems that can connect a wide range of thermal demands, there are many opportunities all over the State of Maine to provide local uses of a wide variety of forest industry residuals and refined woody biomass products. In addition to the
Transcript
Wood Energy Technical Assistance Team
Northeastern Area WERC Wood Energy Technical Assistance Team
Wood Education and Resource Center 310 Hardwood Lane Princeton, WV 24720 (304) 487‐1510
Memorandum
DATE: November 28, 2016 TO: Maine State Wood Energy Team FROM: Lew McCreery, WERC; Steve Knobeloch, WES CC: RE: Maine Woody Biomass Thermal Potential
1.0 EXECUTIVE SUMMARY
Recently a number of major forest products industry facilities in Maine have closed. These closures present a host of environmental and economic issues for Maine. A key issue is the impact to markets for woody biomass residuals from the forest products industry and from forest management activities. Given the impact to this market the US Forest Service Wood Education and Resource Center (WERC) Woody Biomass Utilization Technical Assistance Team evaluated the potential to use these residuals to meet thermal energy needs in the State.
WERC’s approach to develop a basic assessment of the potential is twofold. The first step was to make a general estimate of conversion potential based on available permit data for minor source facilities that have boilers. This is a sample of the facilities in the State that could be converted, but allows for an assessment of the basic economics for conversions with current energy pricing. It is important to note that the specific facilities considered in this memorandum only represent a small portion of the thermal energy use in the State. As a result, the second step of the approach compared the facility specific data to EIA data on thermal energy use in the State to identify an upper bound on the potential for conversion.
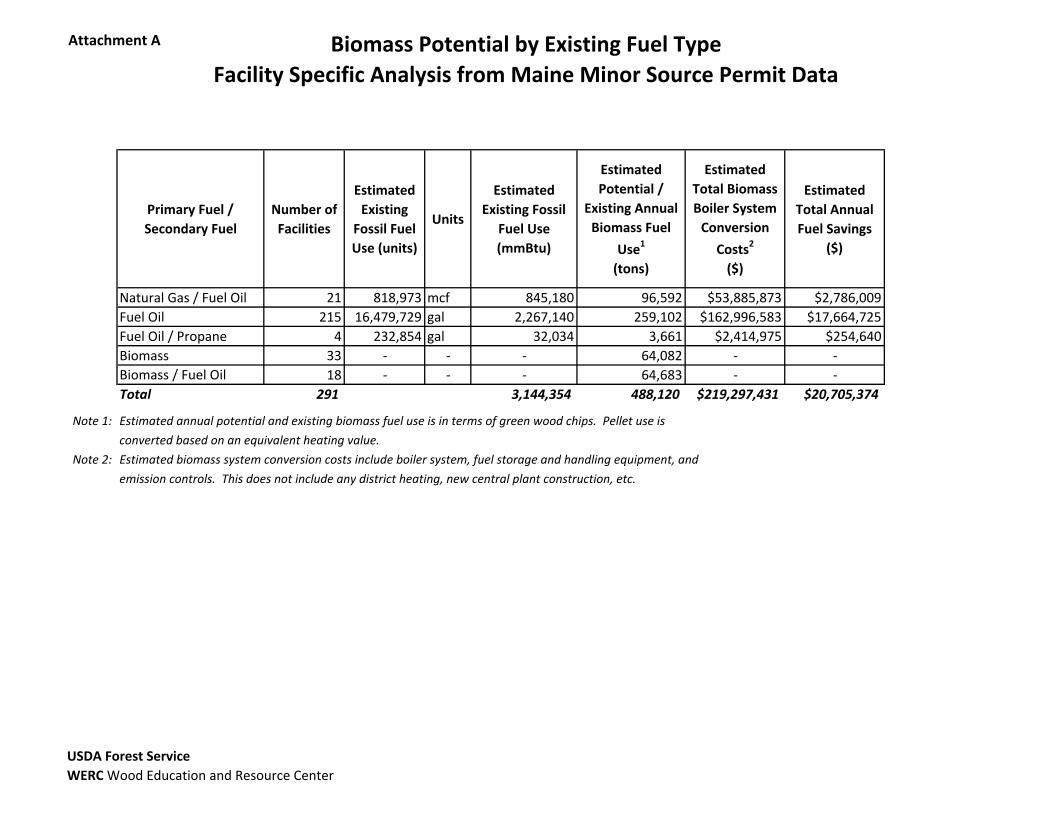
WERC found that, in aggregate, conversion at the 240 existing and identified facilities with fossil fuel boilers would require an investment of approximately $220,000,000, and this would save approximately $21,000,000 on energy annually even given the relatively low cost of fossil fuels today. These facilities would require the equivalent of 359,000 green tons of wood chips annually. Some of these facilities would be large enough to use bark and whole tree chips, and some facilities would be of a size where wood pellets would be the most effective woody biomass product. These specific facilities represent about 3,000,000 mmBtu of fossil fuel input annually, and this fossil fuel use is a mix of natural gas, fuel oil and propane.
In evaluating EIA data on the total fossil fuel use, WERC found that over 69,000,000 mmBtu of fossil fuel is used for thermal energy annually in the State of Maine. Thus, as would be expected, the 240 facilities represent a small percentage (~4%) of the potential for conversions.
Through systems at individual facilities, as well as district energy systems that can connect a wide range of thermal demands, there are many opportunities all over the State of Maine to provide local uses of a wide variety of forest industry residuals and refined woody biomass products. In addition to the
Maine Woody Biomass Thermal Potential Memorandum – 11/28/16
WERC Wood Education and Resource Center Page 2 of 8
thermal opportunities, the creation of district energy systems and consolidating thermal loads would provide excellent opportunities to implement highly efficient combined heat and power facilities.
Implementing these facility conversions and district energy systems would require significant capital investment and effort. However, once this investment is made, these facilities would provide environmentally and economically sustainable markets for forest industry residuals, as well as a host of economic benefits including: energy savings to owners, keeping energy dollars within the local economy, and developing woody biomass energy and district energy expertise that can be exported to other parts of the country and world.
2.0 SITE SPECIFIC ANALYSIS
WERC used data available on the following website to identify the existing mix of boilers at existing
minor sources in Maine http://www.maine.gov/dep/air/licensing/minor‐source‐list.html.
This data was used to develop a general picture of the potential for biomass use and energy cost savings at existing facilities in Maine. The results of the data analysis are presented in the following attachments to this memorandum:
Attachment A – Woody Biomass Potential by Existing Fuel Type (Minor Source Permit Data)
Attachment B – Woody Biomass Potential by County (Minor Source Permit Data)
Attachment C – Key Values and Assumptions (Minor Source Permit Data)
This section describes the data analyzed, the development of the analysis, and the key values and assumptions used.
2.1 Description of Data Used
Boiler information taken from air emission licenses issued by the Maine Department of Environmental Protection was used to identify 291 facilities with a host of fossil fuel and biomass boilers for providing thermal energy for process and heating demands. Of these facilities, 51 had biomass boilers.
The information available for each facility includes the number of boilers, fuel used by the boilers, and location of the facility. This information was used in conjunction with a number of assumptions described in this memorandum to develop a basic idea of the potential for woody biomass conversions, energy savings, cost of conversions, and woody biomass needs to meet the demands.
2.2 Analysis of Annual Heating Demand
The data available gave the fuel type and input capacity (in units of mmBtu/hr) for boilers for the facility. In order to determine the annual heating demand and thereby the fuel requirements, several assumptions were made.
The total input capacity of each facility is based on the permitted input ratings of the boilers at the facility. Output capacity is calculated based on assumed boiler efficiencies based on the primary fuel type at the facility. It is assumed, for ease of calculation, that the primary fuel type is 100% of the fuel use at the facility.
Assumptions are then made to determine the peak heating load for which each facility was designed. For facilities with multiple boilers, a 100% boiler redundancy was assumed, meaning the facility would have twice the output capacity needed. Each system was also then assumed to be oversized by 25% based on the peak design load, meaning the annual peak load is equal to 80% of the assumed output
Maine Woody Biomass Thermal Potential Memorandum – 11/28/16
WERC Wood Education and Resource Center Page 3 of 8
capacity (once assumed redundant capacity is removed). The heating demand is based on a general assumption that the plant runs at 30% of the peak load for 6,744 hours per year. While this provides only a generic estimate, this provides a reasonable number for most facilities where space heating is the key demand, and is likely conservative for when process heat is the key demand.
2.3 Analysis Biomass Fuel Use, System Cost, and Fuel Cost Savings
Existing fossil fuel use and potential biomass fuel use were calculated based on the estimated annual heating demand, fuel heating values, and assumed boiler efficiencies (see Attachment C). The economics are based on the boilers’ primary fuel type only. All fuel oil use is assumed to be #2 fuel oil.
Average fuel oil and natural gas costs were obtained from the Maine Governor’s Energy Office and the US Energy Information Administration, respectively. See Attachment C for all fuel cost and heating value assumptions.
Biomass system installation costs are based on several biomass boiler system quotes previously obtained for various boiler sizes. Cost estimates are based on an average system cost per boiler horsepower. The estimated biomass boiler sizes are equivalent to the estimated peak demand. Biomass boiler sizes above 2.0 mmBtu/hr are assumed to be wood chip projects and those below 2.0 mmBtu/hr are assumed to be wood pellet projects.
3.0 EIA DATA ANALYSIS
The U.S. Energy Information Administration (EIA) collects and analyzes energy data, including coal, petroleum, and natural gas consumption and price data.
Data provided by the EIA was used to develop an overall picture of the use and cost of fossil fuels in the State of Maine for meeting thermal demands in the residential, commercial, and industrial sectors. The results of the data analysis are presented in the following attachments to this memorandum:
Attachment D – EIA – Maine Fossil Fuel Use for Thermal Applications
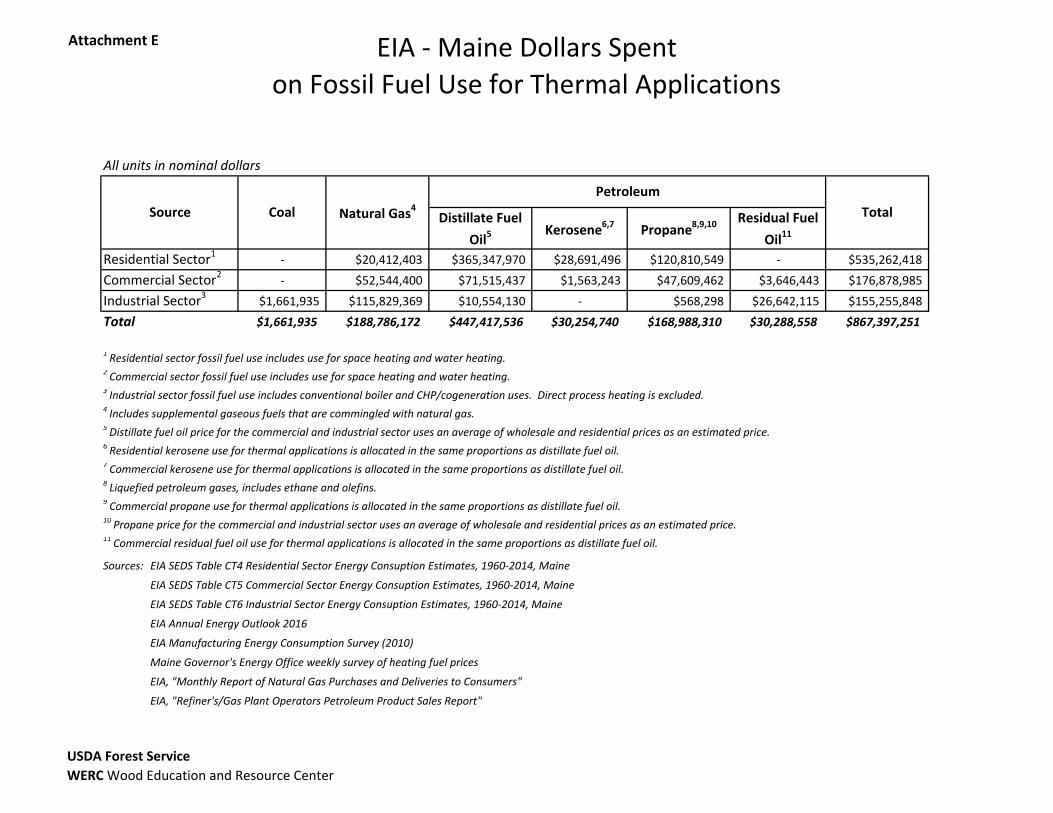
Attachment E – EIA – Maine Dollars Spent on Fossil Fuel Use for Thermal Applications
This memorandum describes the data sets analyzed, and the key values and assumptions used.
3.1 Energy Consumption Profiles by Sector
The EIA State Energy Data System (SEDS) publishes annual energy consumption by sector and fuel type for each state. This state‐level data is an estimate based on a survey of annual fuel sales reports of active companies selling fuel. Sales were reported by fuel type and sector. SEDS breaks down the estimated fuel consumption into four sectors: residential, commercial, industrial, and transportation. This memo focuses on consumption of the residential, commercial, and industrial sectors.
A five‐year average estimated consumption (in units of million Btu’s) for all fossil fuels reported by the SEDS for the State of Maine is presented in Table 1. Energy reported in this table represents estimated consumption for all applications for the residential, commercial, and industrial sectors.
Maine Woody Biomass Thermal Potential Memorandum – 11/28/16
WERC Wood Education and Resource Center Page 4 of 8
Table 1: Annual Maine Energy Consumption Estimates (mmBtu) (All Applications)
Total 700,000 38,940,000 41,940,000 1,820,000 11,660,000 5,780,000 100,840,000
Note: Annual energy consumption estimates are based on a five‐year average of energy consumption estimates by sector and fuel type for the time period 2010‐2014. All units are in millions of Btu’s.
3.2 Energy Consumption for Thermal Applications
For the purposes of this memorandum, the energy consumption data presented in Table 1 must be further broken down to identify energy use for thermal applications. Thermal energy consumption by application is estimated using data from two sources: the EIA’s Annual Energy Outlook (AEO) 2016 and Manufacturing Energy Consumption Survey (MECS) 2010. These reports show national energy consumption data by application. Energy use by application in the State of Maine is allocated in the same proportions as the reported national use, which is likely conservative given the amount of heating demand in Maine as compared to much of the US.
Estimates for fuel consumption for thermal applications for the residential sector are based on the 2015 data presented in Table A4: Residential Sector Key Indicators and Consumption, in the AEO 2016 report. This table breaks out energy use by application for natural gas, distillate fuel oil and propane. Propane and kerosene product consumption is allocated in the same proportion as distillate fuel oil.
Estimates for fuel consumption for thermal applications for the commercial sector are based on the 2015 data presented in Table A5: Commercial Sector Key Indicators and Consumption, in the AEO 2016 report. This table breaks out energy use by application for natural gas and distillate fuel oil. Product consumption for other grades of fuel oil, propane, and kerosene is allocated in the same proportion as distillate fuel oil.
Estimates for fuel consumption for thermal applications for the industrial sector are based on the data presented in Table 5.2: End Uses of Fuel Consumption, 2010, in the MECS 2010 report. This table breaks out energy use by application for residual fuel oil, distillate fuel oil, natural gas, liquid petroleum gas (propane), and coal. Only indirect uses, conventional boiler use and CHP and/or cogeneration process, are considered for thermal application use for purposes of this memorandum. Direct process and non‐process uses are not considered.
Estimated energy consumption by fuel type and sector for thermal applications in the State of Maine is presented in Table 2. Energy consumption for thermal applications is based on the energy data presented in Table 1 and allocated proportionally based on the AEO 2016 and MECS 2010 reports as described in the previous paragraphs. Table 4 provides the percentages of thermal use by sector and fuel from the EIA tables referenced.
Maine Woody Biomass Thermal Potential Memorandum – 11/28/16
WERC Wood Education and Resource Center Page 5 of 8
Table 2: Annual Maine Energy Consumption Estimates (mmBtu) (Thermal Applications)
Total 519,355 23,079,815 32,055,026 1,694,768 7,465,692 4,445,009 69,259,664
Note: Annual energy consumption estimates are based on a five‐year average of energy consumption estimates by sector and fuel type for the time period 2010‐2014. All units are in millions of Btu’s.
3.3 Energy Costs for Thermal Applications
An estimate of the total dollars spent on energy for use in thermal applications is based on the energy use presented in Table 2 and energy pricing information provided by the Maine Governor’s Energy Office (GEO) and the EIA. All pricing information is based on an average prices of October 2015 ‐ October 2016 where available. Preference was given to energy prices specific to the State of Maine where it was available, and the unit prices are provided in Table 4.
A summary of dollars spent on fossil fuel energy for use in thermal applications is presented in Table 3.
Table 3: Annual Energy Costs for Fossil Fuel Use (Thermal Applications Only – 2015‐2016 Fuel Prices)
Total $1,661,935 $188,786,172 $446,787,328 $30,254,740 $168,988,310 $30,288,558 $866,767,043
Note: Annual energy cost estimates are based on a five‐year average of energy consumption estimates by sector and fuel type for the time period 2010‐2014. Fuel prices are based on EIA and Maine GEO records for 2015‐2016.
A comparison of the cost of heat delivered for various fossil fuels and woody biomass fuels is also presented for each sector in Figures 1‐3. Cost of heat comparisons are based on energy pricing information for fuel type and assumed boiler efficiencies.
A cost of heat comparison for the residential sector is presented in Figure 1. A cost of heat comparison for the commercial sector is presented in Figure 2. A cost of heat comparison for the industrial sector is presented in Figure 3.
Maine Woody Biomass Thermal Potential Memorandum – 11/28/16
WERC Wood Education and Resource Center Page 6 of 8
Figure 1: Cost of Heat Comparison – Residential Sector
Figure 2: Cost of Heat Comparison – Commercial Sector
Maine Woody Biomass Thermal Potential Memorandum – 11/28/16
WERC Wood Education and Resource Center Page 7 of 8
Figure 3: Cost of Heat Comparison – Industrial Sector
Maine Woody Biomass Thermal Potential Memorandum – 11/28/16
WERC Wood Education and Resource Center Page 8 of 8
3.4 Key Values and Assumptions
All key values and assumptions used in this memorandum are presented in Table 4.
Table 4: Key Values and Assumptions
Key Value or Assumption Value Units Source
US Residential natural gas use for thermal applications as percent of total use 88.9% percent EIA AEO 2016
US Residential distillate fuel oil use for thermal applications as percent of total use 98.0% percent EIA AEO 2016
US Residential propane use for thermal applications as percent of total use 81.4% percent EIA AEO 2016
US Commercial natural gas use for thermal applications as percent of total use 69.0% percent EIA AEO 2016
US Commercial distillate fuel oil use for thermal applications as percent of total use 48.6% percent EIA AEO 2016
US Industrial coal use for indirect thermal applications as percent of total use 74.2% percent EIA MECS 2010
US Industrial natural gas use for indirect thermal applications as percent of total use 55.0% percent EIA MECS 2010
US Industrial distillate fuel oil use for indirect thermal applications as percent of total use 17.7% percent EIA MECS 2010
US Industrial propane use for indirect thermal applications as percent of total use 18.8% percent EIA MECS 2010
US Industrial residual fuel oil use for indirect thermal applications as percent of total use 83.5% percent EIA MECS 2010
Maine average fuel oil price (wholesale 2015‐2016 + 25%) $1.72 $/gallon US Energy Information Administration
Natural gas higher heating value 1,032 Btu/ft3
US Energy Information AdministrationNatural gas boiler efficiency 80% percent WES Assumption
Natural gas average price (2015 ‐ 2016) ‐ Industrial $0.0074 $/ft3
US Energy Information Administration
Natural gas average price (2015 ‐ 2016) ‐ Commercial $0.0103 $/ft3 US Energy Information AdministrationGreen wood chip higher heating value (40% m.c.) 10.0 mmBtu/ton WES Assumption
1 Residential sector fossil fuel use includes space heating and water heating.2 Commercial sector fossil fuel use includes space heating and water heating.3 Industrial sector fossil fuel use includes conventional boiler and CHP/cogeneration uses. Direct process heating is excluded.4 Includes supplemental gaseous fuels that are commingled with natural gas.5 Residential kerosene use for thermal applications is allocated in the same proportions as distillate fuel oil.6 Commercial kerosene use for thermal applications is allocated in the same proportions as distillate fuel oil.7 Liquefied petroleum gases, includes ethane and olefins.8 Commercial propane use for thermal applications is allocated in the same proportions as distillate fuel oil.9 Commercial residual fuel oil use for thermal applications is allocated in the same proportions as distillate fuel oil.
Sources: EIA SEDS Table CT4 Residential Sector Energy Consuption Estimates, 1960‐2014, Maine
EIA SEDS Table CT5 Commercial Sector Energy Consuption Estimates, 1960‐2014, Maine
EIA SEDS Table CT6 Industrial Sector Energy Consuption Estimates, 1960‐2014, Maine
EIA Annual Energy Outlook 2016
EIA Manufacturing Energy Consumption Survey (2010)
1 Residential sector fossil fuel use includes use for space heating and water heating.2 Commercial sector fossil fuel use includes use for space heating and water heating.3 Industrial sector fossil fuel use includes conventional boiler and CHP/cogeneration uses. Direct process heating is excluded.4 Includes supplemental gaseous fuels that are commingled with natural gas.5 Distillate fuel oil price for the commercial and industrial sector uses an average of wholesale and residential prices as an estimated price.6 Residential kerosene use for thermal applications is allocated in the same proportions as distillate fuel oil.7 Commercial kerosene use for thermal applications is allocated in the same proportions as distillate fuel oil.8 Liquefied petroleum gases, includes ethane and olefins.9 Commercial propane use for thermal applications is allocated in the same proportions as distillate fuel oil.10 Propane price for the commercial and industrial sector uses an average of wholesale and residential prices as an estimated price.11 Commercial residual fuel oil use for thermal applications is allocated in the same proportions as distillate fuel oil.
Sources: EIA SEDS Table CT4 Residential Sector Energy Consuption Estimates, 1960‐2014, Maine
EIA SEDS Table CT5 Commercial Sector Energy Consuption Estimates, 1960‐2014, Maine
EIA SEDS Table CT6 Industrial Sector Energy Consuption Estimates, 1960‐2014, Maine
EIA Annual Energy Outlook 2016
EIA Manufacturing Energy Consumption Survey (2010)
Maine Governor's Energy Office weekly survey of heating fuel prices
EIA, "Monthly Report of Natural Gas Purchases and Deliveries to Consumers"
Northeastern Area WERC Wood Energy Technical Assistance Team
Wood Education and Resource Center 310 Hardwood Lane Princeton, WV 24720 (304) 487‐1510
For More Information or To Obtain Technical Assistance on Your Project Contact: US Forest Service -WERC Wood Energy Technical Assistance Team 180 Canfield St. Morgantown, WV 26501 Lew R. McCreery, Woody Biomass Coordinator [email protected] 304-285-1538 WERC Woody Biomass Website: http://na.fs.fed.us/werc/biomass/index.shtm The information contained herein creates no warranty either express or implied. The USDA Forest Service, its officers, employees, and project partners assume no liability for its contents or use thereof. Use of this information is at the sole discretion of the user. "The U.S. Department of Agriculture (USDA) prohibits discrimination in all its programs and activities on the basis of race, color, national origin, age, disability, and where applicable, sex, marital status, familial status, parental status, religion, sexual orientation, genetic information, political beliefs, reprisal, or because all or part of an individual's income is derived from any public assistance program. (Not all prohibited bases apply to all programs.) Persons with disabilities who require alternative means for communication of program information (Braille, large print, audiotape, etc.) should contact USDA's TARGET Center at (202) 720‐2600 (voice and TDD). To file a complaint of discrimination, write to USDA, Director, Office of Civil Rights, 1400 Independence Avenue, S.W., Washington, DC 20250‐9410, or call (800) 795‐3272 (voice) or (202) 720‐6382 (TDD). USDA is an equal opportunity provider and employer."