12
UEFA Elite Club Injury Study – 2016/17 mid-season report UEFA Elite Club Injury Study 2016/17 mid-season report SSC Napoli

UEFA Elite Club Injury Study – 2016/17 mid-season report
UEFA Elite Club Injury Study
2016/17 mid-season report
SSC Napoli
UEFA Elite Club Injury Study – 2016/17 mid-season report
The UEFA Elite Club Injury Study was initiated by and is funded and supported by
UEFA.
This report has been produced on behalf of the UEFA Medical Committee by:
Professor Jan Ekstrand, MD, PhD, Linkoping University
Former first vice-chairman of the UEFA Medical Committee
Correspondence should be addressed to:
Injury Study Group
Professor Jan Ekstrand
Hertig Karlsgatan 13 B
582 21 Linköping
Sweden
Håkan Bengtsson Anna Hallén
[email protected] [email protected]
+46 13 318990
UEFA
Marc Vouillamoz
Head of Medical and Anti-Doping Unit
Niki Papadimitriou
UEFA Medical Assistant
Route de Genève 46
1260 Nyon 2
Switzerland
+41 848 00 27 27
+41 22 707 27 34 (fax)

UEFA Elite Club Injury Study – 2016/17 mid-season report
2016/17 MID-SEASON REPORT
Each season, on behalf of UEFA, the Football Research Group (FRG) provides clubs
participating in the UEFA Elite Club Injury Study with reports containing up-to-date
results in the course of the year. In these reports, data is presented for each team and
compared with averages for all participating teams.
Participating clubs
This mid-season report contains results from July to December of the 2016/17 season
for the 35 clubs that provided complete data for at least five months. The following
teams have been included: AC Milan, Arsenal FC, AS Roma, Athletic Club, Bayer 04
Leverkusen, Borussia Dortmund, Chelsea FC, Club Atlético de Madrid, Club Brugge
KV, FC Barcelona, FC Basel 1893, FC København, FC Porto, FC Shakhtar Donetsk, FC
Zenit, Galatasaray AŞ, GNK Dinamo Zagreb, Juventus, Leicester City FC, LOSC Lille,
Manchester City FC, Manchester United FC, NK Maribor, Olympique Lyonnais, Paris
Saint-Germain, PFC CSKA Moskva, PFC Ludogorets Razgrad, PSV Eindhoven, Real
Madrid CF, RSC Anderlecht, SL Benfica, Southampton FC, Sporting Clube de Portugal,
SSC Napoli, Tottenham Hotspur FC.
Interpretation of results
When comparing your club’s results with those of other participating clubs, please
bear the following in mind:
Because of the limited amounts of data collected, the injury rates presented
are sometimes based on just a few actual injuries. This means that some results
should be interpreted with caution.
The overall number of injuries varies between clubs, mainly because of the
number of minor injuries. It is therefore important to look not only at the
overall injury rate, but also at the data on severe injuries and squad availability,
as these variables may have a greater impact on the club.
Only months where full data has been provided are included in this analysis.
The number of months of data may therefore differ between teams, and this
may influence the injury statistics in the report.
We hope that you will find this report useful in your daily work treating and
preventing injuries at your club. Please do not hesitate to contact FRG if you have any
questions about how to interpret the results.

UEFA Elite Club Injury Study – 2016/17 mid-season report
Exposure
In total, 154 000 hours of exposure were recorded in the first half of the 2016/17
season, with approximately 133 000 training hours (86%) and 21 000 match hours
(14%). The average squad size has been 27 players/team.
SSC Napoli reported 5 330 hours of total exposure, with 4 804 training hours (90%)
and 527 match hours 10%).
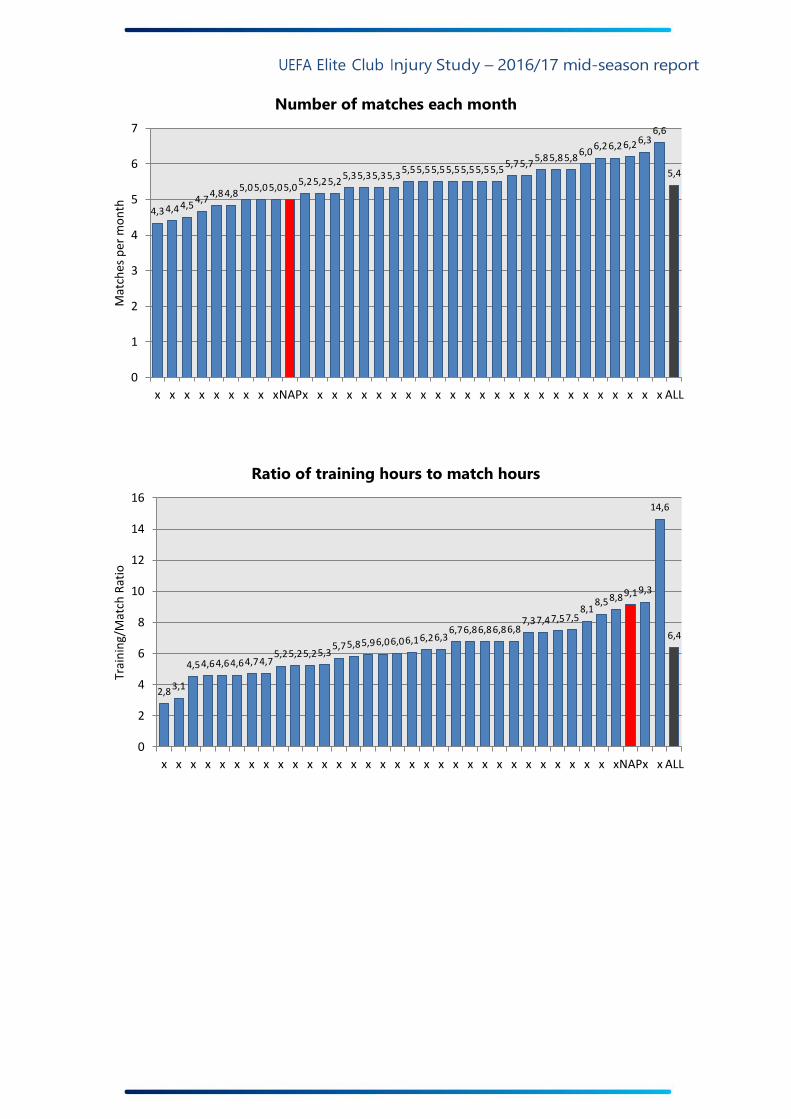
On average, teams reported 127 training sessions and 32 matches over the review
period. Since the reporting period differed between teams, we have also calculated a
monthly training and match load. On average, teams had 21 training sessions and 5.4
matches each month, giving an average training-to-match exposure ratio of 6.4 hours
of training for each hour of match play.
Number of training sessions each month
16 16 16 17 18 18
19 19 19 20 20 20 20 21 21 21 21 21 22 22
23 23 23 23 23 23 24 24 24 25 25 25 26 26
28
21
0
5
10
15
20
25
30
x x x x x x x x x x x x x x x x x x x x x x x x x x x x x x x x x xNAPALL
Trai
nin
g se
ssio
ns
per
mo
nth
UEFA Elite Club Injury Study – 2016/17 mid-season report
Number of matches each month
Ratio of training hours to match hours
4,3 4,4 4,5 4,7
4,8 4,8 5,0 5,0 5,0 5,0
5,2 5,2 5,2 5,3 5,3 5,3 5,3
5,5 5,5 5,5 5,5 5,5 5,5 5,5 5,7 5,7
5,8 5,8 5,8 6,0
6,2 6,2 6,2 6,3 6,6
5,4
0
1
2
3
4
5
6
7
x x x x x x x x xNAPx x x x x x x x x x x x x x x x x x x x x x x x x ALL
Mat
ches
per
mo
nth
2,8 3,1
4,5 4,6 4,6 4,6 4,7 4,7 5,2 5,2 5,2 5,3
5,7 5,8 5,9 6,0 6,0 6,1 6,2 6,3 6,7 6,8 6,8 6,8 6,8
7,3 7,4 7,5 7,5 8,1
8,5 8,8 9,1 9,3
14,6
6,4
0
2
4
6
8
10
12
14
16
x x x x x x x x x x x x x x x x x x x x x x x x x x x x x x x xNAPx x ALL
Trai
nin
g/M
atch
Rat
io

UEFA Elite Club Injury Study – 2016/17 mid-season report
Injury rate (number of injuries for every 1,000 hours of exposure)
In total, 796 injuries were reported, with 348 training injuries (44%) and 448 match
injuries (56%). There were 140 severe injuries (18%), 333 muscle injuries (42%) and
137 ligament injuries (17%).
SSC Napoli reported 9 injuries (4 training injuries; 5 match injuries) during this period,
including 3 severe injuries, 5 muscle injuries and 2 ligament injuries.
The mean training injury rate for all teams was 2.6 injuries for every 1,000 training
hours, with individual rates ranging from 0.1 to 9.3.
Training injury rate
0,1
0,6 0,7 0,8 0,8 0,9 1,0 1,2 1,3 1,7
2,1 2,1 2,1 2,1 2,2 2,3 2,4 2,5 2,7 2,9 3,1 3,1 3,1 3,2 3,3 3,4 3,5
3,9 4,1 4,4
4,8
5,5
7,3
7,8
9,3
2,6
0
1
2
3
4
5
6
7
8
9
10
x x xNAPx x x x x x x x x x x x x x x x x x x x x x x x x x x x x x x ALL
Inci
den
ce
UEFA Elite Club Injury Study – 2016/17 mid-season report
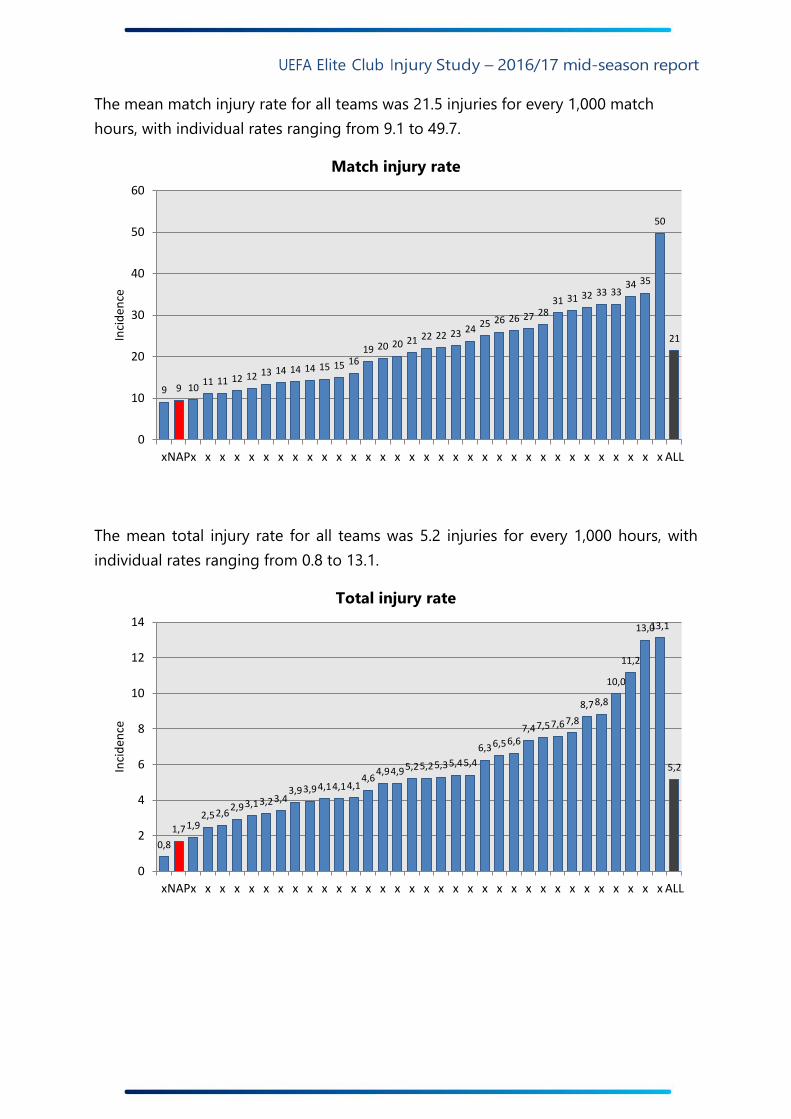
The mean match injury rate for all teams was 21.5 injuries for every 1,000 match
hours, with individual rates ranging from 9.1 to 49.7.
Match injury rate
The mean total injury rate for all teams was 5.2 injuries for every 1,000 hours, with
individual rates ranging from 0.8 to 13.1.
Total injury rate
9 9 10 11 11 12 12 13 14 14 14 15 15 16
19 20 20 21 22 22 23 24 25 26 26 27 28
31 31 32 33 33 34 35
50
21
0
10
20
30
40
50
60
xNAPx x x x x x x x x x x x x x x x x x x x x x x x x x x x x x x x x ALL
Inci
den
ce
0,8
1,7 1,9 2,5 2,6
2,9 3,1 3,2 3,4 3,9 3,9 4,1 4,1 4,1
4,6 4,9 4,9 5,2 5,2 5,3 5,4 5,4
6,3 6,5 6,6 7,4 7,5 7,6 7,8
8,7 8,8
10,0
11,2
13,0 13,1
5,2
0
2
4
6
8
10
12
14
xNAPx x x x x x x x x x x x x x x x x x x x x x x x x x x x x x x x x ALL
Inci
den
ce
UEFA Elite Club Injury Study – 2016/17 mid-season report
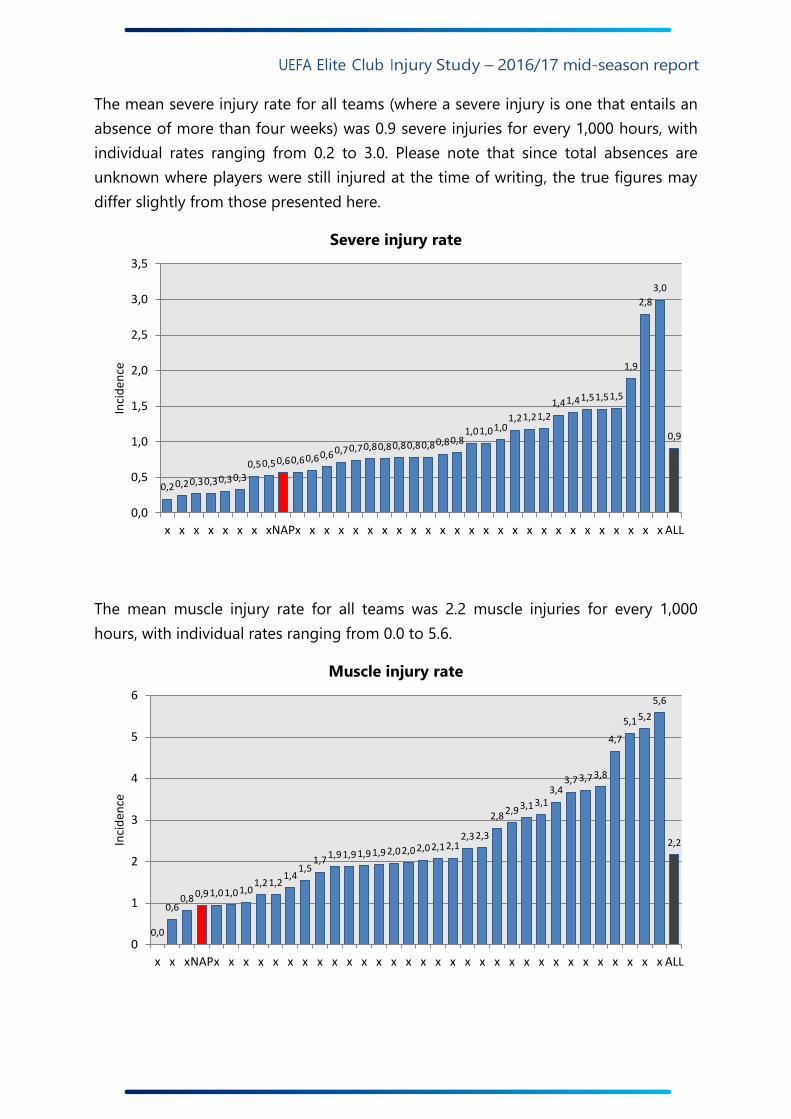
The mean severe injury rate for all teams (where a severe injury is one that entails an
absence of more than four weeks) was 0.9 severe injuries for every 1,000 hours, with
individual rates ranging from 0.2 to 3.0. Please note that since total absences are
unknown where players were still injured at the time of writing, the true figures may
differ slightly from those presented here.
Severe injury rate
The mean muscle injury rate for all teams was 2.2 muscle injuries for every 1,000
hours, with individual rates ranging from 0.0 to 5.6.
Muscle injury rate
0,2 0,2 0,3 0,3 0,3 0,3
0,5 0,5 0,6 0,6 0,6 0,6 0,7 0,7 0,8 0,8 0,8 0,8 0,8 0,8 0,8 1,0 1,0 1,0
1,2 1,2 1,2
1,4 1,4 1,5 1,5 1,5
1,9
2,8
3,0
0,9
0,0
0,5
1,0
1,5
2,0
2,5
3,0
3,5
x x x x x x x xNAPx x x x x x x x x x x x x x x x x x x x x x x x x x ALL
Inci
den
ce
0,0
0,6 0,8 0,9 1,0 1,0 1,0
1,2 1,2 1,4
1,5 1,7
1,9 1,9 1,9 1,9 2,0 2,0 2,0 2,1 2,1 2,3 2,3
2,8 2,9 3,1 3,1
3,4 3,7 3,7 3,8
4,7
5,1 5,2
5,6
2,2
0
1
2
3
4
5
6
x x xNAPx x x x x x x x x x x x x x x x x x x x x x x x x x x x x x x ALL
Inci
den
ce

UEFA Elite Club Injury Study – 2016/17 mid-season report
The mean ligament injury rate for all teams was 0.9 ligament injuries for every 1,000
hours, with individual rates ranging from 0.2 to 2.5.
Ligament injury rate
0,2 0,2 0,2 0,2 0,2 0,3 0,3 0,3 0,4
0,5 0,5 0,6 0,6 0,8 0,8
0,9 0,9 0,9 0,9 1,0 1,0 1,0 1,0 1,0 1,2 1,2 1,2 1,2
1,3 1,5
1,7
1,9
2,3 2,3 2,5
0,9
0,0
0,5
1,0
1,5
2,0
2,5
3,0
x x x x x x x xNAPx x x x x x x x x x x x x x x x x x x x x x x x x x ALL
Inci
den
ce

UEFA Elite Club Injury Study – 2016/17 mid-season report
Squad attendance/availability
All data in the charts in this section is in the form of percentages.
Squad attendance/availability refers to the average percentage of players who
participated in training sessions or were available for match selection over the review
period. An attendance/availability rate of 100% would mean that no player was
absent because of injury, illness, international duty or any other reason.
Squad attendance rates for training
Squad availability rates for matches
0%
10%
20%
30%
40%
50%
60%
70%
80%
90%
100%
x x x x x x x x x x x x x x x x x x x x x x x x x x x xNAPx x x x x x ALL
Training attendance (%) Training absence (%)
0%
10%
20%
30%
40%
50%
60%
70%
80%
90%
100%
x x x x x x x x x x x x x x x x x x x x x x x x x x x x x x x xNAPx x ALL
Match availability (%) Match absence (%)
UEFA Elite Club Injury Study – 2016/17 mid-season report
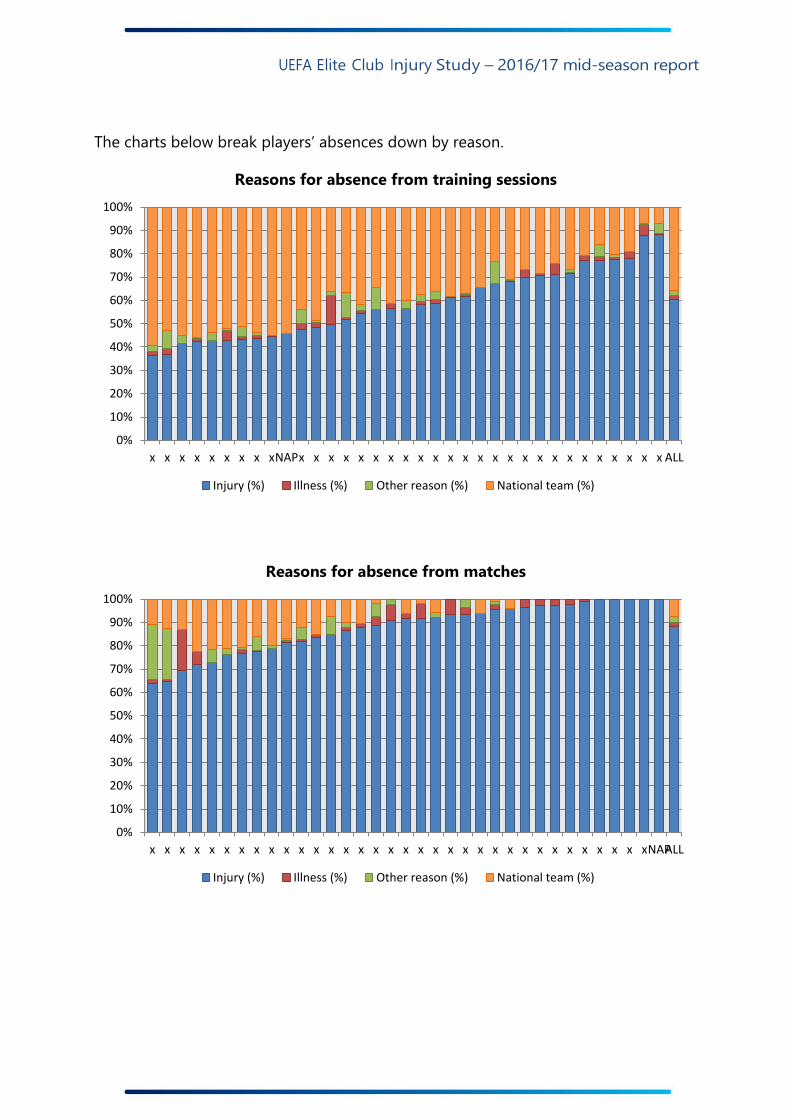
The charts below break players’ absences down by reason.
Reasons for absence from training sessions
Reasons for absence from matches
0%
10%
20%
30%
40%
50%
60%
70%
80%
90%
100%
x x x x x x x x xNAPx x x x x x x x x x x x x x x x x x x x x x x x x ALL
Injury (%) Illness (%) Other reason (%) National team (%)
0%
10%
20%
30%
40%
50%
60%
70%
80%
90%
100%
x x x x x x x x x x x x x x x x x x x x x x x x x x x x x x x x x xNAPALL
Injury (%) Illness (%) Other reason (%) National team (%)

UEFA Elite Club Injury Study – 2016/17 mid-season report
Number of training sessions/matches missed because of injury
The consequences of injuries have also been assessed in terms of the number of
training sessions and matches that players missed during the review period. On
average, across all clubs, each player missed 2.2 training sessions and 0.6 matches
each month because of injury. Data specific to each club is presented below.
Number of training sessions missed per player per month owing to injury
Number of matches missed per player per month owing to injury
0,6
0,9 1,0 1,1 1,1 1,1
1,3 1,3 1,4 1,4 1,5 1,5 1,5
1,6 1,9 1,9 1,9 2,0 2,0 2,0
2,2 2,4
2,6 2,6 2,6 2,7 2,9
3,0 3,2
3,4 3,5
3,8 3,9 4,0
4,2
2,2
0,0
0,5
1,0
1,5
2,0
2,5
3,0
3,5
4,0
4,5
x x x x x x x x xNAPx x x x x x x x x x x x x x x x x x x x x x x x x ALL
Mis
sed
tra
inin
gs p
er p
laye
r p
er m
on
th
0,2 0,2 0,3 0,3 0,3 0,3 0,3 0,3 0,3 0,4 0,4 0,4 0,4 0,4
0,5 0,5 0,5 0,5 0,6 0,6 0,6 0,6 0,6
0,7 0,7 0,7 0,7 0,7 0,8 0,8 0,8 0,8
0,9
1,1 1,2
0,6
0,0
0,2
0,4
0,6
0,8
1,0
1,2
1,4
x x x xNAPx x x x x x x x x x x x x x x x x x x x x x x x x x x x x x ALL
Mis
sed
mat
ches
per
pla
yer
per
mo
nth


