Author: Dr. Ray Russell Founder and President of RaysWeather.Com Date: October 20, 2017 RaysWeather.Com 2017-2018 Winter Fearless Forecast Background Hurricanes grabbed headlines during late summer and early fall; however, in between those storms, warm, dry air dominated. Three brief cool shots got leaf season going. Now, we await winter’s return. RaysWeather.Com has produced a winter forecast in October for 15 years. While no one should put too much stock in any long-range forecast, ours has held up better than most. Last year, we forecast less than average snowfall—that worked for most of the region; however, NC Foothills saw greater than average snow. See Table 1 for details on how last year’s edition of the “Fearless Forecast” faired. We also forecast near to slightly above average temperatures—above average was the correct answer. Table 1: Last Year’s RWC Fearless Winter Snowfall Forecast Location Forecast Actual Actual - Forecast Asheville, NC 10" 12" +2" Banner Elk, NC 34" 25" -9" Beech Mtn, NC 70" 32" -38" Boone, NC 30" 17" -13" Galax, VA 15” 12” -3” Hendersonville 6" 9" +3” Hickory 5" 8" +3" Independence, VA 16" 10" -6” Jefferson & W Jefferson 20" 9” -11" Lenoir 5" 7" +2" Morganton 6" 8" +2" Mt Airy 9” 7” -2” Old Fort 6 8” +2” Sparta 16" 8” -8" Spruce Pine 19" 10" -9" Sugar Mountain 70" 44" -26" Waynesville 19" 9" -10" Wilkesboro & N Wilkesboro 8” 7” -1” Wytheville, VA 17” 13” -4” (Actual reports even within each location varied from site to site. I chose a snowfall total that fairly represented the average for each location.)
Summary of the Fearless Forecast for Winter 2017-2018 You may want to read the rationale that follows, but we’ll give you the “answer” first.
10% to 15% less snow than the long-term average overall, with the western edge of the
Appalachians getting a better share than the rest of the region in the form of NW Flow snows.
Temperatures about 1 degree above long-term averages (with big swings warm to cold).
Below are forecast totals for many locations in the Southern Appalachians. (Note: The forecast snowfall
total includes snow/ice falling between October 2017 and May 2018.)
Table 2: Specific 2016-17 Snowfall Forecasts for Selected Locations
Location Expected Total Snow/Ice for Winter 2017-2018
Asheville, NC 12" Banner Elk, NC 40" Beech Mountain, NC 85" Boone, NC 34" Galax, VA 18" Hendersonville, NC 7" Hickory, NC 5" Independence, VA 19" Jefferson and West Jefferson 21" Lenoir, NC 5" Morganton, NC 5" Mt. Airy, NC 9" Old Fort, NC 6" Sparta, NC 20" Spruce Pine, NC 18" Sugar Mountain, NC 85" Waynesville, NC 14" Wilkesboro and N. Wilkesboro 7" Wytheville, VA 20"
Happy Skiing and Snowboarding! We’ll keep you informed with the most reliable day-to-day forecasts
for the Southern Appalachians and Foothills all winter.
This forecast does not come out of thin air. It comes from serious analysis; continue reading for the
rationale.
Fearless Forecast Rationale
ENSO Analysis As always, the first data considered in a Winter forecast are the current state and forecast for the El
Niño/Southern Oscillation (ENSO). ENSO is a measure of large-scale weather conditions in the Equatorial
Pacific. It fluctuates between El Niño (associated with warmer than average sea surface temperatures in
the Equatorial Pacific) and La Niña (associated with colder than average sea surface temperatures in the
Equatorial Pacific).
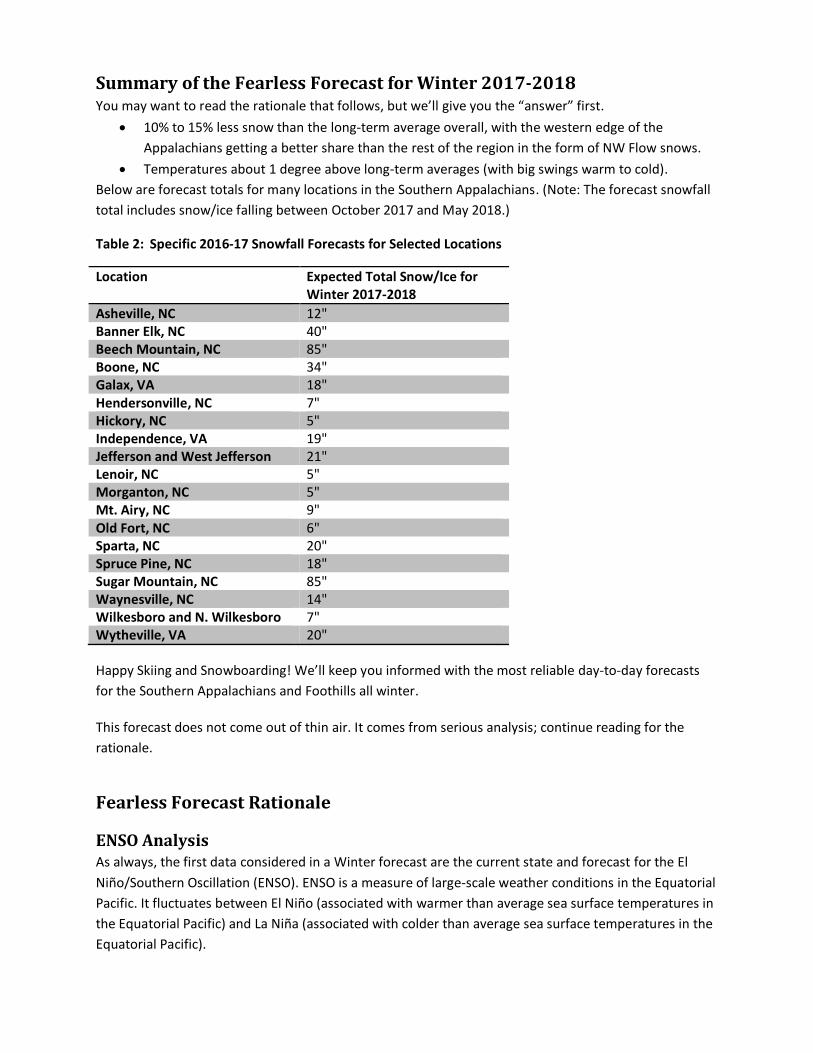
Currently, the ENSO is classified as Neutral but points toward La Niña conditions. Figure 1 shows the Sea
Surface Temperature Anomaly from October 12, 2017. In the Equatorial Pacific, you see a band of cooler
than average temperatures (the darker blues). (Also note the cool waters northeast of the Bahamas
thanks to all the hurricane activity in that region this season.)
Figure 1: Sea Surface Temperature Anomaly 10/12/2017 (from www.ospo.noaa.gov/Products/ocean/sst/anomaly/index.html)
Last October, SSTs were configured similarly to what you see above. However, last year, we expected
either a continued weak La Niña or a turn toward neutral conditions. The La Niña quickly went to neutral
and have remained neutral to now.
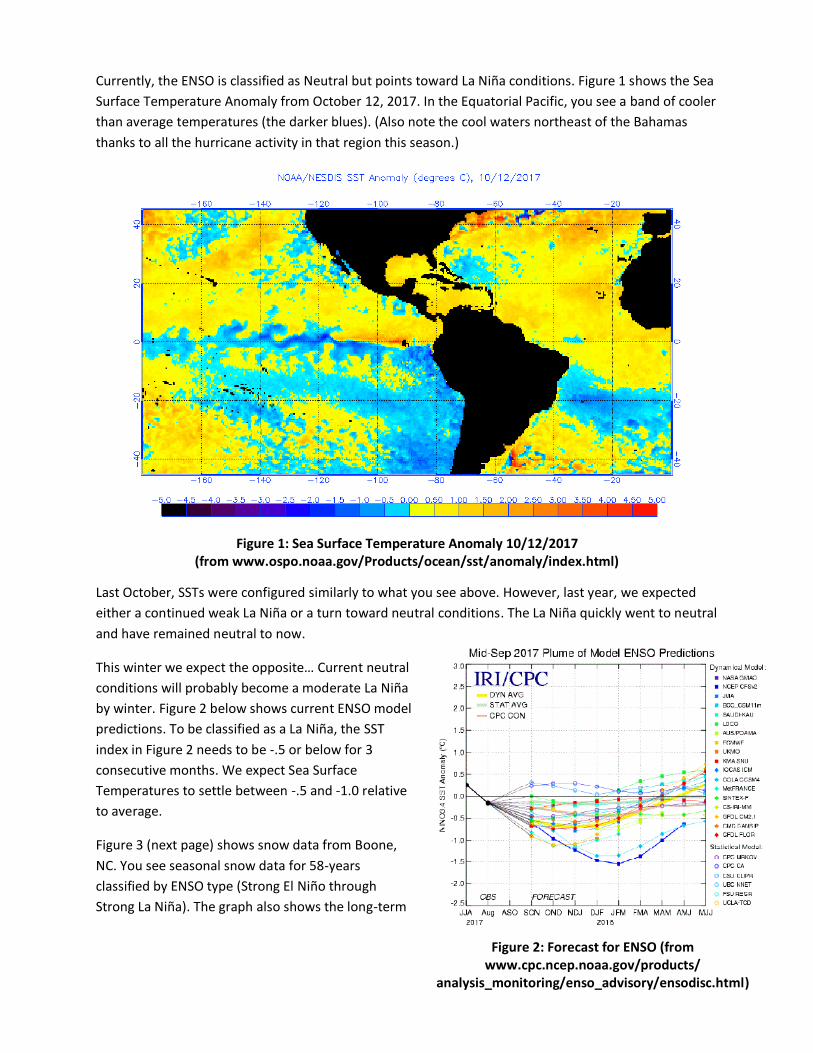
This winter we expect the opposite… Current neutral
conditions will probably become a moderate La Niña
by winter. Figure 2 below shows current ENSO model
predictions. To be classified as a La Niña, the SST
index in Figure 2 needs to be -.5 or below for 3
consecutive months. We expect Sea Surface
Temperatures to settle between -.5 and -1.0 relative
to average.
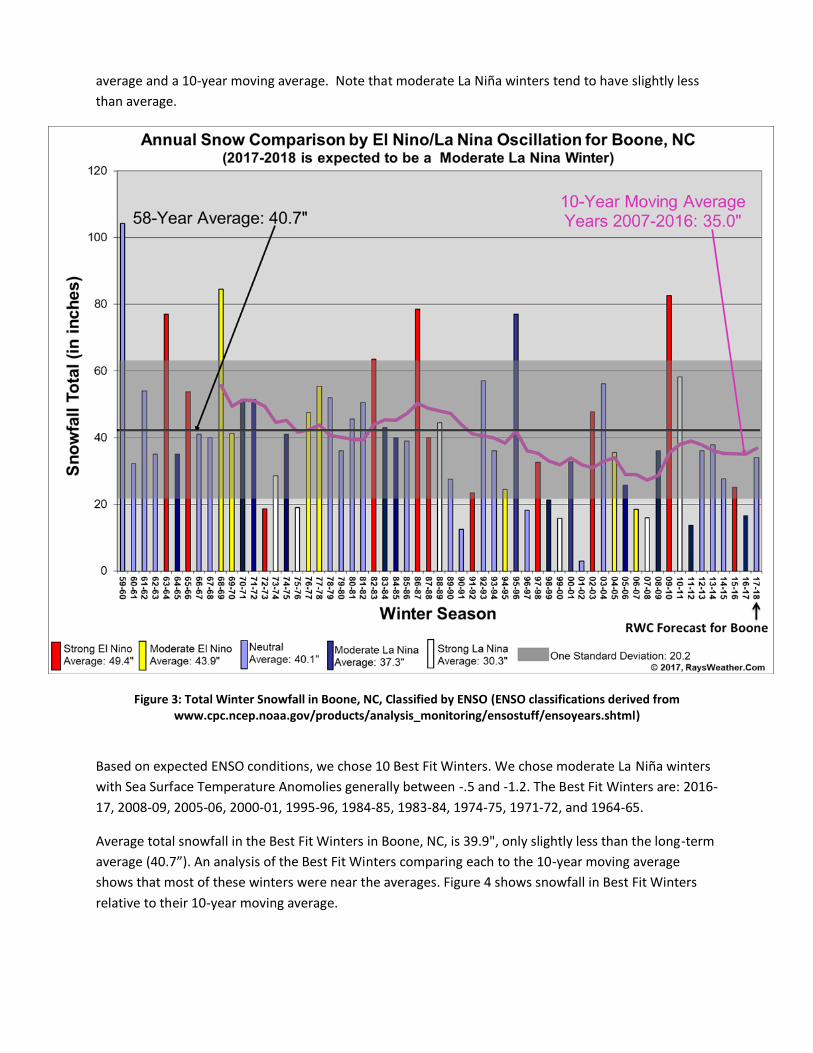
Figure 3 (next page) shows snow data from Boone,
NC. You see seasonal snow data for 58-years
classified by ENSO type (Strong El Niño through
Strong La Niña). The graph also shows the long-term
Figure 2: Forecast for ENSO (from www.cpc.ncep.noaa.gov/products/
analysis_monitoring/enso_advisory/ensodisc.html)
average and a 10-year moving average. Note that moderate La Niña winters tend to have slightly less
than average.
Figure 3: Total Winter Snowfall in Boone, NC, Classified by ENSO (ENSO classifications derived from www.cpc.ncep.noaa.gov/products/analysis_monitoring/ensostuff/ensoyears.shtml)
Based on expected ENSO conditions, we chose 10 Best Fit Winters. We chose moderate La Niña winters
with Sea Surface Temperature Anomolies generally between -.5 and -1.2. The Best Fit Winters are: 2016-
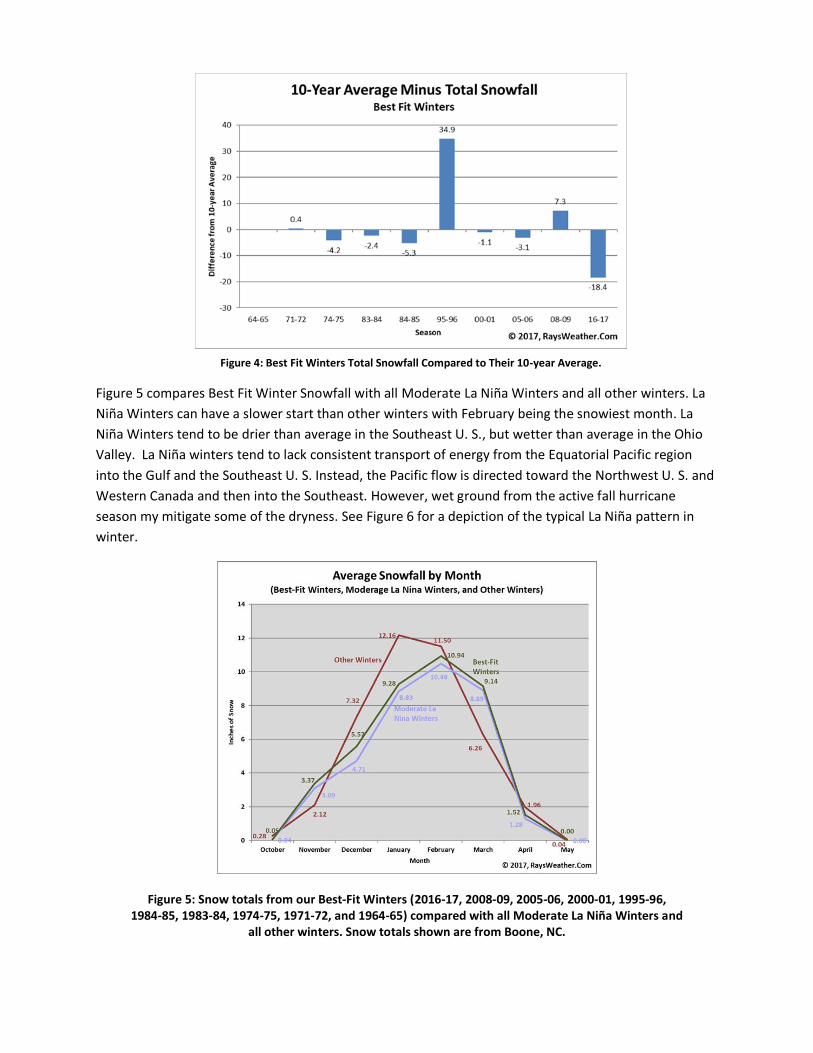
Average total snowfall in the Best Fit Winters in Boone, NC, is 39.9", only slightly less than the long-term
average (40.7”). An analysis of the Best Fit Winters comparing each to the 10-year moving average
shows that most of these winters were near the averages. Figure 4 shows snowfall in Best Fit Winters
relative to their 10-year moving average.
Figure 4: Best Fit Winters Total Snowfall Compared to Their 10-year Average.
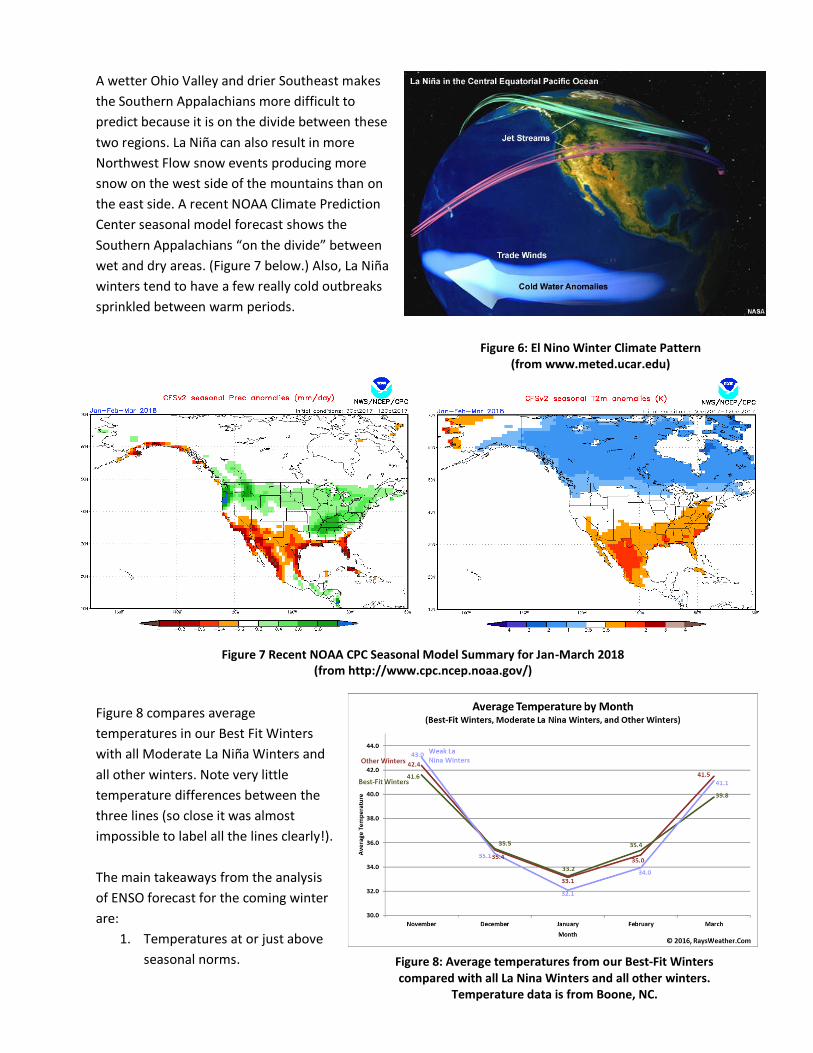
Figure 5 compares Best Fit Winter Snowfall with all Moderate La Niña Winters and all other winters. La
Niña Winters can have a slower start than other winters with February being the snowiest month. La
Niña Winters tend to be drier than average in the Southeast U. S., but wetter than average in the Ohio
Valley. La Niña winters tend to lack consistent transport of energy from the Equatorial Pacific region
into the Gulf and the Southeast U. S. Instead, the Pacific flow is directed toward the Northwest U. S. and
Western Canada and then into the Southeast. However, wet ground from the active fall hurricane
season my mitigate some of the dryness. See Figure 6 for a depiction of the typical La Niña pattern in
winter.
Figure 5: Snow totals from our Best-Fit Winters (2016-17, 2008-09, 2005-06, 2000-01, 1995-96, 1984-85, 1983-84, 1974-75, 1971-72, and 1964-65) compared with all Moderate La Niña Winters and
all other winters. Snow totals shown are from Boone, NC.
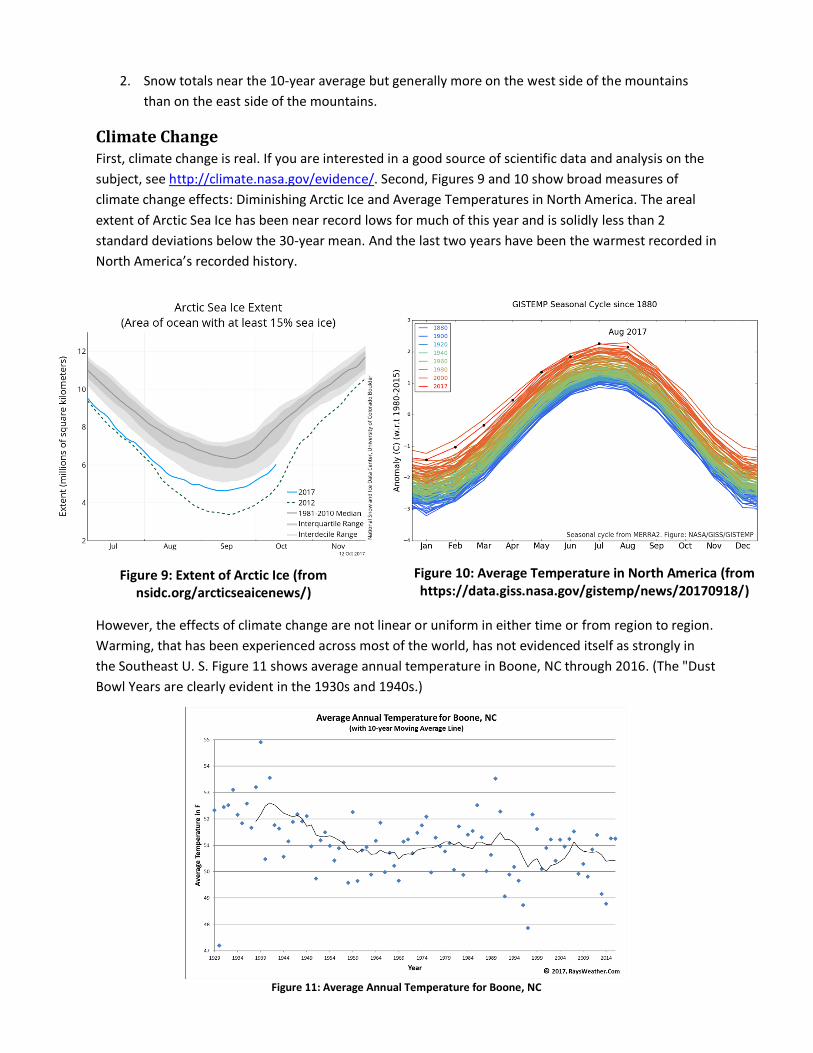
Figure 7 Recent NOAA CPC Seasonal Model Summary for Jan-March 2018 (from http://www.cpc.ncep.noaa.gov/)
A wetter Ohio Valley and drier Southeast makes
the Southern Appalachians more difficult to
predict because it is on the divide between these
two regions. La Niña can also result in more
Northwest Flow snow events producing more
snow on the west side of the mountains than on
the east side. A recent NOAA Climate Prediction
Center seasonal model forecast shows the
Southern Appalachians “on the divide” between
wet and dry areas. (Figure 7 below.) Also, La Niña
winters tend to have a few really cold outbreaks
sprinkled between warm periods.
Figure 8 compares average
temperatures in our Best Fit Winters
with all Moderate La Niña Winters and
all other winters. Note very little
temperature differences between the
three lines (so close it was almost
impossible to label all the lines clearly!).
The main takeaways from the analysis
of ENSO forecast for the coming winter
are:
1. Temperatures at or just above
seasonal norms.
Figure 6: El Nino Winter Climate Pattern (from www.meted.ucar.edu)
Figure 8: Average temperatures from our Best-Fit Winters compared with all La Nina Winters and all other winters.
Temperature data is from Boone, NC.
Figure 11: Average Annual Temperature for Boone, NC
2. Snow totals near the 10-year average but generally more on the west side of the mountains
than on the east side of the mountains.
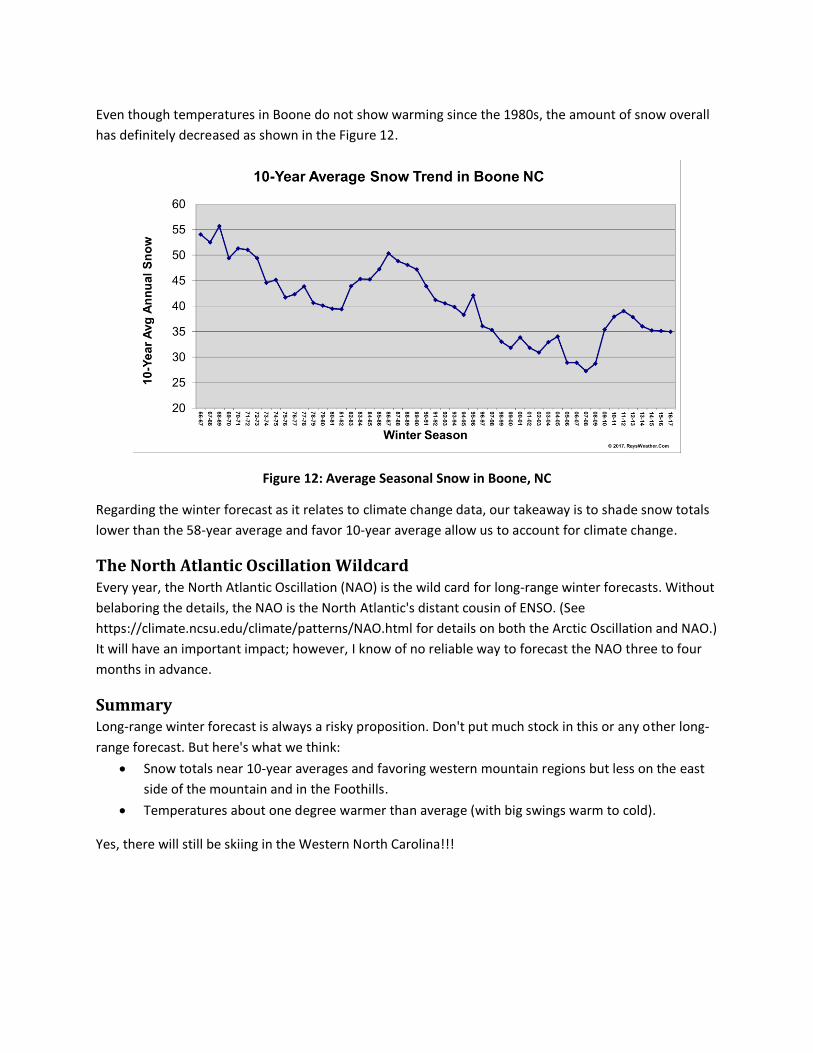
Climate Change First, climate change is real. If you are interested in a good source of scientific data and analysis on the
subject, see http://climate.nasa.gov/evidence/. Second, Figures 9 and 10 show broad measures of
climate change effects: Diminishing Arctic Ice and Average Temperatures in North America. The areal
extent of Arctic Sea Ice has been near record lows for much of this year and is solidly less than 2
standard deviations below the 30-year mean. And the last two years have been the warmest recorded in
North America’s recorded history.
However, the effects of climate change are not linear or uniform in either time or from region to region.
Warming, that has been experienced across most of the world, has not evidenced itself as strongly in
the Southeast U. S. Figure 11 shows average annual temperature in Boone, NC through 2016. (The "Dust
Bowl Years are clearly evident in the 1930s and 1940s.)
Figure 9: Extent of Arctic Ice (from nsidc.org/arcticseaicenews/)
Figure 10: Average Temperature in North America (from https://data.giss.nasa.gov/gistemp/news/20170918/)