Page 1
Senvion (CDAX, Renewables)
FU L L NO T E Published 17.01.2017 07:50 1
A n a l y s t
Arash Roshan Za mir, CFA [email protected]
+49 40 309537-155
Value Indicators: EUR Share data: Description:
DCF: 11.87
Bloomberg: SEN GR
Reuters: SENG
ISIN: LU1377527517
One of the world's leading producers of wind power systems
Market Snapshot: EUR m Shareholders: Risk Profile (WRe): 2016e
Hold
EUR 12.00
Price EUR 11.58
Upside 3.6 %
Market cap: 751
No. of shares (m): 65
EV: 795
Freefloat MC: 198
Ø Trad. Vol. (30d): 622.95 th
Freefloat 26.4 %
Centerbridge/ Rapid Partners 73.6 %
Beta: 1.4
Price / Book: 2.0 x
Equity Ratio: 18 %
2017 - a year to skip; Initiation with Hold
We initiate coverage of Senvion with Hold and a price target of EUR 12.0, implying 3.6% upside to current share price levels. Our cautious view
is based on the following expectations: (1) we estimate a 7% drop in group sales in FY 2017 on the back of disappointing onshore installations
and increased pricing pressure; (2) a decline in the adj. EBITDA margin by 70bps to 8.8% as we expect a decrease on the top line to put
margins under pressure; (3) heavy downward revisions to consensus estimates as the street is currently anticipating flattish growth and stable
margins in FY 2017; (4) We also estimate cumulative FCF generation of a mere EUR 24m between 2016-18, as the company is just at the
beginning of a massive capex cycle to catch up with peers in terms of its product portfolio. (5) Finally, we argue that the eagerly awaited
flagship 3.4M140 turbine could fail to live up to sky-high expectations and thus we are not fully convinced of the commercial success.
Sales to drop by 7% in FY 2017 on weak order intake and pricing pressure: We estimate that onshore installations in FY 2017 will amount
to less than 1,500 MW, a significant drop after 1,745 MW in FY 2015. The situation could be exacerbated by increased pricing pressure (WRe:
EUR 0.97m /MW; -5% p.a.) as Senvion is set to execute projects with rather low price points in FY 2017. We anticipate sales of EUR 2.076m in
FY 2017, a drop of 7% yoy. This, in turn, should put margins under pressure. We are assuming a 70bps drop in the adj. EBITDA margin to
8.8%. This is not reflected in consensus estimates. Our 2017 estimates are 7% and 13% below street expectations with respect to sales and
EBITDA. Looking further ahead to FY 2018, we struggle to see substantial growth above 2016 levels and thus we estimate a sales CAGR of
1.7% p.a. between 2016-18e and a margin which is likely to remain below 2016 levels, too.
Massive capex cycle to burden FCF generation until 2018: Following Senvion’s acquisition by Centerbridge in 2015, the company has
ramped up its long overdue investment in the development of its product portfolio, which has been lagging behind peers, especially when it
comes to a light wind product offering. We estimate cumulative capex investments of EUR 340m until FY 2018 (thereof EUR 150m capitalized
R&D costs). Cumulative FCF generation in the same period is likely to amount to a mere EUR 24m. This marks the beginning of a massive
capex cycle and investors will need to be patient before benefiting from any substantial FCF generation. In our view, this raises the valid
question as to why investors should invest now rather than in two years’ time when Senvion’s investment case is subject to fewer uncertainties.
Valuation – stock is cheap for a reason: We value Senvion based on our DCF model which points to a fair value of EUR 12.0. In terms of
relative valuation, the stock currently trades at a 26% discount to its European WTM peers on FY 2017 EV/ EBITDA, which we regard as the
most appropriate trading multiple. However, the valuation gap to its peers has recently shrunk as the peer group has devalued following
Trump’s election win. Our price target of EUR 12.0, indicates that the current discount to peers is appropriate. With respect to the ongoing
share buyback programme, we do not expect management to exhaust the maximum EUR 75m for the programme and more importantly, we do
not expect it to provide a floor to the share price. This was proven in recent weeks, when roughly 20% of the average daily trading volume
could have been attributed to the buyback programme but the share price continued to tank. We also anticipate a hefty share overhang at a
share price of EUR 15.75 since this would reflect the hurdle when many investors would be “in the money” following the IPO. In addition,
Centerbridge had initially planned to exit a larger portion of its investment via the IPO and thus a reduction in its stake could exert additional
pressure on the shares, leaving limited room for share price gains. We initiate coverage with a Hold rating and a PT of EUR 12.0.
Rel. Performance vs CDAX:
1 month: -9.9 %
6 months: -17.2 %
Year to date: -6.0 %
Trailing 12 months: n/a
Company events:
16.03.17 FY 2016
11.05.17 Q1
31.05.17 AGM
11.08.17 Q2
FY End: 31.12. in EUR m
CAGR (15-18e) 2012 2013 2014 2015 2016e 2017e 2018e
Sales 2.6 % 2,294 1,759 1,922 2,140 2,234 2,076 2,310
Change Sales yoy n.a. -23.3 % 9.3 % 11.3 % 4.4 % -7.1 % 11.3 %
EBITDA adj. 0.6 % 35 125 144 210 212 182 214
Margin 1.5 % 7.1 % 7.5 % 9.8 % 9.5 % 8.8 % 9.3 %
EBIT adj. -2.0 % 48 80 90 154 153 122 145
Margin 2.1 % 4.5 % 4.7 % 7.2 % 6.9 % 5.9 % 6.3 %
EBIT -7 79 70 -85 40 29 104
Net income - -12 5 32 -151 -19 -25 35
EPS - -12.40 4.86 32.10 -28.11 -0.30 -0.40 0.56
DPS - 0.00 0.00 0.00 0.00 0.00 0.00 0.00
FCFPS -28.31 41.65 37.16 50.23 0.54 -0.32 0.14
FCF / Market cap n.a. n.a. n.a. n.a. 4.7 % -2.7 % 1.2 %
EV / Sales n.a. n.a. n.a. n.a. 0.3 x 0.4 x 0.3 x
EV / EBITDA adj. n.a. n.a. n.a. n.a. 3.6 x 4.2 x 3.6 x
EV / EBIT adj. n.a. n.a. n.a. n.a. 4.9 x 6.3 x 5.3 x
P / E n.a. n.a. n.a. n.a. n.a. n.a. 20.7 x
P / E adj. n.a. n.a. n.a. n.a. n.a. n.a. 20.7 x
Net Debt (Cash) -3 -3 -3 -3 -11 27 18
ROCE (NOPAT) n.a. 14.7 % 13.7 % n.a. 8.7 % 6.5 % 22.8 % Guidance: FY 2016: sales of EUR 2.25-2.30bn; adj. EBITDA margin of c. 9.5%
Page 2
Senvion
FU L L NO T E Published 17.01.2017 2
Sales development in EUR m
Source: Warburg Research
Onshore Sales by regions 2015; in %
Source: Warburg Research
Gross profit development in EUR m
Source: Warburg Research
Company Background
� Senvion is a leading global developer and manufacturer of onshore and offshore wind turbine generators, headquartered in Hamburg,
Germany.
� The company is operating in twenty countries with approx. 13.7 GW of cumulative installed capacity worldwide as of December 31,
2015.
� Senvion holds a strong competitive position in its core markets of Germany, the United Kingdom, France, Australia and Canada.
Competitive Quality
� Senvion develops, manufactures, assembles, installs and markets a competitive range of technologically advanced wind turbines with
rated ouputs ranging from 2 to 6.2 MW and rotor diameters ranging from 82 to 152 meters.
� Senvion's product portfolio therefore covers almost all wind classes in both onshore and offshore markets.
� Besides the assembly business, Senvion also covers other areas of the value chain such as service and maintenance.
� The company's customer structure includes seven of the top twelve global wind utility companies (excl. Chinese participants) such as
RWE, EDF, Vattenfall and Enel
� Senvion also counts large-scale wind farm developers and leading independent producers of renewable power projects among its
customers.
Adj. EBITDA development in EUR m
Source: Warburg Research
Sales by segments 2015; in %
Source: Warburg Research
Adj. EBIT development in EUR m
Source: Warburg Research
Page 3
Senvion
FU L L NO T E Published 17.01.2017 3
Summary of Investment Case 5
Company Overview 6
Market Overview 7
Sluggish growth expected in core markets 7
German onshore market volume to shrink notably 8
New EEG 2017 law to cap new installation additions at 2.8GW 8
New onshore wind installations set to shift to southern Germany 10
Introduction of auction system to result in 16% drop in FITs in FY 2017 12
UK government turns its back on onshore wind 14
French market to provide a ray of hope 15
Canada to normalise at solid levels of roughly 1 GW p.a. 16
Expansion to new markets under pressure to pay off 16
Installations in new markets to exceed 400 MW in FY 2017 – if there is no further delay of major Chile order 17
Installations in core markets to drop to a mere 874 MW in FY 2019 – new markets unlikely to fully offset the slump 18
Products 20
Product portfolio might fail to impress 20
Fierce competition looming for the most efficient light wind turbine 20
Enercon’s E-141 turbine boasts superior characteristics to Senvion’s upcoming flagship turbine 23
Offshore product portfolio could fall behind 24
Average offshore turbine capacity to increase to 6-8 MW by 2018 26
Lack of competitiveness in offshore is looming by 2019 27
Financials 28
Top-line growth in FY 2017 is rather unlikely 28
Expected sales development 28
Slump in order intake in FY 2016M. 29
Mhas resulted in a shrinking order backlog 30
Conditional order book has been growing but c. EUR 480m at risk 30
Service sales expected to grow at double-digit rates in the mid term 31
Lack of volume growth and pricing pressure to put margins under pressure 32
Consensus estimates look too upbeat for FY 2017 33
Capex cycle to remain at peak levels until FY 2018 35
Strong working capital ratio leaves little room for improvement 35
Total capex spend to amount to EUR 340m until FY 2018 36
Healthy balance sheet but redemption of high yield bond should be top priority38
Share Price Development 41
Recent development supported by share buybacks 41
Share buyback programme unlikely to drive share price going forward 46
Poor share price development reflects industry weakness but not necessarily company-specific issues yet 46
Page 4
Senvion
FU L L NO T E Publ ished 17 .01 .2017 4
Valuation 48
Absolute valuation 48
DCF model 48
Relative valuation 50
Company History 51
Onshore business 51
Offshore business 51
Services 52
Management 53
Management Board of Senvion 53
Dr. Jürgen M. Geißinger, CEO 53
Manav Sharma, CFO 53
Supervisory Board of Senvion 53
Stefan Kowski 53
Page 5
Senvion
FU L L NO T E Published 17.01.2017 5
Summary of Investment Case
Investment triggers
� Total onshore installations are set to slump to below 1,500 MW in FY 2017– a stark drop from 1,744 MW in FY 2015. This can be
attributed to very weak order intake from core markets in FY 2016 (EUR 1,304m; -41% yoy), in particular from Germany where
Senvion is set to hold a market share of less than 10% in FY 2016 & 2017 due to a lack of product offering for low wind sites.
� We also anticipate heavy pricing pressure and therefore assume an average price of a mere EUR 0.97m/MW (-5% yoy) for
onshore wind in FY 2017 (in FY 2015: EUR 1.033m/MW) based on the company’s entry to new markets such as Chile, Mexico,
Peru, Scandinavia and Uruguay where we assume lower price points. Senvion’s recent order wins in the so called “new markets” (411
MW in Chile and Norway) come with an average price of EUR 0.83m /MW which potentially provides a glimpse of upcoming prices.
� Consequently, group revenues are expected to decline by 7% yoy to EUR 2,076m in FY 2017 which should put margins under
pressure. We assume a 70bps drop in the adj. EBITDA margin to 8.8% in FY 2017.
� In terms of free cash flow generation, we estimate cumulative FCF generation of a mere EUR 24m between FY 2016-18 as the
company is poised to invest c. EUR 340m until 2018 after many years of restrained investment under the ownership of cash-strapped
Suzlon. This, however, implies that Senvion is at the beginning of a massive capex cycle and raises the valid question as to why
investors should invest now rather than in two years’ time.
Valuation
� We value Senvion based on our DCF model, which points to a fair value of EUR 12.0. This value is based on a detailed planning
horizon until 2019, a transition period until 2028 and our derived terminal value. Following the detailed planning period, we assume
peak sales growth of 3% p.a. with a steady decline to a sustainable growth rate of 1.5% p.a. in perpetuity. We also assume a
peak EBIT margin (after PPA and one-offs) of 6.3% and a long-term sustainable EBIT margin of 4.5% for our terminal growth
assumption (exp. reported EBIT margin in FY 2016: 1.8%). Finally, we use a WACC of 8.5% to discount the estimated cash flows.
� Our relative valuation indicates a 26% discount to the peer group on FY 2017 EV/EBITDA multiples. However, we deem the
current discount to peers as appropriate for the following reasons: Firstly, we expect heavy downward revisions to FY 2017
consensus estimates. Secondly, a lack of free cash flow generation between FY 2016-2018 as well as a lack of track record when it
comes to the company’s strategic shift towards new markets are grounds for the current valuation discount to peers.
� Since Senvion is currently in private equity ownership (Centerbridge holds a 73.6% stake in Senvion), we fear that the owners might
seek to continue their (partial) exit from their investment in Senvion, exerting considerable pressure on the share price. In addition,
we see significant risk of a share overhang at EUR 16/ share, the hurdle when many investors would be “in the money”.
Growth
� We estimate sales CAGR FY 2016-18e of 1.7% p.a.
� Forecast for FY 2017: -7% owing to a drop in onshore installations and 5% price pressure with entry to emerging markets and
introduction of auction system.
Competitive positioning
� Senvion currently lacks a competitive light wind turbine which could result in significant market share losses in Germany until 2018, in
our view. Senvion is scheduled to launch its flagship light wind turbine, the 3.4M140 EBC at the end of 2017 at the earliest, although it
was already presented to the market in 2015. Meanwhile competitors, such as Enercon and Nordex, are expected to have new
product offerings in the market by 2018. Therefore, Senvion’s 3.4M140 won’t be the only show in town by 2018 and while the
3.4M140 was state of the art when it was unveiled in 2015, we are not fully convinced of its commercial success in 2018.
� In the offshore space, Senvion still benefits from its strong positioning in the 5 MW+ turbine class. As the company is currently
executing a 443 MW offshore order, comprising 72 6.2MW WTGs, the company’s offshore production capacity should be fully utilised
until 2018. We, however, fear that Senvion could miss out on new offshore orders from 2019 onwards without a new 8 MW turbine.
Warburg versus consensus
� Our FY 2017 sales estimate of EUR 2,076m stands some 7% below consensus expectations.
� Consequently, our FY 2017 adj. EBITDA estimate of EUR 182m stands 13% below consensus expectations. We assume a 70bps
decline in the adj. EBITDA margin to 8.8% as we fear that a drop on the top line would put margins under pressure.
� Our FY 2018 sales and adj. EBITDA estimates are 1% and 6% below consensus, respectively
Page 6
Senvion
FU L L NO T E Publ ished 17 .01 .2017 6
Company Overview
Onshore wind turbines Offshore wind turbines Services
Turbines: 3.4M140; 3.4M104 Turbines: 6.2M152, 6.2M126 Installation and commissioning
3.4M114; 3.2M122; 3.0M122; MM92 Rated power: 6.15 MW Logistic services (transportation)
Rated power: 2.0 - 3.4 MW Hub heights (m): 97-124; 95-117 Integrated services
Hub heights (m): 59 -143 Wind class: IEC 1 Operation & Maintenance (O&M)
▪ Enercon ▪ Siemens ▪ Siemens
▪ Vestas ▪ Adwen ▪ Nordex
▪ Nordex ▪ MHI Vestas ▪ Enercon
▪ GE ▪ BARD ▪ Vestas
▪ Siemens ▪ Vensys
▪ Vensys
% of total 84.3% 4.7% 11.0%
Adj. EBITDA CY 15
in EUR m
Margin in %
Adj. EBIT CY 15
in EUR m
Margin in %
Product offering
Customers
9.70%
7.60%
154
Group sales split by
business segments /
onshore sales split by
regions (2015)
Segments
Competitors
Sales CY 15 (EUR m) 1,801 99 233
approx. 74% approx. 13% approx. 13%Share recuring
210
Germany42.3%
Australia3.4%
Canada14.1%
France8.0%
UK13.3%
Other18.9%
Onshore revenue by region Onshore
84.2%
Offshore4.6%
Services10.9%
Other0.3%
Revenue by business
Source: Warburg Research
Page 7
Senvion
FU L L NO T E Publ ished 17 .01 .2017 7
Market Overview
� Senvion’s core markets to suffer from anaemic growth
� Unfavourable regulatory changes to result in significantly lower capacity additions in
Germany and the UK.
� German onshore market volume to slump by roughly 20% by 2019 (compared to FY
2016/17 levels).
� In addition, FITs in Germany are set to decline by 16.5% in FY 2017, increasing
pressure on WTMs to reduce cost of energy
� UK onshore wind market is set to decline dramatically by FY 2018
� Geographic expansion to new markets to almost double addressable market size by
8.5 GW from previously c. 9 GW.
� However, onshore installations in core markets (incl. Canada, Australia and Other) set
to drop to 874MW in FY 2019 (from 1,629 MW in FY 2016e) – entry to new markets
unlikely to fully offset the slump.
Sluggish growth in core markets
Sluggish growth expected in core markets
In this section we take a detailed look at Senvion’s “core” onshore markets. In the past,
Senvion benefited from its strong footprint in various European markets such as
Germany, UK, and France. Consequently, these markets contributed roughly 65% to FY
2015 group sales.
Market share of WTMs in EMEA (2015)
Vestas 24.3%
Enercon 16.8%
Siemens 16.7%
Senvion 11.7%
Nordex 9.6%
GE 6.3%
Others 14.6%
Source: Senvion, Warburg Research
However, our analysis on a country-by-country basis has led us to the conclusion that
Senvion’s traditional markets are unlikely to provide a source of growth going forward.
More importantly, as market volumes are expected to shift from Europe to developing
countries, the German turbine manufacturer needs to position itself in those markets and
compete with established peers in those regions.
Page 8
Senvion
FU L L NO T E Publ ished 17 .01 .2017 8
German onshore market volume to shrink notably
In FY 2015 Senvion generated roughly 42% of its onshore revenues in Germany (EUR
762m). Thus, the domestic market is of particular importance to the German turbine
manufacturer. Thanks to its strong footprint in the German wind market, Senvion raised
its market share in FY 2015 by 340bps from 14.6% to 18%, ranking it the number three
OEM turbine supplier in Germany in 2015.
Market share of turbine suppliers in Germany in 2015
Enercon37.3%
Vestas21.3%
Senvion18.0%
Nordex11.8%
Siemens1.7%
GE7.3%
Vensys1.1%
e.n.o. energy0.0%
Others1.6%
Source: DEWI, Warburg Research
Going forward, it will be important to defend this market position as the total market size
for onshore wind is set to shrink quite dramatically.
In 2015, annual onshore wind installations in Germany amounted to 3,730 MW. The
German market therefore represented the largest wind market in Europe by far, followed
by Poland (1,266 MW) and France (1,073 MW). The UK also represented a rather
important onshore wind market in Europe in 2015 with around 650 MW of new capacity.
However, the British onshore wind market is no longer of meaningful size since the
ending of new onshore subsidies with the closure of Renewable Obligation (RO) to all
capacities of onshore wind in the UK in April/May 2016.
New EEG 2017 law to cap new installation additions at 2.8GW
In July 2016, the German government passed the latest amendment to its renewable
energy laws. The new renewable energy act (“EEG 2017”) is set to introduce an auction
system for new onshore wind capacities. The current subsidy regime of guaranteed feed-
in tariffs (FITs) will no longer apply from January 1, 2017. The new, market-based
subsidy scheme is expected to put additional downward pressure on subsidy rates.
In addition to an anticipated heavy reduction in feed-in tariffs, new onshore wind capacity
will be limited to 2.8 GW p.a. from 2017 onwards. Three auctions are already scheduled
for FY 2107 which should result in a total tendered volume of 2,800 MW.
Page 9
Senvion
FU L L NO T E Publ ished 17 .01 .2017 9
Scheduled onshore wind auctions in Germany in 2017/18
800
1000 1000
700 700 700 700
0
200
400
600
800
1000
1200
May 2017 Aug 2017 Nov 2017 Feb 2018 May 2018 Aug 18 Nov 18in
MW
Scheduled tender volumes in 2017/18
Source: Warburg Research
Clearly, the German onshore market is on track to level off at a size of 2,800 MW p.a.
However, in the meantime, wind farm projects which had received planning permission
by December 31, 2016, were given 24 months to complete their projects and install their
turbines. Thus, for the years of 2017 and 2018 we might experience new onshore wind
installation higher than the tendered 2,800 MW thanks to spill-over effects from the
expired EEG 2014.
Thus, new installation figures in FY 2017 won’t immediately drop to 2,800 MW but should
come in at 3,000-3,500 MW. A big question mark remains, however, over the size of the
onshore market in FY 2018. Bloomberg New Energy Finance expects sluggish new
installation figures in 2018 based on a sharp drop in feed-in tariffs.
Projection of new onshore wind installations in Germany by BNEF
1,443
1,899
2,359
2,998
4,438
3,7303,978
3,100
2,6002,200 2,300
0
500
1000
1500
2000
2500
3000
3500
4000
4500
5000
2010 2011 2012 2013 2014 2015 2016e 2017e 2018e 2019e 2020e
in M
W
New onshore wind installations in Germany (historical & projection)
Source: Bloomberg New Energy Finance, Warburg Research
According to MAKE Consulting, which specialises in the global wind energy industry, the
German onshore market is set to experience strong growth through 2018 on the back of
significant spill-over effects from the current project pipeline. MAKE anticipates new
capacity of 3,600 MW to come online in FY 2018.
Page 10
Senvion
FU L L NO T E Publ ished 17 .01 .2017 10
However, we remain sceptical and assume new installations of roughly 3,000 MW in
2018 (assuming some 200 MW of projects remaining under the old EEG 2014, to
materialise 12 to 24 months after receiving planning permission in 2016).
For FY 2019, we assume new capacity of 2,800 MW, in line with the onshore wind
capacity target of the German administration. This implies a decline of roughly 20%
compared to average annual capacity additions between 2014 and 2018.
Projection of new onshore wind installations in Germany by MAKE
3,7724,000
3,750 3,600
2,800
0
500
1000
1500
2000
2500
3000
3500
4000
4500
2015 2016e 2017e 2018e 2019e
in M
W
New onshore wind installation projection by MAKE
Source: MAKE Consulting, Nordex, Warburg Research
New onshore wind installations set to shift to southern Germany
As part of the new renewable energy act, EEG 2017, new onshore wind installations in
the northern German states of Lower Saxony, Schleswig Holstein and Mecklenburg
Western Pomerania are set to be limited to 58% of the average new installation of the
last three years. This is because wind energy installations have strained grid capacities,
especially in northern Germany in recent years. Under the new EEG 2017, certain parts
of the grid will be strengthened and extended to ensure sufficient grid capacity for the
future expansion of renewable energies in Germany. New installations in “grid extension
areas” (“Netzausbaugebiete”) are thus expected to be capped at roughly 900MW p.a.
Page 11
Senvion
FU L L NO T E Publ ished 17 .01 .2017 11
New onshore wind installation in Germany by federal states
0
1000
2000
3000
4000
5000
6000
7000
8000
9000
Low
er
Sa
xo
ny
Bra
nd
en
bu
rg
Sa
xo
ny-A
nh
alt
Schle
sw
ig-H
.
No
rth R
hin
e-W
estp
.
Me
ckle
nb
urg
-W.P
Rh
ine
lan
d-P
.
Ba
va
ria
Sa
xo
ny
Th
uri
ngia
He
sse
n
Ba
de
n-W
ue
rtte
mb
.
Sa
arl
an
d
Bre
me
n
Ha
mb
urg
Be
rlin
in M
W
Cumulative date (as of 21.12.2010) Net new installation in 2011
Net new installation in 2012 Net new installation in 2013
Source: DEWI, Warburg Research
The northern states of Lower Saxony, Schleswig Holstein and Mecklenburg Western
Pomerania assumed a leading role in the promotion of wind energy in Germany in recent
years. According to our calculations, roughly 1,482 MW of onshore wind capacity was
added in these federal states between 2013 and 2015. The new regulation is set to
restrict annual capacity additions to approx. 900 MW (58% of three-year historical
average).
Wind installation in grid extension areas limited to 58% of hist. average
424246
754
437
304
176
0
200
400
600
800
1000
1200
1400
1600
Average over the last 3 years New installation is limited to 58% ofthe average over the last 3 years
(expected)
in M
W
Lower Saxony Schleswig-H. Mecklenburg-W. P.
Source: DEWI, Warburg Research
Page 12
Senvion
FU L L NO T E Publ ished 17 .01 .2017 12
Clearly, this should result in additional growth in installation figures in southern Germany.
This, in turn, should drive demand for light wind turbines since those regions are
predominantly characterised by low wind sites.
Classification of wind zones in Germany according to IEC
Source: Bloomberg New Energy Finance, Warburg Research
Introduction of auction system to result in 16% drop in FITs in FY 2017
In addition to the expected drop in market volume, the German onshore market is also
likely to undergo heavy cuts in subsidy rates. As mentioned above, the switch from the
current subsidy regime to an auction system is set to reinforce downward pressure on
tariffs.
Going forward, only the lowest bids offered by project developers will be successful until
the targeted tender volume is reached. Three tender rounds scheduled for 2017 and the
maximum bid for the first round in May 2017 has been set at EUR 7.0 cts./kWh. This
already implies a drop of 16.5% compared to the expected feed-in tariff in January 2017
of EUR 8.38 cents/kWh.
We regard this as a clear negative for the wind energy industry as a whole in Germany
but in particular for turbine suppliers as WTMs are now expected to feel the heat when it
Page 13
Senvion
FU L L NO T E Publ ished 17 .01 .2017 13
comes to pricing.
Development of German onshore wind tariffs in 2016 under EEG 2014
FIT tariff degression
Q1 2016 8.79 Cent/ kWh 1.20%
Q2 2016 8.69 Cent/ kWh 1.20%
Q3 2016 8.58 Cent/ kWh 1.20%
Q4 2016 8.48 Cent/ kWh 1.20%
Q1 2017e 8.38 Cent/ kWh 1.20%
Source: Bloomberg New Energy Finance, Warburg Research
The chart below illustrates the expected development of tariffs under the old EEG 2014
regime as well as under the new EEG 2017 auction system. Projects which qualified
under the old EEG 2014 will see their FITs declining from EUR 8.38 Cents/kWh at the
beginning of the year to EUR 7.68 Cents/kWh in Q4 2017 (assuming a tariff degression
of 2.4% in the last quarter), a drop of 8.35% within a couple of months.
However, compared to the EEG 2017 subsidy regime, a mere drop of 8.35% in FITs still
looks very bearable. The new renewable energy act will precipitate a slump in FITs by at
least 16% to EUR 7 Cents/kWh.
Consequently, to ensure they can make a competitive bid, project developers are likely
to rush for the most efficient turbines with the lowest cost of energy. Turbine suppliers
with less efficient turbines are likely to lose out.
Thus, in addition to fiercer pricing pressure, competitive pressure among turbine
manufacturers is likely to intensify. Senvion’s product portfolio is therefore of paramount
importance to ensure onshore order wins in Germany going forward. We will elaborate
on Senvion’s turbine portfolio in the next section.
Expected development of FITs under EEG 2014/2017 in Germany in 2017
7.87 7.68
6.00
6.50
7.00
7.50
8.00
8.50
9.00
Jan Feb Mar Apr May Jun Jul Aug Sep Oct
ct/
kW
FIT under EEG 2014 FIT under EEG 2017
additonal 1.05% tariff
degression to kick-in in
March 2017
Source: Warburg Research
Page 14
Senvion
FU L L NO T E Publ ished 17 .01 .2017 14
UK government turns its back on onshore wind
In 2015, Senvion installed 275 MW of wind capacity in the UK. Consequently, revenues
from the UK represented roughly 13% of onshore sales in FY 2015, the third-largest
onshore market for Senvion.
Taking into consideration that the total UK onshore market amounted to roughly 650 MW
in 2015, Senvion achieved a whopping 42% market share.
However, as already mentioned, the UK government brought forward the closure of the
Renewables Obligation (RO) certificate scheme to onshore wind by one year to April
2016 (ROs represent an obligation for electricity suppliers to source a certain portion of
electricity from renewable sources). Thus, the British administration has more or less
withdrawn its financial support for onshore wind projects.
Broadly speaking, the Contract for Difference (CfD) scheme has replaced the RO for
new solar and wind projects. The CfD scheme, guarantees a set price for the electricity
produced – the so called strike price. However, the government has delayed decisions
on future CfD auctions and there is currently zero visibility with respect to if and when the
next CfD auction round for onshore wind will take place and how much the government
is ready to commit for the promotion of this technology. There is also the wide belief that
onshore wind will not be eligible for future CfD auctions at all.
Cumulative onshore wind capacity in the UK currently stands at 8.5 GW. According to
various sources (such as RenewableUK), there is still an estimated 2 GW of onshore
projects in the pipeline, which are either under construction or are sufficiently advanced
to go ahead.
Nonetheless, once the execution of these projects is concluded, we fear the sector will
grind to a halt in 2018, as can be seen from the current capacity forecast by BNEF.
UK onshore wind market to shrink
607542
1,165
1,540
779650
1,432
997
360 366
180
0
200
400
600
800
1000
1200
1400
1600
1800
2010 2011 2012 2013 2014 2015 2016e 2017e 2018e 2019e 2020e
in M
W
New annual onshore wind capacity
Source: BNEF, Warburg Research
Page 15
Senvion
FU L L NO T E Publ ished 17 .01 .2017 15
To sum up, we believe the UK market is highly unlikely to be a growth driver for
Senvion’s onshore sales in 2018 or beyond. As long as the current UK government
remains reluctant to change its view on solar and onshore wind, the UK market is likely
to be negligible.
French market to provide a ray of hope
The French onshore wind market was ranked number three in Europe with 1,073 MW of
new capacity in FY 2015. For Senvion, the French market represented the fourth-largest
onshore market in 2015 with total sales of EUR 144m (8% of onshore sales).
Furthermore, Senvion benefits from its strong positioning in France with a market share
of roughly 19% in terms of cumulative installed capacity.
More importantly, we expect the French wind market to represent an important source of
growth going forward. The French administration has pledged to double onshore wind
capacity until 2023, which represents a much needed signal to the sector that the
country is committed to promoting onshore wind.
At the end of 2015, cumulative capacity stood at 10.3 GW. The administration has set its
targets at 15 GW and 21.8 GW of operating capacity by 2018 and 2023, respectively.
To reach 15 GW of capacity, installations of over 1.5 GW p.a. are required in France,
higher than anything that has been achieved before. This is not yet anticipated by
sources such as BNEF. Nonetheless, the French market is at least expected to remain
rock solid in the coming years.
Onshore wind to thrive in France
1,190
928821
632
1,042 1,0731,168
1,1061,050
1,150 1,150
0
200
400
600
800
1000
1200
1400
2010 2011 2012 2013 2014 2015 2016e 2017e 2018e 2019e 2020e
in M
W
New annual onshore capacity
Source: BNEF, Warburg Research
As most of the new available sites in France are light wind areas, these turbine models
should be in high demand in FY 2017/18.
Page 16
Senvion
FU L L NO T E Publ ished 17 .01 .2017 16
Canada to normalise at solid levels of roughly 1 GW p.a.
In addition to the European markets, Senvion also benefits from a solid competitive
positioning in Canada. In FY 2015, the German turbine manufacturer installed 262 MW
in Canada, reaching the number 2 position in the Canadian market, behind Siemens,
and a market share of more than 17%.
In 2015, around 1,506 MW of new wind energy capacity was added, the third-biggest
year ever for Canada. In terms of cumulative capacity, Canada has a total of 11,205 MW
wind capacity installed. However, after three strong years with net capacity additions of
more than 1.5 GW p.a., installation figures are set to normalise in the coming two years.
For FY 2016, for instance, we estimate new onshore installations of 1,100 MW, broadly
in line with forecasts by BNEF (1,193 MW) and MAKE (1,080 MW).
According to the Canadian Wind Energy Association, there are more than 2,000 MW of
contracted projects in the pipeline which are expected to come online in the next two
years. Consequently, we estimate that Senvion is well positioned to install approx. 200
MW of wind capacity in Canada in the coming years. Thus, for Senvion, the Canadian
market represents one of the few core markets, which is not expected to shrink notably.
Expansion to new markets under pressure to pay off
As Senvion’s core markets are expected to shrink or to stagnate at best, Senvion’s new
strategy to move into new markets is absolutely comprehensible
However, this new strategy comes with significant uncertainties. Under Suzlon’s
ownership, Senvion was not allowed to supply markets outside of Europe (except for
Australia and Canada) and thus the company does not have a track record in its new
markets. Furthermore, it is lagging behind peers in terms of expansion into emerging
markets. Many European rivals have already secured a strong foothold in many of the
emerging markets targeted by Senvion. Consequently, we anticipate intense competition
in these markets.
To compensate for lacklustre growth in its core markets, Senvion is targeting the
following new markets: Chile, Peru, Uruguay as well as India, Turkey, Mexico,
Scandinavia, Ireland and Japan.
These markets were selected according to detailed criteria, such as:
1. Evaluating if Senvion’s products fit local demand
2. Ensuring that successful market entry does not require sizeable local capex (i.e.
no need to fulfil local content requirements to win an order)
3. Capitalizing on existing relationships with key customers and follow them as
they enter new markets
Based on market data from MAKE Consulting, we estimate that new market entry will
almost double Senvion’s addressable market by some 8.5 GW from c. 9 GW previously.
Page 17
Senvion
FU L L NO T E Publ ished 17 .01 .2017 17
Rather than examining the attractiveness of each of the targeted new markets based on
market size and market growth, we take a bottom-up approach and elaborate on the
company’s secured (conditional) orders to derive our assumptions for Senvion’s
expected installations in those markets.
Installations in new markets to exceed 400 MW in FY 2017 – if there is no further delay of major Chile order
So far, Senvion has achieved some early success with its expansion strategy as it
managed to secure 417 MW of firm and conditional orders from new markets for
execution in FY 2017 (thereof 300 MW conditional order from Chile and 111 MW firm
order from Norway).
Thus, in our market model, we currently forecast 417 MW of installations from new
markets in FY 2017, implying a solid total market share of 5% in those markets.
However, we don’t expect this to fully offset declining installation numbers in core
markets such as Germany and the UK and thus we forecast a decline in onshore
installations to 1,494 MW in FY 2017, a drop of 8% yoy. More importantly, the 300 MW
Chile order from Mainstream Renewable Power is not yet a firm order. Hence, if the
delay continues (conditional order was signed in April 2016), it could jeopardise our
assumption that Senvion is set to install 417MW of orders from the new markets in FY
2017.
Looking ahead to FY 2018, we estimate 500 MW of installations from new markets,
another significant increase compared to our estimate of 417 MW for FY 2017. Our
assumption is mainly supported by the company’s first firm framework agreement in
India to supply 220 Senvion turbines with a total nominal capacity of more than 500 MW
between Q4 2017 and FY 2019. For the sake of simplicity, we assume that Senvion is
set to execute roughly 250MW of the framework agreement in each year. In addition,
Senvion has more than 250MW of conditional orders in Scandinavia on hand. Should
Senvion manage to convert a large portion of these conditional orders into firm orders in
the course of FY 2017, our forecast for FY 2018 would be within reach. Finally, Senvion
also concluded a conditional supply order for 42 MW in Serbia, which can also be
regarded as one of Senvion’s “new markets”. The installation of the 21 turbines with a
rated output of 2MW is expected to take place in autumn 2018. Hence, there is good
reason to believe that Senvion is on track to achieve a total installation of 500MW in new
markets in FY 2018.
Clearly, visibility is much lower for FY 2019 but we nonetheless estimate installations
from new markets to increase further to 600 MW in total. Again the framework order in
India would constitute the basis of our assumption. Our assumption of total installations
of 600 MW in FY 2019, would imply a market share of 8% for Senvion in those markets.
We are currently assuming that Senvion’s move into new markets will ultimately prove to
be successful. However, we do not expect Senvion’s onshore installation figures to grow
noticeably in the period until FY 2019, except for the expected increase in installations in
2018 (thanks to a major 300 MW order from Australia) after a significant drop in 2017.
Page 18
Senvion
FU L L NO T E Publ ished 17 .01 .2017 18
(Please see next page for a summary of our main assumptions for market growth)
Installations in core markets to drop to a mere 874 MW in FY 2019 – new markets unlikely to fully offset the slump
We expect Senvion’s installations in core markets (including Canada, Australia and
Others) to drop from 1,629 MW in FY 2016 to 874 MW, mainly due to a shrinking market
volume in many of Senvion’s core markets (such as UK and Germany) but also due to
Senvion’s less competitive product portfolio when it comes to a light wind product
offering (see next section for Senvion’s product offering).
The company’s move into new markets is expected to add some 600MW of installations
in FY 2019, according our market model. However, this is unlikely to offset the drop in
installations in core markets. Consequently, we are forecasting a drop in onshore
installations to 1,474 MW in FY 2019. To fully compensate for the drop in installations in
the core markets, installations in Senvion’s new markets would have to surge to 1,000
MW in 2019. This, however, would imply a market share of 12.7% for Senvion in those
markets, which seems over optimistic. Hence, from the current point of view, we do not
expect Senvion’s entry to new markets to fully offset the slump in the core markets.
Page 19
Senvion
FU L L NO T E Publ ished 17 .01 .2017 19
Warburg Research onshore market growth assumptions
Annual volume (MW) 2015 2016e 2017e 2018e 2019e
Germany
MAKE 3,772 4,000 3,750 3,600 2,200
BNEF 3,730 3,978 3,100 2,600 2,200
WRe 3,730 4,000 3,750 3,000 2,600
UK
MAKE 679 1,672 778 722 356
BNEF 650 1,432 997 360 366
WRe 650 1,250 750 300 150
France
MAKE 1,088 1,100 1,100 1,200 800
BNEF 1,073 1,168 1,106 1,050 1,150
WRe 1,073 1,100 1,100 1,200 1,100
Canada
MAKE 1,443 1,080 1,000 1,250 1,100
BNEF 1,600 1,193 1,547 1,474 774
WRe 1,506 1,100 1,300 1,400 1,000
Australia
MAKE 267 45 515 600 700
BNEF 273 126 342 1,789 1,316
WRe 380 75 400 700 600
Others* 2,911 1,675 1,735 1,915 2,010
New markets** 6,336 8,567 8,566 7,593 7,852
Addressable market 16,586 17,767 17,601 16,108 15,312
Market share - Senvion
Germany 17.9% 10% 9% 14% 14%
UK 42.3% 36% 20% 10% 0%
France 14.3% 17% 17% 12% 12%
Canada 17.4% 19% 11% 13% 13%
Australia 4.2% 0% 8% 43% 0%
Others* 12.8% 24% 12% 16% 12%
New markets** 0.0% 0% 5% 7% 8%
Installation 2015 2016e 2017e 2018e 2019e
Germany 666 390 350 420 364
UK 275 445 150 30 0
France 153 185 187 144 132
Canada 262 209 145 182 130
Australia 16 0 30 300 0
Others* 372 400 215 300 248
New markets** 0 0 417 500 600
Total onshore installations 1,744 1,629 1,494 1,876 1,474
-6.6% -8.3% 25.6% -21.4%
Offshore installations 0 200 220 170 150
Total installation (onshore+offshore) 1,744 1,829 1,714 2,046 1,624
4.9% -6.3% 19.4% -20.6%
* includes Austria, Belgium, Netherlands, Poland, Romania, Italy, Portugal, Spain
** includes Chile, Mexico, Peru, Uruguay, Finland, Norway, Sweden, Turkey, India, Japan
Source: BNEF, MAKE Consulting Q3 2015 forecast, Warburg Research
Page 20
Senvion
FU L L NO T E Published 17.01.2017 20
Products
� Launch of Senvion’s very first low wind turbine (3.4M140) is scheduled for the end of
2017.
� For onshore, hopes rest on the successful launch of the new low wind product, the
3.4M140 WTG to reverse expected market share losses in Germany.
� Other players such as Enercon and Nordex, however, are expected to have a
similarly competitive light wind product offering by 2018.
� In offshore, Senvion currently benefits from its first-mover advantage in the class of 5
MW-plus turbines.
� However, Senvion’s offshore technology risks becoming outdated by 2018. New
investments in a new offshore turbine platform are inevitable, if the company is to
continue to offer a competitive product platform.
Launch of flagship light wind turbine might come too late
Product portfolio might fail to impress
Fierce competition looming for the most efficient light wind turbine
Senvion’s product portfolio covers a broad range of onshore and offshore turbines with a
rated power output from 2 to 6.15 MW and rotor diameters ranging from 82 to 152
metres, as can be seen from the table below.
In onshore, the company is best known for its high to medium wind speed turbines. For
instance, the MM92 model with a nominal power capacity of 2.05 MW, which was
launched in 2005, is specifically designed for medium wind sites and represents
Senvion’s top-selling WTG model to date.
With respect to offshore, the company claims the number one position when it comes to
the 5 MW-plus segment, with a market share of over 50% of commissioned offshore
projects in Europe.
Page 21
Senvion
FU L L NO T E Publ ished 17 .01 .2017 21
Senvion’s product range at a glance
Turbine Rated power Hub height Wind
type (MW) (m) class
Offshore 6.2M152 6.15 97-124 IEC 1
turbines 6.2M126 6.15 95-117 IEC 1
3.4M140 EBC 3.40 110-130 IEC 3
3.4M104 3.40 73-100 IEC 1/2
Onshore 3.4M114 3.40 93-143 IEC 2/3
3.XM 3.4M114 NES 3.40 93-119 IEC 2/3
Series 3.2M122 NES 3.20 86-139 IEC 3
3.2M114 CCV 3.20 93-100 IEC 2/3
3.2M114 VG 3.20 93-143 IEC 2/3
3.0M122 3.00 89-139 IEC 2
Onshore MM92 2.05 64-100 IEC 1/2/3
MM MM82 2.05 59-80 IEC 1
Series MM100 2.00 75-100 IEC 2/3
Source: Senvion, Warburg Research
Going forward, however, success in the onshore market is expected to be determined by
the ability to offer highly competitive light wind turbines. According to MAKE, the low
wind market is expected to be the dominant wind class by 2020 and is expected to
account for 50% of the market in 2020 compared to a mere 29% in 2014.
Thus, Senvion’s hopes rest on the launch of its flagship light wind turbine, the 3.4M140
turbine, which will be available at the end of FY 2017, one year earlier than initially
planned. As already discussed in the market section of this note, Senvion is expected to
lose market share in Germany in the course of FY 2016 and 2017 due to a lack of a
suitable product offering for low wind sites.
Page 22
Senvion
FU L L NO T E Publ ished 17 .01 .2017 22
Senvion’s low wind flagship product - 3.4M140 WTG
Source: Senvion, Warburg Research
In 2015, when Senvion unveiled its new flagship light wind turbine at the Husum Wind
fair, the 3.4M140 represented the largest turbine in its class by rotor diameter and was
named the most efficient WTG for low wind speeds by MAKE (Make Consulting Trends,
2015). However in the meantime, competitors too have announced new low wind
turbines.
In our view, the table below illustrates the most competitive light wind offerings in the
industry (as of November 2016). In the past, Enercon, like Senvion, lacked a light wind
turbine but is now expected to push into this profitable and growing niche with its E-141
EP4 WTG. More importantly, Enercon’s light wind product is expected to be ready for
series production as soon as in FY 2017. In addition, Enercon’s E-141 was named best
onshore turbine in the 3MW-plus class in 2016 by wind power publication Windpower
Monthly, indicating that these new turbines might pose a serious threat to Senvion’s yet
to be launched light wind turbine.
Senvion’s light wind product offering compared to peer turbines
Senvion 3.4M140 EBC Nordex N131 3.3 Nordex N131 3.6 Enercon E-141 EP4
Prototype 2017 2016 At the end of 2016
Series production 2018 2015 In summer 2017 2017
Specifications
▪ Nominal pow er kW 3,400 3,300 3,600 4,200
▪ Rotor diameter m 140 131 141
▪ Rotor area m2 15,394 13478 13,478
▪ Hub height m 110 / 130 134 / 164 84 / 112 / 134 129 / 159
▪ Wind class IEC 3 IEC 3 IEC 3 IEC 3
▪ Rotor speed U/min 5.2 - 9.6 6.8 - 12.4 4.0 - 10.6
▪ Cut-out w ind speed m/s 22 20 28 - 34
▪ Cut-in w ind speed m/s 3 3 2
▪ Nominal w ind speed m/s 11 11.5 14
Source: Senvion, Nordex, Enercon, Warburg Research
Page 23
Senvion
FU L L NO T E Publ ished 17 .01 .2017 23
Nordex, probably Senvion’s closest peer, already has a strong product offering of light
wind turbines. Nordex introduced the N117/2400 in 2011 and the turbine has been the
best-selling model in Germany in the class of onshore turbines up to 2.9 MW and was
specifically designed for the IEC 3 wind class. Nordex’s successor model, the
N131/3000, was named the best onshore turbine in the class of 3MW-plus turbines by
the wind power publication, Windpower Monthly, in 2014 and can be regarded as one of
the best light wind turbines currently on the market.
Wind site classification according to IEC standards
Light windStrong wind
Source: http://www.windenergie-im-binnenland.de/siteassessment, Warburg Research
As outlined above, Senvion aims to shake up Nordex’s foothold in the light wind market
and regain market share in Germany with its 3.4M140 WTG.
Power curve of Senvion’s 3.4M140 EBC
-
500
1,000
1,500
2,000
2,500
3,000
3,500
4,000
0 1 2 3 4 5 6 7 8 9 10 11 12 13 14 15 16 17 18 19 20 21 22 23
po
we
r (k
W)
wind speed (m/s)
Senvion 3.4M140 EBC
Source: Senvion, Warburg Research
Enercon’s E-141 turbine boasts superior characteristics to Senvion’s upcoming flagship turbine
However, Senvion’s 3.4M140 EBC WTG will not be the only show in town in 2018.
Enercon’s E141 EP4 WTG will have a larger rotor diameter than Senvion’s flagship
turbine and is expected to come with a higher nominal power capacity of 4.2 MW. The
Page 24
Senvion
FU L L NO T E Publ ished 17 .01 .2017 24
chart below illustrates that Senvion’s upcoming flagship turbine will not have a better
energy output than, for instance, Enercon’s low wind dedicated product.
The chart below also illustrates the power curve of Nordex’s current low wind product
offering, the N131/3.6 WTG. However, it is important to note that the turbine is already
available. More importantly, we expect Nordex to unveil a new low wind turbine with a
nominal power capacity of at least 4MW in Q1 2017. However, the energy output from
Nordex’s current turbine generation falls only marginally short of Senvion’s flagship
turbine at an average wind speed of 4 m/s to 9 m/s.
Thus, we fear that it will be far from easy for Senvion when its new turbine hits the
market at the end of 2017. To sum up, we believe that Senvion’s 3.4M140 was state of
the art when it was unveiled in 2015 but its commercial success when it is expected to
be launched in 2018 is no longer self-evident.
Comparison of power curves
-
500
1,000
1,500
2,000
2,500
3,000
3,500
4,000
4,500
0 1 2 3 4 5 6 7 8 9 1011121314151617181920212223242526
po
we
r (k
W)
wind speed (m/s)
Senvion 3.4M140 EBC Nordex N131 3.6 Enercon E-141 EP4
Source: Senvion, Warburg Research
Offshore product portfolio could fall behind
Senvion set itself apart from competitors in the offshore market by capitalising on its first-
mover advantage. The company was the first to successfully install and connect an
offshore 5 MW WTG to the grid in 2004. In 2008, Senvion once again proved its
technological leadership with the launch of its 6.2M126 WTG, the most powerful turbine
in the industry at that time. Consequently, Senvion now holds the leading market position
in the 5 MW-plus segment in the offshore market, with a market share of over 50% of
commissioned offshore projects in Europe.
In 2014, Senvion installed the prototype of the 6.2M152, the most recent addition to its
offshore product portfolio. Moreover, the company is currently executing two firm orders
in Germany with a total size of 443 MW, comprising 72 6.2MW WTGs. Thus, for the
coming two years, the company’s offshore turbine production is operating at full capacity,
underlining the solid demand for Senvion’s offshore turbines.
Page 25
Senvion
FU L L NO T E Publ ished 17 .01 .2017 25
Installed offshore capacity by regions
Germany; 45%
United Kingdom; 17%
Other Countries;
38%
Source: Warburg Research
Furthermore, in September 2016, Senvion won an offshore order of over 203 MW for
Trianel Borkum II, consisting of 32 6.2M152 turbines. The final investment decision (FID)
for the offshore project is expected in H1 2017. Thus, the order should turn into a firm
order for Senvion within the next 12 months and ensure a solid offshore order backlog
for 2018 and 2019.
Overview of Senvion’s offshore projects
Project Cap. of turbin Project cap. Period of construction Customer
Beatrice (UK) 5 MW 10 MW 2006 - 2007 SSE
Thornton Bank I (Bel) 5 MW 30 MW 2008 - 2009 C-Power
Alpha Ventus (Ger) 5 MW 30 MW 2009 - 2010 DOTI
Ormonde (UK) 5 MW 150 MW 2011 Vattenfall
Thornton Bank II/III (Bel) 6.2 MW 295 MW 2012 - 2013 C-Power
Nordsee Ost (Ger) 6.2 MW 295 MW 2014 RWE
Nordsee One (Ger) 6.2 MW 332 MW 2016 - 2018 Northland Power
Nordergründe (Ger) 6.15 MW 111 Mw 2016 - 2018 wpd
Source: Warburg Research
Nonetheless, looking ahead, we fear the current 6.2MW platform might prove outdated
and it could become increasingly difficult to win new offshore orders without a new
turbine platform on offer.
In H1 2016, the average turbine capacity of new offshore projects in Germany amounted
to 6 MW with an average rotor diameter of 154m and an average hub height of 110m.
Thus, Senvion’s current offshore turbine platform reflects the current industry average.
The average capacity of offshore turbines has grown by 41% from 2010 to 2015,
reflecting a continuous effort by turbine manufacturers to increase energy yields at sea.
Page 26
Senvion
FU L L NO T E Publ ished 17 .01 .2017 26
Average offshore turbine capacity to increase to 6-8 MW by 2018
According to EWEA, the deployment of 4-6 MW turbines in 2015 is expected to be
followed by the gradual introduction of 6-8 MW turbines towards 2018.
This view is shared by GWEC (Global Wind Energy council) in its latest global wind
energy outlook. The report argues that recent reductions in tender prices for offshore
wind can be attributed to the availability of the new range of 7 and 8 MW machines.
Average offshore wind turbine rated capacity in Europe
0
1
2
3
4
5
6
19
91
19
92
19
93
19
94
19
95
19
96
19
97
19
98
19
99
20
00
20
01
20
02
20
03
20
04
20
05
20
06
20
07
20
08
20
09
20
10
20
11
20
12
20
13
20
14
20
15
H1 2
01
6
Average capacity (MW)
Source: EWEA, Warburg Research
The table below illustrates that Senvion’s closest competitors in the offshore space
already have 8 MW offshore turbines on offer.
In September 2016, MHI Vestas already installed the first V164-8.0 turbine, the world’s
most powerful turbine with the largest rotor, at Burbo Bank Extension. The project, which
comprises 32 turbines at the site, is planned to be completed in 2017.
Siemens has announced that a prototype of its new SWT-8.0-152 offshore turbine is
planned to be built in H1 2017 and the certification is planned for 2018.
Page 27
Senvion
FU L L NO T E Publ ished 17 .01 .2017 27
Current offshore product portfolio of peers
Rotor diameter Capacity Hub Height
Siemens G4-platform 130m 4MW site specific
D7 platform 154m 6 to 8MW site specific
Adwen 5MW platform 132-135m 5MW 102m+
8MW platform 180m 8MW
GE Haliade 150m 6MW 100m+
MHI Vestas V164-8.0 164m 8MW+ app.105m+
V112-3.3 112m 3.3MW 140m
Senvion 6.XM 126-152m 6.15MW 95-124m
Source: Warburg Research
Lack of competitiveness in offshore is looming by 2019
In our view, 8 MW offshore turbines are likely to be perceived as the new norm from
2018 onwards. While we acknowledge that Senvion’s current offshore turbine offering is
on par with the offering of competitors such as Siemens, we fear that other players such
as MHI Vestas will establish their 8 MW turbines in the offshore market and capitalise on
their first-mover advantage.
The current 6.2M152 is rather an evolutionary development from the previous 6.2M126
model and should not necessarily be considered as an entirely new product. However,
this is unlikely to satisfy customers in 2-3 years time and a new offshore platform should
already be in the making.
Consequently, we fear that Senvion will fail to win new offshore orders in FY 2018/2019.
This, in turn, implies that roughly EUR 200-300m of annual sales contribution from the
offshore business will gradually decline.
Page 28
Senvion
FU L L NO T E Published 17.01.2017 28
Financials
� We expect average onshore prices per MW to drop by 5% p.a. until 2019 as the
company enters emerging markets and as the auction system is introduced in
Germany.
� Based on our detailed analysis of Senvion’s upcoming installations in FY 2017 (WRe:
1,494 MW in 2017) as well as our average pricing assumption, we forecast group
sales will drop by 7% to EUR 2,076m in FY 2017.
� As a result of a declining sales volume, we also expect operating margins to come
under pressure. We forecast a decline of 70bps in the adj. EBITDA margin to 8.8% in
FY 2017.
� Our FY 2017 sales and adj. EBITDA estimates stand some 7% and 13% below
consensus expectations.
� In terms of FCF generation, we forecast cumulative FCF generation of a mere EUR
24m until FY 2018 due to significant capex investments in the years to come (WRe:
EUR 340m in total until 2018).
Group sales to drop quite significantly in FY 2017
Top-line growth in FY 2017 is rather unlikely
Expected sales development
The table below illustrates our top-line estimates until FY 2019, based on our installation
and pricing assumptions. We expect a rather clear decline on the top line in FY 2017,
partly on the back of a shrinking order backlog but also due to lower pricing in the
backlog.
For FY 2017, we anticipate sales of EUR 2.1bn, derived from our onshore installation
assumption of 1,500 MW and a 5% decline in average prices per MW. While our pricing
assumption might seem pessimistic at first glance, it is important to keep in mind that
Senvion is set to execute two large orders in Norway and Chile in FY 2017 with a total
nominal capacity of 411 MW. However, those wind farm projects are expected to have a
total value of EUR 340m (as disclosed by CFO Manav Sharma during the Q3 2016
results conference call), implying an average price per MW of EUR 0.83m. This is likely
to have a significant impact on Senvion’s average pricing in FY 2017. Adjusted for those
two projects, average pricing for the remaining projects would stand at EUR 1.025m/MW,
in line with the average in the previous years.
Looking ahead to FY 2018, we expect a rebound in sales, driven by a recovery in
installation figures in Germany and a 300 MW conditional order from Australia, which
was announced by Senvion in November 2016. Nonetheless, we stick to our view that
pricing is likely to deteriorate further owing to the introduction of the auction system in
Germany in 2017 which should impact average prices in 2018 when those projects are
executed.
Page 29
Senvion
FU L L NO T E Publ ished 17 .01 .2017 29
Warburg Research volume and pricing assumptions until FY 2019
Installation 2015 2016e 2017e 2018e 2019e
Germany 666 390 350 420 364
UK 275 445 150 30 0
France 153 185 187 144 132
Canada 262 209 145 182 130
Australia 16 0 30 300 0
Others* 372 400 215 300 248
New markets** 0 0 417 500 600
Total onshore installations 1,744 1,629 1,494 1,876 1,474
-6.6% -8.3% 25.6% -21.4%
Offshore installations 0 200 220 170 150
Total installation (onshore+offshore) 1,744 1,829 1,714 2,046 1,624
4.9% -6.3% 19.4% -20.6%
Pricing 2015 2016e 2017e 2018e 2019e
Avg. onshore revenue (EURm /MW) 1.033 1.02 0.97 0.92 0.91
yoy in % -1.0% -5.0% -5.0% -1.0%
Onshore revenues (EUR m) 1,801.2 1,665.6 1,451.2 1,731.1 1,346.6
yoy in % -7.5% -12.9% 19.3% -22.2%
Avg. offshore revenue (EURm /MW) 1.50 1.50 1.50 1.50
yoy in % 0.0% 0.0% 0.0%
Offshore revenues (EUR m) 99.1 300 330 255 225
yoy in % 202.7% 10.0% -22.7% -11.8%
Service sales (EUR m) 233.1 268.1 294.9 324.4 356.8
yoy in % 15.0% 10.0% 10.0% 10.0%
Total revenues (EUR m) 2,139.4 2,233.7 2,076.1 2,310.5 1,928.4
4.4% -7.1% 11.3% -16.5%
* includes Austria, Belgium, Netherlands, Poland, Romania, Italy, Portugal, Spain
** includes Chile, Mexico, Peru, Uruguay, Finland, Norway, Sweden, Turkey, India, Japan
Source: Warburg Research
Slump in order intake in FY 2016N.
Our rather cautious view for FY 2017 is based on the slower order intake in FY 2016
than in FY 2015. Order intake in the first nine months of 2016 amounted to a mere EUR
846m, a steep drop from last year’s 9M order intake of EUR 1,908m. Even adjusted for
last year’s offshore orders of EUR 662m, last year’s 9M order intake would have been
roughly EUR 1,249m, considerably higher than this year’s result.
In Q4 2016, order intake amounted to a mere EUR 458m, mainly driven by orders from
Germany, France and Scandinavia. It is our understanding that Senvion once again
failed to convert the 300 MW conditional order from Chile into a firm order in Q4 2016.
With a total order intake of EUR 1.2bn in FY 2016 however, we struggle to see a path of
growth for Senvion in FY 2017.
Page 30
Senvion
FU L L NO T E Publ ished 17 .01 .2017 30
Order intake development in FY 2016
2,211
269 285 292458
1,304
0
500
1,000
1,500
2,000
2,500
2015 Q1 2016 Q2 2016 Q3 2016 Q4 2016e 2016e
in E
UR
m
Order intake (EUR m)
Source: Warburg Research
Nhas resulted in a shrinking order backlog
As Senvion is set to generate sales of at least EUR 800m in Q4 2016 to meet its FY
2016 guidance of sales in the range of EUR 2.25-2.35bn, the company is required to
execute a large portion of its order backlog in the fourth quarter. Consequently, we
expect Senvion’s order backlog to decline further in Q4 2016.
Trailing 12-months firm order backlog
2,050
1,837 1,8401,720
1,466
0
500
1,000
1,500
2,000
2,500
9M 2015 2015 Q1 2016 H1 2016 9M 2016
in E
UR
m
Firm order backlog (EUR m)
Source: Senvion, Warburg Research
Conditional order book has been growing but c. EUR 480m at risk
On a more positive note, the company’s conditional backlog has grown in the course of
FY 2016, as can be seen from the chart below. This can be attributed to the conditional
offshore order of more than 203 MW for Trianel Borkum II in Q3 2016.
Page 31
Senvion
FU L L NO T E Publ ished 17 .01 .2017 31
Trailing 12-months conditional order backlog
1,350
1,5981,717 1,740
1,921
0
500
1,000
1,500
2,000
2,500
9M 2015 2015 Q1 2016 H1 2016 9M 2016
in E
UR
m
Conditional order backlog (EUR m)
Source: Warburg Research
However, EUR 826m of the total conditional order backlog stem from conditional German
contracts. During the Q3 2016 conference call, management stated that roughly 25% of
the total conditional order backlog (i.e. EUR 480m) is at risk if German wind projects do
not receive planning permission by year-end. These orders would be declassified into the
order pipeline and would be subject to the auction process in FY 2017. Clearly, this
would represent a blow to Senvion’s growth prospects for FY 2017 and 2018 as
conversion of those orders into firm orders would be significantly delayed.
Service sales expected to grow at double-digit rates in the mid term
Senvion’s service business, in contrast, was the fastest-growing business segment in FY
2016. In the first nine months of the year, service revenues grew by 22% yoy as the
company capitalised on its growing installed base and the higher renewal rate for its
service contracts. As a result, the company’s service order book grew by some 9% since
December 31, 2015, as can be seen from the chart below.
Trailing 12-months service order backlog
1,9401,972
2,064
2,102
2,151
1,800
1,850
1,900
1,950
2,000
2,050
2,100
2,150
2,200
9M 2015 2015 Q1 2016 H1 2016 9M 2016
in E
UR
m
Order book for O&M services (EUR m)
Source: Senvion, Warburg Research
Page 32
Senvion
FU L L NO T E Publ ished 17 .01 .2017 32
The company has almost 12 GW of installations under service coverage which should
enable Senvion to benefit from the annuity-like revenue profile of the business going
forward.
Nearly 12 GW of installations under service
9.3 9.4 9.8 10.210.8
11.411.9
0
2
4
6
8
10
12
14
Mar 2015 Jun 15 Sep 15 Dec 15 Mar 16 Jun 16 Sep 16
in G
W
Installed base under service (in GW)
Source: Senvion, Warburg Research
On the back of convincing renewal rates of more than 80% and a growing installed fleet,
we share the company’s view that the service business is likely to grow at double-digit
rates in the medium term. We therefore estimate service sales CAGR of 10% between
2017 and 2019.
Lack of volume growth and pricing pressure to put margins under pressure
As outlined above, we fear that Senvion might be facing a period of anaemic growth in
FY 2017. We estimate a 6% yoy decline in installation numbers and 5% pricing pressure
in FY 2017. We therefore estimate a 7% decline in group revenues (growth in service
sales should offset some of the decline in the project business) to EUR 2,076m in FY
2017.
This, however, should have an adverse impact on margins as well, since we doubt that
Senvion can offset lower revenue volume with ad-hoc cost-cutting measures. Thus, we
estimate a 70bps decline in the adj. EBITDA margin from 9.5% in FY 2016 to 8.8% in FY
2017.
With an expected return to top-line growth in FY 2018, we estimate a rebound in the
margin. However, we fear that pricing pressure, which we continue to estimate at 5% in
FY 2018, is likely to prevent a stellar margin increase.
We acknowledge that stronger growth in the service business is likely to support
margins, as we estimate that Senvion’s service business generates an EBIT margin of
roughly 15%, which is broadly in line with the service margin of peers such as Nordex.
This could add approximately EUR 4m p.a. to the company’s EBIT, which represents
rather minor margin support in light of potentially strong pricing pressure.
Page 33
Senvion
FU L L NO T E Publ ished 17 .01 .2017 33
With respect to FY 2017/18, our estimates do not assume any adverse one-offs.
However, we estimate PPA expenses of EUR 93m and EUR 41m in FY 2017 and 2018,
respectively.
P&L overview: No margin expansion on the cards
FY End: 31.12. CAGR
in EUR m (15-18e) 2014 2015 2016e 2017e 2018e
Sales 2.6 % 1,921.8 2,139.5 2,233.7 2,076.1 2,310.5
yoy 9.3 % 11.3 % 4.4 % -7.1 % 11.3 %
Gro ss pro f it 8.5 % 488.1 490.1 607.9 557.9 625.6
Gross margin 25.4 % 22.9 % 27.2 % 26.9 % 27.1 %
EB IT D A 0.6 % 144.0 210.4 212.3 182.1 214.3
EBITDA-margin 7.5 % 9.8 % 9.5 % 8.8 % 9.3 %
EB IT -2.0 % 90.1 154.0 153.3 121.9 145.0
EBIT-margin 4.7 % 7.2 % 6.9 % 5.9 % 6.3 %
N et Inco me - 32.1 -150.8 -19.1 -25.2 35.0
EP S - 32.10 -28.11 -0.29 -0.39 0.54
D P S - 0.00 0.00 0.00 0.00 0.00
Source: Warburg Research
Consensus estimates look too upbeat for FY 2017
In light of our cautious view for FY 2017, we believe that consensus estimates are still
too upbeat, posing significant downside risk. There have been some downward revisions
to FY 2017 estimates recently and we believe the release of the FY 2016 figures will
serve as a catalyst for fresh downward revisions.
Consensus is anticipating somewhat flat top-line development in FY 2017. This,
however, looks rather optimistic to us. As we argued earlier, even with a very strong Q4
2016 order intake, new orders in FY 2016 should amount to EUR 1.5bn at best, a decline
of more than 30% yoy. Thus, onshore sales in FY 2017 are likely to experience a notable
drop, leaving limited room for growth in group sales.
In terms of profitability however, consensus estimates do not assume a margin
expansion until FY 2018. Consensus expects the EBITDA margin to hover around 9.5%
in the coming years, in line with the expected margin in the current fiscal year.
Thus, our FY 2017 EBITDA estimate of EUR 182m stands more than 13% below
consensus. As outlined above, this is based on our assumption that a decline on the top
line in FY 2017 is likely to have an adverse impact on margins as well.
Page 34
Senvion
FU L L NO T E Publ ished 17 .01 .2017 34
Warburg estimates vs consensus
As o f: 27.12.2016 2016e 2017e 2018e
Sales 2,252.6 2,228.2 2,333.7
yoy in % 5.3% -1.1% 4.7%
Sales (WR e) 2,233.7 2,076.1 2,310.5
yoy in % 4.4% -7.1% 11.3%
Delta WRe estimates (abso lute) -19.0 -152.2 -23.3
Delta WRe estimates (relative) -0.8% -6.8% -1.0%
EB IT D A adjusted 215.0 209.8 228.8
yoy in % 2.2% -2.4% 9.0%
M argin in % 9.5% 9.4% 9.8%
EB IT D A adjusted (WR e) 212.3 182.1 214.3
yoy in % 0.9% -14.2% 17.7%
M argin in % 9.5% 8.8% 9.3%
Delta WRe estimates (abso lute) -2.7 -27.7 -14.5
Delta WRe estimates (relative) -1.3% -13.2% -6.3%
EB IT adjusted 156.2 155.9 173.9
yoy in % 1.4% -0.2% 11.5%
EB IT adjusted (WR e) 153.3 121.9 145.0
yoy in % -0.5% -20.5% 18.9%
Delta WRe estimates (abso lute) -2.9 -34.0 -28.9
Delta WRe estimates (relative) -1.9% -21.8% -16.6%
Source: FactSet , Warburg Research
Page 35
Senvion
FU L L NO T E Published 17.01.2017 35
Capex cycle to remain at peak levels until FY 2018
With respect to cash generation, we fear that Senvion will struggle to demonstrate a
strong cash profile as the company is likely to suffer from depressed profitability and high
capex investments until FY 2018. While the company has made great strides with
respect to working capital discipline, we believe that the peak has been reached and net
working capital is likely to normalise to -2% of sales by FY 2018.
Strong working capital ratio leaves little room for improvement
Following the acquisition of Senvion by Centerbridge in 2015, Senvion benefited from a
notable improvement in its working capital management. Under the supervision of
Centerbridge, the net working capital to sales ratio improved from 8.3% (at the end of
March 2015) to -4.7% at the end of FY 2015. This can be attributed to a change in
accounting systems. Previously Senvion recognized revenues based on accrued costs,
which resulted in early recognition of sales but also increased pre-production of
components. Following the Centerbridge takeover, Senvion switched to a system of
revenue recognition based on milestones. This set an incentive to reduce inventory
levels and increase the efficiency of working capital management.
The net working capital to sales ratio improved even further in the course of FY 2016 to -
6.4% at the end of September 2016 as a result of better alignment of supplier payment
terms to project milestones and higher advance payments (represent roughly 15% of
wind turbine order intake).
However, we doubt there is much scope to reduce net working capital any further,
especially as growth is expected predominantly in LatAm and other emerging markets,
where payment targets are usually less strict. Moreover, as we are assuming that
competition will intensify among the WTMs, we doubt that Senvion can increase advance
payments or the receivables collection period. Hence, we expect to see a normalisation
of the net working capital ratio in the coming years and we therefore estimate a net
working capital ratio of -2% in FY 2018. However, we don’t expect changes in working
capital to pose significant headwinds to cash flow generation until FY 2018.
Working capital management improved significantly
8.3%
-4.6%
-4.7%-3.5%
-2.0%
-6.0%
-3.0%
0.0%
3.0%
6.0%
9.0%
Mar 2015 Dec 2015 Dec 2016e Dec 2017e Dec 2018e
in %
Working Capital / Sales
Source: Warburg Research
Page 36
Senvion
FU L L NO T E Publ ished 17 .01 .2017 36
Total capex spend to amount to EUR 340m until FY 2018
In our view, the next years will be characterised by extraordinarily high capex
investments. This is unlikely to abate before FY 2019 as the company needs to catch up
in terms of R&D and growth investments. We therefore estimate that total capex
investments will exceed 5% of sales between FY 2016 and FY 2018.
Senvion lowered its capex investments quite significantly when it was part of the cash-
strapped Suzlon group. Thus, the company now needs to ramp up its investments in
R&D and physical capacities.
R&D investment is necessary to ensure market introduction of the eagerly awaited
3.4M140 light wind turbine as well as the recently announced medium wind turbine
3.6M140 in FY 2018. We therefore expect R&D spend to remain above historical levels
until FY 2018.
Expected development of R&D expenses
4245
58
6770 70 70
2023
3945
50 50 50
0
10
20
30
40
50
60
70
80
2012 2013 2014 2015PF 2016e 2017e 2018e
in E
UR
m
Total R&D expenses thereof capitalized R&D costs
Source: Warburg Research
In addition, total capex investments also include investments in physical capacities such
as production facility upgrades and growth capex for the internationalisation strategy.
Senvion’s expansion into new markets in LatAm (Chile, Mexico, Peru and Uruguay),
Scandinavia and India requires, in certain cases, local content for the production.
Hence, we estimate total capex investments (including capitalised R&D costs) to amount
to EUR 115m, EUR 115m and EUR 110m in FY 2016, 2017 and 2018, respectively.
Page 37
Senvion
FU L L NO T E Publ ished 17 .01 .2017 37
Investments to remain at record highs until FY 2018
55
69
8375
115 115110
2.4%
3.9% 4.3%
3.5%
5.1% 5.5%
4.8%
0%
3%
6%
9%
0
20
40
60
80
100
120
140
2012 2013 2014 2015PF 2016e 2017e 2018ein
EU
R m
Total capital expenditures Total Capex (incl. cap. R&D) / Sales
Source: Warburg Research, Senvion
As a result of the sustained high level of capex investments, we do not expect Senvion to
generate a meaningful cumulative free cash flow in the period FY 2016-2018.
Free cash flow generation to remain subdued
150
95
119115 115 110
35
-20
9
-40
-20
0
20
40
60
80
100
120
140
160
2016e 2017e 2018e
in E
UR
m
OpCF Capex FCF
Source: Warburg Research
We forecast that cumulative FCF (before acquisitions) in 2016-2018 will amount to a
mere EUR 23.9m.
Page 38
Senvion
FU L L NO T E Publ ished 17 .01 .2017 38
Cumulative free cash flow generation 2016-2018
363.9
340.0
23.9
00
50
100
150
200
250
300
350
400
OpCF Capex FCF
in E
UR
m
Source: Warburg Research
Healthy balance sheet but redemption of high yield bond should be top priority
We regard the company’s balance sheet structure as rather healthy with a net cash
position of EUR 3m as of December 31, 2015. More importantly, since fixed assets
represent roughly 10% of total assets, one can rightly draw the conclusion that the
company has a very asset-light business model.
Expected balance sheet structure at the end of FY 2016
Cash; 21%Financial
liabilities; 21%
PP&E; 10%Equity; 18%
Goodwill & intangibles;
31%
Account payables; 18%
Inventory; 15% Advance payments; 17%
Account receiv.; 15%
Provisions; 13%
Other; 9% Other; 13%
0%
10%
20%
30%
40%
50%
60%
70%
80%
90%
100%
Assets Liability
Source: Warburg Research
The company’s net cash position improved even further to EUR 19m in the first nine
months of the year. However, Senvion’s strong balance sheet benefits from advance
payments which amounted to roughly EUR 291m at the end of FY 2015 (and EUR 310m
as of September 30, 2016).
Page 39
Senvion
FU L L NO T E Publ ished 17 .01 .2017 39
In future, however, we forecast a swing to a net debt position in FY 2017 on the back of
weaker operating cash flow generation and a EUR 30m cash outflow for the ongoing
share buyback programme.
Expected net debt development
-3
-13
27
18
-20
-15
-10
-5
0
5
10
15
20
25
30
2015PF 2016e 2017e 2018e
in E
UR
m
Net debt / (net cash)
Source: Warburg Research
Despite its low net indebtedness, it is important to note that the company has a senior
secured note outstanding (Green bond) with a principal amount of EUR 400m due
November 2020. The high yield bond was issued in April 2015 to refinance Senvion’s
acquisition. The note bears interest at a fixed rate of 6.625% p.a. and Senvion therefore
incurs net interest expenses of EUR 26.5m per year which is clearly inefficient,
considering the company’s solid balance sheet structure.
To reduce the interest burden, one might expect Senvion to refinance the bond or at
least a portion of the outstanding amount early. The bond is callable on, and after, May
15, 2017 at par plus 50% of the coupon (103.313%). To our understanding, however, the
company is not planning to redeem a portion of the bond in FY 2017 but reserves the
right to purchase its Senior Secured notes for cash in open market purchases or by
privately-negotiated transactions. The main intention is to avoid premium fees for the
early redemption of the bond.
Finally, the chart below illustrates our assumptions with respect to payments for
acquisitions (Kenersys & EUROS) and the ongoing share buyback.
Page 40
Senvion
FU L L NO T E Publ ished 17 .01 .2017 40
Net debt / (net cash) bridge for FY 2015-2018e
-2.9 18.2
363.9
-340.0
-20.0
-25.0
-400
-350
-300
-250
-200
-150
-100
-50
0
50
Net cash2015
OpCF Capex Acqusitions Sharebuyback
Net debt2018e
in E
UR
m
Source: Warburg Research
Page 41
Senvion
FU L L NO T E Published 17.01.2017 41
Share Price Development
� Management launched a EUR 75m share buyback programme following a dramatic
share price slump to c. EUR 10 (the shares initially floated at EUR 15.75).
� However, we don’t expect management to exhaust the maximum amount and
estimate a total buyback volume of EUR 25m.
� More importantly, while the initial effect was positive, the buyback has not proven very
effective in recent weeks since the shares continued to decline following the Q3 2016
results.
� Finally, we anticipate a massive share overhang at a price of EUR 15.75 since this
would reflect the hurdle when many investors would be “in the money” following the
IPO. In addition, the current owner Centerbridge (73.6% stake) had initially planned to
sell a larger portion of its stake via the IPO. We fear that a reduction of the stake
could exert additional pressure on the share price.
Share buyback programme unlikely to drive share price going forward
Recent development supported by share buybacks
Although the company went public less than a year ago, in March 2016, investors have
already had quite a turbulent time.
Back in February 2015, Senvion announced its plan to go public in the first half of 2016.
In a first step, ahead of the IPO, the company planned to offer up to 29.9m shares
(around 46% stake) for a price of between EUR 20.00 and EUR 23.50 to institutional
investors as part of a private placement. That would have resulted in a valuation
between EUR 1.3bn and 1.53bn. The actual IPO was scheduled to take place one day
after the private placement.
However, Senvion cancelled its plans for an IPO one day before the end of the offer
period on March 16, 2016. The reasons were not disclosed.
One week later, on March 21, Senvion reassessed the situation and announced it would
resume the floatation process with changed parameters. The price range was adjusted
to EUR 15.50 to EUR 17.00 per share. The maximum volume was reduced to 18.7m
(16.25m + 2.4m overallotment) shares. More importantly, the issued shares should stem
from Centerbridge and Arpwood, providing a partial exit for both private equity houses.
Finally, on March 23, Senvion went public with an issuing price of EUR 15.75 for nearly
18.7m shares. Total offer volume amounted to EUR 294m with a market capitalization of
EUR 1.02bn. After a stabilization period, Centerbridge and Arpwood retained a 73.6%
stake in Senvion. Furthermore, Centerbridge and Arpwood agreed to a lock-up period of
six months, which expired on September 25, 2016.
However, we expect a share overhang at a share price of roughly EUR 16 since we
believe that many investors could decide to take profits one they are back “in the money”
following the IPO. In addition, we believe Centerbridge would welcome an exit sooner
rather than later. Thus, we fear that the shares won’t have sufficient breathing room to
remain above the EUR 16 hurdle on a sustainable basis.
Page 42
Senvion
FU L L NO T E Publ ished 17 .01 .2017 42
Shareholder structure (as of April 30, 2016)
Centerbridge/ Rapid
Partners73.60%
Free float26.40%
Source: Senvion, Warburg Research
Following the successful IPO in March, the shares followed a downward trend. This was
mainly driven by a slower than expected order intake in the course of the fiscal year.
The shares reached a trough at EUR 10.40 on August 10, 2016. However, only five days
later, management decided to initiate a share buyback programme for a maximum of
EUR 75m over the next two years. The repurchase of shares can be made within a price
range of EUR 10 to EUR 35 per share for up to 6.5m shares (10% of issued share
capital).
Following the announcement and the commencement of the buyback programme on
August 26, 2016, the shares recovered to c. EUR 16 but did not exceed this very
important mark.
Page 43
Senvion
FU L L NO T E Publ ished 17 .01 .2017 43
Share price development
Source: Warburg Research
The share buyback is being carried out by a credit institution, which makes independent
decisions regarding the timing of the repurchase of shares, without the involvement of
the company.
Share price development since start of share buyback programme
Source: FactSet, Warburg Research
Between August 26 and October 18, 321,846 shares were bought back, significantly
driving daily trading volume. Senvion repurchased roughly 8,700 shares per day.
Page 44
Senvion
FU L L NO T E Publ ished 17 .01 .2017 44
Average daily trading volume vs daily repurchases (26/08 – 18/10/2016)
51,134
8,699
0
10,000
20,000
30,000
40,000
50,000
60,000
Average daily trading volume Average daily volume repurchased
Source: Senvion, Bloomberg, Warburg Research
Consequently, roughly 19% of the total daily trading volume is attributable to the share
buyback programme, which is quite high considering that it is not permitted to
repurchase more than 25% of the average daily trading volume of the shares (in XETRA
trading over the last 20 trading days).
Around 19% of total daily volume was attributable to share buybacks
19%
0%
5%
10%
15%
20%
25%
30%
Daily volume repurchased (in %) Average volume repurchased
Source: Senvion, Bloomberg, Warburg Research
Senvion spent EUR 5m in total between August and October 2016 on the share buyback
programme.
The company suspended its buyback programme ahead of the release of its Q3 2016
Page 45
Senvion
FU L L NO T E Publ ished 17 .01 .2017 45
results on November 15, 2016. Following the share price slump after the release of the
Q3 2016 results and Trump’s election win, Senvion resumed its share repurchase
programme. Between November 29 and December 16, 2016 the company bought back
111,000 shares and spent some EUR 1.5m.
Average daily trading volume vs daily repurchases (29/11 – 16/12/2016)
72,313
7,916
0
10,000
20,000
30,000
40,000
50,000
60,000
70,000
80,000
Average daily trading volume Average daily volume repurchased
Source: Senvion, Bloomberg, Warburg Research
Once again, the company’s buyback programme represented a significant portion (16%)
of the total average daily trading volume.
Share repurchases represented 16% of daily trading volume (29/11 –
16/12/2016)
0%
5%
10%
15%
20%
25%
29
.11
.20
16
30
.11
.20
16
01
.12
.20
16
02
.12
.20
16
03
.12
.20
16
04
.12
.20
16
05
.12
.20
16
06
.12
.20
16
07
.12
.20
16
08
.12
.20
16
09
.12
.20
16
10
.12
.20
16
11
.12
.20
16
12
.12
.20
16
13
.12
.20
16
14
.12
.20
16
15
.12
.20
16
16
.12
.20
16
Daily volume repurchased (in %) Average volume repurchased
Source: Senvion, Bloomberg, Warburg Research
However, this time the company’s buyback programme did not support the share price
and the company’s shares dropped 9% from EUR 13.85 to EUR 12.6 on December 16,
2016.
Page 46
Senvion
FU L L NO T E Publ ished 17 .01 .2017 46
Share buyback programme unlikely to drive share price going forward
While the company’s share buyback programme represented a significant driver of the
shares until October 2016, it failed to deliver such support in December 2016. The
shares dropped quite significantly to below EUR 13.
More importantly, management does not regard the share repurchase programme as a
tool to prevent low valuation levels. Hence the programme won’t provide an effective
floor to the share price. To our understanding, the company’s announcement of the
share buyback programme back in August was rather an attempt to signal confidence in
times of significant volatility when the shares suddenly dropped to EUR 10.
However, this also implies that the share buyback programme will not be used as a
means to take advantage of low share price levels, nor was the programme intended to
return funds to shareholders as the company is in the midst of an extensive capex
programme.
To sum up, we do not expect management to boost share prices as it is not committed to
a certain share price level. Consequently, investors should not base their investment
rationale on the company’s share buyback programme.
We currently estimate that Senvion might spend a total of EUR 17.5m on the share
buyback programme in FY 2017 as we expect a rather turbulent year. However, we do
not expect management to exhaust the maximum amount of EUR 75m for the
programme. We estimate a total cash outflow of EUR 25m for share repurchases
(thereof EUR 7.5m in FY 2016).
Poor share price development reflects industry weakness but not necessarily company-specific issues yet
Senvion’s share price development and the performance of its direct peers shows that it
was not a particularly successful year for most of the WTMs as investors seem to fear
the introduction of the auction system in Europe as well as a Trump presidency, which is
expected to inhibit the development of onshore wind in the US.
Senvion shares have lost some 27% in value since the IPO, which compares to a flattish
share price development at Vestas and a gain of more than 23% at Gamesa, mainly
driven by the takeover offer of Siemens. Nordex is the only WTM, with a poorer share
price development than Senvion.
Even though Senvion’s share price performance lagged behind peers, we do not
consider the performance gap large enough to warrant a meaningful technical rebound
going forward. We deem this a lot more likely for Nordex, which has underperformed
significantly compared to its peers.
Page 47
Senvion
FU L L NO T E Publ ished 17 .01 .2017 47
More importantly, as we expect Senvion to suffer from market share losses in FY 2017
as well as weaker financial results and the associated downward revisions to consensus
estimates, we believe these developments are set to prevent a rebound in the share
price.
Indexed share price development of wind players (as of January 2016)
Source: FactSet, Warburg Research
Page 48
Senvion
FU L L NO T E Published 17.01.2017 48
Valuation
� We value Senvion based on our DCF model, which points to a fair value per share of
EUR 12.
� In terms of relative valuation, the shares trade at a 26% discount to peers on FY 2017
EV/ EBITDA. However, following the US election, the peer group has experienced a
devaluation which has resulted in a shrinking discount to peers for Senvion.
� Our PT of EUR 12 indicates that the current discount to peers is appropriate.
Absolute valuation indicates a fair value of EUR 12 per share
Absolute valuation
DCF model
We value Senvion based on our DCF model which points to a fair value per share of
EUR 12.0. This value is based on a detailed planning horizon until 2019 (which, in turn,
is based on our market model), a transition period until 2028 and our terminal value
assumption. Our main underlying assumptions:
� Sales growth of 4.4%, -7.1% and 11.3% in FY 2016, 2017 and 2018, respectively.
Based on our market model, we also forecast a drop in sales of 16.5% in FY 2019.
Following the detailed planning period, we assume peak sales growth of 3% p.a. with a
steady decline to a sustainable growth rate of 2% p.a. in perpetuity.
� Peak EBIT margin (after PPA and one-offs) of 6.3% and a long-term sustainable EBIT
margin of 4.5% for our terminal growth assumption (expected reported EBIT margin in
FY 2016: 1.8%).
� Terminal growth of 1.5%
� Stable tax rate of 30%
� WACC of 8.5%, implying a risk-free rate of 1.5% and a market premium of 5.5%
� Beta of 1.40, which reflects the cyclicality of the renewable industry
Our sensitivity analysis indicates that on average an increase in the assumed EBIT
margin of +1pp, which would be a challenging target, would result in a fair value of EUR
15.0. Nonetheless, in light of difficult growth prospects, intense competition and
increasing pricing pressure, we stick to our view that it would be rather difficult to expand
the EBIT margin by 1% on a sustainable basis.
Page 49
Senvion
FU L L NO T E Publ ished 17 .01 .2017 49
DCF model
Detailed forecast period Transitional period Term. Value
Figures in EUR m 2016e 2017e 2018e 2019e 2020e 2021e 2022e 2023e 2024e 2025e 2026e 2027e 2028e
Sales 2,234 2,076 2,310 1,929 1,987 2,037 2,088 2,140 2,193 2,237 2,282 2,328 2,363
Sales change 4.4 % -7.1 % 11.3 % -16.5 % 3.0 % 2.5 % 2.5 % 2.5 % 2.5 % 2.0 % 2.0 % 2.0 % 1.5 % 1.5 %
EBIT 40 29 104 77 99 122 131 130 128 126 124 122 120
EBIT-margin 1.8 % 1.4 % 4.5 % 4.0 % 5.0 % 6.0 % 6.3 % 6.1 % 5.8 % 5.6 % 5.4 % 5.2 % 5.1 %
Tax rate (EBT) 15.0 % 15.0 % 15.0 % 30.0 % 30.0 % 30.0 % 30.0 % 30.0 % 30.0 % 30.0 % 30.0 % 30.0 % 30.0 %
NOPAT 34 25 88 54 70 86 92 91 90 88 87 86 84
Depreciation 162 153 110 87 79 71 63 64 66 67 68 70 71
in % of Sales 7.3 % 7.4 % 4.8 % 4.5 % 4.0 % 3.5 % 3.0 % 3.0 % 3.0 % 3.0 % 3.0 % 3.0 % 3.0 %
Changes in provisions 0 0 0 0 0 0 0 0 0 0 0 0 0
Change in Liquidity from
- Working Capital -7 33 27 26 19 20 11 1 12 1 1 1 1
- Capex 115 115 110 96 89 81 84 86 88 89 91 93 71
Capex in % of Sales 5.1 % 5.5 % 4.8 % 5.0 % 4.5 % 4.0 % 4.0 % 4.0 % 4.0 % 4.0 % 4.0 % 4.0 % 3.0 %
Other 0 0 0 0 0 0 0 0 0 0 0 0 0
Free Cash Flow (WACC Model)
89 30 62 18 40 55 60 68 56 65 63 61 83 67
PV of FCF 82 25 49 13 27 34 34 36 27 29 26 23 29 332 share of PVs 20.44 % 36.25 % 43.31 %
Model parameter Valuation (m)
Derivation of WACC: Derivation of Beta: Present values 2028e 435
Terminal Value 332
Debt ratio 14.00 % Financial Strength 1.40 Financial liabilities 416
Cost of debt (after tax) 4.2 % Liquidity (share) 1.20 Pension liabilities 0
Market return 7.00 % Cyclicality 1.70 Hybrid capital 0
Risk free rate 1.50 % Transparency 1.40 Minority interest 0
Others 1.30 Market val. of investments 0
Liquidity 419 No. of shares (m) 64.9
WACC 8.50 % Beta 1.40 Equity Value 770 Value per share (EUR) 11.87
Sensitivity Value per Share (EUR)
Terminal Growth Delta EBIT-margin
Beta WACC 0.75 % 1.00 % 1.25 % 1.50 % 1.75 % 2.00 % 2.25 % Beta WACC -1.5 pp -1.0 pp -0.5 pp +0.0 pp +0.5 pp +1.0 pp +1.5 pp
1.61 9.5 % 10.03 10.13 10.25 10.37 10.50 10.63 10.78 1.61 9.5 % 6.11 7.53 8.95 10.37 11.79 13.20 14.62
1.51 9.0 % 10.66 10.79 10.92 11.07 11.22 11.39 11.57 1.51 9.0 % 6.54 8.05 9.56 11.07 12.57 14.08 15.59
1.45 8.8 % 11.00 11.14 11.29 11.45 11.62 11.81 12.01 1.45 8.8 % 6.78 8.34 9.90 11.45 13.01 14.57 16.12
1.40 8.5 % 11.37 11.53 11.69 11.87 12.06 12.26 12.48 1.40 8.5 % 7.04 8.65 10.26 11.87 13.48 15.09 16.70
1.35 8.3 % 11.76 11.93 12.12 12.31 12.52 12.75 13.00 1.35 8.3 % 7.31 8.98 10.65 12.31 13.98 15.64 17.31
1.29 8.0 % 12.19 12.37 12.57 12.79 13.03 13.28 13.55 1.29 8.0 % 7.61 9.34 11.06 12.79 14.52 16.25 17.97
1.19 7.5 % 13.12 13.35 13.60 13.87 14.16 14.48 14.83 1.19 7.5 % 8.28 10.14 12.01 13.87 15.74 17.60 19.46
� The DCF model is based on a peak EBIT margin of 6.3% and a long-term sustainable EBIT margin of 4.5%.
� We cautiously estimate top-line growth of 3% p.a. at maximum and a terminal growth rate of 1.5%.
Page 50
Senvion
FU L L NO T E Publ ished 17 .01 .2017 50
Relative valuation
In terms of relative valuation, our peer group comparison indicates that Senvion trades at
a discount to its peers. Our peer group solely consists of pure-play European wind
turbine peers.
To arrive at the trading multiples for the wind turbine peers, we decided to treat
advanced payments from customers as part of debt to allow for a fair picture across the
peer group. Consequently, we have added EUR 310m of customers’ advanced
payments (as of September 30, 2016) to Senvion’s enterprise value calculation. We
conducted the same adjustments to the EV for the other companies in our peer group
(using 9M 2016 balance sheet figures).
We believe the best trading multiple to compare the peers is EV/ adj. EBITDA. Significant
PPA expenses at Senvion and Nordex would otherwise distort the picture. On FY 2017
EV/ EBITDA, Senvion trades on a multiple of 5.8x. This compares to an industry average
of 7.3x, which is a reflection of the devaluation of wind names, recently observed
following the US presidential election. Nonetheless, this still implies a discount of roughly
26% to peers. However, Senvion trades at discount of just 16% compared to its closest
peer Nordex.
Thus, if Senvion was trading in line with the industry average, this would imply a share
price of EUR 16.0. However, we believe a discount is warranted based on Senvion’s
product portfolio which is lagging behind peers, an internationalisation strategy which still
needs to prove itself, and finally its high capex needs in the years ahead.
Our price target of EUR 12.0, in contrast, implies a fair 2017e EV/ adj. EBITDA multiple
of 5.9x for Senvion. Thus, we deem the current discount to peers as appropriate.
Relative valuation
Peergroup - Valuation Multiples
C o mpany LC P rice M C EV
in LC in LC m in LC m 16e 17e 18e 16e 17e 18e 16e 17e 18e 16e 17e 18e
Vestas DKK 472.60 104,702.0 105,038.0 14.1 x 14.9 x 13.6 x 1.4 x 1.4 x 1.4 x 8.0 x 8.8 x 8.3 x 10.2 x 11.4 x 10.6 x
Gamesa EUR 19.57 5,465.3 5,663.2 18.7 x 17.0 x 15.5 x 1.2 x 0.9 x 0.9 x 8.2 x 7.3 x 7.6 x 12.4 x 9.0 x 8.2 x
Nordex EUR 20.10 1,949.3 2,377.6 22.1 x 17.5 x 13.0 x 0.7 x 0.7 x 0.6 x 8.5 x 6.9 x 6.0 x 15.4 x 12.7 x 9.8 x
Average 18.3 x 16.5 x 14.0 x 1.1 x 1.0 x 0.9 x 8.2 x 7.7 x 7.3 x 12.7 x 11.0 x 9.6 x
M edian 18.7 x 17.0 x 13.6 x 1.2 x 0.9 x 0.9 x 8.2 x 7.3 x 7.6 x 12.4 x 11.4 x 9.8 x
Senvio n EUR 11.75 763.4 1,055.2 neg. neg. 21.0 x 0.5 x 0.5 x 0.5 x 5.2 x 5.8 x 4.9 x 26.1 x 36.5 x 7.3 x
Valuation difference to M edian n.a. n.a. -35% 163% 78% 89% 57% 26% 55% -52% -69% 35%
Fair value per share based on M edian n.a. n.a. 7.63 38.20 24.39 26.21 20.96 16.00 20.69 3.24 0.57 17.42
P / E EV / Sales EV / EB IT D A EV / EB IT
Source: Warburg Research
Page 51
Senvion
FU L L NO T E Published 17.01.2017 51
Company History
Senvion, formerly known as REpower, is a German wind turbine company,
headquartered in Hamburg/Germany, and the sixth-largest manufacturer of wind turbines
worldwide with a market share of 6.6% (excluding China). In Europe, Senvion extended
its market share to 11.7% in 2015. The company is operating in 20 countries and has an
installed capacity of 13.7 GW worldwide. Senvion’s main activity is the onshore business,
which generates 85.1% of its revenues (2015).
The company was founded back in 2001 following the merger of several entities (Denker
& Wulf and Jacobs Energie, amongst others) and was publicly listed in 2002. Suzlon
acquired a majority stake in the company in 2007 and delisted the company in 2011,
following a squeeze-out of the minority shareholders. REpower was renamed to Senvion
in 2014 and acquired by private equity firm Centerbridge in April 2015 for EUR 1.0bn.
While Senvion was not allowed to operate in emerging markets under the ownership of
Suzlon, the company is now focusing heavily on its geographic expansion strategy,
breaking into new markets in Chile, Peru, Uruguay as well as India, Turkey, Mexico,
Scandinavia, Ireland and Japan.
Onshore business
Senvion has about 20 years of experience in the onshore business and provides its
customers with wind turbines for all wind speeds. The size and height depend on the
customer’s needs. The hub height can be up to 160 meters. Such heights are especially
suitable for Scandinavian countries or Germany where the landscape is covered by
forest. The number of WTG installed per project ranges from a single turbine to 30
WTGs. Even larger projects were realised in Canada and Australia. However, an
average of five WTGs are installed per project.
The WTG capacity Senvion offers its customers in the onshore business ranges from 2
to 3.4 MW. The 3.4M140 is the company’s latest development. The wind turbine was
developed for areas of low wind speed and was named the most efficient WTG in the
market for low wind speed in 2015 by MAKE Consulting (MAKE Trends 2015).
At the end of 2015, Senvion installed about 4,377 WTGs of the MM series and 746
WTGs of the 3.XM series in the onshore business. Overall Senvion installed a capacity
of 12.8 GW in the onshore market.
Offshore business
Since 2001, Senvion has been developing high-performance wind turbines for the
offshore market. Today, the company has more than 10 years of experience in this
business field. Senvion was the first company to successfully install a 5MW WTG in
2006. Since then, it has installed a capacity of 939 MW of offshore WTGs. All were
installed in Europe and 45% were installed in Germany. In the 5MW-plus market in
Europe, Senvion’s market share exceeds 50% of all commissioned offshore projects.
The 6.2M152 WTG is Senvion’s latest development with a capacity of more than 6 MW.
Page 52
Senvion
FU L L NO T E Publ ished 17 .01 .2017 52
Services
At the end of 2015, Senvion held service contracts for three-quarters of its installed fleet.
The average duration of a service contract increased to 10 years from 8.6 years in 2012.
One of the strengths of these contracts is the stable and predictable cash flow. In FY
2015, about 10.7% of revenues were generated by O&M services.
The main services Senvion provides are the following:
• Installation and commissioning of WTGs
As a supplier of WTGs, Senvion offers additional installation services for its
customers. In 2015, 126 of 601 installed WTGs were installed by the customers
themselves, while 475 were installed by Senvion’s staff or subcontracted
companies.
• Integrated services
The integrated service supports the customer with the planning of wind farms
and evaluation of locations and potential risks related to the project. The
company also offers support with local restrictions and carries out the planning
for the connection of the wind farm to electricity grids.
• Logistic services
Delivering a WTG and organizing the transport to a wind farm is a challenging
project. Senvion is able to deliver WTGs to nearly every location more than 50
kilometres offshore and to a depth of more than 40 metres.
• Operation and maintenance
The operation and maintenance services include 24-hour remote monitoring,
maintenance and repair services. While most of the onshore wind farms can be
reached within approx. two hours from a service centre, 60% of faults can be
diagnosed and rectified by the system remotely. Those services are offered in
separate contracts.
The “Integrated Service Package” accounts for 86% of service revenues. This
package includes all spare parts and labour necessary to keep WTG operations
up and running. The contract duration can range from two to 20 years.
Customers requiring a more customised contract may select parts of the
contract only.
Senvion also offers standardised maintenance contracts which account for 5%
of service revenues.
The renewal rate of service contracts was about 75% in 2015.
Page 53
Senvion
FU L L NO T E Publ ished 17 .01 .2017 53
Management
Management Board of Senvion
Dr. Jürgen M. Geißinger, CEO
Jürgen Geißinger (age: 56) joined the management board of Senvion in December 2015.
His career started at the Fraunhofer Institute of Production Technology and Automation,
where he gained his PhD. After working for Heidelberger Druckmaschinen, Jürgen
Geißinger held leading positions at ITT, a company in the automotive industry. In 1998
he was appointed CEO of Schaeffler and held this position until 2013. During that time
he was responsible for the company’s growth strategy and the successful expansion to
emerging markets. After leaving Schaeffler he was appointed to several supervisory
boards and is still a member of the supervisory board at MTU Aero Engines and Sandvik.
Manav Sharma, CFO
Manav Sharma (age: 34) became CFO of Senvion in July 2015. He has a Bachelor
Degree in Computer Engineering and a post graduate degree in Management from the
Symbiosis International University in Pune. His career started at ITC – an Indian
conglomerate – where he was responsible for business development, sales and
marketing. Afterwards Manav Sharma worked for Ernst & Young in the field of Business
Advisory. In 2008 he joined Suzlon as a Senior Manager and was later promoted
“Assistant General Manager for Strategy” in the chairman’s office. From there, he
managed several projects in business development, portfolio management of group
investments, strategy and global M&A.
Supervisory Board of Senvion
Stefan Kowski
Stefan Kowski (age: 37) leads Centerbridge’s corporate private equity investment
business in Europe. In 2014 he joined Centerbridge as a Managing Director. He received
an MBA from Harvard Business School and previously worked in the Mergers,
Acquisitions and Restructurings Department at Morgan Stanley.
Other members of the Supervisory board include Deepak Misra, Todd Morgan, Amol
Jain, Matthias Schubert and Prof. Dr. Martin Skiba.
Page 54
Senvion
FU L L NO T E Publ ished 17 .01 .2017 54
DCF model
Detailed forecast period Transitional period Term. Value
Figures in EUR m 2016e 2017e 2018e 2019e 2020e 2021e 2022e 2023e 2024e 2025e 2026e 2027e 2028e
Sales 2,234 2,076 2,310 1,929 1,987 2,037 2,088 2,140 2,193 2,237 2,282 2,328 2,363
Sales change 4.4 % -7.1 % 11.3 % -16.5 % 3.0 % 2.5 % 2.5 % 2.5 % 2.5 % 2.0 % 2.0 % 2.0 % 1.5 % 1.5 %
EBIT 40 29 104 77 99 122 131 130 128 126 124 122 120
EBIT-margin 1.8 % 1.4 % 4.5 % 4.0 % 5.0 % 6.0 % 6.3 % 6.1 % 5.8 % 5.6 % 5.4 % 5.2 % 5.1 %
Tax rate (EBT) 15.0 % 15.0 % 15.0 % 30.0 % 30.0 % 30.0 % 30.0 % 30.0 % 30.0 % 30.0 % 30.0 % 30.0 % 30.0 %
NOPAT 34 25 88 54 70 86 92 91 90 88 87 86 84
Depreciation 162 153 110 87 79 71 63 64 66 67 68 70 71
in % of Sales 7.3 % 7.4 % 4.8 % 4.5 % 4.0 % 3.5 % 3.0 % 3.0 % 3.0 % 3.0 % 3.0 % 3.0 % 3.0 %
Changes in provisions 0 0 0 0 0 0 0 0 0 0 0 0 0
Change in Liquidity from
- Working Capital -7 33 27 26 19 20 11 1 12 1 1 1 1
- Capex 115 115 110 96 89 81 84 86 88 89 91 93 71
Capex in % of Sales 5.1 % 5.5 % 4.8 % 5.0 % 4.5 % 4.0 % 4.0 % 4.0 % 4.0 % 4.0 % 4.0 % 4.0 % 3.0 %
Other 0 0 0 0 0 0 0 0 0 0 0 0 0
Free Cash Flow (WACC Model)
89 30 62 18 40 55 60 68 56 65 63 61 83 67
PV of FCF 82 25 49 13 27 34 34 36 27 29 26 23 29 332 share of PVs 20.44 % 36.25 % 43.31 %
Model parameter Valuation (m)
Derivation of WACC: Derivation of Beta: Present values 2028e 435
Terminal Value 332
Debt ratio 14.00 % Financial Strength 1.40 Financial liabilities 416
Cost of debt (after tax) 4.2 % Liquidity (share) 1.20 Pension liabilities 0
Market return 7.00 % Cyclicality 1.70 Hybrid capital 0
Risk free rate 1.50 % Transparency 1.40 Minority interest 0
Others 1.30 Market val. of investments 0
Liquidity 419 No. of shares (m) 64.9
WACC 8.50 % Beta 1.40 Equity Value 770 Value per share (EUR) 11.87
Sensitivity Value per Share (EUR)
Terminal Growth Delta EBIT-margin
Beta WACC 0.75 % 1.00 % 1.25 % 1.50 % 1.75 % 2.00 % 2.25 % Beta WACC -1.5 pp -1.0 pp -0.5 pp +0.0 pp +0.5 pp +1.0 pp +1.5 pp
1.61 9.5 % 10.03 10.13 10.25 10.37 10.50 10.63 10.78 1.61 9.5 % 6.11 7.53 8.95 10.37 11.79 13.20 14.62
1.51 9.0 % 10.66 10.79 10.92 11.07 11.22 11.39 11.57 1.51 9.0 % 6.54 8.05 9.56 11.07 12.57 14.08 15.59
1.45 8.8 % 11.00 11.14 11.29 11.45 11.62 11.81 12.01 1.45 8.8 % 6.78 8.34 9.90 11.45 13.01 14.57 16.12
1.40 8.5 % 11.37 11.53 11.69 11.87 12.06 12.26 12.48 1.40 8.5 % 7.04 8.65 10.26 11.87 13.48 15.09 16.70
1.35 8.3 % 11.76 11.93 12.12 12.31 12.52 12.75 13.00 1.35 8.3 % 7.31 8.98 10.65 12.31 13.98 15.64 17.31
1.29 8.0 % 12.19 12.37 12.57 12.79 13.03 13.28 13.55 1.29 8.0 % 7.61 9.34 11.06 12.79 14.52 16.25 17.97
1.19 7.5 % 13.12 13.35 13.60 13.87 14.16 14.48 14.83 1.19 7.5 % 8.28 10.14 12.01 13.87 15.74 17.60 19.46
� The DCF model is based on a peak EBIT margin of 6.3% and a long-term sustainable EBIT margin of 4.5%.
� We cautiously estimate top-line growth of 3% p.a. at maximum and a terminal growth rate of 1.5%.
Page 55
Senvion
FU L L NO T E Published 17.01.2017 55
Valuation
2012 2013 2014 2015 2016e 2017e 2018e
Price / Book n.a. n.a. n.a. n.a. 2.0 x 2.2 x 2.0 x
Book value per share ex intangibles 388.53 387.09 389.97 -141.05 -4.03 -4.16 -3.74
EV / Sales n.a. n.a. n.a. n.a. 0.3 x 0.4 x 0.3 x
EV / EBITDA n.a. n.a. n.a. n.a. 3.7 x 4.2 x 3.6 x
EV / EBIT n.a. n.a. n.a. n.a. 18.7 x 26.7 x 7.3 x
EV / EBIT adj.* n.a. n.a. n.a. n.a. 4.9 x 6.3 x 5.3 x
P / FCF n.a. n.a. n.a. n.a. 21.3 x n.a. 83.9 x
P / E n.a. n.a. n.a. n.a. n.a. n.a. 20.7 x
P / E adj.* n.a. n.a. n.a. n.a. n.a. n.a. 20.7 x
Dividend Yield n.a. n.a. n.a. n.a. n.a. n.a. n.a.
Free Cash Flow Yield Potential n.a. n.a. n.a. n.a. 18.4 % 15.5 % 18.5 %
*Adjustments made for: -
Page 56
Senvion
FU L L NO T E Published 17.01.2017 56
Consolidated profit & loss In EUR m 2012 2013 2014 2015 2016e 2017e 2018e
Sales 2,294 1,759 1,922 2,140 2,234 2,076 2,310
Change Sales yoy n.a. -23.3 % 9.3 % 11.3 % 4.4 % -7.1 % 11.3 %
Increase / decrease in inventory -94 12 4 -13 0 0 0
Own work capitalised 21 23 39 45 45 43 41
Total Sales 2,221 1,795 1,965 2,171 2,279 2,119 2,351
Material expenses 1,836 1,366 1,477 1,681 1,671 1,561 1,726
Gross profit 385 429 488 490 608 558 626
Gross profit margin 16.8 % 24.4 % 25.4 % 22.9 % 27.2 % 26.9 % 27.1 %
Personnel expenses 198 196 209 230 255 241 261
Other operating income 70 44 34 54 61 62 69
Other operating expenses 222 152 189 240 212 197 219
Unfrequent items 0 0 0 0 0 0 0
EBITDA 35 124 124 75 202 182 214
Margin 1.5 % 7.1 % 6.5 % 3.5 % 9.1 % 8.8 % 9.3 %
Depreciation of fixed assets 41 45 54 56 59 60 69
EBITA -7 79 70 19 143 122 145
Amortisation of intangible assets 0 0 0 104 103 93 41
Goodwill amortisation 0 0 0 0 0 0 0
EBIT -7 79 70 -85 40 29 104
Margin -0.3 % 4.5 % 3.6 % -4.0 % 1.8 % 1.4 % 4.5 %
EBIT adj. 48 80 90 154 153 122 145
Interest income 3 1 2 2 2 2 2
Interest expenses 16 16 20 97 65 60 65
Other financial income (loss) 0 0 0 0 0 0 0
EBT -20 26 52 -188 -23 -30 41
Margin -0.9 % 1.5 % 2.7 % -8.8 % -1.0 % -1.4 % 1.8 %
Total taxes -8 14 21 -32 -3 -4 6
Net income from continuing operations -12 12 31 -156 -19 -25 35
Income from discontinued operations (net of tax) 0 -8 1 0 0 0 0
Net income before minorities -12 5 32 -156 -19 -25 35
Minority interest 0 0 0 -5 0 0 0
Net income -12 5 32 -151 -19 -25 35
Margin -0.5 % 0.3 % 1.7 % -7.0 % -0.9 % -1.2 % 1.5 %
Number of shares, average 1 1 1 5 65 63 63
EPS -12.40 4.86 32.10 -28.11 -0.30 -0.40 0.56
EPS adj. -12.40 4.86 32.10 -28.11 -0.30 -0.40 0.56
*Adjustments made for:
Guidance: FY 2016: sales of EUR 2.25-2.30bn; adj. EBITDA margin of c. 9.5%
Financial Ratios 2012 2013 2014 2015 2016e 2017e 2018e
Total Operating Costs / Sales 95.3 % 95.0 % 95.8 % 98.0 % 93.0 % 93.3 % 92.5 %
Operating Leverage n.a. n.a. -1.3 x n.a. n.a. 4.1 x 23.0 x
EBITDA / Interest expenses 2.1 x 7.7 x 6.2 x 0.8 x 3.1 x 3.0 x 3.3 x
Tax rate (EBT) 39.4 % 52.8 % 40.7 % 17.1 % 15.0 % 15.0 % 15.0 %
Dividend Payout Ratio 0.0 % 0.0 % 0.0 % 0.0 % 0.0 % 0.0 % 0.0 %
Sales per Employee n.a. n.a. n.a. n.a. n.a. n.a. n.a.
Sales, EBITDA in EUR m
Source: Warburg Research
Operating Performance in %
Source: Warburg Research
Performance per Share
Source: Warburg Research
Page 57
Senvion
FU L L NO T E Published 17.01.2017 57
Consolidated balance sheet In EUR m 2012 2013 2014 2015 2016e 2017e 2018e
Assets
Goodwill and other intangible assets 105 118 142 687 634 591 600
thereof other intangible assets 89 102 126 687 634 591 600
thereof Goodwill 16 16 16 0 0 0 0
Property, plant and equipment 192 201 205 193 219 224 215
Financial assets 0 0 0 0 0 0 0
Other long-term assets 24 21 13 21 21 21 21
Fixed assets 320 341 360 901 874 836 836
Inventories 530 569 583 417 319 319 356
Accounts receivable 144 155 178 231 306 313 342
Liquid assets 381 270 301 419 427 390 398
Other short-term assets 171 240 208 158 158 158 158
Current assets 1,226 1,235 1,270 1,225 1,210 1,180 1,254
Total Assets 1,546 1,576 1,629 2,126 2,085 2,016 2,090
Liabilities and shareholders' equity
Subscribed capital 9 9 9 0 1 1 1
Capital reserve 304 304 299 27 495 495 495
Retained earnings 0 3 3 7 -13 -38 -3
Other equity components 181 189 220 -103 -111 -128 -128
Shareholders' equity 493 505 532 -70 373 330 365
Minority interest 9 5 7 0 0 0 0
Total equity 502 510 539 -69 373 330 365
Provisions 200 242 264 280 280 280 280
thereof provisions for pensions and similar obligations 0 0 0 0 0 0 0
Financial liabilities (total) 75 75 56 903 434 434 434
thereof short-term financial liabilities 10 8 8 6 6 6 6
Accounts payable 312 331 337 382 367 341 380
Other liabilities 456 418 433 631 631 631 631
Liabilities 1,044 1,065 1,090 2,196 1,712 1,686 1,724
Total liabilities and shareholders' equity 1,546 1,576 1,629 2,126 2,085 2,016 2,090
Financial Ratios 2012 2013 2014 2015 2016e 2017e 2018e
Efficiency of Capital Employment
Operating Assets Turnover 13.0 x 6.5 x 6.7 x 22.5 x 19.6 x 13.7 x 13.7 x
Capital Employed Turnover 11.7 x 5.6 x 6.5 x 5.2 x 5.9 x 5.5 x 5.8 x
ROA -3.9 % 1.4 % 8.9 % -16.7 % -2.2 % -3.0 % 4.2 %
Return on Capital
ROCE (NOPAT) n.a. 14.7 % 13.7 % n.a. 8.7 % 6.5 % 22.8 %
ROE n.a. 1.0 % 6.2 % -65.2 % -12.6 % -7.2 % 10.1 %
Adj. ROE n.a. 1.0 % 6.2 % -65.2 % -12.6 % -7.2 % 10.1 %
Balance sheet quality
Net Debt -306 -195 -245 483 7 44 36
Net Financial Debt -306 -195 -245 483 7 44 36
Net Gearing -61.0 % -38.3 % -45.5 % -696.8 % 1.8 % 13.4 % 9.7 %
Net Fin. Debt / EBITDA n.a. n.a. n.a. 644.3 % 3.3 % 24.3 % 16.6 %
Book Value / Share 493.1 505.2 532.0 -13.0 5.7 5.3 5.8
Book value per share ex intangibles 388.5 387.1 390.0 -141.1 -4.0 -4.2 -3.7
ROCE Development
Source: Warburg Research
Net debt in EUR m
Source: Warburg Research
Book Value per Share in EUR
Source: Warburg Research
Page 58
Senvion
FU L L NO T E Published 17.01.2017 58
Consolidated cash flow statement In EUR m 2012 2013 2014 2015 2016e 2017e 2018e
Net income -12 5 32 -107 -19 -25 35
Depreciation of fixed assets 41 45 54 110 59 60 69
Amortisation of goodwill 0 0 0 0 0 0 0
Amortisation of intangible assets 0 0 0 104 103 93 41
Increase/decrease in long-term provisions 103 39 0 -17 0 0 0
Other non-cash income and expenses -2 27 4 10 0 0 0
Cash Flow before NWC change 129 115 90 101 143 128 145
Increase / decrease in inventory 0 0 0 0 97 0 -36
Increase / decrease in accounts receivable 0 0 0 0 -75 -7 -29
Increase / decrease in accounts payable 0 0 0 0 -15 -26 39
Increase / decrease in other working capital positions 0 0 0 0 0 0 0
Increase / decrease in working capital (total) -102 -4 30 321 7 -33 -27
Net cash provided by operating activities [1] 27 111 120 318 150 95 119
Investments in intangible assets -23 -26 -44 -32 -50 -50 -50
Investments in property, plant and equipment -32 -44 -39 -16 -65 -65 -60
Payments for acquisitions 0 0 0 -731 -20 0 0
Financial investments 0 0 0 0 0 0 0
Income from asset disposals 4 4 2 1 0 0 0
Net cash provided by investing activities [2] -51 -66 -81 -779 -135 -115 -110
Change in financial liabilities -9 -8 -8 872 0 0 0
Dividends paid 0 0 0 0 0 0 0
Purchase of own shares 0 0 0 0 -8 -18 0
Capital measures 0 0 0 2 0 0 0
Other 0 0 0 0 0 0 0
Net cash provided by financing activities [3] -9 -8 -8 874 -8 -18 0
Change in liquid funds [1]+[2]+[3] -33 37 32 413 8 -38 9
Effects of exchange-rate changes on cash 0 0 0 0 0 0 0
Cash and cash equivalent at end of period 231 274 301 419 427 390 398
Financial Ratios 2012 2013 2014 2015 2016e 2017e 2018e
Cash Flow
FCF -28 42 37 270 35 -20 9
Free Cash Flow / Sales -1.2 % 2.4 % 1.9 % 12.6 % 1.6 % -1.0 % 0.4 %
Free Cash Flow Potential 42 65 104 99 139 120 142
Free Cash Flow / Net Profit 228.3 % 857.1 % 115.8 % -178.7 % -184.1 % 79.3 % 24.8 %
Interest Received / Avg. Cash n.a. 0.3 % 0.7 % 0.5 % 0.4 % 0.4 % 0.5 %
Interest Paid / Avg. Debt n.a. 21.6 % 30.6 % 20.1 % 9.7 % 13.9 % 14.9 %
Management of Funds
Investment ratio 2.4 % 3.9 % 4.3 % 2.3 % 5.1 % 5.5 % 4.8 %
Maint. Capex / Sales 0.0 % 0.0 % 0.0 % 0.0 % 3.0 % 3.2 % 2.9 %
Capex / Dep 134.7 % 154.4 % 153.7 % 30.3 % 71.0 % 75.1 % 99.7 %
Avg. Working Capital / Sales n.a. 1.6 % 3.9 % -0.4 % -4.6 % -4.3 % -2.6 %
Trade Debtors / Trade Creditors 46.1 % 46.9 % 52.8 % 60.4 % 83.3 % 91.6 % 90.0 %
Inventory Turnover 3.5 x 2.4 x 2.5 x 4.0 x 5.2 x 4.9 x 4.9 x
Receivables collection period (days) 23 32 34 39 50 55 54
Payables payment period (days) 62 88 83 83 80 80 80
Cash conversion cycle (Days) -25 -9 -11 -62 -80 -79 -71
CAPEX and Cash Flow in EUR m
Source: Warburg Research
Free Cash Flow Generation
Source: Warburg Research
Working Capital
Source: Warburg Research
Page 59
Senvion
FU L L NO T E Published 17.01.2017 59
LEGAL DISCLAIMER
This research report (“investment recommendation” or “recommendation”) was prepared by the Warburg Research GmbH, a fully owned subsidiary of
the M.M.Warburg & CO (AG & Co.) KGaA and is passed on by the M.M.Warburg & CO (AG & Co.) KGaA. It contains selected information and does not
purport to be complete. The report is based on publicly available information and data ("the information") believed to be accurate and complete.
Warburg Research GmbH neither examines the information for accuracy and completeness, nor guarantees its accuracy and completeness. Possible
errors or incompleteness of the information do not constitute grounds for liability of M.M.Warburg & CO (AG & Co.) KGaA or Warburg Research GmbH
for damages of any kind whatsoever, and M.M.Warburg & CO (AG & Co.) KGaA and Warburg Research GmbH are not liable for indirect and/or direct
and/or consequential damages. In particular, neither M.M.Warburg & CO (AG & Co.) KGaA nor Warburg Research GmbH are liable for the statements,
plans or other details contained in these analyses concerning the examined companies, their affiliated companies, strategies, economic situations,
market and competitive situations, regulatory environment, etc. Although due care has been taken in compiling this research report, it cannot be
excluded that it is incomplete or contains errors. M.M.Warburg & CO (AG & Co.) KGaA and Warburg Research GmbH, their shareholders and
employees are not liable for the accuracy and completeness of the statements, estimations and the conclusions derived from the information contained
in this document. Provided a research report is being transmitted in connection with an existing contractual relationship, i.e. financial advisory or similar
services, the liability of M.M.Warburg & CO (AG & Co.) KGaA and Warburg Research GmbH shall be restricted to gross negligence and wilful
misconduct. In case of failure in essential tasks, M.M.Warburg & CO (AG & Co.) KGaA and Warburg Research GmbH are liable for normal negligence.
In any case, the liability of M.M.Warburg & CO (AG & Co.) KGaA and Warburg Research GmbH is limited to typical, expectable damages. This
research report does not constitute an offer or a solicitation of an offer for the purchase or sale of any security. Partners, directors or employees of
M.M.Warburg & CO (AG & Co.) KGaA, Warburg Research GmbH or affiliated companies may serve in a position of responsibility, i.e. on the board of
directors of companies mentioned in the report. Opinions expressed in this report are subject to change without notice. All rights reserved.
COPYRIGHT NOTICE
This work including all its parts is protected by copyright. Any use beyond the limits provided by copyright law without permission is prohibited and
punishable. This applies, in particular, to reproductions, translations, microfilming, and storage and processing on electronic media of the entire content
or parts thereof.
DISCLOSURE ACCORDING TO §34B OF THE GERMAN SECURITIES TRADING ACT (WHPG), THE ORDINANCE ON THE ANALYSIS OF FINANCIAL INSTRUMENTS (FINANV) AND MAR INCL. COMMISSION DELEGATED REGULATION (EU) 2016/958
The valuation underlying the investment recommendation for the company analysed here is based on generally accepted and widely used methods of
fundamental analysis, such as e.g. DCF Model, Free Cash Flow Potential, Peer Group Comparison or Sum of the Parts Model. The result of this
fundamental valuation is modified to take into consideration the analyst’s assessment as regards the expected development of investor sentiment and
its impact on the share price.
Independent of the applied valuation methods, there is the risk that the price target will not be met, for instance because of unforeseen changes in
demand for the company’s products, changes in management, technology, economic development, interest rate development, operating and/or
material costs, competitive pressure, supervisory law, exchange rate, tax rate etc. For investments in foreign markets and instruments there are further
risks, generally based on exchange rate changes or changes in political and social conditions.
This commentary reflects the opinion of the relevant author at the point in time of its compilation. A change in the fundamental factors underlying the
valuation can mean that the valuation is subsequently no longer accurate. Whether, or in what time frame, an update of this commentary follows is not
determined in advance.
Additional internal and organisational arrangements to prevent or to deal with conflicts of interest have been implemented. Among these are the spatial
separation of Warburg Research GmbH from M.M.Warburg & CO (AG & Co.) KGaA and the creation of areas of confidentiality. This prevents the
exchange of information, which could form the basis of conflicts of interest for Warburg Research in terms of the analysed issuers or their financial
instruments.
The analysts of Warburg Research GmbH do not receive a gratuity – directly or indirectly – from the investment banking activities of M.M.Warburg &
CO (AG & Co.) KGaA or of any company within the Warburg Group.
All prices of financial instruments given in this investment recommendation are the closing prices on the last stock-market trading day before the
publication date stated, unless another point in time is explicitly stated.
M.M.Warburg & CO (AG & Co.) KGaA and Warburg Research GmbH are subject to the supervision of the Federal Financial Supervisory Authority,
BaFin. M.M.Warburg & CO (AG & Co.) KGaA is additionally subject to the supervision of the European Central Bank (ECB).
SOURCES
All data and consensus estimates have been obtained from FactSet except where stated otherwise.
Page 60
Senvion
FU L L NO T E Published 17.01.2017 60
Additional information for clients in the United States
1. This research report (the “Report”) is a product of Warburg Research GmbH, Germany, a fully owned subsidiary of M.M.Warburg & CO (AG & Co.)
KGaA, Germany (in the following collectively “Warburg”). Warburg is the employer of the research analyst(s), who have prepared the Report. The
research analyst(s) reside outside the United States and are not associated persons of any U.S. regulated broker-dealer and therefore are not subject
to the supervision of any U.S. regulated broker-dealer.
2. The Report is provided in the United States for distribution solely to "major U.S. institutional investors" under Rule 15a-6 of the U.S. Securities
Exchange Act of 1934.
3. Any recipient of the Report should effect transactions in the securities discussed in the Report only through J.P.P. Euro-Securities, Inc., Delaware.
4. J.P.P. Euro-Securities, Inc. does not accept or receive any compensation of any kind for the dissemination of the research reports from Warburg.
Reference in accordance with section 34b of the German Securities Trading Act (WpHG), the Ordinance on the Analysis of Financial Instruments (FinAnV), MAR and Commission Delegated Regulation (EU) regarding possible conflicts of interest with companies analysed:
-1- Warburg Research, or an affiliated company, or an employee of one of these companies responsible for the compilation of the research, hold
a share of more than 5% of the equity capital of the analysed company.
-2-
Warburg Research, or an affiliated company, within the last twelve months participated in the management of a consortium for an issue in
the course of a public offering of such financial instruments, which are, or the issuer of which is, the subject of the investment
recommendation.
-3- Companies affiliated with Warburg Research manage financial instruments, which are, or the issuers of which are, subject of the
investment recommendation, in a market based on the provision of buy or sell contracts.
-4-
MMWB, Warburg Research, or an affiliated company, reached an agreement with the issuer to provide investment banking and/or
investment services and the relevant agreement was in force in the last 12 months or there arose for this period, based on the relevant
agreement, the obligation to provide or to receive a service or compensation - provided that this disclosure does not result in the disclosure of
confidential business information.
-5- The company compiling the analysis or an affiliated company had reached an agreement on the compilation of the investment
recommendation with the analysed company.
-6- Companies affiliated with Warburg Research regularly trade financial instruments of the analysed company or derivatives of these.
-6a- Warburg Research, or an affiliated company, holds a net long position of more than 0.5% of the total issued share capital of the analysed
company.
-6b- Warburg Research, or an affiliated company, holds a net short position of more than 0.5% of the total issued share capital of the analysed
company.
-6c- The issuer holds shares of more than 5% of the total issued capital of Warburg Research or an affiliated company.
-7- The company preparing the analysis as well as its affiliated companies and employees have other important interests in relation to the
analysed company, such as, for example, the exercising of mandates at analysed companies.
This report has been made accessible to the company analysed.
Company Disclosure Link to the historical price targets and rating changes (last 12 months)
Senvion – http://www.mmwarburg.com/disclaimer/disclaimer_en/LU1377527517.htm
Page 61
Senvion
FU L L NO T E Published 17.01.2017 61
INVESTMENT RECOMMENDATION
Investment recommendation: expected direction of the share price development of the financial instrument up to the given price target in the opinion of
the analyst who covers this financial instrument.
-B- Buy: The price of the analysed financial instrument is expected to rise over the next 12 months.
-H- Hold: The price of the analysed financial instrument is expected to remain mostly flat over the next 12
months.
-S- Sell: The price of the analysed financial instrument is expected to fall over the next 12 months.
“-“ Rating suspended: The available information currently does not permit an evaluation of the company.
WARBURG RESEARCH GMBH – ANALYSED RESEARCH UNIVERSE BY RATING
Rating Number of stocks % of Universe
Buy 121 63
Hold 66 34
Sell 4 2
Rating suspended 1 1
Total 192 100
WARBURG RESEARCH GMBH – ANALYSED RESEARCH UNIVERSE BY RATING N
N taking into account only those companies which were provided with major investment services in the last twelve months.
Rating Number of stocks % of Universe
Buy 28 72
Hold 10 26
Sell 0 0
Rating suspended 1 3
Total 39 100
PRICE AND RATING HISTORY SENVION AS OF 17.01.2017
Markings in the chart show rating changes by Warburg Research
GmbH in the last 12 months. Every marking details the date and
closing price on the day of the rating change.
Page 62
Senvion
FU L L NO T E Published 17.01.2017 62
EQUITIES Roland Rapelius +49 40 3282-2673 Head of Equities [email protected] RESEARCH Michael Heider +49 40 309537-280 Andreas Pläsier +49 40 309537-246 Head of Research [email protected] Banks, Financial Services [email protected]
Henner Rüschmeier +49 40 309537-270 Jochen Reichert +49 40 309537-130 Head of Research [email protected] Telco, Internet, Media [email protected]
Lucas Boventer +49 40 309537-290 J. Moritz Rieser +49 40 309537-260 Renewables, Internet, Media [email protected] Real Estate [email protected]
Christian Cohrs +49 40 309537-175 Arash Roshan Zamir +49 40 309537-155 Engineering, Logistics [email protected] Cap. Goods, Renewables [email protected]
Felix Ellmann +49 40 309537-120 Malte Schaumann +49 40 309537-170 Software, IT [email protected] Technology [email protected]
Jörg Philipp Frey +49 40 309537-258 Oliver Schwarz +49 40 309537-250 Retail, Consumer Goods [email protected] Chemicals, Agriculture [email protected]
Marie-Thérèse Grübner +49 40 309537-240 Marc-René Tonn +49 40 309537-259 Small Cap Research [email protected] Automobiles, Car Suppliers [email protected]
Ulrich Huwald +49 40 309537-255 Björn Voss +49 40 309537-254 Health Care, Pharma [email protected] Steel, Car Suppliers [email protected]
Thilo Kleibauer +49 40 309537-257 Alexander Wahl +49 40 309537-230 Retail, Consumer Goods [email protected] Car Suppliers, Technology [email protected]
Eggert Kuls +49 40 309537-256 Andreas Wolf +49 40 309537-140 Engineering [email protected] Software, IT [email protected]
Henrik Paganetty +49 40 309537-185 Telecommunications [email protected] INSTITUTIONAL EQUITY SALES Holger Nass +49 40 3282-2669 Michael Kriszun +49 40 3282-2695 Head of Equity Sales, USA [email protected] United Kingdom [email protected]
Klaus Schilling +49 40 3282-2664 Marc Niemann +49 40 3282-2660 Dep. Head of Equity Sales, GER [email protected] Germany [email protected]
Tim Beckmann +49 40 3282-2665 Sanjay Oberoi +49 69 5050-7410 United Kingdom [email protected] United Kingdom [email protected]
Lyubka Bogdanova +49 69 5050-7411 Simon Pallhuber +49 69 5050-7414 United Kingdom, Australia [email protected] Switzerland, France [email protected]
Jens Buchmüller +49 69 5050-7415 Scandinavia, Austria [email protected]
Paul Dontenwill +49 40 3282-2666 Angelika Flegler +49 69 5050-7417 USA [email protected] Roadshow/Marketing [email protected]
Matthias Fritsch +49 40 3282-2696 Juliane Willenbruch +49 40 3282-2694 United Kingdom [email protected] Roadshow/Marketing [email protected]
SALES TRADING Oliver Merckel +49 40 3282-2634 Bastian Quast +49 40 3282-2701 Head of Sales Trading [email protected] Sales Trading [email protected] Elyaz Dust +49 40 3282-2702 Jörg Treptow +49 40 3262-2658 Sales Trading [email protected] Sales Trading [email protected] Michael Ilgenstein +49 40 3282-2700 Jan Walter +49 40 3262-2662 Sales Trading [email protected] Sales Trading [email protected] MACRO RESEARCH Carsten Klude +49 40 3282-2572 Dr. Christian Jasperneite +49 40 3282-2439 Macro Research [email protected] Investment Strategy [email protected] Our research can be found under: Warburg Research http://research.mmwarburg.com/en/index.html Thomson Reuters www.thomsonreuters.com Bloomberg MMWA GO Capital IQ www.capitaliq.com FactSet www.factset.com For access please contact:
Andrea Schaper +49 40 3282-2632 Kerstin Muthig +49 40 3282-2703 Sales Assistance [email protected] Sales Assistance [email protected]


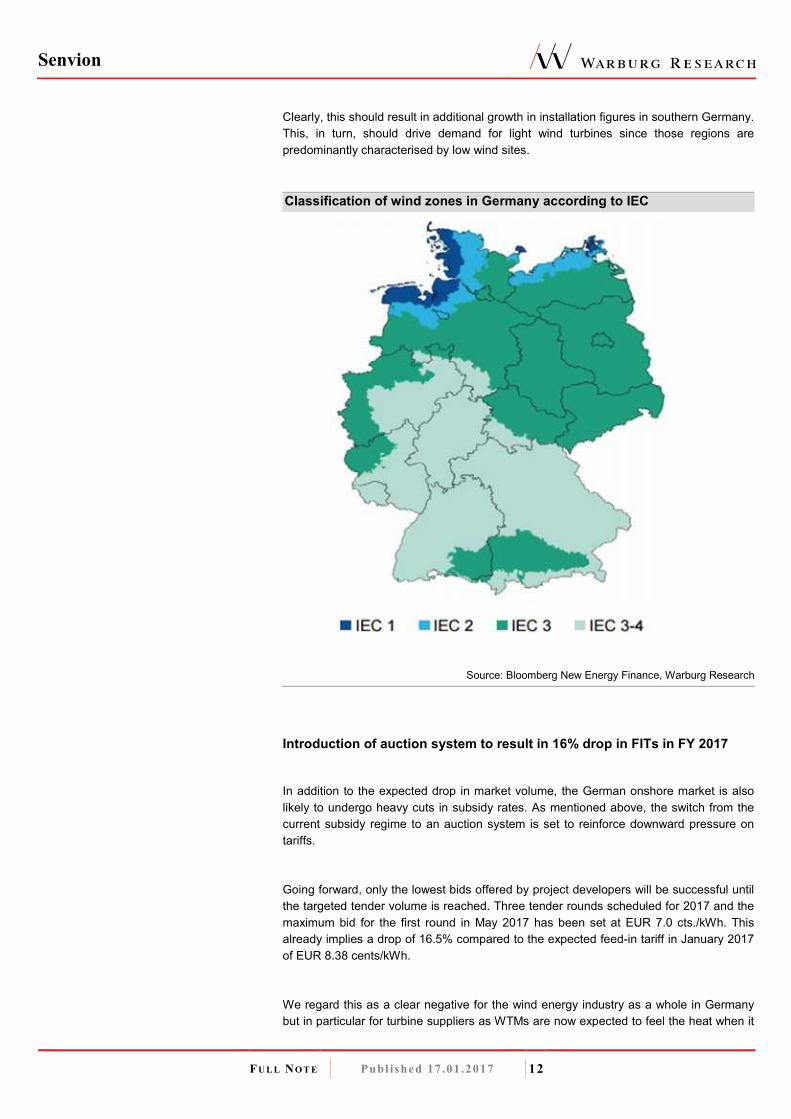


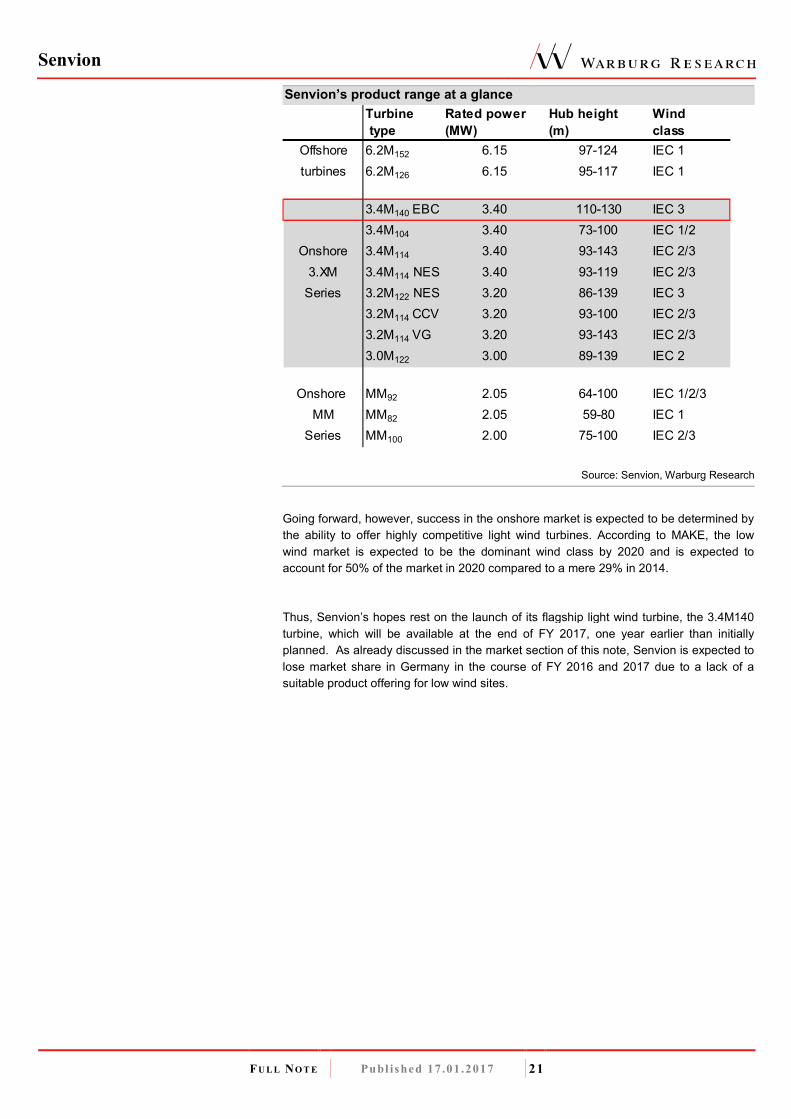


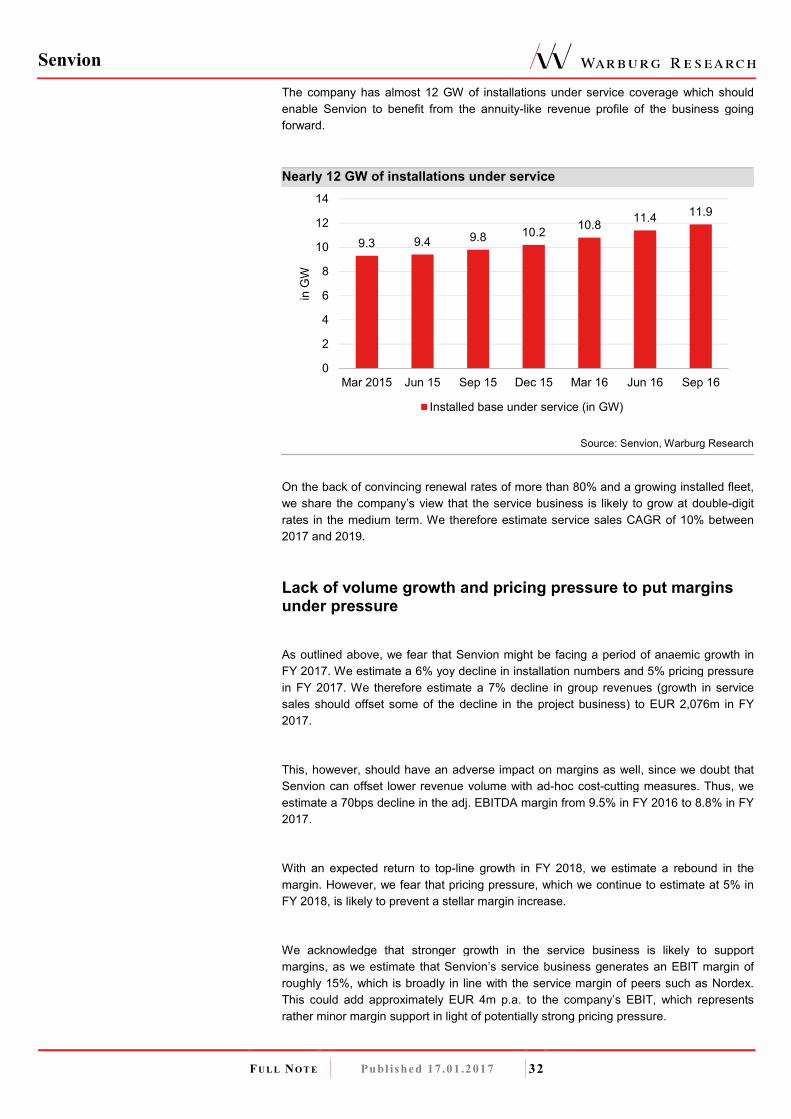
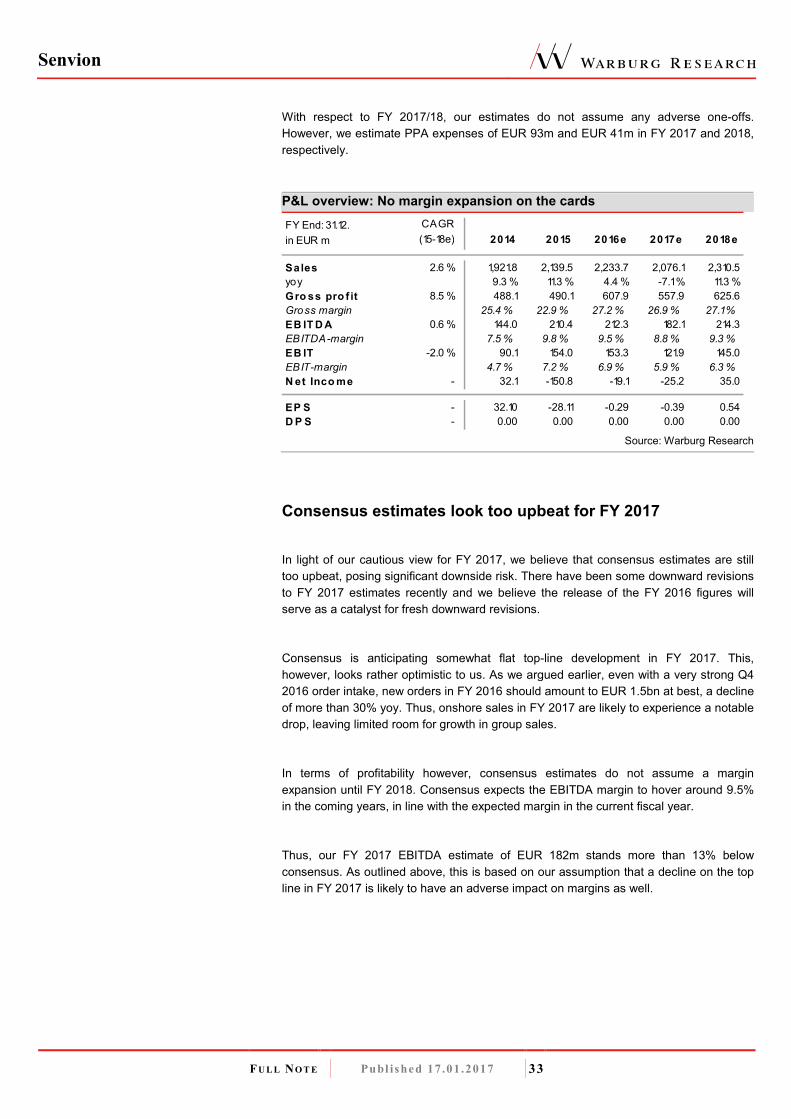


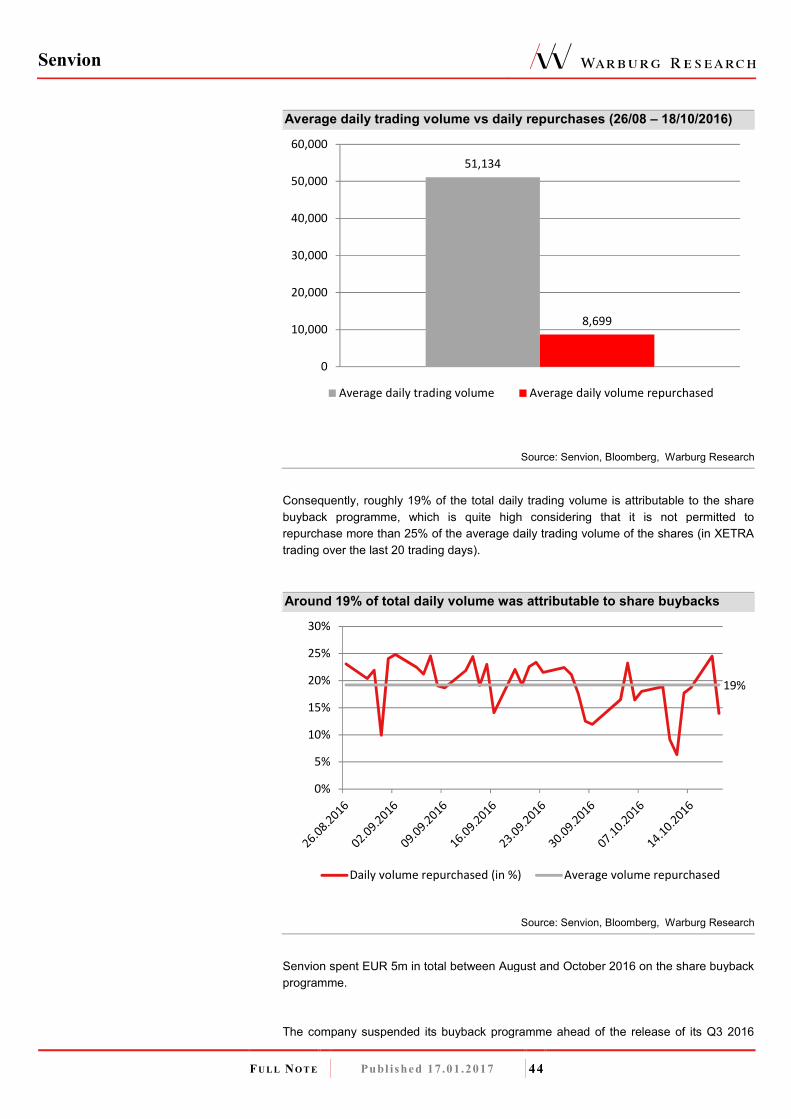


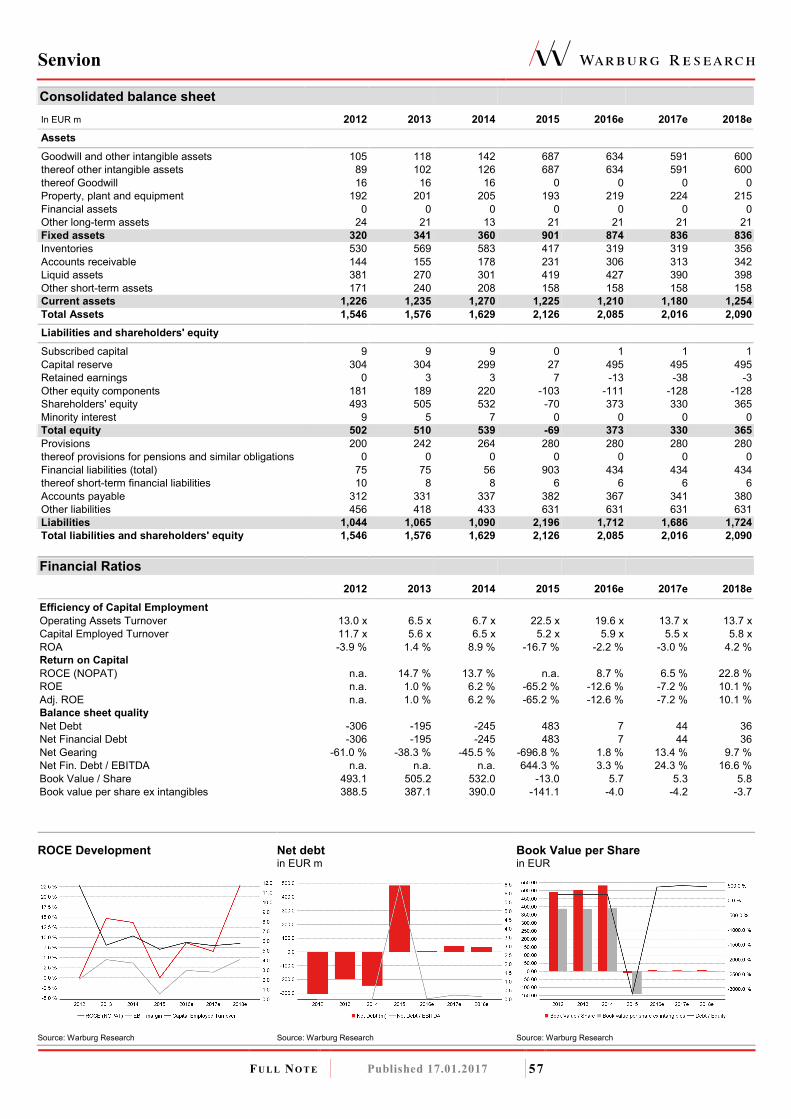


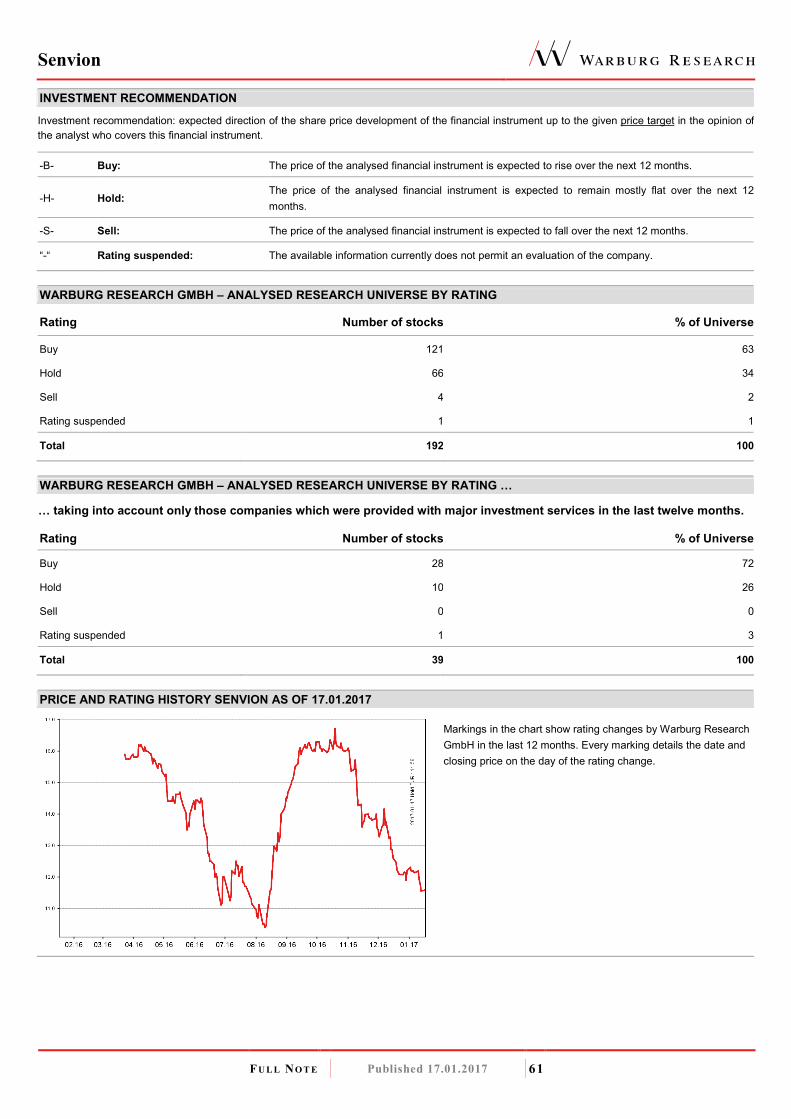


![Charts on Q4 FY 2019/20 Facts & Figures - ThyssenKrupp · 2020. 10. 1. · Q4 EBIT adj. with sequential recovery, particularly at Auto and Materials businesses [€ mn] 1. Figures](https://static.documents.pub/doc/80x56/60bb7a6789ce347487097e40/charts-on-q4-fy-201920-facts-figures-thyssenkrupp-2020-10-1-q4-ebit.jpg)


