18
an Association of Clinical Documentation Improvement Specialists publication www.acdis.org 2017 PHYSICIAN QUERY BENCHMARKING SURVEY

an Association of Clinical Documentation Improvement Specialists publication www.acdis.org
2017P H Y S I C I A N Q U E R Y BENCHMARKING SURVEY

2 Physician Query Benchmarking Survey | 2017 © 2017 HCPro, an H3.Group brand
Query survey shows areas of both growth and stagnation
It’s been nearly four years since ACDIS’ last survey regarding query practices. The 2017 Physician Query Benchmarking Survey, released in January, garnered 361 respondents. The previous survey, released in 2013, attracted 517 respondents. Though the numbers shifted, the distribution of professional titles remained statisti-cally similar. In 2013, 71.95% of the respondents identi-fied as CDI specialists; in 2017, 65.96% identified as CDI specialists.
The 38-question survey illustrates many ways the CDI profession has matured in recent years. Yet, in some areas, it also reveals stagnation or even backpedaling.
Purpose of reviews
At the beginning of CDI’s existence, most programs focused on MS-DRG assignment and CC/MCC capture; however, the practice of CDI has evolved over time. With the advent of new quality reporting systems, one might assume CDI departments would continue to shift away from traditional CC/MCC capture reviews to a more holistic approach.
“Compliance-wise, we had to start focusing on all opportunities. Once you step into the quality world, though, it can be overwhelming and complicated,” says Melinda Scharf, RN, BSN, CCDS, CCS, a regional clinical documentation integrity educator at St. Joseph Health in Irvine, California.
The 2017 survey showed an upturn in the number of people reviewing primarily for financial impact (from 20.8% in 2013 to 37.89% in 2017), while the percentage of those reviewing for any documentation clarification went down from 67.37% in 2013 to 51.93% in 2017. (See Figure 1.)
“On the one hand, those numbers were really very sur-prising and, quite frankly, alarming. On the other hand, though, maybe it’s not so surprising. We’re under so much pressure to prove a return on investment,” says Shelia Duhon, MBA, RN, CCDS, A-CCRN, the
national director for CDI education at Tenet Healthcare in Spring, Texas.
Perhaps even more troublingly, 40.91% of respondents who identified their position as “CDI specialist” said they primarily review for financial effect. This number was only slightly eclipsed by CDI specialists who said they review for any documentation needing clarification, at 51.24%. Both percentages are significant changes from 2013, when only 16.98% of CDI specialists said they reviewed primarily for financial impact and 72.41% said they reviewed for all documentation clarification.
“If that’s the case in the CDI industry, I think I might be in the wrong field and should go work in the auditing industry,” says Dee Banet, RN, CCDS, CDIP, director of CDI at Norton Healthcare in Louisville, Kentucky.
An encouraging number of people said they query for any clarification regardless of reimbursement at 41.27%, yet 0.55% still said they never query this way.
“The fact that we’re reviewing for primarily reimburse-ment is really going to put the industry behind the curve of value-based purchasing. We’re supposed to be look-ing at the bigger picture,” says Mark Dominesey, MBA, RN, CCDS, CDIP, CHTS-CP, the manager of excel-lence in clinical documentation at Children’s National Medical Center in Washington, D.C.
Productivity expectations
For new record reviews, 43.95% of respondents said they review 6–10 charts per day, whereas 30.09% review 11–15. In the 2013 survey, these two numbers were essentially flipped.
Overall, the number of expected new reviews has gone down slightly, with the number of people reviewing more than 16 new charts per day remaining static from the previous survey—21.81% in 2013 versus 21.23% in 2017. (See Figure 2.)
The overall number of expected re-reviews also decreased. In 2013, 30.24% of respondents said they

3 Physician Query Benchmarking Survey | 2017 © 2017 HCPro, an H3.Group brand
conducted more than 16 re-reviews per day. In the 2017 survey, the number of respondents re-reviewing more than 16 charts per day dropped to 20.46%. Almost 40% of respondents conduct 11–15 re-reviews per day, while 31.70% re-review 6–10 per day. The 2013 survey showed most (31.28%) re-reviewing between 11–15 charts and 25.93% reviewing 6–10.
“The days of getting right in and out of the chart are way behind us,” Duhon says.
The depth and type of review conducted highly affects productivity standards, according to ACDIS’ 2017 White Paper “Set CDI productivity expectations, but don’t look for a national standard.”
“Not all reviews are created equal; some reviews may present more opportunities for documentation clarifica-tion or face-to-face discussion with the attending pro-vider—which, of course, require additional time,” accord-ing to the White Paper.
With the rise in CC/MCC- and DRG-focused reviews, however, one might expect to also see a rise in the overall review numbers. This proved not to be the case, accord-ing to the 2017 survey. The middle ranges stayed fairly similar to 2013, while the higher ranges actually dropped by about 10%.
Part of the drop in higher numbers could be linked to electronic health record (EHR) implementation, accord-ing to Scharf. “For us, we have three different applica-tions we’re working in each day. That definitely affects productivity,” she says.
Expansion of review focus and review timing
With all the discussion regarding expansion of review focus, one might expect the percentage of those con-ducting reviews for concerns like severity of illness/risk of mortality (SOI/ROM), core measures, quality, or ICD-10 code specification to have increased.
The data show, however, a leveling out of such reviews if not an outright drop in certain cases. The 2013 survey showed that 7.44% of respondents reviewed primarily for SOI/ROM information; the 2017 survey showed a slight drop to 4.99%. Likewise, the number of respondents reviewing for quality or core measures dropped from 1.15% in 2013 to 0.55% in 2017.
Clinical validation (meaning, according to the survey question, querying “to confirm the presence of a doc-umented diagnosis lacking clinical support”) remains a CDI focus, with 44.41% of respondents saying CDI alone reviews and queries providers for this information; however, 38.55% of respondents say coders also place these queries. (See Figure 3.)
According to the 2017 ICD-10-CM Official Guidelines for Coding and Reporting:
“[T]he assignment of the diagnosis code is based upon the provider’s diagnostic statement that the con-dition exists. The provider’s statement that a condition exists is sufficient. Code assignment is not based on clinical criteria used by the provider to establish the diagnosis.”
While some take this as an elimination of clinical vali-dation queries, this statement is not directed at querying, but at coding, Banet says. Additionally, Recovery Audi-tors (RA) scrutinize diagnoses considered unsupported by the clinical documentation. This means the practice of clinical validation queries will not be going anywhere any time soon.
“We’re probably doing more clinical validation [reviews] for the fear of something getting coded that’s not sup-ported. The guideline has actually created some more issues for us. We have to work harder now,” says Banet.
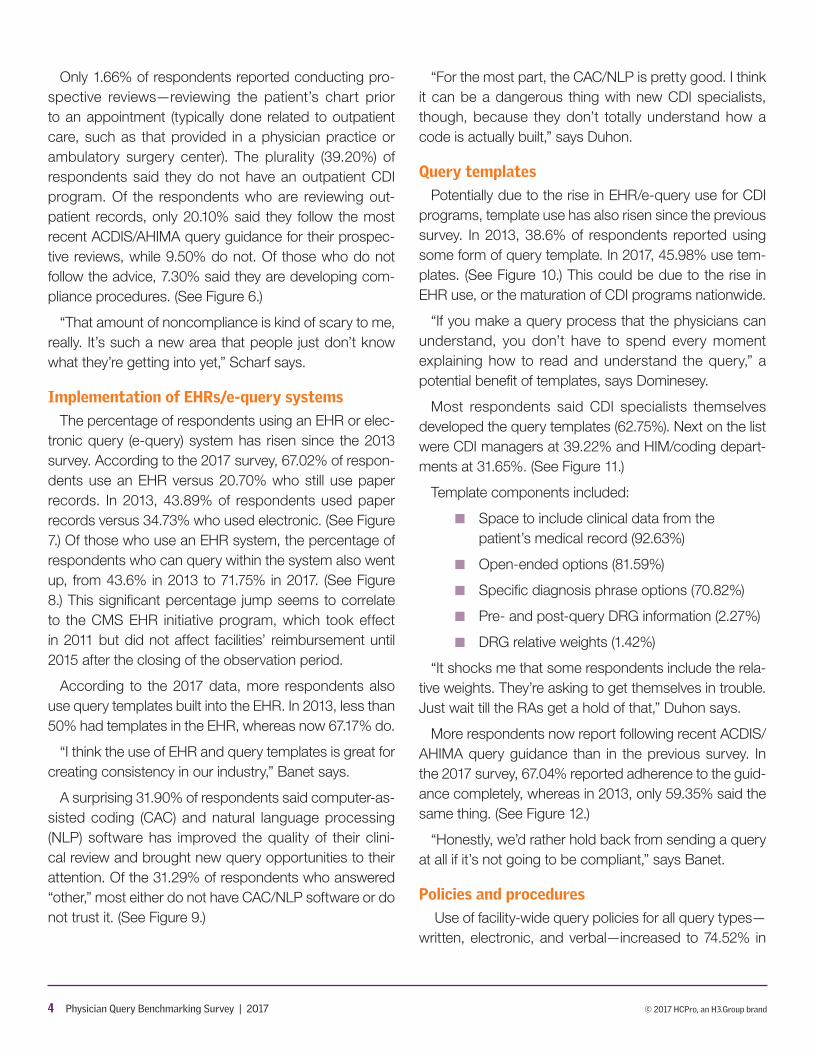
As far as the review timing, the 2017 survey shows the majority of CDI specialists reviewing concurrently (98.06%). About half of respondents—48.75%—said they review retrospectively as well, and another 14.96% also review post-billing. Of the 4.71% who answered “other,” the majority said they conduct retrospective reviews only in mortality cases to fully capture the patient’s SOI/ROM scores. (See Figure 4.)
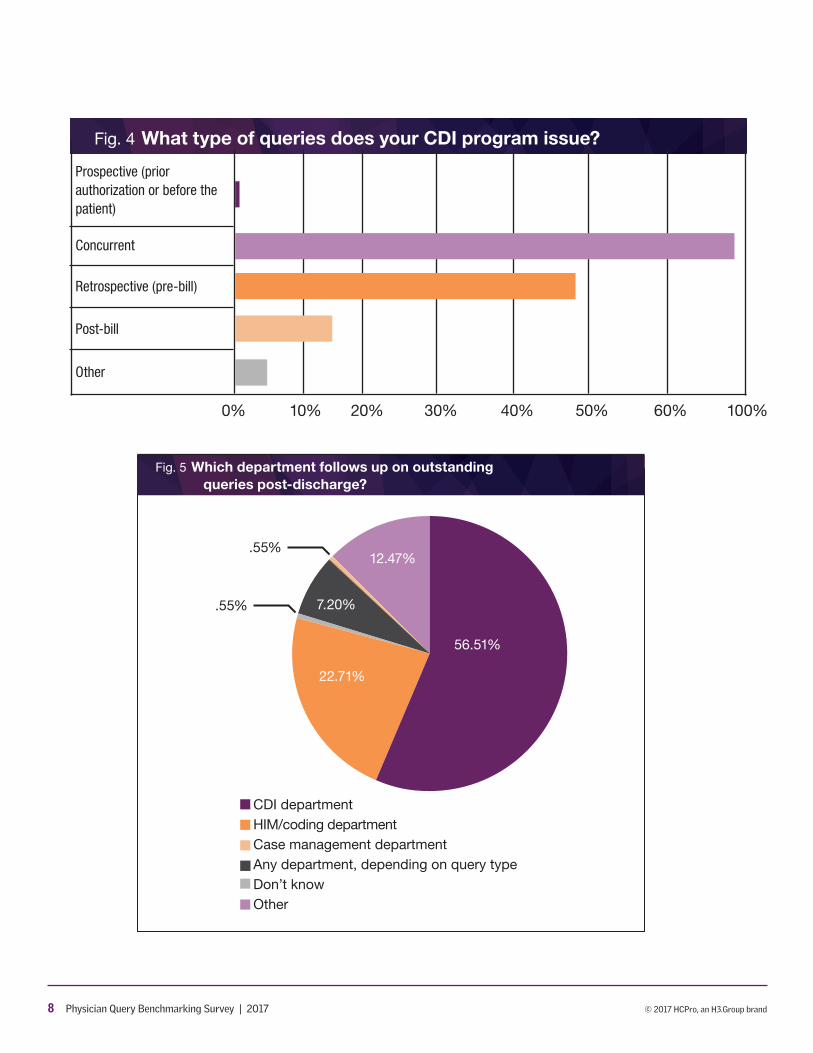
When it comes to outstanding query follow-up post-discharge, most respondents (56.51%) said CDI staff are responsible for that follow-up, with coding or HIM trailing at 22.71%. Respondents who answered “other” are the third place holder at 12.47%. Most of the “other” respondents said that the person who initiates the query is always responsible for the follow-up, even post-discharge. (See Figure 5.)
4 Physician Query Benchmarking Survey | 2017 © 2017 HCPro, an H3.Group brand
Only 1.66% of respondents reported conducting pro-spective reviews—reviewing the patient’s chart prior to an appointment (typically done related to outpatient care, such as that provided in a physician practice or ambulatory surgery center). The plurality (39.20%) of respondents said they do not have an outpatient CDI program. Of the respondents who are reviewing out-patient records, only 20.10% said they follow the most recent ACDIS/AHIMA query guidance for their prospec-tive reviews, while 9.50% do not. Of those who do not follow the advice, 7.30% said they are developing com-pliance procedures. (See Figure 6.)
“That amount of noncompliance is kind of scary to me, really. It’s such a new area that people just don’t know what they’re getting into yet,” Scharf says.
Implementation of EHRs/e-query systems
The percentage of respondents using an EHR or elec-tronic query (e-query) system has risen since the 2013 survey. According to the 2017 survey, 67.02% of respon-dents use an EHR versus 20.70% who still use paper records. In 2013, 43.89% of respondents used paper records versus 34.73% who used electronic. (See Figure 7.) Of those who use an EHR system, the percentage of respondents who can query within the system also went up, from 43.6% in 2013 to 71.75% in 2017. (See Figure 8.) This significant percentage jump seems to correlate to the CMS EHR initiative program, which took effect in 2011 but did not affect facilities’ reimbursement until 2015 after the closing of the observation period.
According to the 2017 data, more respondents also use query templates built into the EHR. In 2013, less than 50% had templates in the EHR, whereas now 67.17% do.
“I think the use of EHR and query templates is great for creating consistency in our industry,” Banet says.
A surprising 31.90% of respondents said computer-as-sisted coding (CAC) and natural language processing (NLP) software has improved the quality of their clini-cal review and brought new query opportunities to their attention. Of the 31.29% of respondents who answered “other,” most either do not have CAC/NLP software or do not trust it. (See Figure 9.)
“For the most part, the CAC/NLP is pretty good. I think it can be a dangerous thing with new CDI specialists, though, because they don’t totally understand how a code is actually built,” says Duhon.
Query templates
Potentially due to the rise in EHR/e-query use for CDI programs, template use has also risen since the previous survey. In 2013, 38.6% of respondents reported using some form of query template. In 2017, 45.98% use tem-plates. (See Figure 10.) This could be due to the rise in EHR use, or the maturation of CDI programs nationwide.
“If you make a query process that the physicians can understand, you don’t have to spend every moment explaining how to read and understand the query,” a potential benefit of templates, says Dominesey.
Most respondents said CDI specialists themselves developed the query templates (62.75%). Next on the list were CDI managers at 39.22% and HIM/coding depart-ments at 31.65%. (See Figure 11.)
Template components included:
■ Space to include clinical data from the patient’s medical record (92.63%)
■ Open-ended options (81.59%)
■ Specific diagnosis phrase options (70.82%)
■ Pre- and post-query DRG information (2.27%)
■ DRG relative weights (1.42%)
“It shocks me that some respondents include the rela-tive weights. They’re asking to get themselves in trouble. Just wait till the RAs get a hold of that,” Duhon says.
More respondents now report following recent ACDIS/AHIMA query guidance than in the previous survey. In the 2017 survey, 67.04% reported adherence to the guid-ance completely, whereas in 2013, only 59.35% said the same thing. (See Figure 12.)
“Honestly, we’d rather hold back from sending a query at all if it’s not going to be compliant,” says Banet.
Policies and procedures
Use of facility-wide query policies for all query types—written, electronic, and verbal—increased to 74.52% in

5 Physician Query Benchmarking Survey | 2017 © 2017 HCPro, an H3.Group brand
2017. Some respondents reported having varied query policies (for example, 6.93% said they have procedures only for written queries), while 9.70% of respondents said they do not have any facility-wide policies. (See Figure 13.)
Most respondents said the CDI department is respon-sible for developing the query policies (56.16%). While the next highest percentages belonged to the HIM/coding departments and the compliance department, with 36.64% and 21.02% respectively, 10.21% reported “other.” Of these respondents, most said the CDI man-ager or director develops their facility’s query policies.
Another major change from the 2013 survey was the percentage of CDI programs retaining queries as a part of the patient’s permanent medical record—from 32.8% in 2013 to 58.45% in 2017. Though 19.39% of respondents said they did not retain them in the medical record at all, 18.28% said some were retained. Many of the “other” respondents (2.49%) only retain retrospective reviews. (See Figure 14.)
In addition, the percentage of respondents who said they never submit their queries to an auditor has gone down since the 2013 survey—16% in 2013 said they would submit their queries to an auditor versus 30.98% saying the same in 2017. This could be linked to the rise in facilities complying with query practice briefs.
“We’re just getting into an area where there’s so much auditing and so many compliance regulations, we have to make sure things are compliant and reliable. You have to assume that the queries are discoverable,” Banet says.
Physician engagement
Overall, physician response to query efforts has risen since 2013, with the largest portion of 2017 respondents (22.84%) reaching a 96%–98% response rate and only 11.62% receiving a response rate of 80% or less. In 2013, only 15.64% reported a response rate of 91%–95%, and 28.8% reported an 80%-or-less response rate. (See Fig-ure 15.) While this indicates an upward trend in physi-cian engagement, it’s worth noting that the 2017 ACDIS Membership Survey found physician engagement still rates as the primary concern for CDI programs.
Physician agreement rates to queries, however, have stayed nearly flat. In 2013, 66.87% reported agreement rates above 80%; in 2017, 69.44% reported the same.
When it comes to engagement tactics, the percentage of respondents who find the most success with leaving a message in the EHR system rose from 19.27% in 2013 to 59% in 2017. Additionally, the percentage of CDI profes-sionals who prefer verbal conversations with physicians rose from 38.88% to 55.68%.
“If you have a conversation with them, then that edu-cation takes place and your number of queries to a given physician will go down,” says Duhon.
9.42% of respondents said they prefer faxing queries to the physician office. Of the 9.42% of respondents who listed “other” as their preferred form of physician com-munication, most said they use a secure texting appli-cation to notify the physicians of an outstanding query. Some said they page the physicians. (See Figure 16.)
The 2017 survey also showed more transparency regarding physician query response rates between the physicians and CDI staff, with 53.40% saying they share the response rates with the physicians. In 2013, this per-centage was lower at 45.06%. (See Figure 17.)
“I think that’s really great. Transparency is excellent. Plus, a lot of physicians are competitive, so sharing the response rates can help spur them to be better” and improve engagement, Dominesey says.
CDI benchmarks and program accountability
As far as query metrics, the percentages of respon-dents in 2017 who have a set query quota and those who do not were nearly the same, with “yes” garnering 47.22% and “no” garnering 46.91%. Of those who do have a quota, the expected percentages of charts que-ried was quite varied—although the norm seemed to be a quota of around 21%–25% of charts reviewed. (See Figure 18.)
These expectations appear well founded, as 28.09% of respondents say that 21%–30% of their chart reviews result in a query. This number remains fairly static from the 2013 survey, which saw 25.01% placing queries on 21%–30% of their reviewed charts.

6 Physician Query Benchmarking Survey | 2017 © 2017 HCPro, an H3.Group brand
The plurality of respondents have seen a decrease in the number of needed queries as their program has matured (37.27%); however, 22.91% have seen an increase in the number of needed queries.
As far as monitoring the quality of the queries, 24.10% of respondents said they audit their queries “as needed,” with the next largest percentage saying they audit on a monthly basis (22.71%). (See Figure 19.) The major-ity of those who have a query audit procedure in place (60.98%) reported that their CDI manager/leader con-ducts the audits. (See Figure 20.)
“Auditing needs to happen not just for the CDI special-ists, but for everyone. It can even be completed by other CDI specialists. Sometimes, it’s actually more helpful to have a more peer-level review,” says Dominesey.
Most options for audit focus presented in the survey garnered about 50% of respondents’ support, though there were some outliers, such as “leading queries,” which received 63.71%. “Inaccurate information on the query form” received the lowest percentage at 43.21%, perhaps due to the overall increase in template use. (See Figure 21.)
“If a CDI specialist’s queries are compliant and there’s no additional opportunities for additional queries, then I’m fine with a lower query percentage. When it comes to query metrics, it all depends on the quality of the queries themselves. You have to use your brain and do some critical thinking about it,” says Duhon.
2013
2017
Fig. 1 What type of queries does your CDI Program prioritize?
0% 10% 20% 30% 40% 50% 60% 70% 90%
DRG shift/CC/MCC capture (financial impact)
Severity of illness (SOI)/ risk of mortality (ROM)
Quality of core measures
HCC capture/optimization
ICD-10 or other code specificity
Any documentation that requires clarification
Other

7 Physician Query Benchmarking Survey | 2017 © 2017 HCPro, an H3.Group brand
Fig. 2 How many records do you review per day?
0-5
6-10
11-15
16-20
21-25
26-30
0% 10% 20% 30% 40% 50% 60%
New patients
Re-Reviews
Yes, our CDI specialists and coders do thisYes, but this is a CDI function onlyNo, we code what is documented by the physicianDon’t knowOther
1.40%
Fig. 3 Do you query for clinical validation?
38.55%
44.41%
8.94%
6.70%
8 Physician Query Benchmarking Survey | 2017 © 2017 HCPro, an H3.Group brand
Fig. 4 What type of queries does your CDI program issue?
Prospective (prior authorization or before the patient)
Concurrent
Retrospective (pre-bill)
Post-bill
Other
0% 10% 20% 30% 40% 50% 60% 100%
CDI departmentHIM/coding departmentCase management departmentAny department, depending on query typeDon’t knowOther
Fig. 5 Which department follows up on outstanding queries post-discharge?
.55%
.55%
56.51%
22.71%
12.47%
7.20%

9 Physician Query Benchmarking Survey | 2017 © 2017 HCPro, an H3.Group brand
YesNoDon’t knowWe are developing policiesOther
Fig. 6 If you conduct prospective reviews/queries, do you follow recommended policies and procedures?
39.2%
20.1%
9.5%
23.8%
7.3%
0% 10% 20% 30% 40% 50% 60% 70%
Fig. 7 Are the majority of your queries
Written (paper-based)
Written (electronic)
Verbal (face-to-face)
Roughly a mix of verbal and written
Other
2013
2017

10 Physician Query Benchmarking Survey | 2017 © 2017 HCPro, an H3.Group brand
0% 10% 20% 30% 40% 50% 60% 70% 80%
Fig. 8 Does you facility have an electronic query system either
Yes
No
No, but we are in the process of implementing one
Other
2013
2017
0% 10% 20% 30% 40%
Fig. 9 How has CAC and/or NLP affected your chart reviews and queries?
Improved the quality/depth of clinical review and query opportunities
Increased the quantity of queries posted
Diminished the quality/depth of clinical review and query opportunities
Decreased the quantity of queries posted
Don’t know
Other

11 Physician Query Benchmarking Survey | 2017 © 2017 HCPro, an H3.Group brand
0% 10% 20% 30% 40% 50%
Fig. 10 Do you use templates in your written/electronic queries?
Yes, always
Yes, frequently
Yes, occasionally
No, never
Other
2013
2017
0% 10% 20% 30% 40% 50% 60% 70%
Fig. 11 Who was involved in developing your query templates/forms?
CDI staff
Physician advisor/champion
Other medical staff
HIM coding staff
Nursing/ancilliary staff
CDI manager
Case management staff
Legal department
Compliance department
Primarily a consultant or a software vendor
We do not use templates
Other

12 Physician Query Benchmarking Survey | 2017 © 2017 HCPro, an H3.Group brand
0% 10% 20% 30% 40% 50% 60% 70%
Fig. 12 Do your query practices follow the latest ACDIS/AHIMA physician query guidance?
Yes, fully
Yes, partially; we have read the guidance and included applicable suggestions in our CDI program policies and procedures
Yes, partially; we have read the guidance and included applicable suggestions, but have different policies
Yes, partially; we have separate policies for CDI specialists/HIM staff
Don’t know/have not read the latest guidance
No, we follow our own internal set of query guidelines
Other
2013
2017

13 Physician Query Benchmarking Survey | 2017 © 2017 HCPro, an H3.Group brand
Yes, for all query types regardless of departmentYes, but they only apply to written queriesYes, but they only apply to coding staffNoDon’t know
Fig. 13 Does your facility have standard query policies and procedures?
74.52%
6.93%
9.7%
6.65%
2.22%
Fig. 14 Are your query forms part of the patient’s permanent medical record?
Yes
No
No, but they are archived as administrative information
Some are a permanent part of the record and some are not
Don’t know
Other
2013
2017
0% 10% 20% 30% 40% 50% 60%

14 Physician Query Benchmarking Survey | 2017 © 2017 HCPro, an H3.Group brand
Fig. 15 What is your percentange of physician response to queries?
Under 40%
41%-50%
51%-60%
61%-70%
71%-80%
81%-85%
86%-90%
91%-95%
96%-98%
99%-100%
Don’t know
We don’t measure/track this
Other
0% 5% 10% 15% 20% 25%
2013
2017

15 Physician Query Benchmarking Survey | 2017 © 2017 HCPro, an H3.Group brand
Fig. 16 Which of the following techniques do you find most effective when querying?
Leave a paper query in the patients medical record
Leave an electronic message in the medica record
Have a verbal conversation/discussion with the physician
Email the physician daily
Fax the physician office
Hand a query form to the physician
Hand a query form to a physician extender
Other
0% 10% 20% 30% 40% 50% 60%
Fig. 17 Do you share your query response rates with physicians?
Yes
No
Don’t know
Other
2013
2017
0% 10% 20% 30% 40% 50% 60%
2013
2017

16 Physician Query Benchmarking Survey | 2017 © 2017 HCPro, an H3.Group brand
Fig. 18 What percentage of charts does your program expect CDE specialists to query?
0%-5%
6%-10%
11%-15%
16%-20%
21%-25%
26%-30%
31%-35%
36%-40%
41%-45%
46%-50%
Greater than 50%
Don’t know
We don’t track this metric
Other, please specify
0% 10% 20% 30%

17 Physician Query Benchmarking Survey | 2017 © 2017 HCPro, an H3.Group brand
Fig. 20 Who reviews/audits your query forms for compliance?
Self-auditing
CDI peers
CDI manager/leader
Consultant
Compliance department
HIM/coding department
Physician advisor/champion to CDI
Other, please specify
0% 10% 20% 30% 40% 50% 60%
Once every two or three yearsAs neededWe do not review themOther, please specify
MonthlyQuarterlyBiannuallyYearly
Fig. 19 How often do you review/audit your query forms for compliance?
2.77%
3.32%
22.71%
24.1%
11.63%
11.36%
14.96%
9.14%

18 Physician Query Benchmarking Survey | 2017 © 2017 HCPro, an H3.Group brand
2013
2017
Fig. 21 Do you audit/monitor the following indicators for query quality?
Unnecessary queries
Leading queries
Poor choice of wording/clarity
Missed query opportunity
Noncompliance with query standards
Not clinically appropriate and supported
Inaccurate information on the query form
We don’t monitor queries for quality
OIther, please specify
0% 10% 20% 30% 40% 50% 60% 70%


