216
2017 ANNUAL REPORT

2017 ANNUAL REPORT

*Adjusted - please refer to page 14 of the MD&A
CONTENTS
1 Message from the President andChiefExecutiveOfficer
7 Executive Management Team
8 Board of Directors
9 Message from the Chairman of the Board
11 Management’s Discussion and Analysis
125 Consolidated Financial Statements
STRONG CAPITAL POSITION
WHY INVEST IN SCOTIABANK?
• Diversifiedbybusinessand geography;providingsustainableand growing earnings
• Earnings momentum in personal, commercialandwealthbusinesses–globally
• Attractive growth opportunities inourkeyPacificAlliancemarkets
• Focused on digitization to strengthen customer experience andimproveefficiency
• Strong risk management culture
• Consistent record of dividend increases
• Strongbalancesheetwithprudentcapital and liquidity positions
EARNINGS PER SHARE*
Diluted, dollars per share
DIVIDEND GROWTHDollars per share
Webelieveeverycustomer–corporate, commercial, wealth andretail–hastherighttobecome betteroff.Throughadvice,financialservices and community support, wearecommittedtobuildingthepersonal economy of every one of ourcustomers.Weknowthat when our customers and the communities they live and work inprosper,weallprosper.
13 14 15 16 17
2.0
2.5
3.0
3.5
2.0
2.5
3.0
3.5
2.0
3.5
3.0
2.5CAGR = 6%
$3.05
13 14 15 16 17
3.5-
3.0-
2.5-
2.0-
13 14 15 16 175.0
5.5
6.0
6.5
5.0
5.5
6.0
6.5
5.0
6.5
6.0
5.5CAGR = 7%
$6.49
13 14 15 16 17
6.5-
6.0-
5.5-
5.0-
RETURN ON EQUITY:* 14.6% 14.3%
in 2016VS

CEO’S MESSAGEto Shareholders
Dear fellow Shareholders,At185yearsold,ScotiabankisolderthanthecountryofCanadaitself.FromourhumblebeginningsinHalifax,NovaScotia,wehavebecomeonetheworld’slargestandsoundestbanks.Weareproudtobeacriticalpartoftheeconomicfabricofthecountriesinwhichweoperate.ThisisaresponsibilitythatScotiabankerstakeseriously,andwearehonouredbythetrustplacedinusbyourcustomersandshareholders.
TheBank’shistoryisatestamenttoourpastsuccess,butitdoesnotguaranteeourfuturesuccess.Thatiswhy,sincebecomingPresidentandCEOfouryearsago,Ihavebeenmost focused on setting and implementing a Strategic Agenda thatpositionsourBankforasuccessfulfuture.Ourstrategyconsiders how to deploy shareholder capital strategically and responsibly,whiledeliveringasuperiorbankingexperienceforourcustomers.Asyouwillreadintheletterbelow,weare pleased with the progress we have made to date and vigilantabouttheneedtodrivecontinuouschange.
Financial Results 2017wasanothergoodyearfortheBank.Eachofourbusinesslinesdeliveredstrongresults–despiteonlymoderate growth in some key countries, increased competitive pressures, elevated regulatory requirements, geopoliticalchallengesandanunusuallyhighnumberofnaturaldisastersacrossourfootprint.
Ourgoodmomentumcanbeseenbythestrongrelativeperformanceofourstockpriceforthepasttwofiscalyears.Our shares appreciated more than 35% since the end of 2015, compared to the peer average of 29%, and had the 2nd strongestperformanceamongourBig5peergroup.
Canadian Banking generated record earnings in 2017, delivering good revenue growth and meaningful cost savings–aportionofwhicharebeingre-investedtobuild
abetterbankingexperienceforourcustomers.SinceItook over as President and CEO, we have increased our focusonactivelymanagingourbusinessmix.AmongourCanadianpeergroup,wearetheonlybanktohaveimprovedourNetInterestMarginoverthepastfour-yearperiod – an accomplishment we are proud of, particularly inalowinterest-rate-environment.
OurongoingfocusonthePacificAllianceregion(comprisedofMexico,Peru,ChileandColombia)continues to translate into very strong earnings growth in International Banking.Onceagain,thedivisiondeliveredrecord earnings and achieved year-over-year gains in loan marketshareacrossthePacificAllianceregion.Scotiabanknowranksasthe5thlargestbankinMexico,andweimprovedourcompetitivepositioninChile.
GoodresultsinourcorepersonalandcommercialbankingbusinesseshavecontributedtostrongReturnonEquity(ROE)attheall-Banklevel.InternationalBankingROE, inparticular,hasimprovedbyapproximately300bps from11.7%since2014to14.6%today.
Our footprint is key to our investment thesis, and an importantdifferentiatorforusasCanada’sInternationalBank.Some people are surprised to learn that more than 50,000 ofour88,000employeesresideoutsideofCanada.Weremainhighly-confidentintheabove-averageearningspotentialofourinternationalbusiness,particularlyinthePacificAlliance region, which we will continue to grow organically andthroughselectiveacquisitionswithinourfootprint.
Global Banking and Markets(GBM)hadastrongeryearin2017.Earningswereup16%over2016,andwesawsome encouraging growth of our presence and relevance in LatinAmericanmarkets.Asanexample,forthebetterpartoftheyear,ScotiabankwasatthetopofBloomberg’sBookrunnerLeagueTableforSyndicatedLoansinLatinAmerica.
Brian PorterPresident and ChiefExecutiveOfficer
2 0 1 7 S CO T I A BANK ANNUA L R E PO R T | 1

We will continue to implement our strategy for GBM, whichincludesexpandingourinvestmentbankingandcapitalmarketscapabilitiesinCanada,andbetterleveragingtheBank’swholesalecapabilitiesintothe PacificAllianceregion.
Building an Even Better BankInadditiontodeliveringstrongfinancialresultsin2017,wealsomadeconsiderableprogressonourStrategicAgenda,whichguidesusaswebuildanevenbetterBankandcreatevalueforyou,ourshareholders.
Wearepleasedtohighlightafewnotableachievementsbelow,whichrepresentasmallsampleofthemanysignificantchangeswearemakingacrosstheBank:
Customer FocusThecoreofourStrategicAgendacontinuestobeourfocusonour24millioncustomers.Thismeansensuringthatthevoiceofthecustomerisdirectlyembeddedintoeverythingwedo,onacontinuousbasis.Throughouttheyear,werolled-outanumberofinitiativestodoexactlythat.Oneexampleisourimplementationofabank-widecustomerexperiencemanagementsystem–calledThePulseorElPulso.The Pulse is a powerful digital system that allows us to continuouslygatherfeedbackfromourcustomers,throughthechannelsinwhichtheychoosetobankwithus.Wehavealreadyreceivedfeedbackfrommorethan2millioncustomersandmade150,000call-backstocustomers.Therichdatawearegatheringallowsustobetterunderstandourcustomers’ needs and prioritize investments to improve theirbankingexperience.
DigitalTwoyearsago,weembarkedonadigitaltransformationjourneytobetterserveourcustomersandbecome moreefficient.Todemonstrateourcommitmenttodigitalleadership,in2017,wewerethefirstbankinCanadatoholdaDigitalBankingUpdate.Attheevent,wecommunicatedour digital vision and strategy for achieving that vision to theinvestmentcommunity.ThetargetswepresentedinFebruaryareboldandaspirational.Wehavemoreworktodo,butwearepleasedbytheprogresswearemaking.Agood example is our Digital Factory Network, which is now fully-operational in Canada, Mexico, Peru, Chile and Colombia.TheNetworkfeaturesaglobaloperatingmodeland is a key pillar of our digital strategy, as it leverages our international scale and diversity of talent across our footprint.Itisalsoadriverofinternalinnovation.
Financial StrengthOurincreasedattentiontobusinessmixhasledtousfocusequallyonbothsidesofthebalancesheet.Wehavegrowndepositstosupportareductionofwholesalefunding. Todate,wehavereducedourwholesalefundingratiobyapproximately20%.Asaresult,wehaveloweredourfundingcostsandfurtherstrengthenedourfinancialposition.
Capital Deployment ScotiabankhasthestrongestCommonEquityTier1(CET1)ratioinourpeergroupat11.5%.Ourstrongcapitalpositionprovides us with optionality to deploy capital for organic growth,acquisitions,dividendsandsharebuybacks.Wearefocused on deploying internally-generated capital to grow the Bank and provide returns to you, our shareholders, through activecapitalmanagement.Overthepastfouryears,theBankhasgeneratedapproximately$30billionofinternalcapital.
STRATEGIC PRIORITIES
2 | 2 0 1 7 S CO T I A BANK ANNUA L R E PO R T

Approximatelyhalfofthiscapitalhasbeenreturnedtoshareholders in the form of dividends and selective share buybacks.TheBankhasrepurchasedapproximately36millionshares at an average price of $67 – for context, our share priceasofOctober31was$83.28.AquarteroftheremainingcapitalwasdeployedtosupportorganicbusinessgrowthintheBank,whilethebalancewasusedfortechnologyinvestments,andtofurtherbuildtheBank’scapitallevels.
LowCostbyDesignDuring 2016, we announced a major undertaking to significantlytransformtheBank’scoststructure–somethingwe refer to internally as our Structural Cost Transformation (SCT)program.2017wasthefirstfullyearofourSCTprogram,andIampleasedtoreportthatitisprogressingverywell.Ithasgenerated$500millioninsavings,whichis40%betterthanthecommitmentwemadein2016.Wearealsoontracktoachieveourproductivityratiotargetof52%bytheendof2019.OurSCTprogramcontinuestogrowinscope, as we look at all opportunities across the Bank to reducestructuralcosts,whilebetterservingourcustomers.The SCT program is a great example of how we are makingtheBankbetteroverthemediumandlonger-term,whilealsoinstillingacultureofcontinuousimprovement.
LeadershipOverthepastfewyears,wehaveinvestedsignificantly inourleadershipteams.Inadditiontomakingseveralappointments at senior levels of the Bank, we have strengthenedtheBank’sleadershipcapabilitieswithaninfusionofnewleadersfromotherbusinessesandindustries.ThesenewScotiabankershavebroughtdepthandadiversityof thought that continues to meaningfully improve our Bank’sstrengthandefficiency.Atthesametime,wehave
invested heavily in internal training programs for our employees – several of our programs have received external recognitionforleadershipdevelopment.
Diversity&InclusionAsCanada’sInternationalBank,weareinherentlydiverse.Scotiabankersunderstandthatdiversityleadstoimprovedperformanceandamoreinclusiveworkenvironment.Thatis why we are committed to diversity – including diversity of thought, experience, gender, culture, race, religion and sexualorientationateverydecision-makingtable,andinallsettingsacrosstheBank.Tonefromthetopiscriticalinthisregard,whichiswhyIchairScotiabank’sInclusionCouncil.IamproudofthefactthatsinceIwasappointedPresidentand CEO, the percentage of women at the VP+ level in Canada is at an all-time high of nearly 40% – up from 30% in2014.Whilewehavemadesomegoodprogressinthisarea, our work is not done, particularly at the enterprise level.Wehaveanumberofinitiativesunderwaytobringevengreaterdiversityofalltypestoourleadershipteams.
Building our BrandEarlier this year, we were very proud to announce an expanded, 20-year partnership with Maple Leaf Sports & Entertainment(MLSE).Thepartnershipincludesnamingrightsforoneofthemostrecognizableentertainmentcomplexes in North America, and many other initiatives thatwillsubstantiallyenhanceourbrandasCanada’sHockeyBank,createmultipleopportunitiestoacquirenewcustomers,anddeepenexistingcustomerrelationships.
In2017,theBankreachedtheimportantmilestoneofsupporting more than one million kids through our commitmenttocommunityhockeyacrossCanada.
DIGITALTRANSFORMATION
STRATEGY
Alignment
Culture & Talent
Technology Modernization
Customer Experience Operational Efficiency
2 0 1 7 S CO T I A BANK ANNUA L R E PO R T | 3

Our historic agreement with MLSE provides us with even moreopportunitiestogivebacktothecommunitiesinwhichourcustomersandemployeesliveandwork.
More Work AheadWhile we are proud of our progress to date, we still have a lot ofworkaheadofusonourjourneytobuildanevenbetterBank.Inparticular,weneedtomovefasterandwithmoreagility.Wealsoneedtocontinuetosharpenourfocusanddiscipline.
Wetalkinternallyabouttheseeffortsas‘strengtheningthecore’–ametaphordrawnfromtheworldofphysicalfitness,wherecorestrengthisfoundationaltooverallstrength,balanceandagility.LetmeoutlineafewrelevantexamplesoftheeffortswehaveundertakentogettheBankinbettershape.
On culture,Scotiabankhasalottobeproudof.AsItoldourshareholders at our 2017 annual meeting, the Bank’s solid cultural foundation and strong moral compass have helped ussuccessfullynavigateperiodsofuncertaintyandchange.Scotiabankerspossessqualitiessuchasentrepreneurialism,integrityandcouragetotakerisks.Thatsaid,someoftheelementsthatwewillneedinthefuturewillbedifferentthanwhatservedussowelloverthepast185years.Wehavemanyinitiatives underway to ensure our successful future, including effortstodriveamoreperformance-orientedculture.
On pace, we are focused on simplifying internal decision-making, improvingoreliminatinginefficientprocessesandactingwithanincreasedsenseofurgency.Whenitcomestoprioritizing our use of scarce resources, we are laser-focused on those areas that will move the dial for our customers andforyou,ourshareholders.
On innovation, we are making strategic investments to provide superior products and services for our customers,
aswellasstrengtheninternalsystemsandprocesses.Technology investments are improving our customers’ experience,andalsohelpingtoincreasetheefficiency and effectiveness of our employees, whether they are customer-facingorservinginourcorporatefunctions.In2017,theBankinvestedmorethan$3billionintechnologyandrelated expenses – up 14% compared to 2016, in line with ourglobalpeers.Ourinvestmentsintechnologyareupmeaningfully from previous years, which is consistent with ourstrongcommitmenttodigitalleadership.WerecognizethatgettingtechnologyrightismissioncriticalforScotiabankand we will continue to make the necessary investments to achieveourgoals.
OnegoodexampleisArtificialIntelligence(AI).DevelopinganddeployingAIcapabilitiesisincreasinglycriticaltoallfirmsforimprovingawiderangeofbusinessoutcomes,includingcustomerexperience,supplychainsandcyber-security.WeareactivelydeployingAIacrossmanyareasattheBankandarecommittedtofurtherdevelopingourAIcapabilities.Todoso,wehaveenteredintoanumberofpartnershipswithexpertsinthefield,includingtheUniversityofToronto’sRotmanSchoolofBusiness,theVectorInstitute,andtheCreativeDestructionLabsattheUniversityofTorontoandtheUniversityofBritishColumbia.Canadaiswell-positionedasagloballeaderinAI,andScotiabankfullyintendstoleveragethisasa competitive advantage in Canada as well as in our key internationalmarkets.
Giving BackWebelieveinpartnershipsaskeyenablersingivingbacktothecommunitiesinwhichweliveandwork.ThatiswhywebuildsoccerfieldsincommunitiesacrossLatinAmericaanddeliversportingequipmenttoyoungpeopleinCanada’sNorth.
basispoints improvement
basispoints improvement
in priority products
deployed in our 5 key markets
Transactions
in-branchDigital
AdoptionDigital Sales
Customer Pulse
Will improve All-Bank productivity ratio
DIGITAL VISION: PROGRESS UPDATE
400 200 PROGRESSINGWELL 100%
4 | 2 0 1 7 S CO T I A BANK ANNUA L R E PO R T

That is why we sponsor several groups of young Canadian students to travel to Vimy,FranceandlearnabouttheimportantcontributionsthatbraveCanadiansoldiersmadeinWorldWarI.Andthatiswhy,whenourcustomersandemployeesfaceterriblenaturaldisasters,wedowhatwecantohelp.
ItwasaverychallengingyearformanyScotiabankers,aswellasmanyofourcustomerswhofacedfloodingandwildfiresinCanada;floodingandmudslidesinPeru;floodinginTexas;HurricanesIrmaandMariaintheCaribbean;andearthquakesinMexico.OurteamsacrosstheBankplayedanimportantroleinthereliefefforteach time a disaster hit – ensuring that our employees and customers were safe, andalsohadaccesstothenecessarysuppliesandfinancialservices.TheBankwasproudtosupporttheRedCrossandlocalcharitieswithanumberoflargefinancialgifts.WealsoprovidedCanadianswiththeopportunitytodonatetotheRedCrossinanyofourScotiabankbranchesacrossCanada.
In2017,Scotiabankcontributedmorethan$80milliongloballyindonations,sponsorshipsandotherformsofassistance,andScotiabankemployeescontributedmorethan400,000hoursofvolunteeringandfundraisingtime.IwanttotakethisopportunitytothankalloftheScotiabankersforcomingtogethertohelpourcustomersandeachotherduringthepastyear.Yourcontributionshavehelpedtomakearealdifferenceforourcustomersandemployees.
Looking Forward with OptimismTransformationonthescalewearepursuingisnoteasy,butitisnecessary. We know that we have a lot of work ahead of us, particularly when it comes to strengtheningourculture,increasingourpace,andbecomingadigitalleaderinourindustry.Wealsounderstandthatitwilltaketimeandresiliencytofullyachieveourstrategicagenda.ButifIcanleaveyou,ourshareholders,withonetakeawayfromthisyear’sletter,itisthis:Wearedeeplycommittedtoourjourneybecausewefundamentallybelievethatthechangeswearedrivingwillmakeusastronger,moreinnovativeandmorecompetitiveorganization.
Inclosing,itcontinuestobeanhonourandprivilegetoserveyourBankasPresidentandCEO.Iamgratefultoourcustomers,ourshareholdersandourBoardMembersfortheirtrust.IalsowanttothankeachandeveryScotiabankeracrossourfootprintforworkinghardoverthepastyearonbehalfofourcustomersandtodeliverstrongresultsforourshareholders.
WhileourBank’s185-yearhistoryhasbeenwritten,thefutureisourstodetermine,andIthinkthatfutureisveryexcitingindeed.
AVERAGEASSETS BY
GEOGRAPHY(in$billions)
n Canada...........................................60%n U.S..................................................12%n PacificAlliance.................................10%n OtherInternational..........................18%
$111
$162
$539
$86$898
Total
We fundamentally believe that the changes we are driving will make us a stronger, more innovative and more competitive organization.
2 0 1 7 S CO T I A BANK ANNUA L R E PO R T | 5

May 2017 | Grand Opening of new Digital Factory in Colombia
October 2015 |Scotiabank’sfirst Digital Factory is launched
June 2016 | Global Digital Banking organization is created
December 2016 | Appointed five leaders for Digital Factories in Canada, Mexico, Peru, Chile andColombia,includingseveralexternalhires.
DIGITAL TRANSFORMATION HIGHLIGHTS
February 2017 | Digital Banking Update,outliningtheglobalstrategyand goals for Digital
June 2017 | Kicked off the Digital Advisory Council, four prominent external digital leaders and practitioners to provide practical advice and counsel to the Bank
March 2016 | Announced Scotiabank Digital Banking Lab atIveyBusinessSchool
July 2016 | Announced partnership and investment in Georgian Partners that is focused on security, messaging andartificialintelligence
October 2017 | Announced partnership with NXTP Labs, Latin America’s leading start-up accelerator, to access the most promising FinTechs inthePacificAlliance
January 2016 | Scotiabank Centre for Customer Analytics opens at Queen’s University’s Smith School of Business
May 2016 |NamedGlobalBankwiththe Best Digital Strategy Award for 2016byRetailBankerInternational
March 2017 | Grand Opening of new Digital Factory in Mexico
October 2017 | Grand Opening of new Digital Factory in Peru
December 2016 | Announced partnership with QED Investors to inject capital and industry expertise into select Latin American FinTech companies January 2017 | Grand
Opening of new Digital Factory in Toronto
November 2017 | First Canadian bank to offer FaceID authentication formobilebankingoniPhoneX (iPhone10)devices.
September 2016 | Scotiabank accelerates the development of the entrepreneurial ecosystem in Canada, specificallyinartificialintelligenceandscience-basedventures,throughitssupportof the Rotman School of Management at the University of Toronto and the Creative DestructionLab.
6 | 2 0 1 7 S CO T I A BANK ANNUA L R E PO R T

Brian J. PorterPresident and ChiefExecutiveOfficer
Ignacio “Nacho” DeschampsGroupHead, InternationalBanking and Digital Transformation
Dieter W. JentschGroupHead,GlobalBankingand Markets
Barbara MasonGroupHeadandChiefHumanResourcesOfficer
Sean D. McGuckinGroupHeadand ChiefFinancialOfficer
James O’Sullivan GroupHead, Canadian Banking
Deborah M. AlexanderExecutive Vice President and General Counsel
Ian ArellanoExecutive Vice President, Legal
Andrew BranionExecutive Vice President and Group Treasurer
John W. DoigExecutive Vice President and ChiefMarketingOfficer
Terry FryettExecutive Vice President andChiefCreditOfficer
Mike HenryExecutive Vice President and ChiefDataOfficer
Marian LawsonExecutive Vice President, GlobalFinancialInstitutions and Transaction Banking
James McPhedranExecutive Vice President, Canadian Banking
Daniel MooreChiefRiskOfficer
James NeateExecutive Vice President, InternationalCorporateand CommercialBanking
Dan ReesExecutive Vice President, Operations
Gillian RileyExecutive Vice President, Canadian Commercial Banking
Shawn RoseExecutive Vice President andChiefDigitalOfficer
Anya SchnoorExecutive Vice President, Retail Payments, Deposits and Unsecured Lending
Laurie Stang Executive Vice President, Canadian Branch Banking
Maria Theofilaktidis Executive Vice President, Chief Compliance and RegulatoryOfficer
Michael ZerbsChiefTechnologyOfficer
EXECUTIVE MANAGEMENT TEAM
2 0 1 7 S CO T I A BANK ANNUA L R E PO R T | 7

Thomas C. O’NeillChairman of the Board
Scotiabankdirectorsince May 26, 2008
Committee Chairs
Tiff Macklem, Ph.D.Dean of the Rotman School of Management at the University of Toronto
Risk Committee Chair
Scotiabankdirectorsince June 22, 2015
Una M. PowerCorporate director
Audit Committee Chair
Scotiabankdirectorsince April 12, 2016
Aaron W. RegentFounding Partner of MagrisResourcesInc.
HumanResources Committee Chair
Scotiabankdirectorsince April 9, 2013
Susan L. SegalPresident and Chief Executive OfficeroftheAmericasSocietyand Council of the Americas
Corporate Governance Committee Chair
Scotiabankdirectorsince December2,2011
Board of Directors
Nora A. AufreiterCorporate director
ScotiabankdirectorsinceAugust 25, 2014
Guillermo E. BabatzManaging Partner of AtikCapital,S.C.
ScotiabankdirectorsinceJanuary 28, 2014
Scott B. BonhamCorporate director and co-founder of IntentionalCapital
ScotiabankdirectorsinceJanuary 25, 2016
Charles H. Dallara, Ph.D.Executive Vice Chairman of the Board of Directors of PartnersGroupHoldingAGand Chairman of the Americas
ScotiabankdirectorsinceSeptember23,2013
Eduardo PachecoChiefExecutiveOfficerand a directorofMercantilColpatriaS.A.
Scotiabankdirectorsince September25,2015
Michael D. PennerChairman of the Board of DirectorsofHydro-Québec
Scotiabankdirectorsince June 26, 2017
Brian J. PorterPresident and Chief Executive OfficerofScotiabank
Scotiabankdirectorsince April 9, 2013
Indira V. Samarasekera, O.C., Ph.D.Senior advisor at Bennett Jones LLP and a corporate director
Scotiabankdirectorsince May 26, 2008
Barbara S. ThomasCorporate director
ScotiabankdirectorsinceSeptember28,2004
L. Scott ThomsonPresident and Chief ExecutiveOfficerof FinningInternationalInc.
Scotiabankdirectorsince April 12, 2016
BOARD OF DIRECTORS
8 | 2 0 1 7 S CO T I A BANK ANNUA L R E PO R T

Dear fellow Shareholders,The Board is pleased with the continued progress that the Bank’s management team is making against its Strategic Agenda, which is designed to deliver value for our customers andshareholdersoverthelongerterm.
Inparticular,theshifttowardsbecomingamorecustomer-focused organization is resonating across the Bank’s footprint.InOctober,ourBoard,andsomeoftheBank’ssenior leaders, travelled to Peru to visit our operations in Lima.Inourdiscussionswiththelocalmanagementteam,boardmembersandcustomers,itwasevidentthattheBank’scommitment to our 24 million customers transcends country boundaries.Ineachofthenearly50countriesinwhichweoperate,Scotiabankersarefocusedondeliveringasuperiorbankingexperienceandeasytouseproductsandservices.Putting the customer at the centre of everything we do has beenkeytoourpresentstrengthandsuccess,andthatwillcontinuetobesogoingforward.
TheBank’sdigitaltransformationisalsoprogressingwell.Embracingdigitaltechnologybringsexcitingopportunitiesforourcustomersandouremployees.Inaddition,byleveragingtechnologyandbuildingstrategicdigitalpartnerships,wearebetterabletoprotectourcustomersandtheBank.
Our Corporate GovernanceSound and effective corporate governance is essential for the long-term success of the Bank and the execution of ourstrategicvision.TheBoardiscomprisedofadiverse
anddedicatedgroupofbusinessprofessionalsfromaroundtheworld,whobringsoundbusinessinsightandexpertisetothetable.Currently13ofyourBank’s15directorsareindependent,andourboardincludesdirectors of varying ages, cultures and geographic backgrounds.
Duringtheyear,wewelcomedonenewdirectorandbidfarewelltothreeothers.
•InJune,wewerefortunatetohaveMichaelPennerjoin theboard.Michaelbringsawiderangeofpublicand private sector leadership experience and his knowledgeoftheenergyandretailsectorswillbea tremendousasset.
•RonaldBrenneman,PaulSobeyandWilliamFattretiredin2017.Theirleadershipandcommitmenthasbeeninvaluabletooursuccess.Wethankthemfortheiryearsof service and their commitment to the Bank and our shareholders.
Inclosing,IwouldliketothankourPresidentandCEOBrian Porter for his dedication to the Bank, and for the leadership he provides to the team of more than 88,000 Scotiabankers.Thanksalsotoourshareholdersfortheirongoingconfidenceandsupport.
CHAIRMAN’S MESSAGEto Shareholders
Thomas C. O’NeillChairmanofScotiabank’s Board of Directors
2 0 1 7 S CO T I A BANK ANNUA L R E PO R T | 9

Objective:
ReturnonEquity:14%
EarningsPerShareGrowth: 5 - 10%*
Maintain Strong Capital Ratios
Achieve Positive Operating Leverage*
2017 Results:
14.6%
8.0%
11.5%
-0.2%
MEDIUM-TERM FINANCIAL OBJECTIVES
MD&A HIGHLIGHTS
Total Assets
$915Billion
Deposits
$625Billion
Loans
$504Billion
Revenue
$27Billion
Net Income
$8.2Billion
Total Taxes Paid
$3.2Billion
COMMON EQUITYTIER 1 CAPITAL RATIO %
EARNINGS BY BUSINESS LINE %
% INCOME BYGEOGRAPHY
171615
100%
50%
0%
11.5
201720162015
11.010.3
For more information, please see page 44
Scotiabankn
S&P/TSXBanksTotalReturnIndexn
S&P/TSXCompositeTotalReturnIndexn
Scotiabank
S&P/TSX Banks Total Return Index
S&P/TSX Composite Total Return Index
07 08 09 1110 12 13 14 15 16 17
50
100
150
200
250TOTAL RETURN TO COMMON SHAREHOLDERS
n Canadian Banking
n International Banking
n GlobalBanking and Markets n
n Canada
n U.S.
n PacificAlliance
n Other International
Share price appreciation plus dividends reinvested, 2006 = 100
29 49
58
22
7
18
17
*Adjusted - please refer to page 14 of the MD&A
1 0 | 2 0 1 7 S CO T I A BANK ANNUA L R E PO R T

Enhanced Disclosure Task Force (EDTF) Recommendations
The Enhanced Disclosure Task Force (EDTF) was established by the Financial Stability Board in May 2012 with the goal of developing fundamentaldisclosure principles. On October 29, 2012 the EDTF published its report, “Enhancing the Risk Disclosures of Banks”, which sets forthrecommendations around improving risk disclosures and identifies existing leading practice risk disclosures.
Below is the index of all these recommendations to facilitate easy reference in the Bank’s annual report and other public disclosure documentsavailable on www.scotiabank.com/investorrelations.
Reference Table for EDTF
Pages
SupplementaryRegulatory
CapitalDisclosuresType of risk Number Disclosure MD&A
FinancialStatements
General 1 The index of risks to which the business is exposed. 64, 67, 752 The Bank’s risk to terminology, measures and key parameters. 60, 633 Top and emerging risks, and the changes during the reporting period. 57, 66, 72-744 Discussion on the regulatory development and plans to meet new regulatory ratios. 43-44, 84-85,
102-104
Risk governance,risk managementand businessmodel
5 The Bank’s Risk Governance structure. 58-606 Description of risk culture and procedures applied to support the culture. 60-637 Description of key risks from the Bank’s business model. 64-658 Stress testing use within the Bank’s risk governance and capital management. 62
CapitalAdequacy andrisk-weightedassets
9 Pillar 1 capital requirements, and the impact for global systemically important banks. 43-44 182-183 1-210 a) Regulatory capital components. 45 4, 5, 7
b) Reconciliation of the accounting balance sheet to the regulatory balance sheet. 611 Flow statement of the movements in regulatory capital since the previous reporting period, including
changes in common equity tier 1, additional tier 1 and tier 2 capital.46-47 7
12 Discussion of targeted level of capital, and the plans on how to establish this. 43-4413 Analysis of risk-weighted assets by risk type, business, and market risk RWAs. 49-53, 65, 112 160, 208 10-1214 Analysis of the capital requirements for each Basel asset class. 49-53 160, 200-207 11-19, 23-2615 Tabulate credit risk in the Banking Book. 49-53 201 11-19, 22-2516 Flow statements reconciling the movements in risk-weighted assets for each risk-weighted asset type. 49-53 917 Discussion of Basel III Back-testing requirement including credit risk model performance and validation. 51-52
Liquidity Funding 18 Analysis of the Bank’s liquid assets. 82-8519 Encumbered and unencumbered assets analyzed by balance sheet category. 8420 Consolidated total assets, liabilities and off-balance sheet commitments analyzed by remaining
contractual maturity at the balance sheet date.88-90
21 Analysis of the Bank’s sources of funding and a description of the Bank’s funding strategy. 86-88
Market Risk 22 Linkage of market risk measures for trading and non-trading portfolios and the balance sheet. 8123 Discussion of significant trading and non-trading market risk factors. 76-82 205-20824 Discussion of changes in period on period VaR results as well as VaR assumptions, limitations,
backtesting and validation.76-82 205-208
25 Other risk management techniques e.g. stress tests, stressed VaR, tail risk and market liquidity horizon. 76-82 207-208
Credit Risk 26 Analysis of the aggregate credit risk exposures, including details of both personal and wholesalelending.
72-74, 105-112
167-168,202-203
12-20, 16-22(1)
27 Discussion of the policies for identifying impaired loans, defining impairments and renegotiated loans,and explaining loan forbearance policies.
140-142, 168
28 Reconciliations of the opening and closing balances of impaired loans and impairment allowancesduring the year.
71, 106-107,109, 110
168 17-18(1)
29 Analysis of counterparty credit risk that arises from derivative transactions. 69-70 158, 16030 Discussion of credit risk mitigation, including collateral held for all sources of credit risk. 69-70, 72
Other risks 31 Quantified measures of the management of operational risk. 53, 9132 Discussion of publicly known risk items. 57
(1) In the Supplementary Financial Information Package
2 0 1 7 S C O T I A B A N K A N N U A L R E P O R T | 11

MANAGEMENT’S DISCUSSION AND ANALYSIS
TABLE OF CONTENTS13 Forward-looking statements14 Non-GAAP measures15 Financial highlights
Overview of Performance16 Financial results: 2017 vs 201616 Medium Term Objectives16 Shareholder returns17 Economic outlook17 Impact of foreign currency translation
Group Financial Performance18 Net income18 Net interest income20 Non-interest income21 Provision for credit losses23 Non-interest expenses24 Income taxes25 Financial results review: 2016 vs 201527 Fourth quarter review29 Trending analysis
Business Line Overview30 Overview31 Canadian Banking34 International Banking37 Global Banking and Markets40 Other
Group Financial Condition42 Statement of financial position43 Capital management
53 Off-balance sheet arrangements56 Financial instruments57 Selected credit instruments – publically known
risk items
Risk Management58 Risk management framework67 Credit risk75 Market risk82 Liquidity risk91 Other risks
Controls and Accounting Policies95 Controls and procedures95 Critical accounting estimates99 Future accounting developments102 Regulatory developments104 Related party transactions
Supplementary Data105 Geographic information108 Credit risk113 Revenues and expenses115 Selected quarterly information116 Eleven-year statistical review
12 | 2 0 1 7 S C O T I A B A N K A N N U A L R E P O R T

MANAGEMENT’S DISCUSSION AND ANALYSIS
FORWARD LOOKING STATEMENTS
Our public communications often include oral or written forward-looking statements. Statements of this type are included in this document, and maybe included in other filings with Canadian securities regulators or the U.S. Securities and Exchange Commission, or in other communications. All suchstatements are made pursuant to the “safe harbor” provisions of the U.S. Private Securities Litigation Reform Act of 1995 and any applicableCanadian securities legislation. Forward-looking statements may include, but are not limited to, statements made in this document, theManagement’s Discussion and Analysis in the Bank’s 2017 Annual Report under the headings “Outlook” and in other statements regarding theBank’s objectives, strategies to achieve those objectives, the regulatory environment in which the Bank operates, anticipated financial results (includingthose in the area of risk management), and the outlook for the Bank’s businesses and for the Canadian, U.S. and global economies. Such statementsare typically identified by words or phrases such as “believe,” “expect,” “anticipate,” “intent,” “estimate,” “plan,” “may increase,” “may fluctuate,”and similar expressions of future or conditional verbs, such as “will,” “may,” “should,” “would” and “could.”
By their very nature, forward-looking statements involve numerous assumptions, inherent risks and uncertainties, both general and specific, andthe risk that predictions and other forward-looking statements will not prove to be accurate. Do not unduly rely on forward-looking statements, as anumber of important factors, many of which are beyond the Bank’s control and the effects of which can be difficult to predict, could cause actualresults to differ materially from the estimates and intentions expressed in such forward-looking statements. These factors include, but are not limitedto: the economic and financial conditions in Canada and globally; fluctuations in interest rates and currency values; liquidity and funding; significantmarket volatility and interruptions; the failure of third parties to comply with their obligations to the Bank and its affiliates; changes in monetarypolicy; legislative and regulatory developments in Canada and elsewhere, including changes to, and interpretations of tax laws and risk-based capitalguidelines and reporting instructions and liquidity regulatory guidance; changes to the Bank’s credit ratings; operational (including technology) andinfrastructure risks; reputational risks; the risk that the Bank’s risk management models may not take into account all relevant factors; the accuracyand completeness of information the Bank receives on customers and counterparties; the timely development and introduction of new products andservices; the Bank’s ability to expand existing distribution channels and to develop and realize revenues from new distribution channels; the Bank’sability to complete and integrate acquisitions and its other growth strategies; critical accounting estimates and the effects of changes in accountingpolicies and methods used by the Bank as described in the Bank’s annual financial statements (See “Controls and Accounting Policies – Criticalaccounting estimates” in the Bank’s 2017 Annual Report) and updated by quarterly reports; global capital markets activity; the Bank’s ability to attractand retain key executives; reliance on third parties to provide components of the Bank’s business infrastructure; unexpected changes in consumerspending and saving habits; technological developments; fraud by internal or external parties, including the use of new technologies in unprecedentedways to defraud the Bank or its customers; increasing cyber security risks which may include theft of assets, unauthorized access to sensitiveinformation or operational disruption; anti-money laundering; consolidation in the financial services sector in Canada and globally; competition, bothfrom new entrants and established competitors; judicial and regulatory proceedings; natural disasters, including, but not limited to, earthquakes andhurricanes, and disruptions to public infrastructure, such as transportation, communication, power or water supply; the possible impact ofinternational conflicts and other developments, including terrorist activities and war; the effects of disease or illness on local, national or internationaleconomies; and the Bank’s anticipation of and success in managing the risks implied by the foregoing. A substantial amount of the Bank’s businessinvolves making loans or otherwise committing resources to specific companies, industries or countries. Unforeseen events affecting such borrowers,industries or countries could have a material adverse effect on the Bank’s financial results, businesses, financial condition or liquidity. These and otherfactors may cause the Bank’s actual performance to differ materially from that contemplated by forward-looking statements. For more information,see the “Risk Management” section of the Bank’s 2017 Annual Report.Material economic assumptions underlying the forward-looking statements contained in this document are set out in the 2017 Annual Report underthe headings “Outlook”, as updated by quarterly reports. The “Outlook” sections are based on the Bank’s views and the actual outcome is uncertain.Readers should consider the above-noted factors when reviewing these sections. The preceding list of factors is not exhaustive of all possible riskfactors and other factors could also adversely affect the Bank’s results. When relying on forward-looking statements to make decisions with respect tothe Bank and its securities, investors and others should carefully consider the preceding factors, other uncertainties and potential events. The forward-looking statements contained in this document are presented for the purpose of assisting the holders of the Bank’s securities and financial analysts inunderstanding the Bank’s financial position and results of operations as at and for the periods ended on the dates presented, as well as the Bank’sfinancial performance objectives, vision and strategic goals, and may not be appropriate for other purposes. Except as required by law, the Bank doesnot undertake to update any forward-looking statements, whether written or oral, that may be made from time to time by or on its behalf.Additional information relating to the Bank, including the Bank’s Annual Information Form, can be located on the SEDAR website at www.sedar.comand on the EDGAR section of the SEC’s website at www.sec.gov.
November 28, 2017
2 0 1 7 S C O T I A B A N K A N N U A L R E P O R T | 13

MANAGEMENT’S DISCUSSION & ANALYSISThe Management’s Discussion and Analysis (MD&A) is provided to enable readers to assess the Bank’s financial condition and results of operations asat and for the year ended October 31, 2017. The MD&A should be read in conjunction with the Bank’s 2017 Consolidated Financial Statements andNotes. This MD&A is dated November 28, 2017.
Additional information relating to the Bank, including the Bank’s 2017 Annual Report, are available on the Bank’s website at www.scotiabank.com.As well, the Bank’s 2017 Annual Report and Annual Information Form are available on the SEDAR website at www.sedar.com and on the EDGARsection of the SEC’s website at www.sec.gov.
Non-GAAP Measures
The Bank uses a number of financial measures to assess its performance. Some of these measures are not calculated in accordance with GenerallyAccepted Accounting Principles (GAAP), which are based on International Financial Reporting Standards (IFRS), are not defined by GAAP and do nothave standardized meanings that would ensure consistency and comparability among companies using these measures. The Bank believes that certainnon-GAAP measures are useful in assessing underlying ongoing business performance and provide readers with a better understanding of howmanagement assesses performance. These non-GAAP measures are used throughout this report and defined below.
T1 Adjusted diluted earnings per share
The adjusted diluted earnings per share is calculated as follows:
2017 2016 2015
For the year ended October 31 ($ millions)Diluted
EPS(1)Diluted
EPS(1)Diluted
EPS(1)
Net income attributable to common shareholders (diluted) (refer to Note 33) $ 7,935 $ 6.49 $ 7,070 $ 5.77 $ 6,983 $ 5.672016 Restructuring charge – – 278 0.23 – –
Net income attributable to common shareholders (diluted) adjusted forrestructuring charge 7,935 6.49 7,348 6.00 6,983 5.67Amortization of intangible assets, excluding software 60 0.05 76 0.05 65 0.05
Adjusted net income attributable to common shareholders (diluted) $ 7,995 $ 6.54 $ 7,424 $ 6.05 $ 7,048 $ 5.72
Weighted average number of diluted common shares outstanding (millions) 1,223 1,226 1,232
(1) Adjusted diluted earnings per share calculations are based on full dollar and share amounts.
T2 Impact of the 2016 restructuring charge
The table below reflects the impact of the 2016 restructuring charge of $378 million pre-tax ($278 million after tax)(1).
For the year ended October 31, 2017 ($ millions) ReportedImpact of the 2016
restructuring chargeAdjusted for the
restructuring charge
Operating leverage 2.4% (2.6)% (0.2)%
For the year ended October 31, 2016 ($ millions) ReportedImpact of the 2016
restructuring chargeAdjusted for the
restructuring charge
Net income ($ millions) $ 7,368 $ 278 $ 7,646Diluted earnings per share $ 5.77 $ 0.23 $ 6.00Return on equity 13.8% 0.5% 14.3%Productivity ratio 55.2% (1.5)% 53.7%Operating leverage (1.9)% 2.9% 1.0%
(1) Calculated using the statutory tax rates of the various jurisdictions.
Core banking assets
Core banking assets are average earning assets excluding bankers’ acceptances and average trading assets within Global Banking and Markets.
Core banking margin
This ratio represents net interest income divided by average core banking assets.
14 | 2 0 1 7 S C O T I A B A N K A N N U A L R E P O R T

T3 Financial highlights
As at and for the years ended October 31 2017 2016 2015
Operating results ($ millions)Net interest income 15,035 14,292 13,092Non-interest income 12,120 12,058 10,957Total revenue 27,155 26,350 24,049Provision for credit losses 2,249 2,412 1,942Non-interest expenses 14,630 14,540 13,041Income tax expense 2,033 2,030 1,853Net income 8,243 7,368 7,213Net income attributable to common shareholders 7,876 6,987 6,897
Operating performanceBasic earnings per share ($) 6.55 5.80 5.70Diluted earnings per share ($) 6.49 5.77 5.67Adjusted diluted earnings per share ($)(1)(2) 6.54 6.05 5.72Return on equity (%) 14.6 13.8 14.6Productivity ratio (%) 53.9 55.2 54.2Operating leverage (%) 2.4 (1.9) (1.6)Core banking margin (%)(1) 2.46 2.38 2.39
Financial position information ($ millions)Cash and deposits with financial institutions 59,663 46,344 73,927Trading assets 98,464 108,561 99,140Loans 504,369 480,164 458,628Total assets 915,273 896,266 856,497Deposits 625,367 611,877 600,919Common equity 55,454 52,657 49,085Preferred shares and other equity instruments 4,579 3,594 2,934Assets under administration 470,198 472,817 453,926Assets under management 206,675 192,702 179,007
Capital and liquidity measuresCommon Equity Tier 1 (CET1) capital ratio (%) 11.5 11.0 10.3Tier 1 capital ratio (%) 13.1 12.4 11.5Total capital ratio (%) 14.9 14.6 13.4Leverage ratio (%) 4.7 4.5 4.2CET1 risk-weighted assets ($ millions)(3) 376,379 364,048 357,995Liquidity coverage ratio (LCR) (%) 125 127 124
Credit qualityNet impaired loans ($ millions)(4) 2,243 2,446 2,085Allowance for credit losses ($ millions) 4,327 4,626 4,197Net impaired loans as a % of loans and acceptances(4) 0.43 0.49 0.44Provision for credit losses as a % of average net loans and acceptances 0.45 0.50 0.43
Common share informationClosing share price ($)(TSX) 83.28 72.08 61.49Shares outstanding (millions)
Average – Basic 1,203 1,204 1,210Average – Diluted 1,223 1,226 1,232End of period 1,199 1,208 1,203
Dividends paid per share ($) 3.05 2.88 2.72Dividend yield (%)(5) 4.0 4.7 4.4Market capitalization ($ millions)(TSX) 99,872 87,065 73,969Book value per common share ($) 46.24 43.59 40.80Market value to book value multiple 1.8 1.7 1.5Price to earnings multiple (trailing 4 quarters) 12.7 12.4 10.8
Other informationEmployees 88,645 88,901 89,214Branches and offices 3,003 3,113 3,177
(1) Refer to page 14 for a discussion of Non-GAAP measures.(2) Refer to table T1 Adjusted diluted earnings per share.(3) As at October 31, 2017, credit valuation adjustment (CVA) risk-weighted assets were calculated using scalars of 0.72, 0.77 and 0.81 to compute CET1, Tier 1 and Total Capital ratios, respectively.(4) Excludes loans acquired under the Federal Deposit Insurance Corporation (FDIC) guarantee related to the acquisition of R-G Premier Bank of Puerto Rico.(5) Based on the average of the high and low common share price for the year.
2 0 1 7 S C O T I A B A N K A N N U A L R E P O R T | 15

MANAGEMENT’S DISCUSSION AND ANALYSIS
Overview of Performance
Financial Results: 2017 vs 2016
The Bank’s net income for the year was $8,243 million, up 12% from $7,368 million. Diluted earnings per share (EPS) were $6.49 compared to $5.77.Return on equity was 14.6% compared to 13.8%.
Adjusting for the impact of the restructuring charge in the prior year of $278 million after tax ($378 million pre-tax), or $0.23 per share1, net incomeand diluted earnings per share increased 8%. Return on equity was 14.6% compared to 14.3% last year on an adjusted basis.
Net income was positively impacted by increases in net interest income and banking fees, as well as lower provision for credit losses and a lowereffective tax rate. Partially offsetting were lower trading revenues, as well as higher non-interest expenses and the unfavourable impact of foreigncurrency translation. Lower net gain on investment securities was partly offset by higher gains on sale of real estate. This year’s gain on sale ofHollisWealth, a wealth management business, was lower than last year’s gain on sale of a non-core lease financing business (“gain on sale ofbusinesses”) in Canadian Banking.
Net interest income increased $743 million or 5%, due primarily to growth in retail and commercial lending in Canadian Banking and InternationalBanking, partly offset by the unfavourable impact of foreign currency translation. The core banking margin improved eight basis points to 2.46%,driven by higher margins in all business lines.
Non-interest income increased to $12,120 million from $12,058 million. Higher banking and credit card revenues were partly offset by lower tradingrevenues and lower fee and commission revenues due to the sale of HollisWealth business. Lower gain on sale of businesses in Canadian Banking,lower net gain on investment securities and the negative impact of foreign currency translation were partly offset by higher gains on sale of realestate.
Provision for credit losses was $2,249 million, down $163 million from last year, due primarily to lower provisions related to energy exposures and theimpact of last year’s increase in the collective allowance against performing loans of $50 million. Lower commercial provisions in Canadian Bankingand International Banking were partly offset by higher retail provisions. The provision for credit losses ratio improved five basis points to 45 basispoints.
Non-interest expenses were $14,630 million this year compared to $14,540 million. Adjusting for the impact of the restructuring charge last year,non-interest expenses increased $468 million or 3%, reflecting higher employee costs, including pension and other benefit costs, as well asperformance-based compensation and the impact of acquisitions. Increased investments in technology and digital banking also contributed to theyear-over-year increase. Partly offsetting were savings from cost-reduction initiatives, the impact from the sale of a wealth management business, andthe impact of foreign currency translation.
The productivity ratio was 53.9% compared to 55.2%, or 53.7% adjusting for the impact of the restructuring charge last year. Operating leveragewas positive 2.4%, or negative 0.2% adjusting for the restructuring charge.
The provision for income taxes was $2,033 million in line with last year. The Bank’s effective tax rate for the year was 19.8% compared to 21.6%, dueprimarily to higher tax-exempt dividends related to client-driven equity trading activities and lower taxes in certain foreign jurisdictions this year.
The all-in Basel III Common Equity Tier 1 ratio was 11.5% as at October 31, 2017, compared to 11.0% last year, and remained well above theregulatory minimum.
Medium-term financial objectives
2017 Results
Reported Adjusted(1)
Diluted earnings per share growth of 5-10% 12% 8%Return on equity of 14%+ 14.6% 14.6%Achieve positive operating leverage Positive 2.4% Negative 0.2%Maintain strong capital ratios CET1 capital ratio of 11.5% CET1 capital ratio of 11.5%
Shareholder Returns
In fiscal 2017, the total shareholder return on the Bank’s shares was 20.3%, which outperformedthe 8.3% total return of the S&P/TSX Composite Index.
The total compound annual shareholder return on the Bank’s shares over the past five years was13.7%, and 9.0% over the past 10 years. This exceeded the total annual return of the S&P/TSXComposite Index, which was 8.4% over the past five years and 3.9% over the last 10 years.
Quarterly dividends were raised twice during the year – a two cent increase effective the secondquarter and a further three cent increase effective in the fourth quarter. As a result, dividends pershare totaled $3.05 for the year, up 6% from 2016. The dividend payout ratio of 46.6% for theyear was in line with the Bank’s target payout range of 40-50%.
C1 Closing common share priceas at October 31
07 09 11 13 15 17
304050607080
$90
1 Refer to Non-GAAP Measures on page 14.
16 | 2 0 1 7 S C O T I A B A N K A N N U A L R E P O R T

MA
NA
GEM
ENT’S
DISC
USSIO
NA
ND
AN
ALY
SIS|
OV
ER
VIE
WO
FP
ER
FOR
MA
NC
E
T4 Shareholder returns
For the years ended October 31 2017 2016 2015
Closing market price per common share ($) 83.28 72.08 61.49Dividends paid ($ per share) 3.05 2.88 2.72Dividend yield (%)(1) 4.0 4.7 4.4Increase (decrease) in share price (%) 15.5 17.2 (10.9)Total annual shareholder return (%)(2) 20.3 22.5 (7.0)
(1) Dividend yield is calculated as the dividend paid divided by the average of the high and low common share price for the year.(2) Total annual shareholder return assumes reinvestment of quarterly dividends, and therefore may not equal the sum of dividend and share price
returns in the table.
C2 Return to common shareholdersShare price appreciation plus dividendsreinvested, 2007=100
07 09 11 13 15 17
ScotiabankS&P/TSX Banks Total Return IndexS&P/TSX Composite Total Return Index
200
120
80
160
240
Economic Outlook
The sources of global growth are strengthening and diversifying, both within countries and across regions. This synchronized global recovery iscontributing to a re-assessment of monetary policy prospects in a number of countries, with a shift in both tone and action from several major centralbanks as they prepare to follow the US Fed’s lead and begin withdrawing exceptional stimulus measures. The Bank of Canada raised its overnight ratefor the first time in nearly seven years in July 2017 and again in September, and the Bank of England followed earlier in November. The EuropeanCentral Bank (ECB) and Bank of Japan are unlikely to change their policy stance in the near-term given weak inflation. While it is possible that this mayincrease volatility as markets digest the implications of reduced central bank support, this shift in stance from central bankers signals that globaleconomic recovery is self-sustaining and less reliant on exceptional policy measures.
In Canada, GDP growth is now tracking to hit 3.1% in 2017. This is the highest annual growth rate since 2011 and puts Canada on track to be one ofthe fastest-growing countries in the industrialized world. As the US economy heads into the eighth year of its third-longest expansion on record, thefundamentals for continued solid growth remain in place, though any slack in the economy is rapidly closing.
In Latin America, economic growth is projected to substantially accelerate next year, but it is likely to be affected by political uncertainty stemmingfrom looming presidential elections in Mexico, Chile, and Colombia, and political divisions in Peru. Similarly, investor support for Brazil will beintimately tied to the fate of the current government’s reform program.
In the Eurozone, survey indicators are extremely strong: they imply that GDP growth should continue to accelerate throughout 2017 to an annualaverage growth rate of 2.3%, twice the currency area’s potential growth rate. In contrast, the outlook for the UK has softened since earlier in the yearand the headwinds to growth are expected to build through 2018.
The Chinese government will likely continue its sizeable fiscal injections to keep the economy’s growth trajectory in line with the official growth targetof “around 6.5%” in 2017; we expect output to expand by 6.7% this year and 6.3% in 2018 as the level of policy support fades.
Impact of Foreign Currency Translation
The impact of foreign currency translation on net income is shown in the table below.
T5 Impact of foreign currency translation
2017 2016 2015
For the fiscal yearsAverage
exchange rate % ChangeAverage
exchange rate % ChangeAverage
exchange rate % Change
U.S. Dollar/Canadian Dollar 0.765 1.4% 0.754 (6.4)% 0.806 (12.2)%Mexican Peso/Canadian Dollar 14.608 6.9% 13.666 10.3% 12.386 2.8%Peruvian Sol/Canadian Dollar 2.513 (1.0)% 2.539 1.3% 2.505 (3.0)%Colombian Peso/Canadian Dollar 2,265 (1.8)% 2,307 10.8% 2,082 16.4%Chilean Peso/Canadian Dollar 500.108 (2.8)% 514.549 0.5% 512.203 0.2%
Impact on net income(1) ($ millions except EPS)2017
vs. 20162016
vs. 20152015
vs. 2014
Net interest income $ (112) $ (51) $ 232Non-interest income(2) (65) 182 243Non-interest expenses 99 86 (151)Other items (net of tax) 18 (34) (62)
Net income $ (60) $ 183 $ 262
Earnings per share (diluted) $ (0.05) $ 0.15 $ 0.21
Impact by business line ($ millions)Canadian Banking $ (4) $ 14 $ 20International Banking(2) (14) 44 84Global Banking and Markets (12) 65 110Other(2) (30) 60 48
$ (60) $ 183 $ 262
(1) Includes impact of all currencies.(2) Includes the impact of foreign currency hedges.
2 0 1 7 S C O T I A B A N K A N N U A L R E P O R T | 17

MANAGEMENT’S DISCUSSION AND ANALYSIS
GROUP FINANCIAL PERFORMANCENet IncomeNet income was $8,243 million, up 12% compared to $7,368 million last year. Last year’s results included a restructuring charge of $378 millionpre-tax, or $278 million after tax. Adjusting for the restructuring charge last year, net income increased $597 million or 8%.
Net Interest IncomeNet interest income was $15,035 million, an increase of $743 million or 5% from the previous year. This increase was driven by a 2% growth in corebanking assets and a 3% increase in the core banking margin.
Net interest income in Canadian Banking was up $339 million or 5% driven by solid asset and deposit growth and an increase in margin. Net interestincome increased $367 million or 6% in International Banking due primarily to strong asset growth and improved margins. Global Banking andMarkets net interest income rose $43 million or 3%.
Core banking assets increased $11 billion to $609 billion. The increase was driven by strong growth in retail and commercial lending in CanadianBanking as well as International Banking. Partially offsetting were lower volumes of deposits with financial institutions, corporate loans in GlobalBanking and Markets and the negative impact of foreign currency translation.
The core banking margin improved eight basis points to 2.46%, driven by higher margins across all business lines.
Outlook
Net interest income is expected to increase in 2018 driven by growth in core banking assets across all business lines and higher margins, partly offsetby the unfavourable impact of foreign currency translation. The core banking margin is expected to benefit in a rising interest rate environment.
T6 Net interest income and core banking margin(1)
2017 2016 2015
($ billions, except percentage amounts)Averagebalance Interest
Averagerate
Averagebalance Interest
Averagerate
Averagebalance Interest
Averagerate
Total average assets and net interest income $ 912.6 $ 15.0 $ 913.8 $ 14.3 $ 860.6 $ 13.1Less: total assets in Capital Markets(1) 249.2 – 259.4 – 258.1 –
Banking margin on average total assets $ 663.4 $ 15.0 2.26% $ 654.4 $ 14.3 2.18% $ 602.5 $ 13.1 2.18%Less: non-earning assets and customers’ liability under
acceptances 54.6 56.6 54.4
Core banking assets and margin $ 608.8 $ 15.0 2.46% $ 597.8 $ 14.3 2.38% $ 548.1 $ 13.1 2.39%
(1) Net interest income from Capital Markets trading assets is recorded in trading revenues in non-interest income.
18 | 2 0 1 7 S C O T I A B A N K A N N U A L R E P O R T

MA
NA
GEM
ENT’S
DISC
USSIO
NA
ND
AN
ALY
SIS|
GR
OU
PFIN
AN
CIA
LP
ER
FOR
MA
NC
E
T7 Average balance sheet(1) and net interest income
2017 2016 2015
For the fiscal years ($ billions)Averagebalance Interest
Averagerate
Averagebalance Interest
Averagerate
Averagebalance Interest
Averagerate
AssetsDeposits with financial institutions $ 53.2 $ 0.5 0.98% $ 67.8 $ 0.4 0.58% $ 71.1 $ 0.3 0.41%Trading assets 107.2 0.1 0.13% 107.2 0.2 0.16% 111.2 0.2 0.17%Securities purchased under resale
agreements and securities borrowed 97.0 0.3 0.29% 99.8 0.1 0.16% 99.9 0.2 0.16%Investment securities 74.8 1.3 1.68% 67.8 1.1 1.57% 43.7 0.7 1.69%Loans:
Residential mortgages 228.3 7.4 3.23% 218.6 7.4 3.37% 214.4 7.5 3.51%Personal and credit cards 100.9 7.8 7.78% 96.8 7.3 7.57% 87.5 6.6 7.52%Business and government 165.0 6.5 3.94% 161.4 5.5 3.41% 142.2 4.6 3.25%Allowance for credit losses (4.5) (4.6) (4.0)
Total loans $ 489.7 $ 21.7 4.43% $ 472.2 $ 20.2 4.28% $ 440.1 $ 18.7 4.26%
Total earning assets $ 821.9 $ 23.9 2.91% $ 814.8 $ 22.0 2.70% $ 766.0 $ 20.1 2.63%
Customers’ liability under acceptances 12.3 11.4 11.4Other assets 78.4 87.6 83.2
Total assets $ 912.6 $ 23.9 2.62% $ 913.8 $ 22.0 2.41% $ 860.6 $ 20.1 2.34%
Liabilities and equityDeposits:
Personal $ 203.8 $ 2.7 1.30% $ 195.1 $ 2.4 1.22% $ 181.4 $ 2.3 1.27%Business and government 374.7 4.7 1.26% 384.7 3.9 1.01% 368.1 3.4 0.91%Financial institutions 42.1 0.5 1.23% 42.8 0.4 1.03% 37.3 0.3 0.85%
Total deposits $ 620.6 $ 7.9 1.27% $ 622.6 $ 6.7 1.08% $ 586.8 $ 6.0 1.02%
Obligations related to securities soldunder repurchase agreements andsecurities lent 102.3 0.2 0.21% 99.1 0.2 0.19% 90.7 0.2 0.26%
Subordinated debentures 7.1 0.2 3.19% 7.5 0.2 3.10% 5.6 0.2 3.33%Other interest-bearing liabilities 58.5 0.6 0.99% 54.9 0.6 1.04% 50.1 0.6 1.20%
Total interest-bearing liabilities $ 788.5 $ 8.9 1.13% $ 784.1 $ 7.7 0.98% $ 733.2 $ 7.0 0.96%
Other liabilities including acceptances 65.3 74.4 75.9Equity(2) 58.8 55.3 51.5
Total liabilities and equity $ 912.6 $ 8.9 0.97% $ 913.8 $ 7.7 0.84% $ 860.6 $ 7.0 0.81%
Net interest income $ 15.0 $ 14.3 $ 13.1
(1) Average of daily balances.(2) Includes non-controlling interests of $1.6 in 2017, $1.5 in 2016 and $1.3 in 2015.
2 0 1 7 S C O T I A B A N K A N N U A L R E P O R T | 19

MANAGEMENT’S DISCUSSION AND ANALYSIS
Non-Interest Income
T8 Non-interest income
For the fiscal years ($ millions) 2017 2016 2015
2017versus
2016
BankingCard revenues $ 1,514 $ 1,359 $ 1,089 11%Deposit and payment services
Deposit services 989 949 928 4Other payment services 335 330 307 2
1,324 1,279 1,235 4
Credit feesCommitment and other credit fees 846 870 787 (3)Acceptance fees 307 284 266 8
1,153 1,154 1,053 –
Other 472 436 406 8
$ 4,463 $ 4,228 $ 3,783 6%
Banking fee related expenses 608 559 423 9
Total banking $ 3,855 $ 3,669 $ 3,360 5%
Wealth managementMutual funds $ 1,639 $ 1,624 $ 1,619 1%Brokerage fees 1,021 1,010 1,006 1Investment management and trust
Investment management and custody 453 443 440 2Personal and corporate trust 205 205 204 –
658 648 644 2
Total wealth management $ 3,318 $ 3,282 $ 3,269 1%
Underwriting and other advisory 598 594 525 1Non-trading foreign exchange 557 540 492 3Trading revenues 1,259 1,403 1,185 (10)Net gain on investment securities 380 534 639 (29)Net income from investments in associated
corporations 407 414 405 (2)Insurance underwriting income, net of claims 626 603 556 4Other 1,120 1,019 526 10
Total non-interest income $12,120 $12,058 $10,957 1%
C3 Sources of non-interest income
12%
10%
10%
5%
14%
8%5%
5%
21%
10%
Card revenues
Credit fees
Deposit andpayment servicesand other bankingfees
Mutual fundsBrokerage Fees
Underwriting andother advisory feesNon-trading foreignexchange fees
Investmentmanagement andtrust
Trading revenuesOther non-interestincome
Non-interest income was $12,120 million, up $62 million or 1%, primarily from growth in banking, wealth management and insurance, partly offsetby lower trading revenues, lower net gain on sale of businesses and the negative impact of foreign currency translation. Higher gains on sales of realestate were more than offset by lower net gain on investment securities.
Banking revenues, excluding related expenses, grew $235 million or 6% to $4,463 million reflecting strong growth in card revenues from higher feesin Canadian Banking and International Banking. Fees from deposit and payment services were up $45 million or 4%, mostly in Canadian Banking.Banking fee related expenses rose $49 million or 9%, primarily due to credit card expenses driven by higher transaction volumes.
Wealth management revenues increased $36 million or 1% to $3,318 million due primarily to higher fee-based brokerage and mutual fund revenues,partly offset by the impact of the sale of the HollisWealth business.
Trading revenues of $1,259 million were lower by $144 million or 10% from the prior year, primarily due to lower revenues in the equity, fixedincome and commodities businesses.
Insurance underwriting income was up $23 million or 4% year over year, mostly from strong business growth in the Canadian market.
Other income was $1,120 million, up $101 million due primarily to higher gains on sale of real estate, partly offset by lower gain on sale ofbusinesses.
Outlook
Non-interest income in 2018 is expected to benefit from higher credit card revenues, banking fees and trading revenues, while gains on investmentsecurities and real estate sales are expected to be lower.
20 | 2 0 1 7 S C O T I A B A N K A N N U A L R E P O R T

MA
NA
GEM
ENT’S
DISC
USSIO
NA
ND
AN
ALY
SIS|
GR
OU
PFIN
AN
CIA
LP
ER
FOR
MA
NC
E
T9 Trading revenues
For the fiscal years ($ millions) 2017 2016 2015
By trading products:Interest rate and credit $ 575 $ 613 $ 400Equities 47 101 177Commodities 295 376 345Foreign exchange 250 262 201Other 92 51 62
Total trading revenues $ 1,259 $ 1,403 $ 1,185
% of total revenues 4.6% 5.3% 4.9%
Provision for Credit LossesProvision for credit losses was $2,249 million, down $163 million from last year due primarily to lower provisions related to energy exposures and theimpact of last year’s increase in the collective allowance against performing loans of $50 million. The provision for credit losses ratio was 45 basispoints compared to 50 basis points in the prior year.
The provision for credit losses in Canadian Banking was $913 million, an increase of $81 million due to higher provisions in retail portfolios, primarilyin credit cards and lines of credit. The provision for credit losses ratio was 29 basis points in Canadian Banking, in line with the prior year.
The provision for credit losses in International Banking increased $13 million to $1,294 million. Retail provision increases in Colombia, Chile, Uruguayand Peru were partly offset by lower provisions in Mexico and the Caribbean and Central America. Commercial provisions were lower in Colombia,the Caribbean, and Mexico, and were partly offset by higher provisions, primarily in Chile and Central America. Overall, the provision for credit lossesratio improved five basis points to 1.21%.
The provision for credit losses in Global Banking and Markets decreased $207 million to $42 million due primarily to higher energy sector provisionslast year. The provision for credit losses ratio was five basis points, down 25 basis points from last year.
The collective allowance against performing loans of $1,562 million, held in the Other segment, remained unchanged. An increase in the allowancefor exposures related to recent hurricanes in the Caribbean and Puerto Rico, was offset by a reduction in the amount held against energy exposures.
Outlook
The quality of the Bank’s credit portfolio is expected to remain strong given its broad global diversification. The total provision for credit losses isexpected to increase in 2018 mostly due to higher provisions attributable to performing loans under IFRS 9 accounting standards. We also expectgreater volatility from implementation of the new accounting standards. However, underlying performance remains strong, and in Canadian Banking,retail and commercial credit quality is expected to remain stable. In International Banking, the retail provision for credit losses is expected to rise duemainly to lower acquisition-related benefits and seasoning of unsecured growth in 2017, while commercial credit quality is expected to remain stable.In Global Banking and Markets, the credit quality is expected to improve slightly.
T10 Provisions against impaired loans by business line
For the fiscal years ($ millions) 2017 2016 2015
Canadian BankingRetail $ 857 $ 770 $ 642Commercial 56 62 45
$ 913 $ 832 $ 687
International BankingCaribbean and Central America $ 215 $ 250 $ 184Latin America
Mexico 193 224 260
Peru 329 317 265
Chile 145 112 108
Colombia 337 320 247
Other Latin America 75 58 64
Total Latin America 1,079 1,031 944
$ 1,294 $ 1,281 $ 1,128
Global Banking and MarketsCanada $ (6) $ 43 $ 42U.S. (15) 113 4Asia and Europe 63 93 21
$ 42 $ 249 $ 67
Total $ 2,249 $ 2,362 $ 1,882
2 0 1 7 S C O T I A B A N K A N N U A L R E P O R T | 21

MANAGEMENT’S DISCUSSION AND ANALYSIS
T11 Provision for credit losses as a percentage of average net loans and acceptances
For the fiscal years (%) 2017 2016 2015
Canadian BankingRetail 0.32% 0.29% 0.25%Commercial 0.13 0.15 0.12
0.29 0.28 0.23
International BankingRetail 2.09 2.08 2.33Commercial 0.37 0.52 0.26
1.21 1.26 1.24
Global Banking and Markets 0.05 0.30 0.10
Provisions against impaired loans 0.45 0.49 0.42Provisions against performing loans – 0.01 0.01
Total 0.45% 0.50% 0.43%
T12 Net charge-offs(1) as a percentage of average loans and acceptances
For the fiscal years (%) 2017 2016 2015
Canadian BankingRetail 0.34% 0.26% 0.26%Commercial 0.18 0.16 0.20
0.32 0.24 0.25
International BankingRetail 2.17 1.90 1.99Commercial 0.50 0.31 0.30
1.31 1.06 1.10
Global Banking and Markets 0.11 0.21 0.01
Total 0.50% 0.41% 0.39%
(1) Write-offs net of recoveries.
22 | 2 0 1 7 S C O T I A B A N K A N N U A L R E P O R T

MA
NA
GEM
ENT’S
DISC
USSIO
NA
ND
AN
ALY
SIS|
GR
OU
PFIN
AN
CIA
LP
ER
FOR
MA
NC
E
Non-Interest Expenses
T13 Non-interest expenses and productivity
For the fiscal years ($ millions) 2017 2016 2015
2017versus
2016
Salaries and employee benefitsSalaries $ 4,220 $ 4,071 $ 4,019 4%Performance-based compensation 1,599 1,538 1,438 4Share-based payments 209 243 220 (14)Other employee benefits 1,347 1,173 1,004 15
$ 7,375 $ 7,025 $ 6,681 5%
Premises and technologyPremisesOccupancy 444 428 433 4Property taxes 93 89 89 4Other premises costs 432 431 421 –
$ 969 $ 948 $ 943 2%
Technology $ 1,467 $ 1,290 $ 1,143 14%
$ 2,436 $ 2,238 $ 2,086 9%
Depreciation and amortizationDepreciation 340 325 303 5Amortization of intangible assets 421 359 281 17
$ 761 $ 684 $ 584 11%
Communications $ 437 $ 442 $ 434 (1)%
Advertising and business development $ 581 $ 617 $ 592 (6)%
Professional $ 775 $ 693 $ 548 12%
Business and capital taxesBusiness taxes 383 356 319 8Capital taxes 40 47 42 (15)
$ 423 $ 403 $ 361 5%
Other $ 1,842 $ 2,438 $ 1,755 (24)%
Total non-interest expenses $ 14,630 $ 14,540 $ 13,041 1%
Productivity ratio 53.9% 55.2% 54.2%
C4 Non-interest expenses$ millions
8000600040002000
16000140001200010000
15 16 17
Other
Premises & technology
Communications & advertisingProfessional & taxes
Salaries & employee benefits
Depreciation and amortization
C5 Direct and indirect taxes$ millions
15 16 17
2000
2500
1500
1000
500
3500
3000
Total other taxesProvision for income taxes
2 0 1 7 S C O T I A B A N K A N N U A L R E P O R T | 23

MANAGEMENT’S DISCUSSION AND ANALYSIS
Non-interest expenses were $14,630 million, an increase of $90 million or 1%. Adjusting for the impact of the prior year’s restructuring charge of$378 million, non-interest expenses increased by $468 million or 3%.
The increase was due mostly to higher technology costs, professional fees and software amortization. As well, there were increases in employee costs,including benefit expenses and performance-based compensation, higher business taxes, and the impact of acquisitions. These were partly offset bythe positive impact of foreign currency translation and the impact of the sale of HollisWealth.
The Bank’s total technology cost, that includes Technology expenses in Table T13 and those included within Salaries, Professional, Amortization ofintangible assets and Depreciation, amounted to $3.1 billion, an increase of 14% from $2.7 billion incurred in 2016. This increase reflects the Bank’sinvestment in its digital transformation and technology modernization efforts. The Bank achieved savings of approximately $500 million in 2017arising from cost-reduction initiatives relating to the 2016 restructuring charge. The Bank’s strategy to reduce structural costs will lead to productivitygains and partially fund these larger technology investments.
The productivity ratio was 53.9% compared to 55.2%, or 53.7% adjusting for last year’s restructuring charge.
Operating leverage was positive 2.4%, or negative 0.2% adjusting for the restructuring charge.
Outlook
Non-interest expenses are expected to rise in 2018. This is driven by business growth and ongoing strategic and technology investments. The growthwill be partly offset by further savings from structural cost reduction initiatives.
Income Taxes
The provision for income taxes was $2,033 million, in line with last year. The Bank’s overall effective tax rate for the year was 19.8% compared to21.6% for 2016. The decrease in the effective tax rate was due primarily to higher tax-exempt income from client-driven equity trading activities andlower taxes in certain foreign jurisdictions this year.
Outlook
The Bank’s consolidated effective tax rate is expected to be in the range of 22% to 25% in 2018.
24 | 2 0 1 7 S C O T I A B A N K A N N U A L R E P O R T

MA
NA
GEM
ENT’S
DISC
USSIO
NA
ND
AN
ALY
SIS|
GR
OU
PFIN
AN
CIA
LP
ER
FOR
MA
NC
E
Financial Results Review: 2016 vs. 2015In order to identify key business trends between 2016 and 2015, commentary and the related financial results are below.
Net income
The Bank had net income of $7,368 million in 2016, up 2% from $7,213 million in 2015. Diluted earnings per share (EPS) were $5.77 comparedto $5.67 in 2015. Return on equity was 13.8% in 2016 compared to 14.6% in 2015.
The Bank recorded a restructuring charge of $378 million pre-tax, or $278 million after tax, in 2016 (refer T2). Adjusting for the restructuringcharge, net income was $7,646 million and diluted earnings per share was $6.00, up 6% compared to 2015. Return on equity was 14.3% on anadjusted basis compared to 14.6% in 2015.
The 2016 net income was positively impacted by increases in net interest income and non-interest income, as well as acquisitions and the favourableimpact of foreign currency translation. Partially offsetting were higher provision for credit losses, non-interest expenses and income taxes. The 2015net income was positively impacted by an increase in net interest income, the favourable impact of foreign currency translation and lower incometaxes. Mostly offsetting these positive impacts were higher provision for credit losses and higher non-interest expenses. The 2015 net incomeincluded the following, largely offsetting items, comprised of a reduction in the pension benefit accrual related to modifications made to the Bank’smain pension plan of $204 million pre-tax ($151 million after tax; approximately 3% of the pension liability), an increase to the collective allowanceagainst performing loans of $60 million pre-tax ($44 million after tax) to support the growing loan portfolio, and reorganization costs related to theconsolidation of Canadian shared services operations of $61 million pre-tax ($45 million after tax). These items were recorded in the Other segment.
Net interest income
Net interest income increased $1,200 million or 9% to $14,292 million in 2016, driven by growth in core banking assets across all business linesand acquisitions. The core banking margin was 2.38%, down one basis point from 2015.
Non-interest income
Non-interest income increased $1,101 million or 10% to $12,058 million in 2016. Strong growth in banking and trading revenues, acquisitionsand the favourable impact of foreign currency translation contributed to the increase. Also contributing to the increase in 2016 was a gain on saleof a non-core lease financing business in Canada, while gains on sale of real estate in 2016 were largely offset by lower net gains on investmentsecurities. In 2015, increases in wealth management and banking revenues and the positive impact of foreign currency translation were partlyoffset by lower underwriting and advisory fees and lower net gain on investment securities.
Provision for credit losses
The total provision for credit losses was $2,412 million in 2016, up $470 million from 2015, and net of acquisition-related benefits of$152 million. Contributing to this increase were higher provisions related to energy exposures in Global Banking and Markets, higher commercialprovisions in International Banking, and higher retail provisions in Canadian Banking, primarily in credit cards and automotive loans, generally inline with volume growth. Partially offsetting were higher acquisition-related benefits this year. The 2016 provision for credit losses included a$50 million increase in the collective allowance against performing loans compared to an increase of $60 million in 2015.
Non-interest expenses
Non-interest expenses were $14,540 million in 2016, an increase of $1,499 million or 11% over 2015. Adjusting for the restructuring charge(refer T2), expenses increased 9%. The increase reflects the impact of acquisitions, higher performance-based compensation, as well as higherbusiness initiative and volume-driven costs including technology and professional fees, software amortization, and deposit insurance. As well, therewere higher employee pension and benefit expenses as 2015 benefited from lower pension benefit costs related to modifications made to theBank’s main pension plan. These were partly offset by net savings of $55 million realized from structural cost reduction initiatives related to the2016 restructuring charge, as well as the reorganization cost incurred in 2015. Operating leverage was negative 1.9% on a reported basis, orpositive 1.0% adjusting for the restructuring charge (refer T2).
Income taxes
The provision for income taxes was $2,030 million, an increase of $177 million from 2015. The Bank’s overall effective tax rate for 2016 was21.6% compared to 20.4% in 2015. The increase in the effective tax rate was due primarily to lower tax-exempt income and higher taxes inforeign jurisdictions in 2016.
T14 Financial Results Review
For the year ended October 31, 2016 ($ millions)(1)Canadian
BankingInternational
BankingGlobal Banking
and Markets Other(2) Total
Net interest income $ 7,024 $ 6,359 $ 1,293 $ (384) $ 14,292Non-interest income 5,164 3,482 3,139 273 12,058
Total revenue $ 12,188 $ 9,841 $ 4,432 $ (111) $ 26,350Provision for credit losses 832 1,281 249 50 2,412Non-interest expenses 6,324 5,523 2,040 653 14,540Income tax expense 1,296 707 572 (545) 2,030
Net income $ 3,736 $ 2,330 $ 1,571 $ (269) $ 7,368
Net income attributable to non-controlling interests – 251 – – 251
Net income attributable to equity holders of the Bank $ 3,736 $ 2,079 $ 1,571 $ (269) $ 7,117
(1) Taxable equivalent basis. Refer to Glossary.(2) Includes all other smaller operating segments, including Group Treasury, and corporate adjustments, such as the elimination of the tax-exempt income gross-up reported in net interest income, non-interest income and provision
for income taxes for the year ended October 31, 2016 – $299 to arrive at the amounts reported in Consolidated Statement of income, and differences in the actual amount of costs incurred and charged to the operatingsegments.
2 0 1 7 S C O T I A B A N K A N N U A L R E P O R T | 25

MANAGEMENT’S DISCUSSION AND ANALYSIS
For the year ended October 31, 2015 ($ millions)(1)Canadian
BankingInternational
BankingGlobal Banking
and Markets Other(2) Total
Net interest income $ 6,415 $ 5,706 $ 1,071 $ (100) $ 13,092Non-interest income 4,832 3,137 2,953 35 10,957
Total revenue $ 11,247 $ 8,843 $ 4,024 $ (65) $ 24,049Provision for credit losses 687 1,128 67 60 1,942Non-interest expenses 6,014 5,095 1,846 86 13,041Income tax expense 1,202 568 558 (475) 1,853
Net income $ 3,344 $ 2,052 $ 1,553 $ 264 $ 7,213
Net income attributable to non-controlling interests – 199 – – 199
Net income attributable to equity holders of the Bank $ 3,344 $ 1,853 $ 1,553 $ 264 $ 7,014
(1) Taxable equivalent basis. Refer to Glossary.(2) Includes all other smaller operating segments, including Group Treasury, and corporate adjustments, such as the elimination of the tax-exempt income gross-up reported in net interest income, non-interest income and provision
for income taxes for the year ended October 31, 2015 – $390 to arrive at the amounts reported in Consolidated Statement of income, and differences in the actual amount of costs incurred and charged to the operatingsegments.
26 | 2 0 1 7 S C O T I A B A N K A N N U A L R E P O R T

MA
NA
GEM
ENT’S
DISC
USSIO
NA
ND
AN
ALY
SIS|
GR
OU
PFIN
AN
CIA
LP
ER
FOR
MA
NC
E
Fourth Quarter Review
T15 Fourth quarter financial results
For the three months ended
($ millions)October 31
2017July 31
2017October 31
2016
Net interest income $ 3,831 $ 3,833 $ 3,653Non-interest income 2,981 3,061 3,098
Total revenue $ 6,812 $ 6,894 $ 6,751Provision for credit losses 536 573 550Non-interest expenses 3,668 3,672 3,650Income tax expense 538 546 540
Net income $ 2,070 $ 2,103 $ 2,011
Net income attributable to non-controlling interests in subsidiaries $ 55 $ 58 $ 72
Net income attributable to equity holders of the Bank $ 2,015 $ 2,045 $ 1,939Preferred shareholders and other equity instrument holders 29 29 31Common shareholders $ 1,986 $ 2,016 $ 1,908
Net income
Q4 2017 vs Q4 2016
Net income was $2,070 million, an increase of $59 million or 3%. Asset growth and an improved net interest margin, a lower provision for creditlosses and a lower effective tax rate were partly offset by a decline in non-interest income.
Q4 2017 vs Q3 2017
Net income was $2,070 million, a decrease of $33 million or 2%, due primarily to the negative impact of foreign currency translation. Lower non-interest income was partly offset by lower provision for credit losses.
Net interest income
Q4 2017 vs Q4 2016
Net interest income was $3,831 million, an increase of $178 million or 5%. Adjusting for the negative impact of foreign currency translation, netinterest income grew by 7%. The increase was attributable to asset growth in retail and commercial lending in Canadian Banking and InternationalBanking, as well as higher core banking margin.
The core banking margin improved four basis points to 2.44%, driven by higher margins in Global Banking and Markets and Canadian Banking, partlyoffset by lower margins in International Banking.
Q4 2017 vs Q3 2017
Net interest income was $3,831 million, a decrease of $2 million. Adjusting for the negative impact of foreign currency translation, net interestincome grew by 2%. Growth in retail and commercial lending in Canadian Banking was partly offset by the impact of lower margin.
The core banking margin of 2.44% was down two basis points, mainly from lower margins in International Banking, partly offset by higher margins inGlobal Banking and Markets.
Non-interest income
Q4 2017 vs Q4 2016
Non-interest income of $2,981 million was down $117 million or 4%. This was due mainly to lower trading revenues, lower fee and commissionrevenue due to the sale of HollisWealth business (“Sale of business”) and lower gains on sale of real estate. Partly offsetting were higher cardrevenues, higher net gain on investment securities, and the gain on Sale of business.
Q4 2017 vs Q3 2017
Non-interest income was $2,981 million, down $80 million or 3%. Half of the decrease was due to the negative impact of foreign currencytranslation. The remaining decrease was due to lower fee and commission revenue due to the Sale of business, lower banking fees and tradingrevenues, and lower gains on sale of real estate. Partly offsetting were higher net gains on investment securities, and the gain on Sale of business.
Provision for credit losses
Q4 2017 vs Q4 2016
The provision for credit losses was $536 million, down $14 million. The decrease was due primarily to lower provisions in Global Banking and Markets,partly offset by higher provisions in International Banking. The collective allowance against performing loans of $1,562 million, held in the Othersegment, remained unchanged. An increase in the allowance for exposures related to recent hurricanes in the Caribbean was primarily offset by areduction in the amount held against energy exposures. The provision for credit losses ratio improved three basis points to 42 basis points.
Q4 2017 vs Q3 2017
The provision for credit losses was $536 million, a decline of $37 million. The decrease was due primarily to lower provisions in Global Banking andMarkets and lower retail provisions. The provision for credit losses ratio improved three basis points to 42 basis points.
2 0 1 7 S C O T I A B A N K A N N U A L R E P O R T | 27

MANAGEMENT’S DISCUSSION AND ANALYSIS
Non-interest expenses
Q4 2017 vs Q4 2016
Non-interest expenses were $3,668 million, up 1%, primarily reflecting investments in technology, digital banking and other initiatives and higheremployee pension and benefit costs. The growth was partly offset by savings from cost-reduction initiatives, the impact of the Sale of business and thepositive impact of foreign currency translation.
The productivity ratio was 53.8% compared to 54.1%.
Q4 2017 vs Q3 2017
Non-interest expenses were in line with last quarter or up 2% adjusting for the positive impact of foreign currency translation. Higher technology,professional and marketing expenses were partly offset by decreases from the impact of the Sale of business, as well as lower employee benefit andshared-based compensation expenses.
The productivity ratio was 53.8% compared to 53.3%.
Income taxes
Q4 2017 vs Q4 2016
The effective tax rate was 20.6% compared to 21.2% due primarily to higher tax-exempt income and lower taxes on the gain on Sale of business.
Q4 2017 vs Q3 2017
The effective tax rate was in line with the prior quarter. Higher taxes in foreign jurisdictions and lower tax-exempt income in the quarter were offset bylower taxes on the gain on Sale of business.
28 | 2 0 1 7 S C O T I A B A N K A N N U A L R E P O R T

MA
NA
GEM
ENT’S
DISC
USSIO
NA
ND
AN
ALY
SIS|
GR
OU
PFIN
AN
CIA
LP
ER
FOR
MA
NC
E
Trending Analysis
T16 Quarterly financial highlights
For the three months ended
($ millions)October 31
2017July 31
2017April 30
2017January 31
2017October 31
2016July 31
2016April 30
2016January 31
2016
Net interest income $ 3,831 $ 3,833 $ 3,728 $ 3,643 $ 3,653 $ 3,602 $ 3,518 $ 3,519Non-interest income 2,981 3,061 2,853 3,225 3,098 3,038 3,076 2,846
Total revenue $ 6,812 $ 6,894 $ 6,581 $ 6,868 $ 6,751 $ 6,640 $ 6,594 $ 6,365Provision for credit losses 536 573 587 553 550 571 752 539Non-interest expenses 3,668 3,672 3,601 3,689 3,650 3,505 3,817 3,568Income tax expense 538 546 332 617 540 605 441 444
Net income $ 2,070 $ 2,103 $ 2,061 $ 2,009 $ 2,011 $ 1,959 $ 1,584 $ 1,814
Basic earnings per share ($) 1.66 1.68 1.63 1.58 1.58 1.55 1.24 1.44Diluted earnings per share ($) 1.64 1.66 1.62 1.57 1.57 1.54 1.23 1.43
Net income
The Bank recorded strong net income over the past eight quarters, with earnings generally trending upwards over the period. The second quarter of2016 was impacted by a restructuring charge of $278 million ($378 million pre-tax).
Net interest income
Net interest income generally increased over the period, driven by steady growth in retail and commercial loans in both Canadian and InternationalBanking, as well as corporate loans in Global Banking and Markets. Additionally, the average balance of low-spread deposits with banks has declinedover the period. The margin has remained solid, with moderate increases in most periods. The margin was 2.44% this quarter, down two basis pointsfrom the prior quarter mainly from lower margins in International Banking driven by asset mix changes and lower inflation, partly offset by widermargins in Global Banking and Markets. The second quarter of 2017 experienced a 14 basis point increase to 2.54% driven by improved margins inInternational Banking mainly reflecting business mix changes and Central Bank rate changes, as well as higher contributions from asset/liabilitymanagement activities. The margin decreased to 2.46% in the third quarter of 2017, due mainly to asset mix changes in International Banking.
Non-interest income
Non-interest income increased in most quarters over the period. Banking revenues trended upward from growth in card fees in Canadian andInternational Banking. Wealth management fees were also strong over the period, but decreased this quarter due to the sale of HollisWealth. Tradingrevenues were generally strong over the period, but declined in the second quarter of 2017 due to lower trading revenues in the equities and fixedincome businesses. The lower net gain on investment securities in 2017 compared to the prior year was partly offset by higher gains on sale of realestate. The gain on Sale of business this quarter was lower than the gain on disposition of a non-core lease finance business in Canadian Banking inthe second quarter of 2016.
Provision for credit losses
Provision for credit losses has remained relatively stable over the period, but peaked in the second quarter of 2016 due primarily to provisions againstexposures in the energy sector and an increase of $50 million in the collective allowance against performing loans. Asset quality has remained strongover the period despite increased lending activity.
Non-interest expenses
Non-interest expenses have generally trended upwards over the period, mostly to support business growth and the Bank’s investments in strategicinitiatives and in technology. There have also been increases in performance-based compensation and employee-related benefits over the period. Thesecond quarter of 2016 included a restructuring charge of $378 million.
Income taxes
The effective tax rate was 20.6% this quarter and averaged 20.6% over the period, with a range of 13.9% to 23.6%. In the second quarter of 2017,the tax rate was 13.9% reflecting a higher amount of tax-exempt dividends related to client driven equity trading activities. Effective tax rates in otherquarters were impacted by different levels of income earned in foreign tax jurisdictions, as well as the variability of tax-exempt dividend income.
2 0 1 7 S C O T I A B A N K A N N U A L R E P O R T | 29
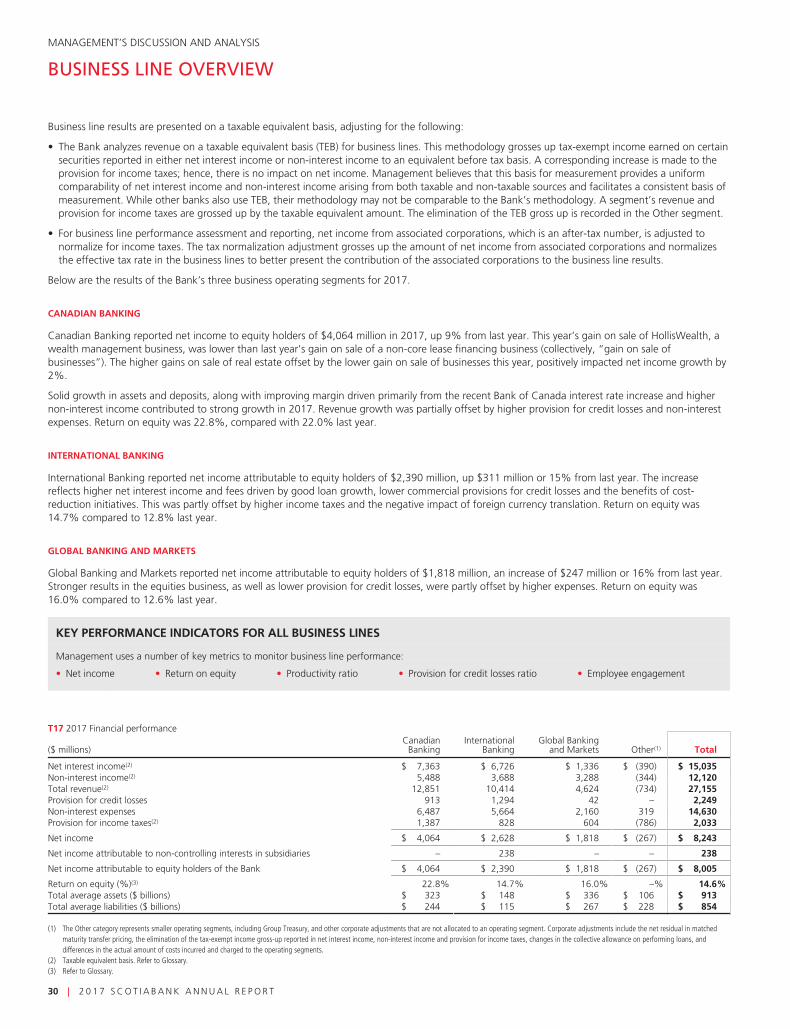
MANAGEMENT’S DISCUSSION AND ANALYSIS
BUSINESS LINE OVERVIEW
Business line results are presented on a taxable equivalent basis, adjusting for the following:
• The Bank analyzes revenue on a taxable equivalent basis (TEB) for business lines. This methodology grosses up tax-exempt income earned on certainsecurities reported in either net interest income or non-interest income to an equivalent before tax basis. A corresponding increase is made to theprovision for income taxes; hence, there is no impact on net income. Management believes that this basis for measurement provides a uniformcomparability of net interest income and non-interest income arising from both taxable and non-taxable sources and facilitates a consistent basis ofmeasurement. While other banks also use TEB, their methodology may not be comparable to the Bank’s methodology. A segment’s revenue andprovision for income taxes are grossed up by the taxable equivalent amount. The elimination of the TEB gross up is recorded in the Other segment.
• For business line performance assessment and reporting, net income from associated corporations, which is an after-tax number, is adjusted tonormalize for income taxes. The tax normalization adjustment grosses up the amount of net income from associated corporations and normalizesthe effective tax rate in the business lines to better present the contribution of the associated corporations to the business line results.
Below are the results of the Bank’s three business operating segments for 2017.
CANADIAN BANKING
Canadian Banking reported net income to equity holders of $4,064 million in 2017, up 9% from last year. This year’s gain on sale of HollisWealth, awealth management business, was lower than last year’s gain on sale of a non-core lease financing business (collectively, “gain on sale ofbusinesses”). The higher gains on sale of real estate offset by the lower gain on sale of businesses this year, positively impacted net income growth by2%.
Solid growth in assets and deposits, along with improving margin driven primarily from the recent Bank of Canada interest rate increase and highernon-interest income contributed to strong growth in 2017. Revenue growth was partially offset by higher provision for credit losses and non-interestexpenses. Return on equity was 22.8%, compared with 22.0% last year.
INTERNATIONAL BANKING
International Banking reported net income attributable to equity holders of $2,390 million, up $311 million or 15% from last year. The increasereflects higher net interest income and fees driven by good loan growth, lower commercial provisions for credit losses and the benefits of cost-reduction initiatives. This was partly offset by higher income taxes and the negative impact of foreign currency translation. Return on equity was14.7% compared to 12.8% last year.
GLOBAL BANKING AND MARKETS
Global Banking and Markets reported net income attributable to equity holders of $1,818 million, an increase of $247 million or 16% from last year.Stronger results in the equities business, as well as lower provision for credit losses, were partly offset by higher expenses. Return on equity was16.0% compared to 12.6% last year.
KEY PERFORMANCE INDICATORS FOR ALL BUSINESS LINES
Management uses a number of key metrics to monitor business line performance:
• Net income • Return on equity • Productivity ratio • Provision for credit losses ratio • Employee engagement
T17 2017 Financial performance
($ millions)Canadian
BankingInternational
BankingGlobal Banking
and Markets Other(1) Total
Net interest income(2) $ 7,363 $ 6,726 $ 1,336 $ (390) $ 15,035Non-interest income(2) 5,488 3,688 3,288 (344) 12,120Total revenue(2) 12,851 10,414 4,624 (734) 27,155Provision for credit losses 913 1,294 42 – 2,249Non-interest expenses 6,487 5,664 2,160 319 14,630Provision for income taxes(2) 1,387 828 604 (786) 2,033
Net income $ 4,064 $ 2,628 $ 1,818 $ (267) $ 8,243
Net income attributable to non-controlling interests in subsidiaries – 238 – – 238
Net income attributable to equity holders of the Bank $ 4,064 $ 2,390 $ 1,818 $ (267) $ 8,005
Return on equity (%)(3) 22.8% 14.7% 16.0% –% 14.6%Total average assets ($ billions) $ 323 $ 148 $ 336 $ 106 $ 913Total average liabilities ($ billions) $ 244 $ 115 $ 267 $ 228 $ 854
(1) The Other category represents smaller operating segments, including Group Treasury, and other corporate adjustments that are not allocated to an operating segment. Corporate adjustments include the net residual in matchedmaturity transfer pricing, the elimination of the tax-exempt income gross-up reported in net interest income, non-interest income and provision for income taxes, changes in the collective allowance on performing loans, anddifferences in the actual amount of costs incurred and charged to the operating segments.
(2) Taxable equivalent basis. Refer to Glossary.(3) Refer to Glossary.
30 | 2 0 1 7 S C O T I A B A N K A N N U A L R E P O R T

MA
NA
GEM
ENT’S
DISC
USSIO
NA
ND
AN
ALY
SIS|
CA
NA
DIA
NB
AN
KIN
G
Canadian Banking2017 Achievements• Customer Focus - Deliver an excellent customer experience across our businesses and channels.
• Completed the roll-out of Customer Pulse (rebranded from Net Promoter System) across our retail channels, our proprietary customerexperience system, in Canada and have received over 1 million customer survey responses to date.
• Continued our branch transformation roll out, delivering new roles, processes, and tools to more than half of our branches.
• Tangerine achieved the highest customer satisfaction among mid-sized banks for the sixth straight year in the 2017 J.D. PowerCanadian Retail Banking Customer Satisfaction Study.
• Scotiabank received 8 Best Banking Awards by Ipsos in 2017.
• Expanded our partnership with Maple Leaf Sports and Entertainment – we will continue to be the official sponsor of the Toronto MapleLeafs, as well as a partner of the MLSE Foundation. In July 2018, the Air Canada Centre will be renamed the Scotiabank Arena.
• Scotiabank iTRADE selected by MoneySense Magazine as a Top 3 pick in best online brokerages in Canada.
• Structural Cost Transformation - Reduce structural costs to build the capacity to invest in our businesses and technology.
• Exceeded this year’s structural cost reduction, productivity ratio, and operating leverage targets.
• Delivered positive operating leverage.
• Digital Transformation - Enhance our digital offering and e-commerce capabilities to drive digital sales and engagement.
• Launched the flagship Digital Factory in Toronto to drive our digital products, applications and services as we increase the percentage ofdigital sales, reduce the percentage of transactions made in branches, and increase the proportion of customers adopting digitalchannels.
• Ranked 1st by J.D. Power among Big 5 peers in mobile satisfaction and performance.
• Developed a new on-boarding engine that strengthen controls, and provides a seamless onboarding experience for our customers byallowing instant Know Your Customer for credit cards, Day-to-Day and Small Business customers.
• Business Mix Alignment - Optimize our business mix by growing higher margin assets, building core deposits, and earning higher feeincome.
• As we focus on strengthening our credit card portfolio, we were awarded by MoneySense Magazine as having the best rewards,cashback, and student credit card offerings, solidifying our position as the “Bank of Rewards” with market leading offerings.
• Launched the MomentumPlus Savings Account, an innovative solution that allows customers to save for multiple goals in one account,as we continue to focus on core deposits.
• Successfully piloted a virtual Small Business Advisor role to capitalize on significant growth opportunities in this segment.
• Completed sale of HollisWealth to refocus efforts as we continue to actively manage our businesses.
Business Profile
Canadian Banking provides a full suite of financial advice and banking solutions, supported by an excellent customer experience, to over 10 millionRetail, Small Business, Commercial Banking, and Wealth Management customers. It serves these customers through its network of 963 branches andmore than 3,600 automated banking machines (ABMs), as well as internet, mobile and telephone banking and specialized sales teams. CanadianBanking also provides an alternative self-directed banking solution to over two million Tangerine Bank customers. Canadian Banking is comprised ofthe following areas:
• Retail and Small Business Banking provides financial advice and solutions and day-to-day banking products, including debit cards, chequingaccounts, credit cards, investments, mortgages, loans and related creditor insurance products to individuals and small businesses. Tangerine Bankprovides everyday banking products, including chequing and saving accounts, credit cards, investments and loans to self-directed customers.
• Commercial Banking delivers advice and a full suite of lending, deposit, cash management and trade finance solutions to medium and largebusinesses, including automotive dealers and their customers to whom we provide retail automotive financing solutions.
• Wealth Management provides a suite of investment and wealth management advice, services, products and solutions to customers, as well asadvisors. The asset management business is focused on developing investment solutions for both retail and institutional investors. The customerfacing wealth businesses, including private customer, online brokerage, full-service brokerage, pensions, and institutional customer services, arefocused on providing a full suite of wealth management solutions to our customers.
Strategy
Canadian Banking continues to execute on a long-term strategy to deliver a best-in-class customer experience, grow its primary banking relationships,and outperform competitors in earnings growth through customer experience, business mix alignment, operational improvements and digitaltransformation.
2018 Priorities• Customer focus: Deliver a leading customer experience and deepen relationships with customers across our businesses and channels.• Structural cost transformation: Reduce structural costs to build the capacity to invest in our businesses and technology to drive shareholder
return.• Digital transformation: Leverage digital as the foundation of all our activities to improve our operations, enhance the client experience, and drive
digital sales.• Business mix alignment: Optimize our business mix by growing higher margin assets, building core deposits, and earning higher fee income.• Leadership: Grow and diversify talent and engage employees through a performance-focused culture.
2 0 1 7 S C O T I A B A N K A N N U A L R E P O R T | 31

MANAGEMENT’S DISCUSSION AND ANALYSIS
T18 Canadian Banking financial performance
($ millions) 2017 2016 2015
Net interest income(1) $ 7,363 $ 7,024 $ 6,415Non-interest income(1)(2) 5,488 5,164 4,832
Total revenue(1) 12,851 12,188 11,247Provision for credit losses 913 832 687Non-interest expenses 6,487 6,324 6,014Income tax expense 1,387 1,296 1,202
Net income $ 4,064 $ 3,736 $ 3,344
Net income attributable to non-controlling interests – – –
Net income attributable to equity holders of the Bank $ 4,064 $ 3,736 $ 3,344
Key ratiosReturn on equity(3) 22.8% 22.0% 21.0%Productivity(1) 50.5% 51.9% 53.5%Net interest margin(4) 2.40% 2.38% 2.23%Provision for credit losses as a percentage of loans and acceptances 0.29% 0.28% 0.23%
Selected Consolidated Statement of Financial Position data (average balances)Earning assets $ 315,916 $ 302,648 $ 293,460Total assets 322,712 309,232 299,929Deposits 233,260 224,006 210,241Total liabilities 243,748 232,498 217,753
Other ($ billions) as at October 31Assets under administration $ 315 $ 318 $ 310Assets under management $ 155 $ 145 $ 135
(1) Taxable equivalent basis (TEB).(2) Includes net income from investments in associated corporations of $66 (2016 – $78; 2015 – $66).(3) Refer to Glossary.(4) Net interest income (TEB) as % of average earning assets excluding bankers acceptances.
32 | 2 0 1 7 S C O T I A B A N K A N N U A L R E P O R T
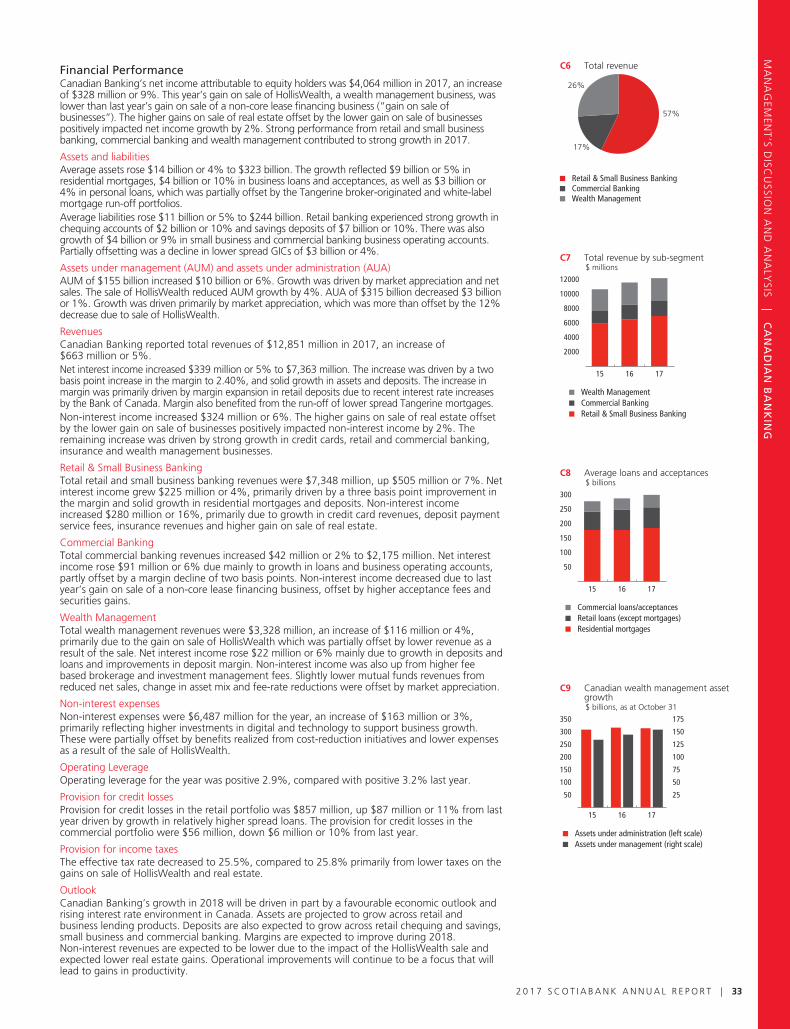
MA
NA
GEM
ENT’S
DISC
USSIO
NA
ND
AN
ALY
SIS|
CA
NA
DIA
NB
AN
KIN
G
Financial PerformanceCanadian Banking’s net income attributable to equity holders was $4,064 million in 2017, an increaseof $328 million or 9%. This year’s gain on sale of HollisWealth, a wealth management business, waslower than last year’s gain on sale of a non-core lease financing business (“gain on sale ofbusinesses”). The higher gains on sale of real estate offset by the lower gain on sale of businessespositively impacted net income growth by 2%. Strong performance from retail and small businessbanking, commercial banking and wealth management contributed to strong growth in 2017.
Assets and liabilitiesAverage assets rose $14 billion or 4% to $323 billion. The growth reflected $9 billion or 5% inresidential mortgages, $4 billion or 10% in business loans and acceptances, as well as $3 billion or4% in personal loans, which was partially offset by the Tangerine broker-originated and white-labelmortgage run-off portfolios.Average liabilities rose $11 billion or 5% to $244 billion. Retail banking experienced strong growth inchequing accounts of $2 billion or 10% and savings deposits of $7 billion or 10%. There was alsogrowth of $4 billion or 9% in small business and commercial banking business operating accounts.Partially offsetting was a decline in lower spread GICs of $3 billion or 4%.
Assets under management (AUM) and assets under administration (AUA)AUM of $155 billion increased $10 billion or 6%. Growth was driven by market appreciation and netsales. The sale of HollisWealth reduced AUM growth by 4%. AUA of $315 billion decreased $3 billionor 1%. Growth was driven primarily by market appreciation, which was more than offset by the 12%decrease due to sale of HollisWealth.
RevenuesCanadian Banking reported total revenues of $12,851 million in 2017, an increase of$663 million or 5%.Net interest income increased $339 million or 5% to $7,363 million. The increase was driven by a twobasis point increase in the margin to 2.40%, and solid growth in assets and deposits. The increase inmargin was primarily driven by margin expansion in retail deposits due to recent interest rate increasesby the Bank of Canada. Margin also benefited from the run-off of lower spread Tangerine mortgages.Non-interest income increased $324 million or 6%. The higher gains on sale of real estate offsetby the lower gain on sale of businesses positively impacted non-interest income by 2%. Theremaining increase was driven by strong growth in credit cards, retail and commercial banking,insurance and wealth management businesses.
Retail & Small Business BankingTotal retail and small business banking revenues were $7,348 million, up $505 million or 7%. Netinterest income grew $225 million or 4%, primarily driven by a three basis point improvement inthe margin and solid growth in residential mortgages and deposits. Non-interest incomeincreased $280 million or 16%, primarily due to growth in credit card revenues, deposit paymentservice fees, insurance revenues and higher gain on sale of real estate.
Commercial BankingTotal commercial banking revenues increased $42 million or 2% to $2,175 million. Net interestincome rose $91 million or 6% due mainly to growth in loans and business operating accounts,partly offset by a margin decline of two basis points. Non-interest income decreased due to lastyear’s gain on sale of a non-core lease financing business, offset by higher acceptance fees andsecurities gains.
Wealth ManagementTotal wealth management revenues were $3,328 million, an increase of $116 million or 4%,primarily due to the gain on sale of HollisWealth which was partially offset by lower revenue as aresult of the sale. Net interest income rose $22 million or 6% mainly due to growth in deposits andloans and improvements in deposit margin. Non-interest income was also up from higher feebased brokerage and investment management fees. Slightly lower mutual funds revenues fromreduced net sales, change in asset mix and fee-rate reductions were offset by market appreciation.
Non-interest expensesNon-interest expenses were $6,487 million for the year, an increase of $163 million or 3%,primarily reflecting higher investments in digital and technology to support business growth.These were partially offset by benefits realized from cost-reduction initiatives and lower expensesas a result of the sale of HollisWealth.
Operating LeverageOperating leverage for the year was positive 2.9%, compared with positive 3.2% last year.
Provision for credit lossesProvision for credit losses in the retail portfolio was $857 million, up $87 million or 11% from lastyear driven by growth in relatively higher spread loans. The provision for credit losses in thecommercial portfolio were $56 million, down $6 million or 10% from last year.
Provision for income taxesThe effective tax rate decreased to 25.5%, compared to 25.8% primarily from lower taxes on thegains on sale of HollisWealth and real estate.
OutlookCanadian Banking’s growth in 2018 will be driven in part by a favourable economic outlook andrising interest rate environment in Canada. Assets are projected to grow across retail andbusiness lending products. Deposits are also expected to grow across retail chequing and savings,small business and commercial banking. Margins are expected to improve during 2018.Non-interest revenues are expected to be lower due to the impact of the HollisWealth sale andexpected lower real estate gains. Operational improvements will continue to be a focus that willlead to gains in productivity.
C6 Total revenue
Commercial BankingWealth Management
Retail & Small Business Banking
26%
57%
17%
C7 Total revenue by sub-segment$ millions
15 1716
Wealth ManagementCommercial BankingRetail & Small Business Banking
2000
4000
6000
8000
10000
12000
C8 Average loans and acceptances$ billions
15 16 17
200
150
100
50
300
250
Commercial loans/acceptancesRetail loans (except mortgages)Residential mortgages
C9 Canadian wealth management assetgrowth$ billions, as at October 31
15 16 17
Assets under management (right scale)Assets under administration (left scale)
50
100
200
150
350
300
250
25
50
100
75
175
150
125
2 0 1 7 S C O T I A B A N K A N N U A L R E P O R T | 33

MANAGEMENT’S DISCUSSION AND ANALYSIS
International Banking2017 Achievements• Customer Focus
• Completed the roll-out of Customer Pulse, our proprietary customer experience systems, allowing us to receive direct feedback from ourcustomers in the Pacific Alliance countries.
• Launched the Employee Pulse program empowering our employees to listen, identify and escalate any opportunity to deliver an excellentexperience to our customers in the Pacific Alliance countries.
• Grew our number of Primary Customers in Retail and Commercial Banking allowing us to establish stronger, long-term relationships.• Recognized as the Latin American Retail Bank of the Year by Retail Banker International.
• Leadership• Launched Workplace, Facebook’s enterprise internal communication and productivity platform, across the Pacific Alliance countries and at Head
Office in Toronto to drive engagement and collaboration across the Bank.• Increased the representation of women in leadership positions by 9% year-over-year.
• Structural Cost Transformation• Surpassed the 2017 structural cost reduction target and progressed well toward our productivity ratio goal.• Delivered positive operating leverage.
• Digital Transformation• Opened Digital Factories in our priority markets of Mexico, Colombia, Chile and Peru to drive innovation and development of online and mobile
banking solutions for our customers.• Held our first Digital Investor Day and provided key digital banking targets of which, significant progress has already been made in increasing the
percentage of digital sales, reducing the percentage of transactions made in branches, and increasing the proportion of customers adoptingdigital channels.
• Established partnerships with venture capital firms, Fintechs, accelerators, and academic institutions to advance the Bank’s digital transformationand build synergies with the Pacific Alliance countries’ digital innovation ecosystems.
• Named the “World’s Best Consumer Digital Bank 2017” in 24 countries across Latin America and the Caribbean, and received the award for“Best in Mobile Banking” in the region from Global Finance magazine.
• Business Mix Alignment• Increased loan market share in most key markets.• Achieved strong deposit growth across several regions and divisions.
Business ProfileInternational Banking (IB) has a well-established, diversified franchise that serves more than 15 million Retail, Corporate, and Commercial customersacross our footprint. These customers are supported by over 50,000 employees, more than 1,800 branches and a network of contact and businesssupport centers. IB is focused on growing operations in Latin America, including the Pacific Alliance countries of Mexico, Peru, Chile and Colombia,and the Caribbean and Central America.
We believe the Pacific Alliance countries offer excellent opportunities for growth with young demographics, low banking penetration, growingeconomies, low consumer indebtedness and stable banking systems. The Caribbean and Central America countries are more mature markets, but stillvery profitable. We see continued opportunities to optimize operations, improve customer profitability and reduce structural costs.
StrategyInternational Banking continues to execute on a long-term strategy focused on grow in the Pacific Alliance countries and optimizing operations inCentral America and the Caribbean. Our strategy is organized around five areas: customer focus, leadership, structural cost transformation, digitaltransformation and business mix alignment.
2018 PrioritiesOur primary focus to further our strategy and grow across our footprint is to focus on the following key initiatives:
• Customer focus: Take customer experience to the next level by leveraging the Customer Pulse program and implement the Employee Pulseprogram to gather feedback from front-line employees on how to better serve our customers.
• Leadership: Continue to strengthen our teams across our business lines and functions.
• Structural cost transformation: Continue to make progress on our cost reduction programs, while focusing on developing new capabilities acrossthe Bank.
• Digital transformation: Scale-up our digital banking units across the four Pacific Alliance countries (and Canada), continue driving digital sales onpriority products, and accelerate digital adoption and transaction migration.
• Business mix alignment: Strategically grow in key areas, including core deposits, to improve profitability and reduce funding costs.
34 | 2 0 1 7 S C O T I A B A N K A N N U A L R E P O R T

MA
NA
GEM
ENT’S
DISC
USSIO
NA
ND
AN
ALY
SIS|
INT
ER
NA
TIO
NA
LB
AN
KIN
G
T19 International Banking financial performance
($ millions) 2017 2016 2015
Net interest income(1) $ 6,726 $ 6,359 $ 5,706Non-interest income(1)(2) 3,688 3,482 3,137
Total revenue(1) 10,414 9,841 8,843Provision for credit losses 1,294 1,281 1,128Non-interest expenses 5,664 5,523 5,095Income tax expense(1) 828 707 568
Net income $ 2,628 $ 2,330 $ 2,052
Net income attributable to non-controlling interests 238 251 199
Net income attributable to equity holders of the Bank $ 2,390 $ 2,079 $ 1,853
Key ratiosReturn on equity(3) 14.7% 12.8% 13.0%Productivity(1) 54.4% 56.1% 57.6%Net interest margin(4) 4.79% 4.71% 4.71%Provision for credit losses as a percentage of loans and acceptances 1.21% 1.26% 1.24%
Selected Consolidated Statement of Financial Position data (average balances)Earning assets(5) $ 140,471 $ 135,167 $ 121,130Total assets 147,537 142,582 128,248Deposits 95,232 87,508 73,946Total liabilities 114,694 109,302 94,340
Other ($ millions as at October 31)Assets under administration $ 88,189 $ 85,888 $ 80,606Assets under management $ 52,553 $ 47,287 $ 43,560
(1) Taxable equivalent basis.(2) Includes net income from investments in associated corporations of $482 (2016 – $473; 2015 – $476).(3) Refer to Glossary.(4) Net interest income (TEB) as % of average earning assets excluding bankers acceptances.(5) Includes bankers acceptances.
2 0 1 7 S C O T I A B A N K A N N U A L R E P O R T | 35

MANAGEMENT’S DISCUSSION AND ANALYSIS
Financial Performance
Net income attributable to equity holders was $2,390 million, up 15% from $2,079 million, withstrong results in Latin America and the Caribbean and Central America. The increase reflectshigher net interest income and fees driven by good loan growth, lower commercial provisions forcredit losses and the benefits of cost-reduction initiatives. This was partly offset by higher incometaxes.
Assets and LiabilitiesAverage assets of $148 billion were up $5 billion or 3%. Adjusting for the impact of foreigncurrency translation, retail loan growth was 8% and commercial loan growth was 5%, with LatinAmerica driving the growth of 13% and 7% respectively. Average liabilities increased $5 billionor 5% to $115 billion largely due to 9% growth in deposits, or 10% adjusting for the impact offoreign currency translation, including demand and savings deposits up 8% and term deposits up11%.
RevenuesTotal revenues of $10,414 million increased $573 million or 6%. Net interest income increased$367 million or 6% driven by good loan growth, acquisitions in Central America, and a highernet interest margin. The net interest margin rose eight basis points to 4.79% due to changes inbusiness mix, as retail loan growth outpaced commercial loan growth, and higher spreads mainlyrelated to Central Bank rate changes in Latin America last year. Non-interest income increased$206 million or 6%. This increase was largely driven by higher net fee and commission revenueswhich increased $176 million or 7%.
Latin AmericaTotal revenues of $6,949 million increased 8% from last year. Net interest income increased$347 million or 8%, or 9% excluding the impact of foreign currency translation, reflecting theimpact of strong asset growth and a higher net interest margin. The net interest margin rose12 basis points to 4.85% due to business mix and Central Bank rate changes. Non-interestincome increased $146 million or 7% primarily from net fee and commission revenues up$140 million or 7% largely driven by transaction fees and card revenues.
Caribbean and Central AmericaTotal revenues were $3,032 million, up 2% versus last year or 5% adjusting for the negativeimpact of foreign currency translation. Net interest income increased $20 million or 1%;however, 4% adjusting for the negative impact of foreign currency translation driven by assetgrowth primarily in Central America and Dominican Republic. Non-interest income was up$45 million or 5%; however, 7% adjusting for the negative impact of foreign currency translationas a result of strong growth in transaction fees, credit card revenues and wealth fees.
AsiaTotal revenues were $433 million, up 3% versus last year. This was primarily driven by a highercontribution from Thanachart Bank, partly offset by a lower contribution from Bank of Xi’an.
Non-interest expensesNon-interest expenses of $5,664 million increased $141 million or 3% from last year. Theincrease reflected business volume growth, inflationary increases, increased technology spending,and the impact of acquisitions, partly offset by the positive impact of foreign currency translationand the benefits of expense management programs. Operating leverage was a positive 3.3%.
Provision for credit lossesThe provision for credit losses increased $13 million or 1% to $1,294 million. Retail provisions forcredit losses increased in line with loan growth. Commercial provisions for credit lossesdecreased, mainly in Colombia, the Caribbean and Mexico, relative to the high levels last year.Overall, the provision for credit losses ratio improved five basis points to 1.21%.
Provision for income taxesThe effective tax rate was 24.0% compared to 23.3% last year due primarily to lower taxbenefits in Mexico.
OutlookInternational Banking’s earnings growth in 2018 will be achieved through leveraging itsdiversified footprint, with particular focus on the Pacific Alliance countries. Economic growth isexpected to improve in these countries, driving low double digit loan growth in this region.Margins and credit quality are expected to remain stable. Expense management and delivery ofpositive operating leverage remain key business priorities. The current strength of the Canadiandollar has the potential to negatively impact reported earnings growth in International Banking in2018. While the primary business focus remains on organic growth, acquisition opportunitiesthat are strategically aligned and complement current operations within International Banking’sexisting footprint will be considered.
C10 Total revenue
Caribbean and Central AmericaLatin AmericaAsia
4.2%
29.1%
66.7%
C11 Total revenue by region$ millions
15 1716
50004000300020001000
6000
AsiaCaribbean and Central AmericaLatin America
1100010000
900080007000
C12 Average loans and acceptances$ billions
20
40
60
80
120
100
Residential mortgagesRetail loans (except mortgages)Business loans/acceptances
15 1716
C13 Average earning assets(1) by region$ billions
15 1716
AsiaCaribbean and Central AmericaLatin America
40
60
80
100
140
120
(1) Average earning assets excluding bankers acceptances
36 | 2 0 1 7 S C O T I A B A N K A N N U A L R E P O R T

MA
NA
GEM
ENT’S
DISC
USSIO
NA
ND
AN
ALY
SIS|
GLO
BA
LB
AN
KIN
GA
ND
MA
RK
ET
S
Global Banking and Markets
2017 AchievementsIn 2017, we continued to build our franchise as a leading wholesale bank in Canada and the Pacific Alliance and made significant progress on ourkey priorities:
• Customer Focus
• Enhanced our customer focus and delivered superior service and solutions to our customers – a sample of our Awards and Recognitions,along with Deal Highlights from 2017, are listed below.
• Expanded our investment banking franchise across the Bank’s global footprint to better align our enhanced customer-focused strategy inour priority markets.
• Business Mix Alignment
• Shifted our business mix to focus our resources on our priority markets and businesses.
• Resource Productivity
• Made significant investments in people, process and technology, and improved our resource productivity. We continue to optimize andmodernize our operations and systems to better serve our customers and reduce costs.
• Digital Transformation
• Continued investment in digital technologies and automation to provide a better customer experience. In 2017, we became the firstCanadian bank to launch a mobile banking app for business with an integrated digital security token.
Awards and Recognitions
• Ranked #3 in Thomson Reuters LPC’s League Table for Investment Grade Loan Syndications in Canada, and #16 in the United States, for thefirst three quarters of 2017.
• Ranked #2 in Bloomberg’s League Table for Loan Syndications in Latin America, for the first three quarters of 2017.
• Recognized with four Latin America Project & Infrastructure Finance Awards by LatinFinance during 2017:
• Best Airport Financing: Mexico City Airport Trust (Bond Financing)
• Best Transport Financing: Mexico City Airport Trust (Bond Financing)
• Best Infrastructure Financing – Mexico: Red Compartida (Project Financing)
• Best Infrastructure Financing – Caribbean: Aeropuertos Dominicanos Siglo XXI (Loan and Bond Financing)
• Scotiabank’s Equity Research team achieved eight #1 industry rankings and 18 top-tier sector rankings overall in the 2017 Canadian EquityInvestors Study by Greenwich Associates.
Deal Highlights
• Acted as Financial Advisor to Royal Dutch Shell (Shell) on the sale of its 60% interest in the Athabasca Oil Sands Project and 100% interest inthe Peace River Complex for C$11.1 billion to Canadian Natural Resources Limited (CNRL), as well as the concurrent joint acquisition by Shelland CNRL of Marathon Oil Canada Corporation for US$2.5 billion. Scotiabank also acted as Joint Lead Arranger on CNRL’s related C$9 billionbridge credit facility.
• Acted as Exclusive Financial Advisor to Veresen Inc. on its acquisition by Pembina Pipeline Corporation. The transaction, valued atC$9.4 billion, created one of the largest energy infrastructure companies in Canada.
• Acted as Joint Lead Arranger and Underwriter of 50% of a new US$1.2 billion financing to support Jacobs Engineering’s acquisition of CH2MHill. In addition, Scotiabank backstopped 50% of the company’s existing US$1.6 billion credit facility in connection with the acquisition.
• Acted as Global Coordinator, Joint Bookrunner and Billing & Delivery Agent on the inaugural PEN10 billion Euroclearable bond issuance due2032 by the Republic of Peru. This transaction represents the first PEN-denominated issuance ever to clear and settle through Euroclear.
• Acted as Bookrunner on a £4.0 billion syndicated re-opening of the Conventional Gilt due 2065 for the UK Debt Management Office (UKDMO). This was Scotiabank’s first ever bookrunner role in a Conventional Gilt syndication, and was the second bookrunner mandate receivedfrom the UK DMO in the past 12 months.
• Acted as Mandated Lead Arranger, Underwriter, Bookrunner and Hedge Provider on a A$5.9 billion debt facility for the acquisition of theEndeavour Energy electricity network in Australia by MIRA, AMP Capital, BCIMC and Qatar Investment Authority.
Business ProfileGlobal Banking and Markets (GBM) conducts the Bank’s wholesale banking and capital markets business with corporate, government and institutionalinvestor clients. GBM is a full-service wholesale bank and investment dealer in Canada and Mexico, and offers a range of products and services in theU.S., Latin America (excluding Mexico), and in select markets in Europe, Asia and Australia.
More specifically, GBM provides clients with: corporate lending; transaction banking (including trade finance and cash management); investmentbanking (including corporate finance and mergers & acquisitions); fixed income and equity underwriting, sales, trading and research; prime services(prime brokerage and stock lending); foreign exchange sales and trading; commodity derivatives; precious and base metals sales, trading, financingand physical services; and collateral management.
StrategyGlobal Banking and Markets continues to build its franchise as a leading wholesale bank in Canada and the Pacific Alliance, while maintaining arelevant presence in other regions to support its multi-regional customers.
2018 Priorities• Enhance Customer Focus: We continue to place the customer at the centre of everything we do. We are improving the end-to-end customer
experience to seamlessly offer our full capabilities, thereby deepening and strengthening our relationships, while leveraging our global footprint tobetter serve our multi-regional customers.
2 0 1 7 S C O T I A B A N K A N N U A L R E P O R T | 37

MANAGEMENT’S DISCUSSION AND ANALYSIS
• Leaders in our Primary Markets: We are investing in people, process and technology, enhancing our capabilities in our primary markets ofCanada and the Pacific Alliance. We are expanding our investment banking and capital markets expertise to increase our relevance and deepen ourcustomer relationships in these markets.
• Optimize Effectiveness: We are controlling costs and investing in the right areas to drive shareholder value, while optimizing our use of capitaland funding. We are investing in technology to enhance the customer experience, improve our data and analytics capabilities, and increaseoperational effectiveness.
T20 Global Banking and Markets financial performance
($ millions) 2017 2016 2015
Net interest income(1) $ 1,336 $ 1,293 $ 1,071Non-interest income(1) 3,288 3,139 2,953
Total revenue(1) 4,624 4,432 4,024Provision for credit losses 42 249 67Non-interest expenses 2,160 2,040 1,846Income tax expense(1) 604 572 558
Net income $ 1,818 $ 1,571 $ 1,553
Net income attributable to non-controlling interests in subsidiaries – – –
Net income attributable to equity holders of the Bank $ 1,818 $ 1,571 $ 1,553
Key ratiosReturn on equity(2) 16.0% 12.6% 13.0%Productivity(1) 46.7% 46.0% 45.9%Net interest margin(3)(4) 1.75% 1.67% 1.65%Provision for credit losses as a percentage of loans and acceptances 0.05% 0.30% 0.10%
Selected Consolidated Statement of Financial Position data (average balances)Trading assets $ 103,861 $ 103,316 $ 108,137Loans and acceptances 79,937 81,662 70,103Earning assets 291,870 298,664 290,482Total assets 335,599 350,627 342,389Deposits 77,158 77,261 63,308Total liabilities 267,377 269,755 239,628
(1) Taxable equivalent basis.(2) Refer to Glossary.(3) Business Banking only.(4) Net interest income (TEB) as % of average earning assets excluding bankers’ acceptances.
38 | 2 0 1 7 S C O T I A B A N K A N N U A L R E P O R T

MA
NA
GEM
ENT’S
DISC
USSIO
NA
ND
AN
ALY
SIS|
GLO
BA
LB
AN
KIN
GA
ND
MA
RK
ET
S
Financial PerformanceGlobal Banking and Markets reported net income attributable to equity holders of $1,818 millionin 2017, an increase of $247 million or 16% from last year. Stronger results in the equitiesbusiness related primarily to higher client trading activity contributed approximately 6% of theearnings growth. As well, significantly lower provision for credit losses were partly offset byhigher non-interest expenses.
Average assets
Average assets decreased by $15 billion or 4% to $336 billion this year. Adjusting for the impactof foreign currency translation, assets decreased by $9 billion or 2%, as decreases in securitiespurchased under resale agreements and derivative-related assets were partly offset by highertrading securities.
Average liabilities
Average liabilities decreased by $3 billion or 1% to $267 billion this year. Adjusting for theimpact of foreign currency translation, liabilities increased by $2 billion or 1% due to growth insecurities sold under repurchase agreements and bullion deposits, partly offset by lowerderivative-related liabilities.
Net interest income
Net interest income increased by 3% to $1,336 million, mainly driven by higher deposit volumesand higher lending volumes in the U.S. and Canada. The net interest margin was 1.75%, anincrease of eight basis points.
Non-interest income
Non-interest income of $3,288 million increased by $149 million or 5%. Stronger tradingrevenues in equities, net gains on investment securities and higher underwriting fees contributedto the growth. This was partly offset by lower banking fees and lower trading revenues in metalsand fixed income.
Non-interest expenses
Non-interest expenses increased by $120 million or 6% to $2,160 million in 2017. This was dueprimarily to higher regulatory, compliance and technology costs. Operating leverage was negative1.5%.
Provision for credit losses
The provision for credit losses decreased $207 million to $42 million due primarily to higherenergy sector provisions last year. The provisions this year were primarily in Asia and Europe. Theprovision for credit losses ratio was down 25 basis points to five basis points.
Provision for income taxes
The effective tax rate of 25.0% was 1.7% lower than the prior year, due to lower taxes in certainforeign operations.
Outlook
With the execution of our client-focused strategies, investment in our people and capabilitiesincluding our Global Investment Banking platform, we expect continued strong growth indeposits and improved Corporate Banking results. This growth is expected to be partly offset bylower revenues from certain client-driven capital market transactions. Expenses are expected torise to support higher regulatory and technology investments.
C14 Total revenue
Business BankingCapital Markets
50%
50%
C15 Business banking revenue$ millions
15 16 17
Metals Lending
500
1000
1500
2500
2000
C16 Capital markets revenueby business line$ millions
15 1716
500
1000
1500
2500
2000
Global Investment BankingGlobal EquitiesFixed Income & Commodities
C17 Composition of averageearning assets$ billions
15 1716
OtherSecurities purchased under resale agreementTrading assetsCorporate loans and acceptances
50100
400350300250200150
C18 Trading day losses
16
10
8
6
4
2
14
12
17
2 0 1 7 S C O T I A B A N K A N N U A L R E P O R T | 39
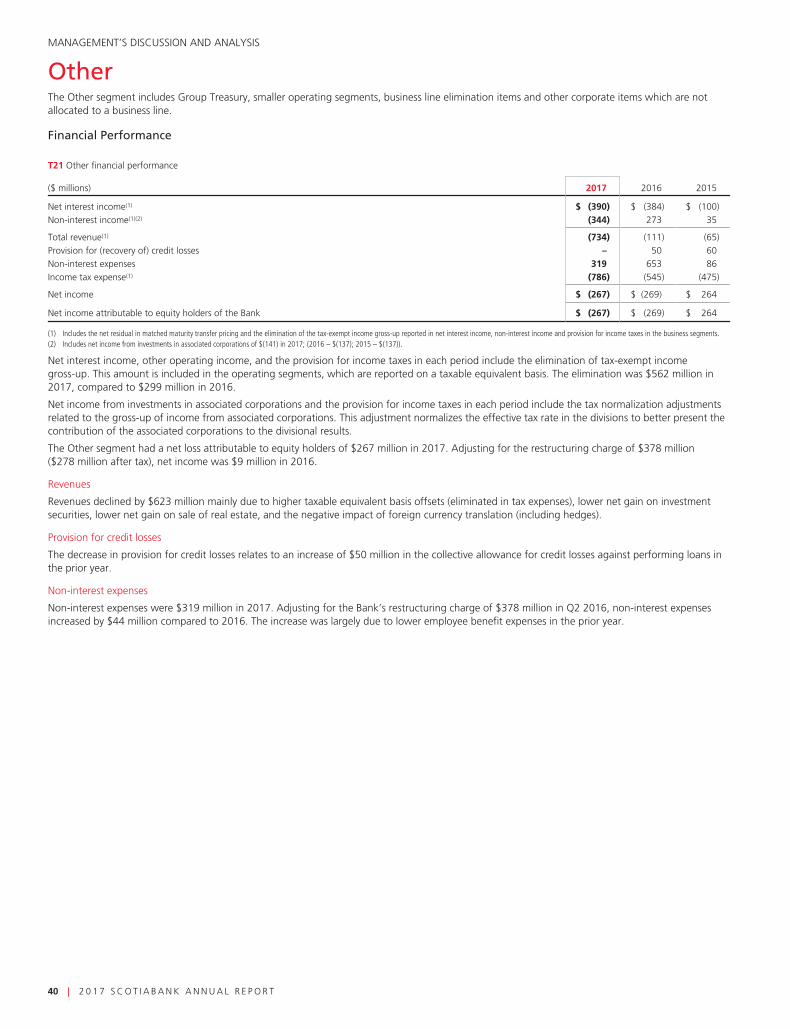
MANAGEMENT’S DISCUSSION AND ANALYSIS
OtherThe Other segment includes Group Treasury, smaller operating segments, business line elimination items and other corporate items which are notallocated to a business line.
Financial Performance
T21 Other financial performance
($ millions) 2017 2016 2015
Net interest income(1) $ (390) $ (384) $ (100)Non-interest income(1)(2) (344) 273 35
Total revenue(1) (734) (111) (65)Provision for (recovery of) credit losses – 50 60Non-interest expenses 319 653 86Income tax expense(1) (786) (545) (475)
Net income $ (267) $ (269) $ 264
Net income attributable to equity holders of the Bank $ (267) $ (269) $ 264
(1) Includes the net residual in matched maturity transfer pricing and the elimination of the tax-exempt income gross-up reported in net interest income, non-interest income and provision for income taxes in the business segments.(2) Includes net income from investments in associated corporations of $(141) in 2017; (2016 – $(137); 2015 – $(137)).
Net interest income, other operating income, and the provision for income taxes in each period include the elimination of tax-exempt incomegross-up. This amount is included in the operating segments, which are reported on a taxable equivalent basis. The elimination was $562 million in2017, compared to $299 million in 2016.
Net income from investments in associated corporations and the provision for income taxes in each period include the tax normalization adjustmentsrelated to the gross-up of income from associated corporations. This adjustment normalizes the effective tax rate in the divisions to better present thecontribution of the associated corporations to the divisional results.
The Other segment had a net loss attributable to equity holders of $267 million in 2017. Adjusting for the restructuring charge of $378 million($278 million after tax), net income was $9 million in 2016.
Revenues
Revenues declined by $623 million mainly due to higher taxable equivalent basis offsets (eliminated in tax expenses), lower net gain on investmentsecurities, lower net gain on sale of real estate, and the negative impact of foreign currency translation (including hedges).
Provision for credit losses
The decrease in provision for credit losses relates to an increase of $50 million in the collective allowance for credit losses against performing loans inthe prior year.
Non-interest expenses
Non-interest expenses were $319 million in 2017. Adjusting for the Bank’s restructuring charge of $378 million in Q2 2016, non-interest expensesincreased by $44 million compared to 2016. The increase was largely due to lower employee benefit expenses in the prior year.
40 | 2 0 1 7 S C O T I A B A N K A N N U A L R E P O R T

MA
NA
GEM
ENT’S
DISC
USSIO
NA
ND
AN
ALY
SIS|
OT
HE
R
Financial Performance of Business Lines: 2016 vs. 2015
Canadian Banking
Canadian Banking’s net income attributable to equity holders was $3,736 million in 2016, an increase of $392 million or 12%. The gain on thesale of a non-core lease financing business (“the gain on sale”) of $116 million pre-tax or $100 million after tax contributed 3% growth to netincome. Strong performance from retail and small business banking, commercial banking and wealth management, as well as the impact of thecredit card portfolio acquired from JPMorgan Chase Bank (“the acquisition”) contributed to the growth. Return on equity was 22.0% up from21.0% in 2015.
International Banking
Net income attributable to equity holders was $2,079 million, an increase of $226 million or 12%. Earnings from strong asset and fee growth,including the positive impact of foreign currency translation, were partly offset by higher provision for credit losses. Strong underlying asset andfee growth in Latin America and a solid contribution from Caribbean & Central America were complemented by earnings in Asia. Return onequity was 12.8%, versus 13.0% in 2015.
Global Banking and Markets
Global Banking and Markets reported net income attributable to equity holders of $1,571 million in 2016, an increase of $18 million or 1% from2015. Stronger results in the fixed income, corporate lending and commodities businesses, as well as the positive impact of foreign currencytranslation, were mainly offset by higher provision for credit losses and lower results in equities. Return on equity was 12.6% versus 13.0% in2015.
Other
The Other segment had a net loss attributable to equity holders of $269 million in 2016. Adjusting for the restructuring charge of $378 million($278 million after tax; refer T2), net income was $9 million in 2016. Net income attributable to equity holders was $264 million in 2015 whichincluded a number of largely offsetting items, comprised of a reduction in pension benefit accrual related to modifications made to the Bank’smain pension plan of $204 million pre-tax ($151 million after tax), an increase to the collective allowance for credit losses against performingloans due to the increase in the loan portfolio of $60 million pre-tax ($44 million after tax), and reorganization costs related to CanadianBanking’s shared services operations of $61 million pre-tax ($45 million after tax).
2 0 1 7 S C O T I A B A N K A N N U A L R E P O R T | 41

MANAGEMENT’S DISCUSSION AND ANALYSIS
GROUP FINANCIAL CONDITIONT22 Condensed statement of financial position
As at October 31 ($ billions) 2017 2016 2015
AssetsCash, deposits with financial institutions and precious metals $ 65.4 $ 54.8 $ 84.5Trading assets 98.5 108.6 99.1Securities purchased under resale agreements and securities
borrowed 95.3 92.1 87.3Investment securities 69.3 72.9 43.2Loans 504.4 480.2 458.6Other 82.4 87.7 83.8
Total assets $ 915.3 $896.3 $856.5
LiabilitiesDeposits $ 625.4 $611.9 $600.9Obligations related to securities sold under repurchase
agreements and securities lent 95.8 97.1 77.0Other liabilities 126.5 121.8 118.9Subordinated debentures 5.9 7.6 6.2
Total liabilities $ 853.6 $838.4 $803.0
EquityCommon equity 55.5 52.7 49.1Preferred shares and other equity instruments 4.6 3.6 2.9Non-controlling interests in subsidiaries 1.6 1.6 1.5
Total equity $ 61.7 $ 57.9 $ 53.5
Total liabilities and shareholders’ equity $ 915.3 $896.3 $856.5
C19 Loan portfolioloans & acceptances, $ billions, as atOctober 31
15 16 17
240
160
80
560
480
400
320
Business & governmentPersonal & credit cardsResidential mortgages
C20 Deposits$ billions, as at October 31
15 16 17
BanksBusiness & governmentPersonal
100
200
300
400
700
600
500
Statement of Financial Position
Assets
The Bank’s total assets as at October 31, 2017 were $915 billion, up $19 billion or 2% from October 31, 2016. Adjusting for the impact of foreigncurrency translation, total assets were up $32 billion. This growth was primarily in loans, while increases in deposits with financial institutions wereoffset by lower trading assets and investment securities.
Cash and deposits with financial institutions increased $13 billion, while trading assets decreased $10 billion due primarily to a decrease in tradingsecurities.
Investment securities decreased $4 billion from October 31, 2016 due primarily to lower holdings of held-to-maturity securities. The unrealized gainon available-for-sale securities, after the impact of qualifying hedges, decreased $74 million to an unrealized loss of $48 million as at October 31,2017, due mainly to realized gains on disposals and changes in interest rates.
Loans increased $24 billion or 5% from October 31, 2016. Adjusting for the impact of foreign currency translation, loans increased $30 billion.Residential mortgages increased $15 billion and personal loans and credit cards were up $5 billion primarily in Canada and Latin America. Businessand government loans were up $10 billion, mainly in Canada and Latin America.
Derivative instrument assets decreased $6 billion due primarily to lower mark-to-market amounts related to interest rate contracts.
42 | 2 0 1 7 S C O T I A B A N K A N N U A L R E P O R T

MA
NA
GEM
ENT’S
DISC
USSIO
NA
ND
AN
ALY
SIS|
GR
OU
PFIN
AN
CIA
LC
ON
DIT
ION
Liabilities
Total liabilities were $854 billion as at October 31, 2017, up $15 billion or 2% from October 31, 2016. Adjusting for the impact of foreign currencytranslation, total liabilities were up $29 billion.
Total deposits increased $13 billion. Adjusting for the impact of foreign currency translation, total deposits increased $23 billion. Personal depositsgrew by $2 billion, primarily in Canada and Latin America, and business and government deposits grew by $20 billion, mainly in Canada, the U.S. andLatin America.
Obligations related to securities sold short increased by $7 billion. Derivative instrument liabilities decreased by $8 billion, which was similar to thedecrease in derivative instrument assets. Total wholesale funding decreased by $8 billion.
Equity
Total shareholders’ equity increased $3,804 million from October 31, 2016. This increase was driven mainly by current year earnings of $8,243 millionand a net increase in preferred shares and other equity instruments of $985 million. Partly offsetting was a reduction in other comprehensive incomeof $709 million, due primarily to a decrease in unrealized foreign currency translation gains on the Bank’s investments in its foreign operations,dividends paid of $3,797 million and the repurchase and cancellation of approximately 14 million common shares for $1,009 million.
Outlook
Assets and deposits are expected to continue to increase in 2018 across all business lines. In Canada, while growth in residential mortgages isexpected to moderate, other retail and commercial lending should continue to expand. Internationally, lending assets and personal deposits areexpected to increase with stronger growth in the Pacific Alliance countries.
Capital Management
Overview
Scotiabank is committed to maintaining a strong capital base to support the risks associated with its diversified businesses. Strong capital levelscontribute to safety for the Bank’s customers, foster investor confidence and support strong credit ratings. It also allows the Bank to take advantage ofgrowth opportunities as they arise and enhance shareholder returns through increased dividends. The Bank’s capital management framework includesa comprehensive internal capital adequacy assessment process (ICAAP), aimed at ensuring that the Bank’s capital is adequate to meet current andfuture risks and achieve its strategic objectives. Key components of the Bank’s ICAAP include sound corporate governance; creating a comprehensiverisk appetite for the Bank; managing and monitoring capital, both currently and prospectively; and utilizing appropriate financial metrics which relaterisk to capital, including internal capital and regulatory capital measures.
Governance and oversight
The Bank has a sound capital management framework to measure, deploy and monitor its available capital and assess its adequacy. Capital ismanaged in accordance with the Board-approved Capital Management Policy. In addition, the Board reviews and approves the Bank’s annual capitalplan. The Asset-Liability Committee and senior executive management provide governance over the capital management process. The Bank’s Finance,Treasury and Global Risk Management groups take a coordinated approach to implementing the Bank’s capital plan.
Risk appetite
The risk appetite framework that establishes enterprise wide risk tolerances in addition to capital targets are detailed in the Risk Management section“Risk appetite”. The framework encompasses medium term targets with respect to regulatory capital thresholds, earnings and other risk-basedparameters. These targets ensure the Bank achieves the following overall objectives: exceed regulatory and internal capital targets, manage capitallevels commensurate with the risk profile of the Bank, maintain strong credit ratings and provide the Bank’s shareholders with acceptable returns.
Regulatory capital
Effective November 1, 2012, Canadian banks are subject to the revised capital adequacy requirements as published by the Basel Committee onBanking Supervision (BCBS) and commonly referred to as Basel III. Basel III builds on the “International Convergence of Capital Measurement andCapital Standards: A Revised Framework” (Basel II). Under Basel III, there are three primary risk-based regulatory capital ratios used to assess capitaladequacy; Common Equity Tier 1 (CET1), Tier 1 and Total capital ratios, which are determined by dividing those capital components by risk-weightedassets. Basel III also provides guidance on non-viability contingent capital (NVCC). The guidance stipulates that in order to qualify as regulatory capital,non-common share capital instruments must be convertible into common equity upon a trigger event as defined within the guidance. Allnon-common share capital instruments issued after December 31, 2012, are required to meet these NVCC requirements to qualify as regulatorycapital.
To enable banks to meet the new standards, the BCBS Basel III rules contain transitional arrangements commencing January 1, 2013, throughJanuary 1, 2019. Transitional requirements result in a five year phase-in of new deductions and additional components to common equity.Non-qualifying non-common capital instruments are being phased-out over 10 years and the capital conservation buffer is being phased-in over fouryears. As of January 2019, banks will be required to meet new minimum requirements related to risk-weighted assets of: CET1 ratio of 4.5% plus acapital conservation buffer of 2.5%, collectively 7%, minimum Tier 1 ratio of 8.5%, and Total capital ratio of 10.5%.
The Office of the Superintendent of Financial Institutions, Canada (OSFI) has issued guidelines, reporting requirements and disclosure guidance whichare consistent with the Basel III reforms, except for its deferral of the Basel III credit valuation adjustment (CVA) related capital charges, requiring theybe phased-in over a five year period, beginning January 2014. In accordance with OSFI’s requirements, during 2017, the scalars for CVA risk-weightedassets of 0.72, 0.77 and 0.81 were used to compute the CET1, Tier 1 and Total capital ratios, respectively (October 31, 2016 – scalars of 0.64,0.71 and 0.77, respectively). The scalars will increase to 0.80, 0.83 and 0.86, respectively, effective in the first quarter of 2018.
2 0 1 7 S C O T I A B A N K A N N U A L R E P O R T | 43

MANAGEMENT’S DISCUSSION AND ANALYSIS
Commencing the first quarter of 2013, OSFI required Canadian deposit-taking institutions to fully implement the 2019 Basel III reforms, without thetransitional phase-in provisions for capital deductions (referred to as ‘all-in’) and achieve minimums of 7%, 8.5% and 10.5% for CET1, Tier 1 andTotal Capital ratios, respectively. OSFI has also designated the Bank a domestic systemically important bank (D-SIB), increasing its minimum capitalratio requirements by 1% across all tiers of capital effective January 1, 2016, in line with the requirements for global systemically important banks.
In addition to risk-based capital requirements, the Basel III reforms introduced a simpler, non risk-based Leverage ratio requirement to act as asupplementary measure to its risk-based capital requirements. The Leverage ratio is defined as a ratio of Basel III Tier 1 capital to a leverage exposuremeasure which includes on-balance sheet assets and off-balance sheet commitments, derivatives and securities financing transactions, as definedwithin the requirements. In January 2014, the BCBS issued revisions to the Basel III Leverage ratio framework.
In 2014, OSFI released its Basel III Leverage Ratio Requirements Guideline and Public Disclosure Requirements which outlines the application anddisclosure of the Basel III Leverage ratio in Canada and the replacement of the former Assets-to-Capital Multiple (ACM), effective the first quarter of2015. Institutions are expected to maintain a material operating buffer above the 3% minimum.
Regulatory developments related to capital
Effective Q1 2017, new OSFI requirements were implemented for Canadian uninsured loans secured by residential real estate in response to evolvingrisks, such as risks associated with elevated house prices in certain markets, and increasing levels of household debt. The new requirements for lossgiven default (LGD) capital models under the Advanced Internal Ratings-Based (AIRB) Approach introduced a risk-sensitive floor which is tied toincreases in local property prices and/or to house prices that are high relative to borrower income. The changes apply to new originations, refinancesand renewals of all uninsured real estate secured products on a go-forward basis.
Planning, managing and monitoring capital
Capital is managed and monitored based on planned changes in the Bank’s strategy, identified changes in its operating environment or changes in itsrisk profile. As part of the Bank’s comprehensive ICAAP, sources and uses of capital are continuously measured and monitored through financialmetrics, including regulatory thresholds, and internal capital. These results are used in capital planning and strategic decision-making.
The Bank’s assessment of capital adequacy is in the context of its current position and its expected future risk profile and position relative to itsinternal targets while considering the potential impact of various stress scenarios. Specific scenarios are selected based on the current economicconditions and business events facing the Bank. In addition, the Bank’s forward looking capital adequacy assessment includes a consideration of theresults of more severe multi-risk scenarios within its enterprise-wide stress testing. This testing is used to determine the extent to which severe, butplausible events, impact the Bank’s capital.
The Bank sets internal regulatory capital targets to ensure the Bank’s available capital is sufficient within the context of its risk appetite.
The Bank’s internal target includes an adequate buffer over the regulatory minimum ensuring sufficient flexibility for future capital deployment and inconsideration of the Bank’s risk appetite, the volatility of planning assumptions, the results from stress testing and contingency planning.
The Bank has a comprehensive risk management framework to ensure that the risks taken while conducting its business activities are consistent withits risk appetite, its impact on capital relative to internal targets, and that there is an appropriate balance between risk and return. Refer to the RiskManagement section for further discussion on the Bank’s risk management framework. In managing the Bank’s capital base, close attention is paid tothe cost and availability of the various types of capital, desired leverage, changes in the assets and risk-weighted assets, and the opportunities toprofitably deploy capital. The amount of capital required for the business risks being assumed, and to meet regulatory requirements, is balancedagainst the goal of generating an appropriate return for the Bank’s shareholders.
Capital generation
Capital is generated internally through net earnings after dividend payments. As well, capital is generated by the issuance of common shares,preferred shares and other equity instruments, and subordinated debentures, net of redemptions.
Capital instruments utilization
The Bank deploys capital to support sustainable, long-term revenue and net income growth. The growth can be through existing businesses byattracting new customers, increasing cross-selling activities to existing customers, adding new products and enhancing sales productivity, or throughacquisitions. All major initiatives to deploy capital are subject to rigorous analysis, validation of business case assumptions and evaluation of expectedbenefits. Key financial criteria include impact on earnings per share, capital ratios, return on invested capital, expected payback period and internalrate of return based on discounted cash flows.
Regulatory capital ratios
The Bank continues to maintain strong, high quality capital levels which position it well for future business growth. The Basel III all-in Common EquityTier 1 (CET1) ratio as at October 31, 2017 was 11.5%. The CET1 ratio grew by 50 basis points in 2017 primarily from strong internal capitalgeneration.
The Bank’s Basel III all-in Tier 1 and Total capital ratios were 13.1% and 14.9%, respectively, as at October 31, 2017. In addition, the Leverage ratioalso improved to 4.7%. The Tier 1, Total capital ratios and the Leverage ratio also benefited from the US$1.25 billion issuance of subordinated NVCCadditional Tier 1 capital during the fourth quarter.
The Bank’s capital ratios continue to be well in excess of OSFI’s minimum capital ratio requirements for 2017 (including the 1% D-SIB surcharge) of8%, 9.5% and 11.5% for CET1, Tier 1 and Total Capital, respectively. The Bank was well above the OSFI prescribed minimum Leverage ratio as atOctober 31, 2017.
Outlook
The Bank will continue to have a strong capital position in 2018. Capital will be prudently managed to support organic growth initiatives, selectiveacquisitions that enhance shareholder returns, and meet higher capital requirements from evolving accounting and regulatory changes.
44 | 2 0 1 7 S C O T I A B A N K A N N U A L R E P O R T

MA
NA
GEM
ENT’S
DISC
USSIO
NA
ND
AN
ALY
SIS|
GR
OU
PFIN
AN
CIA
LC
ON
DIT
ION
T23 Regulatory capital(1)
Basel III All-in
As at October 31 ($ millions) 2017 2016 2015
Common Equity Tier 1 capitalTotal Common Equity $ 55,454 $ 52,657 $ 49,085Qualifying non-controlling interest in common equity of subsidiaries 636 597 557Goodwill and non-qualifying intangibles, net of deferred tax liabilities(2) (11,505) (11,589) (11,018)
Threshold related deductions (271) (435) (664)Net deferred tax assets (excluding those arising from temporary differences) (417) (484) (539)Other Common Equity Tier 1 capital deductions(3) (545) (757) (456)
Common Equity Tier 1 43,352 39,989 36,965
Preferred shares(4) 3,019 3,594 2,934Subordinated additional Tier 1 capital securities (NVCC) 1,560 – –Capital instrument liabilities – trust securities(4) 1,400 1,400 1,400Other Tier 1 capital adjustments(5) 142 83 67
Net Tier 1 capital 49,473 45,066 41,366
Tier 2 capitalSubordinated debentures, net of amortization(4) 5,935 7,633 6,182Eligible collective allowance for inclusion in Tier 2 and excess allowance (re: IRB approach) 602 528 486Qualifying non-controlling interest in Tier 2 capital of subsidiaries 103 103 196Other Tier 2 capital adjustments – – –
Tier 2 capital 6,640 8,264 6,864
Total regulatory capital 56,113 53,330 48,230
Risk-weighted assets ($ billions)Credit risk 315.2 314.8 308.0Market risk 7.8 10.6 14.4Operational risk 40.6 38.6 35.6Basel I capital floor adjustment(6) 12.8 – –
CET1 risk-weighted assets(6)(7) $ 376.4 $ 364.0 $ 358.0
Capital ratios(8)
Common Equity Tier 1 11.5% 11.0% 10.3%Tier 1 13.1% 12.4% 11.5%Total 14.9% 14.6% 13.4%
Leverage:Leverage exposures $1,052,891 $ 1,010,987 $ 980,212Leverage ratio 4.7% 4.5% 4.2%
(1) Effective November 1, 2012, regulatory capital ratios are determined in accordance with Basel III rules on an all-in basis.(2) Reported amounts are based on OSFI’s requirements that goodwill relating to investments in associates be classified as goodwill for regulatory reporting purposes.(3) Other CET1 capital deductions under Basel III all-in include gains/losses due to changes in own credit risk on fair valued liabilities, pension plan assets and other items.(4) Non-qualifying Tier 1 and Tier 2 capital instruments are subject to a phase-out period of 10 years.(5) Other Tier 1 capital adjustments under the all-in approach include eligible non-controlling interests in subsidiaries.(6) Since the introduction of Basel II in 2008, OSFI has prescribed a minimum capital floor for institutions that use the advanced internal ratings-based approach for credit risk. The Basel I capital floor add-on is determined by
comparing a capital requirement calculated by reference to Basel I against the Basel III calculation, as specified by OSFI. A shortfall in the Basel III capital requirement as compared with the Basel I floor is added to RWA. As atOctober 31, 2017, CET1 RWA included a Basel I floor adjustment of $12.8 billion (2016 and 2015 - nil).
(7) As at October 31, 2017, CVA risk-weighted assets were calculated using scalars of 0.72, 0.77, and 0.81 to compute CET1, Tier 1 and Total capital ratios, respectively, (scalars of 0.64, 0.71, and 0.77 in 2016).(8) OSFI designated the Bank as a domestic systemically important bank (D-SIB), increasing its minimum capital ratio requirements by 1% for the identified D-SIBs. This 1% surcharge was applicable to all minimum capital ratio
requirements for CET1, Tier 1 and Total Capital, by January 1, 2016, in line with the requirements for global systemically important banks.
2 0 1 7 S C O T I A B A N K A N N U A L R E P O R T | 45

MANAGEMENT’S DISCUSSION AND ANALYSIS
T24 Changes in regulatory capital(1)
Basel III All-in
For the fiscal years ($ millions) 2017 2016 2015
Total capital, beginning of year $ 53,330 $ 48,230 $ 43,592
Changes in Common Equity Tier 1Net income attributable to common equity holders of the Bank 7,876 6,987 6,897Dividends paid to equity holders of the bank (3,668) (3,468) (3,289)Shares issued 313 391 104Shares repurchased/redeemed (1,009) (80) (955)Gains/losses due to changes in own credit risk on fair valued liabilities 185 (2) (158)Movements in accumulated other comprehensive income, excluding cash flow hedges (634) (472) 1,451Change in non-controlling interest in common equity of subsidiaries 39 40 43
Change in goodwill and other intangible assets (net of related tax liability)(2) 84 (571) (535)
Other changes including regulatory adjustments below: 177 199 (335)
– Deferred tax assets that rely on future profitability (excluding those arising from temporary differences) 67 55 81– Significant investments in the common equity of other financial institutions (amount above 10% threshold) 129 61 (317)– Other capital deductions 35 126 44– Other (54) (43) (143)
Changes in Common Equity Tier 1 $ 3,363 $ 3,024 $ 3,223
Changes in Additional Tier 1 CapitalIssued 1,560 1,350 –
Redeemed (575) (690) –
Other changes including regulatory adjustments and phase-out of non-qualifying instruments 59 16 70
Changes in Additional Tier 1 Capital $ 1,044 $ 676 $ 70
Changes in Tier 2 CapitalIssued – 2,502 1,250Redeemed (1,500) (1,035) –
Collective allowances eligible for inclusion in Tier 2 and Excess Allowance under AIRB 74 42 17
Other changes including regulatory adjustments and phase-out of non-qualifying instruments (198) (109) 78
Changes in Tier 2 Capital $ (1,624) $ 1,400 $ 1,345
Total capital generated (used) $ 2,783 $ 5,100 $ 4,638
Total capital, end of year $ 56,113 $ 53,330 $ 48,230
(1) Regulatory capital ratios are determined in accordance with Basel III rules on an all-in basis.(2) Reported amounts are based on OSFI’s requirements that goodwill relating to investments in associates be classified as goodwill for regulatory reporting purposes.
46 | 2 0 1 7 S C O T I A B A N K A N N U A L R E P O R T

MA
NA
GEM
ENT’S
DISC
USSIO
NA
ND
AN
ALY
SIS|
GR
OU
PFIN
AN
CIA
LC
ON
DIT
ION
Regulatory capital componentsThe Bank’s regulatory capital is divided into three components – Common Equity Tier 1 (CET1),Tier 1 capital and Tier 2 capital, depending on their degree of permanency and loss absorbency.All components of capital provide support for banking operations and protect depositors.
CET1 consists primarily of common shareholders’ equity, a proration of non-controlling interests,and regulatory deductions. These regulatory deductions include goodwill, intangible assets (netof deferred tax liabilities), deferred tax assets that rely on future profitability, defined-benefitpension fund net assets, shortfall of allowance for credit losses to expected losses and significantinvestments in the common equity of other financial institutions.
Additional Tier 1 capital consists primarily of qualifying non-cumulative preferred shares,qualifying other equity instruments (as described in Note 23), and non-qualifying preferred sharesand innovative Tier 1 instruments subject to phase-out. Tier 2 capital consists mainly of qualifyingor non-qualifying subordinated debentures subject to phase-out and the eligible allowances forcredit losses.
The Bank’s CET1 capital was $43.4 billion as at October 31, 2017, an increase of $3.4 billionfrom the prior year primarily from:
• $4.2 billion growth from internal capital generation; and,
• $0.5 billion from decreases in regulatory capital deductions and other regulatory capitaladjustments.
Partly offset by:
• $0.7 billion from common share buybacks net of common shares issuances under the Bank’semployee share purchase and stock option plans; and,
• $0.6 billion decrease from movements in Accumulated Other Comprehensive Income,excluding cash flow hedges, primarily from the impact of foreign currency translation, partlyoffset by gains from employee pensions and benefits plans.
The Bank’s Tier 1 and Total capital ratios also benefited from the above changes and the issuanceof US$1.25 billion of NVCC subordinated additional Tier 1 capital securities, partly offset by theplanned redemptions of non-NVCC preferred shares of $0.6 billion. In addition, Total capital waslower due to the $1.5 billion planned redemption of non-NVCC subordinated debentures duringthe year.
Dividends
The strong earnings and capital position allowed the Bank to increase its dividends twice in 2017.The annual dividend in 2017 was $3.05, compared to $2.88 in 2016, an increase of 6%. Thedividend payout ratio was 46.6% in line with the Bank’s Board approved target dividend payoutratio of 40-50%.
T25 Selected capital management activity
For the fiscal years ($ millions) 2017 2016 2015
DividendsCommon $ 3,668 $ 3,468 $ 3,289Preferred 129 130 117
Common shares issued(1)(2) 313 391 104Common shares repurchased for cancellation under the Normal
Course Issuer Bid(2) 1,009 80 955Preferred shares and other equity instruments issued 1,560 1,350 –Preferred shares and other equity instruments redeemed 575 690 –Subordinated debentures issued – 2,502 1,250Maturity, redemption and repurchase of subordinated debentures 1,500 1,035 20
(1) Represents primarily cash received for stock options exercised during the year, common shares issued pursuant to the Dividend and Share PurchasePlan.
(2) Represents reduction to Common shares and Retained earnings (refer to the Consolidated Statement of Changes in Equity).
C21 CET1 capital%, as at October 31
1615 17
4
2
6
14
12
10
8
C22 Dividend growthdollars per share
1
2
4
3
07 09 11 13 15 17
C23 Internally generated capital$ billions, for years ended October 31
1615 17
1.00.5
1.52.0
4.03.53.02.5
Normal Course Issuer BidDuring the year ended October 31, 2017, under normal course issuer bids, the Bank repurchased and cancelled approximately 14 million commonshares (2016 – 1.5 million) at an average price of $72.09 per share (2016 – $52.34) for a total amount of approximately $1,009 million (2016 –$80 million).
On May 30, 2017, the Bank announced that OSFI and the Toronto Stock Exchange (TSX) approved a normal course issuer bid (the “2017 NCIB”)pursuant to which it may repurchase for cancellation up to 24 million of the Bank’s common shares. Purchases under the 2017 NCIB will terminateupon the earlier of: (i) the Bank purchasing the maximum number of common shares under the NCIB, (ii) the Bank providing a notice of termination,or (iii) June 1, 2018. On a quarterly basis, the Bank will notify OSFI prior to making purchases. Under this bid, the Bank has repurchased and cancelled4 million common shares at an average price of approximately $74.83 per share.
On May 31, 2016, the Bank announced that OSFI and the TSX approved a normal course issuer bid (the “2016 NCIB”) pursuant to which it mayrepurchase for cancellation up to 12 million of the Bank’s common shares. The 2016 NCIB terminated on June 1, 2017. On January 4, 2017 andMarch 17, 2017 the TSX approved amendments to the 2016 NCIB, including to allow the Bank to purchase common shares by private agreement orunder a specific share repurchase program, respectively. Under the 2016 NCIB, the Bank repurchased and cancelled 10 million common shares at anaverage price of approximately $71.00 per share.
2 0 1 7 S C O T I A B A N K A N N U A L R E P O R T | 47

MANAGEMENT’S DISCUSSION AND ANALYSIS
Share data and other capital instrumentsThe Bank’s common and preferred share data, as well as other capital instruments, are shown in T26. Further details, including exchangeabilityfeatures, are discussed in Note 20 and Note 23 of the Consolidated Financial Statements.
T26 Shares and other instruments
As at October 31, 2017Amount
($ millions)
Dividendsdeclared
per share(1)
Numberoutstanding
(000s)Conversion
features
Common shares(2) $ 15,644 $ 3.05 1,199,232 n/a
Preferred sharesPreferred shares Series 16(3) – – – –Preferred shares Series 17(3) – – – –Preferred shares Series 18(4)(5)(6) 187 0.837500 7,498 Series 19Preferred shares Series 19(4)(5)(7) 158 0.642626 6,302 Series 18Preferred shares Series 20(4)(5)(8) 201 0.902500 8,039 Series 21Preferred shares Series 21(4)(5)(9) 149 0.554501 5,961 Series 20Preferred shares Series 22(4)(5)(10) 234 0.957500 9,377 Series 23Preferred shares Series 23(4)(5)(11) 66 0.600126 2,623 Series 22Preferred shares Series 30(4)(5)(12) 154 0.455000 6,143 Series 31Preferred shares Series 31(4)(5)(13) 111 0.380126 4,457 Series 30Preferred shares Series 32(4)(5)(14) 279 0.515752 11,161 Series 33Preferred shares Series 33(4)(5)(15) 130 0.465159 5,184 Series 32Preferred shares Series 34(4)(5)(16)(17) 350 1.375000 14,000 Series 35Preferred shares Series 36(4)(5)(16)(18) 500 1.375000 20,000 Series 37Preferred shares Series 38(4)(5)(16)(19) 500 1.351175 20,000 Series 39
Additional Tier 1 securitiesAmount
($ millions) Distribution(20) Yield (%)
Numberoutstanding
(000s)
Scotiabank Trust Securities – Series 2006-1 issued by Scotiabank Capital Trust(21a,c,d) $ 750 28.25 5.650 750Scotiabank Tier 1 Securities – Series 2009-1 issued by Scotiabank Tier 1 Trust(21b,c,d) 650 39.01 7.802 650Subordinated additional Tier 1 capital securities (NVCC)(22) US$ 1,250 US$ 23.25 4.650 1,250
NVCC subordinated debenturesAmount
($ millions)Interest
Rate (%)
Subordinated debentures due March 2027 $ 1,250 2.58Subordinated debentures due December 2025 750 3.37Subordinated debentures due December 2025 US$ 1,250 4.50
Options
Numberoutstanding
(000s)
Outstanding options granted under the Stock Option Plans to purchase common shares(2)(23) 15,555
(1) Dividends declared as at August 29, 2017.(2) Dividends on common shares are paid quarterly, if and when declared. As at November 17, 2017, the number of outstanding common shares and options was 1,199,380 thousand and 15,345 thousand, respectively.(3) On January 27, 2017 and on April 26, 2017, the Bank redeemed all outstanding Non-cumulative Preferred shares Series 16 and Series 17 and paid dividends of $0.328125 and $0.350000 per share respectively.(4) These preferred shares are entitled to non-cumulative preferential cash dividends payable quarterly. Refer to Note 23 of the Consolidated Financial Statements in the Bank’s 2017 Annual Report for further details.(5) These preferred shares have conversion features. Refer to Note 23 of the Consolidated Financial Statements in the Bank’s 2017 Annual Report for further details.(6) Subsequent to the initial five-year fixed rate period which ended on April 25, 2013, and resetting every five years thereafter, the dividends, if and when declared, will be determined by the sum of the five-year Government of
Canada Yield plus 2.05%, multiplied by $25.00.(7) Dividends, if and when declared, are determined by the sum of the three-month Government of Canada Treasury Bill Yield plus 2.05%, multiplied by $25.00, which will be reset quarterly.(8) Subsequent to the initial five-year fixed rate period which ended on October 25, 2013, and resetting every five years thereafter, the dividends, if and when declared, will be determined by the sum of the five-year Government of
Canada Yield plus 1.70%, multiplied by $25.00.(9) Dividends, if and when declared, are determined by the sum of the three-month Government of Canada Treasury Bill Yield plus 1.70%, multiplied by $25.00, which will be reset quarterly.(10) Subsequent to the initial five-year fixed rate period which ended on January 25, 2014, and resetting every five years thereafter, the dividends, if and when declared, will be determined by the sum of the five-year Government of
Canada Yield plus 1.88%, multiplied by $25.00.(11) Dividends, if and when declared, are determined by the sum of the three-month Government of Canada Treasury Bill Yield plus 1.88%, multiplied by $25.00, which will be reset quarterly.(12) Subsequent to the initial five-year fixed rate period which ended on April 25, 2015, and resetting every five years thereafter, the dividends, if and when declared, will be determined by the sum of the five-year Government of
Canada Yield plus 1.00%, multiplied by $25.00.(13) Dividends, if and when declared, are determined by the sum of the three-month Government of Canada Treasury Bill Yield plus 1.00%, multiplied by $25.00, which will be reset quarterly.(14) Subsequent to the initial five-year fixed rate period which ended on February 1, 2016, and resetting every five years thereafter, the dividends, if and when declared, will be determined by the sum of the five-year Government of
Canada Yield plus 1.34%, multiplied by $25.00.(15) Dividends, if and when declared, are determined by the sum of the three-month Government of Canada Treasury Bill Yield plus 1.34%, multiplied by $25.00, which will be reset quarterly.(16) These preferred shares contain Non-Viability Contingent Capital (NVCC) provisions necessary for the shares to qualify as Tier 1 regulatory capital under Basel III. Refer to Note 23 of the Consolidated Financial Statements in the
Bank’s 2017 Annual Report for further details.(17) Subsequent to the initial five-year fixed rate period ending on April 25, 2021, and resetting every five years thereafter, the dividends, if and when declared, will be determined by the sum of the five-year Government of Canada
Yield plus 4.51%, multiplied by $25.00.(18) Subsequent to the initial five-year fixed rate period ending on July 25, 2021, and resetting every five years thereafter, the dividends, if and when declared, will be determined by the sum of the five-year Government of Canada
Yield plus 4.72%, multiplied by $25.00.(19) Subsequent to the initial five-year fixed rate period ending on January 26, 2022, and resetting every five years thereafter, the dividends, if and when declared, will be determined by the sum of the five-year Government of
Canada Yield plus 4.19%, multiplied by $25.00.(20) Per face amount of $1,000 or US$1,000, as applicable.
(21)(a) On September 28, 2006, Scotiabank Capital Trust issued 750,000 Scotiabank Trust Securities – Series 2006-1 (Scotia BaTS II Series 2006-1). The holders of Scotia BaTS II Series 2006-1 are entitled to receive non-cumulativefixed cash distributions payable semi-annually in an amount of $28.25 per security. With regulatory approval, these securities may be redeemed in whole upon the occurrence of certain tax or regulatory capital changes, or inwhole or in part on December 30, 2011 and on any distribution date thereafter at the option of Scotiabank Capital Trust. The holder has the right at any time to exchange their security into Non-cumulative Preferred SharesSeries S of the Bank. The Series S shares will be entitled to cash dividends payable semi-annually in an amount of $0.4875 per $25.00 share [refer to Note 23 – Restrictions on dividend payments in the Bank’s 2017 AnnualReport]. Under the circumstances outlined in 21(c) below, the Scotia BaTS II Series 2006-1 would be automatically exchanged without the consent of the holder, into Non-cumulative Preferred Shares Series T of the Bank. TheSeries T shares will be entitled to non-cumulative cash dividends payable semi-annually in an amount of $0.625 per $25.00 share. If there is an automatic exchange of the Scotia BaTS II Series 2006-1 into Preferred SharesSeries T of the Bank, then the Bank would become the sole beneficiary of the Trust.
(21)(b) On May 7, 2009, Scotiabank Tier 1 Trust issued 650,000 Scotiabank Tier 1 Securities Series 2009-1 (Scotia BaTS III Series 2009-1). Interest is payable semi-annually in an amount of $39.01 per Scotia BaTS III Series 2009-1 onthe last day of June and December until June 30, 2019. After June 30, 2019 and on every fifth anniversary thereafter until June 30, 2104, the interest rate on the Scotia BaTS III Series 2009-1 will be reset at an interest rateper annum equal to the then prevailing 5-year Government of Canada Yield plus 7.05%. On or after June 30, 2014, the Trust may, at its option redeem the Scotia BaTS III Series 2009-1, in whole or in part, subject to regulatoryapproval. Under the circumstances outlined in 21(c) below, the Scotia BaTS III Series 2009-1, including accrued and unpaid interest thereon, would be exchanged automatically without the consent of the holder, into newlyissued Non-cumulative Preferred Shares Series R of the Bank. In addition, in certain circumstances, holders of Scotia BaTS III Series 2009-1 may be required to invest interest paid on the Scotia BaTS III Series 2009-1 in a series ofnewly-issued preferred shares of the Bank with non-cumulative dividends (each such series is referred to as Bank Deferral Preferred Shares). If there is an automatic exchange of the Scotia BaTS III Series 2009-1 into PreferredShares Series R of the Bank, then the Bank would become the sole beneficiary of the Trust.
48 | 2 0 1 7 S C O T I A B A N K A N N U A L R E P O R T

MA
NA
GEM
ENT’S
DISC
USSIO
NA
ND
AN
ALY
SIS|
GR
OU
PFIN
AN
CIA
LC
ON
DIT
ION
(21)(c) The Scotia BaTS II Series 2006-1 and Scotia BaTS III Series 2009-1 may be automatically exchanged, without the consent of the holder, into Non-cumulative Preferred Shares of the Bank in the following circumstances:(i) proceedings are commenced for the winding-up of the Bank; (ii) the Superintendent takes control of the Bank or its assets; (iii) the Bank has a Tier 1 Capital ratio of less than 5% or a Total Capital ratio of less than 8%; or(iv) the Superintendent has directed the Bank to increase its capital or provide additional liquidity and the Bank elects such automatic exchange or the Bank fails to comply with such direction.
(21)(d) No cash distributions will be payable on the Scotia BaTS II Series 2006-1 and Scotia BaTS III Series 2009-1 in the event that the regular dividend is not declared on the Bank’s preferred shares and, if no preferred shares areoutstanding, the Bank’s common shares. In such a circumstance the net distributable funds of the Trust will be payable to the Bank as the holder of the residual interest in the Trust. Should the Trust fail to pay the semi-annualdistributions on the Scotia BaTS II Series 2006-1 and Scotia BaTS III Series 2009-1 in full, the Bank will not declare dividends, of any kind on any of its preferred or common shares for a specified period of time [refer to Note 23 –Restrictions on dividend payments].
(22) On October 12, 2017, the Bank issued US$1.25 billion 4.650% fixed to floating rate non-cumulative subordinated additional Tier 1 capital securities (NVCC). Refer to Note 23(b) – Preferred shares and other equity instruments.(23) Included are 5,900 stock options with tandem stock appreciation rights (Tandem SAR) features.
Credit ratings
Credit ratings are one of the factors that impact the Bank’s access to capital markets and borrowing costs, as well as the terms on which the Bank canconduct derivatives and hedging transactions and obtain related borrowings. The credit ratings and outlook that the rating agencies assign to theBank are based on their own views and methodologies.
On May 10, 2017, Moody’s downgraded the long-term ratings of all Canadian banks, citing concerns around expanding levels of private sector debt,which could increase the likelihood of weaker asset quality in the future. Moody’s downgraded the Bank’s long-term ratings by one notch to A1 fromAa3, while affirming the Bank’s short-term deposit rating of P-1.
The Bank continues to have strong credit ratings and is rated AA by DBRS, A1 by Moody’s, AA- by Fitch and A+ by Standard and Poor’s (S&P). Fitchand S&P have a stable outlook on the Bank. Meanwhile, DBRS and Moody’s continue to maintain their negative outlook for all Canadian banks citingthe uncertainty around the federal government’s proposed new bail-in regime for senior unsecured debt, to reflect the greater likelihood that suchdebt may incur losses in the unlikely event of a distress scenario. (Refer to Shareholder Information section for ratings of other securities).
Risk-weighted assets
Regulatory capital requirements are based on OSFI’s target minimum percentage of risk-weighted assets (RWA). RWA represent the Bank’s exposureto credit, market and operational risk and are computed by applying a combination of the OSFI approved Bank’s internal risk models and OSFIprescribed risk weights to on- and off-balance sheet exposures. CET1, Tier 1 and Total Capital RWA were $376.4 billion at year end, representingincreases from 2016 of approximately $12.3 billion, $11.9 billion and $11.5 billion, respectively.
Since the introduction of Basel II in 2008, OSFI has prescribed a minimum capital floor for institutions that use the advanced internal ratings-basedapproach for credit risk. The Basel I capital floor add-on is determined by comparing a capital requirement calculated by reference to Basel I againstthe Basel III calculation, as specified by OSFI. A shortfall in the Basel III capital requirement as compared with the Basel I floor is added to RWA.
Increases to CET1, Tier 1 and Total Capital RWA during the year are due to Basel I floor adjustments of $12.8 billion, $12.6 billion and $12.4 billion,respectively, and higher operational risk RWA of $1.9 billion, and credit risk RWA of approximately $0.3 billion (including the impact of foreigncurrency translation of -$6.9 billion), partly offset by lower market risk RWA of $2.7 billion.
CET1 Credit risk-weighted assets
As shown in Table T27, CET1 credit risk-weighted assets increased by approximately $0.3 billion to $315.2 billion primarily due to the followingcomponents:
• Higher volumes increased RWA by $14.2 billion;
• Book quality changes, including parameter recalibrations, reduced RWA by $5.8 billion;
• Model updates decreased RWA by $2.2 billion;
• Implementation of methodology and policy changes during the year increased RWA by $1.1 billion; and,
• The impact of foreign exchange translation decreased RWA by $6.9 billion.
T27 Flow statement for Basel III All-in credit risk-weighted assets ($ millions)
2017 2016
Credit risk-weighted assets movement by key driver(1)
($ millions) Credit risk
Of whichcounterparty
credit risk Credit risk
Of whichcounterparty
credit risk
CET1 Credit risk-weighted assets as at beginning of year $ 314,822 $ 16,432 $ 308,035 $ 22,940Book size(2) 14,219 797 1,781 (4,082)Book quality(3) (5,812) (1,209) 10,542 740Model updates(4) (2,248) 219 (3,214) (3,214)Methodology and policy(5) 1,062 521 (2,849) –Acquisitions and disposals – – 1,672 –Foreign exchange movements (6,884) (266) 2,731 48Other – – (3,876) –
CET1 Credit risk-weighted assets as at end of year(6) $ 315,159 $ 16,494 $ 314,822 $ 16,432
Tier 1 CVA scalar 208 208 456 456Tier 1 Credit risk-weighted assets as at end of year(6) 315,367 16,702 315,278 16,888Total CVA scalar 166 166 390 390
Total Credit risk-weighted assets as at end of year(6) $ 315,533 $ 16,868 $ 315,668 $ 17,278
(1) Includes counterparty credit risk.(2) Book size is defined as organic changes in book size and composition (including new business and maturing loans).(3) Book quality is defined as quality of book changes caused by experience such as underlying customer behaviour or demographics, including changes through model calibrations/realignments.(4) Model updates are defined as model implementation, change in model scope or any change to address model enhancement.(5) Methodology and policy is defined as methodology changes to the calculations driven by regulatory policy changes, such as new regulation (e.g. Basel III).(6) As at October 31, 2017, risk-weighted assets were calculated using scalars of 0.72, 0.77, and 0.81 to compute CET1, Tier 1, and Total capital ratios, respectively, (scalars were 0.64, 0.71, and 0.77 in 2016).
2 0 1 7 S C O T I A B A N K A N N U A L R E P O R T | 49

MANAGEMENT’S DISCUSSION AND ANALYSIS
T28 Internal rating scale(1) and mapping to external rating agencies
Equivalent Rating
External Rating – S&P External Rating – Moody’s External Rating – DBRS Grade IG Code PD Range(2)
AAA to AA+ Aaa to Aa1 AAA to AA (high)Investment
grade
99-98 0.0000% – 0.0448%AA to A+ Aa2 to A1 AA to A (high) 95 0.0448% – 0.1304%A to A- A2 to A3 A to A (low) 90 0.0552% – 0.1402%BBB+ Baa1 BBB (high) 87 0.0876% – 0.2187%BBB Baa2 BBB 85 0.1251% – 0.3176%BBB- Baa3 BBB (low) 83 0.1788% – 0.4610%
BB+ Ba1 BB (high)
Non-Investmentgrade
80 0.2886% – 0.5134%BB Ba2 BB 77 0.4658% – 0.5716%BB- Ba3 BB (low) 75 0.5716% – 0.7518%B+ B1 B (high) 73 0.7518% – 1.4444%B to B- B2 to B3 B to B (low) 70 1.4444% – 2.7749%
CCC+ Caa1 –
Watch list
65 2.7749% – 10.1814%CCC Caa2 – 60 10.1814% – 19.4452%CCC- to CC Caa3 to Ca – 40 19.4452% – 35.4088%– – – 30 35.4088% – 59.5053%Default Default 27-21 100%
(1) Applies to non-retail portfolio.(2) PD ranges overlap across IG codes as the Bank utilizes two risk rating systems for its AIRB portfolios, and each risk rating system has its own separate IG to PD mapping.
T29 Non-retail AIRB portfolio exposure by internal rating grade(1)(2)
As at October 31 ($ millions) 2017 2016
Grade IG Code
Exposureat default
($)(4)RWA
($)PD
(%)(5)(8)LGD(%)(6)(8)
RW(%)(7)(8)
Exposureat default
($)(4)RWA
($)PD
(%)(5)(8)LGD(%)(6)(8)
RW(%)(7)(8)
Investment grade(3)
99-98 79,908 930 0.01 11 1 66,127 878 0.01 18 195 46,871 5,816 0.05 33 12 45,031 6,458 0.06 30 1490 56,472 9,190 0.07 35 16 52,357 8,540 0.07 37 1687 44,533 10,229 0.11 38 23 42,398 10,326 0.13 37 2485 40,379 13,229 0.16 43 33 40,162 14,189 0.18 41 3583 41,488 17,796 0.25 44 43 37,926 16,704 0.25 44 44
Non-Investment grade
80 36,235 18,701 0.35 44 52 36,135 20,502 0.36 46 5777 23,045 13,167 0.50 42 57 23,941 14,955 0.51 43 6275 20,085 13,703 0.75 43 68 15,941 11,830 0.74 46 7473 7,271 5,608 1.44 35 77 7,307 6,063 1.42 40 8370 3,758 3,666 2.77 37 98 4,692 4,682 2.73 43 100
Watch list 65 2,167 2,136 10.18 25 99 1,297 2,078 9.99 41 16060 761 1,454 19.45 38 191 1,221 2,447 19.05 40 20040 1,311 2,647 30.74 38 202 2,465 4,901 28.77 37 19930 159 220 58.44 36 138 100 178 59.28 43 178
Default(9) 27-21 1,752 6,298 100 44 359 2,520 8,106 100 42 322
Total 406,195 124,790 0.86 34 31 379,620 132,837 1.20 36 35Government guaranteed
residential mortgages 91,737 – – 35 – 100,869 – – 25 –
Total 497,932 124,790 0.70 34 25 480,489 132,837 0.95 34 28
(1) Refer to the Bank’s Supplementary Regulatory Capital Disclosures for a more detailed breakdown by asset class, exposure at default, probability at default, loss given default and risk weighting.(2) Excludes securitization exposures.(3) Excludes government guaranteed residential mortgages of $91.7 billion ($100.9 billion in 2016).(4) After credit risk mitigation.(5) PD – Probability of Default.(6) LGD – Loss Given Default.(7) RW – Risk Weight.(8) Exposure at default used as basis for estimated weightings.(9) Gross defaulted exposures, before any related allowances.
Credit risk-weighted assets – non-retail
Credit risk measures the risk that a borrower or counterparty will fail to honour its financial or contractual obligations to the Bank. The Bank uses theAdvanced Internal Ratings Based (AIRB) approach under Basel III to determine minimum regulatory capital requirements for its domestic, U.S. andEuropean credit portfolios, and certain international non-retail portfolios. The remaining credit portfolios are subject to the Standardized approach,which relies on the external credit ratings of borrowers, if available, to compute regulatory capital for credit risk. For AIRB portfolios, the key riskmeasures used in the quantification of regulatory capital for credit risk include probability of default (PD), loss given default (LGD) and exposure atdefault (EAD).
• Probability of default (PD) measures the likelihood that a borrower, with an assigned Internal Grade (IG) code, will default within a one-year timehorizon. IG codes are a component of the Bank’s risk rating system. Each of the Bank’s internal borrower IG codes is mapped to a PD estimate.
50 | 2 0 1 7 S C O T I A B A N K A N N U A L R E P O R T

MA
NA
GEM
ENT’S
DISC
USSIO
NA
ND
AN
ALY
SIS|
GR
OU
PFIN
AN
CIA
LC
ON
DIT
ION
• Loss given default (LGD) measures the severity of loss on a facility in the event of a borrower’s default. The Bank’s internal LGD grades are mappedto ranges of LGD estimates. LGD grades are assigned based on facility characteristics such as seniority, collateral type, collateral coverage and otherstructural elements. LGD for a defaulted exposure is based on the concept of economic loss and is calculated using the present value of repayments,recoveries and related direct and indirect expenses.
• Exposure at default (EAD) measures the expected exposure on a facility at the time of default.
All three risk measures are estimated using the Bank’s historical data, as well as available external benchmarks, and are updated on a regular basis.The historical data used for estimating these risk measures exceeds the minimum five-year AIRB requirement for PD estimates and the minimumseven-year AIRB requirement for LGD and EAD estimates. Further analytical adjustments, as required under the Basel III Framework and OSFI’srequirements set out in its Domestic Implementation Notes, are applied to average estimates obtained from historical data. These analyticaladjustments incorporate the regulatory requirements pertaining to:
• Long-run estimation of PD, which requires that PD estimates capture average default experience over a reasonable mix of high-default andlow-default years of the economic cycle;
• Downturn estimation for LGD, which requires that LGD estimates appropriately reflect conditions observed during periods where credit losses aresubstantially higher than average; and
• Downturn estimation for EAD, which requires that EAD estimates appropriately reflect conditions observed during periods of economic downturn;and
• The addition of a margin of conservatism, which is related to the likely range of errors based on the identification and quantification of the varioussources of uncertainty inherent in historical estimates.
These risk measures are used in the calculation of regulatory capital requirements based on formulas specified by the Basel framework. The creditquality distribution of the Bank’s AIRB non-retail portfolio is shown in Table T29.
The risk measures are subject to a rigorous back-testing framework which uses the Bank’s historical data to ensure that they are appropriatelycalibrated. Based on results obtained from the back-testing process, risk measures are reviewed, re-calibrated and independently validated on at leastan annual basis to ensure that they reflect the implications of new data, technical advances and other relevant information.
• As PD estimates represent long-run parameters, back-testing is performed using historical data spanning at least one full economic cycle. RealizedPDs are back-tested using pre-defined confidence intervals, and the results are then aggregated to provide an overall assessment of theappropriateness of each PD estimate;
• The back-testing for LGD and EAD estimates is conducted from both long-run and downturn perspectives, in order to ensure that these estimatesare adequately conservative to reflect both long-run and downturn conditions.
Portfolio-level back-testing results, based on a comparison of estimated and realized parameters for the four-quarter period ended at July 31, 2017,are shown in Table T30.
T30 Portfolio-level comparison of estimated and actual non-retail percentages
Estimated(1) Actual
Average PD 0.92 0.40Average LGD 41.59 22.18Average CCF(2) 51.28 5.69
(1) Estimated parameters are based on portfolio averages at Q3/16, whereas actual parameters are based on averages of realized parameters during the subsequent four quarters.(2) EAD back-testing is performed through Credit Conversion Factor (CCF) back-testing, as EAD is computed using the sum of the drawn exposure and undrawn exposure multiplied by the estimated CCF.
Credit risk-weighted assets – Canadian retail
The AIRB approach is used to determine minimum regulatory capital requirements for the retail credit portfolio. The retail portfolio is comprised of thefollowing Basel-based pools:
• Residential real estate secured exposures consists of conventional and high ratio residential mortgages and all other products opened under theScotia Total Equity Plan (STEP), such as loans, credit cards and secured lines of credit;
• Qualifying revolving retail exposures consists of all unsecured credit cards and lines of credit;
• Other retail consists of term loans (secured and unsecured), as well as credit cards and lines of credit which are secured by assets other than realestate.
For the AIRB portfolios, the following models and parameters are estimated:
• Probability of default (PD) is the likelihood that the facility will default within the next 12 months.
• Loss Given Default (LGD) measures the economic loss as a proportion of the defaulted balance.
• Exposure at Default (EAD) is the portion of expected exposures at time of default.
The data observation period used for PD/EAD/LGD estimates meets the five year minimum. Various statistical techniques including predictive modelingand decision trees were used to develop models. The models assign accounts into homogenous segments using internal and external borrower/facility-level credit experience. Every month, exposures are automatically re-rated based on risk and loss characteristics. PD, LGD and EAD estimates are thenassigned to each of these segments incorporating the following regulatory requirements:
• PD incorporates the average long run default experience over an economic cycle. This long run average includes a mix of high and low defaultyears.
• LGD is adjusted to appropriately reflect economic downturn conditions.
• EAD may also be adjusted to reflect downturn conditions when PD and EAD are highly correlated.
• Sources of uncertainty are reviewed regularly to ensure uncertainties are identified, quantified and included in calculations so that all parameterestimates reflect appropriate levels of conservatism.
2 0 1 7 S C O T I A B A N K A N N U A L R E P O R T | 51

MANAGEMENT’S DISCUSSION AND ANALYSIS
The table below summarizes the credit quality distribution of the Bank’s AIRB retail portfolio as at October 31, 2017.
T31 Retail AIRB portfolio exposure by PD range(1)(2)
As at October 31 ($ millions) 2017 2016
Category PD Range
Exposureat default
($)(2)RWA
($)PD
(%)(3)(6)LGD(%)(4)(6)
RW(%)(5)(6)
Exposureat default
($)(2)RWA
($)PD
(%)(3)(6)LGD(%)(4)(6)
RW(%)(5)(6)
Exceptionally low 0.0000% – 0.0499% 16,026 476 0.05 66 3 44,356 964 0.04 30 2Very low 0.0500% – 0.1999% 80,507 4,059 0.09 28 5 59,509 4,417 0.15 31 7Low 0.2000% – 0.9999% 94,081 19,638 0.52 35 21 52,261 12,483 0.54 42 24
Medium low 1.0000% – 2.9999% 17,070 9,919 1.91 57 58 20,851 10,961 1.75 53 53Medium 3.0000% – 9.9999% 8,583 8,827 5.56 75 103 6,265 6,028 5.34 61 96
High 10.0000% – 19.9999% 889 1,086 17.18 43 122 1,997 2,926 10.77 67 147Extremely high 20.0000% – 99.9999% 1,453 2,566 36.86 62 177 2,312 3,682 35.12 56 159
Default(7) 100% 607 – 100.00 79 – 677 – 100.00 74 –
Total 219,216 46,571 1.21 38 21 188,228 41,461 1.48 38 22
(1) Refer to the Bank’s Supplementary Regulatory Capital Disclosures for a more detailed breakdown by asset class, exposure at default, probability at default, loss given default and risk-weighting.(2) After credit risk mitigation.(3) PD – Probability of Default.(4) LGD – Loss Given Default.(5) RW – Risk Weight.(6) Exposure at default used as basis for estimated weightings.(7) Gross defaulted exposures, before any related allowances.
All AIRB models and parameters are monitored on a quarterly basis and independently validated annually by the Global Risk Management group.These models are tested to ensure rank ordering and back testing of parameters is appropriate. Comparison of estimated and actual loss parametersfor the period ended July 31, 2017 is shown in Table T32. During this period the actual experience was significantly better than the estimated riskparameters.
T32 Estimated and actual loss parameters(1)
($ millions)
Averageestimated
PD(%)(2)(7)
Actualdefault
rate(%)(2)(5)
Averageestimated
LGD(%)(3)(7)
ActualLGD(%)(3)(6)
EstimatedEAD
($)(4)(7)
ActualEAD
($)(4)(5)
Residential real estate securedResidential mortgages
Insured mortgages(8) 0.69 0.59 – – – –Uninsured mortgages 0.46 0.44 18.12 10.82 – –
Secured lines of credit 0.77 0.32 28.95 13.95 107 92Qualifying revolving retail exposures 2.14 1.92 77.54 63.91 743 650Other retail 2.21 1.32 58.90 47.12 8 8
(1) Estimates and actual values are recalculated to align with new models implemented during the period.(2) Account weighted aggregation.(3) Default weighted aggregation.(4) EAD is estimated for revolving products only.(5) Actual based on accounts not at default as at four quarters prior to reporting date.(6) Actual LGD calculated based on 24 month recovery period after default and therefore excludes any recoveries received after the 24 month period.(7) Estimates are based on the four quarters prior to the reporting date.(8) Actual and estimated LGD for insured mortgages are not shown. Actual LGD includes the insurance benefit, whereas estimated LGD may not.
Credit risk-weighted assets – International retail
International retail credit portfolios follow the Standardized approach and consist of the following components:
• Residential real estate secured lending;
• Qualifying revolving retail exposures consisting of all credit cards and lines of credit;
• Other retail consisting of term loans.
Under the standardized approach, in general, residential real estate secured lending products are risk-weighted 35% and other retail products receivea 75% risk-weight.
Market risk
Market risk is the risk of loss from changes in market prices including interest rates, credit spreads, equity prices, foreign exchange rates, andcommodity prices, the correlations between them, and their levels of volatility.
For all material trading portfolios, the Bank applies its internal models to calculate the market risk capital charge. OSFI has approved the Bank’sinternal VaR, Stressed VaR, Incremental Risk Charge and Comprehensive Risk Measure models for the determination of market risk capital. Theattributes and parameters of these models are described in the Risk Measurement Summary.
For some non-material trading portfolios, the Bank applies the Standardized Approach for calculating market risk capital. The standardized methoduses a “building block” approach, with the capital charge for each risk category calculated separately.
52 | 2 0 1 7 S C O T I A B A N K A N N U A L R E P O R T
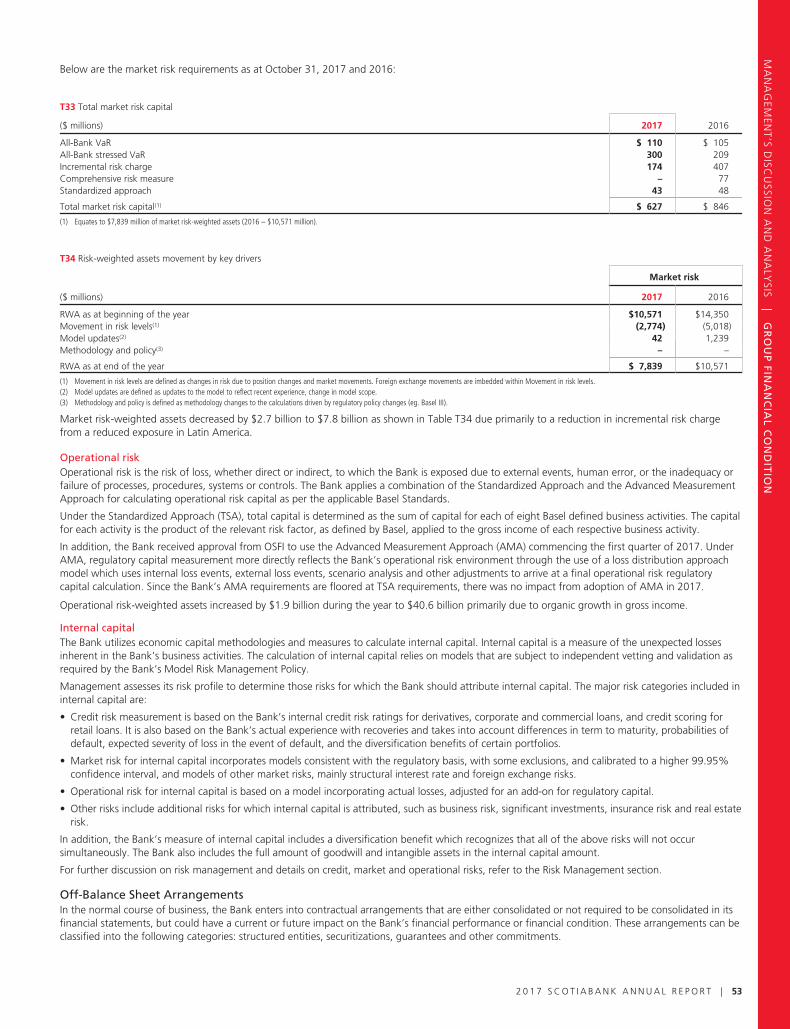
MA
NA
GEM
ENT’S
DISC
USSIO
NA
ND
AN
ALY
SIS|
GR
OU
PFIN
AN
CIA
LC
ON
DIT
ION
Below are the market risk requirements as at October 31, 2017 and 2016:
T33 Total market risk capital
($ millions) 2017 2016
All-Bank VaR $ 110 $ 105All-Bank stressed VaR 300 209Incremental risk charge 174 407Comprehensive risk measure – 77Standardized approach 43 48
Total market risk capital(1) $ 627 $ 846
(1) Equates to $7,839 million of market risk-weighted assets (2016 – $10,571 million).
T34 Risk-weighted assets movement by key drivers
Market risk
($ millions) 2017 2016
RWA as at beginning of the year $10,571 $14,350Movement in risk levels(1) (2,774) (5,018)Model updates(2) 42 1,239Methodology and policy(3) – –
RWA as at end of the year $ 7,839 $10,571
(1) Movement in risk levels are defined as changes in risk due to position changes and market movements. Foreign exchange movements are imbedded within Movement in risk levels.(2) Model updates are defined as updates to the model to reflect recent experience, change in model scope.(3) Methodology and policy is defined as methodology changes to the calculations driven by regulatory policy changes (eg. Basel III).
Market risk-weighted assets decreased by $2.7 billion to $7.8 billion as shown in Table T34 due primarily to a reduction in incremental risk chargefrom a reduced exposure in Latin America.
Operational riskOperational risk is the risk of loss, whether direct or indirect, to which the Bank is exposed due to external events, human error, or the inadequacy orfailure of processes, procedures, systems or controls. The Bank applies a combination of the Standardized Approach and the Advanced MeasurementApproach for calculating operational risk capital as per the applicable Basel Standards.
Under the Standardized Approach (TSA), total capital is determined as the sum of capital for each of eight Basel defined business activities. The capitalfor each activity is the product of the relevant risk factor, as defined by Basel, applied to the gross income of each respective business activity.
In addition, the Bank received approval from OSFI to use the Advanced Measurement Approach (AMA) commencing the first quarter of 2017. UnderAMA, regulatory capital measurement more directly reflects the Bank’s operational risk environment through the use of a loss distribution approachmodel which uses internal loss events, external loss events, scenario analysis and other adjustments to arrive at a final operational risk regulatorycapital calculation. Since the Bank’s AMA requirements are floored at TSA requirements, there was no impact from adoption of AMA in 2017.
Operational risk-weighted assets increased by $1.9 billion during the year to $40.6 billion primarily due to organic growth in gross income.
Internal capitalThe Bank utilizes economic capital methodologies and measures to calculate internal capital. Internal capital is a measure of the unexpected lossesinherent in the Bank’s business activities. The calculation of internal capital relies on models that are subject to independent vetting and validation asrequired by the Bank’s Model Risk Management Policy.
Management assesses its risk profile to determine those risks for which the Bank should attribute internal capital. The major risk categories included ininternal capital are:
• Credit risk measurement is based on the Bank’s internal credit risk ratings for derivatives, corporate and commercial loans, and credit scoring forretail loans. It is also based on the Bank’s actual experience with recoveries and takes into account differences in term to maturity, probabilities ofdefault, expected severity of loss in the event of default, and the diversification benefits of certain portfolios.
• Market risk for internal capital incorporates models consistent with the regulatory basis, with some exclusions, and calibrated to a higher 99.95%confidence interval, and models of other market risks, mainly structural interest rate and foreign exchange risks.
• Operational risk for internal capital is based on a model incorporating actual losses, adjusted for an add-on for regulatory capital.
• Other risks include additional risks for which internal capital is attributed, such as business risk, significant investments, insurance risk and real estaterisk.
In addition, the Bank’s measure of internal capital includes a diversification benefit which recognizes that all of the above risks will not occursimultaneously. The Bank also includes the full amount of goodwill and intangible assets in the internal capital amount.
For further discussion on risk management and details on credit, market and operational risks, refer to the Risk Management section.
Off-Balance Sheet ArrangementsIn the normal course of business, the Bank enters into contractual arrangements that are either consolidated or not required to be consolidated in itsfinancial statements, but could have a current or future impact on the Bank’s financial performance or financial condition. These arrangements can beclassified into the following categories: structured entities, securitizations, guarantees and other commitments.
2 0 1 7 S C O T I A B A N K A N N U A L R E P O R T | 53

MANAGEMENT’S DISCUSSION AND ANALYSIS
Structured entitiesArrangements with structured entities include structured entities that are used to provide a wide range of services to customers, such as structuredentities established to allow clients to securitize their financial assets while facilitating cost-efficient financing, and to provide certain investmentopportunities. The Bank creates, administers and manages personal and corporate trusts on behalf of its customers. The Bank also sponsors andactively manages certain structured entities (see discussion on other unconsolidated structured entities on page 55).
All structured entities are subject to a rigorous review and approval process to ensure that all significant risks are properly identified and addressed. Formany of the structured entities that are used to provide services to customers, the Bank does not guarantee the performance of the structured entities’underlying assets, and does not absorb any related losses. For other structured entities, such as securitization and investment vehicles, the Bank may beexposed to credit, market, liquidity or operational risks. The Bank earns fees based on the nature of its association with a structured entity.
Consolidated structured entitiesThe Bank controls its U.S.-based multi-seller conduit and certain funding and other vehicles, and consolidates these structured entities in the Bank’sconsolidated financial statements.
As at October 31, 2017, total assets of consolidated structured entities were $53 billion, compared to $59 billion at the end of 2016. The change wasprimarily due to decreased assets in Scotiabank Covered Bond Guarantor Limited Partnership and assets that matured in other structured entities.More details of the Bank’s consolidated structured entities are provided in Note 14(a) to the consolidated financial statements.
Unconsolidated structured entities
There are two primary types of association the Bank has with unconsolidated structured entities:
• Canadian multi-seller conduits administered by the Bank, and
• Structured finance entities.
The Bank earned total fees of $30 million in 2017 (October 31, 2016 – $23 million) from certain structured entities in which it had a significantinterest at the end of the year but did not consolidate. More information with respect to the Bank’s involvement with these unconsolidated structuredentities, including details of liquidity facilities and maximum loss exposure by category is provided below and in Note 14(b) to the consolidatedfinancial statements.
Canadian multi-seller conduits administered by the Bank
The Bank sponsors two Canadian-based multi-seller conduits that are not consolidated. The Bank earned commercial paper issuance fees, programmanagement fees, liquidity fees and other fees from these multi-seller conduits, which totaled $29 million in 2017, compared to $22 million in 2016.These multi-seller conduits purchase high-quality financial assets and finance these assets through the issuance of highly-rated commercial paper.
As further described below, the Bank’s exposure to these off-balance sheet conduits primarily consists of liquidity support and temporary holdings ofcommercial paper. Although the Bank has power over the relevant activities of the conduits, it has limited exposure to variability in returns, whichresults in the Bank not consolidating the two Canadian conduits. The Bank has a process to monitor these exposures and significant events impactingthe conduits to ensure there is no change in control, which could require the Bank to consolidate the assets and liabilities of the conduits at fair value.
A significant portion of the conduits’ assets have been structured to receive credit enhancements from the sellers, including overcollateralizationprotection and cash reserve accounts. Each asset purchased by the conduits is supported by a backstop liquidity facility provided by the Bank in theform of a liquidity asset purchase agreement (LAPA). The primary purpose of the backstop liquidity facility is to provide an alternative source offinancing in the event the conduits are unable to access the commercial paper market. Under the terms of the LAPA, in most cases, the Bank is notobliged to purchase defaulted assets.
The Bank’s primary exposure to the Canadian-based conduits is the liquidity support provided, with total liquidity facilities of $5 billion as atOctober 31, 2017 (October 31, 2016 – $5.8 billion). The year-over-year decrease was due to normal business operations. As at October 31, 2017,total commercial paper outstanding for the Canadian-based conduits was $3.1 billion (October 31, 2016 – $4.4 billion) and the Bank held less than0.01% of the total commercial paper issued by these conduits. Table T35 presents a summary of assets purchased and held by the Bank’s twoCanadian multi-seller conduits as at October 31, 2017 and 2016, by underlying exposure.
All of the funded assets have at least an equivalent rating of AA– or higher based on the Bank’s internal rating program. Assets held in these conduitswere investment grade as at October 31, 2017. Approximately 83% of the funded assets have final maturities falling within three years, and theweighted-average repayment period, based on cash flows, approximates 1.4 years.
T35 Assets held by Scotiabank-sponsored Canadian-based multi-seller conduits
As at October 31 ($ millions)
2017 2016
Fundedassets(1)
Unfundedcommitments
Totalexposure(2)
Fundedassets(1)
Unfundedcommitments
Totalexposure(2)
Auto loans/leases $ 2,447 $ 464 $ 2,911 $ 3,168 $ 601 $ 3,769Trade receivables 161 649 810 131 618 749Canadian residential mortgages 519 756 1,275 1,081 194 1,275Equipment loans/leases – – – 21 – 21
Total(3) $ 3,127 $ 1,869 $ 4,996 $ 4,401 $ 1,413 $ 5,814
(1) Funded assets are reflected at original cost, which approximates estimated fair value.(2) Exposure to the Bank is through global-style liquidity facilities.(3) These assets are substantially sourced from Canada.
54 | 2 0 1 7 S C O T I A B A N K A N N U A L R E P O R T

MA
NA
GEM
ENT’S
DISC
USSIO
NA
ND
AN
ALY
SIS|
GR
OU
PFIN
AN
CIA
LC
ON
DIT
ION
Structured finance entities
The Bank has interests in structured finance entities used to assist corporate clients in accessing cost-efficient financing through their securitizationstructures. The Bank’s maximum exposure to loss from structured finance entities was $1,827 million as at October 31, 2017, (October 31, 2016 –$2,326 million). The change was primarily due to structures that matured during the year.
Other unconsolidated structured entities
The Bank sponsors unconsolidated structured entities including mutual funds, in which it has insignificant or no interest at the reporting date. TheBank is a sponsor when it is significantly involved in the design and formation at inception of the structured entity, and the Bank’s name is used by thestructured entity to create an awareness of the instruments being backed by the Bank’s reputation and obligation. The Bank also considers otherfactors, such as its continuing involvement and obligations to determine if, in substance, the Bank is a sponsor. For the year ended October 31, 2017,the Bank earned $2,021 million income from its involvement with the unconsolidated Bank-sponsored structured entities, a majority of which is fromBank-sponsored mutual funds (for the year ended October 31, 2016 – $1,968 million).
Securitizations
The Bank securitizes fully insured residential mortgage loans, Bank originated and others, through the creation of mortgage backed securities that aresold to Canada Housing Trust (CHT) and/or third party investors. The sale of such mortgages does not qualify for derecognition with the exception ofsocial housing mortgage pools. The outstanding amount of off-balance sheet securitized social housing pools was $1,264 million as at October 31,2017, compared to $1,237 million last year. The transferred mortgages sold to CHT and/or third party investors continue to be recognized on balancesheet along with the proceeds from sale treated as secured borrowings. More details have been provided in Note 13 to the consolidated financialstatements.
The Bank securitizes a portion of its Canadian lines of credit and credit card receivables (receivables) through two Bank-sponsored structured entities.The receivables are comprised of unsecured personal lines of credit, securitized through Hollis Receivables Term Trust II (Hollis), and personal and smallbusiness credit card receivables, securitized through Trillium Credit Card Trust II (Trillium). Hollis and Trillium issue Class A notes to third-party investorsand subordinated notes to the Bank, and the proceeds of such issuances are used to purchase co-ownership interests in the respective receivablesoriginated by the Bank. The sale of such co-ownership interests does not qualify for derecognition and therefore the receivables continue to berecognized on the Consolidated Statement of Financial Position. Recourse of the note holders is limited to the purchased co-ownership interests.During the year, no receivables were securitized through Hollis (2016 – nil) or Trillium (2016 – $1,242 million). As at October 31, 2017, theoutstanding subordinated notes issued by Hollis of $205 million (2016 – $297 million) and Trillium of $99 million (2016 – $99 million), both held bythe Bank, are eliminated on consolidation.
The Bank securitizes a portion of its Canadian auto loan receivables (receivables) through Securitized Term Auto Receivables Trust 2016-1, 2017-1 and2017-2 (START) Bank-sponsored structured entities. The START entities issue multiple series of Class A notes to third-party investors and subordinatednotes to the Bank, and the proceeds of such issuances are used to purchase discrete pools of retail indirect auto loan receivables from the Bank on afully serviced basis. The sale of such pools does not qualify for derecognition and therefore the receivables continue to be recognized on theConsolidated Statement of Financial Position. Recourse of the note holders is limited to the receivables. During the year, assets of $2,176 million weresecuritized through the START program (2016 – $740 million). As at October 31, 2017, the outstanding subordinated notes issued by the STARTentities of $178 million (2016 – $45 million), held by the Bank, are eliminated on consolidation.
Guarantees and other commitments
Guarantees and other commitments are fee-based products that the Bank provides to its customers. These products can be categorized as follows:
• Standby letters of credit and letters of guarantee. As at October 31, 2017, these amounted to $36 billion, compared to $35 billion last year. Theseinstruments are issued at the request of a Bank customer to secure the customer’s payment or performance obligations to a third party. The year-over-year increase reflects a general increase in customer activity and the impact of foreign currency translation;
• Liquidity facilities. These generally provide an alternate source of funding to asset-backed commercial paper conduits in the event a general marketdisruption prevents the conduits from issuing commercial paper or, in some cases, when certain specified conditions or performance measures arenot met;
• Indemnification contracts. In the ordinary course of business, the Bank enters into many contracts where it may indemnify contract counterpartiesfor certain aspects of its operations that are dependent on other parties’ performance, or if certain events occur. The Bank cannot estimate, in allcases, the maximum potential future amount that may be payable, nor the amount of collateral or assets available under recourse provisions thatwould mitigate any such payments. Historically, the Bank has not made any significant payments under these indemnities;
• Loan commitments. The Bank has commitments to extend credit, subject to specific conditions, which represent undertakings to make creditavailable in the form of loans or other financings for specific amounts and maturities. As at October 31, 2017, these commitments amounted to$186 billion, compared to $174 billion last year. The year-over-year increase is primarily due to an increase in business activity.
These guarantees and loan commitments may expose the Bank to credit or liquidity risks, and are subject to the Bank’s standard review and approvalprocesses. For the guaranteed products, the dollar amounts represent the maximum risk of loss in the event of a total default by the guaranteedparties, and are stated before any reduction for recoveries under recourse provisions, insurance policies or collateral held or pledged.
Fees from the Bank’s guarantees and loan commitment arrangements, recorded as credit fees in other income in the Consolidated Statement ofIncome, were $571 million in 2017, compared to $574 million in the prior year. Detailed information on guarantees and loan commitments isdisclosed in Note 34 to the consolidated financial statements.
2 0 1 7 S C O T I A B A N K A N N U A L R E P O R T | 55

MANAGEMENT’S DISCUSSION AND ANALYSIS
Financial InstrumentsGiven the nature of the Bank’s main business activities, financial instruments make up a substantial portion of the Bank’s financial position and areintegral to the Bank’s business. Assets that are financial instruments include cash resources, securities, securities purchased under resale agreements,loans and customers’ liability under acceptances. Financial instrument liabilities include deposits, acceptances, obligations related to securities soldunder repurchase agreements, obligations related to securities sold short, subordinated debentures and capital instrument liabilities. In addition, theBank uses derivative financial instruments for both trading and hedging purposes.
Financial instruments are generally carried at fair value, except for non-trading loans and receivables, certain securities and most financial liabilities,which are carried at amortized cost unless designated as fair value through profit and loss at inception.
Unrealized gains and losses on the following items are recorded in other comprehensive income:
• available-for-sale securities, net of related hedges,
• derivatives designated as cash flow hedges, and
• net investment hedges.
Gains and losses on available-for-sale securities are recorded in the Consolidated Statement of Income when realized. Gains and losses on cash flowhedges and net investment hedges are recorded in the Consolidated Statement of Income when the hedged item affects income.
All changes in the fair value of derivatives, including embedded derivatives that must be separately accounted for, are recorded in the ConsolidatedStatement of Income, other than those designated as cash flow and net investment hedges which flow through other comprehensive income. TheBank’s accounting policies for derivatives and hedging activities are further described in Note 3 to the consolidated financial statements.
Interest income and expense on non-trading interest-bearing financial instruments are recorded in the Consolidated Statement of Income as part ofnet interest income. Credit losses resulting from loans are recorded in the provision for credit losses. Interest income and expense, as well as gains andlosses, on trading securities and trading loans are recorded in other operating income – trading revenues. Realized gains and losses and write-downsfor impairment on available-for-sale debt or equity instruments are recorded in net gain on investment securities within other operating income.
Several risks arise from transacting financial instruments, including credit risk, liquidity risk, operational risk and market risk. The Bank manages theserisks using extensive risk management policies and practices, including various Board-approved risk management limits.
A discussion of the Bank’s risk management policies and practices can be found in the Risk Management section on pages 58 to 94. In addition,Note 35 to the consolidated financial statements presents the Bank’s exposure to credit risk, liquidity risk and market risks arising from financialinstruments as well as the Bank’s corresponding risk management policies and procedures.
There are various measures that reflect the level of risk associated with the Bank’s portfolio of financial instruments. For example, the interest rate riskarising from the Bank’s financial instruments can be estimated by calculating the impact of a 100 basis point increase or decrease in interest rates onannual income, and the economic value of shareholders’ equity, as described on page 78. For trading activities, Table T46 discloses the averageone-day Value at Risk by risk factor. For derivatives, based on the Bank’s maturity profile of derivative instruments, only 17% (2016 – 16%) had a termto maturity greater than five years.
Note 9 to the consolidated financial statements provides details about derivatives used in trading and hedging activities, including notional amounts,remaining term to maturity, credit risk and fair values.
The fair value of the Bank’s financial instruments is provided in Note 6 to the consolidated financial statements along with a description of how theseamounts were determined.
The fair value of the Bank’s financial instruments was favourable when compared to their carrying value by $1,678 million as at October 31, 2017(October 31, 2016 – favourable $2,148 million). This difference relates mainly to loan assets, deposit liabilities, subordinated debentures and otherliabilities. The year-over-year change in the fair value over carrying value arose mainly from changes in interest rates since origination. Fair valueestimates are based on market conditions as at October 31, 2017, and may not be reflective of future fair values. Further information on how fairvalues are estimated is contained in the section on critical accounting estimates.
Disclosures specific to certain financial instruments designated at fair value through profit and loss can be found in Note 8 to the consolidatedfinancial statements. These designations were made primarily to significantly reduce accounting mismatches.
56 | 2 0 1 7 S C O T I A B A N K A N N U A L R E P O R T

MA
NA
GEM
ENT’S
DISC
USSIO
NA
ND
AN
ALY
SIS|
GR
OU
PFIN
AN
CIA
LC
ON
DIT
ION
Selected Credit Instruments – Publically Known Risk Items
Mortgage-backed securities
Total mortgage-backed securities held in the Non-trading and Trading portfolios are shown in Table T36.
T36 Mortgage-backed securities
As at October 31Carrying value ($ millions)
2017 2016
Non-tradingportfolio
Tradingportfolio
Non-tradingportfolio
Tradingportfolio
Canadian NHA mortgage-backed securities(1) $ 1,810 $ 1,709 $ 1,591 $ 1,546Commercial mortgage-backed securities – 1 – 57Other residential mortgage-backed securities 461 – 521 –
Total $ 2,271 $ 1,710 $ 2,112 $ 1,603
(1) Canada Mortgage and Housing Corporation provides a guarantee of timely payment to NHA mortgage-backed security investors.
Collateralized debt obligations
Trading portfolio
The Bank held synthetic collateralized debt obligations (CDOs) in its trading portfolio as a result of structuring and managing transactions with clientsand other financial institutions. The remaining CDOs had matured during the fiscal year. As shown in Table T37 below, the Bank does not have anyCDO in its trading portfolios as at October 31, 2017.
T37 Collateralized debt obligations (CDOs)
2017 2016
As at October 31Outstanding ($ millions)
NotionalAmount
Positive/(negative)fair value
NotionalAmount
Positive/(negative)fair value
CDOs – sold protection $ – $ – $ 142 $ 4CDOs – purchased protection $ – $ – $ – $ –
Other
As at October 31, 2017, the Bank has insignificant exposure to highly leveraged loans awaiting syndication, auction-rate securities, Alt-A type loans,monoline insurance and investments in structured investment vehicles.
2 0 1 7 S C O T I A B A N K A N N U A L R E P O R T | 57

MANAGEMENT’S DISCUSSION AND ANALYSIS
RISK MANAGEMENTEffective risk management is fundamental to the success of the Bank,and is recognized as key in the Bank’s overall approach to strategymanagement. Scotiabank has a strong, disciplined risk culture wheremanaging risk is a responsibility shared by all of the Bank’s employees.
Risk Management FrameworkThe primary goals of risk management are to ensure that the outcomesof risk-taking activities are consistent with the Bank’s strategies and riskappetite, and that there is an appropriate balance between risk andreward in order to maximize shareholder value. Scotiabank’s Enterprise-Wide Risk Management Framework articulates the foundation forachieving these goals.
RiskGovernance
Risk AppetiteRisk Capacity
Risk Appetite StatementRisk Appetite Metrics
Roles and Responsibilities
Risk Management ToolsPolicies & Limits, Risk Measurement,
Monitoring & Reporting, Forward-Looking Exercises
Risks Identification and AssessmentPrincipal Risk Type:
FinancialNon-Financial
Credit, Market, Liquidity, Insurance,Operational, IT & Cybersecurity, Compliance, ML/TF,Environmental, Reputational, Strategic
Strong Risk Culture
The Bank’s risk management framework is applied on an enterprise-wide basis and consists of five key elements:
• Risk Governance
• Risk Appetite
• Risk Management Tools
• Risk Identification and Assessment
• Risk Culture
Risk Management PrinciplesRisk-taking and risk management activities across the enterprise are guided by the following principles:
Risk and Reward – business and risk decisions are consistent with strategies and risk appetite.
Understand the Risks – all material risks to which the Bank is exposed, including both financial and non-financial, are identified and managed.
Forward Thinking – emerging risks and potential vulnerabilities are proactively identified.
Shared Accountability – every employee is responsible for managing risk.
Customer Focus – understanding our customers and their needs is essential to all business and risk decision-making.
Protect our Brand – all risk taking activities must be in line with the Bank’s risk appetite, Code of Conduct, values and policy principles.
Compensation – performance and compensation structures reinforce the Bank’s values and promote sound risk taking behaviour.
Risk GovernanceEffective risk management begins with effective risk governance.
The Bank has a well-established risk governance structure, with an active and engaged Board of Directors supported by an experienced executivemanagement team. Decision-making is highly centralized through a number of senior and executive risk management committees.
The Bank’s risk management framework is predicated on the three-lines-of-defence model. Within this model,
• the First Line of Defence (typically comprised of the business lines and most corporate functions) incurs and owns the risks,
• the Second Line of Defence (typically comprised of control functions such as Global Risk Management, Global Compliance, Global AML/ATF andGlobal Finance) provides independent oversight and objective challenge to the First Line of Defence, as well as monitoring and control of risk, and
• the Third Line of Defence (Internal Audit) provides enterprise-wide independent assurance over the design and operation of the Bank’s internalcontrol, risk management and governance processes throughout the first and second lines of defence.
58 | 2 0 1 7 S C O T I A B A N K A N N U A L R E P O R T

MA
NA
GEM
ENT’S
DISC
USSIO
NA
ND
AN
ALY
SIS|
RISK
MA
NA
GE
ME
NT
In this risk governance structure, employees in every area of the organization are responsible for risk management.
• Own the risks generated by their activities, which may be financial (e.g. credit, market) or nonfinancial (e.g. operational, reputational)
• Design and execute internal controls
• Ensure the risks generated are identified, assessed, managed and monitored, are within risk appetite, and are in compliance with relevant policies, guidelines and limits
• Assist Risk Owners in Identifying, assessing, monitoring, reporting, and responding to risks
• Assist Risk Owners in implementing risk management initiatives, and establishing risk governance, internal controls, and reporting frameworks
• Establish risk appetite, risk limits, policies and frameworks, in accordance with best practice and regulatory requirements
• Measure, monitor and report on risks taken in relation to limits and risk appetite, and on emerging risks
• Must be independent of the first line to be able to perform its function in an objective manner
• Provide reasonable assurance to senior management and the Board that the first and second lines of defence are effectively managing and controlling risks.
• Focus on governance frameworkand control systems.
All employees are, for some of their activities, Risk Owners (1A), as all employees are capable of generating reputational and operational risks in their day to day activities, and must be held accountable for owning and managing these risks.
BOARD OF DIRECTORS
THREE LINES OF DEFENCE
Board of DirectorsCommittees
President and Chief Executive Officer
Executive Management Team andExecutive & Senior Management Committees
ImportantNote:
Independent Assurance3Risk Owner’s Oversight2Risk Owners’ Support1BRisk Owners1A
The Board of Directors: as the top of the Bank’s risk management governance structure, provides oversight, either directly or through its committees,to satisfy itself that decision making is aligned with the Bank’s strategies and risk appetite. The Board receives regular updates on the key risks of theBank – including a quarterly comprehensive summary of the Bank’s risk profile and performance of the portfolio against defined limits – and approveskey risk policies, limits, the Enterprise Risk Appetite Framework.
The Risk Committee of the Board: assists the Board by providing oversight to the risk management, compliance and anti-money laundering/anti-terrorist finance functions at the Bank. This includes periodically reviewing and approving the Bank’s key risk management policies, frameworks andlimits and satisfying itself that management is operating within the Bank’s Enterprise Risk Appetite Framework. The Committee also oversees theindependence of each of these functions, including the effectiveness of the heads of these functions, as well as the functions themselves.
Audit Committee of the Board: assists the Board by providing oversight on the effectiveness of the Bank’s system of internal controls. The Committeeoversees the integrity of the Bank’s consolidated financial statements and related quarterly results. The Committee oversees the external auditor’squalifications, independence and performance, and oversees the Global Finance and Audit functions at the Bank.
Human Resources Committee of the Board: in conjunction with the Risk Committee of the Board, satisfies itself that adequate procedures are in placeto identify, assess and manage the risks associated with the Bank’s material compensation programs and that such procedures are consistent with theBank’s risk management programs. The Committee has further responsibilities relating to leadership, succession planning and total rewards.
Corporate Governance Committee of the Board: acts in an advisory capacity to the Board to enhance the Bank’s corporate governance through acontinuing assessment of the Bank’s approach to corporate governance and makes policy recommendations. The Committee is responsible for theBoard succession plan, and for reviewing the Bank’s corporate social responsibility strategy and reporting.
President and Chief Executive Officer (CEO): reports directly to the Board and is responsible for defining, communicating and implementing thestrategic direction, goals and core values for Scotiabank that maximize long term shareholder value. The CEO oversees the establishment of the Bank’srisk appetite, in collaboration with the CRO and CFO, which is consistent with the Bank’s short and long term strategy, business and capital plans, aswell as compensation programs.
Chief Risk Officer (CRO): reports to the CEO and is responsible for the overall management of Global Risk Management, Global Compliance andGlobal AML/ATF. The CRO and the heads of Global Compliance and Global AML/ATF also have unfettered access to the Risk Committee of the Boardto ensure their independence. As a senior member of the Bank’s executive management team, the CRO participates in strategic decisions related towhere and how the Bank will deploy its various sources of capital to meet the performance targets of the business lines and the Bank’s BalancedScorecard.
2 0 1 7 S C O T I A B A N K A N N U A L R E P O R T | 59

MANAGEMENT’S DISCUSSION AND ANALYSIS
Global Risk Management (GRM): supports the Bank’s objectives and is mandated to maintain an ongoing and effective enterprise-wide riskmanagement framework that resonates through all levels of the Bank. GRM is responsible for providing reasonable assurance to executivemanagement, the Board of Directors and shareholders that risks are actively identified, managed and communicated to all key stakeholders. This isachieved through reliable and timely reporting. GRM’s mission is to ensure that the outcomes of risk taking activities are consistent with the Bank’sstrategies and risk appetite, and that there is an appropriate balance between risk and reward in order to maximize shareholder value.
Global Compliance: on an enterprise-wide basis, promotes and reports on ethical conduct and compliance generally throughout Scotiabank. GlobalCompliance provides independent oversight and effective challenge of compliance risk management in the Bank’s business lines and corporatefunctions and acts as a consultant and educator on regulatory and internal policies and procedures. It is responsible for conducting ongoing risk-based, enterprise-wide risk assessment, monitoring and testing and other activities to gain reasonable assurance as to the effectiveness of compliancecontrols.
Global AML/ATF: on an enterprise-wide basis, develops standards to be followed in effectively controlling money laundering, terrorist financing, andsanctions risks. Global AML/ATF is responsible for maintaining the program current with the Bank’s needs, industry practice, and AML/ATF andsanctions legal and regulatory requirements, as well as providing risk-based independent oversight of the Bank’s compliance with these requirementsand standards.
Global Finance: leads enterprise-wide financial strategies which support the Bank’s ability to maximize sustainable shareholder value, and activelymanages the reliable and timely reporting of financial information to management, the Board of Directors and shareholders, regulators, as well asother stakeholders. This reporting includes the Bank’s consolidated financial statements and related quarterly and annual results, as well as financialregulatory filings. Global Finance executes the Bank’s financial and capital management strategies with appropriate governance and control, whileensuring its processes are efficient and effective.
Internal Audit: reports independently to the Board through the Audit Committee of the Board on the design and operating effectiveness of the Bank’srisk governance and risk management framework. The mission of the audit department is to provide enterprise-wide independent, objective assuranceover the design and operation of the Bank’s controls and operational processes and to provide advisory services designed to improve the Bank’soperations.
Business Line and Corporate Functions: as the first line of defence in the Three Lines of Defence model, are accountable for effective management ofthe risks within their business lines and functions through identifying, assessing, mitigating and monitoring the risks. Business lines and corporatefunctions actively implement effective internal controls to manage risk and maintain activities within risk appetite and policies. Further, business lineshave processes to be able to effectively identify, monitor and report against allocated risk appetite limits.
Risk AppetiteEffective risk management requires clear articulation of the Bank’s risk appetite and how the Bank’s risk profile will be managed inrelation to that appetite.
The Bank’s Enterprise Risk Appetite Framework (Enterprise RAF)articulates the amount and types of risk the Bank is willing to take inorder to meet its strategic objectives. The Enterprise RAF consists of theidentification of the risk capacity, the risk appetite statement, the riskappetite metrics and roles and responsibilities. Together, theapplication of these components helps to ensure the Bank stays withinappropriate risk boundaries, finds an optimal balance between risk andreturn, and assists in nurturing a healthy risk culture.
Scotiabank’s risk appetite is integrated into the strategic and capitalplanning process and is reviewed annually by senior management whorecommend it to the Board for approval. Business lines, controlfunctions and select business units develop their own risk appetiteframeworks and/or statements, which are aligned with the Bank’sEnterprise RAF.
Roles andResponsibilities
RiskAppetiteMetrics
RiskAppetite
Statement
RiskCapacity
RiskAppetite
Framework
Risk Appetite Statement
The Bank’s Risk Appetite Statement can be summarized as follows:
1. The Bank favours businesses that generate sustainable, consistent and predictable earnings.
2. The Bank expects to take certain risks in order to generate earnings, but sets limits to ensure risk taking activities are in line with the Bank’s strategicobjectives, risk culture, and risk appetite.
3. The Bank limits its risk-taking activities to those that are well understood and where there is sufficient expertise, resources and infrastructure toeffectively measure and manage the risk and balance risk with reward.
60 | 2 0 1 7 S C O T I A B A N K A N N U A L R E P O R T

MA
NA
GEM
ENT’S
DISC
USSIO
NA
ND
AN
ALY
SIS|
RISK
MA
NA
GE
ME
NT
4. Capital considerations are part of all material risk decisions.
5. The Bank has low appetite for reputational, legal, regulatory or taxation risk, and no appetite for breaches of the Code of Conduct.
6. All employees of the Bank are responsible for understanding the limits and any other boundaries that apply to their activities.
Risk Appetite Metrics
Risk appetite metrics provide clear risk limits, which are critical in implementing effective risk management. For major risks the key risk appetite metricsare supported by management level limit structures and controls, as applicable.
Other components of Scotiabank’s risk appetite metrics:
• Set risk capacity and appetite in relation to regulatory constraints
• Use stress testing to provide forward-looking metrics
• Ensure Scotiabank’s credit rating remains strong
• Minimize earnings volatility
• Limit exposure to operational events that can have an impact on earnings, including regulatory fines
• Ensure reputational risk is top of mind and strategy is being executed within established operating parameters
Risk Management ToolsEffective risk management includes tools that are guided by the Bank’s Enterprise Risk Appetite Framework and integrated with theBank’s strategies and business planning processes.
Scotiabank’s risk management framework is supported by a variety of risk management tools that are used together to manage enterprise-wide risks.Risk management tools are regularly reviewed and updated to ensure consistency with risk-taking activities, and relevance to the business andfinancial strategies of the Bank.
Policies & Limits
Policies
The Bank develops and implements its key risk policies in consultation with the Board. Such policies (which include appetites and frameworks) are alsosubject to the requirements and guidelines of the Office of the Superintendent of Financial Institutions (OSFI), the Bank Act, and the Canada DepositInsurance Corporation (CDIC). Policy development and implementation reflect best governance practices which the Bank strives to adhere to at alltimes. The Bank also provides advice and counsel to its subsidiaries in respect of their risk policies to ensure alignment with the Bank’s policies, subjectto the local regulatory requirements of each subsidiary.
Policies apply to specific types of risk or to the activities that are used to measure and control risk exposure. They are based on recommendations fromrisk management, internal audit, business lines, and senior and executive management. Industry best practices and regulatory requirements are alsofactored into the policies. Policies are guided by the Bank’s risk appetite, and set the limits and controls within which the Bank and its subsidiaries canoperate. Key risk policies are supported by manuals, procedures and guidelines.
Limits
Limits control risk-taking activities within the appetite and tolerances established by the Board and executive management. Limits also establishaccountability for key tasks in the risk-taking process and establish the level or conditions under which transactions may be approved or executed.
Risk Measurement
Models
The use of quantitative risk methodologies and models is balanced by a strong governance framework and includes the application of sound andexperienced judgment. The development, independent review, and approval of models are subject to formalized policies such as the Model RiskManagement Policy and oversight of senior management committees such as the Model Review Committee (for market risk, counterparty credit risk,and liquidity risk models). Key models used in the calculation of credit and market risk regulatory capital on an enterprise basis are OSFI approved.These models are incorporated into the Bank’s framework for governance and control of model risk to ensure that they continue to perform in linewith regulatory requirements. The Bank uses models for a range of purposes including:
• valuing transactions,
• measuring risk exposures,
• determining credit risk ratings and parameters,
• calculating internal economic and regulatory capital, and
• calculating expected credit risk loss.
Monitoring and Reporting
The Bank continuously monitors its risk exposures to ensure business activities are operating within approved limits or guidelines, and the Bank’sstrategies and risk appetite. Breaches, if any, of these limits or guidelines are reported to senior management and/or the Board depending on the limitor guideline.
Risk Reports aggregate measures of risk across products and businesses, and are used to ensure compliance with risk policies, limits, and guidelines.They also provide a clear statement of the amounts, types, and sensitivities of the various risks in the portfolio. Senior management and the Board usethis information to understand the Bank’s risk profile and the performance of the portfolios. A comprehensive summary of the Bank’s risk profile andperformance of the portfolio is presented quarterly to the Board of Directors.
2 0 1 7 S C O T I A B A N K A N N U A L R E P O R T | 61

MANAGEMENT’S DISCUSSION AND ANALYSIS
Forward-Looking Exercises
Stress Testing
Stress testing programs at both the enterprise-wide level and individual risk level allow the Bank to estimate the potential impact on the Bank’sincome and capital as a result of significant changes in macroeconomic conditions, credit environment, liquidity demands, and/or other risk factors.Enterprise-wide stress testing is also integrated with both the strategic and financial planning processes, as well as crisis management planning. Thedevelopment, approval and on-going review of the Bank’s stress testing programs are subject to policy, and the oversight of the Stress Testing andCredit Loss Models Committee or other management committees as appropriate. Where appropriate, the Board of Directors or the Risk Committee ofthe Board approves stress testing limits for certain risk factors, and receives reports on performance regularly. Each program is developed with inputfrom a broad base of stakeholders, and results are integrated into management decision making processes for capital, funding, market risk limits, andcredit risk appetite. The stress testing programs are designed to capture a number of stress scenarios with varied severities, scopes and time horizons.
Other Testing
Other tests are conducted as may be required at the enterprise-wide level and within specific functional areas to test the decision making processes ofthe Executive Management team and key personnel, by simulating a potential stress scenario. Simulated stress scenarios may include a number ofcomplexities and disruptions through which Executive Management are engaged to make certain key decisions. Generally, the objectives of thesimulations can include testing (1) the executability of activation protocols, (2) operational readiness, (3) the flexibility of the executive decision makingprocess, and (4) the process by which actions to be taken are prioritized. The exercises may also be designed to test the applicability and relevance ofavailable data and the timeliness of reporting for decision making under stressed/crisis conditions.
Risk Identification and AssessmentEffective risk management requires a comprehensive process to identify risks and assess their materiality.
Principal Risk Types
The Bank’s principal risk types are reviewed regularly to ensure they adequately reflect the Bank’s risk profile. The principal risks can be categorizedinto two main categories:
Financial Risks:
Credit, Market, Liquidity, Insurance
These are risks that the Bank understands well and takes on in order to generate sustainable and predictable earnings. Financial risks are generallyquantifiable using widely accepted methodologies and are relatively predictable. The Bank has higher risk appetite for financial risks which areconsidered to be a fundamental part of doing business; but only when they are well understood, within established limits, and meet the desired riskand return profile.
Non-Financial Risks:
Operational, IT & Cybersecurity, Compliance, ML& TF, Environmental, Reputational, Strategic
These are risks that are inherent in our business and must be managed to reduce potential losses. In comparison to financial risks, non-financial risksare less predictable and more difficult to define and measure. If not managed properly, these risks can lead to significant financial losses. The Bank haslow risk appetite for non-financial risks and reduces these risks through internal controls and procedures, and continued investments to enhance theseinternal controls and procedures.
Assessment of Risks
On a regular basis, the Bank undergoes a Bank-wide risk assessment that measures the materiality of all risks to the Bank. This process evaluates eachrisk and determines the pervasiveness of the risk across multiple business lines, the significance of the risk to a specific business line, the likelihood andpotential impact of the risk and whether the risk may cause unexpected losses in income. The process also reviews other evolving and emerging risksand includes qualitative considerations. The identified risks are ascribed a rating of how probable and impactful they may be and used as an importantinput in the Internal Capital Adequacy Assessment Process (ICAAP) and the determination of Internal Capital.
Top and Emerging Risks
The Bank is exposed to a variety of top and emerging risks. These risks can potentially adversely affect the Bank’s business, financial performance,reputation, and business strategies. As part of our risk management approach, we proactively identify, assess, review, monitor and manage a broadrange of top and emerging risks so that appropriate risk mitigation strategies can be taken. Every quarter, selected top and emerging risks arepresented to Senior Management and the Board of Directors.
Other Considerations
Risk identification and assessment is performed on an ongoing basis through the following:
• Transactions – risks, including credit and market exposures, are assessed by the business lines and reviewed by GRM, as applicable.
• Monitoring – risks are identified by constantly monitoring and reporting current trends and analysis.
• New Products and Services – new products and services are assessed for potential risks through a standardized process.
• Strategic Investments – investment transactions are thoroughly reviewed for risks and are approved by the Strategic Transactions and InvestmentCommittee (STIC) who provides advice & counsel and decisions on effective allocation and prioritization of resources.
62 | 2 0 1 7 S C O T I A B A N K A N N U A L R E P O R T

MA
NA
GEM
ENT’S
DISC
USSIO
NA
ND
AN
ALY
SIS|
RISK
MA
NA
GE
ME
NT
Risk CultureEffective risk management requires a strong, robust, and pervasive risk management culture where every Bank employee is a riskmanager and is responsible for managing risks.
The Bank’s risk culture is influenced by numerous factors including the interdependentrelationship amongst the Bank’s risk governance structure, risk appetite, strategy,organizational culture, and risk management tools.
The Bank’s risk culture is supported through the following foundational elements:
1. Tone from the Top – Clear and consistent communication from leaders on risk behaviorexpectations and the importance of Scotiabank’s values.
2. Accountability – All Scotiabankers are accountable for risk management in accordancewith the Three Lines of Defence model.
3. Incentives – Performance and compensation structures encourage desired behaviors andreinforce the Bank’s risk culture.
4. Effective Challenge – Scotiabankers are encouraged to have a critical attitude –transparency and open dialogue is promoted.
Other elements that influence and support the Bank’s risk culture:
• Code of Conduct: describes the standard of behaviour to which all employees mustattest on an annual basis.
• Values: Integrity – Act With Honour; Respect – Value Every Voice; Accountability – MakeIt Happen; Passion – Be Your Best.
RiskCulture
RiskGovernance
Risk AppetiteRisk
ManagementTools
OrganizationalCulture
Strategy
• Communication: the Bank actively communicates risk appetite, and how it relates to Scotiabankers, to promote a sound risk culture.
o Reputation is everything,
o Information is key,
o Success depends on you,
o Know your boundaries.
• Compensation: programs are structured to discourage behaviours that are not aligned with the Bank’s values and Code of Conduct, and ensurethat such behaviors are not rewarded.
• Training: risk culture is continually reinforced by providing effective and informative mandatory and non-mandatory training modules for allemployees on a variety of risk management topics.
• Decision-making on risk issues is highly centralized: the flow of information and transactions to senior and executive committees keepsmanagement well informed of the risks the Bank faces, and ensures that transactions and risks are aligned with the Bank’s risk appetite.
• Executive Mandates: all Executives across the Bank have risk management responsibilities within their mandates.
2 0 1 7 S C O T I A B A N K A N N U A L R E P O R T | 63

MANAGEMENT’S DISCUSSION AND ANALYSIS
Principal Risk Types
Risk Type Key Governing Documentation Ways that they support Risk Appetite
Credit Risk Credit Risk Policy
Credit Risk Appetite
Residential Mortgage UnderwritingPolicy
Quantitative limits, such as: Credit Risk Appetite limits at the all-Bank level andBusiness Line level; Exposure to a single counterparty or group of related parties;Country risk; and Industry concentrations.
Market Risk Market and Structural RiskManagement Policy
Quantitative limits, such as: Value at Risk (VaR); Stress test results; Debt investmentexposures; and Structural interest rate and foreign exchange exposures.
Liquidity Risk Liquidity Risk and CollateralManagement Policy
Quantitative limits, such as: Liquidity Coverage Ratio (LCR); Appropriate levels ofhigh quality liquid assets that can be readily sold or pledged; Limits to control themaximum net cash outflow over specified short-term horizon; and Diversificationamongst funding source.
Insurance Risk Insurance Risk Policy
Insurance Risk ManagementFramework
Where insurance risks are taken, it is on a selective basis to achieve stable andsustainable earnings; and the risk assumed is diversified geographically and byproduct. Quantitative limits, such as Insurance Earnings at Risk metrics areincluded in the Bank’s Risk Appetite Statement.
Operational Risk Operational Risk ManagementPolicy and Framework
Internal Control Policy
New Initiative Risk ManagementPolicy
Third Party Risk Management Policy
Operational risk appetite expresses how much residual risk the Bank is willing totolerate and is expressed quantitatively by an aggregate loss event limit, a singleevent loss limit, and a variety of limits for individual categories of operationalrisk.
InformationTechnology &Cybersecurity Risk
IT Risk Management Policy andFramework
Information Security Policy
Information Security GovernanceFramework
Common Security Standards
The Bank has established minimum expectations and requirements for thesystematic identification, measurement, mitigation and monitoring of IT andCybersecurity risk, including requirements for the protection of informationthroughout its lifecycle.
Compliance Risk Compliance Policy
Code of Conduct
The Bank has very little appetite for losses due to lack of regulatory compliance.Compliance risk is expressed by an all-Bank residual compliance risk rating,which is based on current Compliance Risk & Control Assessment results.
MoneyLaundering &Terrorist Financing(ML/TF) Risk
AML/ATF and Sanctions Policy
AML/ATF and Sanctions Handbook
The Bank has no appetite for entering into relationships with businesses orindividuals engaged in illegal activities, or with businesses engaged in improper,quasi-legal, or inappropriate activities.
Reputational Risk Reputational Risk Policy Low appetite for reputational, legal, or taxation risk arising in business activities,initiatives, products, services, transactions or processes, or from a lack ofsuitability of products for clients.
Environmental Risk Environmental Policy The Bank has policies and procedures in place to ensure that it provides loans toborrowers that demonstrate an ability and willingness to practice soundenvironmental risk management.
Strategic Risk Annual Strategy Report to theBoard of Directors
Strategy report considers linkages between the Bank’s Enterprise Risk AppetiteFramework with the enterprise strategy, business line strategies and corporatefunction strategies.
64 | 2 0 1 7 S C O T I A B A N K A N N U A L R E P O R T

MA
NA
GEM
ENT’S
DISC
USSIO
NA
ND
AN
ALY
SIS|
RISK
MA
NA
GE
ME
NT
T38 Exposure to risks arising from the activities of the Bank’s businesses
The Bank
OtherCanadianBanking
BusinessLines
BusinessActivities
• RWA $120.3bn• Proportion of Bank 32%
Comprised of:• Credit risk 85%• Market risk –%• Operational risk 15%
Risk-Weighted
Assets(4)
Credit, market, liquidity, operational, reputational, environmental, strategic and insurance risk.
• Deposits
• Accounts services
• Credit and lending
• Commercial banking
• Payments and cashmanagement
• Advisory services
• Asset management
• Insurance – creditor,life, home, health,auto, and travel
• Online brokerage
• Group treasury
• Other controlfunctions
Balance Sheet
• Average assets $323bn • Average assets(1) $106bn
AttributedCapital(2)
• Attributed Capital $17.6bn• Proportion of Bank 38%
Comprised of: • Credit risk 47%• Market risk 0%• Operational risk 9%• Other(3) 44%
InternationalBanking
• RWA $134.0bn• Proportion of Bank 36%
Comprised of:• Credit risk 88%• Market risk 1%• Operational risk 11%
• Average assets $148bn
• Deposits
• Accounts services
• Credit and lending
• Commercial banking
• Payments and cashmanagement
• Advisory services
• Asset management
• Insurance – creditor,life, home, health,auto, and travel
• Attributed Capital $16.0bn• Proportion of Bank 34%
Comprised of: • Credit risk 57%• Market risk 1%• Operational risk 8%• Other(3) 34%
• Attributed Capital $2.1bn• Proportion of Bank 4%
Comprised of: • Credit risk 54%• Market risk 3%• Operational risk -2%• Other(3) 45%
• RWA $21.9bn• Proportion of Bank 5%
Comprised of:• Credit risk 37%• Market risk 7%• Operational risk –2%• Other(5) 58%
Global Bankingand Markets
• RWA $100.2bn• Proportion of Bank 27%
Comprised of:• Credit risk 87%• Market risk 5%• Operational risk 8%
• Average assets $336bn
• Attributed Capital $11.2bn• Proportion of Bank 24%
Comprised of: • Credit risk 73%• Market risk 4%• Operational risk 7%• Other(3) 16%
• Deposits
• Account services
• Corporate lending
• Equity and debtunderwriting
• M&A advisory services
• Capital marketsproducts & services
• Foreign exchange
• Precious metals
• Payment and cashmanagement
(1) Average assets for the Other segment include certain non-earning assets related to the business lines.(2) Attributed Capital is a combination of regulatory: (i) Risk-based capital and (ii) Leverage capital. Attributed Capital is reported on a quarterly average basis.(3) Includes Attributed Capital for significant investments, goodwill, intangibles and Basel I capital floor adjustments.(4) Risk-weighted assets (RWA) are as at October 31, 2017 as measured for regulatory purposes in accordance with the Basel III all-in approach.(5) Includes Basel I capital floor adjustments.
2 0 1 7 S C O T I A B A N K A N N U A L R E P O R T | 65

MANAGEMENT’S DISCUSSION AND ANALYSIS
Top and emerging risks
The Bank is exposed to a variety of top and emerging risks. These risks can potentially adversely affect the Bank’s business strategies, financialperformance, and reputation. As part of our risk management approach, we proactively identify, assess, review, monitor and manage a broad rangeof top and emerging risks and undertake appropriate risk mitigation strategies. Every quarter, a listing and a brief discussion of selected top andemerging risks is presented to Senior Management and the Board of Directors.
The Bank’s top and emerging risks are as follows:
Geopolitical risk
Geopolitical risks could affect volatility in foreign exchange and capital markets globally. This affects all participants in these markets. In the short run,a market shock could potentially impact the Bank’s trading and non-trading market activities and revenues. Over a longer period of time, the morebroadly based macroeconomic effects could potentially impact the Bank’s exposures to customers and market segments impacted by those shocks.Although it is difficult to predict where new geopolitical disruption will occur, the Bank’s stress testing program assists in evaluating the potentialimpact of severe conditions, whether caused by geopolitical or other circumstances. Management’s strong understanding of the local politicallandscapes and macroeconomic environments in which the Bank operates, combined with the Bank’s business model and diversified geographicfootprint, serve as ongoing mitigants to this risk.
Legal and regulatory compliance risk
The Bank is subject to extensive regulation in the jurisdictions in which it operates. Although the Bank continually monitors and evaluates the potentialimpact of regulatory developments to assess the impact on our businesses and to implement any necessary changes, regulators and private partiesmay challenge our compliance. Failure to comply with legal and regulatory requirements may result in fines, penalties, litigation, regulatory sanctions,enforcement actions and limitations or prohibitions from engaging in business activities, all of which may negatively impact the Bank’s financialperformance and its reputation. In addition, day-to-day compliance with existing laws and regulations has involved and will continue to involvesignificant resources, including requiring the Bank to take actions or incur greater costs than anticipated, which may negatively impact the Bank’sfinancial performance. Such changes could also adversely impact the Bank’s business strategies or limit its product or service offerings, or enhance theability of the Bank’s competitors to offer their own products and services that rival the Bank’s.
Anti-money laundering
Money laundering and terrorist financing are receiving significant attention as nations attempt to deal with the harmful legal, economic, and socialconsequences of illegal activities. Governments, law enforcement agencies, and regulators around the world employ a variety of means, includingestablishing regulatory requirements on financial institutions, to curtail the ability of criminal and terrorist elements to profit from, or finance, theiractivities. It is widely recognized that financial institutions are uniquely positioned and possess the necessary infrastructure to assist in the fight againstmoney laundering, terrorist financing, and criminal activity through prevention, detection, and the exchange of information.
Money laundering, terrorist financing and economic sanctions violations represent regulatory, legal, financial and reputational risk to the Bank.Scotiabank is subject to a number of expanding and constantly evolving anti-money laundering/anti-terrorist financing (AML/ATF) and economicsanctions, laws and regulations internationally given the Bank’s global footprint.
The Bank is committed to sustaining secure financial systems in the countries around the world in which it maintains operations by taking thenecessary action, using a risk-based approach. The Bank’s AML program includes policies and internal controls with respect to client identification anddue diligence, transaction monitoring, investigating and reporting of suspicious activity, and evaluation of new products and services to prevent and/ordetect activities that may pose AML risk to the Bank. The AML program also facilitates an annual enterprise-wide AML/ATF risk assessment processand ensures that all employees, including the Board of Directors, undergo initial and ongoing AML/ATF training.
Technology, information and cyber security risk
Technology, information and cyber security risks continue to impact financial institutions and other businesses in Canada and around the globe.Threats are not only increasing in volume but in their sophistication as adversaries use ever evolving technologies and attack methodologies. Thetechnology environment of the Bank, its customers and the third parties providing services to the Bank, may be subject to attacks, breaches or othercompromises. Incidences like these can result in disruption to operations, misappropriation or unauthorized release of confidential, financial orpersonal information, and reputational damage, among other things. The Bank proactively monitors and manages the risks and constantly updatesand refines programs as threats emerge to minimize disruptions and keep systems and information protected. In addition, the Bank has purchasedinsurance coverage to help mitigate against certain potential losses associated with cyber incidents.
Technology innovation and disruption
Fast evolving technology innovation continues to impact the financial services industry and its customers. Increasingly, non-traditional new participantsare entering certain segments of the market and challenge the position of traditional financial institutions. New participants may use advancedtechnologies and analytical tools to innovate at an accelerating speed which has the potential to impact revenues and costs in certain of the Bank’sbusinesses. In response to increased customer demands, needs and expectations, the Bank has embarked on a multi-year digital transformation withthe aspiration to be a digital leader in the financial services industry. To support this strategy the Bank has opened digital factories in Toronto and itskey international markets in Mexico, Peru, Chile and Colombia. These factories contribute to financial innovation through partnerships with smallerfinancial technology companies. In addition, the Bank makes material investments in skills training and education through various digital partnershipswith Canadian universities and other organizations.
Canadian consumer indebtedness
Canadian household indebtedness has outpaced growth in disposable income in recent quarters fueled by low interest rates and stable nationalemployment levels. In such an environment, an upward trend in mortgage credit growth and strong home sales contributed to higher consumerindebtedness. In light of these trends, multiple levels of government implemented new legislation to introduce additional safeguards to the housingmarket. These include the foreign buyer tax in British Columbia and Ontario, as well as changes on a national basis to tighten origination criteria forinsured mortgages. The Bank actively manages its lending portfolios and stress tests them against various scenarios. For further discussion relating toour retail portfolio, refer to the Credit Risk Summary section.
66 | 2 0 1 7 S C O T I A B A N K A N N U A L R E P O R T

MA
NA
GEM
ENT’S
DISC
USSIO
NA
ND
AN
ALY
SIS|
RISK
MA
NA
GE
ME
NT
Credit Risk
Credit risk is the risk of loss resulting from the failure of a borrower or counterparty to honour its financial or contractual obligations tothe Bank. Credit risk arises in the Bank’s direct lending operations, and in its funding, investment and trading activities wherecounterparties have repayment or other obligations to the Bank. Credit risk includes settlement risk, suitability risk and wrong way risk.
Index of all credit risk disclosures
Page Tables and charts Page
Credit risk summary 68
Credit Risk Management Framework
Risk measures 68
Corporate and commercial 68
Risk ratings 68
Adjudication 69
Credit Risk Mitigation-Collateral/Security 69
Traditional Non-Retail Products 69
Commercial/Corporate Real Estate 69
Traded products 70
Credit Risk Mitigation-Collateral/Security 70
Retail 70
Adjudication 70
Risk ratings 70
Credit Risk Mitigation-Collateral/Security 70
Credit Quality 71 T3 Financial highlights 15
Impaired loans 71 T11 Provision for credit losses as a percentage of average loans and acceptances 22
Allowance for credit losses 71 T12 Net charge-offs as a percentage of average loans and acceptances 22
T60 Gross impaired loans by geographic segment 107
T61 Provision against impaired loans by geographic segment 107
T62 Cross-border exposure to select countries 107
T63 Loans and acceptances by type of borrower 108
T64 Off-balance sheet credit instruments 108
T65 Changes in net impaired loans 109
T66 Provision for credit losses 109
T67 Provision for credit losses against impaired loans by type of borrower 110
T68 Impaired loans by type of borrower 110
T69 Total credit risk exposures by geography 111
T70 AIRB credit risk exposures by maturity 111
T71 Total credit risk exposures and risk-weighted assets 112
Analysis of the aggregate credit risk exposure including market risk exposure,
assets of the Bank’s insurance subsidiaries and other assets that fully reconciles to
the balance sheet (refer Note 35 – Financial instruments – risk management in the
consolidated financial statements) 200
Acquisition-related purchased loans 72
Portfolio review 72
Risk diversification 72 C24 Well diversified in Canada and internationally – loans and acceptances 73
C25 and in household and business lending – loans and acceptances 73
T59 Loans and acceptances by geography 106
Risk mitigation 72
Real estate secured lending 73 T43 Bank’s exposure distribution by country 74
Loans to Canadian condominium developers 74 Indirect exposures 74
European exposures 74
Financial instruments 56 T36 Mortgage-backed securities 57
T37 Collateralized debt obligations (CDOs) 57
2 0 1 7 S C O T I A B A N K A N N U A L R E P O R T | 67
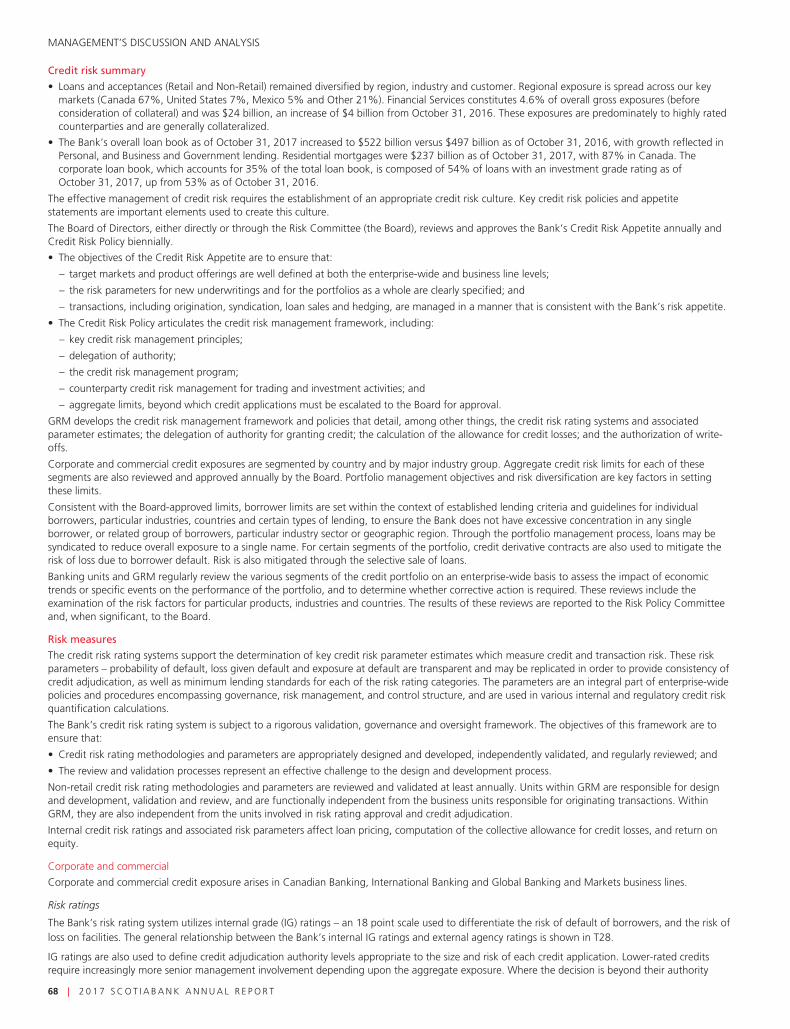
MANAGEMENT’S DISCUSSION AND ANALYSIS
Credit risk summary
• Loans and acceptances (Retail and Non-Retail) remained diversified by region, industry and customer. Regional exposure is spread across our keymarkets (Canada 67%, United States 7%, Mexico 5% and Other 21%). Financial Services constitutes 4.6% of overall gross exposures (beforeconsideration of collateral) and was $24 billion, an increase of $4 billion from October 31, 2016. These exposures are predominately to highly ratedcounterparties and are generally collateralized.
• The Bank’s overall loan book as of October 31, 2017 increased to $522 billion versus $497 billion as of October 31, 2016, with growth reflected inPersonal, and Business and Government lending. Residential mortgages were $237 billion as of October 31, 2017, with 87% in Canada. Thecorporate loan book, which accounts for 35% of the total loan book, is composed of 54% of loans with an investment grade rating as ofOctober 31, 2017, up from 53% as of October 31, 2016.
The effective management of credit risk requires the establishment of an appropriate credit risk culture. Key credit risk policies and appetitestatements are important elements used to create this culture.
The Board of Directors, either directly or through the Risk Committee (the Board), reviews and approves the Bank’s Credit Risk Appetite annually andCredit Risk Policy biennially.
• The objectives of the Credit Risk Appetite are to ensure that:
– target markets and product offerings are well defined at both the enterprise-wide and business line levels;
– the risk parameters for new underwritings and for the portfolios as a whole are clearly specified; and
– transactions, including origination, syndication, loan sales and hedging, are managed in a manner that is consistent with the Bank’s risk appetite.
• The Credit Risk Policy articulates the credit risk management framework, including:
– key credit risk management principles;
– delegation of authority;
– the credit risk management program;
– counterparty credit risk management for trading and investment activities; and
– aggregate limits, beyond which credit applications must be escalated to the Board for approval.
GRM develops the credit risk management framework and policies that detail, among other things, the credit risk rating systems and associatedparameter estimates; the delegation of authority for granting credit; the calculation of the allowance for credit losses; and the authorization of write-offs.
Corporate and commercial credit exposures are segmented by country and by major industry group. Aggregate credit risk limits for each of thesesegments are also reviewed and approved annually by the Board. Portfolio management objectives and risk diversification are key factors in settingthese limits.
Consistent with the Board-approved limits, borrower limits are set within the context of established lending criteria and guidelines for individualborrowers, particular industries, countries and certain types of lending, to ensure the Bank does not have excessive concentration in any singleborrower, or related group of borrowers, particular industry sector or geographic region. Through the portfolio management process, loans may besyndicated to reduce overall exposure to a single name. For certain segments of the portfolio, credit derivative contracts are also used to mitigate therisk of loss due to borrower default. Risk is also mitigated through the selective sale of loans.
Banking units and GRM regularly review the various segments of the credit portfolio on an enterprise-wide basis to assess the impact of economictrends or specific events on the performance of the portfolio, and to determine whether corrective action is required. These reviews include theexamination of the risk factors for particular products, industries and countries. The results of these reviews are reported to the Risk Policy Committeeand, when significant, to the Board.
Risk measures
The credit risk rating systems support the determination of key credit risk parameter estimates which measure credit and transaction risk. These riskparameters – probability of default, loss given default and exposure at default are transparent and may be replicated in order to provide consistency ofcredit adjudication, as well as minimum lending standards for each of the risk rating categories. The parameters are an integral part of enterprise-widepolicies and procedures encompassing governance, risk management, and control structure, and are used in various internal and regulatory credit riskquantification calculations.
The Bank’s credit risk rating system is subject to a rigorous validation, governance and oversight framework. The objectives of this framework are toensure that:
• Credit risk rating methodologies and parameters are appropriately designed and developed, independently validated, and regularly reviewed; and
• The review and validation processes represent an effective challenge to the design and development process.
Non-retail credit risk rating methodologies and parameters are reviewed and validated at least annually. Units within GRM are responsible for designand development, validation and review, and are functionally independent from the business units responsible for originating transactions. WithinGRM, they are also independent from the units involved in risk rating approval and credit adjudication.
Internal credit risk ratings and associated risk parameters affect loan pricing, computation of the collective allowance for credit losses, and return onequity.
Corporate and commercial
Corporate and commercial credit exposure arises in Canadian Banking, International Banking and Global Banking and Markets business lines.
Risk ratings
The Bank’s risk rating system utilizes internal grade (IG) ratings – an 18 point scale used to differentiate the risk of default of borrowers, and the risk ofloss on facilities. The general relationship between the Bank’s internal IG ratings and external agency ratings is shown in T28.
IG ratings are also used to define credit adjudication authority levels appropriate to the size and risk of each credit application. Lower-rated creditsrequire increasingly more senior management involvement depending upon the aggregate exposure. Where the decision is beyond their authority
68 | 2 0 1 7 S C O T I A B A N K A N N U A L R E P O R T

MA
NA
GEM
ENT’S
DISC
USSIO
NA
ND
AN
ALY
SIS|
RISK
MA
NA
GE
ME
NT
levels, credit units will refer the request – with its recommendation – to a senior credit committee for adjudication. In certain cases, these must bereferred to the Risk Committee of the Board of Directors.
Adjudication
Credit adjudication units within GRM analyze and evaluate all significant credit requests for corporate and commercial credit exposures, to ensure thatrisks are adequately assessed, properly approved, continually monitored and actively managed. The decision-making process begins with anassessment of the credit risk of the individual borrower or counterparty. Key factors considered in the assessment include:
• The borrower’s management;
• The borrower’s current and projected financial results and credit statistics;
• The industry in which the borrower operates;
• Economic trends; and
• Geopolitical risk.
Based on this assessment, a risk rating is assigned to the individual borrower or counterparty, using the Bank’s risk rating systems.
A separate risk rating is also assigned at the facility level, taking into consideration additional factors, such as security, seniority of claim, structure,term and any other forms of credit risk mitigation that affect the amount of potential loss in the event of a default of the facility. Security typicallytakes the form of charges over inventory, receivables, real estate, and operating assets when lending to corporate and commercial borrowers; andcash or treasuries for trading lines such as securities lending, repurchase transactions, and derivatives. The types of acceptable collateral, and relatedvaluation processes are documented in risk management policies and manuals.
Other forms of credit risk mitigation include third party guarantees and, in the case of derivatives facilities, master netting agreements.
Internal borrower and facility risk ratings are assigned when a facility is first authorized, and are promptly re-evaluated and adjusted, if necessary, as aresult of changes to the customer’s financial condition or business prospects. Re-evaluation is an ongoing process, and is done in the context ofgeneral economic changes, specific industry prospects, and event risks, such as revised financial projections, interim financial results and extraordinaryannouncements.
The internal credit risk ratings are also considered as part of the Bank’s adjudication limits, as guidelines for hold levels are tied to different risk ratings.Single borrower limits are much lower for higher risk borrowers than low risk borrowers.
The credit adjudication process also uses a risk-adjusted return on equity profitability model to ensure that the client and transaction structure offersan appropriate return for a given level of risk. For the corporate portfolio, and the large borrowers in International, the Loan Portfolio ManagementGroup reviews the profitability model results, together with external benchmarks, and provides an opinion on the relative return and pricing of eachtransaction above a minimum threshold.
Individual credit exposures are regularly monitored by both the business line units and GRM for any signs of deterioration. In addition, the businessline units and GRM conduct a review and risk analysis of each borrower annually, or more frequently for higher-risk borrowers. If, in the judgement ofmanagement, an account requires the expertise of specialists in workouts and restructurings, it will be transferred to a special accounts group formonitoring and resolution.
Credit Risk Mitigation – Collateral/Security
Traditional Non-Retail Products (e.g. Operating lines of Credit, Term Loans)
Collateral values are accurately identified at the outset and throughout the tenure of a transaction by using standard evaluation methodologies.Collateral valuation estimates are conducted at a frequency that is appropriate to the frequency by which the market value fluctuates, using thecollateral type and the borrower risk profile.
In addition, when it is not cost effective to monitor highly volatile collateral (e.g. accounts receivable, inventory), appropriate lending margins areapplied to compensate (e.g. accounts receivable are capped at 80% of value, inventory at 50%). The frequency of collateral valuations is alsoincreased when early warning signals of a borrower’s deteriorating financial condition are identified.
Borrowers are required to confirm adherence to covenants including confirmation of collateral values on a periodic basis, which are used by the Bankto provide early warning signals of collateral value deterioration. Periodic inspections of physical collateral are performed where appropriate andwhere reasonable means of doing so are available.
Bank procedures require verification including certification by banking officers during initial, annual, and periodic reviews, that collateral values/margins/etc. have been assessed and, where necessary, steps have been taken to mitigate any decreased collateral values.
The Bank does not use automated valuation models (AVMs) for valuation purposes for traditional non-retail products. GRM performs its ownvaluations of companies based on various factors such as book value, discounted book value, enterprise value etc.
Commercial/Corporate Real Estate
New or updated appraisals are generally obtained at inception of a new facility, as well as during loan modifications, loan workouts and troubled debtrestructure. The primary reason for requiring a new appraisal is if, in the reasonable opinion of the banking execution unit, or GRM, there has been amaterial change in value. Additionally, none of the appraisal guidelines contained within the policies should dissuade the Bank from requesting anappraisal more frequently if an adverse change in market conditions, sponsorship, credit worthiness, or other underwriting assumptions is realized orexpected.
Appraisals must be in writing and must contain sufficient information and analysis to support the Bank’s decision to make the loan. Moreover, inrendering an opinion of the property’s market value, third party appraisers are responsible for establishing the scope of work necessary to developcredible assignment results. The appraisal must meet the regulatory and industry requirements which, depending on the type of property beingappraised, contain any or all of the following three approaches to value:
i. comparable sales approach
ii. replacement cost approach
iii. income approach
2 0 1 7 S C O T I A B A N K A N N U A L R E P O R T | 69

MANAGEMENT’S DISCUSSION AND ANALYSIS
The appraiser must disclose the rationale for the omission of any valuation approach. Furthermore, the appraiser must disclose whether the subjectproperty was physically inspected and whether anyone provided significant assistance to the person signing the appraisal report. The report mustcontain a presentation and explanation of the assumptions used in determining value under each of the above mentioned approaches.
Review of every appraisal is conducted by the banking units and GRM to confirm that the appraisal identifies all of the relevant issues for the specificasset class, location and economic environment and incorporates all appropriate valuation methodologies and assumptions. In most cases, thebanking units also include comparable properties in addition to what is included in the appraisal to further justify value.
When third party assessors are used, they must be accredited and satisfactory to the Bank. In addition, GRM validates any third party valuations viainternal desktop estimates either based on comparables or discounted income valuations.
Traded products
Traded products are transactions such as derivatives, foreign exchange, commodities, repurchase/reverse repurchase agreements, and securitieslending/borrowing. Credit risks arising from traded products cannot be determined with certainty at the outset, because during the tenure of atransaction the dollar value of the counterparty’s obligation to the Bank will be affected by changes in the capital markets (such as changes in stockprices, interest rates, and exchange rates). The Bank adjudicates credit exposures arising from transacting in traded products by considering theircurrent fair value plus an additional component to reflect potential future changes in their mark-to-market value. The credit adjudication process alsoincludes an evaluation of potential wrong way risk, which arises when the exposure to a counterparty is positively correlated to the probability ofdefault of that counterparty.
Credit risk associated with traded products is managed within the same credit adjudication process as the lending business. The Bank considers thecredit risk arising from lending activities, as well as the potential credit risk arising from transacting in traded products with that counterparty.
Credit risk mitigation – collateral/security
Derivatives are generally transacted under industry standard International Swaps and Derivatives Association (ISDA) master netting agreements, whichallow for a single net settlement of all transactions covered by that agreement in the event of a default or early termination of the transactions. ISDAagreements are frequently accompanied by an ISDA Credit Support Annex (CSA), the terms of which may vary according to each party’s view of theother party’s creditworthiness. CSAs can require one party or both parties to post initial margin at the onset of each transaction. CSAs also allow forvariation margin to be called if total uncollateralized mark-to-market exposure exceeds an agreed upon threshold. Such variation margin provisionscan be one-way (only one party will ever post collateral) or bilateral (either party may post depending upon which party is in-the-money). The CSA willalso detail the types of collateral that are acceptable to each party, and the haircuts that will be applied against each collateral type. The terms of theISDA master netting agreements and CSAs are taken into consideration in the calculation of counterparty credit risk exposure.
For derivative transactions, investment grade counterparties account for approximately 92% of the credit risk. Approximately 29% of the Bank’sderivative counterparty exposures are to bank counterparties. After taking into consideration, where applicable, netting and collateral arrangements,no net credit risk amount arising from traded products transactions with any single counterparty was considered material to the financial position ofthe Bank as at October 31, 2017. No individual exposure to an investment grade bilateral counterparty exceeded $1,230 million and no individualexposure to a corporate counterparty exceeded $752 million.
Retail
Retail credit exposures arise in the Canadian Banking and International Banking business lines.
Adjudication
The decision-making process for retail loans ensures that credit risks are adequately assessed, properly approved, continually monitored and activelymanaged. Generally, credit decisions on consumer loans are processed by proprietary adjudication software and are based on risk ratings, which aregenerated using predictive credit scoring models.
The Bank’s credit adjudication and portfolio management methodologies are designed to ensure consistent underwriting and early identification ofproblem loans. The Bank’s rigorous credit underwriting and retail risk modeling methodologies are more customer focused than product focused. TheBank’s view is that a customer-centric approach provides better risk assessment than product-based approaches, and should result in lower loan lossesover time.
All credit scoring and policy changes are initiated by units within GRM that are functionally independent from the business units responsible for retailportfolios. Risk models and parameters are also subject to independent validation and review from the units involved in the design and developmentof models. The review process includes referral to the appropriate Senior Credit Committee for approval, where required. Consumer credit portfoliosare reviewed monthly to identify emerging trends in loan quality and to assess whether corrective action is required.
Risk ratings
The Bank’s consumer risk rating systems are oriented to borrower or transaction risk. Each retail exposure is assigned a risk grade based on thecustomer’s credit history and/or internal credit score. The Bank’s automated risk rating systems assess the ongoing credit-worthiness of individualcustomers on a monthly basis. This process provides for meaningful and timely identification and management of problem loans.
The risk rating system under the AIRB approach is subject to regular review and ongoing performance monitoring of key components. Risk modelvalidations are conducted independently from the areas responsible for rating system development and implementation, to ensure effectiveindependence in design and performance review.
Customer behavior characteristics which are used as inputs within the Bank’s Basel III AIRB models are consistent with those used by the Bank’sCanadian consumer risk rating systems. The International portfolios are subject to the Standardized approach at this time.
Credit risk mitigation – collateral/security
The property values for residential real estate secured exposures are confirmed at origination through a variety of validation methodologies, includingAVM and full appraisal’s (in-person inspection). The appraisal is completed by a third party, Bank approved appraiser. For monitoring of materialportfolios, property values are indexed quarterly to house prices. For loan impairment within material portfolios, residential property values arere-confirmed using third party AVM’s.
70 | 2 0 1 7 S C O T I A B A N K A N N U A L R E P O R T

MA
NA
GEM
ENT’S
DISC
USSIO
NA
ND
AN
ALY
SIS|
RISK
MA
NA
GE
ME
NT
Where AVM values are used, these AVM values are subject to routine validation through a continuous random sampling process that back-tests AVMvalues against available property appraisals (primarily third party AVMs). Where third party appraisals are obtained, the Bank relies on the professionalindustry accreditation of the appraiser. Samples of approved appraisal reports are reviewed by the Bank’s senior appraisers to ensure consistentappraisal quality and satisfactory appraisal values. The third party appraisers are selected from a pre-approved list of Bank-vetted appraisers.
Credit quality
T39 Impaired loans by business line(1)
2017 2016
As at October 31 ($ millions)
Grossimpaired
loans
Allowancefor credit
losses
Netimpaired
loans
Grossimpaired
loans
Allowancefor credit
losses
Netimpaired
loans
Canadian BankingRetail $ 882 $ 645 $ 237 $ 1,003 $ 656 $ 347Commercial 174 134 40 228 160 68
$ 1,056 $ 779 $ 277 $ 1,231 $ 816 $ 415
International BankingCaribbean and Central America $ 1,221 $ 461 $ 760 $ 1,540 $ 648 $ 892Latin America
Mexico 303 219 84 301 215 86
Peru 704 402 302 764 501 263
Chile 565 245 320 499 237 262
Colombia 462 261 201 381 239 142
Other Latin America 182 142 40 143 136 7
Total Latin America 2,216 1,269 947 2,088 1,328 760
$ 3,437 $ 1,730 $ 1,707 $ 3,628 $ 1,976 $ 1,652
Global Banking and MarketsCanada $ 1 $ 1 $ – $ 27 $ 7 $ 20U.S. 132 39 93 210 47 163Asia and Europe 239 73 166 298 102 196
$ 372 $ 113 $ 259 $ 535 $ 156 $ 379
Totals $ 4,865 $ 2,622 $ 2,243 $ 5,394 $ 2,948 $ 2,446
Allowance for credit losses against performing loans 1,446 1,444
Impaired loan metrics
Net impaired loans
As at October 31 ($ millions) 2017(1) 2016(1)
Net impaired loans as a % of loans and acceptances 0.43% 0.49%Allowance against impaired loans as a % of gross impaired loans 54% 55%
(1) Excludes loans acquired under the Federal Deposit Insurance Corporation (FDIC) guarantee related to the acquisition of R-G Premier Bank of Puerto Rico.
Impaired loans
Gross impaired loans decreased to $4,865 million as at October 31, 2017 (excluding $62 million related to loans purchased under FDIC guaranteerelated to the acquisition of R-G Premier Bank of Puerto Rico), from $5,394 million (excluding $100 million related to R-G Premier Bank of Puerto Rico)last year.
Impaired loans in Canadian Banking decreased by $175 million, primarily in the retail portfolio.
In International Banking, impaired loans decreased by $191 million due to decreases in the Caribbean and Central America region, and Peru.
Impaired loans in Global Banking and Markets decreased by $163 million, due to decreases in Asia, the United States and Canada.
Net impaired loans, after deducting the allowance for credit losses, were $2,243 million as at October 31, 2017, a decrease of $203 million from ayear ago. Net impaired loans as a percentage of loans and acceptances were 0.43% as at October 31, 2017, a decrease of 6 basis points from 0.49%a year ago.
Allowance for credit losses
The total allowance for credit losses was down $324 million to $4,068 million as at October 31, 2017 (excluding $259 million related to loansacquired under FDIC guarantee related to the acquisition of R-G Premier Bank of Puerto Rico), from $4,392 million (excluding $234 million related toR-G Premier Bank) last year.
Allowances in Canadian Banking decreased by $37 million to $779 million, in line with the decreases in gross impaired loans.
In International Banking, allowances decreased by $246 million to $1,730 million mainly in the Caribbean and Central America region and Peru.
Global Banking and Markets’ allowances decreased by $43 million to $113 million, reflecting the decrease in gross impaired loans.
The collective allowance against performing loans is unchanged at $1,562 million and consists of the collective allowance against performing loans inaddition to reserves against unfunded commitments and other off-balance sheet items. The collective allowance against performing loans increased by$2 million to $1,446 million due to a re-allocation from the reserves against unfunded commitments and other off-balance sheet items.
2 0 1 7 S C O T I A B A N K A N N U A L R E P O R T | 71

MANAGEMENT’S DISCUSSION AND ANALYSIS
Acquisition-related purchased loans
All purchased loans are initially measured at fair value on the date of acquisition, with no allowance for credit losses recorded in the ConsolidatedStatement of Financial Position on the date of acquisition. Consequently, none of the purchased loans are considered to be impaired on the date ofacquisition. In arriving at the fair value, the Bank considers interest rate mark and credit rate mark adjustments.
The interest rate mark on the date of acquisition is principally set up for fixed interest rate loans and captures the impact of the interest ratedifferential between the contractual rate of interest on the loan and the prevailing interest rate on the loan on the date of acquisition for theremaining term. The interest rate mark is fully amortized into interest income in the Consolidated Statement of Income over the expected life of theloan using the effective interest method.
The credit mark captures management’s best estimate of cash flow shortfalls on the loans over their lifetime as determined at the date of acquisition.Changes to the expected cash flows of these loans are recorded as a charge/recovery in the provision for credit losses in the Consolidated Statementof Income.
The total credit mark remaining on all acquired loans in Canadian Banking and International Banking as at October 31, 2017 was $58 million(October 31, 2016 – $259 million).
Adjusting for the impact of foreign currency translation, the utilization of incurred and expected losses in the credit mark during the year was$192 million (for the year ended October 31, 2016 – $244 million). The net benefit to net income attributable to common shareholders from thecredit mark on acquired loans this year was $113 million (for the year ended October 31, 2016 – $123 million).
Portfolio review
Canadian Banking
Gross impaired loans in the retail portfolio decreased by $121 million or 12%. Provision for credit losses in the retail portfolio was $857 million, up$87 million or 11% from last year driven by growth in relatively higher spread loans.
In the commercial loan portfolio, gross impaired loans decreased by $54 million to $174 million. The provision for credit losses was $56 million, down$6 million or 10% from last year.
International Banking
In retail, gross impaired loans decreased by $54 million to $2,173 million, with a decrease attributable mainly to the Caribbean and Central Americaregion. The provision for credit losses in the retail portfolio increased to $1,090 million from $1,007 million last year. Retail provision increases inColombia, Chile, Uruguay and Peru were partly offset by decreases in Mexico and the Caribbean and Central America region. In commercial banking,gross impaired loans were $1,264 million, a decrease of $137 million over the prior year. The provision for credit losses in the commercial portfoliowas $204 million compared with $274 million last year. The decrease was primarily attributable to lower provisions in Colombia, the Caribbean andMexico, partially offset by higher provisions primarily in Chile and Central America.
Global Banking and Markets
Gross impaired loans in Global Banking and Markets decreased by $163 million to $372 million, primarily in Asia. The provision for credit losses was$42 million compared with $249 million last year. The provisions this year were primarily in Asia and Europe.
Risk diversification
The Bank’s exposures to various countries and types of borrowers are well diversified (see T59 and T63). Chart C24 shows loans and acceptances bygeography. Ontario represents the largest Canadian exposure at 33% of the total. Latin America was 11% of the total exposure and the U.S. was7%.
C25 shows loans and acceptances by type of borrower (see T63). Excluding loans to households, the largest industry exposures were real estate andconstruction (4.7%), financial services (4.6% including banks and non-banks), wholesale and retail (4.0%) and energy (3.0%).
Risk mitigation
To mitigate exposures in its performing corporate portfolios, the Bank uses diversification by company, industry, and country, with loan sales andcredit derivatives used sparingly. In 2017, loan sales totaled $242.1 million, compared to $42 million in 2016. The largest volume of loan sales in 2017related to loans in the energy industry. As at October 31, 2017, credit derivatives used to mitigate exposures in the portfolios totaled $23 million(notional amount), compared to $24 million as at October 31, 2016.
The Bank actively monitors industry and country concentrations. As is the case with all industry exposures, the Bank continues to closely followdeveloping trends and takes additional steps to mitigate risk as warranted. Energy, mining, and shipping portfolios are being closely managed.
Overview of loan portfolio
The Bank has a well-diversified portfolio by product, business and geography. Details of certain portfolios of current focus are highlighted below.
Energy
The Bank’s outstanding loan exposure to commercial and corporate companies in the energy sector was $15.5 billion as at October 31, 2017(October 31, 2016 – $15.6 billion), reflecting approximately 3.0% (October 31, 2016 – 3.1%) of the Bank’s total loan portfolio. In addition, the Bankhas related undrawn energy loan commitments amounting to $13.1 billion as at October 31, 2017 (October 31, 2016 – $11.1 billion). The increase inundrawn loan commitments is primarily driven by the upstream and midstream sub-sectors. Exposure in the upstream sub-sector increase by$1.9 billion since October 31, 2016. Approximately 64% of the Bank’s outstanding energy loan exposure and associated undrawn commitments areinvestment grade, after taking into account the benefit of collateral and guarantees.
72 | 2 0 1 7 S C O T I A B A N K A N N U A L R E P O R T

MA
NA
GEM
ENT’S
DISC
USSIO
NA
ND
AN
ALY
SIS|
RISK
MA
NA
GE
ME
NT
The Bank continues to consider the impact of lower energy prices in its ongoing stress testingprogram. Results continue to be within our risk tolerance.
Real estate secured lending
A large portion of the Bank’s lending portfolio is comprised of residential mortgages andconsumer loans, which are well diversified by borrower. As at October 31, 2017, these loansaccounted for $340 billion or 65% of the Bank’s total loans and acceptances outstanding(October 31, 2016 – $322 billion or 65%). Of these, $257 billion or 76% are real estate securedloans (October 31, 2016 – $242 billion or 75%). The tables below provide more details byportfolios.
Insured and uninsured residential mortgages and home equity lines of credit
The following table presents amounts of insured and uninsured residential mortgages and homeequity lines of credit (HELOCs), by geographic area.
T40 Insured and uninsured residential mortgages and home equity lines of credit (HELOCs), by geographicareas
2017
Residential mortgages Home equity lines of credit
As at October 31 Insured(1) Uninsured Total Insured(1) Uninsured Total
($ millions) Amount % Amount % Amount % Amount % Amount % Amount %
Canada:(2)
Atlantic provinces $ 6,671 3.2 $ 5,088 2.5 $ 11,759 5.7 $ 1 – $ 1,226 6.1 $ 1,227 6.1Quebec 8,100 3.9 7,843 3.8 15,943 7.7 – – 1,009 5.0 1,009 5.0Ontario 46,367 22.5 55,166 26.8 101,533 49.3 – – 10,416 51.7 10,416 51.7Manitoba &
Saskatchewan 5,696 2.8 3,698 1.8 9,394 4.6 1 – 816 4.1 817 4.1Alberta 18,902 9.2 12,162 5.9 31,064 15.1 2 – 3,050 15.1 3,052 15.1British Columbia &
Territories 15,185 7.4 20,915 10.2 36,100 17.6 – – 3,631 18.0 3,631 18.0
Canada(3) $100,921 49.0% $104,872 51.0% $205,793 100% $ 4 –% $20,148 100% $20,152 100%
International – – 31,123 100 31,123 – – – – – – –
Total $100,921 42.6% $135,995 57.4% $236,916 100% $ 4 –% $20,148 100% $20,152 100%
2016
Canada(3) $109,947 56.9% $ 83,356 43.1% $193,303 100% $ 8 0.1% $19,065 99.9% $19,073 100%
International – – 29,585 100 29,585 100 – – – – – –
Total $109,947 49.3% $112,941 50.7% $222,888 100% $ 8 0.1% $19,065 99.9% $19,073 100%
(1) Default insurance is contractual coverage for the life of eligible facilities whereby the Bank’s exposure to real estate secured lending is protectedagainst potential shortfalls caused by borrower default. This insurance is provided by either government-backed entities or private mortgageinsurers.
(2) The province represents the location of the property in Canada.(3) Includes multi-residential dwellings (4+ units) of $2,594 (October 31, 2016 – $2,376) of which $1,689 are insured (October 31, 2016 – $1,392).
Amortization period ranges for residential mortgages
The following table presents the distribution of residential mortgages by remaining amortizationperiods, and by geographic areas.
T41 Distribution of residential mortgages by remaining amortization periods, and by geographic areas
2017
Residential mortgages by remaining amortization periods
As at October 31Less than20 years
20-24years
25-29years
30-34years
35 yearsand
greater
Totalresidentialmortgage
Canada 33.8% 37.9% 26.9% 1.3% 0.1% 100%
International 69.3% 17.2% 11.1% 2.3% 0.1% 100%
2016
Canada 35.2% 36.3% 26.7% 1.7% 0.1% 100%
International 67.7% 19.0% 11.5% 1.7% 0.1% 100%
Loan to value ratios
The Canadian residential mortgage portfolio is 51% uninsured (October 31, 2016 – 43%). Theaverage loan-to-value (LTV) ratio of the uninsured portfolio is 51% (October 31, 2016 – 50%).
The following table presents the weighted average LTV ratio for total newly originated uninsuredresidential mortgages and home equity lines of credit during the year, which include mortgagesfor purchases, refinances with a request for additional funds and transfers from other financialinstitutions, by geographic areas.
C24 Well diversified in Canada andinternationally...loans and acceptances, October 2017
67%
7%
11%
6%
CanadaUnited StatesMexicoLatin AmericaEurope
Caribbean andCentral AmericaOther
5%
2%2%
C25 … and in household and businesslendingloans and acceptances, October 2017
20%
29%
6%
45%
CorporateFinancial and governmentPersonalResidential mortgages
2 0 1 7 S C O T I A B A N K A N N U A L R E P O R T | 73

MANAGEMENT’S DISCUSSION AND ANALYSIS
T42 Loan to value ratios
Uninsured LTV ratios(1)
For the year end October 31, 2017
Residential mortgagesLTV%
Home equity lines of credit(2)
LTV%
Canada:Atlantic provinces 69.4% 57.8%Quebec 65.4 67.9Ontario 63.2 62.0Manitoba & Saskatchewan 68.7 62.8Alberta 68.3 70.0British Columbia & Territories 62.7 61.3
Canada 64.0% 62.7%
International 70.4% n/a
For the year end October 31, 2016
Canada 62.9% 64.5%
International 69.1% n/a
(1) The province represents the location of the property in Canada.(2) Includes only home equity lines of credit (HELOC) under Scotia Total Equity Plan. LTV is calculated based on the sum of residential mortgages and the authorized limit for related HELOCs, divided by the value of the related
residential property, and presented on a weighted average basis for newly originated mortgages and HELOCs.
Potential impact on residential mortgages and real estate home equity lines of credit in the event of an economic downturnThe Bank performs stress testing on its portfolio to assess the impact of increased levels of unemployment, rising interest rates, reduction in propertyvalues and changes in other relevant macro-economic variables. Potential losses in the mortgage portfolio under such economic downturn scenariosare considered manageable given the diversified composition of the portfolio, the high percentage of insured exposures, and the low LTV in theportfolio. This is further supported by sound risk management oversight and pro-active risk mitigation strategies.
Loans to Canadian condominium developersWith respect to loans to Canadian condominium developers, the Bank had loans outstanding of $949 million as at October 31, 2017 (October 31,2016 – $956 million). This is a high quality portfolio with well-known developers who have long-term relationships with the Bank.
European exposuresThe Bank believes that its European exposures are manageable, are sized appropriately relative to the credit worthiness of the counterparties (86% ofthe exposures are to investment grade counterparties based on a combination of internal and external ratings), and are modest relative to the capitallevels of the Bank. There were no significant events in the quarter that have materially impacted the Bank’s exposures.The Bank’s exposure to sovereigns was $8.9 billion as at October 31, 2017 (October 31, 2016 – $7.3 billion), $5.7 billion to banks (October 31, 2016– $5.2 billion) and $17.6 billion to corporates (October 31, 2016 – $16.6 billion).In addition to exposures detailed in the table below, the Bank had indirect exposures consisting of securities exposures to non-European entitieswhose parent company is domiciled in Europe of $1.3 billion as at October 31, 2017 (October 31, 2016 – $0.6 billion).
The Bank’s current European exposure is distributed as follows:
T43 Bank’s exposure distribution by country:
As at October 31 2017 2016
($ millions)
Loans andloan
equivalents(1)
Depositswith
financialinstitutions Securities(2)
SFT andderivatives(3)
FundedTotal
UndrawnCommitments(4) Total Total
Greece $ 214 $ – $ (1) $ – $ 213 $ – $ 213 $ 311Ireland 582 275 10 43 910 1,123 2,033 771Italy 93 – (9) – 84 49 133 240Portugal – – – 1 1 – 1 –Spain 637 1 (2) 5 641 185 826 771
Total GIIPS $ 1,526 $ 276 $ (2) $ 49 $ 1,849 $ 1,357 $ 3,206 $ 2,093
U.K. $ 8,956 $ 1,510 $ 2,343 $ 1,804 $ 14,613 $ 5,553 $ 20,166 $ 15,986Germany 1,131 731 1,571 59 3,492 1,003 4,495 4,878France 1,036 52 2,317 87 3,492 1,561 5,053 5,325Netherlands 1,476 121 318 91 2,006 1,335 3,341 3,469Switzerland 783 7 154 269 1,213 943 2,156 2,300Other 2,744 144 2,304 359 5,551 2,517 8,068 7,546
Total Non-GIIPS $ 16,126 $ 2,565 $ 9,007 $ 2,669 $ 30,367 $ 12,912 $ 43,279 $ 39,504
Total Europe $ 17,652 $ 2,841 $ 9,005 $ 2,718 $ 32,216 $ 14,269 $ 46,485 $ 41,597
As at October 31, 2016 $ 14,748 $ 2,519 $ 8,304 $ 3,554 $ 29,125 $ 12,472 $ 41,597
(1) Individual allowances for credit losses are $52. Letters of credit and guarantees are included as funded exposure as they have been issued. Included in loans and loans equivalent are letters of credit and guarantees which total$3,366 as at October 31, 2017 (October 31, 2016 – $2,890).
(2) Exposures for securities are calculated taking into account derivative positions where the security is the underlying reference asset and short trading positions, with net short positions in brackets.(3) SFT comprise of securities purchased under resale agreements, obligations related to securities sold under repurchase agreements and securities lending and borrowing transactions. Gross and net funded exposures represent all net
positive positions after taking into account collateral. Collateral held against derivatives was $2,515 and collateral held against SFT was $12,112.(4) Undrawn commitments represent an estimate of the contractual amount that may be drawn upon by the obligor and include commitments to issue letters of credit on behalf of other banks in a syndicated bank lending
arrangement.
74 | 2 0 1 7 S C O T I A B A N K A N N U A L R E P O R T

MA
NA
GEM
ENT’S
DISC
USSIO
NA
ND
AN
ALY
SIS|
RISK
MA
NA
GE
ME
NT
Market Risk
Market risk is the risk of loss from changes in market prices and rates (including interest rates, credit spreads, equity prices, foreign exchange rates andcommodity prices), the correlations between them, and their levels of volatility. Below is an index of market risk disclosures:
Index of all market risk disclosures
Index Page Tables and charts Page
Market risk factors 76Interest rate risk 76Credit spread risk 76Foreign currency risk 76Equity risk 76Commodity risk 76
Market risk governance 76
Risk measurement summary 76Value at risk 76Incremental risk charge and comprehensive riskmeasure 77Stress testing 77Sensitivity analysis 77Gap analysis 77
Validation of market risk models 77
Non-trading market risk 77Interest rate risk 77-78
C26 Interest rate gap 78T44 Interest rate gap 78T45 Structural interest rate sensitivity 78
Foreign currency risk 78-79Investment portfolio risks 79
Trading market risk 79 T46 Market risk measures 79C27 Trading revenue distribution 80C28 Daily trading revenue vs. VaR 80
Market risk linkage to balance sheet 81 T47 Market risk linkage to balance sheet of the Bank 81
Derivative instruments and structured transactions 81Derivatives 81Structured transactions 81-82
European exposures 74 T43 Bank’s exposure distribution by country 74
Market risk 52-53 T33 Total market risk capital 53
Financial instruments 56 T36 Mortgage-backed securities 57T37 Collateralized debt obligations (CDOs) 57
2 0 1 7 S C O T I A B A N K A N N U A L R E P O R T | 75

MANAGEMENT’S DISCUSSION AND ANALYSIS
Market risk factors
Interest rate risk
The risk of loss due to changes in the level and/or the volatility of interest rates. This risk affects instruments such as, but not limited to, debt securities,loans, mortgages, deposits and derivatives.
Interest rate risks are managed through sensitivity, gap, stress testing, annual income and VaR limits and mitigated through portfolio diversificationand hedges using interest rate derivatives and debt securities.
Credit spread risk
The risk of loss due to changes in the market price and volatility of credit, or the creditworthiness of issuers. This risk is mainly concentrated in loanand debt securities portfolios. Risk is managed through sensitivity, jump-to-default, stress testing and VaR limits and mitigated through hedges usingcredit derivatives.
Foreign currency risk
The risk of loss resulting from changes in currency exchange rates and exchange rate volatility. Foreign currency denominated debt and othersecurities as well as future cash flows in foreign currencies are exposed to this type of risk. Risk is managed through maximum net trading position,sensitivity, stress testing and VaR limits and mitigated through hedges using foreign exchange positions or derivatives.
Equity risk
The risk of loss due to changes in prices, volatility or any other equity related risk factor of individual equity or equity linked securities. This risk affectsinstruments such as, but not limited to, equities, exchange traded funds, mutual funds, derivatives and other equity linked products. Risk is managedthrough sensitivity, stress testing and VaR limits and mitigated through hedges using physical equity and derivatives instruments.
Commodity risk
The risk of loss due to changes in prices or volatility of precious metal, base metal, energy and agriculture products. Both physical commodity andderivatives positions are exposed to this risk. Risk is managed through aggregate and net trading position, sensitivity, stress testing and VaR limits andmitigated through hedges using physical commodity and derivative positions.
The following maps risk factors to trading and non-trading activities:
Non-trading Funding Investments Trading
Interest rate riskForeign currency risk
Interest rate riskCredit spread riskForeign currency riskEquity risk
Interest rate riskCredit spread riskForeign currency riskEquity riskCommodity risk
Market risk governance
Overview
The Board of Directors reviews and approves market risk policies and limits annually. The Bank’s Asset-Liability Committee (ALCO) and Market RiskManagement and Policy Committee (MRMPC) oversee the application of the framework set by the Board, and monitor the Bank’s market riskexposures and the activities that give rise to these exposures. The MRMPC establishes specific operating policies and sets limits at the product,portfolio, business unit and business line levels, and for the Bank in total. Limits are reviewed at least annually.
Global Risk Management provides independent oversight of all significant market risks, supporting the MRMPC and ALCO with analysis, riskmeasurement, monitoring, reporting, proposals for standards and support for new product development. To ensure compliance with policies andlimits, market risk exposures are independently monitored on a continuing basis, either by Global Risk Management, the back offices, or Finance. Theyprovide senior management, business units, the ALCO, and the MRMPC with a series of daily, weekly and monthly reports of market risk exposures bybusiness line and risk type.
The Bank uses a variety of metrics and models to measure and control market risk exposures. These measurements are selected based on anassessment of the nature of risks in a particular activity. The principal measurement techniques are Value at Risk (VaR), Incremental Risk Charge,Comprehensive Risk Measure, stress testing, sensitivity analysis and gap analysis. The use and attributes of each of these techniques are noted in theRisk Measurement Summary.
Risk measurement summary
Value at risk (VaR)
VaR is a statistical method of measuring potential loss due to market risk based upon a common confidence interval and time horizon. The Bankcalculates VaR daily using a 99% confidence level, and a one-day holding period for its trading portfolios. This means that once in every 100 days, thetrading positions are expected to lose more than the VaR estimate. VaR has two components: general market risk and debt specific risk. The Bankcalculates general market risk VaR using historical simulation based on 300 days of market data. Obligor specific risk on debt instruments and creditderivatives not captured in general market risk VaR is calculated through the debt specific risk VaR, which uses historical resampling. In addition, theBank calculates a Stressed VaR measure which follows the same basic methodology as VaR but is calibrated to a one year stressed period. The stressedperiod is determined based on analysis of the trading book’s risk profile against historical market data. Stressed VaR complements VaR in that itevaluates the impact of market volatility that is outside the VaR’s historical set.
All material risk factors are captured in VaR. Where historical data is not available, proxies are used to establish the relevant volatility for VaR andStressed VaR until sufficient data is available. Changes in VaR between reporting periods are generally due to changes in positions, volatilities and/orcorrelations between asset classes. VaR is also used to evaluate risks arising in certain funding and investment portfolios. Backtesting is also animportant and necessary part of the VaR process. The Bank backtests the actual trading profit and loss against the VaR result to validate the qualityand accuracy of the Bank’s VaR model. The Board reviews VaR and backtesting results quarterly.
76 | 2 0 1 7 S C O T I A B A N K A N N U A L R E P O R T

MA
NA
GEM
ENT’S
DISC
USSIO
NA
ND
AN
ALY
SIS|
RISK
MA
NA
GE
ME
NT
Incremental Risk Charge (IRC) and Comprehensive Risk Measure (CRM)
Basel market risk capital requirements include IRC and CRM which capture the following:
Default risk: This is the potential for direct losses due to an obligor’s (equity/bond issuer or counterparty) default.
Credit migration risk: This is the potential for direct losses due to a credit rating downgrade or upgrade.
A Monte Carlo model is used to perform default and migration simulations for the obligors underlying credit derivative and bond portfolios. Inaddition, in correlation trading there is a market simulation model in CRM to capture historical price movements. Both IRC and CRM are calculated atthe 99.9th percentile with a one year liquidity horizon. The Board reviews IRC and CRM results quarterly.
Stress testing
A limitation of VaR and Stressed VaR is that they only reflect the recent history of market volatility and a specific one year stressed period, respectively.To complement these measures, stress testing examines the impact that abnormally large changes in market factors and periods of prolongedinactivity might have on trading portfolios. Stress testing scenarios are designed to include large shifts in risk factors as well as historical andtheoretical multi risk market events. Historical scenarios capture severe movements over periods that are significantly longer than the one-day holdingperiod captured in VaR, such as the 2008 Credit Crisis or the 1998 Russian Financial Crisis. Similar to Stressed VaR, stress testing providesmanagement with information on potential losses due to tail events. In addition, the results from the stress testing program are used to verify that theBank’s market risk capital is sufficient to absorb these potential losses.
The Bank subjects its trading portfolios to a series of daily, weekly and monthly stress tests. The Bank also evaluates risk in its investment portfoliosmonthly, using stress tests based on risk factor sensitivities and specific market events. The stress testing program is an essential component of theBank’s comprehensive risk management framework which complements the VaR methodology and other risk measures and controls employed by theBank. The Board reviews stress testing results quarterly.
Sensitivity analysis
In trading portfolios, sensitivity analysis is used to measure the effect of changes in risk factors, including prices and volatility, on financial productsand portfolios. These measures apply across product types and geographies and are used for limit monitoring and management reporting.
In non-trading portfolios, sensitivity analysis assesses the effect of changes in interest rates on current earnings and on the economic value ofshareholders’ equity. It is applied globally to each of the major currencies within the Bank’s operations. The Bank’s sensitivity analysis for limit anddisclosure purposes is measured through positive and negative parallel shifts in the underlying interest rate curves. The Bank also performs sensitivityanalysis using various non-parallel interest rate curve shifts, for example: curve steepeners, curve flatteners and curve twists.
Gap analysis
Gap analysis is used to assess the interest rate sensitivity of re-pricing mismatches in the Bank’s non-trading operations. Under gap analysis, interestrate sensitive assets, liabilities and off-balance sheet instruments are assigned to defined time periods based on expected re-pricing dates. Productswith a contractual maturity are assigned an interest rate gap term based on the shorter of the contractual maturity date and the next re-pricing date.Products with no contractual maturity are assigned an interest rate gap based on observed historical consumer behaviour.
Validation of market risk models
Prior to the implementation of new market risk models, rigorous validation and testing is conducted. Validation is conducted when the model isinitially developed and when any significant changes are made to the model. The models are also subject to ongoing validation, the frequency ofwhich is determined by model risk ratings. Models may also be triggered for earlier revalidation when there have been significant structural changes inthe market or changes to the composition of the portfolio. Model validation includes backtesting, and additional analysis such as:
• Theoretical review or tests to demonstrate whether assumptions made within the internal model are appropriate; and
• Impact tests including stress testing that would occur under historical and hypothetical market conditions.
The validation process is governed by the Bank’s Model Risk Management Policy.
Non-trading market risk
Funding and investment activities
Market risk arising from the Bank’s funding and investment activities is identified, managed and controlled through the Bank’s asset-liabilitymanagement processes. The Asset-Liability Committee meets biweekly to review risks and opportunities, and evaluate performance including theeffectiveness of hedging strategies.
Interest rate risk
Interest rate risks in the non-trading portfolios are predominately driven by the interest rate mismatch (i.e. re-pricing frequency) in the asset andliability exposures. The largest exposures in the non-trading book arise from retail banking operations in Canada. The largest component of this risk isfrom positions related to the retail mortgage book. T44 shows a summary of the interest rate gaps for the Bank’s non-trading positions.
Interest rate risk arising from the Bank’s lending, funding and investment activities is managed in accordance with Board-approved policies and globallimits, which are designed to control the risk to net interest income and economic value of shareholders’ equity. The annual income limit measures theeffect of a specified change in interest rates on the Bank’s annual net interest income over the next twelve months, while the economic value limitmeasures the impact of a specified change in interest rates on the present value of the Bank’s net assets. These limits are set according to thedocumented risk appetite of the Bank. Board-level limit utilization is reported to both the Asset-Liability Committee and the Board on a regular basis.Any limit exceptions are reported according to the Limit Monitoring and Compliance Policy of the Bank.
Net interest income and the economic value of equity result from the differences between yields earned on the Bank’s non-trading assets and interestrate paid on its liabilities. The difference in yields partly reflects mismatch between the maturity and re-pricing characteristics of the assets andliabilities. This mismatch is inherent in the non-trading operations of the Bank and exposes it to adverse changes in the level of interest rates. The
2 0 1 7 S C O T I A B A N K A N N U A L R E P O R T | 77
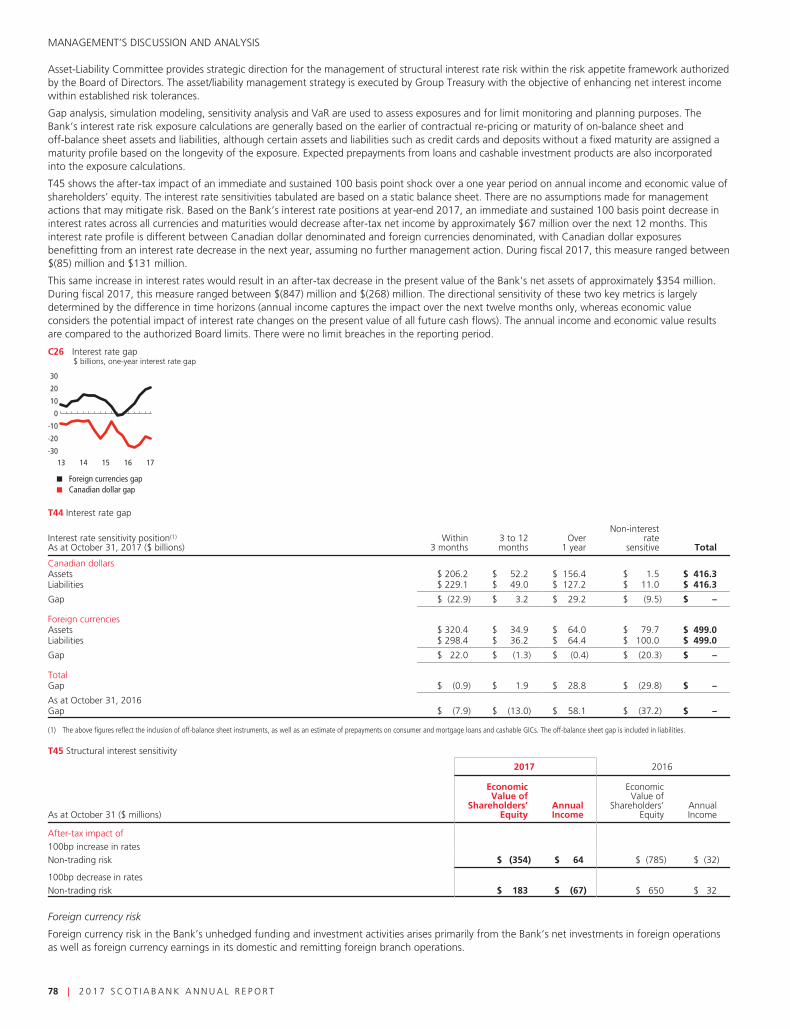
MANAGEMENT’S DISCUSSION AND ANALYSIS
Asset-Liability Committee provides strategic direction for the management of structural interest rate risk within the risk appetite framework authorizedby the Board of Directors. The asset/liability management strategy is executed by Group Treasury with the objective of enhancing net interest incomewithin established risk tolerances.
Gap analysis, simulation modeling, sensitivity analysis and VaR are used to assess exposures and for limit monitoring and planning purposes. TheBank’s interest rate risk exposure calculations are generally based on the earlier of contractual re-pricing or maturity of on-balance sheet andoff-balance sheet assets and liabilities, although certain assets and liabilities such as credit cards and deposits without a fixed maturity are assigned amaturity profile based on the longevity of the exposure. Expected prepayments from loans and cashable investment products are also incorporatedinto the exposure calculations.
T45 shows the after-tax impact of an immediate and sustained 100 basis point shock over a one year period on annual income and economic value ofshareholders’ equity. The interest rate sensitivities tabulated are based on a static balance sheet. There are no assumptions made for managementactions that may mitigate risk. Based on the Bank’s interest rate positions at year-end 2017, an immediate and sustained 100 basis point decrease ininterest rates across all currencies and maturities would decrease after-tax net income by approximately $67 million over the next 12 months. Thisinterest rate profile is different between Canadian dollar denominated and foreign currencies denominated, with Canadian dollar exposuresbenefitting from an interest rate decrease in the next year, assuming no further management action. During fiscal 2017, this measure ranged between$(85) million and $131 million.
This same increase in interest rates would result in an after-tax decrease in the present value of the Bank’s net assets of approximately $354 million.During fiscal 2017, this measure ranged between $(847) million and $(268) million. The directional sensitivity of these two key metrics is largelydetermined by the difference in time horizons (annual income captures the impact over the next twelve months only, whereas economic valueconsiders the potential impact of interest rate changes on the present value of all future cash flows). The annual income and economic value resultsare compared to the authorized Board limits. There were no limit breaches in the reporting period.
C26 Interest rate gap$ billions, one-year interest rate gap
13 14 15 1716-30
Canadian dollar gapForeign currencies gap
-20
-10
0
10
30
20
T44 Interest rate gap
Interest rate sensitivity position(1)
As at October 31, 2017 ($ billions)Within
3 months3 to 12months
Over1 year
Non-interestrate
sensitive Total
Canadian dollarsAssets $ 206.2 $ 52.2 $ 156.4 $ 1.5 $ 416.3Liabilities $ 229.1 $ 49.0 $ 127.2 $ 11.0 $ 416.3
Gap $ (22.9) $ 3.2 $ 29.2 $ (9.5) $ –
Foreign currenciesAssets $ 320.4 $ 34.9 $ 64.0 $ 79.7 $ 499.0Liabilities $ 298.4 $ 36.2 $ 64.4 $ 100.0 $ 499.0
Gap $ 22.0 $ (1.3) $ (0.4) $ (20.3) $ –
TotalGap $ (0.9) $ 1.9 $ 28.8 $ (29.8) $ –
As at October 31, 2016Gap $ (7.9) $ (13.0) $ 58.1 $ (37.2) $ –
(1) The above figures reflect the inclusion of off-balance sheet instruments, as well as an estimate of prepayments on consumer and mortgage loans and cashable GICs. The off-balance sheet gap is included in liabilities.
T45 Structural interest sensitivity
2017 2016
As at October 31 ($ millions)
EconomicValue of
Shareholders’Equity
AnnualIncome
EconomicValue of
Shareholders’Equity
AnnualIncome
After-tax impact of100bp increase in ratesNon-trading risk $ (354) $ 64 $ (785) $ (32)
100bp decrease in ratesNon-trading risk $ 183 $ (67) $ 650 $ 32
Foreign currency risk
Foreign currency risk in the Bank’s unhedged funding and investment activities arises primarily from the Bank’s net investments in foreign operationsas well as foreign currency earnings in its domestic and remitting foreign branch operations.
78 | 2 0 1 7 S C O T I A B A N K A N N U A L R E P O R T
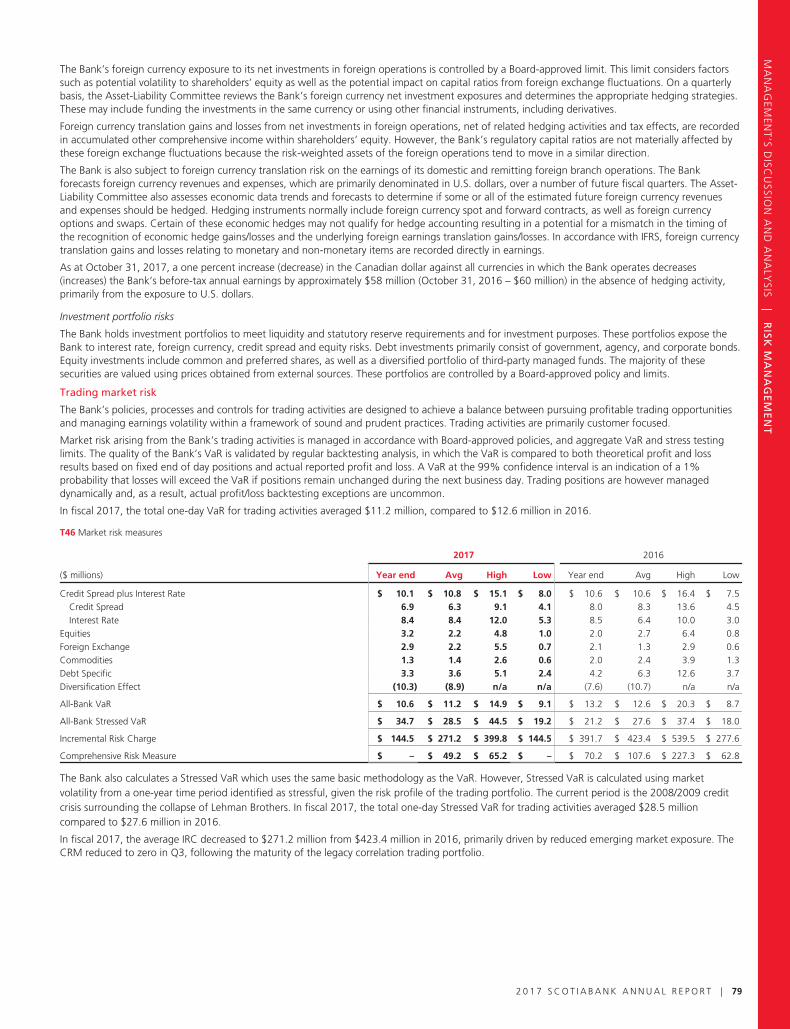
MA
NA
GEM
ENT’S
DISC
USSIO
NA
ND
AN
ALY
SIS|
RISK
MA
NA
GE
ME
NT
The Bank’s foreign currency exposure to its net investments in foreign operations is controlled by a Board-approved limit. This limit considers factorssuch as potential volatility to shareholders’ equity as well as the potential impact on capital ratios from foreign exchange fluctuations. On a quarterlybasis, the Asset-Liability Committee reviews the Bank’s foreign currency net investment exposures and determines the appropriate hedging strategies.These may include funding the investments in the same currency or using other financial instruments, including derivatives.
Foreign currency translation gains and losses from net investments in foreign operations, net of related hedging activities and tax effects, are recordedin accumulated other comprehensive income within shareholders’ equity. However, the Bank’s regulatory capital ratios are not materially affected bythese foreign exchange fluctuations because the risk-weighted assets of the foreign operations tend to move in a similar direction.
The Bank is also subject to foreign currency translation risk on the earnings of its domestic and remitting foreign branch operations. The Bankforecasts foreign currency revenues and expenses, which are primarily denominated in U.S. dollars, over a number of future fiscal quarters. The Asset-Liability Committee also assesses economic data trends and forecasts to determine if some or all of the estimated future foreign currency revenuesand expenses should be hedged. Hedging instruments normally include foreign currency spot and forward contracts, as well as foreign currencyoptions and swaps. Certain of these economic hedges may not qualify for hedge accounting resulting in a potential for a mismatch in the timing ofthe recognition of economic hedge gains/losses and the underlying foreign earnings translation gains/losses. In accordance with IFRS, foreign currencytranslation gains and losses relating to monetary and non-monetary items are recorded directly in earnings.
As at October 31, 2017, a one percent increase (decrease) in the Canadian dollar against all currencies in which the Bank operates decreases(increases) the Bank’s before-tax annual earnings by approximately $58 million (October 31, 2016 – $60 million) in the absence of hedging activity,primarily from the exposure to U.S. dollars.
Investment portfolio risks
The Bank holds investment portfolios to meet liquidity and statutory reserve requirements and for investment purposes. These portfolios expose theBank to interest rate, foreign currency, credit spread and equity risks. Debt investments primarily consist of government, agency, and corporate bonds.Equity investments include common and preferred shares, as well as a diversified portfolio of third-party managed funds. The majority of thesesecurities are valued using prices obtained from external sources. These portfolios are controlled by a Board-approved policy and limits.
Trading market risk
The Bank’s policies, processes and controls for trading activities are designed to achieve a balance between pursuing profitable trading opportunitiesand managing earnings volatility within a framework of sound and prudent practices. Trading activities are primarily customer focused.
Market risk arising from the Bank’s trading activities is managed in accordance with Board-approved policies, and aggregate VaR and stress testinglimits. The quality of the Bank’s VaR is validated by regular backtesting analysis, in which the VaR is compared to both theoretical profit and lossresults based on fixed end of day positions and actual reported profit and loss. A VaR at the 99% confidence interval is an indication of a 1%probability that losses will exceed the VaR if positions remain unchanged during the next business day. Trading positions are however manageddynamically and, as a result, actual profit/loss backtesting exceptions are uncommon.
In fiscal 2017, the total one-day VaR for trading activities averaged $11.2 million, compared to $12.6 million in 2016.
T46 Market risk measures
2017 2016
($ millions) Year end Avg High Low Year end Avg High Low
Credit Spread plus Interest Rate $ 10.1 $ 10.8 $ 15.1 $ 8.0 $ 10.6 $ 10.6 $ 16.4 $ 7.5Credit Spread 6.9 6.3 9.1 4.1 8.0 8.3 13.6 4.5Interest Rate 8.4 8.4 12.0 5.3 8.5 6.4 10.0 3.0
Equities 3.2 2.2 4.8 1.0 2.0 2.7 6.4 0.8Foreign Exchange 2.9 2.2 5.5 0.7 2.1 1.3 2.9 0.6Commodities 1.3 1.4 2.6 0.6 2.0 2.4 3.9 1.3Debt Specific 3.3 3.6 5.1 2.4 4.2 6.3 12.6 3.7Diversification Effect (10.3) (8.9) n/a n/a (7.6) (10.7) n/a n/a
All-Bank VaR $ 10.6 $ 11.2 $ 14.9 $ 9.1 $ 13.2 $ 12.6 $ 20.3 $ 8.7
All-Bank Stressed VaR $ 34.7 $ 28.5 $ 44.5 $ 19.2 $ 21.2 $ 27.6 $ 37.4 $ 18.0
Incremental Risk Charge $ 144.5 $ 271.2 $ 399.8 $ 144.5 $ 391.7 $ 423.4 $ 539.5 $ 277.6
Comprehensive Risk Measure $ – $ 49.2 $ 65.2 $ – $ 70.2 $ 107.6 $ 227.3 $ 62.8
The Bank also calculates a Stressed VaR which uses the same basic methodology as the VaR. However, Stressed VaR is calculated using marketvolatility from a one-year time period identified as stressful, given the risk profile of the trading portfolio. The current period is the 2008/2009 creditcrisis surrounding the collapse of Lehman Brothers. In fiscal 2017, the total one-day Stressed VaR for trading activities averaged $28.5 millioncompared to $27.6 million in 2016.
In fiscal 2017, the average IRC decreased to $271.2 million from $423.4 million in 2016, primarily driven by reduced emerging market exposure. TheCRM reduced to zero in Q3, following the maturity of the legacy correlation trading portfolio.
2 0 1 7 S C O T I A B A N K A N N U A L R E P O R T | 79

MANAGEMENT’S DISCUSSION AND ANALYSIS
Description of trading revenue components and graphical comparison of VaR to daily P&L
Chart C27 shows the distribution of daily trading revenue for fiscal 2017 and Chart C28 compares that distribution to daily VaR results. Tradingrevenue includes changes in portfolio value as well as the impact of new trades, commissions, fees and reserves. Some components of revenue whichare calculated less frequently are pro-rated. Trading revenue averaged $7.0 million per day, compared to $6.5 million in 2016. Revenue was positiveon 99% of trading days during the year, an increase from 98% in 2016. During the year, the largest single day trading loss was $0.4 million whichoccurred on August 3, 2017, and was smaller than the total VaR of $11.0 million on the same day.
C27 Trading revenue distributionYear ended October 31, 2017
GainLoss
$ millions
0
5
10
15
20
25
35
30
-0.3 1 2 3 4 5 6 7 8 9 10 11 12 13 14 15 16 18 20 22 3017 26
# of days
C28 Daily trading revenue vs. VaR$ millions, November 1, 2016 to October 31, 2017
-20
-15
-10
-5
0
5
10
15
20
25
30
35Trading revenueVaR, 99%, 1 day holding period
80 | 2 0 1 7 S C O T I A B A N K A N N U A L R E P O R T

MA
NA
GEM
ENT’S
DISC
USSIO
NA
ND
AN
ALY
SIS|
RISK
MA
NA
GE
ME
NT
Market risk linkage to Consolidated Statement of Financial Position
Trading assets and liabilities are marked to market daily and included in trading risk measures such as VaR. Derivatives risk related to Global Bankingand Markets’ activities is captured under trading risk measures while derivatives used in asset/liability management are in the non-trading riskcategory. A comparison of Consolidated Statement of Financial Position items which are covered under the trading and non-trading risk measures isprovided in the table below.
T47 Market risk linkage to Consolidated Statement of Financial Position of the Bank
Market Risk Measure
As at October 31, 2017($ millions)
ConsolidatedStatement of
FinancialPosition Trading Risk
Non-tradingrisk
Not subject tomarket risk
Primary risk sensitivity ofnon-trading risk
Precious metals $ 5,717 $ 5,717 $ – $ – n/aTrading assets 98,464 98,464 – – n/aFinancial instruments designated at fair value through profit or loss 13 – 13 – Interest rateDerivative financial instruments 35,364 30,648 4,716 – Interest rate, FX, equityInvestment securities 69,269 – 69,269 – Interest rate, FX, equityLoans 504,369 – 504,369 – Interest rate, FXAssets not subject to market risk(1) 202,077 – – 202,077 n/a
Total assets $ 915,273 $ 134,829 $ 578,367 $ 202,077
Deposits $ 625,367 $ – $ 593,174 $ 32,193 Interest rate, FX, equityFinancial instruments designated at fair value through profit or loss 4,663 – 4,663 – Interest rate, equityObligations related to securities sold short 30,766 30,766 – – n/aDerivative financial instruments 34,200 30,545 3,655 – Interest rate, FX, equityTrading liabilities(2) 6,819 6,819 – – n/aRetirement and other benefit liabilities 2,201 – 2,201 – Interest rate, credit spread, equityLiabilities not subject to market risk(3) 149,632 – – 149,632 n/a
Total liabilities $ 853,648 $ 68,130 $ 603,693 $ 181,825
(1) Includes goodwill, intangibles, other assets and securities purchased under resale agreements and securities borrowed.(2) Gold and silver certificates and bullion included in other liabilities.(3) Includes obligations related to securities sold under repurchase agreements and securities lent and other liabilities.
Market Risk Measure
As at October 31, 2016($ millions)
ConsolidatedStatement of
FinancialPosition Trading Risk
Non-tradingrisk
Not subject tomarket risk
Primary risk sensitivity ofnon-trading risk
Precious metals $ 8,442 $ 8,442 $ – $ – n/aTrading assets 108,561 108,561 – – n/aFinancial instruments designated at fair value through profit or loss 221 – 221 – Interest rateDerivative financial instruments 41,657 36,401 5,256 – Interest rate, FX, equityInvestment securities 72,919 – 72,919 – Interest rate, FX, equityLoans 480,164 – 480,164 – Interest rate, FXAssets not subject to market risk(1) 184,302 – – 184,302 n/a
Total assets $ 896,266 $ 153,404 $ 558,560 $ 184,302
Deposits $ 611,877 $ – $ 580,814 $ 31,063 Interest rate, FX, equityFinancial instruments designated at fair value through profit or loss 1,459 – 1,459 – Interest rate, equityObligations related to securities sold short 23,312 23,312 – – n/aDerivative financial instruments 42,387 38,213 4,174 – Interest rate, FX, equityTrading liabilities(2) 8,430 8,430 – – n/aRetirement and other benefit liabilities 3,011 – 3,011 – Interest rate, credit spread, equityLiabilities not subject to market risk(3) 147,969 – – 147,969 n/a
Total liabilities $ 838,445 $ 69,955 $ 589,458 $ 179,032
(1) Includes goodwill, intangibles, other assets and securities purchased under resale agreements and securities borrowed.(2) Gold and silver certificates and bullion included in other liabilities.(3) Includes obligations related to securities sold under repurchase agreements and securities lent and other liabilities.
Derivative instruments and structured transactions
Derivatives
The Bank uses derivatives to meet customer needs, generate revenues from trading activities, manage market and credit risks arising from its lending,funding and investment activities, and to lower its cost of capital. The Bank uses several types of derivative products, including interest rate swaps,futures and options, to hedge interest rate risk exposure. Forward contracts, swaps and options are used to manage foreign currency risk exposures.Credit exposures in its lending and investment books are managed using credit default swaps. As a dealer, the Bank markets a range of derivatives toits customers, including interest rate, foreign exchange, equity, commodity and credit derivatives.
Market risk arising from derivatives transactions is subject to the control, reporting and analytical techniques noted above. Additional controls andanalytical techniques are applied to address certain market-related risks that are unique to derivative products.
Structured transactions
Structured transactions are specialized transactions that may involve combinations of cash, other financial assets and derivatives designed to meet thespecific risk management or financial requirements of customers. These transactions are carefully evaluated by the Bank to identify and address the
2 0 1 7 S C O T I A B A N K A N N U A L R E P O R T | 81

MANAGEMENT’S DISCUSSION AND ANALYSIS
credit, market, legal, tax, reputational and other risks, and are subject to a cross-functional review and sign-off by Trading Management, Global RiskManagement, Taxation, Finance and Legal departments. Large structured transactions are also subject to review by senior risk managementcommittees and evaluated in accordance with the procedures described below in Reputational Risk.
The market risk in these transactions is usually minimal, and returns are earned by providing structuring expertise and by taking credit risk. Onceexecuted, structured transactions are subject to the same ongoing credit reviews and market risk analysis as other types of derivatives transactions.This review and analysis includes careful monitoring of the quality of the reference assets, and ongoing valuation of the derivatives and referenceassets.
Liquidity Risk
Liquidity risk is the risk that the Bank is unable to meet its financial obligations in a timely manner at reasonable prices. Financialobligations include liabilities to depositors, payments due under derivative contracts, settlement of securities borrowing and repurchasetransactions, and lending and investment commitments.
Effective liquidity risk management is essential to maintain the confidence of depositors and counterparties, manage the Bank’s cost of funds and tosupport core business activities, even under adverse circumstances.
Liquidity risk is managed within the framework of policies and limits that are approved by the Board of Directors. The Board receives reports on riskexposures and performance against approved limits. The Asset-Liability Committee (ALCO) provides senior management oversight of liquidity risk.
The key elements of the liquidity risk framework are:
• Measurement and modeling – the Bank’s liquidity model measures and forecasts cash inflows and outflows, including off-balance sheet cash flowson a daily basis. Risk is managed by a set of key limits over the maximum net cash outflow by currency over specified short-term horizons (cashgaps), a minimum level of core liquidity, and liquidity stress tests.
• Reporting – Global Risk Management provides independent oversight of all significant liquidity risks, supporting the ALCO with analysis, riskmeasurement, stress testing, monitoring and reporting.
• Stress testing – the Bank performs liquidity stress testing on a regular basis, to evaluate the effect of both industry-wide and Bank-specificdisruptions on the Bank’s liquidity position. Liquidity stress testing has many purposes including:
– Helping the Bank to understand the potential behavior of various on-balance sheet and off-balance sheet positions in circumstances of stress; and
– Based on this knowledge, facilitating the development of risk mitigation and contingency plans.
The Bank’s liquidity stress tests consider the effect of changes in funding assumptions, depositor behavior and the market value of liquid assets. TheBank performs industry standard stress tests, the results of which are reviewed at senior levels of the organization and are considered in makingliquidity management decisions.
• Contingency planning – the Bank maintains a liquidity contingency plan that specifies an approach for analyzing and responding to actual andpotential liquidity events. The plan outlines an appropriate governance structure for the management and monitoring of liquidity events, processesfor effective internal and external communication, and identifies potential counter measures to be considered at various stages of an event. Acontingency plan is maintained both at the parent-level as well as for major subsidiaries.
• Funding diversification – the Bank actively manages the diversification of its deposit liabilities by source, type of depositor, instrument, term andgeography.
• Core liquidity – the Bank maintains a pool of highly liquid, unencumbered assets that can be readily sold or pledged to secure borrowings understressed market conditions or due to Bank-specific events. The Bank also maintains liquid assets to support its intra-day settlement obligations inpayment, depository and clearing systems.
Liquid assets
Liquid assets are a key component of liquidity management and the Bank holds these types of assets in sufficient quantity to meet potential needs forliquidity management.
Liquid assets can be used to generate cash either through sale, repurchase transactions or other transactions where these assets can be used ascollateral to generate cash, or by allowing the asset to mature. Liquid assets include deposits at central banks, deposits with financial institutions, calland other short-term loans, marketable securities, precious metals and securities received as collateral from securities financing and derivativetransactions. Liquid assets do not include borrowing capacity from central bank facilities.
Marketable securities are securities traded in active markets, which can be converted to cash within a timeframe that is in accordance with the Bank’sliquidity management framework. Assets are assessed considering a number of factors, including the expected time it would take to convert them tocash.
Marketable securities included in liquid assets are comprised of securities specifically held as a liquidity buffer or for asset liability managementpurposes; trading securities, which are primarily held by Global Banking and Markets; and collateral received for securities financing and derivativetransactions.
The Bank maintains large holdings of unencumbered liquid assets to support its operations. These assets generally can be sold or pledged to meet theBank’s obligations. As at October 31, 2017, unencumbered liquid assets were $180 billion (October 31, 2016 – $183 billion). Securities including NHAmortgage-backed securities, comprised 67% of liquid assets (October 31, 2016 – 74%). Other unencumbered liquid assets, comprising cash anddeposits with central banks, deposits with financial institutions, precious metals and call and short loans, were 33% (October 31, 2016 – 26%). Thedecrease in liquid assets was mainly attributable to a decrease in unencumbered liquid securities, precious metals and deposits with financialinstitutions, which was partially offset by an increase in deposits with central banks.
The carrying values outlined in the liquid asset table are consistent with the carrying values in the Bank’s Statement of Financial Position as atOctober 31, 2017. The liquidity value of the portfolio will vary under different stress events as different assumptions are used for the stress scenarios.
82 | 2 0 1 7 S C O T I A B A N K A N N U A L R E P O R T

MA
NA
GEM
ENT’S
DISC
USSIO
NA
ND
AN
ALY
SIS|
RISK
MA
NA
GE
ME
NT
The Bank’s liquid asset pool is summarized in the following table:
T48 Liquid asset pool
Encumberedliquid assets
Unencumberedliquid assets
As at October 31, 2017($ millions)
Bank-ownedliquid assets
Securities received ascollateral from securitiesfinancing and derivative
transactionsTotal liquid
assetsPledged as
collateral Other(1)Available as
collateral Other
Cash and deposits with central banks $ 49,754 $ – $ 49,754 $ – $ 7,306 $ 42,448 $ –Deposits with financial institutions 9,909 – 9,909 – 108 9,801 –Precious metals 5,717 – 5,717 – 123 5,594 –Securities
Canadian government obligations 41,791 9,836 51,627 24,505 – 27,122 –Foreign government obligations 47,388 54,286 101,674 75,362 – 26,312 –Other securities 56,444 59,590 116,034 79,363 – 36,671 –
LoansNHA mortgage-backed securities(2) 33,327 – 33,327 2,360 – 30,967 –Call and short loans 1,405 – 1,405 – – 1,405 –
Total $ 245,735 $ 123,712 $ 369,447 $ 181,590 $ 7,537 $ 180,320 $ –
Encumberedliquid assets
Unencumberedliquid assets
As at October 31, 2016($ millions)
Bank-ownedliquid assets
Securities received ascollateral from securitiesfinancing and derivative
transactionsTotal liquid
assetsPledged as
collateral Other(1)Available as
collateral Other
Cash and deposits with central banks $ 35,396 $ – $ 35,396 $ – $ 7,917 $ 27,479 $ –Deposits with financial institutions 10,948 – 10,948 – 196 10,752 –Precious metals 8,442 – 8,442 – 115 8,327 –Securities
Canadian government obligations 45,825 12,482 58,307 27,187 – 31,120 –Foreign government obligations 50,761 36,822 87,583 58,680 – 28,903 –Other securities 58,833 60,745 119,578 76,394 – 43,184 –
LoansNHA mortgage-backed securities(2) 33,072 – 33,072 1,993 – 31,079 –Call and short loans 1,673 – 1,673 – – 1,673 –
Total $ 244,950 $ 110,049 $ 354,999 $ 164,254 $ 8,228 $ 182,517 $ –
(1) Assets which are restricted from being used to secure funding for legal or other reasons.(2) These mortgage-backed securities, which are available for sale, are reported as residential mortgage loans on the balance sheet.
A summary of total unencumbered liquid assets held by the parent bank and its branches, and domestic and foreign subsidiaries, is presented below:
T49 Total unencumbered liquid assets held by the parent bank and its branches, and domestic and foreign subsidiaries
As at October 31($ millions) 2017 2016
Bank of Nova Scotia (Parent) $ 131,838 $ 135,335Bank domestic subsidiaries 13,753 13,871Bank foreign subsidiaries 34,729 33,311
Total $ 180,320 $ 182,517
The Bank’s liquidity pool is held across major currencies, mostly comprised of Canadian and U.S. dollar holdings. As shown above, the vast majority(81%) of liquid assets are held by the Bank’s corporate office, branches of the Bank, and Canadian subsidiaries of the Bank. To the extent a liquidityreserve held in a foreign subsidiary of the Bank is required for regulatory purposes, it is assumed to be unavailable to the rest of the Group. Otherliquid assets held by a foreign subsidiary are assumed to be available only in limited circumstances. The Bank monitors and ensures compliance inrelation to minimum levels of liquidity required and assets held within each entity, and/or jurisdiction.
2 0 1 7 S C O T I A B A N K A N N U A L R E P O R T | 83

MANAGEMENT’S DISCUSSION AND ANALYSIS
Encumbered assets
In the course of the Bank’s day-to-day activities, securities and other assets are pledged to secure an obligation, participate in clearing or settlementsystems, or operate in a foreign jurisdiction. Securities are also pledged under repurchase agreements. A summary of encumbered and unencumberedassets is presented below:
T50 Asset encumbrance
Encumbered assets Unencumbered assets
As at October 31, 2017($ millions)
Bank-ownedassets
Securities received ascollateral from securitiesfinancing and derivative
transactions Total assetsPledged as
collateral Other(1)Available ascollateral(2) Other(3)
Cash and deposits with central banks $ 49,754 $ – $ 49,754 $ – $ 7,306 $ 42,448 $ –Deposits with financial institutions 9,909 – 9,909 – 108 9,801 –Precious metals 5,717 – 5,717 – 123 5,594 –Liquid securities:
Canadian government obligations 41,791 9,836 51,627 24,505 – 27,122 –Foreign government obligations 47,388 54,286 101,674 75,362 – 26,312 –Other liquid securities 56,444 59,590 116,034 79,363 – 36,671 –
Other securities 2,311 4,645 6,956 2,916 – – 4,040Loans classified as liquid assets:
NHA mortgage-backed securities 33,327 – 33,327 2,360 – 30,967 –Call and short loans 1,405 – 1,405 – – 1,405 –
Other loans 486,949 – 486,949 6,072 54,746 12,721 413,410Other financial assets(4) 151,329 (85,691) 65,638 4,212 – – 61,426Non-financial assets 28,949 – 28,949 – – – 28,949
Total $ 915,273 $ 42,666 $ 957,939 $ 194,790 $ 62,283 $ 193,041 $ 507,825
Encumbered assets Unencumbered assets
As at October 31, 2016($ millions)
Bank-ownedassets
Securities received ascollateral from securitiesfinancing and derivative
transactions Total assetsPledged as
collateral Other(1)Available ascollateral(2) Other(3)
Cash and deposits with central banks $ 35,396 $ – $ 35,396 $ – $ 7,917 $ 27,479 $ –Deposits with financial institutions 10,948 – 10,948 – 196 10,752 –Precious metals 8,442 – 8,442 – 115 8,327 –Liquid securities:
Canadian government obligations 45,825 12,482 58,307 27,187 – 31,120 –Foreign government obligations 50,761 36,822 87,583 58,680 – 28,903 –Other liquid securities 58,833 60,745 119,578 76,394 – 43,184 –
Other securities 5,007 4,149 9,156 3,615 – – 5,541Loans classified as liquid assets:
NHA mortgage-backed securities 33,072 – 33,072 1,993 – 31,079 –Call and short loans 1,673 – 1,673 – – 1,673 –
Other loans 464,840 – 464,840 5,934 60,311 11,596 386,999Other financial assets(4) 151,916 (84,399) 67,517 5,316 – – 62,201Non-financial assets 29,553 – 29,553 – – – 29,553
Total $ 896,266 $ 29,799 $ 926,065 $ 179,119 $ 68,539 $ 194,113 $ 484,294
(1) Assets which are restricted from being used to secure funding for legal or other reasons.(2) Assets that are readily available in the normal course of business to secure funding or meet collateral needs including central bank borrowing immediately available.(3) Other unencumbered assets are not subject to any restrictions on their use to secure funding or as collateral but the Bank would not consider them to be readily available. These include loans, a portion of which may be used to
access central bank facilities outside of the normal course or to raise secured funding through the Bank’s secured funding programs.(4) Securities received as collateral against other financial assets are included within liquid securities and other securities.
As of October 31, 2017, total encumbered assets of the Bank were $257 billion (October 31, 2016 – $248 billion). Of the remaining $701 billion(October 31, 2016 – $678 billion) of unencumbered assets, $193 billion (October 31, 2016 – $194 billion) are considered readily available in thenormal course of business to secure funding or meet collateral needs as detailed above.
In some over-the-counter derivative contracts, the Bank would be required to post additional collateral or receive less collateral in the event its creditrating was downgraded. The Bank maintains access to sufficient collateral to meet these obligations in the event of a downgrade of its ratings by oneor more of the rating agencies. In the event of a one-notch or two-notch downgrade of the Bank’s rating below its lowest current rating, the Bank hasto provide an additional $53 million or $161 million of collateral, respectively, to meet contractual derivative funding or margin requirements.
Encumbered liquid assets are not considered to be available for liquidity management purposes. Liquid assets which are used to hedge derivativepositions in trading books or for hedging purposes are considered to be available for liquidity management provided they meet the criteria discussedin liquid assets above.
Liquidity coverage ratio
The Liquidity Coverage Ratio measure (LCR) is based on a 30 day liquidity stress scenario, with assumptions defined in the OSFI Liquidity AdequacyRequirements (LAR) Guideline. The LCR is calculated as the ratio of high quality liquid assets (HQLA) to net cash outflows. The Bank is subject to aregulatory minimum LCR of 100%.
84 | 2 0 1 7 S C O T I A B A N K A N N U A L R E P O R T

MA
NA
GEM
ENT’S
DISC
USSIO
NA
ND
AN
ALY
SIS|
RISK
MA
NA
GE
ME
NT
OSFI’s LAR stipulates that banks must maintain an adequate level of unencumbered HQLA that can be converted into cash to meet liquidity needsover a 30 calendar day horizon under a pre-defined significantly severe liquidity stress scenario. The LCR-prescribed liquidity stress scenario includesassumptions for asset haircuts, deposit run-off, wholesale rollover rates, and outflow rates for commitments.
The HQLA are grouped into three categories: Level 1, Level 2A and Level 2B, based on guidelines from the LAR. Level 1 HQLA receive no haircuts, andincludes cash, deposits with central banks, central bank reserves available to the Bank in times of stress, and securities with a 0% risk weight. Level 2Aand 2B include HQLA of lesser quality and attracts haircuts ranging from 15%-50%.
The total weighted values for net cash outflows for the next 30 days are derived by applying the assumptions specified in the LAR Guideline to specificitems, including loans, deposits, maturing debt, derivative transactions and commitments to extend credit.
The following table presents the Bank’s average LCR for the quarter ended October 31, 2017, based on the average daily position in the quarter(October 31, 2016 – based on month-end LCR calculations for August, September and October).
T51 Bank’s average LCR
For the quarter ended October 31, 2017 ($ millions)(1)
Totalunweighted
value(Average)(2)
Totalweighted
value(Average)(3)
High-quality liquid assetsTotal high-quality liquid assets (HQLA) * $ 127,444
Cash outflowsRetail deposits and deposits from small business customers, of which: $ 167,418 11,390
Stable deposits 78,922 2,540Less stable deposits 88,496 8,850
Unsecured wholesale funding, of which: 161,682 78,135Operational deposits (all counterparties) and deposits in networks of cooperative banks 54,947 13,338Non-operational deposits (all counterparties) 86,727 44,789Unsecured debt 20,008 20,008
Secured wholesale funding * 30,152Additional requirements, of which: 182,203 38,530
Outflows related to derivative exposures and other collateral requirements 24,467 14,611Outflows related to loss of funding on debt products 5,058 5,058Credit and liquidity facilities 152,678 18,861
Other contractual funding obligations 2,779 1,181Other contingent funding obligations(4) 436,988 7,055
Total cash outflows * $ 166,443
Cash inflowsSecured lending (e.g. reverse repos) $ 142,364 $ 25,351Inflows from fully performing exposures 20,335 13,125Other cash inflows 26,216 26,216
Total cash inflows $ 188,915 $ 64,692
Totaladjusted
value(5)
Total HQLA * $ 127,444Total net cash outflows * $ 101,751Liquidity coverage ratio (%) * 125%
For the quarter ended October 31, 2016 ($ millions)
Totaladjusted
value(5)
Total HQLA * $ 136,401Total net cash outflows * $ 107,822Liquidity coverage ratio (%) * 127%
* Disclosure is not required under regulatory guideline.(1) Based on the average daily positions of the 63 business days in the quarter.(2) Unweighted values represent outstanding balances maturing or callable within the next 30 days.(3) Weighted values represent balances calculated after the application of HQLA haircuts or inflow and outflow rates, as prescribed by the OSFI LAR guidelines.(4) Total unweighted value includes uncommitted credit and liquidity facilities, guarantees and letters of credit, outstanding debt securities with remaining maturity greater than 30 days, and other contractual cash outflows.(5) Total adjusted value represents balances calculated after the application of both haircuts and inflow and outflow rates and any applicable caps.
HQLA continues to be substantially comprised of Level 1 assets (as defined in the LAR guideline). The Bank’s average LCR for the quarter endedOctober 31, 2017 was in line with the quarter ended October 31, 2016.
The Bank’s significant operating currencies are Canadian and U.S. dollars. The Bank monitors its significant currency exposures in accordance with itsliquidity risk management framework and risk appetite.
2 0 1 7 S C O T I A B A N K A N N U A L R E P O R T | 85

MANAGEMENT’S DISCUSSION AND ANALYSIS
Funding
The Bank ensures that its funding sources are well diversified. Funding concentrations are regularly monitored and analyzed by type. The sources offunding are capital, deposits from retail and commercial clients sourced through the Canadian and international branch network, deposits fromfinancial institutions as well as wholesale debt issuance.
Capital and personal deposits are key components of the Bank’s core funding and these amounted to $269 billion as at October 31, 2017(October 31, 2016 – $266 billion). The increase since October 31, 2016, was primarily due to internal capital generation and the issuance of NVCCsubordinated additional Tier 1 Capital Securities, net of redemptions of preferred shares and subordinated debentures. A portion of commercialdeposits, particularly those of an operating or relationship nature, would be considered part of the Bank’s core funding. Furthermore, core funding isaugmented by longer term wholesale debt issuances (original maturity over 1 year) of $140 billion (October 31, 2016 – $141 billion). Longer termwholesale debt issuances include medium-term notes, deposit notes, mortgage securitization, asset-backed securities and covered bonds.
The Bank operates in many different currencies and countries. From a funding perspective, the most significant currencies are Canadian and U.S.dollars. With respect to the Bank’s operations outside Canada, there are different funding strategies depending on the nature of the activities in eachcountry. For those countries where the Bank operates a branch banking subsidiary, the strategy is for the subsidiary to be substantially self-funding inits local market. For other subsidiaries or branches outside Canada where local deposit gathering capability is not sufficient, funding is providedthrough the wholesale funding activities of the Bank.
From an overall funding perspective the Bank’s objective is to achieve an appropriate balance between the cost and the stability of funding.Diversification of funding sources is a key element of the funding strategy.
The Bank’s wholesale debt diversification strategy is primarily executed via the Bank’s main wholesale funding centres, located in Toronto, New York,London and Singapore. The majority of these funds are sourced in Canadian and U.S. dollars. Where required, these funds are swapped to fund assetsin different currencies. The funding strategy deployed by wholesale funding centres and the management of associated risks, such as geographic andcurrency risk, are managed centrally within the framework of policies and limits that are approved by the Board of Directors.
In the normal course, the Bank uses a mix of unsecured and secured wholesale funding instruments across a variety of markets. The choice ofinstruments and markets is based on a number of factors, including relative cost and market capacity as well as an objective of maintaining adiversified mix of sources of funding. Market conditions can change over time, impacting cost and capacity in particular markets or instruments.Changing market conditions can include periods of stress where the availability of funding in particular markets or instruments is constrained. In thesecircumstances the Bank would increase its focus on sources of funding in functioning markets and secured funding instruments. Should a period ofextreme stress exist such that all wholesale funding sources are constrained, the Bank maintains a pool of liquid assets to mitigate its liquidity risk. Thispool includes cash, deposits with central banks and securities.
In Canada, the Bank raises short- and longer-term wholesale debt through the issuance of senior unsecured deposit notes. Additional longer-termwholesale debt may be generated through the Bank’s Canadian Debt and Equity Shelf, the securitization of Canadian insured residential mortgagesthrough CMHC securitization programs (such as Canada Mortgage Bonds), uninsured residential mortgages through the Bank’s Covered BondProgram, unsecured personal lines of credit through the Hollis Receivables Term Trust II Shelf, retail credit card receivables through the Trillium CreditCard Trust II Shelf and retail indirect auto loan receivables through the Securitized Term Auto Receivables Trust Program. While the Bank includesCMHC securitization programs in its view of wholesale debt issuance, this source of funding does not entail the run-off risk that can be experienced infunding raised from capital markets.
Outside of Canada, short-term wholesale debt may be raised through the issuance of negotiable certificates of deposit in the United States,Hong Kong and Australia and the issuance of commercial paper in the United States. The Bank operates longer-term wholesale debt issuanceregistered programs in the United States, such as its SEC Registered Debt and Equity Shelf, and non-registered programs, such as the securitization ofretail indirect auto loan receivables through the Securitized Term Auto Receivables Trust program and the securitization of retail credit card receivablesthrough the Trillium Credit Card Trust II program. The Bank’s Covered Bond Program is listed with the U.K. Listing Authority, and the Bank may issueunder the program in Europe, the United States, Australia and Switzerland. The Bank also raises longer-term funding across a variety of currenciesthrough its Australian Medium Term Note Programme, European Medium Term Note Programme and Singapore Medium Term Note Programme. TheBank’s European Medium Term Note Programme is listed with the U.K. Listing Authority, Swiss Stock Exchange and the Tokyo Pro-Bond Market. TheBank’s Singapore Medium Term Note Programme is listed with the Singapore Exchange and the Taiwan Exchange.
86 | 2 0 1 7 S C O T I A B A N K A N N U A L R E P O R T

MA
NA
GEM
ENT’S
DISC
USSIO
NA
ND
AN
ALY
SIS|
RISK
MA
NA
GE
ME
NT
The table below provides the remaining contractual maturities of funding raised through wholesale funding. In the Consolidated Statement ofFinancial Position, these liabilities are primarily included in Business & Government Deposits.
T52 Wholesale funding(1)
As at October 31, 2017($ millions)
Less than1 month
1-3months
3-6months
6-9months
9-12months
Sub-Total< 1 Year
1-2years
2-5years >5 years Total
Deposits from banks(2) $ 2,740 $ 471 $ 405 $ 264 $ 110 $ 3,990 $ 205 $ 153 $ – $ 4,348Bearer deposit notes,
commercial paper andcertificate of deposits 7,699 12,227 22,351 12,740 7,557 62,574 5,685 495 12 68,766
Asset-backed commercialpaper(3) 1,885 4,233 981 – – 7,099 – – – 7,099
Medium term notes anddeposit notes(4) 24 3,621 8,480 5,469 6,378 23,972 13,024 32,927 10,453 80,376
Asset-backed securities – 1 – 1,162 215 1,378 822 1,975 351 4,526Covered bonds 2,821 – – 13 686 3,520 6,378 14,719 1,410 26,027Mortgage securitization(5) – 569 666 556 310 2,101 2,158 10,522 4,943 19,724Subordinated debentures(6) – – – – – – – 181 7,022 7,203
Total wholesale fundingsources $ 15,169 $ 21,122 $ 32,883 $ 20,204 $ 15,256 $ 104,634 $ 28,272 $ 60,972 $ 24,191 $ 218,069
Of Which:
Unsecured funding $ 10,463 $ 16,319 $ 31,236 $ 18,474 $ 14,045 $ 90,537 $ 18,914 $ 33,755 $ 17,487 $ 160,693Secured funding 4,706 4,803 1,647 1,730 1,211 14,097 9,358 27,217 6,704 57,376
As at October 31, 2016($ millions)
Less than 1month
1-3months
3-6months
6-9months
9-12months
Sub-Total< 1 Year
1-2years
2-5years >5 years Total
Deposits from banks(2) $ 2,958 $ 571 $ 187 $ 148 $ 31 $ 3,895 $ 103 $ 149 $ – $ 4,147Bearer deposit notes,
commercial paper andcertificate of deposits 11,434 16,838 25,324 8,181 7,357 69,134 3,151 333 – 72,618
Asset-backed commercialpaper(3) 2,625 3,978 1,906 – – 8,509 – – – 8,509
Medium term notes anddeposit notes(4) 1,573 5,700 4,576 3,681 3,962 19,492 21,935 31,195 7,576 80,198
Asset-backed securities – 451 25 26 189 691 1,218 1,555 417 3,881Covered bonds – 3,353 2,707 – – 6,060 3,413 19,160 1,381 30,014Mortgage securitization(5) – 1,376 663 950 1,063 4,052 2,102 7,834 3,782 17,770Subordinated debentures(6) 22 30 62 1 3 118 – 109 8,767 8,994
Total wholesale fundingsources $ 18,612 $ 32,297 $ 35,450 $ 12,987 $ 12,605 $ 111,951 $ 31,922 $ 60,335 $ 21,923 $ 226,131
Of Which:
Unsecured funding $ 15,987 $ 23,139 $ 30,149 $ 12,011 $ 11,353 $ 92,639 $ 25,189 $ 31,786 $ 16,343 $ 165,957Secured funding 2,625 9,158 5,301 976 1,252 19,312 6,733 28,549 5,580 60,174
(1) Wholesale funding sources exclude repo transactions and bankers acceptances, which are disclosed in the T57 Contractual maturities. Amounts are based on remaining term to maturity.(2) Only includes commercial bank deposits raised by Group Treasury.(3) Wholesale funding sources also exclude asset-backed commercial paper issued by certain ABCP conduits that are not consolidated for financial reporting purposes.(4) Includes Structured notes issued to insititutional investors.(5) Represents residential mortgages funded through Canadian Federal Government agency sponsored programs. Funding accessed through such programs does not impact the funding capacity of the Bank in its own name.(6) Although subordinated debentures are a component of regulatory capital, they are included in this table in accordance with EDTF recommended disclosures.
Wholesale funding generally bears a higher risk of run-off in a stressed environment than other sources of funding. The Bank mitigates this riskthrough funding diversification, ongoing engagement with investors and by maintaining a large holding of unencumbered liquid assets.Unencumbered liquid assets of $180 billion as at October 31, 2017 (October 31, 2016 – $183 billion) were well in excess of wholesale fundingsources that mature in the next twelve months.
2 0 1 7 S C O T I A B A N K A N N U A L R E P O R T | 87

MANAGEMENT’S DISCUSSION AND ANALYSIS
Contractual maturities and obligations
The table below provides the maturity of assets and liabilities as well as the off-balance sheet commitments as at October 31, 2017, based on thecontractual maturity date.
From a liquidity risk perspective the Bank considers factors other than contractual maturity in the assessment of liquid assets or in determiningexpected future cash flows. In particular, for securities with a fixed maturity date, the ability and time horizon to raise cash from these securities ismore relevant to liquidity management than contractual maturity. For other assets and deposits the Bank uses assumptions about rollover rates toassess liquidity risk for normal course and stress scenarios. Similarly, the Bank uses assumptions to assess the potential drawdown of creditcommitments in various scenarios.
The Bank’s contractual obligations include contracts and purchase obligations, including agreements to purchase goods and services that areenforceable, legally binding on the Bank and affect the Bank’s liquidity and capital resource needs. The Bank leases a large number of its branches,offices and other locations. The majority of these leases are for a term of five years, with options to renew. The total cost of these leases, net of rentalincome from subleases, was $444 million in 2017 (2016 – $428 million). The increase primarily reflects higher contractual rents, partially offset byfavourable forex impact.
88 | 2 0 1 7 S C O T I A B A N K A N N U A L R E P O R T

MA
NA
GEM
ENT’S
DISC
USSIO
NA
ND
AN
ALY
SIS|
RISK
MA
NA
GE
ME
NT
T53 Contractual maturities
As at October 31, 2017
($ millions)
Lessthan one
month
One tothree
months
Threeto six
months
Six tonine
months
Nine totwelve
monthsOne to
two years
Twoto fiveyears
Over fiveyears
No specificmaturity Total
AssetsCash and deposits with financial institutions and
precious metals $ 51,646 $ 894 $ 395 $ 175 $ 159 $ 396 $ 514 $ 290 $ 10,911 $ 65,380Trading assets 5,484 5,106 3,275 2,740 2,224 5,272 14,816 17,776 41,771 98,464Financial instruments designated at fair value
through profit or loss – – – – – 13 – – – 13Securities purchased under resale agreement and
securities borrowed 73,346 16,966 3,732 1,087 188 – – – – 95,319Derivative financial instruments 3,544 4,558 2,084 1,418 1,274 4,303 8,375 9,808 – 35,364Investment securities – available-for-sale 3,094 5,645 4,495 2,170 2,131 6,506 18,098 7,054 1,311 50,504Investment securities – held-to-maturity 739 779 1,052 1,193 123 5,847 8,923 109 – 18,765Loans 28,840 25,032 28,778 29,291 27,197 74,303 209,229 28,667 53,032 504,369
Residential mortgages 3,072 4,065 9,542 15,700 13,083 42,460 129,448 18,017 1,529(1) 236,916Personal and credit cards 3,980 2,309 3,124 3,322 3,217 10,899 20,601 5,293 50,586 103,331Business and government 21,788 18,658 16,112 10,269 10,897 20,944 59,180 5,357 5,244(2) 168,449Allowance for credit losses – – – – – – – – (4,327) (4,327)
Customers’ liabilities under acceptances 10,875 2,399 254 22 10 – – – – 13,560Other assets – – – – – – – – 33,535 33,535
Liabilities and equityDeposits $ 56,154 $ 48,037 $ 49,107 $ 30,938 $ 26,373 $ 44,735 $ 73,099 $ 16,037 $ 280,887 $ 625,367
Personal 7,058 7,247 8,500 7,840 7,862 13,223 13,741 393 134,166 200,030Non-personal 49,096 40,790 40,607 23,098 18,511 31,512 59,358 15,644 146,721 425,337
Financial instruments designated at fair valuethrough profit or loss – 3 5 118 133 543 2,882 979 – 4,663
Acceptances 10,875 2,399 254 22 10 – – – – 13,560Obligations related to securities sold short 336 167 97 148 1,057 3,354 9,229 9,935 6,443 30,766Derivative financial instruments 2,810 3,348 1,786 1,258 1,347 3,056 11,534 9,061 – 34,200Obligations related to securities sold under
repurchase agreements and securities lent 85,636 8,452 1,524 229 2 – – – – 95,843Subordinated debentures – – – – – – – 5,935 – 5,935Other liabilities 1,419 1,076 440 824 187 1,369 3,223 4,314 30,462 43,314Total equity – – – – – – – – 61,625 61,625
Off-Balance sheet commitmentsOperating leases $ 30 $ 60 $ 88 $ 87 $ 84 $ 311 $ 656 $ 593 $ – $ 1,909Credit commitments(3) 4,661 5,913 12,862 18,293 17,254 24,091 97,773 4,819 – 185,666Financial guarantees(4) – – – – – – – – 36,344 36,344Outsourcing obligations(5) 19 37 54 53 53 207 517 – 1 941
(1) Includes primarily impaired mortgages.(2) Includes primarily overdrafts and impaired loans.(3) Includes the undrawn component of committed credit and liquidity facilities.(4) Includes outstanding balances of guarantees, standby letters of credit and commercial letters of credit which may expire undrawn.(5) The Bank relies on outsourcing arrangements for certain support and/or business functions, including, but not limited to, computer operations and cheque and bill payment processing. Outsourcing partners include, among others,
IBM Canada and Symcor Inc.
2 0 1 7 S C O T I A B A N K A N N U A L R E P O R T | 89

MANAGEMENT’S DISCUSSION AND ANALYSIS
As at October 31, 2016
($ millions)
Lessthan one
month
One tothree
months
Threeto six
months
Six tonine
months
Nine totwelve
months
One totwo
years
Twoto fiveyears
Overfive
years
Nospecific
maturity Total
AssetsCash and deposits with financial
institutions and precious metals $ 37,703 $ 1,071 $ 320 $ 237 $ 1,198 $ 932 $ 537 $ 38 $ 12,750 $ 54,786Trading assets 8,579 7,984 2,485 2,754 2,762 4,683 17,149 20,109 42,056 108,561Financial instruments designated at fair
value through profit or loss – – – – 205 – 16 – – 221Securities purchased under resale
agreement and securities borrowed 70,343 13,250 6,156 1,541 839 – – – – 92,129Derivative financial instruments 2,311 3,041 1,210 1,218 900 3,694 9,986 19,297 – 41,657Investment securities – available-for-sale 1,933 4,088 3,265 2,641 1,301 5,666 23,587 5,945 2,083 50,509Investment securities – held-to-maturity 207 439 1,162 522 1,003 4,347 14,434 296 – 22,410Loans 23,431 24,057 26,091 25,375 26,331 81,473 190,391 31,851 51,164 480,164
Residential mortgages 3,382 5,485 8,771 12,693 10,796 48,038 112,675 19,265 1,783(1) 222,888Personal and credit cards 2,790 2,484 2,902 3,154 2,777 10,277 20,914 5,813 48,391 99,502Business and government 17,259 16,088 14,418 9,528 12,758 23,158 56,802 6,773 5,616(2) 162,400Allowance for credit losses – – – – – – – – (4,626) (4,626)
Customers’ liabilities under acceptances 9,899 1,816 248 9 6 – – – – 11,978Other assets – – – – – – – – 33,851 33,851
Liabilities and equityDeposits $ 55,066 $ 59,091 $ 55,977 $ 24,792 $ 22,794 $ 50,504 $ 75,096 $ 13,125 $ 255,432 $ 611,877
Personal 6,944 8,892 9,131 7,392 6,501 15,206 16,317 549 128,370 199,302Non-personal 48,122 50,199 46,846 17,400 16,293 35,298 58,779 12,576 127,062 412,575
Financial instruments designated at fairvalue through profit or loss – 4 – – 3 110 1,038 304 – 1,459
Acceptances 9,899 1,816 248 9 6 – – – – 11,978Obligations related to securities sold short 80 200 388 897 22 2,755 4,544 9,039 5,387 23,312Derivative financial instruments 1,711 2,237 1,399 1,399 1,035 4,267 10,473 19,866 – 42,387Obligations related to securities sold under
repurchase agreements and securitieslent 87,130 7,050 215 335 2,352 1 – – – 97,083
Subordinated debentures – – – – – – – 7,633 – 7,633Other liabilities 568 819 591 316 550 1,434 2,432 4,094 31,912 42,716Total equity – – – – – – – – 57,821 57,821
Off-Balance sheet commitmentsOperating leases $ 28 $ 60 $ 88 $ 85 $ 83 $ 291 $ 631 $ 536 $ – $ 1,802Credit commitments(3) 5,081 5,170 12,498 15,381 20,870 15,723 93,842 5,680 – 174,245Financial guarantees(4) – – – – – – – – 35,297 35,297Outsourcing obligations 17 35 50 49 49 197 114 – 1 512
(1) Includes primarily impaired mortgages.(2) Includes primarily overdrafts and impaired loans.(3) Includes the undrawn component of committed credit and liquidity facilities.(4) Includes outstanding balances of guarantees, standby letters of credit and commercial letters of credit which may expire undrawn.
90 | 2 0 1 7 S C O T I A B A N K A N N U A L R E P O R T

MA
NA
GEM
ENT’S
DISC
USSIO
NA
ND
AN
ALY
SIS|
RISK
MA
NA
GE
ME
NT
Other Risks
Operational Risk
Operational risk is the risk of loss, resulting from people, inadequate or failed processes and systems, or from external events.Operational risk includes legal risk but excludes strategic risk and reputational risk. Operational risk in some form exists in each of theBank’s business and support activities and can result in financial loss, regulatory sanctions and damage to the Bank’s reputation.Operational risk is inherent in all our activities, including the practices and controls used to manage other risks. Failure to manageoperational risk can result in direct or indirect financial loss, but also in regulatory sanctions and reputational impact.
Governance and organization
The Bank’s Operational Risk Management Framework sets out an integrated approach to identify, assess, control, mitigate and report operational risksacross the Bank. The following are key components of the Bank’s Operational Risk Management Framework:
• The Bank’s Risk and Control Self-Assessment program, which includes formal reviews of significant units, operations and processes to identify andassess operational risks. This program provides a basis for management to ensure that key risks have been identified and that controls arefunctioning effectively. Business line management attests to the accuracy of each assessment and develops action plans to mitigate residual riskexposure, as appropriate.
• The Bank’s scenario analysis program provides a forward looking view of key risks and provides management with insights into how plausible buthighly unlikely operational risk events might occur. Scenario analysis will also assist in the selection of severity distributions in the Bank’s AdvancedMeasurement Approach (AMA) capital model (discussed below).
• The Bank’s Key Risk Indicator (KRI) program provides information on the level of exposure to a given operational risk to a particular point in timeand can help to monitor potential shifts in risk conditions or new emerging risk and/or measure residual risk exposure and effectiveness of controls.
• The Business Environment and Internal Control Factors (BEICF) program incorporates the impact of key business environment and internal controlfactors into the regulatory capital allocated to divisions by utilizing a BEICF scorecard. The scorecard is used to adjust capital calculations producedusing the Bank’s AMA capital model and due to its forward-looking nature, it also assists with identifying new trends and emerging risks.
• The Bank’s New Initiatives Risk Management Policy which describes the general principles applicable to the review, approval and implementation ofnew products and services within Scotiabank and is intended to provide overarching guidance.
• The Bank’s centralized operational loss event database, which captures key information on operational losses and near-misses.
• The Bank’s monitoring of industry events, identifies significant losses incurred at other financial institutions and provides a reference for reviewingand assessing the Bank’s own risk exposure.
• The Bank’s training programs, including the mandatory Anti-Money Laundering, Operational Risk and Information Security courses andexaminations which ensure employees are aware and equipped to safeguard our customers’ and the Bank’s assets.
• Operational risk reporting is provided to the Bank’s senior executive management and the Board of Directors, and includes information relating tokey events, results, trends and themes across the operational risk tools. The combination of these information sources provides both a backwardand forward-looking view of operational risk at the Bank.
Operational risk capital
There are two methods for the calculation of operational risk regulatory capital available to the Bank under Basel framework – The StandardizedApproach and the Advanced Measurement Approach (AMA). In 2016, OSFI approved our application to use the Advanced Measurement Approach(AMA) for operational risk, subject to a capital floor. In 2017, we formally began utilizing AMA to report regulatory capital.
Information Technology (IT) & Cybersecurity Risk
IT risk refers to the likelihood of failures or deficiencies related to the IT environment that may result in loss or other negative impact tothe Bank. IT risk is the business risk associated with the use, ownership, operation, involvement, influence and adoption of IT within anenterprise. Cybersecurity risk is a sub-discipline of IT risk, and refers to the protection of information assets by addressing threats toinformation processed, stored, and transported by internetworked information systems. IT & Cybersecurity risk consists of informationtechnology related events (e.g., cybersecurity incidents, outages) that could potentially have an adverse impact on our business. Suchevents could result in business interruption, service disruptions, theft of intellectual property and confidential information, additionalregulatory scrutiny, litigation and reputational damage.
The Board of Directors approves the IT Risk Management Policy and the Information Security Policy to ensure the Bank’s IT environment continues tobe reliable, secure, resilient and robust in supporting its business strategies and objectives. The Bank has established an IT Risk ManagementFramework and Information Security Governance Framework to provide the structure for the effective implementation of those policies in the ITenvironment.
Protecting data and systems against an ever-changing array of digital threats remains a top risk priority for the Bank. The past year highlighted a largenumber of high-profile data breaches involving organizations of all sizes from multiple industries. As cyber-crimes are becoming more widespread,costly and time consuming to resolve, businesses are faced with an increased possibility of legal exposure, reputation damage, operational interruptionand financial impact. The Bank continues to strengthen its cyber security program and is expanding its capabilities to defend against potential threatsand minimize the impact of cyber security attacks. The Bank also regularly tests preparedness to respond to events outside of the Bank’s direct controlsuch as simulations of cyberattacks, and continually reviews and enhances its capabilities and infrastructure.
2 0 1 7 S C O T I A B A N K A N N U A L R E P O R T | 91

MANAGEMENT’S DISCUSSION AND ANALYSIS
Compliance Risk
Compliance Risk is the risk that a business activity may not be conducted in conformity with applicable Regulations, internal policies andprocedures and ethical standards expected by regulators, customers, investors, employees and other stakeholders. “Regulations” meansall Governmental Acts, laws, rules, regulations, regulatory guidelines and industry or self-regulatory organizational codes of conduct,rules and by-laws.
The Bank conducts business in many jurisdictions around the world and provides a wide variety of financial products and services through its variouslines of business and operations. It is subject to, and must comply with, many and changing Regulations by governmental agencies, supervisoryauthorities and self-regulatory organizations in all the jurisdictions in which the Bank operates. The regulatory bar is constantly rising with Regulationsbeing more vigorously enforced and new Regulations being enacted. The bar of public expectations is also constantly rising. Regulators and customersexpect the Bank and its employees will operate its business in compliance with applicable laws and will refrain from unethical practices.
Compliance risk is managed on an enterprise-wide basis throughout the Bank via the operation of the Scotiabank Compliance Program (“theProgram”) which includes the appointment of a Chief Compliance and Regulatory Officer (CCRO) who serves as the Chief Compliance Officer for theBank and is responsible for overseeing Compliance Risk Management within the Bank. The CCRO is responsible for assessing the adequacy of,adherence to and effectiveness of the Program, as well as for the development and application of written compliance policies and procedures that arekept up to date and approved by senior management, assessing and documenting compliance risks, developing and maintaining a written compliancetraining program, which in each case is performed either directly or indirectly by other departments within the Bank in coordination with GlobalCompliance. This program and these ancillary activities are subject to Internal Audit’s periodic review to assess the effectiveness of the Program.
The Board-approved Scotiabank Compliance Policy describes the general policies and principles applicable to compliance risk management withinScotiabank and encompasses the Bank’s Regulatory Compliance Management framework as contemplated by OSFI Guideline E-13. The CompliancePolicy is an integral part of the enterprise-wide policies and procedures that collectively articulate the Bank’s governance and control structure. Othermore specifically focused compliance risk management policies and procedures may be developed within the framework established by theCompliance Policy where necessary or appropriate.
Money Laundering & Terrorist Financing Risk
Money Laundering & Terrorist Financing (ML/TF) risk is the susceptibility of Scotiabank to be used by individuals or organizations tolaunder the proceeds of crime, finance terrorism, or violate economic sanctions. It also includes the risk that Scotiabank does not conformto applicable Anti-Money Laundering (“AML”) / Anti-Terrorist Financing (“ATF”) or sanctions legislation, or does not apply adequatecontrols reasonably designed to deter and detect ML/TF and sanctions violations or to file any required regulatory reports.
Money laundering, terrorist financing, and sanctions risks are managed throughout the Bank via the operation of the Bank’s AML/ATF and Sanctionsprogram (“the Program”) which includes the appointment of a Chief Anti-Money Laundering Officer responsible for the Program, development andapplication of written compliance policies and procedures that are kept up to date and approved by senior management, assessing and documentingthe risk of money laundering, terrorist-financing or sanctions violations, developing and maintaining a written ongoing compliance training program,and regular review of the effectiveness of the Program conducted by Internal Audit. The Chief Anti-Money Laundering Officer has unfettered accessto, and direct communication with, Executive Management of the Bank and its Board.
In providing financial services to its customers, the Bank conducts Customer Due Diligence sufficient to form a reasonable belief that it knows the trueidentity of its customers, including in the case of an entity customer its material beneficial owners. The Bank will not maintain anonymous accounts,nor will it maintain accounts for shell banks. Consistent with a risk-based approach, the Bank assesses the risks of its customers and, whereappropriate, conducts enhanced due diligence on those who are considered higher risk. The Bank also conducts ongoing risk-based monitoring of itscustomers to detect and report suspicious transactions, and conducts customer and transaction screening against terrorist, sanctions, and otherdesignated watch-lists. All employees are provided with mandatory AML/ATF training on an annual basis.
The Bank’s business units conduct an annual self-assessment of their ML/TF risks, as well as self-assessments of their control measures designed tomanage such risks. The process is overseen by the Bank’s Global AML/ATF Unit and the results shared with the Bank’s Senior Management and itsBoard.
Reputational Risk
Reputational risk is the risk that negative publicity regarding Scotiabank’s conduct, business practices or associations, whether true ornot, will adversely affect its revenues, operations or customer base, or require costly litigation or other defensive measures.
Negative publicity about an institution’s business practices may involve any aspect of its operations, but usually relates to questions of business ethicsand integrity, or quality of products and services. Negative publicity and attendant reputational risk frequently arise as a by-product of some otherkind of risk management control failure.
Reputational risk is managed and controlled throughout the Bank by codes of conduct, governance practices and risk management programs, policies,procedures and training. Many relevant checks and balances are outlined in greater detail under other risk management sections, particularlyOperational Risk, where reference is made to the Bank’s well-established compliance program. All directors, officers and employees have aresponsibility to conduct their activities in accordance with the Scotiabank’s Code of Conduct, and in a manner that minimizes reputational risk. Whileall employees, officers and directors are expected to protect the reputation of Scotiabank by complying with the Scotiabank’s Code of Conduct, theactivities of the Legal, Corporate Secretary, Public, Corporate and Government Affairs and Compliance departments, and the Reputational RiskCommittee, are particularly oriented to the management of reputational risk.
In providing credit, advice, or products to customers, or entering into associations, the Bank considers whether the transaction, relationship orassociation might give rise to reputational risk. The Bank has an established, Board-approved Reputational Risk Policy, as well as policy and proceduresfor managing reputational and legal risk related to structured finance transactions. Global Risk Management plays a significant role in theidentification and management of reputational risk related to credit underwriting. In addition, the Reputational Risk Committee is available to supportGlobal Risk Management, as well as other risk management committees and business units, with their assessment of reputational risk associated withtransactions, business initiatives, and new products and services.
92 | 2 0 1 7 S C O T I A B A N K A N N U A L R E P O R T

MA
NA
GEM
ENT’S
DISC
USSIO
NA
ND
AN
ALY
SIS|
RISK
MA
NA
GE
ME
NT
The Reputational Risk Committee considers a broad array of factors when assessing transactions, so that the Bank meets, and will be seen to meet,high ethical standards. These factors include the extent, and outcome, of legal and regulatory due diligence pertinent to the transaction; the economicintent of the transaction; the effect of the transaction on the transparency of a customer’s financial reporting; the need for customer or publicdisclosure; conflicts of interest; fairness issues; and public perception.
The Committee may impose conditions on customer transactions, including customer disclosure requirements to promote transparency in financialreporting, so that transactions meet Bank standards. In the event the Committee recommends not proceeding with a transaction and the sponsor ofthe transaction wishes to proceed, the transaction is referred to the Risk Policy Committee.
Environmental Risk
Environmental risk refers to the possibility that environmental concerns involving Scotiabank or its customers could affect the Bank’sperformance.
To safeguard the Bank and the interests of its stakeholders, Scotiabank has an environmental policy, which is approved by the Bank’s Board ofDirectors. The policy guides day-to-day operations, lending practices, supplier agreements, the management of real estate holdings and externalreporting practices. It is supplemented by specific policies and practices relating to individual business lines.
Environmental risks associated with the business operations of each borrower and any real property offered as security are considered in the Bank’scredit evaluation procedures. This includes an environmental assessment where applicable, and commentary on the impact of climate (includingregulatory, physical or reputational impacts) on the borrower. Global Risk Management has primary responsibility for establishing the related policies,processes and standards associated with mitigating environmental risk in the Bank’s lending activities. Decisions are taken in the context of the riskmanagement framework.
In the area of project finance, the Equator Principles have been integrated into the Bank’s internal processes and procedures since 2006. The EquatorPrinciples help financial institutions determine, assess, manage and report environmental and social risk. The principles apply to project finance loansand advisory assignments where total capital costs exceed US$10 million, and to certain project-related corporate loans. The Equator Principles providesafeguards for sensitive projects to ensure protection of natural habitats and the rights of indigenous peoples, as well as safeguards against the use ofchild and forced labour.
The Bank’s Environmental Policy plays a prominent role in guiding the reduction of the Bank’s environmental footprint. The Real Estate Departmentadheres to an Environmental Compliance Policy to ensure responsible management of the Bank’s real estate holdings from an environmentalperspective. In addition, a variety of reduction measures are in place for energy, paper and waste in the Bank’s corporate offices and branch networks.Internal tracking systems are in place with respect to energy use, greenhouse gas emissions (GHG) and paper consumption. Since 2012, GHGemissions data for the branch network and corporate offices has been externally verified.
To ensure it continues to operate in an environmentally responsible manner, the Bank monitors policy and legislative requirements through ongoingdialogue with government, industry and stakeholders in countries where it operates. Scotiabank has been meeting with environmental organizations,industry associations and socially responsible investment organizations with respect to the role that banks can play to help address issues such asclimate change, protection of biodiversity, promotion of sustainable forestry practices, implementing the recommendations of the Task Force onClimate-related Financial Disclosure, and other environmental issues important to its customers and communities where it operates. The Bank has anongoing process of reviewing its practices in these areas.
Scotiabank has a number of environmentally focused products and services, including: an EcoEnergy Financing program designed to support personaland small business customers who wish to install small-scale renewable energy projects; and an auto loan product for hybrid, electric and clean dieselvehicles. As well, Scotiabank has the Commodities Derivatives group, which assists corporate clients by providing liquidity and hedge solutions in thecarbon market.
Environmental Reporting
Scotiabank is also a signatory to, and participant in the Carbon Disclosure Project, which provides corporate disclosure to the investment communityon greenhouse gas emissions and climate change management. Further information is available in the Bank’s annual Corporate Social ResponsibilityReport.
Insurance Risk
The Bank is both a distributor of third party insurance products and underwriter of insurance risk. As a distributor of third partyinsurance products, the Bank earns fees but bears no insurance risk. The Bank bears insurance risk in its role as an underwriter, eitherthrough direct underwriting or via reinsurance.
Insurance risk is the risk of potential financial loss due to actual experience being different from that assumed in the pricing process ofthe insurance products.
Insurance by nature involves the distribution of products that transfer individual risks to the issuer with the expectation of a return built into theinsurance premiums earned. The Bank is exposed to insurance risk primarily through its creditor, life and select property and casualty insurance andreinsurance products.
The insurance governance and risk management frameworks are calibrated within each insurance subsidiary commensurate with the nature andmateriality of risk assumed. Senior management within the insurance business subsidiaries has primary responsibility for managing insurance risk, withoversight by Global Risk Management through the Insurance Risk Committee. The insurance subsidiaries have their own boards of directors, as well asindependent appointed actuaries who provide additional risk management oversight.
The insurance subsidiaries maintain a number of policies and practices to manage insurance risk. Sound product design is an essential element. Thevast majority of risks insured are short-term in nature, that is, they do not involve long-term pricing guarantees. Geographic diversification andproduct-line diversification are important elements as well. Reinsurance is commonly used as an effective tool to manage the insurance risk exposures.Insurance risk is also managed through effective underwriting and claim adjudication practices, ongoing monitoring of experience, and stress-testingscenario analysis.
2 0 1 7 S C O T I A B A N K A N N U A L R E P O R T | 93

MANAGEMENT’S DISCUSSION AND ANALYSIS
Strategic Risk
Strategic risk is the risk that the enterprise, business lines or corporate functions will make strategic choices that are ineffective orinsufficiently resilient to changes in the business environment, or poorly execute such strategies.
The Board of Directors is ultimately responsible for oversight of strategic risk, by adopting a strategic planning process and approving, on an annualbasis, a strategic plan for the Bank.
The Bank manages its strategic planning process through a series of coordinated efforts between the Executive Management Team, the Business Linesand the Corporate Functions. These efforts address a wide range of relevant considerations including capital and resource allocation, businessinitiatives, strategic transactions and investments, stress testing and alignment with the Bank’s Risk Appetite Framework. These considerations arereviewed in a consistent and disciplined manner. The process involves input from the entire Executive Management Team and from the Board ofDirectors.
On an annual basis, a comprehensive update on the Strategic Agenda is prepared that summarizes the Bank’s key strategic considerations, and ispresented by the President and Chief Executive Officer to the Board of Directors for their review and approval.
The execution and evaluation of strategic plans within the Bank is critically important to the Bank’s enterprise-wide risk management framework. TheBank makes continuous efforts to ensure that all employees are aware of the Bank’s overall strategic direction, and that employees are also aware ofthe strategies and objectives for their respective business line or corporate function. On an ongoing basis, the business lines and corporate functionsidentify, manage and assess the internal and external considerations – including risk factors – that could affect the achievement of their strategicobjectives. These matters are considered on an enterprise-wide basis by the Bank’s Executive Management Team, which makes adjustments, asrequired.
94 | 2 0 1 7 S C O T I A B A N K A N N U A L R E P O R T

MA
NA
GEM
ENT’S
DISC
USSIO
NA
ND
AN
ALY
SIS|
CO
NT
RO
LSA
ND
AC
CO
UN
TIN
GP
OLIC
IES
CONTROLS AND ACCOUNTING POLICIES
Controls and Procedures
Management’s responsibility for financial information contained in this annual report is described on page 126.
Disclosure controls and procedures
The Bank’s disclosure controls and procedures are designed to provide reasonable assurance that information is accumulated and communicated tothe Bank’s management, including the President and Chief Executive Officer and the Group Head and Chief Financial Officer, as appropriate, to allowtimely decisions regarding required disclosure.
As of October 31, 2017, the Bank’s management, with the participation of the President and Chief Executive Officer and Group Head and ChiefFinancial Officer, evaluated the effectiveness of its disclosure controls and procedures, as defined under the rules adopted by the U.S. Securities andExchange Commission (SEC) and the Canadian securities regulatory authorities, and have concluded that the Bank’s disclosure controls andprocedures are effective.
Internal control over financial reporting
Management of the Bank is responsible for establishing and maintaining adequate internal control over financial reporting. These controls includepolicies and procedures that:
• pertain to the maintenance of records that, in reasonable detail, accurately and fairly reflect the transactions and dispositions of the assets of theBank;
• provide reasonable assurance that transactions are recorded as necessary to permit preparation of financial statements in accordance withInternational Financial Reporting Standards (IFRS) as issued by the International Accounting Standards Board (IASB), and that receipts andexpenditures are being made only in accordance with authorizations of management and directors of the Bank; and
• provide reasonable assurance regarding prevention or timely detection of unauthorized acquisition, use or disposition of the Bank’s assets thatcould have a material effect on the financial statements.
All control systems contain inherent limitations, no matter how well designed. As a result, the Bank’s management acknowledges that its internalcontrol over financial reporting will not prevent or detect all misstatements due to error or fraud. In addition, management’s evaluation of controlscan provide only reasonable, not absolute, assurance that all control issues that may result in material misstatements, if any, have been detected.
Management assessed the effectiveness of internal control over financial reporting, using the Internal Control-Integrated Framework 2013 issued bythe Committee of Sponsoring Organizations of the Treadway Commission (COSO), and based on that assessment concluded that internal control overfinancial reporting was effective as of October 31, 2017.
Changes in internal control over financial reporting
There have been no changes in the Bank’s internal control over financial reporting that have materially affected, or are reasonably likely to materiallyaffect, the Bank’s internal control over financial reporting during the year ended October 31, 2017.
Critical Accounting EstimatesThe Bank’s accounting policies are integral to understanding and interpreting the financial results reported in this annual report. Note 3 to theConsolidated Financial Statements, summarizes the significant accounting policies used in preparing the Bank’s consolidated financial statements.Certain of these policies require management to make estimates, assumptions and subjective judgements that are difficult, complex, and often relateto matters that are inherently uncertain. The policies discussed below are considered to be particularly important to the presentation of the Bank’sfinancial position and results of operations, because changes in the estimates, assumptions and judgements could have a material impact on theBank’s consolidated financial statements. These estimates, assumptions and judgements are adjusted in the normal course of business to reflectchanging underlying circumstances.
Allowance for credit losses
The allowance for credit losses represents management’s best estimate of the probable credit losses in the portfolio of deposits with other institutions,loans to borrowers and acceptances. Management undertakes regular reviews of credit quality to assess the adequacy of the allowance for creditlosses. This process requires the use of estimates, assumptions and subjective judgements at many levels. These subjective judgements includeidentifying credits that are impaired, and considering factors specific to individual credits, as well as portfolio characteristics and risks. Changes tothese estimates or use of other reasonable judgements could directly affect the provision for credit losses.
The allowance for credit losses is comprised of collective and individually assessed allowances.
Allowances in respect of individually significant credit exposures are an estimate of probable incurred losses related to existing impaired loans. Inestablishing these allowances applicable to individual credit exposures, management individually assesses each loan for objective indicators ofimpairment and forms a judgement as to whether the loan is impaired. Loan impairment is recognized when, in management’s opinion, there is nolonger reasonable assurance that interest and principal payments will be collected based on original contractual terms. Once a loan is determined tobe impaired, management estimates its net realizable value by making judgements relating to the timing of future cash flow amounts, the fair valueof any underlying security pledged as collateral, costs of realization, observable market prices, and expectations about the future prospects of theborrower and any guarantors.
Individual provisions were lower in 2017 than in 2016 across all business lines.
For loans that have not been individually assessed as impaired, the Bank pools them into groups to assess on a collective basis. Collective allowancesare calculated for performing loans and impaired loans.
Retail loans represented by residential mortgages, credit card loans and most personal loans are considered by the Bank to be homogenous groups ofloans that are not considered individually significant and are assessed on a collective basis. Mortgages are collectively assessed for impairment, takinginto account number of days past due, historical loss experience and incorporating both qualitative and quantitative factors including the currentbusiness and economic environment and the realizable value of the collateral to determine the appropriate value of the collective impairment
2 0 1 7 S C O T I A B A N K A N N U A L R E P O R T | 95

MANAGEMENT’S DISCUSSION AND ANALYSIS
allowance. A roll rate methodology is used to determine impairment losses on a collective basis for credit cards and other personal loans becauseindividual loan assessment is impracticable. This methodology employs statistical analysis of historical data and experience of delinquency and defaultto estimate the amount of loans that will be eventually written off as a result of events not identifiable on an individual loan basis.
An allowance is also determined in respect of probable incurred losses that are inherent in the portfolio, of performing loans, but have not yet beenspecifically identified on an individual basis. Management establishes this allowance on a collective basis through an assessment of quantitative andqualitative factors. Using an internally developed methodology, management arrives at an initial quantitative estimate of the collective allowance forthe performing portfolio based on numerous factors, including historical average default probabilities, loss given default rates and exposure at defaultfactors. Material changes in any of these parameters or assumptions would affect the range of expected credit losses and, consequently, could affectthe collective allowance level. For example, if either the probability of default or the loss given default rates for the non-retail portfolio wereindependently increased or decreased by 10%, the methodology would indicate an increase or decrease to the quantitative estimate of approximately$70 million (2016 – $71 million).
A qualitative assessment of the collective allowance is made based on observable data, such as: economic trends and business conditions, portfolioconcentrations, risk migrations and recent trends in volumes and severity of delinquencies, and a component for the imprecision inherent in themethodology and parameters. Management reviews the collective allowance quarterly to assess whether the allowance is at the appropriate level inrelation to the size of the portfolio, inherent credit risks and trends in portfolio quality.
The total collective allowance for credit losses as at October 31, 2017, was $3,355 million, a decrease of $143 million from a year earlier. Of thecollective allowance amount, $625 million is attributable to business and government performing loans (2016 – $662 million), with the remainderallocated to personal lending and credit cards of $2,303 million (2016 – $2,258 million) and residential mortgages of $427 million (2016 –$578 million). These amounts for personal lending and credit cards, and for residential mortgages include allowances for both performing andimpaired loans.
Fair value of financial instruments
All financial instruments are measured at fair value on initial recognition. Subsequent measurement of a financial instrument depends on itsclassification. Non-trading loans and receivables, certain securities and most financial liabilities are carried at amortized cost unless classified ordesignated as fair value through profit and loss or available-for-sale at inception. All other financial instruments, including those designated as fairvalue through profit and loss at inception, are carried at fair value.
Fair value of a financial asset or liability is the price that would be received to sell an asset or paid to transfer a liability in an orderly transactionbetween market participants in the principal, or in its absence, the most advantageous market to which the Bank has access at the measurement date.
The best evidence of fair value for a financial instrument is the quoted price in an active market. Quoted market prices represent a Level 1 valuation.Quoted prices are not always available for over-the-counter transactions, as well as transactions in inactive or illiquid markets. In these instances,internal models that maximize the use of observable inputs are used to estimate fair value. The chosen valuation technique incorporates all the factorsthat market participants would take into account in pricing a transaction. When all significant inputs are observable, the valuation is classified asLevel 2. Financial instruments traded in a less active market have been valued using indicative market prices, present value of cash flows or othervaluation techniques. Fair value estimates normally do not consider forced or liquidation sales. Where financial instruments trade in inactive markets orwhen using models where observable parameters do not exist, greater management judgement is required for valuation purposes such as multiple ofthe underlying earnings, pricing by third party providers, discount rates, volatilities and correlations. Valuations that require the significant use ofunobservable inputs are considered Level 3. The calculation of estimated fair value is based on market conditions at a specific point in time andtherefore may not be reflective of future fair values.
The Bank has controls and processes in place to ensure that the valuation of financial instruments is appropriately determined. Global RiskManagement (GRM) is responsible for the design and application of the Bank’s risk management framework. GRM is independent from the Bank’sbusiness units and is overseen by Executive Management and the Board of Directors. Senior management committees within GRM oversee andestablish standards for risk management processes that are critical in ensuring that appropriate valuation methodologies and policies are in place fordetermining fair value.
Where possible, valuations are based on quoted prices or observable inputs obtained from active markets. GRM oversees a monthly Independent PriceVerification (IPV) process in order to assess the reliability and accuracy of prices and inputs used in the determination of fair value. The IPV process isperformed by price verification groups that are independent from the business. The Bank maintains an approved list of pricing sources that are used inthe IPV process. These sources include, but are not limited to, brokers, dealers and consensus pricing services. The valuation policies relating to the IPVprocess require that all pricing or rate sources used be external to the Bank. On a periodic basis, an independent assessment of pricing or rate sourcesis also performed by GRM to determine market presence or market representative levels.
Where quoted prices are not readily available, such as for transactions in inactive or illiquid markets, internal models that maximize the use ofobservable inputs are used to estimate fair value. An independent senior management committee within GRM oversees the vetting, approval andongoing validation of valuation models used in determining fair value. Risk policies associated with model development are approved by ExecutiveManagement and/or key risk committees.
In determining fair value for certain instruments or portfolios of instruments, valuation adjustments or reserves may be required to arrive at a moreaccurate representation of fair value. The Bank’s policy of applying valuation reserves to a portfolio of instruments is approved by a seniormanagement committee. These reserves include adjustments for credit risk, bid-offer spreads, unobservable parameters, constraints on prices ininactive or illiquid markets and when applicable funding costs. The methodology for the calculation of valuation reserves are reviewed at least annuallyby senior management.
Valuation adjustments recorded against the fair value of financial assets and financial liabilities totaled $94 million as at October 31, 2017, (2016 –$119 million), net of any write-offs. These valuation adjustments are due mainly to credit risk considerations and bid-offer spreads on derivativetransactions.
As at October 31, 2017, a funding valuation adjustment (FVA) of $80 million pre-tax (2016 – $92 million) was recorded relating to uncollateralizedderivative instruments.
The Bank discloses the classification of all financial instruments carried at fair value in a hierarchy based on the determination of fair value. Thevaluation hierarchy is as follows:
• Level 1 – fair value is based on unadjusted quoted prices in active markets for identical instruments,
96 | 2 0 1 7 S C O T I A B A N K A N N U A L R E P O R T

MA
NA
GEM
ENT’S
DISC
USSIO
NA
ND
AN
ALY
SIS|
CO
NT
RO
LSA
ND
AC
CO
UN
TIN
GP
OLIC
IES
• Level 2 – fair value is based on models using significant market-observable inputs other than quoted prices for the instruments, or
• Level 3 – fair value is based on models using significant inputs that are not based on observable market data.
The Bank’s assets and liabilities which are carried at fair value as classified by the valuation hierarchy are reflected in Note 6. The percentage of eachasset and liability category by fair value hierarchy level are outlined as follows:
T54 Fair value hierarchy of financial instruments carried at fair valueAssets Liabilities
Fair value hierarchyAs at October 31, 2017
Tradingassets
(incl. preciousmetals)
Available-for-sale
securities Derivatives
Obligationsrelated tosecurities
sold short Derivatives
Level 1 62% 58% 2% 90% 2%Level 2 38% 40% 98% 10% 97%Level 3 –% 2% –% –% 1%
100% 100% 100% 100% 100%
Impairment of investment securities
Investment securities are evaluated for impairment at the end of each reporting date, or more frequently, if events or changes in circumstancesindicate the existence of objective evidence of impairment.
In the case of equity instruments classified as available-for-sale, a significant or prolonged decline in the fair value of the security below its original costis considered objective evidence of impairment. A significant decline in fair value is evaluated against the original cost of the asset at initialrecognition; whereas for prolong, the decline is evaluated against the continuous period in which the fair value of the asset has been lower than itsoriginal cost at initial recognition. In the case of debt instruments classified as available-for-sale and held-to-maturity investment securities, the criteriafor assessment of impairment is consistent with the criteria for impairment of loans.
When a decline in value of available-for-sale debt or equity instrument is due to impairment, the value of the security is written down to fair value.The losses arising from impairment are reclassified from accumulated other comprehensive income and included in net gain on investment securitieswithin non-interest income in the Consolidated Statement of Income.
The losses arising from impairment of held-to-maturity investment securities are recognized in net gain on investment securities within other operatingincome in the Consolidated Statement of Income.
Reversals of impairment losses on available-for-sale debt instruments resulting from increases in fair value related to events occurring after the date ofimpairment are included in net gain on investment securities within non-interest income in the Consolidated Statement of Income, to a maximum ofthe original impairment charge. Reversals of impairment on available-for-sale equity instruments are not recognized in the Consolidated Statement ofIncome; increases in fair value of such instruments after impairment are recognized in accumulated other comprehensive income.
Reversals of impairment losses on held-to-maturity investment securities are included in net gain on investment securities within non-interest incomein the Consolidated Statement of Income, to a maximum of the amortized cost of the investment before the original impairment charge.
As at October 31, 2017, the gross unrealized gains on available-for-sale securities recorded in accumulated other comprehensive income were$381 million (2016 – $740 million), and the gross unrealized losses were $422 million (2016 – $285 million). Net unrealized losses were therefore$41 million (2016 – gains of $455 million) before hedge amounts. The net unrealized losses after hedge amounts were $48 million (2016 – gains of$26 million).
At October 31, 2017, the unrealized loss recorded in accumulated other comprehensive income relating to securities in an unrealized loss position formore than 12 months was $263 million (2016 – $206 million). This unrealized loss was comprised of $132 million (2016 – $11 million) in debtsecurities, $87 million (2016 – $160 million) related to preferred shares and $44 million (2016 – $35 million) related to common shares. Theunrealized losses on the debt securities arose primarily from changes in interest rates and credit spreads. For debt securities, based on a number ofconsiderations, including underlying credit of the issuers, the Bank expects that future interest and principal payments will continue to be received ona timely basis in accordance with the contractual terms of the security.
Employee benefits
The Bank sponsors a number of employee benefit plans, including pension and other benefit plans for eligible employees in Canada, andinternationally. The pension plans include both defined benefit plans, which are generally based on years of service and average earnings at retirementas well as defined contribution plans. Other benefits generally include post-retirement health care, dental care and life insurance, along with otherlong-term employee benefits such as long-term disability.
Employee benefit expense and the related benefit obligation are calculated using actuarial methods and certain actuarial assumptions. Theseassumptions are based on management’s best estimate and are reviewed and approved annually. The management assumptions with the greatestpotential impact are the discount rates. These rates are used for measuring the benefit obligation, service cost and interest cost. Prior to 2016 thediscount rate used to determine annual benefit expense was the same as the rate used to determine the defined benefit obligation. Beginning in2016, separate discount rates were used to determine the annual benefit expense in Canada and the US. These rates were determined with referenceto the yields on high quality corporate bonds with durations that match the various components of the annual defined benefit expense. The discountrate used to determine the annual benefit expense for all other plans continues to be the same as the rate used to determine the defined benefitobligation. If the assumed discount rates were 1% lower, the benefit expense for 2017 would have been $119 million higher. Other key assumptionsinclude future compensation, health care costs, employee turnover, retirement age and mortality. When making these estimates, managementconsiders expectations of future economic trends and business conditions, including inflation rates as well as other factors, such as plan specificexperience and best practices.
The Bank uses a measurement date of October 31, and based on this measurement date, the Bank reported a deficit of $513 million in its principalpension plans and a deficit of $1,392 million in its principal other benefit plans, which are typically unfunded, as at October 31, 2017, as disclosed inNote 27 to the consolidated financial statements.
Actual experience that differs from assumptions made by management will result in a net actuarial gain or loss recognized immediately in othercomprehensive income except for other long-term employee benefits where they are recognized in the Consolidated Statement of Income.
2 0 1 7 S C O T I A B A N K A N N U A L R E P O R T | 97

MANAGEMENT’S DISCUSSION AND ANALYSIS
Note 27 contains details of the Bank’s employee benefit plans, such as the disclosure of pension and other benefit amounts, management’s keyassumptions, and a sensitivity analysis of changes in these assumptions on the employee benefit obligation and expense.
Corporate income taxesManagement exercises judgment in determining the provision for income taxes and deferred income tax assets and liabilities. The provision is basedon management’s expectations regarding the income tax consequences of transactions and events during the period. Management interprets the taxlegislation for each jurisdiction in which the Bank operates and makes assumptions about the expected timing of the reversal of deferred income taxassets and liabilities. If management’s interpretations of the legislation differ from those of the tax authorities or if the actual timing of the reversals ofthe deferred income tax assets and liabilities is not as anticipated, the provision for income taxes could increase or decrease in future periods.
Total deferred tax assets related to the Bank’s unused income tax losses from operations arising in prior years were $417 million as at October 31,2017 (2016 – $484 million). The tax related to temporary differences, unused tax losses and unused tax credits for which no deferred tax asset isrecognized in the Consolidated Statement of Financial Position amounted to $82 million (2016 – $55 million). The amount related to unrecognizedtax losses was $9 million, which will expire as follows: $4 million in 2021 and beyond and $5 million have no fixed expiry date.
The Bank maintains provisions for uncertain tax positions that it believes appropriately reflect the risk of tax positions under discussion, audit, dispute,or appeal with tax authorities, or which are otherwise considered to involve uncertainty. These provisions are made using the Bank’s best estimate ofthe amount expected to be paid based on an assessment of all relevant factors, which are reviewed at the end of each reporting period.
In November 2016, the Bank received a federal reassessment of $179 million for tax and interest as a result of the Canada Revenue Agency denyingthe tax deductibility of certain Canadian dividends received during the 2011 taxation year. In August 2017, the Bank received a reassessment of$185 million for tax and interest for the 2012 taxation year. The circumstances of the dividends subject to the reassessment are similar to thoseprospectively addressed by recently enacted rules which had been introduced in the 2015 Canadian federal budget. The Bank is confident that its taxfiling position was appropriate and in accordance with the relevant provisions of the Income Tax Act (Canada), and intends to vigorously defend itsposition.
Note 26 of the 2017 consolidated financial statements contains further details with respect to the Bank’s provisions for income taxes.
Structured entities
In the normal course of business, the Bank enters into arrangements with structured entities on behalf of its customers and for its own purposes.These structured entities can be generally categorized as multi-seller commercial paper conduits, Bank funding vehicles and structured finance entities.Further details are provided in the off-balance sheet arrangements section.
Management is required to exercise judgement to determine whether a structured entity should be consolidated. This evaluation involvesunderstanding the arrangements, determining whether decisions about the relevant activities are made by means of voting rights or other contractualarrangements and determining whether the Bank controls the structured entity.
The Bank controls an investee when it is exposed, or has rights, to variable returns from its involvement with the investee and has the ability to affectthose returns through its power over the investee. The three elements of control are:
• power over the investee;
• exposure, or rights, to variable returns from involvement with the investee; and
• the ability to use power over the investee to affect the amount of the Bank’s returns.
This definition of control applies to circumstances:
• when voting rights or similar rights give the Bank power, including situations where the Bank holds less than a majority of voting rights or involvingpotential voting rights;
• when an investee is designed so that voting rights are not the dominant factor in deciding who controls the investee (i.e., relevant activities aredirected by contractual arrangements);
• involving agency relationships; and
• when the Bank has control over specified assets of an investee.
The Bank does not control an investee when it is acting in an agent’s capacity. The Bank assesses whether it is an agent by determining whether it isprimarily engaged to act on behalf and for the benefit of another party or parties. Factors that the Bank considers in this assessment include the scopeof its decision-making authority over the investee, the rights held by other parties, the remuneration to which it is entitled, and the Bank’s exposure tovariability of returns from other interests that it holds in the investee.
The analysis uses both qualitative and quantitative analytical techniques and involves the use of a number of assumptions about the businessenvironment in which the structured entity operates and the amount and timing of future cash flows.
The Bank reassesses whether it controls an investee if facts and circumstances indicate that one or more of the three elements of control change.
Management is required to exercise judgement to determine if a change in control event has occurred.
During 2017, there were no change in control events that caused the Bank to change its control conclusion of its multi-seller conduits or otherstructured entities.
As described in Note 14 to the consolidated financial statements and in the discussion of off-balance sheet arrangements, the Bank does not controlthe two Canadian-based multi-seller conduits that it sponsors and they are not required to be consolidated on the Bank’s Consolidated Statement ofFinancial Position. The Bank controls its U.S.-based multi-seller conduit and consolidates it on the Bank’s Consolidated Statement of Financial Position.
Goodwill
For the purpose of impairment testing, goodwill acquired in a business combination is, on the acquisition date, allocated to each of the Bank’s groupof cash-generating units (CGU) that are expected to benefit from the particular acquisition.
Goodwill is not amortized but tested for impairment annually and when circumstances indicate that the carrying value may be impaired.
Goodwill is reviewed at each reporting date to determine whether there is any indication of impairment. Each CGU to which goodwill is allocated forimpairment testing purposes reflects the lowest level at which goodwill is monitored for internal management purposes.
98 | 2 0 1 7 S C O T I A B A N K A N N U A L R E P O R T

MA
NA
GEM
ENT’S
DISC
USSIO
NA
ND
AN
ALY
SIS|
CO
NT
RO
LSA
ND
AC
CO
UN
TIN
GP
OLIC
IES
The Bank determines the carrying value of the CGU using a regulatory capital approach based on credit, market, and operational risks, and leverage,consistent with the Bank’s capital attribution for business line performance measurement. An impairment loss is recognized if the carrying amount ofa CGU exceeds its recoverable amount. The recoverable amount is the greater of fair value less costs of disposal and value in use. If either fair valueless costs of disposal or value in use exceeds the carrying amount, there is no need to determine the other. The recoverable amount for the CGU hasbeen determined using the fair value less costs of disposal method. In arriving at such value an appropriate valuation model is used which considersvarious factors including normalized net income, price earnings multiples and control premium. These calculations are corroborated by valuationmultiples, quoted share prices for publicly traded subsidiaries or other available fair value indicators. An impairment loss, in respect of goodwill, is notreversed.
Significant judgement is applied in determining the recoverable amounts of the CGU and assessing whether certain events or circumstances constituteobjective evidence of impairment.
Goodwill was assessed for annual impairment based on the methodology as at July 31, 2017, and no impairment was determined to exist.
Indefinite life intangible assets
Intangible assets with indefinite useful lives are not amortized but tested for impairment annually and when circumstances indicate that the carryingvalue may be impaired. Intangible assets are reviewed at each reporting date to determine whether there is any indication of impairment.
The recoverable amount is the greater of fair value less costs of disposal and value in use. If either fair value less costs of disposal or value in useexceeds the carrying amount, there is no need to determine the other. Value in use method is used by the Bank to determine the recoverable amountof the intangible asset. In determining value in use, an appropriate valuation model is used which considers factors such as management-approvedcash flow projections, discount rate and terminal growth rate. An impairment loss is recognized if the carrying amount of the intangible asset exceedsits recoverable amount. Impairment losses recognized in prior periods are reassessed at each reporting period for any indication that the loss hasdecreased or no longer exists. An impairment loss is reversed if there has been a change in the estimates used to determine the recoverable amount.An impairment loss is reversed only to the extent that the intangible asset’s carrying amount does not exceed the carrying amount that would havebeen determined if no impairment loss had been recognized.
The recoverable amount is significantly impacted by the discount rate and the terminal value. Significant judgement is applied in determining theintangible asset’s recoverable amount and assessing whether certain events or circumstances constitute objective evidence of impairment.
Intangible assets were assessed for annual impairment based on the methodology as at July 31, 2017, and no impairment was determined to exist.
Provisions
The Bank recognizes a provision if, as a result of a past event, the Bank has a present legal or constructive obligation that can be estimated reliably,and it is probable that an outflow of economic benefits will be required to settle the obligation. Probable in this context means more likely than not.Significant judgement is required in determining whether a present obligation exists and in estimating the probability, timing, and amount of anyfuture outflows.
Off-balance sheet credit risks
The provisions for off-balance sheet credit risks relate primarily to off-balance sheet credit risks such as undrawn lending commitments, letters ofcredit and letters of guarantee. These are collectively assessed in a manner consistent with the collective allowance for performing on-balance sheetcredit risks.
Restructuring
Certain of the Bank’s provisions relate to restructuring as part of the Bank’s efforts to enhance the customer experience, drive digital transformationand improve productivity. Restructuring provisions are primarily related to employee severance and require management’s best estimate of theamount required to settle the obligation. Uncertainty exists with respect to when the obligation will be settled and the amounts ultimately paid, as thiswill largely depend upon individual facts and circumstances. The restructuring provision is expected to be utilized in line with the approved plans; theactual utilization will be assessed quarterly and may lead to changes in the provision amount recorded.
Litigation and other
In the ordinary course of business, the Bank and its subsidiaries are routinely defendants in, or parties to a number of pending and threatened legalactions and regulatory proceedings, including actions brought on behalf of various classes of claimants. In view of the inherent difficulty of predictingthe outcome of such matters, the Bank cannot state what the eventual outcome of such matters will be.
Legal provisions are established when it becomes probable that the Bank will incur an expense related to a legal action and the amount can be reliablyestimated. Such provisions are recorded at the best estimate of the amount required to settle any obligation related to these legal actions as at thebalance sheet date, taking into account the risks and uncertainties surrounding the obligation. Management and internal and external experts areinvolved in estimating any amounts that may be required. The actual costs of resolving these claims may vary significantly from the amount of thelegal provisions. The Bank’s estimate involves significant judgement, given the varying stages of the proceedings, the fact that the Bank’s liability, ifany, has yet to be determined and the fact that the underlying matters will change from time to time. As such, there is a possibility that the ultimateresolution of those legal actions may be material to the Bank’s consolidated results of operations for any particular reporting period.
Future Accounting DevelopmentsThe Bank actively monitors developments and changes in accounting standards from the IASB as well as regulatory requirements from the CanadianSecurities Administrators and OSFI.
Effective November 1, 2017IFRS 9 Financial instruments
On July 24, 2014, the IASB issued IFRS 9 Financial Instruments (“the Standard”), which will replace IAS 39. The Standard covers three broad topics:Classification and Measurement, Impairment and Hedging. In line with OSFI’s advisory, all Canadian D-SIBs, including the Bank are required to earlyadopt IFRS 9 effective November 1, 2017.
2 0 1 7 S C O T I A B A N K A N N U A L R E P O R T | 99

MANAGEMENT’S DISCUSSION AND ANALYSIS
In June 2016, OSFI issued “IFRS 9 Financial Instruments and Disclosures” which provides guidance on the application of IFRS 9 that is consistent withthe BCBS guidance issued in 2015.
Governance and project management
The adoption of IFRS 9 is a significant initiative for the Bank, involving substantial finance, risk management and technology resources. The projectwas managed through a strong governance structure across risk management, finance, technology, and the business units. The Bank’s existing systemof internal controls will be refined and revised where required to meet all the requirements of IFRS 9. The Bank has applied many components of itsexisting governance framework to ensure that appropriate validations and controls will be in place over new key processes and significant areas ofjudgment. Adoption of IFRS 9 in 2018 has resulted in revisions to accounting policies and procedures, changes and amendments to internal controldocuments, applicable credit risk manuals, development of new risk models and associated methodologies and new processes within riskmanagement. Periodic reporting on the progress against plan and results of parallel run was provided to Bank senior management throughout Fiscal2017.
The following is a summary of some of the more significant items that are likely to be important in understanding the impact of the implementationof IFRS 9:
Classification and measurement
The Standard introduces new requirements to determine the measurement basis of financial assets, involving the cash flow characteristics of assetsand the business models under which they are managed. Accordingly, the basis of measurement for the Bank’s financial assets may change. TheStandard affects the accounting for available-for-sale equity securities, requiring a designation, by portfolio, between recording both unrealized andrealized gains either through (i) OCI with no recycling to income or (ii) Income Statement. As a result, the amount of equity securities gains recordedthrough income is expected to be lower than current levels and levels recorded in recent years. For other financial instruments, the Bank does notexpect the implementation will result in a significant change in the classification and measurement of the Bank’s financial assets, between Amortizedcost, Fair Value through OCI and Fair Value through Income Statement.
Hedge Accounting
IFRS 9 also incorporates new hedge accounting rules that intend to align hedge accounting with risk management practices. IFRS 9 includes anaccounting policy choice to defer the adoption of IFRS 9 hedge accounting and to continue with IAS 39 hedge accounting. The Bank has decided toexercise this accounting policy choice. However, the Bank will implement the revised hedge accounting disclosures that are required by the IFRS 9related amendments to IFRS 7 “Financial Instruments: Disclosures” in its fiscal 2018 Annual Report.
Impairment
The adoption of IFRS 9 will have a significant impact on the Bank’s impairment methodology. The IFRS 9 expected credit loss (ECL) model is forwardlooking compared to the current incurred loss approach. Expected credit losses reflect the present value of all cash shortfalls related to default eventseither (i) over the following twelve months or (ii) over the expected life of a financial instrument depending on credit deterioration from inception. ECLshould reflect an unbiased, probability-weighted outcome as opposed to the single best estimate allowed under the current approach. The probability-weighted outcome considers multiple scenarios based on reasonable and supportable forecasts.
The Bank’s approach leveraged the existing regulatory capital models and processes for most of the Bank’s loan portfolios that use the existingAdvanced Internal Ratings Based (AIRB) credit models for regulatory capital purposes. For other portfolios that use the Standardized approach tocompute regulatory capital, the Bank developed new methodologies and models taking into account the relative size, quality and complexity of theportfolios. IFRS 9 considers the calculation of ECL by multiplying the Probability of default (PD), Loss Given Default (LGD) and Exposure at Default(EAD).
IFRS 9 Impairment model uses a three stage approach based on the extent of credit deterioration since origination:
Stage 1 – 12-month ECL applies to all financial assets that have not experienced a significant increase in credit risk (SIR) since origination and are notcredit impaired. The ECL will be computed using a 12-month PD that represents the probability of default occurring over the next 12 months. Forthose assets with a remaining maturity of less than 12 months, a PD is used that corresponds to remaining maturity. This Stage 1 approach is differentthan the current approach which estimates a collective allowance to recognize losses that have been incurred but not reported on performing loans.
Stage 2 – When a financial asset experiences a SIR subsequent to origination but is not credit impaired, it is considered to be in Stage 2. This requiresthe computation of ECL based on lifetime PD that represents the probability of default occurring over the remaining estimated life of the financialasset. Provisions are higher in this stage because of an increase in risk and the impact of a longer time horizon being considered compared to12 months in Stage 1.
Stage 3 – Financial assets that have an objective evidence of impairment will be included in this stage. Similar to Stage 2, the allowance for creditlosses will continue to capture the lifetime expected credit losses.
Some of the key concepts in IFRS 9 that have the most significant impact and require a high level of judgement are:
Assessment of Significant Increase in Credit Risk
The assessment of a significant increase in credit risk is done on a relative basis. To assess whether the credit risk on a financial asset has increasedsignificantly since origination, the Bank compares the risk of default occurring over the expected life of the financial asset at the reporting date to thecorresponding risk of default at origination, using key risk indicators that are used in the Bank’s existing risk management processes. At each reportingdate, the assessment of a change in credit risk will be individually assessed for those considered individually significant and at the segment level forretail exposures. This assessment is symmetrical in nature, allowing credit risk of financial assets to move back to Stage 1 if the increase in credit risksince origination has reduced and is no longer deemed to be significant.
Macroeconomic Factors, Forward Looking Information (FLI) and Multiple Scenarios
IFRS 9 requires an unbiased and probability weighted estimate of credit losses by evaluating a range of possible outcomes that incorporates forecastsof future economic conditions.
Macroeconomic factors and FLI are required to be incorporated into the measurement of ECL as well as the determination of whether there has beena significant increase in credit risk since origination. Measurement of ECLs at each reporting period should reflect reasonable and supportable
100 | 2 0 1 7 S C O T I A B A N K A N N U A L R E P O R T

MA
NA
GEM
ENT’S
DISC
USSIO
NA
ND
AN
ALY
SIS|
CO
NT
RO
LSA
ND
AC
CO
UN
TIN
GP
OLIC
IES
information at the reporting date about past events, current conditions and forecasts of future economic conditions.
The Bank will use three scenarios that will be probability weighted to determine ECL, leveraging its existing Enterprise Wide Stress Test modelingframework.
Experienced credit judgment
The Bank’s ECL allowance methodology, in line with OSFI guidelines, requires the Bank to use its experienced credit judgement to incorporate theestimated impact of factors not captured in the modelled ECL results, in all reporting periods.
Expected Life
When measuring ECL, the Bank must consider the maximum contractual period over which the Bank is exposed to credit risk. All contractual termsshould be considered when determining the expected life, including prepayment options and extension and rollover options. For certain revolvingcredit facilities that do not have a fixed maturity, the expected life is estimated based on the period over which the Bank is exposed to credit risk andwhere the credit losses would not be mitigated by management actions.
Definition of Default and Write-off
The Bank has modified its definition of impaired financial instruments (Stage 3) for certain categories of financial instruments to make it consistentwith the definitions used in the calculation of regulatory capital. The Bank does not expect to rebut the presumption in IFRS 9 that loans which are 90days past due are in default for retail loans, with the exception of credit cards receivables that are treated as defaulted when 180 days past due. Thepolicy on the write-off of loans remains unchanged.
The main adjustments to the regulatory capital risk components are summarized in the following chart:
Regulatory capital IFRS 9
PD Through the cycle (represents long-runaverage PD throughout a full economic cycle)
12 month PD is used.
Point in time (based on current conditions, adjusted totake into account estimates of future conditions that willimpact PD).
12 month PD for Stage 1 ECL and Lifetime PD forStage 2 and Stage 3 ECL.
LGD Downturn LGD based on losses that wouldbe expected in an economic downturn andsubject to certain regulatory floors. Bothdirect and indirect collection costs areconsidered.
Expected LGD based on historical charge-off events andrecovery payments, current information about attributesspecific to borrower, and direct costs. Forward-lookingmacroeconomic variables and expected cash flows fromcredit enhancements will be incorporated as appropriateand excludes floors and undue conservatism.
EAD Based on the drawn balance plus expectedutilization of any undrawn portion prior todefault, and cannot be lower than thedrawn balance.
EAD represents the expected balance at default over thelifetime and is conditional on forward lookingexpectations.
Discounting factors Not applicable Expected credit losses are discounted from default dateto the reporting date
Certain allowances for credit losses currently ascribed to impaired loans will be ascribed against Stage 1 and Stage 2 exposures.
Transition impact
The Bank will record an adjustment to its opening November 1, 2017 retained earnings and AOCI, to reflect the application of the new requirementsof Impairment and Classification and Measurement at the adoption date and will not restate comparative periods.
The Bank estimates the IFRS 9 transition amount will reduce shareholders’ equity by approximately $600 million after-tax and the Common EquityTier 1 capital ratio by approximately 15 basis points as at November 1, 2017. The estimated impact relates primarily to the implementation of the ECLrequirements. The Bank continues to revise, refine and validate the impairment models and related process controls leading up to the January 31,2018 reporting.
Effective November 1, 2018
Revenue from contracts with customers
On May 28, 2014, the IASB issued IFRS 15 Revenue from Contracts with Customers, which replaces the previous revenue standard IAS 18 Revenue,and the related Interpretations on revenue recognition. The standard is a control-based model as compared to the existing revenue standard which isprimarily focused on risks and rewards and provides a single principle based framework to be applied to all contracts with customers that are in scopeof the standard. Under the new standard revenue is recognized when a customer obtains control of a good or service. Transfer of control occurs whenthe customer has the ability to direct the use of and obtain the benefits of the good or service. The standard introduces a new five step model torecognize revenue as performance obligations in a contract are satisfied. The standard scopes out contracts that are considered to be lease contracts,insurance contracts and financial instruments, and as such will impact the businesses that earn fee and commission revenue.
On April 12, 2016, the IASB issued amendments to IFRS 15 Revenue from Contracts with Customers. The amendments provide additional clarificationon the identification of a performance obligation in a contract, determining the principal and agent in an agreement, and determining whetherlicensing revenues should be recognized at a point in time or over a specific period. The amendments also provide additional practical expedients thatcan be used on transition to the standard.
2 0 1 7 S C O T I A B A N K A N N U A L R E P O R T | 101

MANAGEMENT’S DISCUSSION AND ANALYSIS
The Bank will adopt the standard and its amendments as of November 1, 2018 and plans to use the modified retrospective approach. Under thisapproach, the Bank will recognize the cumulative effect of initially applying the standard as an adjustment to the opening balances of retainedearnings as of November 1, 2018, without restating comparative periods. Additional disclosures will be required in order to explain any significantchanges between reported results and results had the previous revenue standard been applied.
The standard does not apply to revenue associated with financial instruments, and therefore, will not impact the majority of the Bank’s revenue,including interest income, interest expense, trading revenue and securities gains which are covered under IFRS 9 Financial Instruments. Theimplementation of the standard is being led by the Finance Department in coordination with the business segments. The areas of focus for the Bank’sassessment of impact are fees and commission revenues from wealth management and banking services in Canadian and International Banking. TheBank has been working to identify and review the customer contracts within the scope of the new standard. While the assessment is not complete,the timing of the Bank’s revenue recognition of fees and commissions within the scope of this standard is not expected to materially change. Theclassification of certain contract costs (whether presented gross or offset against non-interest income) continues to be evaluated and the finalinterpretation may impact the presentation of certain contract costs. The Bank is also evaluating the additional disclosures that may be relevant andrequired.
Effective November 1, 2019
Financial instruments: Prepayment features with negative compensation
On October 12, 2017, the IASB issued an amendment to IFRS 9 Financial Instruments. The amendment allows certain pre-payable financial assets withso-called negative compensation prepayment option to be measured at amortized cost or fair value through other comprehensive income, if theprepayment amount substantially represents unpaid principal and interest and reasonable compensation. Reasonable compensation may be positive ornegative. Prior to this amendment financial assets with this negative compensation feature would have failed the solely payments of principal andinterest test and be mandatorily measured at fair value through profit or loss. The amendment will be effective for annual periods beginning on orafter January 1, 2019, with early adoption permitted. Based on preliminary assessments, the amendment is not expected to impact the Bank.
Leases
On January 13, 2016, the IASB issued IFRS 16 Leases, which requires a lessee to recognize an asset for the right to use the leased item and a liabilityfor the present value of its future lease payments. IFRS 16 will result in leases being recorded on the Bank’s balance sheet, including those currentlyclassified as operating leases except for short-term leases and leases with low value of the underlying asset. IFRS 16 substantially carries forward thelessor accounting requirements in IAS 17.
IFRS 16 is effective for the Bank on November 1, 2019, with early adoption permitted from the date the Bank applies IFRS 15 Revenue from Contractswith Customers on or before the date of initial application of IFRS 16. On transition there are practical expedients available whereby the Bank will notneed to reassess whether a contract is, or contains a lease, or reassess the accounting of sale leaseback transactions recognized prior to the date ofinitial application.
A lessee will apply IFRS 16 to its leases either retrospectively to each prior reporting period presented; or retrospectively with the cumulative effect ofinitially applying IFRS 16 being recognized at the date of initial application.
The Bank is currently assessing the impact of this new standard.
Effective November 1, 2021
Insurance contracts
On May 18, 2017, the IASB issued IFRS 17 Insurance Contracts, which provides a comprehensive principle-based framework for the measurement andpresentation of all insurance contracts. The new standard will replace IFRS 4 Insurance Contracts and requires insurance contracts to be measuredusing current fulfillment cash flows and for revenue to be recognized as the service is provided over the coverage period. The standard is effective forthe Bank on November 1, 2021. The Bank will assess the impact of adopting this new standard.
Regulatory DevelopmentsThe Bank continues to monitor and respond to global regulatory developments relating to a broad spectrum of topics, including Basel III capital andliquidity requirements, over-the-counter derivatives reform, consumer protection measures and cybersecurity, in order to ensure that control andbusiness units are responsive on a timely basis and business impacts, if any, are minimized.
Bank Recapitalization Regime – Proposed Bail-in Regulations
On June 22, 2016, legislation came into force amending the Bank Act (Canada) (the “Bank Act”) and the Canada Deposit Insurance Corporation Act(Canada) (the “CDIC Act”) and certain other federal statutes pertaining to banks to create a bail-in regime for Canada’s domestically systemicallyimportant banks (D-SIBs), which include the Bank. On June 17, 2017, the Government of Canada published in draft for public comment regulationsunder the CDIC Act and the Bank Act providing the final details of the conversion, issuance and compensation regimes for bail-in instruments issuedby domestic systemically important banks, including the Bank (collectively, the “Bail-In Regulations”). Pursuant to the CDIC Act, in circumstanceswhere OSFI has determined that the Bank has ceased, or is about to cease, to be viable, the Governor in Council may, upon a recommendation of theMinister of Finance that he or she is of the opinion that it is in the public interest to do so, grant an order directing CDIC to convert all or a portion ofcertain shares and liabilities of the Bank into common shares of the Bank (a “Bail-In Conversion”).
The Bail-In Regulations prescribe the types of shares and liabilities that will be subject to a Bail-In Conversion. In general, any senior debt with an initialor amended term to maturity (including certain explicit or embedded options) greater than 400 days, that is unsecured or partially secured and hasbeen assigned a CUSIP or ISIN or similar identification number would be subject to a Bail-In Conversion. Shares, other than common shares, andsubordinated debt would also be subject to a Bail-In Conversion, unless they are non-viability contingent capital. The Bail-In Regulations becomeeffective 180 days after the regulations are registered. These changes are not expected to have a material impact on the Bank’s cost of long-termunsecured funding.
In conjunction with the pre-publication of the Bail-In Regulations, OSFI issued draft guidelines on Total Loss Absorbing Capacity (TLAC), which willapply to Canada’s D-SIBs as part of the Federal Government’s bail-in regime. The standards are intended to address the sufficiency of a systemicallyimportant bank’s loss absorbing capacity in supporting its recapitalization in the event of its failure. TLAC is defined as the aggregate of Tier 1 capital,Tier 2 capital, and other TLAC instruments, which allow conversion in whole or in part into common shares under the CDIC Act and
102 | 2 0 1 7 S C O T I A B A N K A N N U A L R E P O R T

MA
NA
GEM
ENT’S
DISC
USSIO
NA
ND
AN
ALY
SIS|
CO
NT
RO
LSA
ND
AC
CO
UN
TIN
GP
OLIC
IES
meet all of the eligibility criteria under the guideline. The minimum TLAC requirements are proposed to be effective November 2021. The Bank doesnot anticipate any challenges in meeting the proposed TLAC requirements.
Over-The-Counter Derivatives Reform
Capital requirements for derivatives dealers are currently being considered by international regulators, while margin requirements for non-centrallycleared derivatives have already been adopted in a number of jurisdictions, including Canada, Europe, the United States, Hong Kong and Singapore.In March 2015, the Basel Committee on Banking Supervision and the International Organization of Securities Commissions (IOSCO) published aframework establishing minimum standards for margin requirements for non-centrally cleared derivatives for financial firms and systemically importantnon-financial entities (“BCBS Framework”). On February 29, 2016, the Office of the Superintendent of Financial Institutions (“OSFI”) issued the finalversion of Guideline E-22 to implement the BCBS Framework for federally regulated financial institutions. The Guideline became effective onSeptember 1, 2016 with compliance to be phased in over the next ensuing years in accordance with the BCBS Framework. These margin rules will,once fully implemented, require the exchange of variation margin and initial margin, both of which are designed to secure the performance ofnon-centrally cleared derivatives transactions between covered entities. The Bank became subject to variation margin rules beginning March 1, 2017,while initial margin rules will become effective no earlier than September 1, 2018 and no later than September 1, 2019. In February 2017, variousregulatory authorities including the Board of Governors of the Federal Reserve System, the CFTC, the European Supervisory Authorities and OSFIissued guidance concerning the implementation of their variation margin rules, affirming the importance of timely effectiveness while recognizing theoperational challenges of achieving market-wide participation, especially with respect to smaller counterparty relationships. On April 4, 2017, the CSApublished proposed National Instrument 93-101: Derivatives: Business Conduct Rules. The proposed rules impose a business conduct standard onderivatives dealers and derivatives advisers when transacting in OTC derivatives with derivatives parties. The Bank is continuing with its efforts to meetall obligations imposed by the variation margin rules in accordance with the guidance received from OSFI and other relevant supervisory authorities,while a project has been initiated to prepare for the upcoming implementation of the initial margin rules.
Automatic Exchange of Information – Organisation for Economic Co-operation and Development (OECD)
Under the initiative of the OECD, many countries have committed to automatic exchange of information relating to accounts held by tax residents ofsignatory countries, using a Common Reporting Standard (CRS). Canada’s automatic exchange of financial account information arrangements withjurisdictions, other than the U.S., has been implemented in accordance with the CRS and the implementation of the CRS legislation in Canada waseffective July 1, 2017. The Bank meets all obligations imposed under the CRS, in accordance with local law, in Canada and all applicable jurisdictionsin which it operates.
United Kingdom and European Regulatory Reform
On June 23, 2016, the United Kingdom (UK) held a referendum to decide on its membership in the European Union. The resulting vote was to leavethe European Union. A formal notice of the UK Government’s intention to withdraw was provided to the European Council on March 29, 2017,triggering a two-year negotiation period during which the terms of the UK’s exit will be determined. Until those negotiations are concluded or thenegotiation period expires, the UK will remain an EU Member State, subject to all EU legislation. There are a number of uncertainties in connectionwith the future of the UK and its relationship with the European Union. Until the terms and timing of the UK’s exit from the European Union areclearer, it is difficult to determine the potential longer term impact on the Bank. The UK’s exit from the European Union may result in significantchanges in law, which may impact the Bank’s business, financial condition and results of operations and could adversely impact the Bank’s cost offunding in Europe. The Bank continually monitors developments to prepare for changes that have the potential to impact its operations in the UK andelsewhere in Europe.
The Markets in Financial Instruments Directive II/Regulation (MiFID II/MiFIR) becomes effective January 2018 and will have a significant technologicaland procedural impact on certain of our businesses operating in the European Union, as well as certain businesses operating outside of the EU butwhich are subject to MiFID II/MIFIR. The new requirements contained within MiFIDII/MIFIR will result in changes to pre- and post-trade transparency,market structure, transaction reporting, algorithmic trading, research and business conduct rules. Unlike the current MiFID regime, which appliesprimarily to equities, MiFID II/MiFIR will also extend to fixed income and “equity-like” products.
Cybersecurity and privacy developments in Europe and the U.S.
The E.U. General Data Protection Regulation (“GDPR”) will apply from May 25, 2018. The GDPR replaces the current E.U. Data Protection Directiveand is designed to harmonize data privacy laws across Europe. The GDPR changes data governance and protection requirements as well as disclosurerequirements in respect of data breaches. The GDPR applies to organizations based outside of the European Union if they collect or process data ofE.U. residents. The Bank continues to assess the impact of the GDPR and is taking steps to align privacy and data protection practices to comply withthe new requirements.
The New York Department of Financial Services (NY DFS) cybersecurity requirements took effect on March 1, 2017. Entities subject to NY DFSrequirements must maintain a cybersecurity program designed to protect the confidentiality, integrity and availability of its information systems.Subject to various phase-in dates over the next couple of years, each covered entity must meet various compliance requirements, including:conducting periodic risk assessments; implementing policies and procedures; and monitoring and testing, among others. The Bank of Nova Scotia,New York Agency, is subject to NY DFS requirements. By February 15, 2018, and annually thereafter, applicable entities must certify compliance withthe requirements. The Bank is in compliance with existing NY DFS cybersecurity requirements and expects to comply with additional NYS DFSrequirements by the applicable compliance dates.
Basel Committee on Banking Supervision
In March 2017, the Basel Committee on Banking Supervision (BCBS) issued the Pillar 3 disclosure requirements – consolidated and enhancedframework which builds on the revisions to the Pillar 3 disclosure published by the Committee in January 2015.
In March 2017, the BCBS also released its standard on the interim approach and transitional arrangements for the regulatory treatment of accountingprovisions. In the standard, the BCBS clarified that it will retain its current treatment of provisions under both Standardized Approach and AdvancedInternal Ratings Based frameworks during an interim period. Further, the BCBS allows local jurisdictions the option to choose whether to apply atransitional arrangement for the impact of IFRS 9 on regulatory capital. OSFI has not publicly issued its final guidance for the Canadian banks whichwill take effect from January 1, 2018. The Bank will assess the impact once OSFI’s guidance is issued.
2 0 1 7 S C O T I A B A N K A N N U A L R E P O R T | 103
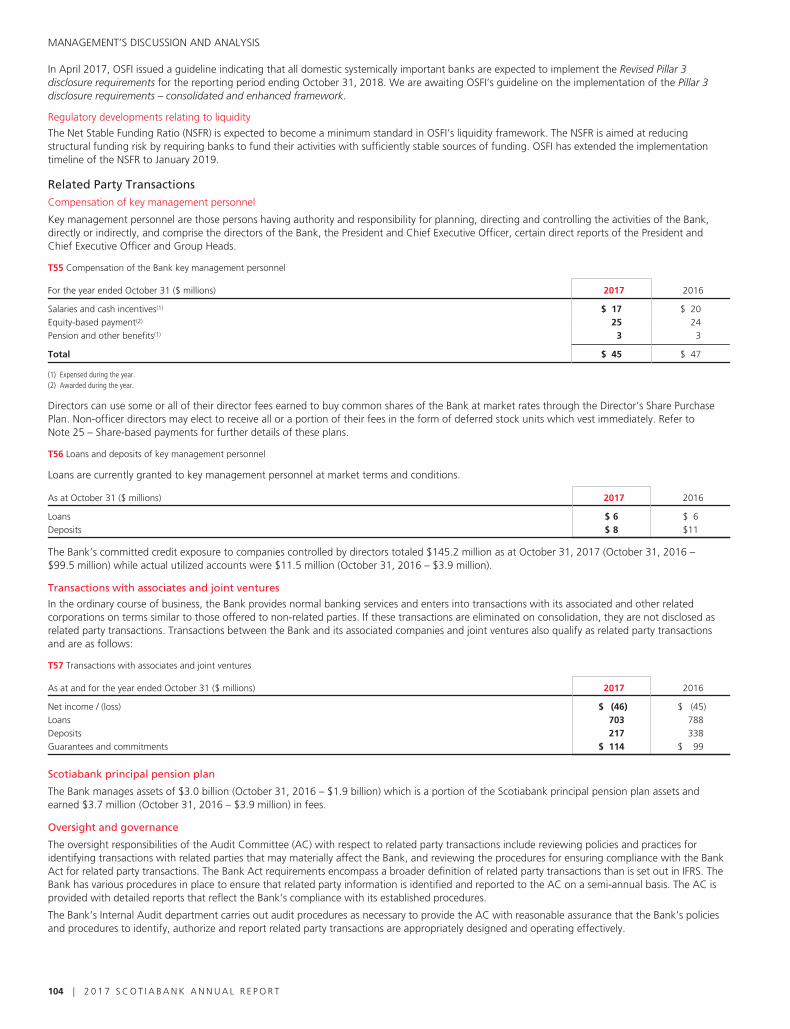
MANAGEMENT’S DISCUSSION AND ANALYSIS
In April 2017, OSFI issued a guideline indicating that all domestic systemically important banks are expected to implement the Revised Pillar 3disclosure requirements for the reporting period ending October 31, 2018. We are awaiting OSFI’s guideline on the implementation of the Pillar 3disclosure requirements – consolidated and enhanced framework.
Regulatory developments relating to liquidity
The Net Stable Funding Ratio (NSFR) is expected to become a minimum standard in OSFI’s liquidity framework. The NSFR is aimed at reducingstructural funding risk by requiring banks to fund their activities with sufficiently stable sources of funding. OSFI has extended the implementationtimeline of the NSFR to January 2019.
Related Party TransactionsCompensation of key management personnel
Key management personnel are those persons having authority and responsibility for planning, directing and controlling the activities of the Bank,directly or indirectly, and comprise the directors of the Bank, the President and Chief Executive Officer, certain direct reports of the President andChief Executive Officer and Group Heads.
T55 Compensation of the Bank key management personnel
For the year ended October 31 ($ millions) 2017 2016
Salaries and cash incentives(1) $ 17 $ 20Equity-based payment(2) 25 24Pension and other benefits(1) 3 3
Total $ 45 $ 47
(1) Expensed during the year.(2) Awarded during the year.
Directors can use some or all of their director fees earned to buy common shares of the Bank at market rates through the Director’s Share PurchasePlan. Non-officer directors may elect to receive all or a portion of their fees in the form of deferred stock units which vest immediately. Refer toNote 25 – Share-based payments for further details of these plans.
T56 Loans and deposits of key management personnel
Loans are currently granted to key management personnel at market terms and conditions.
As at October 31 ($ millions) 2017 2016
Loans $ 6 $ 6Deposits $ 8 $11
The Bank’s committed credit exposure to companies controlled by directors totaled $145.2 million as at October 31, 2017 (October 31, 2016 –$99.5 million) while actual utilized accounts were $11.5 million (October 31, 2016 – $3.9 million).
Transactions with associates and joint ventures
In the ordinary course of business, the Bank provides normal banking services and enters into transactions with its associated and other relatedcorporations on terms similar to those offered to non-related parties. If these transactions are eliminated on consolidation, they are not disclosed asrelated party transactions. Transactions between the Bank and its associated companies and joint ventures also qualify as related party transactionsand are as follows:
T57 Transactions with associates and joint ventures
As at and for the year ended October 31 ($ millions) 2017 2016
Net income / (loss) $ (46) $ (45)Loans 703 788Deposits 217 338Guarantees and commitments $ 114 $ 99
Scotiabank principal pension plan
The Bank manages assets of $3.0 billion (October 31, 2016 – $1.9 billion) which is a portion of the Scotiabank principal pension plan assets andearned $3.7 million (October 31, 2016 – $3.9 million) in fees.
Oversight and governance
The oversight responsibilities of the Audit Committee (AC) with respect to related party transactions include reviewing policies and practices foridentifying transactions with related parties that may materially affect the Bank, and reviewing the procedures for ensuring compliance with the BankAct for related party transactions. The Bank Act requirements encompass a broader definition of related party transactions than is set out in IFRS. TheBank has various procedures in place to ensure that related party information is identified and reported to the AC on a semi-annual basis. The AC isprovided with detailed reports that reflect the Bank’s compliance with its established procedures.
The Bank’s Internal Audit department carries out audit procedures as necessary to provide the AC with reasonable assurance that the Bank’s policiesand procedures to identify, authorize and report related party transactions are appropriately designed and operating effectively.
104 | 2 0 1 7 S C O T I A B A N K A N N U A L R E P O R T

MA
NA
GEM
ENT’S
DISC
USSIO
NA
ND
AN
ALY
SIS|
SUP
PLE
ME
NT
AR
YD
AT
A
SUPPLEMENTARY DATA
Geographic Information
T58 Net income by geographic segment
2017 2016 2015
For the fiscal years($ millions) Canada U.S. Mexico Peru Chile Colombia
OtherInter-
national Total Canada U.S. Mexico Peru Chile Colombia
OtherInter-
national Total Canada U.S. Mexico Peru Chile Colombia
OtherInter-
national Total
Net interest
income $7,440 $460 $1,380 $1,287 $817 $710 $2,999 $15,093 $7,022 $479 $1,224 $1,231 $763 $674 $2,950 $14,343 $6,458 $472 $1,246 $1,077 $554 $677 $2,631 $13,115
Non-interest
income 6,924 830 536 635 409 455 2,502 12,291 6,893 871 554 600 325 419 2,409 12,071 6,272 882 561 601 231 372 2,163 11,082
Provision for
credit losses 906 (14) 193 329 145 337 353 2,249 876 112 225 315 113 320 401 2,362 728 6 260 266 108 246 268 1,882
Non-interest
expenses 7,650 606 1,123 762 630 620 3,069 14,460 7,339 633 1,121 740 605 550 3,036 14,024 6,936 507 1,160 744 431 541 2,745 13,064
Income tax
expense 1,066 147 125 225 77 71 506 2,217 1,235 155 69 201 45 89 497 2,291 1,038 267 27 195 24 84 401 2,036
Total $4,742 $551 $ 475 $ 606 $374 $137 $1,573 $ 8,458 $4,465 $450 $ 363 $ 575 $325 $134 $1,425 $ 7,737 $4,028 $574 $ 360 $ 473 $222 $178 $1,380 $ 7,215
Corporate
adjustments (215) (369) (2)
Net Income $ 8,243 $ 7,368 $ 7,213
2 0 1 7 S C O T I A B A N K A N N U A L R E P O R T | 105

MANAGEMENT’S DISCUSSION AND ANALYSIS
T59 Loans and acceptances by geography (1)
Percentage mix
As at October 31 ($ billions) 2017 2016 2015 2017 2015
CanadaAtlantic provinces $ 22.7 $ 26.7 $ 25.6 4.3% 5.4%Quebec 29.0 29.7 28.5 5.5 6.0Ontario 173.6 156.7 150.7 33.3 31.9Manitoba and Saskatchewan 17.1 17.0 16.5 3.3 3.5Alberta 51.9 50.8 49.6 9.9 10.5British Columbia 55.6 47.6 44.5 10.7 9.4
349.9 328.5 315.4 67.0 66.7
U.S. 36.9 38.5 30.2 7.1 6.4
Mexico 24.2 20.8 18.6 4.6 3.9
Peru 18.4 17.8 17.0 3.5 3.6
Chile 22.8 19.4 16.4 4.4 3.5
Colombia 9.4 9.3 8.7 1.8 1.8
Other InternationalLatin America 6.6 6.4 6.7 1.3% 1.4%Europe 10.0 8.4 9.3 1.9 2.0Caribbean and Central America 31.4 32.6 31.8 6.0 6.7Asia and Other 12.6 15.0 19.0 2.4 4.0
60.6 62.4 66.8 11.6 14.1
$ 522.2 $ 496.7 $ 473.1 100.0% 100.0%
Total allowance for loan losses(2) (4.3) (4.6) (4.2)
Total loans and acceptances net of allowance for loan losses $ 517.9 $ 492.1 $ 468.9
(1) Prior periods have been restated to reflect the current period presentation.(2) Total allowance includes a collective allowance on performing loans of $1,446 million in 2017 and $1,444 million in 2016. The increase reflects a $2 million reallocation from reserves against unfunded commitments and other
off-balance sheet items.
106 | 2 0 1 7 S C O T I A B A N K A N N U A L R E P O R T

MA
NA
GEM
ENT’S
DISC
USSIO
NA
ND
AN
ALY
SIS|
SUP
PLE
ME
NT
AR
YD
AT
A
T60 Gross impaired loans by geographic segment
As at October 31 ($ millions) 2017(1) 2016(1) 2015(1)
Canada $ 1,049 $ 1,258 $ 1,189U.S. 140 210 11Mexico 303 301 271Peru 704 764 603Chile 565 499 405Colombia 462 381 356Other International 1,642 1,981 1,823
Total $ 4,865 $ 5,394 $ 4,658
(1) Excludes loans acquired under the Federal Deposit Insurance Corporation (FDIC) guarantee related to the acquisition of R-G Premier Bank of Puerto Rico.
T61 Provision against impaired loans by geographic segment
For the fiscal years ($ millions) 2017 2016 2015
Canada $ 906 $ 876 $ 727U.S. (14) 112 6Mexico 193 224 260Peru 329 317 265Chile 145 112 108Colombia 337 320 247Other International 353 401 269
Total $2,249 $2,362 $1,882
T62 Cross-border exposure to select countries(1)
As atOctober 31($ millions) Loans Trade
Interbankdeposits
Governmentand othersecurities
Investment insubsidiaries
and affiliates Other2016Total
2017Total
AsiaChina $ 1,683 $ 1,186 $ 596 $ 99 $ 747 $ 56 $ 4,367 $ 5,205India 2,185 57 – – – 12 2,254 1,893Thailand 149 6 516 – 2,789 1 3,461 3,249South Korea 901 58 – – – 9 968 1,564Hong Kong 1,250 72 124 – – 19 1,465 1,736Malaysia 275 – – – 303 4 582 1,108Japan 477 35 179 4,317 – 6 5,014 1,756Others(2) 1,052 180 118 – – 21 1,371 1,673
Total $ 7,972 $ 1,594 $ 1,533 $ 4,416 $ 3,839 $ 128 $ 19,482 $ 18,184
Latin AmericaChile $ 3,075 $ 959 $ 628 $ 191 $ 3,452 $ 40 $ 8,345 $ 6,314Mexico 2,945 187 – 141 3,544 84 6,901 6,464Brazil 3,540 1,022 – 15 223 517 5,317 5,198Peru 2,264 73 – 199 4,518 26 7,080 6,760Colombia 1,308 226 – 10 1,431 7 2,982 2,940Others(3) 115 12 – – 551 – 678 632
Total $ 13,247 $ 2,479 $ 628 $ 556 $ 13,719 $ 674 $ 31,303 $ 28,308
Caribbean andCentral America
Panama $ 3,907 $ 99 $ 35 $ – $ 288 $ – $ 4,329 $ 4,495Costa Rica 1,272 184 – – 1,084 – 2,540 2,767El Salvador 579 32 – – 659 – 1,270 1,460Dominican Republic 1,151 55 16 – – – 1,222 1,113Jamaica 18 1 – – 766 – 785 743Others(4) 1,508 115 1 – 406 – 2,030 2,183
Total $ 8,435 $ 486 $ 52 $ – $ 3,203 $ – $ 12,176 $ 12,761
As at October 31, 2017 $ 29,654 $ 4,559 $ 2,213 $ 4,972 $ 20,761 $ 802 $ 62,961
As at October 31, 2016 $ 30,589 $ 4,150 $ 1,293 $ 2,179 $ 19,655 $ 1,387 $ 59,253
(1) Cross-border exposure represents a claim, denominated in a currency other than the local one, against a borrower in a foreign country on the basis of ultimate risk.(2) Includes Indonesia, Macau, Singapore, Vietnam, Taiwan and Turkey.(3) Includes Venezuela and Uruguay(4) Includes other English and Spanish Caribbean countries, such as Bahamas, Barbados, British Virgin Islands, Trinidad & Tobago, Turks & Caicos.
2 0 1 7 S C O T I A B A N K A N N U A L R E P O R T | 107

MANAGEMENT’S DISCUSSION AND ANALYSIS
Credit Risk
T63 Loans and acceptances by type of borrower
2017
As at October 31 ($ billions) Balance % of total 2016 2015
Residential mortgages $ 236.9 45.3% $ 222.9 $ 217.5Personal loans and credit cards 103.3 19.8 99.5 91.5
Personal $ 340.2 65.1% $ 322.4 $ 309.0Financial services
Non-bank $ 20.5 3.9% $ 16.1 $ 14.3Bank(1) 3.8 0.7 3.7 6.7
Wholesale and retail 21.1 4.0 22.1 21.5Real estate and construction 24.6 4.7 22.6 19.5Energy 15.5 3.0 15.6 16.5Transportation 8.2 1.6 9.0 9.1Automotive 13.0 2.5 11.5 10.4Agriculture 10.2 2.0 8.8 8.1Hospitality and leisure 3.5 0.7 3.5 3.6Mining 4.9 0.9 5.4 4.5Metals refinery and processing 2.6 0.5 2.5 2.8Utilities 8.1 1.6 7.8 5.8Health care 5.6 1.1 5.2 5.0Technology and media 9.6 1.8 11.8 9.1Chemical 1.1 0.2 1.6 2.0Food and beverage 6.3 1.2 4.9 4.9Forest products 1.7 0.3 2.5 1.7Other(2) 17.0 3.3 14.7 13.6Sovereign(3) 4.7 0.9 5.0 5.0
Business and government $ 182.0 34.9% $ 174.3 $ 164.1
$ 522.2 100.0% $ 496.7 $ 473.1
Total allowance for loan losses (4.3) (4.6) (4.2)
Total loans and acceptances net of allowance for loan losses $ 517.9 $ 492.1 $ 468.9
(1) Deposit taking institutions and securities firms.(2) Other related to $3.5 in financing products, $2.2 in services and $2.3 in wealth management (2016 – $3.2, $2.4, and $2.0 respectively).(3) Includes central banks, regional and local governments, and supra-national agencies.
T64 Off-balance sheet credit instruments
As at October 31 ($ billions) 2017 2016 2015
Commitments to extend credit(1) $ 185.7 $ 174.2 $ 166.4Standby letters of credit and letters of guarantee 35.5 34.5 30.9Securities lending, securities purchase commitments and other 42.0 40.0 42.8
Total $ 263.2 $ 248.7 $ 240.1
(1) Excludes commitments which are unconditionally cancellable at the Bank’s discretion at any time.
108 | 2 0 1 7 S C O T I A B A N K A N N U A L R E P O R T

MA
NA
GEM
ENT’S
DISC
USSIO
NA
ND
AN
ALY
SIS|
SUP
PLE
ME
NT
AR
YD
AT
A
T65 Changes in net impaired loans(1)
For the fiscal years ($ millions) 2017 2016 2015
Gross impaired loansBalance at beginning of year $ 5,394 $ 4,658 $ 4,200Net additions
New additions 4,297 4,684 3,763Declassifications (42) (24) (13)Payments (1,427) (1,344) (1,254)Sales (50) (95) (11)
2,778 3,221 2,485Write-offs
Residential mortgages (170) (201) (109)Personal loans (1,478) (1,279) (1,310)Credit cards (1,024) (671) (490)Business and government (501) (428) (319)
(3,173) (2,579) (2,228)Foreign exchange and other (134) 94 201
Balance at end of year $ 4,865 $ 5,394 $ 4,658
Allowance for credit losses on impaired loansBalance at beginning of year $ 2,948 $ 2,573 $ 2,198Provision for credit losses 2,249 2,362 1,916Write-offs (3,173) (2,579) (2,228)Recoveries
Residential mortgages 70 20 35Personal loans 252 305 260Credit cards 303 217 82Business and government 55 40 52
680 582 429Foreign exchange and other (82) 10 258
Balance at end of year $ 2,622 $ 2,948 $ 2,573
Net impaired loansBalance at beginning of year $ 2,446 $ 2,085 $ 2,002Net change in gross impaired loans (529) 736 458Net change in allowance for credit losses on impaired loans 326 (375) (375)
Balance at end of year $ 2,243 $ 2,446 $ 2,085
(1) Excludes loans acquired under the Federal Deposit Insurance Corporation (FDIC) guarantee related to the acquisition of R-G Premier Bank of Puerto Rico.
T66 Provision for credit losses
For the fiscal years ($ millions) 2017 2016 2015
Gross provisions $ 3,057 $ 3,072 $ 2,435Reversals (128) (110) (68)Recoveries (680) (600) (485)
Net provisions for credit losses on impaired loans 2,249 2,362 1,882Collective provision (reversals) on performing loans – 50 60
Total net provisions for credit losses $ 2,249 $ 2,412 $ 1,942
2 0 1 7 S C O T I A B A N K A N N U A L R E P O R T | 109

MANAGEMENT’S DISCUSSION AND ANALYSIS
T67 Provision for credit losses against impaired loans by type of borrower
For the fiscal years ($ millions) 2017 2016 2015
Residential mortgages $ 61 $ 100 $ 118Personal loans and credit cards 1,886 1,677 1,526
Personal $ 1,947 $ 1,777 $ 1,644Financial services
Non-bank 10 (1) (1)Bank 1 2 (1)
Wholesale and retail 63 61 62Real estate and construction 62 34 30Energy (8) 290 48Transportation 20 45 23Automotive 8 28 9Agriculture 14 14 12Hospitality and leisure 14 25 1Mining 2 6 7Metals refinery and processing 46 11 4Utilities 12 20 –Health care 7 9 9Technology and media (1) 14 4Chemical (1) (7) 4Food and beverage 18 6 16Forest products 3 1 4Other 31 23 6Sovereign 1 4 1
Business and government $ 302 $ 585 $ 238
Total provisions against impaired loans $ 2,249 $ 2,362 $ 1,882
T68 Impaired loans by type of borrower
2017(1) 2016(1)
As at October 31 ($ millions) Gross
Allowancefor credit
losses Net Gross
Allowancefor credit
losses Net
Residential mortgages $ 1,445 $ 326 $ 1,119 $ 1,608 $ 458 $ 1,150Personal loans and credit cards 1,610 1,583 27 1,622 1,596 26
Personal $ 3,055 $ 1,909 $ 1,146 $ 3,230 $ 2,054 $ 1,176Financial services
Non-bank 31 20 11 23 8 15Bank 2 2 – 2 2 –
Wholesale and retail 242 132 110 290 193 97Real estate and construction 257 115 142 234 105 129Energy 265 77 188 324 89 235Transportation 181 73 108 214 84 130Automotive 20 7 13 70 38 32Agriculture 55 30 25 75 37 38Hospitality and leisure 41 7 34 83 27 56Mining 11 5 6 14 6 8Metals refinery and processing 107 27 80 159 25 134Utilities 280 61 219 252 53 199Health care 52 26 26 49 29 20Technology and media 7 5 2 32 28 4Chemical 4 3 1 15 6 9Food and beverage 95 35 60 110 44 66Forest products 22 8 14 23 6 17Other 123 74 49 150 108 42Sovereign 15 6 9 45 6 39
Business and government $ 1,810 $ 713 $ 1,097 $ 2,164 $ 894 $ 1,270
Total $ 4,865 $ 2,622 $ 2,243 $ 5,394 $ 2,948 $ 2,446
(1) Excludes loans acquired under the Federal Deposit Insurance Corporation (FDIC) guarantee related to the acquisition of R-G Premier Bank of Puerto Rico.
110 | 2 0 1 7 S C O T I A B A N K A N N U A L R E P O R T

MA
NA
GEM
ENT’S
DISC
USSIO
NA
ND
AN
ALY
SIS|
SUP
PLE
ME
NT
AR
YD
AT
A
T69 Total credit risk exposures by geography(1)(2)
2017 2016
Non-Retail
As at October 31 ($ millions) Drawn UndrawnOther
exposures(3) Retail Total Total
Canada $ 95,801 $ 37,900 $ 40,926 $ 327,597 $ 502,224 $ 468,923U.S. 88,623 31,008 37,755 – 157,386 143,808Mexico 17,389 1,152 2,535 9,452 30,528 26,873Peru 15,873 1,551 3,415 7,894 28,733 28,328Chile 12,004 754 1,756 12,676 27,190 23,510Colombia 4,782 150 337 5,590 10,859 10,943Other International
Europe 25,216 6,586 11,228 – 43,030 41,525Caribbean and Central America 18,554 1,554 1,299 17,951 39,358 41,168Latin America (other) 7,489 542 299 705 9,035 8,908Other 23,551 3,696 2,823 – 30,070 30,929
Total $ 309,282 $ 84,893 $ 102,373 $ 381,865 $ 878,413 $ 824,915
As at October 31, 2016 $ 290,566 $ 76,745 $ 102,061 $ 355,543 $ 824,915
(1) Geographic segmentation is based upon the location of the ultimate risk of the credit exposure. Includes all credit risk portfolios and excludes available-for-sale equities and other assets.(2) Amounts represent exposure at default.(3) Includes off-balance sheet lending instruments such as letters of credit, letters of guarantee, derivatives, securitization and repo-style transactions after collateral.
T70 AIRB credit risk exposures by maturity(1)(2)
2017 2016
Residual maturity as at October 31 ($ millions) Drawn UndrawnOther
exposures(3) Total Total
Non-retailLess than 1 year $ 134,454 $ 23,128 $ 55,542 $ 213,124 $ 195,369One to 5 years 105,995 54,653 31,439 192,087 188,751Over 5 years 9,596 1,561 12,060 23,217 18,880
Total non-retail $ 250,045 $ 79,342 $ 99,041 $ 428,428 $ 403,000
RetailLess than 1 year $ 34,389 $ 16,656 $ – $ 51,045 $ 44,215One to 5 years 178,940 – – 178,940 167,999Over 5 years 16,299 – – 16,299 20,243Revolving credits(4) 38,582 27,445 – 66,027 58,285
Total retail $ 268,210 $ 44,101 $ – $ 312,311 $ 290,742
Total $ 518,255 $ 123,443 $ 99,041 $ 740,739 $ 693,742
As at October 31, 2016 $ 487,326 $ 107,470 $ 98,946 $ 693,742
(1) Remaining term to maturity of the credit exposure. Includes all credit risk portfolios and excludes available-for-sale equities and other assets.(2) Exposure at default, before credit risk mitigation.(3) Off-balance sheet lending instruments, such as letters of credit, letters of guarantee, securitization, derivatives and repo-style transactions after collateral.(4) Credit cards and lines of credit with unspecified maturity.
2 0 1 7 S C O T I A B A N K A N N U A L R E P O R T | 111

MANAGEMENT’S DISCUSSION AND ANALYSIS
T71 Total credit risk exposures and risk-weighted assets
2017 2016
AIRB Standardized(1) Total Total
As at October 31 ($ millions)Exposure at
Default(2)
CET1 risk-weighted
assets(3)Exposure at
Default(2)
CET1 risk-weighted
assets(3)Exposure at
Default(2)
CET1 risk-weighted
assets(3)Exposure at
Default(2)
CET1 risk-weighted
assets(3)
Non-retailCorporateDrawn $ 132,648 $ 66,098 $ 50,614 $ 48,524 $ 183,262 $ 114,622 $ 175,784 $ 117,178Undrawn 75,962 29,324 5,252 5,149 81,214 34,473 73,711 34,499Other(4) 40,892 12,224 3,298 3,207 44,190 15,431 39,943 16,356
249,502 107,646 59,164 56,880 308,666 164,526 289,438 168,033BankDrawn 19,734 4,070 2,489 2,045 22,223 6,115 26,022 6,567Undrawn 2,560 383 96 94 2,656 477 1,982 368Other(4) 9,098 1,594 34 29 9,132 1,623 13,175 2,567
31,392 6,047 2,619 2,168 34,011 8,215 41,179 9,502SovereignDrawn 97,663 3,524 6,134 1,141 103,797 4,665 88,760 5,161Undrawn 820 101 203 198 1,023 299 1,052 119Other(4) 977 26 – – 977 26 497 12
99,460 3,651 6,337 1,339 105,797 4,990 90,309 5,292Total Non-retailDrawn 250,045 73,692 59,237 51,710 309,282 125,402 290,566 128,906Undrawn 79,342 29,808 5,551 5,441 84,893 35,249 76,745 34,986Other(4) 50,967 13,844 3,332 3,236 54,299 17,080 53,615 18,935
$ 380,354 $ 117,344 $ 68,120 $ 60,387 $ 448,474 $ 177,731 $ 420,926 $ 182,827
RetailRetail residential mortgagesDrawn $ 200,618 $ 15,011 $ 34,002 $ 15,013 $ 234,620 $ 30,024 $ 220,917 $ 25,028
200,618 15,011 34,002 15,013 234,620 30,024 220,917 25,028Secured lines of creditDrawn 20,281 3,351 – – 20,281 3,351 19,233 4,497Undrawn 15,356 917 – – 15,356 917 14,587 1,359
35,637 4,268 – – 35,637 4,268 33,820 5,856Qualifying retail revolving
exposuresDrawn 16,939 9,676 – – 16,939 9,676 16,717 9,463Undrawn 27,445 3,291 – – 27,445 3,291 21,108 2,656
44,384 12,967 – – 44,384 12,967 37,825 12,119Other retailDrawn 30,372 14,014 35,552 26,304 65,924 40,318 62,182 38,006Undrawn 1,300 311 – – 1,300 311 799 203
31,672 14,325 35,552 26,304 67,224 40,629 62,981 38,209Total retailDrawn 268,210 42,052 69,554 41,317 337,764 83,369 319,049 76,994Undrawn 44,101 4,519 – – 44,101 4,519 36,494 4,218
$ 312,311 $ 46,571 $ 69,554 $ 41,317 $ 381,865 $ 87,888 $ 355,543 $ 81,212
Securitization exposures 23,591 2,529 – – 23,591 2,529 25,025 2,613Trading derivatives 24,483 7,147 – – 24,483 7,147 23,421 6,599
CVA derivatives – – – 2,988 – 2,988 – 4,165
Subtotal $ 740,739 $ 173,591 $ 137,674 $ 104,692 $ 878,413 $ 278,283 $ 824,915 $ 277,416
Equities 1,281 1,188 – – 1,281 1,188 2,042 2,042Other assets – – 50,631 25,201 50,631 25,201 49,829 24,659
Total credit risk, before scalingfactor $ 742,020 $ 174,779 $ 188,305 $ 129,893 $ 930,325 $ 304,672 $ 876,786 $ 304,117
Add-on for 6% scaling factor(5) – 10,487 – – – 10,487 – 10,705
Total credit risk $ 742,020 $ 185,266 $ 188,305 $ 129,893 $ 930,325 $ 315,159 $ 876,786 $ 314,822
(1) Net of specific allowances for credit losses.(2) Outstanding amount for on-balance sheet exposures and loan equivalent amount for off-balance sheet exposures, before credit risk mitigation.(3) As at October 31, 2017, CVA risk-weighted assets were calculated using scalars of 0.72, 0.77, and 0.81 for the CET1, Tier 1 and Total capital ratios, respectively (scalars of 0.64, 0.71, and 0.77 in 2016).(4) Other exposures include off-balance sheet lending instruments, such as letters of credit, letters of guarantee, non-trading derivatives and repo-style exposures, after collateral.(5) Basel Committee imposed a scaling factor (6%) on risk-weighted assets for Internal Ratings-Based credit risk portfolios.
112 | 2 0 1 7 S C O T I A B A N K A N N U A L R E P O R T

MA
NA
GEM
ENT’S
DISC
USSIO
NA
ND
AN
ALY
SIS|
SUP
PLE
ME
NT
AR
YD
AT
A
Revenues and Expenses
T72 Volume/rate analysis of change in net interest income
Increase (decrease) due to change in:2017 versus 2016
Increase (decrease) due to change in:2016 versus 2015
Average Average Net Average Average Net($ millions) volume rate change volume rate change
Net interest incomeTotal earning assets $ 785 $ 1,152 $ 1,937 $ 1,859 $ 13 $ 1,872Total interest-bearing liabilities 29 1,165 1,194 515 157 672
Change in net interest income $ 756 $ (13) $ 743 $ 1,344 $(144) $ 1,200
Assets
Deposits with banks $ (85) $ 213 $ 128 $ (14) $ 116 $ 102Trading assets – (28) (28) (7) (6) (13)Securities purchased under resale agreements (5) 129 124 – (4) (4)Investment securities 109 85 194 407 (79) 328Loans:Residential mortgages 326 (327) (1) 147 (311) (164)Personal loans and credit cards 315 207 522 701 44 745Business and government 125 873 998 625 253 878
Total loans 766 753 1,519 1,473 (14) 1,459
Total earning assets $ 785 $ 1,152 $ 1,937 $ 1,859 $ 13 $ 1,872
Liabilities
Deposits:Personal $ 106 $ 156 $ 262 $ 174 $ (95) $ 79Business and government (101) 937 836 151 359 510Banks (7) 82 75 47 79 126
Total deposits (2) 1,175 1,173 372 343 715
Obligations related to securities sold under repurchase agreements 6 13 19 22 (64) (42)Subordinated debentures (12) 6 (6) 62 (17) 45Other interest-bearing liabilities 37 (29) 8 59 (105) (46)
Total interest-bearing liabilities $ 29 $ 1,165 $ 1,194 $ 515 $ 157 $ 672
T73 Provision for income taxes
For the fiscal years ($ millions) 2017 2016 2015
2017versus
2016
Income taxesIncome tax expense $ 2,033 $ 2,030 $ 1,853 –%
Other taxes
Payroll taxes 380 347 329 10Business and capital taxes 423 403 361 5Harmonized sales tax and other 412 363 310 13
Total other taxes 1,215 1,113 1,000 9
Total income and other taxes(1) $ 3,248 $ 3,143 $ 2,853 3%
Net income before income taxes $ 10,276 $ 9,398 $ 9,066 9%
Effective income tax rate (%) 19.8 21.6 20.4 (1.8)Total tax rate (%)(2) 28.3 29.9 28.3 (1.6)
(1) Comprising $1,758 of Canadian taxes (2016 – $1,742; 2015 – $1,849) and $1,490 of foreign taxes (2016 – $1,401; 2015 – $1,004).(2) Total income and other taxes as a percentage of net income before income and other taxes.
2 0 1 7 S C O T I A B A N K A N N U A L R E P O R T | 113

MANAGEMENT’S DISCUSSION AND ANALYSIS
T74 Assets under administration and management
($ billions) 2017 2016 2015
Assets under administrationPersonal
Retail brokerage $ 151.7 $ 163.5 $ 155.9Investment management and trust 107.0 106.4 100.2
258.7 269.9 256.1
Mutual funds 148.3 139.2 130.7Institutional 63.2 63.7 67.1
Total $ 470.2 $ 472.8 $ 453.9
Assets under managementPersonal $ 51.8 $ 47.9 $ 43.0Mutual funds 134.0 125.1 117.7Institutional 20.9 19.7 18.3
Total $ 206.7 $ 192.7 $ 179.0
T75 Changes in assets under administration and management
As at October 31 ($ billions) 2017 2016 2015
Assets under administrationBalance at beginning of year $ 472.8 $ 453.9 $ 427.5
Net inflows (outflows)(1) (33.6) 4.3 14.3Impact of market changes, including foreign currency translation 31.0 14.6 12.1
Balance at end of year $ 470.2 $ 472.8 $ 453.9
(1) Includes impact of business acquisitions/dispositions of $(33.5) (2016 – nil; 2015 – nil).
As at October 31 ($ billions) 2017 2016 2015
Assets under managementBalance at beginning of year $ 192.7 $ 179.0 $ 164.8
Net inflows (outflows)(1) 3.6 6.6 8.2Impact of market changes, including foreign currency translation 10.4 7.1 6.0
Balance at end of year $ 206.7 $ 192.7 $ 179.0
(1) Includes impact of business acquisitions/dispositions of $(4.3) (2016 – nil; 2015 – nil).
T76 Fees paid to the shareholders’ auditors
For the fiscal years ($ millions) 2017 2016 2015
Audit services $ 28.5 $ 26.1 $ 25.5Audit-related services 0.8 0.7 0.9Tax services outside of the audit scope – – –Other non-audit services 0.4 0.4 0.4
Total $ 29.7 $ 27.2 $ 26.8
114 | 2 0 1 7 S C O T I A B A N K A N N U A L R E P O R T

MA
NA
GEM
ENT’S
DISC
USSIO
NA
ND
AN
ALY
SIS|
SUP
PLE
ME
NT
AR
YD
AT
A
Selected Quarterly Information
T77 Selected quarterly information
2017 2016
As at and for the quarter ended Q4 Q3 Q2 Q1 Q4 Q3 Q2 Q1
Operating results ($ millions)Net interest income 3,831 3,833 3,728 3,643 3,653 3,602 3,518 3,519Non-interest income 2,981 3,061 2,853 3,225 3,098 3,038 3,076 2,846Total revenue 6,812 6,894 6,581 6,868 6,751 6,640 6,594 6,365Provision for credit losses 536 573 587 553 550 571 752 539Non-interest expenses 3,668 3,672 3,601 3,689 3,650 3,505 3,817 3,568Income tax expense 538 546 332 617 540 605 441 444Net income 2,070 2,103 2,061 2,009 2,011 1,959 1,584 1,814Net income attributable to common shareholders 1,986 2,016 1,965 1,909 1,908 1,860 1,489 1,730
Operating performanceBasic earnings per share ($) 1.66 1.68 1.63 1.58 1.58 1.55 1.24 1.44Diluted earnings per share ($) 1.64 1.66 1.62 1.57 1.57 1.54 1.23 1.43Adjusted diluted earnings per share ($)(1) 1.65 1.68 1.63 1.58 1.58 1.55 1.48 1.44Return on equity (%) 14.5 14.8 14.9 14.3 14.7 14.8 12.1 13.8Productivity ratio (%) 53.8 53.3 54.7 53.7 54.1 52.8 57.9 56.1Core banking margin (%)(1) 2.44 2.46 2.54 2.40 2.40 2.38 2.38 2.38
Financial position information ($ billions)Cash and deposits with financial institutions 59.7 57.8 50.9 48.4 46.3 69.8 61.2 75.3Trading assets 98.5 105.1 111.8 106.5 108.6 103.9 101.4 104.3Loans 504.4 498.6 496.3 477.4 480.2 472.8 466.8 476.6Total assets 915.3 906.3 921.6 887.0 896.3 906.8 895.0 919.6Deposits 625.4 618.1 628.2 604.7 611.9 631.3 609.3 630.9Common equity 55.5 53.4 55.1 53.0 52.7 50.8 48.9 50.9Preferred shares and other equity instruments 4.6 3.0 3.0 3.2 3.6 3.1 3.4 3.3Assets under administration 470.2 481.1 494.2 469.6 472.8 464.9 453.5 452.6Assets under management 206.7 201.3 205.0 194.0 192.7 187.9 179.4 179.0
Capital and liquidity measuresCommon Equity Tier 1 (CET1) capital ratio (%) 11.5 11.3 11.3 11.3 11.0 10.5 10.1 10.1Tier 1 capital ratio (%) 13.1 12.6 12.5 12.6 12.4 11.8 11.4 11.2Total capital ratio (%) 14.9 14.8 14.7 14.8 14.6 14.1 13.6 13.4Leverage ratio (%) 4.7 4.4 4.4 4.5 4.5 4.2 4.1 4.0CET1 risk-weighted assets ($ billions)(2) 376.4 365.4 374.9 359.6 364.0 357.7 356.9 374.5Liquidity coverage ratio (LCR)(%) 125 125 126 132 127 125 121 124
Credit qualityNet impaired loans ($ millions)(3) 2,243 2,273 2,510 2,416 2,446 2,491 2,347 2,335Allowance for credit losses ($ millions) 4,327 4,290 4,591 4,508 4,626 4,542 4,402 4,354Net impaired loans as a % of loans and acceptances(3) 0.43 0.44 0.49 0.49 0.49 0.51 0.49 0.48Provision for credit losses as a % of average net loans and acceptances
(annualized) 0.42 0.45 0.49 0.45 0.45 0.47 0.64 0.45
Common share informationClosing share price ($) (TSX) 83.28 77.67 75.88 77.76 72.08 66.33 65.80 57.39Shares outstanding (millions)
Average – Basic 1,198 1,200 1,206 1,209 1,206 1,203 1,203 1,203Average – Diluted 1,215 1,219 1,223 1,229 1,226 1,222 1,228 1,225End of period 1,199 1,198 1,202 1,208 1,208 1,205 1,203 1,203
Dividends paid per share ($) 0.79 0.76 0.76 0.74 0.74 0.72 0.72 0.70Dividend yield (%)(4) 4.0 4.0 3.9 4.0 4.3 4.5 4.9 4.9Market capitalization ($ billions) (TSX) 99.9 93.1 91.2 94.0 87.1 79.9 79.1 69.0Book value per common share ($) 46.24 44.54 45.86 43.87 43.59 42.14 40.70 42.32Market value to book value multiple 1.8 1.7 1.7 1.8 1.7 1.6 1.6 1.4Price to earnings multiple (trailing 4 quarters) 12.7 12.0 12.0 13.1 12.4 11.7 11.8 9.9
(1) Refer to page 14 for a discussion of non-GAAP measures.(2) Credit valuation adjustment (CVA) risk-weighted assets were calculated using scalars of 0.72, 0.77 and 0.81 to compute CET1, Tier 1 and Total capital ratios, respectively in 2017.(3) Excludes loans acquired under the Federal Deposit Insurance Corporation (FDIC) guarantee related to the acquisition of R-G Premier Bank of Puerto Rico.(4) Based on the average of the high and low common share price for the period.
2 0 1 7 S C O T I A B A N K A N N U A L R E P O R T | 115

MANAGEMENT’S DISCUSSION AND ANALYSIS
Eleven-Year Statistical Review
T78 Consolidated Statement of Financial Position
IFRS
As at October 31 ($ millions) 2017 2016 2015 2014 2013 2012 2011
AssetsCash and deposits with financial institutions $ 59,663 $ 46,344 $ 73,927 $ 56,730 $ 53,338 $ 47,337 $ 38,723Precious metals 5,717 8,442 10,550 7,286 8,880 12,387 9,249Trading assetsSecurities 78,652 87,287 78,380 95,363 84,196 74,639 62,192Loans 17,312 19,421 18,341 14,508 11,225 12,857 13,607Other 2,500 1,853 2,419 3,377 1,068 100 –
98,464 108,561 99,140 113,248 96,489 87,596 75,799Financial instruments designated at fair value through
profit or loss 13 221 320 111 106 197 375Securities purchased under resale agreements and
securities borrowed 95,319 92,129 87,312 93,866 82,533 66,189 47,181Derivative financial instruments 35,364 41,657 41,003 33,439 24,503 30,338 37,322Investment securities 69,269 72,919 43,216 38,662 34,319 33,376 30,176LoansResidential mortgages 236,916 222,888 217,498 212,648 209,865 175,630 161,685Personal and credit cards 103,331 99,502 91,477 84,204 76,008 68,277 63,317Business and government 168,449 162,400 153,850 131,098 119,615 111,648 96,743
508,696 484,790 462,825 427,950 405,488 355,555 321,745Allowance for credit losses 4,327 4,626 4,197 3,641 3,273 2,977 2,689
504,369 480,164 458,628 424,309 402,215 352,578 319,056OtherCustomers’ liability under acceptances 13,560 11,978 10,296 9,876 10,556 8,932 8,172Property and equipment 2,381 2,520 2,286 2,272 2,214 2,218 2,504Investments in associates 4,586 4,299 4,033 3,461 5,326 4,791 4,434Goodwill and other intangible assets 12,106 12,141 11,449 10,884 10,704 8,692 7,639Deferred tax assets 1,713 2,021 2,034 1,763 1,938 2,273 2,214Other assets 12,749 12,870 12,303 9,759 10,523 11,321 11,579
47,095 45,829 42,401 38,015 41,261 38,227 36,542
$ 915,273 $ 896,266 $ 856,497 $ 805,666 $ 743,644 $ 668,225 $ 594,423
LiabilitiesDepositsPersonal $ 200,030 $ 199,302 $ 190,044 $ 175,163 $ 171,048 $ 138,051 $ 133,025Business and government 384,988 372,303 375,144 342,367 313,820 293,460 262,833Financial institutions 40,349 40,272 35,731 36,487 33,019 34,178 25,376
625,367 611,877 600,919 554,017 517,887 465,689 421,234Financial instruments designated at fair value through
profit or loss 4,663 1,459 1,486 465 174 157 101OtherAcceptances 13,560 11,978 10,296 9,876 10,556 8,932 8,172Obligations related to securities sold short 30,766 23,312 20,212 27,050 24,977 18,622 15,450Derivative financial instruments 34,200 42,387 45,270 36,438 29,267 35,323 40,236Obligations related to securities sold under repurchase
agreements and securities lent 95,843 97,083 77,015 88,953 77,508 56,968 38,216Subordinated debentures 5,935 7,633 6,182 4,871 5,841 10,143 6,923Capital instruments – – – – – – 2,003Other liabilities 43,314 42,716 41,638 34,785 32,047 32,726 29,848
223,618 225,109 200,613 201,973 180,196 162,714 140,848
853,648 838,445 803,018 756,455 698,257 628,560 562,183
EquityCommon equityCommon shares 15,644 15,513 15,141 15,231 14,516 13,139 8,336Retained earnings 38,117 34,752 31,316 28,609 25,068 21,775 18,421Accumulated other comprehensive income (loss) 1,577 2,240 2,455 949 388 (745) (497)Other reserves 116 152 173 176 193 166 96
Total common equity 55,454 52,657 49,085 44,965 40,165 34,335 26,356Preferred shares and other equity instruments 4,579 3,594 2,934 2,934 4,084 4,384 4,384
Total equity attributable to equity holders of the Bank 60,033 56,251 52,019 47,899 44,249 38,719 30,740Non-controlling interestsNon-controlling interests in subsidiaries 1,592 1,570 1,460 1,312 1,138 946 626Capital instrument equity holders – – – – – – 874
Total equity 61,625 57,821 53,479 49,211 45,387 39,665 32,240
$ 915,273 $ 896,266 $ 856,497 $ 805,666 $ 743,644 $ 668,225 $ 594,423
116 | 2 0 1 7 S C O T I A B A N K A N N U A L R E P O R T

MA
NA
GEM
ENT’S
DISC
USSIO
NA
ND
AN
ALY
SIS|
SUP
PLE
ME
NT
AR
YD
AT
A
T79 Consolidated Statement of Income
IFRS
For the year ended October 31 ($ millions) 2017 2016 2015 2014 2013 2012 2011
RevenueInterest incomeLoans $ 21,719 $ 20,419 $ 18,912 $ 18,176 $ 17,359 $ 15,606 $ 14,373Securities 1,403 1,237 922 921 1,000 1,045 986Securities purchased under resale agreements and securities
borrowed 283 158 161 180 190 221 221Deposits with financial institutions 522 394 292 263 279 287 275
23,927 22,208 20,287 19,540 18,828 17,159 15,855
Interest expenseDeposits 7,878 6,793 6,070 6,173 6,397 6,117 5,589Subordinated debentures 226 232 187 204 339 381 369Capital instruments – – – – – – 138Other 788 891 938 858 742 691 745
8,892 7,916 7,195 7,235 7,478 7,189 6,841
Net interest income 15,035 14,292 13,092 12,305 11,350 9,970 9,014Non-interest income 12,120 12,058 10,957 11,299 9,949 9,676 8,296
Total revenue 27,155 26,350 24,049 23,604 21,299 19,646 17,310
Provision for credit losses 2,249 2,412 1,942 1,703 1,288 1,252 1,076Non-interest expenses 14,630 14,540 13,041 12,601 11,664 10,436 9,481
Income before taxes 10,276 9,398 9,066 9,300 8,347 7,958 6,753Income tax expense 2,033 2,030 1,853 2,002 1,737 1,568 1,423
Net income $ 8,243 $ 7,368 $ 7,213 $ 7,298 $ 6,610 $ 6,390 $ 5,330
Net income attributable to non-controlling interests $ 238 $ 251 $ 199 $ 227 $ 231 $ 196 $ 149Non-controlling interests in subsidiaries 238 251 199 227 231 196 91Capital instrument equity holders – – – – – – 58
Net income attributable to equity holders of the Bank $ 8,005 $ 7,117 $ 7,014 $ 7,071 $ 6,379 $ 6,194 $ 5,181Preferred shareholders and other equity instrument
holders 129 130 117 155 217 220 216Common shareholders $ 7,876 $ 6,987 $ 6,897 $ 6,916 $ 6,162 $ 5,974 $ 4,965
Earnings per common share (in dollars)Basic $ 6.55 $ 5.80 $ 5.70 $ 5.69 $ 5.15 $ 5.27 $ 4.63Diluted $ 6.49 $ 5.77 $ 5.67 $ 5.66 $ 5.11 $ 5.18 $ 4.53
Dividends per common share (in dollars) $ 3.05 $ 2.88 $ 2.72 $ 2.56 $ 2.39 $ 2.19 $ 2.05
2 0 1 7 S C O T I A B A N K A N N U A L R E P O R T | 117

MANAGEMENT’S DISCUSSION AND ANALYSIS
T80A Consolidated Balance Sheet – CGAAP
CGAAP
As at October 31 ($ millions) 2010 2009 2008 2007
AssetsCash resources $ 46,027 $ 43,278 $ 37,318 $ 29,195
SecuritiesTrading 64,684 58,067 48,292 59,685Available-for-sale 47,228 55,699 38,823 28,426Equity accounted investments 4,651 3,528 920 724
116,563 117,294 88,035 88,835
Securities purchased under resale agreements 27,920 17,773 19,451 22,542
LoansResidential mortgages 120,482 101,604 115,084 102,154Personal and credit cards 62,548 61,048 50,719 41,734Business and government 103,981 106,520 125,503 85,500
287,011 269,172 291,306 229,388
Allowance for credit losses 2,787 2,870 2,626 2,241
284,224 266,302 288,680 227,147
OtherCustomers’ liability under acceptances 7,616 9,583 11,969 11,538Derivative instruments 26,852 25,992 44,810 21,960Land, buildings and equipment 2,450 2,372 2,449 2,061Other assets 15,005 13,922 14,913 8,232
51,923 51,869 74,141 43,791
$ 526,657 $ 496,516 $ 507,625 $ 411,510
Liabilities and shareholders’ equityDepositsPersonal $ 128,850 $ 123,762 $ 118,919 $ 100,823Business and government 210,687 203,594 200,566 161,229Banks 22,113 23,063 27,095 26,406
361,650 350,419 346,580 288,458
OtherAcceptances 7,616 9,583 11,969 11,538Obligations related to securities sold under repurchase agreements 40,286 36,568 36,506 28,137Obligations related to securities sold short 21,519 14,688 11,700 16,039Derivative instruments 31,990 28,806 42,811 24,689Other liabilities 28,947 24,682 31,063 21,138
130,358 114,327 134,049 101,541
Subordinated debentures 5,939 5,944 4,352 1,710
Capital instrument liabilities 500 500 500 500
Shareholders’ equityPreferred shares 3,975 3,710 2,860 1,635Common shareholders’ equity
Common shares and contributed surplus 5,775 4,946 3,829 3,566Retained earnings 21,932 19,916 18,549 17,460Accumulated other comprehensive income (loss) (4,051) (3,800) (3,596) (3,857)
Total common shareholders’ equity 23,656 21,062 18,782 17,169
Total equity attributable to equity holders of the Bank 27,631 24,772 21,642 18,804Non-controlling interests 579 554 502 497
Total shareholders’ equity 28,210 25,326 22,144 19,301
$ 526,657 $ 496,516 $ 507,625 $ 411,510
118 | 2 0 1 7 S C O T I A B A N K A N N U A L R E P O R T

MA
NA
GEM
ENT’S
DISC
USSIO
NA
ND
AN
ALY
SIS|
SUP
PLE
ME
NT
AR
YD
AT
A
T81A Consolidated Statement of Income – CGAAP
CGAAP
For the year ended October 31 ($ millions) 2010 2009 2008 2007
Interest incomeLoans $ 12,171 $ 13,973 $ 15,832 $ 13,985Securities 4,227 4,090 4,615 4,680Securities purchased under resale agreements 201 390 786 1,258Deposits with banks 292 482 1,083 1,112
16,891 18,935 22,316 21,035Interest expenseDeposits 6,768 8,339 12,131 10,850Subordinated debentures 289 285 166 116Capital instrument liabilities 37 37 37 53Other 1,176 1,946 2,408 2,918
8,270 10,607 14,742 13,937
Net interest income 8,621 8,328 7,574 7,098Provision for credit losses 1,239 1,744 630 270
Net interest income after provision for credit losses 7,382 6,584 6,944 6,828
Other income 6,884 6,129 4,302 5,392
Net interest and other income 14,266 12,713 11,246 12,220
Non-interest expensesSalaries and employee benefits 4,647 4,344 4,109 3,983Other 3,535 3,575 3,187 3,011
8,182 7,919 7,296 6,994
Income before income taxes 6,084 4,794 3,950 5,226Provision for income taxes 1,745 1,133 691 1,063
Net income $ 4,339 $ 3,661 $ 3,259 $ 4,163
Net income attributable to non-controlling interests $ 100 $ 114 $ 119 $ 118
Net income attributable to equity holders of the Bank 4,239 3,547 3,140 4,045Preferred shareholders 201 186 107 51Common shareholders $ 4,038 $ 3,361 $ 3,033 $ 3,994
Average number of common shares outstanding (millions)Basic 1,032 1,013 987 989Diluted 1,034 1,016 993 997
Earnings per common share (in dollars)(1)
Basic $ 3.91 $ 3.32 $ 3.07 $ 4.04Diluted $ 3.91 $ 3.31 $ 3.05 $ 4.01
Dividends per common share (in dollars) $ 1.96 $ 1.96 $ 1.92 $ 1.74
(1) The calculation of earnings per share is based on full dollar and share amounts.
2 0 1 7 S C O T I A B A N K A N N U A L R E P O R T | 119

MANAGEMENT’S DISCUSSION AND ANALYSIS
T82 Consolidated Statement of Changes in EquityIFRS
For the year ended October 31 ($ millions) 2017 2016 2015 2014 2013 2012 2011
Common sharesBalance at beginning of year $ 15,513 $ 15,141 $ 15,231 $ 14,516 $ 13,139 $ 8,336 $ 5,750Issued 313 391 104 771 1,377 4,803 2,586Purchased for cancellation (182) (19) (194) (56) – – –Balance at end of year $ 15,644 $ 15,513 $ 15,141 $ 15,231 $ 14,516 $ 13,139 $ 8,336
Retained earningsBalance at beginning of year 34,752 31,316 28,609 25,315 21,978 18,421 21,932IFRS adjustment – – – (247) (203) (144) (6,248)Restated balances 34,752 31,316 28,609 25,068 21,775 18,277 15,684Adjustments – – – – – – –Net income attributable to common shareholders of the Bank(2) 7,876 6,987 6,897 6,916 6,162 5,974 4,965Dividends: Preferred(3) – – – – – – –
Common (3,668) (3,468) (3,289) (3,110) (2,858) (2,493) (2,200)Purchase of shares for cancellation and premium on
redemption (827) (61) (761) (264) – – –Other (16) (22) (140)(4) (1) (11) 17 (28)Balance at end of year $ 38,117 $ 34,752 $ 31,316 $ 28,609 $ 25,068 $ 21,775 $ 18,421Accumulated other comprehensive income (loss)Balance at beginning of year 2,240 2,455 949 545 (31) (497) (4,051)IFRS adjustment – – – (157) (714) 32 4,320Restated balances 2,240 2,455 949 388 (745) (465) 269Cumulative effect of adopting new accounting policies – – (5)(5) – – – –Other comprehensive income (loss) (663) (215) 1,511 561 1,133 (280) (766)Balance at end of year $ 1,577 $ 2,240 $ 2,455 $ 949 $ 388 $ (745) $ (497)Other reserves(7)
Balance at beginning of year 152 173 176 193 166 96 25Share-based payments 8 7 14 30 36 38 46Other (44) (28) (17) (47) (9) 32 25Balance at end of year $ 116 $ 152 $ 173 $ 176 $ 193 $ 166 $ 96
Total common equity $ 55,454 $ 52,657 $ 49,085 $ 44,965 $ 40,165 $ 34,335 $ 26,356Preferred shares and other equity instrumentsBalance at beginning of year 3,594 2,934 2,934 4,084 4,384 4,384 3,975Net income attributable to preferred shareholders and other
equity instrument holders of the Bank(2) 129 130 117 155 217 220 216Preferred and other equity instrument dividends(3) (129) (130) (117) (155) (217) (220) (216)Issued 1,560 1,350 – – – – 409Redeemed (575) (690) – (1,150) (300) – –Balance at end of year $ 4,579 $ 3,594 $ 2,934 $ 2,934 $ 4,084 $ 4,384 $ 4,384Non-controlling interestsBalance at beginning of year 1,570 1,460 1,312 1,155 1,743 1,500 579IFRS adjustment – – – (17) (797) (891) 936Restated balances 1,570 1,460 1,312 1,138 946 609 1,515Net income attributable to non-controlling interests 238 251 199 227 231 196 149Distributions to non-controlling interests (133) (116) (86) (76) (80) (44) (181)Effect of foreign exchange and others (83) (25) 35 23 41 185 17Balance at end of year $ 1,592 $ 1,570 $ 1,460 $ 1,312 $ 1,138 $ 946 $ 1,500Total equity at end of year $ 61,625 $ 57,821 $ 53,479 $ 49,211 $ 45,387 $ 39,665 $ 32,240
(1) Relates to the adoption of new financial instruments accounting standards under CGAAP.(2) Under CGAAP, net income attributable to preferred shareholders was included in retained earnings.(3) Under IFRS, preferred dividends are recorded as a reduction to preferred shareholders’ equity. Under CGAAP, dividends are a reduction to retained earnings.(4) Includes retrospective adjustments primarily related to foreign currency translation on Allowance for Credit Losses with respect to periods prior to 2013 ($152).(5) To reflect the adoption of the own credit risk provisions of IFRS 9 pertaining to financial liabilities designated at fair value through profit or loss.(6) Relates to the adoption of the new accounting standard for impairment and classification of financial instruments under CGAAP.(7) Under CGAAP, amounts represent Contributed Surplus.
T83 Consolidated Statement of Comprehensive IncomeIFRS
For the year ended October 31 ($ millions) 2017 2016 2015 2014 2013 2012 2011
Net income $ 8,243 $ 7,368 $ 7,213 $ 7,298 $ 6,610 $ 6,390 $ 5,330Other comprehensive income (loss), net of income taxes:Items that will be reclassified subsequently to net income
Net change in unrealized foreign currency translation gains(losses) (1,259) 396 1,855 889 346 149 (697)
Net change in unrealized gains (losses) on available-for-salesecurities (55) (172) (480) (38) 110 151 (169)
Net change in gains (losses) on derivative instrumentsdesignated as cash flow hedges (28) 258 55 (6) 93 116
Other comprehensive income from investments in associates 56 31 (9) 60 20 25 105Items that will not be reclassified subsequently to net income –
Net change in remeasurement of employee benefit plan assetand liability 592 (716) (1) (320) 563 (747) –
Net change in fair value due to change in own credit risk onfinancial liabilities designated under the fair value option(1) (21) (16) 15 N/A N/A N/A N/A
Other comprehensive income from investments in associates 6 (10) 1 (2) – – –Other comprehensive income (loss) (709) (229) 1,436 583 1,132 (306) (761)Comprehensive income $ 7,534 $ 7,139 $ 8,649 $ 7,881 $ 7,742 $ 6,084 $ 4,569
Comprehensive income attributable to:Common shareholders of the Bank $ 7,213 $ 6,772 $ 8,408 $ 7,477 $ 7,298 $ 5,694 $ 4,199Preferred shareholders and other equity instrument holders
of the Bank 129 130 117 155 217 220 216Non-controlling interests in subsidiaries 192 237 124 249 227 170 96Capital instrument equity holders – – – – – – 58
$ 7,534 $ 7,139 $ 8,649 $ 7,881 $ 7,742 $ 6,084 $ 4,569
(1) In accordance with the transition requirements for the own credit risk provisions of IFRS 9, prior year comparatives have not been restated for the adoption of this standard in 2015.
120 | 2 0 1 7 S C O T I A B A N K A N N U A L R E P O R T

MA
NA
GEM
ENT’S
DISC
USSIO
NA
ND
AN
ALY
SIS|
SUP
PLE
ME
NT
AR
YD
AT
A
CGAAP
2010 2009 2008 2007
$ 4,946 $ 3,829 $ 3,566 $ 3,425804 1,117 266 184
– – (3) (43)$ 5,750 $ 4,946 $ 3,829 $ 3,566
19,916 18,549 17,460 15,843– – – –
19,916 18,549 17,460 15,843– – – (61)(1)
4,239 3,547 3,140 4,045(201) (186) (107) (51)
(2,023) (1,990) (1,896) (1,720)
– – (37) (586)1 (4) (11) (10)
$ 21,932 $ 19,916 $ 18,549 $ 17,460
(3,800) (3,596) (3,857) (2,321)– – – –
(3,800) (3,596) (3,857) (2,321)– 595(6) – 683
(251) (799) 261 (2,219)$ (4,051) $ (3,800) $ (3,596) $ (3,857)
– – – –25 – – –
– – – –$ 25 $ – $ – $ –$ 23,656 $ 21,062 $ 18,782 $ 17,169
3,710 2,860 1,635 600
– – – –– – – –
265 850 1,225 1,035– – – –
$ 3,975 $ 3,710 $ 2,860 $ 1,635
554 502 N/A N/A– – – –
554 502 N/A N/A100 114 N/A N/A(35) (36) N/A N/A(40) (26) N/A N/A
$ 579 $ 554 $ 502 $ 497$ 28,210 $ 25,326 $ 22,144 $ 19,301
CGAAP
2010 2009 2008 2007
$ 4,339 $ 3,661 $ 3,259 $ 4,163
(591) (1,736) 2,368 (2,228)
278 894 (1,588) (67)
62 43 (519) 76– – – –
– – – –
N/A N/A N/A N/A– – – –
(251) (799) 261 (2,219)$ 4,088 $ 2,862 $ 3,520 $ 1,944
$ 3,787 $ 2,562 $ 3,294 $ 1,775
201 186 107 51100 114 119 118
– – – –$ 4,088 $ 2,862 $ 3,520 $ 1,944
2 0 1 7 S C O T I A B A N K A N N U A L R E P O R T | 121

MANAGEMENT’S DISCUSSION AND ANALYSIS
T84 Other statistics
IFRS
For the year ended October 31 2017 2016 2015 2014 2013 2012 2011
Operating performanceBasic earnings per share ($) 6.55 5.80 5.70 5.69 5.15 5.27 4.63
Diluted earnings per share ($) 6.49 5.77 5.67 5.66 5.11 5.18 4.53
Return on equity (%) 14.6 13.8 14.6 16.1 16.6 19.9 20.3
Productivity ratio (%) 53.9 55.2 54.2 53.4 54.8 53.1 54.8
Return on assets (%) 0.90 0.81 0.84 0.92 0.88 0.97 0.91
Core banking margin (%)(1) 2.46 2.38 2.39 2.39 2.31 2.31 2.32
Net interest margin on total averageassets (%) N/A N/A N/A N/A N/A N/A N/A
Capital measures(2)
Common Equity Tier 1 (CET1) capitalratio (%) 11.5 11.0 10.3 10.8 9.1 N/A N/A
Tier 1 capital ratio (%) 13.1 12.4 11.5 12.2 11.1 13.6 12.2
Total capital ratio (%) 14.9 14.6 13.4 13.9 13.5 16.7 13.9
Leverage ratio (%) 4.7 4.5 4.2 N/A N/A N/A N/A
Common share informationClosing share price ($)(TSX) 83.28 72.08 61.49 69.02 63.39 54.25 52.53
Number of shares outstanding(millions) 1,199 1,208 1,203 1,217 1,209 1,184 1,089
Dividends paid per share ($) 3.05 2.88 2.72 2.56 2.39 2.19 2.05
Dividend yield (%)(3) 4.0 4.7 4.4 3.8 4.1 4.2 3.7
Price to earnings multiple (trailing 4quarters) 12.7 12.4 10.8 12.1 12.3 10.3 11.3
Book value per common share ($) 46.24 43.59 40.80 36.96 33.23 28.99 24.20
Other informationAverage total assets ($ millions) 912,619 913,844 860,607 795,641 748,901 659,538 586,101
Number of branches and offices 3,003 3,113 3,177 3,288 3,330 3,123 2,926
Number of employees 88,645 88,901 89,214 86,932 86,690 81,497 75,362
Number of automated bankingmachines 8,140 8,144 8,191 8,732 8,471 7,341 6,260
(1) Refer to page 14 for a discussion of non-GAAP measures.(2) Effective November 1, 2012, regulatory capital ratios are determined in accordance with Basel III rules as an all-in basis. Comparative amounts for periods 2012-2008 were determined in accordance with Basel II rules. Amounts
prior to 2008 were determined in accordance with Basel I rules and have not been restated.(3) Based on the average of the high and low common share price for the year.
122 | 2 0 1 7 S C O T I A B A N K A N N U A L R E P O R T
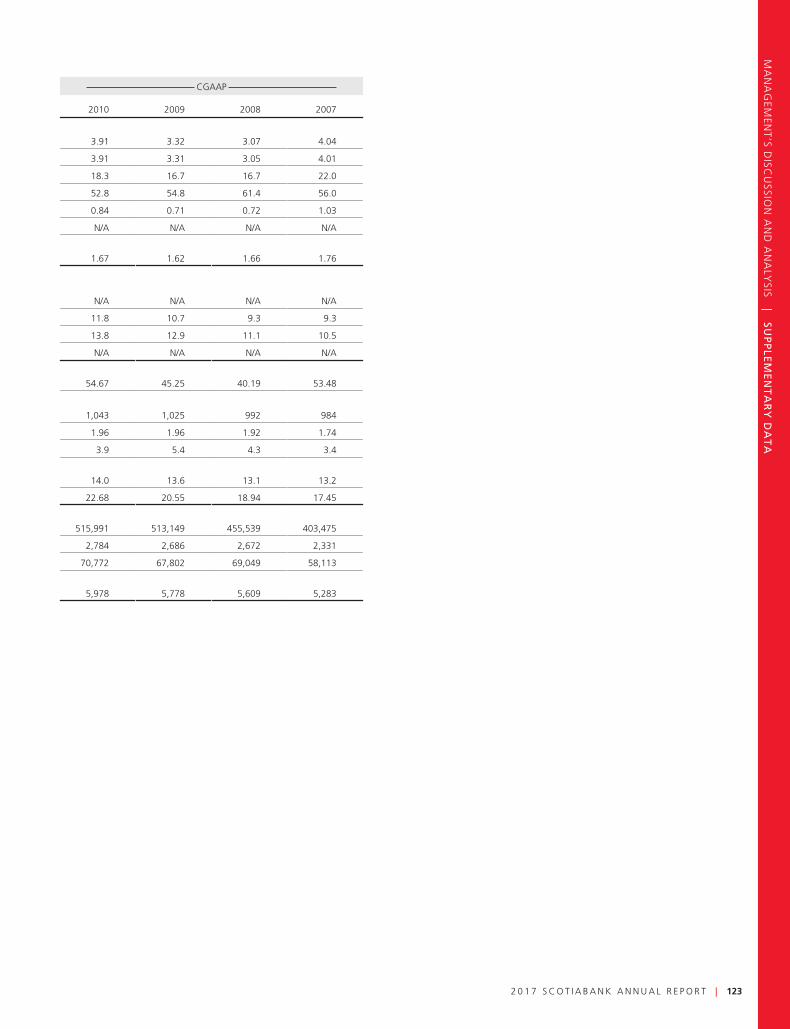
MA
NA
GEM
ENT’S
DISC
USSIO
NA
ND
AN
ALY
SIS|
SUP
PLE
ME
NT
AR
YD
AT
A
CGAAP
2010 2009 2008 2007
3.91 3.32 3.07 4.04
3.91 3.31 3.05 4.01
18.3 16.7 16.7 22.0
52.8 54.8 61.4 56.0
0.84 0.71 0.72 1.03
N/A N/A N/A N/A
1.67 1.62 1.66 1.76
N/A N/A N/A N/A
11.8 10.7 9.3 9.3
13.8 12.9 11.1 10.5
N/A N/A N/A N/A
54.67 45.25 40.19 53.48
1,043 1,025 992 984
1.96 1.96 1.92 1.74
3.9 5.4 4.3 3.4
14.0 13.6 13.1 13.2
22.68 20.55 18.94 17.45
515,991 513,149 455,539 403,475
2,784 2,686 2,672 2,331
70,772 67,802 69,049 58,113
5,978 5,778 5,609 5,283
2 0 1 7 S C O T I A B A N K A N N U A L R E P O R T | 123

MANAGEMENT’S DISCUSSION AND ANALYSIS
Management’s Report on Internal Control Over Financial Reporting
The management of The Bank of Nova Scotia (the Bank) is responsible for establishing and maintaining adequate internal control over financialreporting, and have designed such internal control over financial reporting to provide reasonable assurance regarding the reliability of financialreporting and the preparation of financial statements for external purposes in accordance with International Financial Reporting Standards as issued byThe International Accounting Standards Board.
Management has used the Internal Control – Integrated Framework (2013) to evaluate the effectiveness of internal control over financialreporting, which is a recognized and suitable framework developed by the Committee of Sponsoring Organizations of the Treadway Commission(COSO).
Because of its inherent limitations, internal control over financial reporting may not prevent or detect misstatements. Also, projections of anyevaluation of effectiveness to future periods are subject to the risk that controls may become inadequate because of changes in conditions, or that thedegree of compliance with the policies or procedures may deteriorate.
Management has evaluated the design and operation of the Bank’s internal control over financial reporting as of October 31, 2017, and hasconcluded that such internal control over financial reporting is effective. There are no material weaknesses that have been identified by managementin this regard.
KPMG LLP, the independent auditors appointed by the shareholders of the Bank, who have audited the consolidated financial statements, havealso audited internal control over financial reporting and have issued their report below.
Brian J. Porter Sean McGuckinPresident and Chief Executive Officer Chief Financial Officer
Toronto, CanadaNovember 28, 2017
Report of Independent Registered Public Accounting FirmTo the Shareholders of The Bank of Nova Scotia
We have audited The Bank of Nova Scotia’s internal control over financial reporting as of October 31, 2017, based on criteria established in InternalControl – Integrated Framework (2013) issued by the Committee of Sponsoring Organizations of the Treadway Commission (COSO). The Bank ofNova Scotia’s management is responsible for maintaining effective internal control over financial reporting and for its assessment of the effectivenessof internal control over financial reporting, included in the accompanying “Management’s Report on Internal Control over Financial Reporting”. Ourresponsibility is to express an opinion on The Bank of Nova Scotia’s internal control over financial reporting based on our audit.
We conducted our audit in accordance with the standards of the Public Company Accounting Oversight Board (United States). Those standardsrequire that we plan and perform the audit to obtain reasonable assurance about whether effective internal control over financial reporting wasmaintained in all material respects. Our audit included obtaining an understanding of internal control over financial reporting, assessing the risk that amaterial weakness exists, and testing and evaluating the design and operating effectiveness of internal control based on the assessed risk. Our auditalso included performing such other procedures as we considered necessary in the circumstances. We believe that our audit provides a reasonablebasis for our opinion.
A company’s internal control over financial reporting is a process designed to provide reasonable assurance regarding the reliability of financialreporting and the preparation of financial statements for external purposes in accordance with generally accepted accounting principles. A company’sinternal control over financial reporting includes those policies and procedures that (1) pertain to the maintenance of records that, in reasonabledetail, accurately and fairly reflect the transactions and dispositions of the assets of the company; (2) provide reasonable assurance that transactionsare recorded as necessary to permit preparation of financial statements in accordance with generally accepted accounting principles, and that receiptsand expenditures of the company are being made only in accordance with authorizations of management and directors of the company; and(3) provide reasonable assurance regarding prevention or timely detection of unauthorized acquisition, use, or disposition of the company’s assets thatcould have a material effect on the financial statements.
Because of its inherent limitations, internal control over financial reporting may not prevent or detect misstatements. Also, projections of anyevaluation of effectiveness to future periods are subject to the risk that controls may become inadequate because of changes in conditions, or that thedegree of compliance with the policies or procedures may deteriorate.
In our opinion, The Bank of Nova Scotia maintained, in all material respects, effective internal control over financial reporting as of October 31,2017, based on criteria established in Internal Control – Integrated Framework (2013) issued by the Committee of Sponsoring Organizations of theTreadway Commission (COSO).
We also have audited, in accordance with Canadian generally accepted auditing standards and the standards of the Public Company AccountingOversight Board (United States), the consolidated statements of financial position of The Bank of Nova Scotia as at October 31, 2017 and October 31,2016, the consolidated statements of income, comprehensive income, changes in equity and cash flows for each of the years in the three-year periodended October 31, 2017, and notes, comprising a summary of significant accounting policies and other explanatory information, and our report datedNovember 28, 2017 expressed an unmodified (unqualified) opinion on those consolidated financial statements.
Chartered Professional Accountants, Licensed Public AccountantsToronto, Canada
November 28, 2017
124 | 2 0 1 7 S C O T I A B A N K A N N U A L R E P O R T

CONSOLIDATED FINANCIAL STATEMENTS
TABLE OF CONTENTS126 Management’s Responsibility for Financial Information
127 Independent Auditors’ Report of Registered Public Accounting Firm
128 Consolidated Statement of Financial Position
129 Consolidated Statement of Income
130 Consolidated Statement of Comprehensive Income
131 Consolidated Statement of Changes in Equity
132 Consolidated Statement of Cash Flows
133 Notes to the 2017 Consolidated Financial Statements
2 0 1 7 S C O T I A B A N K A N N U A L R E P O R T | 125
CONSOLIDATED FINANCIAL STATEMENTS
Management’s Responsibility for Financial Information
The management of The Bank of Nova Scotia (the Bank) is responsible for the integrity and fair presentation of the financial information contained inthis Annual Report. The consolidated financial statements have been prepared in accordance with International Financial Reporting Standards asissued by the International Accounting Standards Board. The consolidated financial statements also comply with the accounting requirements of theBank Act.
The consolidated financial statements, where necessary, include amounts which are based on the best estimates and judgment of management.Financial information presented elsewhere in this Annual Report is consistent with that shown in the consolidated financial statements.
Management has always recognized the importance of the Bank maintaining and reinforcing the highest possible standards of conduct in all of itsactions, including the preparation and dissemination of statements fairly presenting the financial condition of the Bank. In this regard, managementhas developed and maintains a system of accounting and reporting which provides for the necessary internal controls to ensure that transactions areproperly authorized and recorded, assets are safeguarded against unauthorized use or disposition, and liabilities are recognized. The system isaugmented by written policies and procedures, the careful selection and training of qualified staff, the establishment of organizational structuresproviding an appropriate and well-defined division of responsibilities, and the communication of policies and guidelines of Scotiabank’s Code ofConduct throughout the Bank.
Management, under the supervision of and the participation of the President and Chief Executive Officer and the Group Head and Chief FinancialOfficer, have a process in place to evaluate disclosure controls and procedures and internal control over financial reporting in line with Canadian andU.S. securities regulations.
The system of internal controls is further supported by a professional staff of internal auditors who conduct periodic audits of all aspects of theBank’s operations. As well, the Bank’s Chief Auditor has full and free access to, and meets periodically with the Audit Committee of the Board ofDirectors. In addition, the Bank’s compliance function maintains policies, procedures and programs directed at ensuring compliance with regulatoryrequirements, including conflict of interest rules.
The Office of the Superintendent of Financial Institutions Canada, which is mandated to protect the rights and interests of the depositors andcreditors of the Bank, examines and enquires into the business and affairs of the Bank, as deemed necessary, to determine whether the provisions ofthe Bank Act are being complied with, and that the Bank is in a sound financial condition.
The Audit Committee, composed entirely of outside directors, reviews the consolidated financial statements with both management and theindependent auditors before such statements are approved by the Board of Directors and submitted to the shareholders of the Bank.
The Audit Committee reviews and reports its findings to the Board of Directors on all related party transactions that may have a material impact onthe Bank.
KPMG LLP, the independent auditors appointed by the shareholders of the Bank, have audited the consolidated financial position of the Bank as atOctober 31, 2017 and October 31, 2016 and its consolidated financial performance and its consolidated cash flows for each of the years in the three-year period ended October 31, 2017 prepared in accordance with International Financial Reporting Standards as issued by the InternationalAccounting Standards Board in accordance with Canadian Generally Accepted Auditing Standards and the standards of the Public CompanyAccounting Oversight Board (United States) and the effectiveness of internal control over financial reporting and have expressed their opinions uponcompletion of such audits in the following report to the shareholders. The Shareholders’ Auditors have full and free access to, and meet periodicallywith, the Audit Committee to discuss their audits, including any findings as to the integrity of the Bank’s accounting, financial reporting and relatedmatters.
Brian J. PorterPresident and Chief Executive Officer
Sean McGuckinChief Financial Officer
Toronto, CanadaNovember 28, 2017
126 | 2 0 1 7 S C O T I A B A N K A N N U A L R E P O R T

CO
NSO
LIDA
TEDFIN
AN
CIA
LSTA
TEMEN
TS
Independent Auditors’ Report of Registered Public Accounting FirmTo the Shareholders of The Bank of Nova Scotia
We have audited the accompanying consolidated financial statements of The Bank of Nova Scotia, which comprise the consolidated statements offinancial position as at October 31, 2017 and October 31, 2016, the consolidated statements of income, comprehensive income, changes in equityand cash flows for each of the years in the three-year period ended October 31, 2017, and notes, comprising a summary of significant accountingpolicies and other explanatory information.
Management’s Responsibility for the Consolidated Financial StatementsManagement is responsible for the preparation and fair presentation of these consolidated financial statements in accordance with InternationalFinancial Reporting Standards as issued by the International Accounting Standards Board, and for such internal control as management determines isnecessary to enable the preparation of consolidated financial statements that are free from material misstatement, whether due to fraud or error.
Auditors’ ResponsibilityOur responsibility is to express an opinion on these consolidated financial statements based on our audits. We conducted our audits in accordancewith Canadian generally accepted auditing standards and the standards of the Public Company Accounting Oversight Board (United States). Thosestandards require that we comply with ethical requirements and plan and perform the audit to obtain reasonable assurance about whether theconsolidated financial statements are free from material misstatement.
An audit involves performing procedures to obtain audit evidence about the amounts and disclosures in the consolidated financial statements. Theprocedures selected depend on our judgment, including the assessment of the risks of material misstatement of the consolidated financial statements,whether due to fraud or error. In making those risk assessments, we consider internal control relevant to the Bank’s preparation and fair presentationof the consolidated financial statements in order to design audit procedures that are appropriate in the circumstances. An audit also includesexamining, on a test basis, evidence supporting the amounts and disclosures in the consolidated financial statements, evaluating the appropriatenessof accounting policies used and the reasonableness of accounting estimates made by management, as well as evaluating the overall presentation ofthe consolidated financial statements.
We believe that the audit evidence we have obtained in our audits is sufficient and appropriate to provide a basis for our audit opinion.
OpinionIn our opinion, the consolidated financial statements present fairly, in all material respects, the consolidated financial position of The Bank of NovaScotia as at October 31, 2017 and October 31, 2016 and its consolidated financial performance and its consolidated cash flows for each of the yearsin the three-year period ended October 31, 2017 in accordance with International Financial Reporting Standards as issued by the InternationalAccounting Standards Board.
Other MatterWe also have audited, in accordance with the standards of the Public Company Accounting Oversight Board (United States), The Bank of NovaScotia’s internal control over financial reporting as of October 31, 2017, based on the criteria established in Internal Control – Integrated Framework(2013) issued by the Committee of Sponsoring Organizations of the Treadway Commission (COSO), and our report dated November 28, 2017expressed an unmodified (unqualified) opinion on the effectiveness of The Bank of Nova Scotia’s internal control over financial reporting.
Chartered Professional Accountants, Licensed Public AccountantsToronto, CanadaNovember 28, 2017
2 0 1 7 S C O T I A B A N K A N N U A L R E P O R T | 127

CONSOLIDATED FINANCIAL STATEMENTS
Consolidated Statement of Financial PositionAs at October 31 ($ millions) Note 2017 2016
AssetsCash and deposits with financial institutions 5 $ 59,663 $ 46,344Precious metals 5,717 8,442Trading assets
Securities 7(a) 78,652 87,287Loans 7(b) 17,312 19,421Other 2,500 1,853
98,464 108,561Financial instruments designated at fair value through profit or loss 8 13 221Securities purchased under resale agreements and securities borrowed 95,319 92,129Derivative financial instruments 9 35,364 41,657Investment securities 11 69,269 72,919Loans
Residential mortgages 12 236,916 222,888Personal and credit cards 12 103,331 99,502Business and government 12 168,449 162,400
508,696 484,790Allowance for credit losses 12(d) 4,327 4,626
504,369 480,164OtherCustomers’ liability under acceptances 13,560 11,978Property and equipment 15 2,381 2,520Investments in associates 16 4,586 4,299Goodwill and other intangible assets 17 12,106 12,141Deferred tax assets 26(c) 1,713 2,021Other assets 18 12,749 12,870
47,095 45,829
$ 915,273 $ 896,266
LiabilitiesDeposits
Personal 19 $ 200,030 $ 199,302Business and government 19 384,988 372,303Financial institutions 19 40,349 40,272
625,367 611,877Financial instruments designated at fair value through profit or loss 8 4,663 1,459OtherAcceptances 13,560 11,978Obligations related to securities sold short 30,766 23,312Derivative financial instruments 9 34,200 42,387Obligations related to securities sold under repurchase agreements and securities lent 95,843 97,083Subordinated debentures 20 5,935 7,633Other liabilities 21 43,314 42,716
223,618 225,109
853,648 838,445
EquityCommon equity
Common shares 23(a) 15,644 15,513Retained earnings 38,117 34,752Accumulated other comprehensive income (loss) 1,577 2,240Other reserves 116 152
Total common equity 55,454 52,657Preferred shares and other equity instruments 23(b) 4,579 3,594
Total equity attributable to equity holders of the Bank 60,033 56,251Non-controlling interests in subsidiaries 30(b) 1,592 1,570
61,625 57,821
$ 915,273 $ 896,266
Thomas C. O’Neill Brian J. PorterChairman of the Board President and Chief Executive Officer
The accompanying notes are an integral part of these consolidated financial statements.
128 | 2 0 1 7 S C O T I A B A N K A N N U A L R E P O R T

CO
NSO
LIDA
TEDFIN
AN
CIA
LSTA
TEMEN
TS
Consolidated Statement of IncomeFor the year ended October 31 ($ millions) Note 2017 2016 2015
RevenueInterest incomeLoans $ 21,719 $ 20,419 $ 18,912Securities 1,403 1,237 922Securities purchased under resale agreements and securities borrowed 283 158 161Deposits with financial institutions 522 394 292
23,927 22,208 20,287
Interest expenseDeposits 7,878 6,793 6,070Subordinated debentures 226 232 187Other 788 891 938
8,892 7,916 7,195
Net interest income 15,035 14,292 13,092Non-interest incomeBanking 31 3,855 3,669 3,360Wealth management 31 3,318 3,282 3,269Underwriting and other advisory 598 594 525Non-trading foreign exchange 557 540 492Trading revenues 32 1,259 1,403 1,185Net gain on sale of investment securities 11(e) 380 534 639Net income from investments in associated corporations 16 407 414 405Insurance underwriting income, net of claims 626 603 556Other 1,120 1,019 526
12,120 12,058 10,957
Total revenue 27,155 26,350 24,049Provision for credit losses 12(d) 2,249 2,412 1,942
24,906 23,938 22,107
Non-interest expensesSalaries and employee benefits 7,375 7,025 6,681Premises and technology 2,436 2,238 2,086Depreciation and amortization 761 684 584Communications 437 442 434Advertising and business development 581 617 592Professional 775 693 548Business and capital taxes 423 403 361Other 1,842 2,438 1,755
14,630 14,540 13,041
Income before taxes 10,276 9,398 9,066Income tax expense 26 2,033 2,030 1,853
Net income $ 8,243 $ 7,368 $ 7,213
Net income attributable to non-controlling interests in subsidiaries 30(b) 238 251 199
Net income attributable to equity holders of the Bank $ 8,005 $ 7,117 $ 7,014Preferred shareholders and other equity instrument holders 129 130 117Common shareholders $ 7,876 $ 6,987 $ 6,897
Earnings per common share (in dollars)Basic 33 $ 6.55 $ 5.80 $ 5.70Diluted 33 6.49 5.77 5.67
Dividends paid per common share (in dollars) 23(a) 3.05 2.88 2.72
The accompanying notes are an integral part of these consolidated financial statements.
2 0 1 7 S C O T I A B A N K A N N U A L R E P O R T | 129

CONSOLIDATED FINANCIAL STATEMENTS
Consolidated Statement of Comprehensive IncomeFor the year ended October 31 ($ millions) 2017 2016 2015
Net income $ 8,243 $ 7,368 $ 7,213Other comprehensive income (loss)Items that will be reclassified subsequently to net income
Net change in unrealized foreign currency translation gains (losses):Net unrealized foreign currency translation gains (losses) (1,564) 614 3,145Net gains (losses) on hedges of net investments in foreign operations 404 (300) (1,677)Income tax expense (benefit):
Net unrealized foreign currency translation gains (losses) (8) (3) 46Net gains (losses) on hedges of net investments in foreign operations 107 (79) (433)
(1,259) 396 1,855Net change in unrealized gains (losses) on available-for-sale securities:Net unrealized gains (losses) on available-for-sale securities (217) 308 386Reclassification of net (gains) losses to net income(1) 143 (549) (966)Income tax expense (benefit):
Net unrealized gains (losses) on available-for-sale securities (61) 82 161Reclassification of net (gains) losses to net income 42 (151) (261)
(55) (172) (480)Net change in gains (losses) on derivative instruments designated as cash flow hedges:Net gains (losses) on derivative instruments designated as cash flow hedges 1,722 (7) 1,519Reclassification of net (gains) losses(2) (1,761) 357 (1,444)Income tax expense (benefit):
Net gains (losses) on derivative instruments designated as cash flow hedges 454 9 450Reclassification of net (gains) losses (465) 83 (430)
(28) 258 55
Other comprehensive income (loss) from investments in associates 56 31 (9)
Items that will not be reclassified subsequently to net incomeNet change in remeasurement of employee benefit plan asset and liability:Actuarial gains (losses) on employee benefit plans 805 (972) (3)Income tax expense (benefit) 213 (256) (2)
592 (716) (1)
Net change in fair value due to change in own credit risk on financial liabilities designated under the fairvalue option:
Change in fair value due to change in own credit risk on financial liabilities designated under the fairvalue option (28) (23) 20
Income tax expense (benefit) (7) (7) 5
(21) (16) 15
Other comprehensive income (loss) from investments in associates 6 (10) 1
Other comprehensive income (loss) (709) (229) 1,436
Comprehensive income $ 7,534 $ 7,139 $ 8,649
Comprehensive income attributable to non-controlling interests 192 237 124
Comprehensive income attributable to equity holders of the Bank $ 7,342 $ 6,902 $ 8,525Preferred shareholders and other equity instrument holders 129 130 117Common shareholders $ 7,213 $ 6,772 $ 8,408
(1) Includes amounts related to qualifying hedges.(2) Amount for 2016 includes reclassification of $22 pre-tax to goodwill for acquisition-related cash flow hedges.
The accompanying notes are an integral part of these consolidated financial statements.
130 | 2 0 1 7 S C O T I A B A N K A N N U A L R E P O R T

CO
NSO
LIDA
TEDFIN
AN
CIA
LSTA
TEMEN
TS
Con
solid
ated
Stat
emen
tof
Cha
nges
inEq
uity
Acc
umul
ated
othe
rco
mpr
ehen
sive
inco
me
(loss
)
($m
illio
ns)
Com
mon
shar
es(N
ote
23)
Reta
ined
earn
ings
(1)
Fore
ign
curr
ency
tran
slat
ion
Ava
ilabl
e-fo
r-sa
lese
curit
ies
Cas
hflo
whe
dges
Oth
er(2
)O
ther
rese
rves
(3)
Tota
lco
mm
oneq
uity
Pref
erre
dsh
ares
and
othe
req
uity
inst
rum
ents
(Not
e23
)
Tota
latt
ribut
able
toeq
uity
hold
ers
Non
-con
trol
ling
inte
rest
sin
subs
idia
ries
(Not
e30
(b))
Tota
l
Bal
ance
asat
No
vem
ber
1,20
16$
15,5
13$
34,7
52$
3,05
5$
14$
264
$(1,
093)
$15
2$
52,6
57$
3,59
4$
56,2
51$
1,57
0$
57,8
21N
etin
com
e–
7,87
6–
––
––
7,87
612
98,
005
238
8,24
3O
ther
com
preh
ensi
vein
com
e(lo
ss)
––
(1,1
94)
(60)
(29)
620
–(6
63)
–(6
63)
(46)
(709
)
Tota
lco
mp
reh
ensi
vein
com
e$
–$
7,87
6$
(1,1
94)
$(6
0)$
(29)
$62
0$
–$
7,21
3$
129
$7,
342
$19
2$
7,53
4Sh
ares
and
othe
req
uity
inst
rum
ents
issu
ed31
3–
––
––
(44)
269
1,56
01,
829
–1,
829
Shar
esre
purc
hase
d/re
deem
ed(1
82)
(827
)–
––
––
(1,0
09)
(575
)(1
,584
)–
(1,5
84)
Com
mon
divi
dend
spa
id–
(3,6
68)
––
––
–(3
,668
)–
(3,6
68)
–(3
,668
)Pr
efer
red
divi
dend
spa
id–
––
––
––
–(1
29)
(129
)–
(129
)D
istr
ibut
ions
tono
n-co
ntro
lling
inte
rest
s–
––
––
––
––
–(1
33)
(133
)Sh
are-
base
dpa
ymen
ts–
––
––
–8
8–
8–
8O
ther
–(1
6)–
––
––
(16)
–(1
6)(3
7)(4
)(5
3)
Bal
ance
asat
Oct
ob
er31
,201
7$
15,6
44$
38,1
17$
1,86
1$
(46)
$23
5$
(473
)$
116
$55
,454
$4,
579
$60
,033
$1,
592
$61
,625
Bal
ance
asat
No
vem
ber
1,20
15$
15,1
41$
31,3
16$
2,63
3$
194
$7
$(3
79)
$17
3$
49,0
85$
2,93
4$
52,0
19$
1,46
0$
53,4
79N
etin
com
e–
6,98
7–
––
––
6,98
713
07,
117
251
7,36
8O
ther
com
preh
ensi
vein
com
e(lo
ss)
––
422
(180
)25
7(7
14)
–(2
15)
–(2
15)
(14)
(229
)
Tota
lco
mp
reh
ensi
vein
com
e$
–$
6,98
7$
422
$(1
80)
$25
7$
(714
)$
–$
6,77
2$
130
$6,
902
$23
7$
7,13
9Sh
ares
issu
ed39
1–
––
––
(28)
363
1,35
01,
713
–1,
713
Shar
esre
purc
hase
d/re
deem
ed(1
9)(6
1)–
––
––
(80)
(690
)(7
70)
–(7
70)
Com
mon
divi
dend
spa
id–
(3,4
68)
––
––
–(3
,468
)–
(3,4
68)
–(3
,468
)Pr
efer
red
divi
dend
spa
id–
––
––
––
–(1
30)
(130
)–
(130
)D
istr
ibut
ions
tono
n-co
ntro
lling
inte
rest
s–
––
––
––
––
–(1
16)
(116
)Sh
are-
base
dpa
ymen
ts–
––
––
–7
7–
7–
7O
ther
–(2
2)–
––
––
(22)
–(2
2)(1
1)(4
)(3
3)
Bal
ance
asat
Oct
ob
er31
,201
6$
15,5
13$
34,7
52$
3,05
5$
14$
264
$(1
,093
)$
152
$52
,657
$3,
594
$56
,251
$1,
570
$57
,821
Bal
ance
asat
No
vem
ber
1,20
14$
15,2
31$
28,6
09$
700
$66
4$
(48)
$(3
67)
$17
6$
44,9
65$
2,93
4$
47,8
99$
1,31
2$
49,2
11N
etin
com
e–
6,89
7–
––
––
6,89
711
77,
014
199
7,21
3
Oth
erco
mpr
ehen
sive
inco
me
(loss
)–
–1,
933
(470
)55
(7)
–1,
511
–1,
511
(75)
1,43
6
Tota
lco
mp
reh
ensi
vein
com
e$
–$
6,89
7$
1,93
3$
(470
)$
55$
(7)
$–
$8,
408
$11
7$
8,52
5$
124
$8,
649
Shar
esis
sued
104
––
––
–(1
7)87
–87
–87
Shar
esre
purc
hase
d/re
deem
ed(1
94)
(761
)–
––
––
(955
)–
(955
)–
(955
)C
omm
ondi
vide
nds
paid
–(3
,289
)–
––
––
(3,2
89)
–(3
,289
)–
(3,2
89)
Pref
erre
ddi
vide
nds
paid
––
––
––
––
(117
)(1
17)
–(1
17)
Dis
trib
utio
nsto
non-
cont
rolli
ngin
tere
sts
––
––
––
––
––
(86)
(86)
Shar
e-ba
sed
paym
ents
––
––
––
1414
–14
–14
Oth
er–
(140
)(5)
––
–(5
)(6)
–(1
45)
–(1
45)
110(
4)(3
5)
Bal
ance
asat
Oct
ob
er31
,201
5$
15,1
41$
31,3
16$
2,63
3$
194
$7
$(3
79)
$17
3$
49,0
85$
2,93
4$
52,0
19$
1,46
0$
53,4
79
(1)
Incl
udes
undi
strib
uted
reta
ined
earn
ings
of$6
1(2
016
–$6
3;20
15–
$61)
rela
ted
toa
fore
ign
asso
ciat
edco
rpor
atio
n,w
hich
issu
bjec
tto
loca
lreg
ulat
ory
rest
rictio
n.(2
)In
clud
esSh
are
from
asso
ciat
es,E
mpl
oyee
bene
fits
and
Ow
ncr
edit
risk.
(3)
Repr
esen
tsam
ount
son
acco
unt
ofsh
are-
base
dpa
ymen
ts(r
efer
toN
ote
25).
(4)
Incl
udes
chan
ges
tono
n-co
ntro
lling
inte
rest
sar
isin
gfr
ombu
sine
ssco
mbi
natio
nsan
dot
her.
(5)
Incl
udes
retr
ospe
ctiv
ead
just
men
tspr
imar
ilyre
late
dto
fore
ign
curr
ency
tran
slat
ion
onA
llow
ance
for
Cre
dit
Loss
esw
ithre
spec
tto
perio
dspr
ior
to20
13($
152)
.(6
)Re
pres
ents
retr
ospe
ctiv
ead
just
men
tsto
refle
ctth
ead
optio
nof
the
own
cred
itris
kpr
ovis
ions
ofIF
RS9
pert
aini
ngto
finan
cial
liabi
litie
sde
sign
ated
atfa
irva
lue
thro
ugh
prof
itor
loss
in20
15.
The
acco
mpa
nyin
gno
tes
are
anin
tegr
alpa
rtof
thes
eco
nsol
idat
edfin
anci
alst
atem
ents
2 0 1 7 S C O T I A B A N K A N N U A L R E P O R T | 131

CONSOLIDATED FINANCIAL STATEMENTS
Consolidated Statement of Cash FlowsSources (uses) of cash flows for the year ended October 31 ($ millions) 2017 2016 2015
Cash flows from operating activitiesNet income $ 8,243 $ 7,368 $ 7,213Adjustment for:
Net interest income (15,035) (14,292) (13,092)Depreciation and amortization 761 684 584Provisions for credit losses 2,249 2,412 1,942Equity-settled share-based payment expense 8 7 14Net gain on sale of investment securities (380) (534) (639)Net gain on disposition of business (62) (116) –Net income from investments in associated corporations (407) (414) (405)Income tax expense 2,033 2,030 1,853Restructuring charge – 378 –
Changes in operating assets and liabilities:Trading assets 8,377 (10,044) 20,302Securities purchased under resale agreements and securities borrowed (4,631) (5,363) 13,991Loans (32,589) (20,355) (22,942)Deposits 27,516 6,702 13,915Obligations related to securities sold short 7,533 4,007 (8,101)Obligations related to assets sold under repurchase agreements and securities lent 849 20,865 (18,982)Net derivative financial instruments (391) (3,806) 2,442Other, net(1) (1,997) 2,293 7,286
Dividends received 1,600 873 1,147Interest received 23,649 21,099 19,145Interest paid (8,730) (7,787) (7,262)Income tax paid (2,012) (1,471) (1,985)
Net cash from/(used in) operating activities 16,584 4,536 16,426
Cash flows from investing activitiesInterest-bearing deposits with financial institutions (14,006) 28,447 (8,448)Purchase of investment securities (64,560) (94,441) (44,684)Proceeds from sale and maturity of investment securities 66,179 65,069 41,649Acquisition/sale of subsidiaries, associated corporations or business units, net of cash acquired 229 (1,050) (701)Property and equipment, net of disposals 3 (348) (282)Other, net (385) (431) (1,053)
Net cash from/(used in) investing activities (12,540) (2,754) (13,519)
Cash flows from financing activitiesProceeds from issue of subordinated debentures – 2,465 1,248Redemption/repayment of subordinated debentures (1,500) (1,035) (18)Proceeds from common shares issued 313 391 101Proceeds from preferred shares and other equity instruments issued 1,560 1,350 –Redemption of preferred shares (575) (690) –Common shares purchased for cancellation (1,009) (80) (955)Cash dividends paid (3,797) (3,598) (3,406)Distributions to non-controlling interests (133) (116) (86)Other, net(1) 2,209 (320) 800
Net cash from/(used in) financing activities (2,932) (1,633) (2,316)
Effect of exchange rate changes on cash and cash equivalents (142) (18) 305
Net change in cash and cash equivalents 970 131 896
Cash and cash equivalents at beginning of year(2) 6,855 6,724 5,828
Cash and cash equivalents at end of year(2) $ 7,825 $ 6,855 $ 6,724
(1) Certain comparative amounts have been restated to conform with current period presentation.(2) Represents cash and non-interest bearing deposits with financial institutions (refer to Note 5).
The accompanying notes are an integral part of these consolidated financial statements.
132 | 2 0 1 7 S C O T I A B A N K A N N U A L R E P O R T
NOTES TO THE 2017 CONSOLIDATED FINANCIAL STATEMENTS
TABLE OF CONTENTSPage Note
134 1 Reporting entity
134 2 Basis of preparation
135 3 Significant accounting policies
148 4 Future accounting developments
150 5 Cash and deposits with financial institutions
150 6 Fair value of financial instruments
156 7 Trading assets
157 8 Financial instruments designated at fair valuethrough profit or loss
158 9 Derivative financial instruments
162 10 Offsetting financial assets and financialliabilities
164 11 Investment securities
167 12 Loans, impaired loans and allowance for creditlosses
170 13 Derecognition of financial assets
171 14 Structured entities
174 15 Property and equipment
174 16 Investments in associates
175 17 Goodwill and other intangible assets
176 18 Other assets
Page Note
177 19 Deposits
177 20 Subordinated debentures
178 21 Other liabilities
178 22 Provisions
179 23 Common and preferred shares and other equityinstruments
182 24 Capital management
183 25 Share-based payments
186 26 Corporate income taxes
188 27 Employee benefits
193 28 Operating segments
195 29 Related party transactions
196 30 Principal subsidiaries and non-controllinginterests in subsidiaries
197 31 Non-interest income
197 32 Trading revenues
198 33 Earnings per share
198 34 Guarantees, commitments and pledged assets
200 35 Financial instruments – risk management
208 36 Business combinations and divestitures
208 37 Event after the Consolidated Statement ofFinancial Position date
2 0 1 7 S C O T I A B A N K A N N U A L R E P O R T | 133

CONSOLIDATED FINANCIAL STATEMENTS
1 Reporting Entity
The Bank of Nova Scotia (the Bank) is a chartered schedule I bank under the Bank Act (Canada) (the Bank Act) and is regulated by the Office of theSuperintendent of Financial Institutions (OSFI). The Bank is a global financial services provider offering a diverse range of products and services,including personal, commercial, corporate and investment banking. The head office of the Bank is located at 1709 Hollis Street, Halifax, Nova Scotia,Canada and its executive offices are at Scotia Plaza, 44 King Street West, Toronto, Canada. The common shares of the Bank are listed on the TorontoStock Exchange and the New York Stock Exchange.
2 Basis of Preparation
Statement of complianceThese consolidated financial statements were prepared in accordance with International Financial Reporting Standards (IFRS) as issued by InternationalAccounting Standards Board (IASB) and accounting requirements of OSFI in accordance with Section 308 of the Bank Act. Section 308 states that,except as otherwise specified by OSFI, the financial statements are to be prepared in accordance with IFRS.
The consolidated financial statements for the year ended October 31, 2017 have been approved by the Board of Directors for issue on November 28,2017.
Certain comparative amounts have been restated to conform with the basis of presentation in the current year.
Basis of measurementThe consolidated financial statements have been prepared on the historical cost basis except for the following material items that are measured at fairvalue in the Consolidated Statement of Financial Position:Š Financial assets and liabilities held-for-tradingŠ Financial assets and liabilities designated at fair value through profit or lossŠ Derivative financial instrumentsŠ Available-for-sale investment securities
Functional and presentation currencyThese consolidated financial statements are presented in Canadian dollars, which is the Bank’s functional currency. All financial information presentedin Canadian dollars has been rounded to the nearest million unless otherwise stated.
Management’s use of estimates, assumptions and judgmentsThe Bank’s accounting policies require estimates, assumptions and judgments that relate to matters that are inherently uncertain. The Bank hasestablished procedures to ensure that accounting policies are applied consistently. Estimates and underlying assumptions are reviewed on an ongoingbasis. Revisions to accounting estimates are recognized in the year in which the estimates are revised and in any future years affected.
Use of estimates and assumptionsThe preparation of these consolidated financial statements, in conformity with IFRS, requires management to make estimates and assumptions thataffect the reported amount of assets and liabilities at the date of the consolidated financial statements, other comprehensive income and income andexpenses during the reporting period. Estimates made by management are based on historical experience and other assumptions that are believed tobe reasonable. Key areas of estimation uncertainty include those relating to the allowance for credit losses, the fair value of financial instruments(including derivatives), corporate income taxes, employee benefits, goodwill and intangible assets, the fair value of all identifiable assets and liabilitiesas a result of business combinations, impairment of investment securities, impairment of non-financial assets, derecognition of financial assets andliabilities and provisions. While management makes its best estimates and assumptions, actual results could differ from these and other estimates.
Significant judgmentsIn the preparation of these consolidated financial statements, management is required to make significant judgments in the classification andpresentation of transactions and instruments and accounting for involvement with other entities.
134 | 2 0 1 7 S C O T I A B A N K A N N U A L R E P O R T

CO
NSO
LIDA
TEDFIN
AN
CIA
LSTA
TEMEN
TS
Significant estimates, assumptions and judgments have been made in the following areas and are discussed as noted in the consolidated financialstatements:
Allowance for credit losses Note 3Note 12(d)
Fair value of financial instruments Note 3Note 6
Corporate income taxes Note 3Note 26
Employee benefits Note 3Note 27
Goodwill and intangible assets Note 3Note 17
Fair value of all identifiable assets and liabilities as a result of business combinations Note 3Note 36
Impairment of investment securities Note 3Note 11
Impairment of non-financial assets Note 3Note 15
Structured entities Note 3Note 14
De facto control of other entities Note 3Note 30
Derecognition of financial assets and liabilities Note 3Note 13
Provisions Note 3Note 22
3 Significant Accounting Policies
The significant accounting policies used in the preparation of these consolidated financial statements, including any additional accountingrequirements of OSFI, as set out below, have been applied consistently to all periods presented in these consolidated financial statements.
Basis of consolidationThe consolidated financial statements include the assets, liabilities, financial performance and cash flows of the Bank and all of its subsidiaries, afterelimination of intercompany transactions and balances. Subsidiaries are defined as entities controlled by the Bank and exclude associates and jointarrangements. The Bank’s subsidiaries can be classified as entities controlled through voting interests or structured entities. The Bank consolidates asubsidiary from the date it obtains control. The Bank controls an investee when it is exposed, or has rights, to variable returns from its involvementwith the investee and has the ability to affect those returns through its power over the investee. For the Bank to control an entity, all of the threeelements of control should be in existence:Š power over the investee;Š exposure, or rights, to variable returns from involvement with the investee; andŠ the ability to use power over the investee to affect the amount of the Bank’s returns.
The Bank does not control an investee when it is acting as an agent. The Bank assesses whether it is an agent by determining whether it is primarilyengaged to act on behalf of and for the benefit of another party or parties. The Bank reassesses whether it controls an investee if facts andcircumstances indicate that one or more of the elements of control has changed. Non-controlling interests are presented within equity in theConsolidated Statement of Financial Position separate from equity attributable to equity holders of the Bank. Partial sales and incremental purchasesof interests in subsidiaries that do not result in a change of control are accounted for as equity transactions with non-controlling interest holders. Anydifference between the carrying amount of the interest and the transaction amount is recorded as an adjustment to retained earnings.
Voting-interest subsidiariesControl is presumed with an ownership interest of more than 50% of the voting rights in an entity unless there are other factors that indicate that theBank does not control the entity despite having more than 50% of voting rights.
The Bank may consolidate an entity when it owns less than 50% of the voting rights when it has one or more other attributes of power:Š by virtue of an agreement, over more than half of the voting rights;Š to govern the financial and operating policies of the entity under a statute or an agreement;Š to appoint or remove the majority of the members of the board of directors or equivalent governing body and control of the entity is by that board
or body; orŠ to govern the financial and operating policies of the entity through the size of its holding of voting rights relative to the size and dispersion of
holding of the other vote holders and voting patterns at shareholder meetings (i.e., de facto control).
2 0 1 7 S C O T I A B A N K A N N U A L R E P O R T | 135

CONSOLIDATED FINANCIAL STATEMENTS
Structured entitiesStructured entities are designed to accomplish certain well-defined objectives and for which voting or similar rights are not the dominant factor indeciding who controls the entity. The Bank may become involved with structured entities either at the formation stage or at a later date. The Bankcontrols an investee when it is exposed, or has rights, to variable returns from its involvement with the investee and has the ability to affect thosereturns through its power over the investee.
The Bank consolidates all structured entities that it controls.
Investments in associatesAn associate is an entity in which the Bank has significant influence, but not control, over the operating and financial policies of the entity. Significantinfluence is ordinarily presumed to exist when the Bank holds between 20% and 50% of the voting rights. The Bank may also be able to exercisesignificant influence through board representation. The effects of potential voting rights that are currently exercisable or convertible are considered inassessing whether the Bank has significant influence.
Investments in associates are recognized initially at cost, which includes the purchase price and other costs directly attributable to the purchase.Associates are accounted for using the equity method which reflects the Bank’s share of the increase or decrease of the post-acquisition earnings andother movements in the associate’s equity.
If there is a loss of significant influence and the investment ceases to be an associate, equity accounting is discontinued from the date of loss ofsignificant influence. If the retained interest on the date of loss of significant influence is a financial asset, it is measured at fair value and thedifference between the fair value and the carrying value is recorded as an unrealized gain or loss in the Consolidated Statement of Income.
Investments in associates are evaluated for impairment at the end of each financial reporting period, or more frequently if events or changes incircumstances indicate the existence of objective evidence of impairment.
For purposes of applying the equity method for an investment that has a different reporting period from the Bank, adjustments are made for theeffects of any significant events or transactions that occur between the reporting date of the investment and the reporting date of the Bank.
Joint arrangementsA joint arrangement is an arrangement over which two or more parties have joint control. Joint control exists only when decisions about the relevantactivities (i.e., those that significantly affect the returns of the arrangement) require the unanimous consent of the parties sharing the control of thearrangement. Investments in joint arrangements are classified as either joint operations or joint ventures depending on the contractual rights andobligations of each investor, rather than the legal structure of the joint arrangement.
Similar to accounting for investment in associates, for joint ventures, investments are recognized initially at cost and accounted for using the equitymethod which reflects the Bank’s share of the increase or decrease of the post-acquisition earnings and other movements in the joint venture’s equity.Investments in joint ventures are evaluated for impairment at the end of each financial reporting period, or more frequently if events or changes incircumstances indicate the existence of objective evidence of impairment.
If there is a loss of joint control and it does not result in the Bank having significant influence over the joint venture, equity accounting is discontinuedfrom the date of loss of joint control. If the retained interest in the former joint venture on the date of loss of joint control is a financial asset, it ismeasured at fair value and the difference between the fair value and the carrying value is recorded as an unrealized gain or loss in the ConsolidatedStatement of Income.
Translation of foreign currenciesThe financial statements of each of the Bank’s foreign operations are measured using its functional currency, being the currency of the primaryeconomic environment of the foreign operation.
Translation gains and losses related to the Bank’s monetary items are recognized in non-interest income in the Consolidated Statement of Income.Revenues and expenses denominated in foreign currencies are translated using average exchange rates, except for depreciation and amortization ofbuildings, equipment and leasehold improvements of the Bank, purchased in foreign currency, which are translated using historical rates. Foreigncurrency non-monetary items that are measured at historical cost are translated into the functional currency at historical rates. Foreign currencynon-monetary items measured at fair value are translated into functional currency using the rate of exchange at the date the fair value wasdetermined. Foreign currency gains and losses on non-monetary items are recognized in the Consolidated Statement of Income or ConsolidatedStatement of Comprehensive Income consistent with the gain or loss on the non-monetary item.
Unrealized gains and losses arising upon translation of foreign operations, together with any gains or losses arising from hedges of those netinvestment positions to the extent effective, are credited or charged to net change in unrealized foreign currency translation gains/losses in othercomprehensive income in the Consolidated Statement of Comprehensive Income. On disposal or partial disposal of a foreign operation, anappropriate portion of the translation differences previously recognized in other comprehensive income are recognized in the Consolidated Statementof Income.
Financial assets and liabilities
Date of recognitionThe Bank initially recognizes loans, deposits, subordinated debentures and debt securities issued on the date at which they are originated orpurchased. Regular-way purchases and sales of financial assets are recognized on the settlement date. All other financial assets and liabilities,including derivatives, are initially recognized on the trade date at which the Bank becomes a party to the contractual provisions of the instrument.
Initial classification and measurementThe classification of financial assets and liabilities at initial recognition depends on the purpose and intention for which the financial assets areacquired and liabilities issued and their characteristics. The initial measurement of a financial asset or liability is at fair value.
136 | 2 0 1 7 S C O T I A B A N K A N N U A L R E P O R T

CO
NSO
LIDA
TEDFIN
AN
CIA
LSTA
TEMEN
TS
Determination of fair valueFair value of a financial asset or liability is the price that would be received to sell an asset or paid to transfer a liability in an orderly transactionbetween market participants in the principal, or in its absence, the most advantageous market to which the Bank has access at the measurement date.
The Bank values instruments carried at fair value using quoted market prices, where available. Quoted market prices represent a Level 1 valuation.When quoted market prices are not available, the Bank maximizes the use of observable inputs within valuation models. When all significant inputsare observable, the valuation is classified as Level 2. Valuations that require the significant use of unobservable inputs are considered Level 3.
Inception gains and losses are only recognized where the valuation is dependent only on observable market data, otherwise, they are deferred andamortized over the life of the related contract or until the valuation inputs become observable.
IFRS 13 permits a measurement exception that allows an entity to determine the fair value of a group of financial assets and liabilities with offsettingrisks based on the sale or transfer of its net exposure to a particular risk (or risks). The Bank has adopted this exception through an accounting policychoice. Consequently, the fair values of certain portfolios of financial instruments are determined based on the net exposure of those instruments toparticular market, credit or funding risk.
In determining fair value for certain instruments or portfolios of instruments, valuation adjustments or reserves may be required to arrive at a moreaccurate representation of fair value. These adjustments include those made for credit risk, bid-offer spreads, unobservable parameters, constraints onprices in inactive or illiquid markets and when applicable funding costs.
Derecognition of financial assets and liabilities
Derecognition of financial assetsThe derecognition criteria are applied to the transfer of part of an asset, rather than the asset as a whole, only if such part comprises specificallyidentified cash flows from the asset, a fully proportionate share of the cash flows from the asset, or a fully proportionate share of specifically identifiedcash flows from the asset.
A financial asset is derecognized when the contractual rights to the cash flows from the asset has expired; or the Bank transfers the contractual rightsto receive the cash flows from the financial asset; or has assumed an obligation to pay those cash flows to an independent third-party; and the Bankhas transferred substantially all the risks and rewards of ownership of that asset to an independent third-party. Management determines whethersubstantially all the risk and rewards of ownership have been transferred by quantitatively comparing the variability in cash flows before and after thetransfer. If the variability in cash flows remains significantly similar subsequent to the transfer, the Bank has retained substantially all of the risks andrewards of ownership.
Where substantially all the risks and rewards of ownership of the financial asset are neither retained nor transferred, the Bank derecognizes thetransferred asset only if it has lost control over that asset. Control over the asset is represented by the practical ability to sell the transferred asset. Ifthe Bank retains control over the asset, it will continue to recognize the asset to the extent of its continuing involvement. At times such continuinginvolvement may be in the form of investment in senior or subordinated tranches of notes issued by non-consolidated structured entities.
On derecognition of a financial asset, the difference between the carrying amount and the sum of (i) the consideration received (including any newasset obtained less any new liability assumed) and (ii) any cumulative gain or loss that had been recognized in other comprehensive income isrecognized in the Consolidated Statement of Income.
Transfers of financial assets that do not qualify for derecognition are reported as secured financings in the Consolidated Statement of FinancialPosition.
Derecognition of financial liabilitiesA financial liability is derecognized when the obligation under the liability is discharged, canceled or expires. If an existing financial liability is replacedby another from the same counterparty on substantially different terms, or the terms of the existing liability are substantially modified, such anexchange or modification is treated as a derecognition of the original liability and the recognition of a new liability at fair value. The difference in therespective carrying amount of the existing liability and the new liability is recognized as a gain/loss in the Consolidated Statement of Income.
Offsetting of financial instrumentsFinancial assets and financial liabilities with the same counterparty are offset, with the net amount reported in the Consolidated Statement of FinancialPosition, only if there is currently a legally enforceable right to offset the recognized amounts and there is an intention to settle on a net basis, or torealize the assets and settle the liabilities simultaneously. When financial assets and financial liabilities are offset in the Consolidated Statement ofFinancial Position, the related income and expense items will also be offset in the Consolidated Statement of Income, unless specifically prohibited byan applicable accounting standard.
Cash and deposits with financial institutionsCash and deposits with financial institutions comprises cash, cash equivalents, demand deposits with banks and other financial institutions, highlyliquid investments that are readily convertible to cash, subject to insignificant risk of changes in value. These investments are those with less than threemonths’ maturity from the date of acquisition.
Precious metalsPrecious metals are carried at fair value less costs to sell, and any changes in fair value less costs to sell are credited or charged to non-interestincome – trading revenues in the Consolidated Statement of Income.
Trading assets and liabilitiesTrading assets and liabilities are measured at fair value in the Consolidated Statement of Financial Position, with transaction costs recognizedimmediately in the Consolidated Statement of Income as part of non-interest income – trading revenues. Gains and losses realized on disposal and
2 0 1 7 S C O T I A B A N K A N N U A L R E P O R T | 137

CONSOLIDATED FINANCIAL STATEMENTS
unrealized gains and losses due to fair value changes on trading assets and liabilities, other than certain derivatives, are recognized as part ofnon-interest income – trading revenues in the Consolidated Statement of Income. Trading assets and liabilities are not reclassified subsequent to theirinitial recognition.
Financial assets and liabilities designated at fair value through profit or lossFinancial assets and financial liabilities classified in this category are those that have been designated by the Bank on initial recognition. The Bank mayonly designate an instrument at fair value through profit or loss when one of the following criteria is met, and designation is determined on aninstrument by instrument basis:Š The designation eliminates or significantly reduces the inconsistent treatment that would otherwise arise from measuring the assets or liabilities on a
different basis; orŠ The assets and liabilities are part of a group of financial assets, financial liabilities or both which are managed together and their performance
evaluated on a fair value basis, in accordance with a documented risk management or investment strategy and the information about the group isprovided to key management personnel and it can be demonstrated that significant financial risks are eliminated or significantly reduced; or
Š The financial instrument contains one or more embedded derivatives which significantly modify the cash flows otherwise required.
Financial assets and financial liabilities designated at fair value through profit or loss are recorded in the Consolidated Statement of Financial Positionat fair value. For assets designated at fair value through profit or loss, changes in fair value are recognized in the Consolidated Statement of Income.For liabilities designated at fair value through profit or loss, changes in fair value arising from changes in the Bank’s own credit risk are recognized inthe Consolidated Statement of Comprehensive Income (OCI), without subsequent reclassification to the Consolidated Statement of Income, unlessdoing so would create or increase an accounting mismatch. All other changes in fair value are recognized in the Consolidated Statement of Income.
Securities purchased and sold under resale agreementsSecurities purchased under resale agreements (reverse repurchase agreements) and securities sold under agreements to repurchase (repurchaseagreements) are treated as collateralized financing arrangements and are recorded at amortized cost. The party disbursing the cash takes possessionof the securities serving as collateral for the financing and having a market value equal to, or in excess of, the principal amount loaned. The securitiesreceived under reverse repurchase agreements and securities delivered under repurchase agreements are not recognized on, or derecognized from,the Consolidated Statement of Financial Position, unless the risks and rewards of ownership are obtained or relinquished. The related income andinterest expense are recorded on an accrual basis in the Consolidated Statement of Income.
Obligations related to securities sold shortObligations related to securities sold short arise in dealing and market-making activities where debt securities and equity shares are sold withoutpossessing such securities.
Similarly, if securities purchased under an agreement to resell are subsequently sold to third parties, the obligation to return the securities is recordedas a short sale within obligations related to securities sold short in the Consolidated Statement of Financial Position. These trading liabilities aremeasured at fair value with any gains or losses included in non-interest income – trading revenues in the Consolidated Statement of Income. Interestexpense accruing on debt securities sold short is recorded in interest expense – other, in the Consolidated Statement of Income.
Securities lending and borrowingSecurities lending and borrowing transactions are usually collateralized by securities or cash. The transfer of the securities to counterparties is onlyreflected on the Consolidated Statement of Financial Position if the risks and rewards of ownership are also transferred. For cash collateral advancedor received, the Bank presents these transactions as securities sold under repurchase agreement or securities purchased under reverse repurchaseagreement, respectively. Interest on cash collateral advanced or received is presented in interest income – securities purchased under resaleagreements and securities borrowed or interest expense – other, respectively. Fees received and paid are reported as fee and commission revenuesand expenses in the Consolidated Statement of Income, respectively.
Securities borrowed are not recognized on the Consolidated Statement of Financial Position, unless they are then sold to third parties, in which casethe obligation to return the securities is recorded as a trading liability and measured at fair value with any gains or losses included in non-interestincome – trading revenues, in the Consolidated Statement of Income.
Derivative instrumentsDerivative instruments are contracts whose value is derived from interest rates, foreign exchange rates, commodities, equity prices or other financialvariables. Most derivative instruments can be characterized as interest rate contracts, foreign exchange and gold contracts, commodity contracts,equity contracts or credit contracts. Derivative instruments are either exchange-traded contracts or negotiated over-the-counter contracts. Negotiatedover-the-counter contracts include swaps, forwards and options.
The Bank enters into these derivative contracts for trading purposes, as well as to manage its risk exposures (i.e., to manage the Bank’s non-tradinginterest rate, foreign currency and other exposures). Trading activities are undertaken to meet the needs of the Bank’s customers, as well as for theBank’s own account to generate income from trading operations.
Derivatives embedded in other financial instruments or host contracts are treated as separate derivatives when the following conditions are met:Š their economic characteristics and risks are not closely related to those of the host contract;Š a separate instrument with the same terms as the embedded derivative would meet the definition of a derivative; andŠ the combined contract is not held for trading or designated at fair value through profit or loss.
Where an embedded derivative is separable from the host contract but the fair value, as at the acquisition or reporting date, cannot be reliablymeasured separately, the entire combined contract is measured at fair value. All embedded derivatives are presented on a combined basis with thehost contracts although they are separated for measurement purposes when conditions requiring separation are met. Subsequent changes in fairvalue of embedded derivatives are recognized in non-interest income in the Consolidated Statement of Income.
138 | 2 0 1 7 S C O T I A B A N K A N N U A L R E P O R T
CO
NSO
LIDA
TEDFIN
AN
CIA
LSTA
TEMEN
TS
All derivatives, including embedded derivatives that must be separately accounted for, are recorded at fair value in the Consolidated Statement ofFinancial Position. The determination of the fair value of derivatives includes consideration of credit risk, estimated funding costs and ongoing directcosts over the life of the instruments. Inception gains or losses on derivatives are only recognized where the valuation is dependent only on observablemarket data, otherwise, they are deferred and amortized over the life of the related contract, or until the valuation inputs become observable.
The gains and losses resulting from changes in fair values of trading derivatives are included in non-interest income – trading revenues in theConsolidated Statement of Income.
Changes in the fair value of non-trading derivatives that do not qualify for hedge accounting are recorded in the Consolidated Statement of Income innon-interest income – other. Where derivative instruments are used to manage the volatility of share-based payment expense, these derivatives arecarried at fair value with changes in the fair value in relation to units hedged included in non-interest expenses – salaries and employee benefits in theConsolidated Statement of Income.
Changes in the fair value of derivatives that qualify for hedge accounting are recorded as non-interest income – other in the Consolidated Statementof Income for fair value hedges and other comprehensive income in the Consolidated Statement of Comprehensive Income for cash flow hedges andnet investment hedges.
Investment securitiesInvestment securities are comprised of available-for-sale and held-to-maturity securities.
Available-for-sale investment securitiesAvailable-for-sale investment securities include equity and debt securities. Equity investments classified as available-for-sale are those which are neitherclassified as held-for-trading nor designated at fair value through profit or loss. Debt securities in this category are those which are intended to be heldfor an indefinite period of time and which may be sold in response to needs for liquidity or in response to changes in the market conditions.Available-for-sale investment securities are recorded at fair value with unrealized gains and losses recorded in other comprehensive income. Whenrealized, these gains and losses are reclassified from the Consolidated Statement of Comprehensive Income and recorded in the ConsolidatedStatement of Income on an average cost basis. For non-monetary investment securities designated as available-for-sale, the gain or loss recognized inother comprehensive income includes any related foreign exchange gains or losses. Foreign exchange gains and losses that relate to the amortizedcost of an available-for-sale debt security are recognized in the Consolidated Statement of Income.
Premiums, discounts and related transaction costs on available-for-sale debt securities are amortized over the expected life of the instrument tointerest income – securities in the Consolidated Statement of Income using the effective interest method.
Transaction costs on available-for-sale equity securities are initially capitalized and then recognized as part of the net realized gain/loss on subsequentsale of the instrument in the Consolidated Statement of Income.
Held-to-maturity investment securitiesHeld-to-maturity investment securities are non-derivative assets with fixed or determinable payments and fixed maturity that the Bank has the positiveintent and ability to hold to maturity, and which do not meet the definition of a loan, are not held-for-trading, and are not designated at fair valuethrough profit or loss or as available-for-sale. After initial measurement, held-to-maturity investment securities are carried at amortized cost using theeffective interest method, less impairment. Amortized cost is calculated by taking into account any discount or premium on acquisition, transactioncosts and fees that are an integral part of the effective interest rate. The amortization is included in interest income – securities in the ConsolidatedStatement of Income.
A sale or reclassification of a more than an insignificant amount of held-to-maturity investments would result in the reclassification of allheld-to-maturity investments as available-for-sale, and would prevent the Bank from classifying investment securities as held-to-maturity for thecurrent and the following two financial years. However, sales and reclassifications in any of the following circumstances would not trigger areclassification:Š Sales or reclassifications that are so close to maturity that changes in the market rate of interest would not have a significant effect on the financial
asset’s fair value;Š Sales or reclassifications after the Bank has collected substantially all of the asset’s original principal; orŠ Sales or reclassifications attributable to non-recurring isolated events beyond the Bank’s control that could not have been reasonably anticipated.
Impairment of investment securitiesInvestment securities are evaluated for impairment at the end of each reporting period, or more frequently if events or changes in circumstancesindicate the existence of objective evidence of impairment.
In the case of equity instruments classified as available-for-sale, a significant or prolonged decline in the fair value of the security below its original costis objective evidence of impairment. In the case of debt instruments classified as available-for-sale and held-to-maturity investment securities,impairment is assessed based on the same criteria as impairment of loans.
When a decline in value of available-for-sale debt or equity instrument is due to impairment, the carrying value of the security continues to reflect fairvalue. Losses arising from impairment are reclassified from accumulated other comprehensive income and included in net gain on investmentsecurities within non-interest income in the Consolidated Statement of Income.
The losses arising from impairment of held-to-maturity investment securities are recognized in net gain on investment securities within non-interestincome in the Consolidated Statement of Income.
Reversals of impairment losses on available-for-sale debt instruments resulting from increases in fair value related to events occurring after the date ofimpairment are included in net gain on investment securities within non-interest income in the Consolidated Statement of Income, to a maximum ofthe original impairment charge. Reversals of impairment on available-for-sale equity instruments are not recognized in the Consolidated Statement ofIncome; increases in fair value of such instruments after impairment are recognized in accumulated other comprehensive income.
2 0 1 7 S C O T I A B A N K A N N U A L R E P O R T | 139

CONSOLIDATED FINANCIAL STATEMENTS
Reversals of impairment losses on held-to-maturity investment securities are included in net gain on investment securities within non-interest incomein the Consolidated Statement of Income, to a maximum of the amortized cost of the investment before the original impairment charge.
LoansLoans include loans and advances originated or purchased by the Bank which are not classified as held-for-trading, held-to-maturity or designated atfair value. Debt securities, which are not trading securities or have not been designated as available-for-sale securities and that are not quoted in anactive market, are also classified as loans.
Loans originated by the Bank are recognized when cash is advanced to a borrower. Loans purchased are recognized when cash consideration is paidby the Bank. Loans are measured at amortized cost using the effective interest method, less any impairment losses. Loans are stated net of allowancefor credit losses.
Purchased loansAll purchased loans are initially measured at fair value on the date of acquisition. In arriving at the fair value, the Bank considers interest rate markadjustments and credit mark adjustments. As a result of recording all purchased loans at fair value, no allowances for credit losses are recorded in theConsolidated Statement of Financial Position on the date of acquisition. Consequently none of the purchased loans are considered to be impaired onthe date of acquisition.
The interest rate mark on the date of acquisition is principally set up for fixed interest rate loans and captures the impact of the interest ratedifferential between the contractual rate of interest on the loan and the prevailing interest rate on the loan on the date of acquisition for theremaining term. The interest rate mark is fully amortized into interest income in the Consolidated Statement of Income over the expected life of theloan using the effective interest method.
An aggregate credit mark adjustment is established to capture management’s best estimate of cash flow shortfalls on the loans over their life time asdetermined at the date of acquisition. The credit mark adjustment comprises of both an incurred loss mark and a future expected loss mark.
For individually assessed loans, the credit mark established at the date of acquisition is tracked over the life of the loan. Changes to the expected cashflows of these loans from those expected at the date of acquisition are recorded as a charge/recovery in the provision for credit losses in theConsolidated Statement of Income.
Where loans are not individually assessed for determining losses, a portfolio approach is taken to determine expected losses at the date of acquisition.The portfolio approach will result in both an incurred loss mark and a future expected loss mark. The incurred loss mark is assessed at the end of eachreporting period against the performance of the loan portfolio and an increase in expected cash flows will result in recovery in provision for creditlosses in the Consolidated Statement of Income while any cash flows lower than expected will result in an additional provision for credit losses. Thefuture expected loss mark is amortized into income as losses are recognized or as the portfolio of loans winds down over its expected life. Anassessment is required at the end of each reporting period to determine the reasonableness of the unamortized balance in relation to the loanportfolio. An overall benefit is only recognized to the extent that the amortized amount is greater than the actual losses incurred. A net charge isrecorded if the actual losses exceed the amortized amounts.
Loan impairment and allowance for credit lossesThe Bank considers a loan to be impaired when there is objective evidence of impairment as a result of one or more loss events that occurred after thedate of initial recognition of the loan and the loss event has an impact on the estimated future cash flows of the loan that can be reliably estimated.Objective evidence is represented by observable data that comes to the attention of the Bank and includes events that indicate:Š significant financial difficulty of the borrower;Š a default or delinquency in interest or principal payments;Š a high probability of the borrower entering a phase of bankruptcy or a financial reorganization;Š a measurable decrease in the estimated future cash flows from the loan or the underlying assets that back the loan.
If a payment on a loan is contractually 90 days in arrears, the loan will be classified as impaired, if not already classified as such, unless the loan is fullysecured, the collection of the debt is in process, and the collection efforts are reasonably expected to result in repayment of the loan or in restoring itto a current status within 180 days from the date a payment has become contractually in arrears. Finally, a loan that is contractually 180 days inarrears is classified as impaired in all situations, except when it is guaranteed or insured by the Canadian government, the provinces or a Canadiangovernment agency; such loans are classified as impaired if the loan is contractually in arrears for 365 days. Any credit card loan that has a paymentthat is contractually 180 days in arrears is written off.
Losses expected as a result of future events are not recognized.
The Bank considers evidence of impairment for loans and advances at both an individual and collective level.
Individual impairment allowanceFor all loans that are considered individually significant, the Bank assesses on a case-by-case basis at each reporting period whether an individualallowance for loan losses is required.
For those loans where objective evidence of impairment exists and the Bank has determined the loan to be impaired, impairment losses aredetermined based on the Bank’s aggregate exposure to the customer considering the following factors:Š the customer’s ability to generate sufficient cash flow to service debt obligations;Š the extent of other creditors’ commitments ranking ahead of, or pari passu with, the Bank and the likelihood of other creditors continuing to
support the company;Š the complexity of determining the aggregate amount and ranking of all creditor claims and the extent to which legal and insurance uncertainties
are evident; andŠ the realizable value of security (or other credit mitigants) and likelihood of successful repossession.
140 | 2 0 1 7 S C O T I A B A N K A N N U A L R E P O R T

CO
NSO
LIDA
TEDFIN
AN
CIA
LSTA
TEMEN
TS
Impairment losses are calculated by discounting the expected future cash flows of a loan at its original effective interest rate, and comparing theresultant present value with the loan’s current carrying amount. This results in interest income being recognized using the original effective interestrate.
Collective impairment allowanceFor loans that have not been individually assessed as being impaired, the Bank pools them into groups to assess them on a collective basis. Collectiveallowances are calculated for impaired loans and performing loans. Allowances related to performing loans estimate probable incurred losses that areinherent in the portfolio but have not yet been specifically identified as impaired.
Internal risk rating parameters are used in the calculation of the collective impairment allowance. For non-retail loan portfolios, internal risk ratingparameters form the basis for calculating the quantitative portion of the collective allowance for performing loans:Š Probability of Default rates (PD) which are based upon the internal risk rating for each borrower;Š Loss Given Default rates (LGD); andŠ Exposure at Default factors (EAD).
Funded exposures are multiplied by the borrower’s PD and by the relevant LGD parameter.
Committed but undrawn exposures are multiplied by the borrower’s PD, by the relevant LGD parameter, and by the relevant EAD parameter. A modelstress component is also applied to recognize uncertainty in the credit risk parameters and the fact that current actual loss rates may differ from thelong-term averages included in the model.
Retail loansRetail loans represented by residential mortgages, credit cards and other personal loans are considered by the Bank to be homogeneous groups ofloans that are not considered individually significant. All homogeneous groups of loans are assessed for impairment on a collective basis.
Mortgages are collectively assessed for impairment, taking into account number of days past due, historical loss experience and incorporating bothquantitative and qualitative factors including the current business and economic environment and the realizable value of collateral to determine theappropriate level of the collective impairment allowance.
A roll rate methodology is used to determine impairment losses on a collective basis for credit cards and other personal loans because individual loanassessment is impracticable. Under this methodology, loans with similar credit characteristics are grouped into ranges according to the number of dayspast due and statistical analysis is used to estimate the likelihood that loans in each range will progress through the various stages of delinquency andultimately prove irrecoverable. This methodology employs statistical analyses of historical data and experience of delinquency and default to estimatethe amount of loans that will eventually be written off as a result of the events not identifiable on an individual loan basis. When the portfolio size issmall or when information is insufficient or not reliable enough to adopt a roll rate methodology, the Bank adopts a basic formulaic approach basedon historical loss rate experience.
Performing loansOver and above the individually assessed and retail roll rate allowances, loans that were subject to individual assessment for which no evidence ofimpairment existed, are grouped together according to their credit risk characteristics for the purpose of reassessing them on a collective basis. Thisreflects impairment losses that the Bank has incurred as a result of events that have occurred but where the individual loss has not been identified.
The collective impairment allowance for such loans is determined after taking into account:Š historical loss experience in portfolios of similar credit risk characteristics (for example, by industry sector, loan grade or product);Š the estimated period between impairment occurring and the loss being identified and evidenced by the establishment of an appropriate allowance
against the individual loan; andŠ management’s experienced judgment as to whether current economic and credit conditions are such that the actual level of inherent losses at the
reporting date is likely to be greater or less than that suggested by historical experience. As soon as information becomes available which identifieslosses on individual loans within the group, those loans are removed from the group and assessed on an individual basis for impairment.
Provision for credit losses on off-balance sheet positionsA provision is set up for the Bank’s off-balance sheet positions and recorded in other liabilities on the Consolidated Statement of Financial Position.The process to determine the provision for off-balance sheet positions is similar to the methodology used for loans. Any change in the provision isrecorded in the Consolidated Statement of Income as provision for credit losses.
Write-off of loansLoans (and the related impairment allowance accounts) are normally written off, either partially or in full, when there is no realistic prospect ofrecovery. Where loans are secured, write-off is generally after receipt of any proceeds from the realization of security. In circumstances where the netrealizable value of any collateral has been determined and there is no reasonable expectation of further recovery, write-off may be earlier.
Reversals of impairmentIf the amount of an impairment loss related to loans decreases in a subsequent period, and the decrease can be related objectively to an eventoccurring after the impairment was recognized, the excess is written back by reducing the loan impairment allowance account accordingly. The write-back is recognized in the provision for credit losses in the Consolidated Statement of Income.
Restructured loansRestructured loans include loans where the Bank has renegotiated the original terms of a loan by granting a concession to the borrower (concessions).These concessions include interest rate adjustments, deferral or extension of principal or interest payments and forgiveness of a portion of principal orinterest. Once the terms of the loan have been renegotiated and agreed upon with the borrower the loan is considered a restructured loan. Theinvestment in the loan is reduced as of the date of the restructuring to the amount of the net expected cash flows receivable under the modified
2 0 1 7 S C O T I A B A N K A N N U A L R E P O R T | 141

CONSOLIDATED FINANCIAL STATEMENTS
terms, discounted at the original effective interest rate inherent in the loan. The loan is no longer considered past due and the reduction in thecarrying value of the loan is recognized as a charge for loan impairment in the Consolidated Statement of Income in the period in which the loanis restructured. In other cases, restructuring may be considered substantial enough to result in recognition of a new loan.
Customer’s liability under acceptancesThe Bank’s potential liability under acceptances is reported as a liability in the Consolidated Statement of Financial Position. The Bank has equivalentclaims against its customers in the event of a call on these commitments, which are reported as an asset. Fees earned are reported in fee andcommission revenues – banking fees in the Consolidated Statement of Income.
Hedge accountingThe Bank formally documents all hedging relationships and its risk management objective and strategy for undertaking these hedge transactions atinception. The hedge documentation includes identification of the asset, liability, firm commitment or highly probable forecasted transaction beinghedged, the nature of the risk being hedged, the hedging instrument used and the method used to assess the effectiveness of the hedge. The Bankalso formally assesses, both at each hedge’s inception and on an ongoing basis, whether the hedging instruments are highly effective in offsettingchanges in fair value or cash flows of hedged items. Hedge ineffectiveness is measured and recorded in non-interest income – other in theConsolidated Statement of Income.
There are three types of hedges: (i) fair value hedges, (ii) cash flow hedges and (iii) net investment hedges.
Fair value hedgesFor fair value hedges, the change in fair value of the hedging instrument is offset in the Consolidated Statement of Income by the change in fair valueof the hedged item attributable to the hedged risk. The Bank utilizes fair value hedges primarily to convert fixed rate financial instruments to floatingrate financial instruments. Hedged items include available-for-sale debt and equity securities, loans, deposit liabilities and subordinated debentures.Hedging instruments include single-currency interest rate swaps, cross-currency interest rate swaps, foreign currency forwards and foreign currencyliabilities.
Cash flow hedgesFor cash flow hedges, the change in fair value of the hedging instrument, to the extent effective, is recorded in other comprehensive income until thecorresponding gains and losses on the hedged item is recognized in income. The Bank utilizes cash flow hedges primarily to hedge the variability incash flows relating to floating rate financial instruments and highly probable forecasted revenues. Hedged items include available-for-sale debtsecurities, loans, deposit liabilities and highly probable forecasted transactions. Hedging instruments include single-currency interest rate swaps, cross-currency interest rate swaps, total return swaps and foreign currency forwards.
Net investment hedgesFor net investment hedges, the change in fair value of the hedging instrument, to the extent effective, is recorded in other comprehensive incomeuntil the corresponding cumulative translation adjustments on the hedged net investment are recognized in income. The Bank designates foreigncurrency liabilities and foreign currency forwards as hedging instruments to manage the foreign currency exposure and impact on capital ratios arisingfrom foreign operations.
Property and equipment
Land, buildings and equipmentLand is carried at cost. Buildings (including building fittings), equipment, and leasehold improvements are carried at cost less accumulated depreciationand accumulated impairment losses, if any. Cost includes expenditures that are directly attributable to the acquisition of the asset. Depreciation iscalculated using the straight-line method over the estimated useful life of the related asset less any residual value as follows: buildings – 40 years,building fittings – 15 years, equipment 3 to 10 years, and leasehold improvements – lease term determined by the Bank. Depreciation expense isincluded in the Consolidated Statement of Income under non-interest expenses – depreciation and amortization. Depreciation methods, useful livesand residual values are reassessed at each financial year-end and adjusted as appropriate.
When major components of building and equipment have different useful lives, they are accounted for separately and depreciated over eachcomponent’s estimated useful life.
Net gains and losses on disposal are included in non-interest income – other in the Consolidated Statement of Income in the year of disposal.
Investment propertyInvestment property is property held either for rental income or for capital appreciation or for both. The Bank holds certain investment propertieswhich are presented in property and equipment on the Consolidated Statement of Financial Position.
Investment property is carried at cost less accumulated depreciation and any accumulated impairment losses. Depreciation is calculated using thestraight-line method over the estimated useful life of 40 years. Depreciation methods, useful lives and residual values are reassessed at each financialyear-end and adjusted as appropriate.
Assets held-for-saleNon-current non-financial assets (and disposal groups) are classified as held-for-sale if their carrying amount will be recovered principally through asale transaction rather than through continuing use. These assets meet the criteria for classification as held-for-sale if they are available for immediatesale in their present condition and their sale is considered highly probable to occur within one year.
Non-current non-financial assets classified as held-for-sale are measured at the lower of their carrying amount and fair value (less costs to sell) and arepresented within other assets in the Consolidated Statement of Financial Position. Any subsequent write-down to fair value less costs to sell isrecognized in the Consolidated Statement of Income, in non-interest income. Any subsequent increase in the fair value less costs to sell, to the extentthis does not exceed the cumulative write-down, is also recognized in non-interest income, together with any realized gains or losses on disposal.
142 | 2 0 1 7 S C O T I A B A N K A N N U A L R E P O R T

CO
NSO
LIDA
TEDFIN
AN
CIA
LSTA
TEMEN
TS
Non-financial assets acquired in exchange for loans as part of an orderly realization are recorded as assets held-for-sale or assets held-for-use. If theacquired asset does not meet the requirement to be considered held-for-sale, the asset is considered held-for-use, measured initially at cost whichequals the carrying value of the loan and accounted for in the same manner as a similar asset acquired in the normal course of business.
Business combinations and goodwillThe Bank follows the acquisition method of accounting for the acquisition of subsidiaries. The Bank considers the date on which control is obtainedand it legally transfers the consideration for the acquired assets and assumed liabilities of the subsidiary to be the date of acquisition. The cost of anacquisition is measured at the fair value of the consideration paid. The fair value of the consideration transferred by the Bank in a businesscombination is calculated as the sum of the acquisition date fair value of the assets transferred by the Bank, the liabilities incurred by the Bank toformer owners of the acquiree, and the equity interests, including any options, issued by the Bank. The Bank recognizes the acquisition date fairvalues of any previously held investment in the subsidiary and contingent consideration as part of the consideration transferred in exchange for theacquisition. A gain or loss on any previously held investments of an acquiree is recognized in non-interest income – other in the ConsolidatedStatement of Income.
In general, all identifiable assets acquired (including intangible assets) and liabilities assumed (including any contingent liabilities) are measured at theacquisition date fair value. The Bank records identifiable intangible assets irrespective of whether the assets have been recognized by the acquireebefore the business combination. Non-controlling interests, if any, are recognized at their proportionate share of the fair value of identifiable assetsand liabilities, unless otherwise indicated. Where the Bank has an obligation to purchase a non-controlling interest for cash or another financial asset,a portion of the non-controlling interest is recognized as a financial liability based on management’s best estimate of the present value of theredemption amount. Where the Bank has a corresponding option to settle the purchase of a non-controlling interest by issuing its own commonshares, no financial liability is recorded.
Any excess of the cost of acquisition over the Bank’s share of the net fair value of the identifiable assets acquired and liabilities assumed is recorded asgoodwill. If the cost of acquisition is less than the fair value of the Bank’s share of the identifiable assets acquired and liabilities assumed, the resultinggain is recognized immediately in non-interest income – other in the Consolidated Statement of Income.
During the measurement period (which is within one year from the acquisition date), the Bank may, on a retrospective basis, adjust the amountsrecognized at the acquisition date to reflect new information obtained about facts and circumstances that existed as of the acquisition date.
The Bank accounts for acquisition-related costs as expenses in the periods in which the costs are incurred and the services are received.
Subsequent to acquisition, the Bank accounts for the following assets and liabilities recognized in a business combination as described below:Š Contingent liabilities, until resolved, are measured at the higher of the amount that would be recognized as a provision or the amount initially
recognized, with any change recognized in the Consolidated Statement of Income.Š Indemnification assets are measured on the same basis as the item to which the indemnification relates.Š Contingent consideration classified as a liability is measured at fair value, with any change recognized in the Consolidated Statement of Income.Š Liabilities to non-controlling interest holders when remeasured at the end of each reporting period, a corresponding change is recorded in equity.
After initial recognition of goodwill in a business combination, goodwill in aggregate is measured at cost less any accumulated impairment losses.Goodwill is not amortized but tested for impairment annually and when circumstances indicate that the carrying value may be impaired.
Goodwill is reviewed at each reporting date to determine whether there is any indication of impairment. For the purpose of impairment testing,goodwill acquired in a business combination is, on the acquisition date, allocated to each of the Bank’s group of cash-generating units (CGUs) that isexpected to benefit from the combination. CGUs to which goodwill has been allocated are aggregated so that the level at which impairment is testedreflects the lowest level at which goodwill is monitored for internal management purposes. Goodwill impairment, at a standalone subsidiary level, maynot in itself result in an impairment at the consolidated Bank level.
The Bank determines the carrying value of the CGU using a regulatory capital approach based on credit, market, and operational risks, and leverage,consistent with the Bank’s capital attribution for business line performance measurement. The recoverable amount is the greater of fair value lesscosts of disposal and value in use. If either fair value less costs of disposal or value in use exceeds the carrying amount, there is no need to determinethe other. The recoverable amount of the CGU has been determined using the fair value less costs of disposal method. The estimation of fair valueless costs of disposal involves significant judgment in the determination of inputs. In determining fair value less costs of disposal, an appropriatevaluation model is used which considers various factors including normalized net income, control premiums and price earnings multiples. Thesecalculations are corroborated by valuation multiples, quoted share prices for publicly traded subsidiaries or other available fair value indicators. Animpairment loss is recognized if the carrying amount of the CGU exceeds the recoverable amount. An impairment loss, in respect of goodwill, is notreversed.
Intangible assetsIntangible assets represent identifiable non-monetary assets and are acquired either separately or through a business combination or generatedinternally. The Bank’s intangible assets are mainly comprised of computer software, customer relationships, contract intangibles, core depositintangibles and fund management contracts.
The cost of a separately acquired intangible asset includes its purchase price and directly attributable costs of preparing the asset for its intended use.Intangibles acquired as part of a business combination are initially recognized at fair value.
In respect of internally generated intangible assets, cost includes all directly attributable costs necessary to create, produce, and prepare the asset tobe capable of operating in the manner intended by management.
After initial recognition, an intangible asset is carried at its cost less any accumulated amortization and accumulated impairment losses.
Intangible assets that have finite useful lives are initially measured at cost and are amortized on a straight-line basis over their useful lives as follows:computer software – 5 to 10 years; and other intangible assets – 5 to 20 years. Amortization expense is included in the Consolidated Statement of
2 0 1 7 S C O T I A B A N K A N N U A L R E P O R T | 143

CONSOLIDATED FINANCIAL STATEMENTS
Income under operating expenses – depreciation and amortization. As intangible assets are considered to be non-financial assets, the impairmentmodel for non-financial assets is applied. Intangible assets with indefinite useful lives are not amortized but are tested for impairment annually andwhen circumstances indicate that the carrying value may be impaired.
Impairment of non-financial assetsThe carrying amount of the Bank’s non-financial assets, other than goodwill and indefinite life intangible assets and deferred tax assets which areseparately addressed, is reviewed at each reporting date to determine whether there is any indication of impairment. For the purpose of impairmenttesting, non-financial assets that cannot be tested individually are grouped together into the smallest group of assets that generate cash inflows fromcontinuing use that are largely independent from the cash inflows of other assets or groups of assets.
If any indication of impairment exists then the asset’s recoverable amount is estimated. The recoverable amount of an asset or CGU is the greater ofits value in use and its fair value less costs of disposal. The Bank’s corporate assets do not generate separate cash inflows. If there is an indication thata corporate asset may be impaired, then the recoverable amount is determined for the CGU to which the corporate asset belongs.
An impairment loss is recognized if the carrying amount of an asset or a CGU exceeds its recoverable amount. Impairment losses of continuingoperations are recognized in the Consolidated Statement of Income in those expense categories consistent with the nature of the impaired asset.Impairment losses recognized in prior periods are reassessed at each reporting date for any indication that the loss had decreased or no longer exists.An impairment loss is reversed if there has been a change in the estimates used to determine the recoverable amount. An impairment loss is reversedonly to the extent that the asset’s carrying amount does not exceed the carrying amount that would have been determined, net of depreciation oramortization, if no impairment loss had been recognized. Such reversal is recognized in the Consolidated Statement of Income.
Significant judgment is applied in determining the non-financial asset’s recoverable amount and assessing whether certain events or circumstancesconstitute objective evidence of impairment.
Corporate income taxesThe Bank follows the balance sheet liability method for corporate income taxes. Under this method, deferred tax assets and liabilities represent thecumulative amount of tax applicable to temporary differences which are the differences between the carrying amount of the assets and liabilities, andtheir values for tax purposes. Deferred tax assets are recognized only to the extent it is probable that sufficient taxable profits will be available againstwhich the benefit of these deferred tax assets can be utilized.
Deferred tax assets and liabilities are measured using enacted or substantively enacted tax rates expected to apply to taxable income in the years inwhich those temporary differences are expected to be recovered or settled.
Deferred and current tax assets and liabilities are only offset when they arise in the same tax reporting group and where the Bank has both the legalright and the intention to settle on a net basis or to realize the asset and settle the liability simultaneously.
The Bank maintains provisions for uncertain tax positions that it believes appropriately reflect the risk of tax positions under discussion, audit, dispute,or appeal with tax authorities, or which are otherwise considered to involve uncertainty. These provisions are made using the Bank’s best estimate ofthe amount expected to be paid based on an assessment of all relevant factors, which are reviewed at the end of each reporting period.
Income tax is recognized in the Consolidated Statement of Income except where it relates to items recognized in other comprehensive income ordirectly in equity, in which case income tax is recognized in the same line as the related item.
Leases
Bank as a lessorAssets leased to customers under agreements which transfer substantially all the risks and rewards of ownership, with or without ultimate legal title,are classified as finance leases and presented within loans in the Consolidated Statement of Financial Position. When assets held are subject to afinance lease, the leased assets are derecognized and a receivable is recognized which is equal to the present value of the minimum lease payments,discounted at the interest rate implicit in the lease. Initial direct costs incurred in negotiating and arranging a finance lease are incorporated into thereceivable through the discount rate applied to the lease. Finance lease income is recognized over the lease term based on a pattern reflecting aconstant periodic rate of return on the net investment in the finance lease. Finance lease income is included in the Consolidated Statement of Incomeunder interest income from loans.
Assets leased to customers under agreements which do not transfer substantially all the risks and rewards of ownership are classified as operatingleases. The leased assets are included within property and equipment on the Bank’s Consolidated Statement of Financial Position. Rental income isrecognized on a straight-line basis over the period of the lease in non-interest income – other in the Consolidated Statement of Income. Initial directcosts incurred in negotiating and arranging an operating lease are added to the carrying amount of the leased asset and recognized as an expense ona straight-line basis over the lease term.
Bank as a lesseeAssets held under finance leases are initially recognized as property and equipment in the Consolidated Statement of Financial Position at an amountequal to the fair value of the leased asset or, if lower, the present value of the minimum lease payments. The corresponding finance lease obligation isincluded in other liabilities in the Consolidated Statement of Financial Position. The discount rate used in calculating the present value of the minimumlease payments is the interest rate implicit in the lease. Contingent rentals are recognized as expense in the periods in which they are incurred.
Operating lease rentals payable are recognized as an expense on a straight-line basis over the lease term, which commences when the lessee controlsthe physical use of the asset. Lease incentives are treated as a reduction of rental expense and are also recognized over the lease term on a straight-line basis. Contingent rentals arising under operating leases are recognized as an expense in the period in which they are incurred.
144 | 2 0 1 7 S C O T I A B A N K A N N U A L R E P O R T

CO
NSO
LIDA
TEDFIN
AN
CIA
LSTA
TEMEN
TS
Sale and lease-backWhere the Bank enters into a sale leaseback transaction for a non-financial asset at fair market value that results in the Bank retaining an operatinglease (where the buyer/lessor retains substantially all risks and rewards of ownership), any gains and losses are recognized immediately in net income.Where the sale leaseback transaction results in a finance lease, any gain on sale is deferred and recognized in net income over the remaining term ofthe lease.
Leasehold improvementsLeasehold improvements are investments made to customize buildings and offices occupied under operating lease contracts to make them suitable fortheir intended purpose. The present value of estimated reinstatement costs to bring a leased property into its original condition at the end of thelease, if required, is capitalized as part of the total leasehold improvements costs. At the same time, a corresponding liability is recognized to reflectthe obligation incurred. Reinstatement costs are recognized in net income through depreciation of the capitalized leasehold improvements over theirestimated useful life.
ProvisionsA provision, including for restructuring, is recognized if, as a result of a past event, the Bank has a present legal or constructive obligation that can beestimated reliably, and it is probable that an outflow of economic benefits will be required to settle the obligation.
The amount recognized as a provision is the Bank’s best estimate of the consideration required to settle the present obligation, taking into accountthe risks and uncertainties surrounding the obligation. If the effect of the time value of money is considered material, provisions are determined bydiscounting the expected future cash flows at a pre-tax rate that reflects current market assessments of the time value of money and, whereappropriate, the risks specific to the liability. The increase in the provision due to the passage of time is recorded as interest expense – other in theConsolidated Statement of Income.
Insurance contractsGross premiums for life insurance contracts are recognized as income when due. Gross premiums for non-life insurance business primarily propertyand casualty are recognized as income over the term of the insurance contracts. Unearned premiums represent the portion of premiums written in thecurrent year that relate to the period of risk after the reporting date. Insurance claims recoveries are accounted as income in the same period as therelated claims.
Gross insurance claims for life insurance contracts reflect the cost of all claims arising during the year. Gross insurance claims for property and casualtyinsurance contracts include paid claims and movements in outstanding claim liabilities. Insurance premiums ceded to reinsurers are accounted as anexpense in the same period as the premiums for the direct insurance contracts to which they relate.
GuaranteesA guarantee is a contract that contingently requires the Bank to make specified payments to reimburse the holder for a loss it incurs because aspecified debtor failed to make payment when due in accordance with the original or modified terms of a debt instrument. Guarantees includestandby letters of credit, letters of guarantee, indemnifications, credit enhancements and other similar contracts. Guarantees that qualify as aderivative are accounted for in accordance with the policy for derivative instruments. For guarantees that do not qualify as a derivative, a liability isrecorded for the fair value of the obligation assumed at inception. The fair value of the obligation at inception is generally based on the discountedcash flow of the premium to be received for the guarantee, resulting in a corresponding asset. Subsequent to initial recognition, such guarantees aremeasured at the higher of the initial amount, less amortization to recognize any fee income earned over the period, and the best estimate of theamount required to settle any financial obligation arising as a result of the guarantee. Any increase in the liability is reported in the ConsolidatedStatement of Income.
Employee benefitsThe Bank provides pension and other benefit plans for eligible employees in Canada and internationally. Pension benefits are offered in the form ofdefined benefit pension plans (generally based on an employee’s length of service and the final five years’ average salary), and in the form of definedcontribution pension plans (where the Bank’s contribution is fixed and there is no legal or constructive obligation to pay further amounts). Otherbenefits provided include post-retirement health care, dental care and life insurance, along with other long-term employee benefits such as long-termdisability benefits.
Defined benefit pension plans and other post-retirement benefit plansThe cost of these employee benefits is actuarially determined each year using the projected unit credit method. The calculation uses management’sbest estimate of a number of assumptions – including the discount rate, future compensation, health care costs, mortality, as well as the retirementage of employees. The discount rate used to determine the defined benefit obligation is set by reference to the yields on high quality corporate bondsthat have durations that match the terms of the Bank’s obligations. Prior to 2016, the discount rate used to determine the annual benefit expense wasthe same as the rate used to determine the define benefit obligation at the beginning of the period. Beginning in 2016, separate discount rates areused to determine the annual benefit expense in Canada and the US. These rates are determined with reference to the yields on high qualitycorporate bonds with durations that match the various components of the annual benefit expense. The discount rate used to determine the annualbenefit expense for all other plans continues to be same as the rate used to determine the defined benefit obligation at the beginning of the period.
The Bank’s net asset or liability in respect of employee benefit plans is calculated separately for each plan as the difference between the present valueof future benefits earned in respect of service for prior periods and the fair value of plan assets. The net asset or liability is included in other assets andother liabilities, as appropriate, in the Consolidated Statement of Financial Position. When the net amount in the Consolidated Statement of FinancialPosition is an asset, the recognized asset is limited to the present value of any economic benefits available in the form of refunds from the plan orreductions in future contributions to the plan.
2 0 1 7 S C O T I A B A N K A N N U A L R E P O R T | 145

CONSOLIDATED FINANCIAL STATEMENTS
The current service cost, net interest expense (income), past service cost, and administrative expense are recognized in net income. Net interest incomeor expense is calculated by applying the discount rate at the beginning of the annual period to the net defined benefit asset or liability. When thebenefits of a plan are improved (reduced), a past service cost (credit) is recognized immediately in net income.
Remeasurements comprising of actuarial gains and losses, the effect of the asset ceiling and the change in the return on plan assets are recognizedimmediately in the Consolidated Statement of Financial Position with a charge or credit to the Statement of Comprehensive Income (OCI) in theperiod in which they occur. Amounts recorded in OCI are not recycled to the Consolidated Statement of Income.
Other long-term employee benefitsOther long-term employee benefits are accounted for similarly to defined benefit pension plans and other post-retirement benefit plans describedabove except that remeasurements are recognized in the Consolidated Statement of Income in the period in which they arise.
Defined contribution plansThe cost of such plans are equal to contributions payable by the Bank to employees’ accounts for service rendered during the period and expensed.
Short-term employee benefitsShort-term employee benefits are expensed as the related service is provided and a liability is measured on an undiscounted basis net of paymentsmade.
Recognition of income and expensesRevenue is recognized to the extent that it is probable that the economic benefits will flow to the Bank and the revenue can be reliably measured. Thefollowing specific criteria must also be met before revenue is recognized:
Interest and similar income and expensesFor all non-trading interest-bearing financial instruments, interest income or expense is recorded in net interest income using the effective interestrate. This is the rate that exactly discounts estimated future cash payments or receipts through the expected life of the financial instrument or ashorter period, where appropriate, to the net carrying amount of the financial asset or financial liability. The calculation takes into account all thecontractual terms of the financial instrument (for example, prepayment options) and includes any fees or incremental costs that are directlyattributable to the instrument and are an integral part of the effective interest rate, but not future credit losses.
For trading financial instruments, mark-to-market changes including related interest income or expense are recorded in trading revenues.
The carrying amount of interest-bearing financial instruments, measured at amortized cost or classified as available-for-sale, is adjusted if the Bankrevises its estimates of payments or receipts. The adjusted carrying amount is calculated based on the original effective interest rate and the change incarrying amount is recorded as non-interest income in the Consolidated Statement of Income.
Once the carrying value of a financial asset or a group of similar financial assets has been reduced due to an impairment loss, interest incomecontinues to be recognized based on net effective interest rate inherent in the investment.
Loan origination costs are deferred and amortized into interest income using the effective interest method over the expected term of the loan. Loanfees are recognized in interest income over the appropriate lending or commitment period. Mortgage prepayment fees are recognized in interestincome when received, unless they relate to a minor modification to the terms of the mortgage, in which case the fees are deferred and amortizedusing the effective interest method over the remaining period of the original mortgage.
Loan syndication fees are recognized when no other services are required of the Bank and the fees are non-refundable unless the yield we retain isless than that of comparable lenders in the syndicate. In such cases, an appropriate portion will be deferred and amortized in interest income over theterm of the loan.
Loan commitment fees for loans that are likely to be drawn down and other credit related fees are deferred (together with any incremental costs) andrecognized as part of the effective interest on the loan. When it is unlikely that a loan will be drawn down, the loan commitment fees are recognizedover the commitment period on a straight-line basis.
Fee and commission revenuesThe Bank earns fee and commission revenues from a diverse range of services it provides to its customers. Fee income can be divided into thefollowing two categories:
Fees earned for the provision of services over a period of time are accrued over that period the services are provided. These fees include commissionincome, investment management, custody and other management and advisory fees. Investment management fees and custodial fees are mainlycalculated as a percentage of daily or period-end market value of the assets under management (AUM) or assets under administration (AUA) and arereceived monthly, quarterly, semi-annually, or annually based on the underlying investment management contracts. Performance-based fees related toAUM are earned based on exceeding certain benchmarks or other performance targets, are recognized at the end of the performance period in whichthe target is met.
Fees arising from negotiating or participating in the negotiation of a transaction for a third-party, such as the arrangement of the acquisition of sharesor other securities or the purchase or sale of businesses, are recognized on completion of the underlying transaction. Fees or components of fees thatare linked to a certain performance are recognized after fulfilling the corresponding criteria.
Fee and commission expensesFee and commission expenses relate to transaction and service fees which are expensed as the services are received.
Dividend incomeDividend income on equity securities is recognized in interest income when the Bank’s right to receive payment is established.
146 | 2 0 1 7 S C O T I A B A N K A N N U A L R E P O R T

CO
NSO
LIDA
TEDFIN
AN
CIA
LSTA
TEMEN
TS
Share-based paymentsShare-based payments awarded to employees are recognized as compensation expense in the Consolidated Statement of Income over the vestingperiod based on the number of awards expected to vest including the impact of expected forfeitures. For awards that are delivered in tranches, eachtranche is considered a separate award and accounted for separately.
Stock appreciation rights and other awards that must be settled for cash are classified as liabilities. Liability-classified awards are re-measured to fairvalue at each reporting date while they remain outstanding, with any changes in fair value recognized in compensation expense in the period. Theliability is expensed over the vesting period which incorporates the re-measurement of the fair value and a revised forfeiture rate that anticipates unitsexpected to vest.
Employee stock options with tandem stock appreciation rights give the employee the right to exercise for shares or settle in cash. These options areclassified as liabilities and are re-measured to fair value at each reporting date while they remain outstanding. If an option is exercised, therebycancelling the tandem stock appreciation right, both the exercise price proceeds together with the accrued liability and associated taxes are credited toequity – common shares in the Consolidated Statement of Financial Position.
Plain vanilla options and other awards that must be settled for shares are classified as equity awards. Equity-classified awards are expensed based onthe grant date fair value with a corresponding increase to equity – other reserves in the Consolidated Statement of Financial Position. If an option isexercised, both the exercise price proceeds together with the amount recorded in other reserves is credited to equity – common shares in theConsolidated Statement of Financial Position.
For tandem stock appreciation rights, stock appreciation rights and plain vanilla options, the Bank estimates fair value using an option pricing model.The option pricing model requires inputs such as the exercise price of the option, the current share price, the risk free interest rate, expecteddividends, expected volatility (calculated using an equal weighting of implied and historical volatility) and specific employee exercise behaviourpatterns based on statistical data. For other awards, fair value is the quoted market price of the Bank’s common shares at the reporting date.
Where derivatives are used to economically hedge share-based payment expense, related mark-to-market gains and losses are included in non-interestexpenses – salaries and employee benefits in the Consolidated Statement of Income.
A voluntary renouncement of a tandem stock appreciation right where an employee retains the corresponding option for shares with no change inthe overall fair value of the award, results in a reclassification of the accrued liability and associated tax to equity – other reserves in the ConsolidatedStatement of Financial Position. This reclassification is measured at the fair value of the renounced awards as of the renouncement date. Subsequentto the voluntary renouncement, these awards are accounted for as plain vanilla options, based on the fair value as of the renouncement date.
Customer loyalty programsThe Bank operates loyalty points programs, which allow customers to accumulate points when they use the Bank’s products and services. The pointscan then be redeemed for free or discounted products or services, subject to certain conditions.
Consideration received is allocated between the products sold or services rendered and points issued, with the consideration allocated to points equalto their fair value. The fair value of points is generally based on equivalent retail prices for the mix of awards expected to be redeemed. The fair valueof the points issued is deferred in other liabilities and recognized as banking revenues when the points are redeemed or lapsed. Managementjudgment is involved in determining the redemption rate to be used in the estimate of points to be redeemed.
Dividends on sharesDividends on common and preferred shares and other equity instruments are recognized as a liability and deducted from equity when they aredeclared and no longer at the discretion of the Bank.
Segment reportingManagement’s internal view is the basis for the determination of operating segments. The operating segments are those whose operating results areregularly reviewed by the Bank’s chief operating decision-maker to make decisions about resources to be allocated to the segment and assess itsperformance. The Bank has three operating segments: Canadian Banking, International Banking, and Global Banking and Markets. The other categoryrepresents smaller operating segments, including Group Treasury and other corporate items, which are not allocated to an operating segment. Thesesegments offer different products and services and are managed separately based on the Bank’s management and internal reporting structure.
The results of these business segments are based upon the internal financial reporting systems of the Bank. The accounting policies used in thesesegments are generally consistent with those followed in the preparation of the consolidated financial statements by the Bank. The only notableaccounting measurement difference is the grossing up of revenues which are tax-exempt and income from associate corporations to an equivalentbefore-tax basis for those affected segments. This change in measurement enables comparison of income arising from taxable and tax-exemptsources.
Because of the complexity of the Bank, various estimates and allocation methodologies are used in the preparation of the business segment financialinformation. The funding value of assets and liabilities is transfer-priced at wholesale market rates, and corporate expenses are allocated to eachsegment on an equitable basis using various parameters. As well, capital is apportioned to the business segments on a risk-based methodology.Transactions between segments are recorded within segment results as if conducted with a third-party and are eliminated on consolidation.
Earnings per share (EPS)Basic EPS is computed by dividing net income for the period attributable to the Bank’s common shareholders by the weighted-average number ofcommon shares outstanding during the period.
Diluted EPS is calculated by dividing adjusted net income for the period attributable to common shareholders by the weighted-average number ofdiluted common shares outstanding for the period. In the calculation of diluted earnings per share, earnings are adjusted for changes in income orexpenses that would result from the issuance of dilutive shares. The weighted-average number of diluted common shares outstanding for the period
2 0 1 7 S C O T I A B A N K A N N U A L R E P O R T | 147

CONSOLIDATED FINANCIAL STATEMENTS
reflects the potential dilution that would occur if options, securities or other contracts that entitle their holders to obtain common shares had beenoutstanding from the beginning of the period (or a later date) to the end of the period (or an earlier date). Instruments determined to have anantidilutive impact for the period are excluded from the calculation of diluted EPS.
Earnings are adjusted by the after-tax amount of distributions related to dilutive capital instruments recognized in the period. For tandem stockappreciation rights that are carried as liabilities, the after-tax re-measurement included in salaries and employee benefits expense, net of relatedhedges, is adjusted to reflect the expense had these rights been equity-classified.
The number of additional shares for inclusion in diluted EPS for share-based payment options is determined using the treasury share method. Underthis method, the net number of incremental common shares is determined by assuming that in-the-money stock options are exercised and theproceeds are used to purchase common shares at the average market price during the period.
The number of additional shares associated with capital instruments that potentially result in the issuance of common shares is based on the terms ofthe contract. On occurrence of contingencies as specified in the Non-Viability Contingent Capital (NVCC) Instruments, the number of additionalcommon shares associated with the NVCC subordinated debentures, NVCC subordinated additional Tier 1 capital securities and NVCC preferredshares is based on an automatic conversion formula as set out in the respective prospectus supplements.
4 Future Accounting Developments
The Bank actively monitors developments and changes in accounting standards from the IASB, as well as requirements from the other regulatorybodies, including OSFI. The Bank is currently assessing the measurement impact the adoption of new standards issued by the IASB will have on itsconsolidated financial statements and also evaluating the alternative elections available on transition.
Effective November 1, 2017
Financial instrumentsOn July 24, 2014, the IASB issued IFRS 9 Financial Instruments, which will replace IAS 39. The standard covers three broad topics: Classification andMeasurement, Impairment and Hedging. IFRS 9 must be adopted retrospectively. Restatement of comparatives is not required, though it is permitted.
On January 9, 2015, the Office of the Superintendent of Financial Institutions (OSFI) issued an advisory on the early adoption of IFRS 9 for DomesticSystematically Important Banks (D-SIBs) for annual reporting periods beginning on November 1, 2017.
On June 21, 2016, OSFI issued revised accounting and disclosure guidelines for IFRS 9 Financial Instruments, that provide application guidance forfederally regulated entities. The guidelines are effective for the Bank with the adoption of IFRS 9 on November 1, 2017 and are consistent with BaselCommittee on Banking Supervision (BCBS) Guidance on credit risk and accounting for expected credit losses issued in December 2015.
On October 11, 2016, BCBS published a consultative document: Regulatory treatment of accounting provisions – interim approach and transitionalarrangements and a discussion document: Regulatory treatment of accounting provisions on the policy considerations related to the regulatorytreatment of accounting provisions under the Basel III capital framework. BCBS is seeking comments on these documents by January 13, 2017.
Classification and measurementThe standard requires the Bank to consider two criteria when determining the measurement basis for debt instruments (e.g. securities) held asfinancial assets; i) its business model for managing those financial assets and ii) the cash flow characteristics of the assets. Based on these criteria, debtinstruments are measured at amortized cost, fair value through OCI, or fair value through profit or loss.
Equity instruments are measured at fair value through profit or loss. However, the Bank may, at initial recognition of a non-trading equity instrument,irrevocably elect to designate the instrument as fair value through OCI, with no subsequent recycling to profit and loss, while recognizing dividendincome in profit and loss. This designation is also available to non-trading equity instrument holdings on date of transition.
In addition, the Bank may, at initial recognition, irrevocably elect to designate a financial asset as fair value through profit or loss, if doing soeliminates or significantly reduces an accounting mismatch which would otherwise arise. This designation is also available to existing financial assetson date of transition.
On transition date, the Bank is permitted to make a one-time irrevocable reassessment to fair value through profit and loss its financial assets andliabilities.
HedgingIFRS 9 also incorporates new hedge accounting rules that intend to align hedge accounting with risk management practices. IFRS 9 includes anaccounting policy choice to defer the adoption of IFRS 9 hedge accounting and to continue with IAS 39 hedge accounting. The Bank has decided toexercise this accounting policy choice. However, the Bank will implement the revised hedge accounting disclosures that are required by the IFRS 9related amendments to IFRS 7 “Financial Instruments: Disclosures” in the 2018 Annual Report.
ImpairmentThe standard introduces a new single model for the measurement of impairment losses on all financial assets including loans and debt securities measured atamortized cost or at fair value through OCI. The IFRS 9 expected credit loss (ECL) model replaces the current “incurred loss” model of IAS 39.
The ECL model contains a three stage approach which is based on the change in credit quality of financial assets since initial recognition. Under Stage1, where there has not been a significant increase in credit risk since initial recognition, an amount equal to 12 months ECL will be recorded. UnderStage 2, where there has been a significant increase in credit risk since initial recognition but the financial instruments are not considered creditimpaired, an amount equal to the default probability weighted lifetime ECL will be recorded.
Under the Stage 3, where there is objective evidence of impairment at the reporting date these financial instruments will be classified as creditimpaired and an amount equal to the lifetime ECL will be recorded for the financial assets.
148 | 2 0 1 7 S C O T I A B A N K A N N U A L R E P O R T

CO
NSO
LIDA
TEDFIN
AN
CIA
LSTA
TEMEN
TS
The ECL model is forward looking and requires the use of reasonable and supportable forecasts of future economic conditions in the determination ofsignificant increases in credit risk and measurement of ECL.
The Bank has also modified its definition of impaired financial instruments (Stage 3) for certain categories of financial instruments to make itconsistent with the definitions used in the calculation of regulatory capital. As well, certain allowances for credit losses currently ascribed to impairedloans will be ascribed against Stage 1 and Stage 2 exposures.
Transition impactThe Bank will record an adjustment to its opening November 1, 2017 retained earnings and AOCI, to reflect the application of the new requirementsof Impairment and Classification and Measurement at the adoption date and will not restate comparative periods.
The Bank estimates the IFRS 9 transition amount will reduce shareholders’ equity by approximately $600 million after-tax and the Common EquityTier 1 capital ratio by approximately 15 basis points as at November 1, 2017. The estimated impact relates primarily to the implementation of the ECLrequirements in the Bank. The Bank continues to revise, refine and validate the impairment models and related process controls leading up to theJanuary 31, 2018 reporting.
Financial instruments: disclosures (IFRS 7)IFRS 7 Financial Instruments: Disclosures, has been amended to include more extensive qualitative and quantitative disclosure relating to IFRS 9 such asnew classification categories, three stage impairment model, new hedge accounting requirements and transition provisions.
Effective November 1, 2018
Revenue from contracts with customersOn May 28, 2014, the IASB issued IFRS 15 Revenue from Contracts with Customers, which replaces the previous revenue standard IAS 18 Revenue,and the related Interpretations on revenue recognition. The standard is a control-based model as compared to the existing revenue standard which isprimarily focused on risks and rewards and provides a single principle based framework to be applied to all contracts with customers that are in scopeof the standard. Under the new standard revenue is recognized when a customer obtains control of a good or service. Transfer of control occurs whenthe customer has the ability to direct the use of and obtain the benefits of the good or service. The standard introduces a new five step model torecognize revenue as performance obligations in a contract are satisfied. The standard scopes out contracts that are considered to be lease contracts,insurance contracts and financial instruments, and as such will impact the businesses that earn fee and commission revenue.
On April 12, 2016, the IASB issued amendments to IFRS 15 Revenue from Contracts with Customers. The amendments provide additional clarificationon the identification of a performance obligation in a contract, determining the principal and agent in an agreement, and determining whetherlicensing revenues should be recognized at a point in time or over a specific period. The amendments also provide additional practical expedients thatcan be used on transition to the standard.
The Bank will adopt the standard and its amendments as of November 1, 2018 and plans to use the modified retrospective approach. Under thisapproach, the Bank will recognize the cumulative effect of initially applying the standard as an adjustment to the opening balance of retainedearnings as of November 1, 2018, without restating comparative periods. Additional disclosures will be required in order to explain any significantchanges between reported results and results had the previous revenue standard been applied.
The standard does not apply to revenue associated with financial instruments, and therefore, will not impact the majority of the Bank’s revenue,including interest income, interest expense, trading revenue and securities gains which are covered under IFRS 9 Financial Instruments. Theimplementation of the standard is being led by the Finance Department in coordination with the business segments. The areas of focus for the Bank’sassessment of impact are fees and commission revenues from wealth management and banking services in Canadian and International Banking. TheBank has been working to identify and review the customer contracts within the scope of the new standard. While the assessment is not complete,the timing of the Bank’s revenue recognition of fees and commissions within the scope of this standard is not expected to materially change. Theclassification of certain contract costs (whether presented gross or offset against non-interest income) continues to be evaluated and the finalinterpretation may impact the presentation of certain contract costs. The Bank is also evaluating the additional disclosures that may be relevant andrequired.
Effective November 1, 2019
Financial instruments: Prepayment features with negative compensationOn October 12, 2017, the IASB issued an amendment to IFRS 9 Financial Instruments. The amendment allows certain pre-payable financial assets withso-called negative compensation prepayment option to be measured at amortized cost or fair value through other comprehensive income, if theprepayment amount substantially represents unpaid principal and interest and reasonable compensation. Reasonable compensation may be positive ornegative. Prior to this amendment financial assets with this negative compensation feature would have failed the solely payments of principal andinterest test and be mandatorily measured at fair value through profit or loss. The amendment will be effective for annual periods beginning on orafter January 1, 2019, with early adoption permitted. Based on preliminary assessments, the amendment is not expected to impact the Bank.
LeasesOn January 13, 2016, the IASB issued IFRS 16 Leases, which requires a lessee to recognize an asset for the right to use the leased item and a liabilityfor the present value of its future lease payments. IFRS 16 will result in leases being recorded on the Bank’s balance sheet, including those currentlyclassified as operating leases except for short-term leases and leases with low value of the underlying asset. IFRS 16 substantially carries forward thelessor accounting requirements in IAS 17.
2 0 1 7 S C O T I A B A N K A N N U A L R E P O R T | 149

CONSOLIDATED FINANCIAL STATEMENTS
IFRS 16 is effective for the Bank on November 1, 2019, with early adoption permitted from the date the Bank applies IFRS 15 Revenue from Contractswith Customers on or before the date of initial application of IFRS 16. On transition there are practical expedients available whereby the Bank will notneed to reassess whether a contract is, or contains a lease, or reassess the accounting of sale leaseback transactions recognized prior to the date ofinitial application. A lessee will apply IFRS 16 to its leases either retrospectively to each prior reporting period presented; or retrospectively with thecumulative effect of initially applying IFRS 16 being recognized at the date of initial application.
The Bank is currently assessing the impact of this new standard.
Effective November 1, 2021
Insurance ContractsOn May 18, 2017, the IASB issued IFRS 17 Insurance Contracts, which provides a comprehensive principle-based framework for the measurement andpresentation of all insurance contracts. The new standard will replace IFRS 4 Insurance Contracts and requires insurance contracts to be measuredusing current fulfillment cash flows and for revenue to be recognized as the service is provided over the coverage period. The standard is effective forthe Bank on November 1, 2021. The Bank will assess the impact of adopting this new standard.
5 Cash and Deposits with Financial InstitutionsAs at October 31 ($ millions) 2017 2016
Cash and non-interest-bearing deposits with financial institutions $ 7,825 $ 6,855
Interest-bearing deposits with financial institutions 51,838 39,489
Total $ 59,663 $ 46,344
The Bank is required to maintain balances with central banks, other regulatory authorities and certain counterparties and these amounted to$7,282 million (2016 – $7,616 million).
6 Fair Value of Financial Instruments
Determination of fair valueThe calculation of fair value is based on market conditions at a specific point in time and therefore may not be reflective of future fair values. The Bankhas controls and processes in place to ensure that the valuation of financial instruments is appropriately determined.
The best evidence of fair value for a financial instrument is the quoted price in an active market. Quoted market prices represent a Level 1 valuation.Where possible, valuations are based on quoted prices or observable inputs obtained from active markets. Independent Price Verification (IPV) isundertaken to assess the reliability and accuracy of prices and inputs used in the determination of fair value. The IPV process is performed by priceverification groups that are independent from the business. The Bank maintains a list of pricing sources that are used in the IPV process. These sourcesinclude, but are not limited to, brokers, dealers and consensus pricing services. The valuation policies relating to the IPV process require that all pricingor rate sources used be external to the Bank. On a periodic basis, an independent assessment of pricing or rate sources is performed to determinemarket presence or market representative levels.
Quoted prices are not always available for over-the-counter transactions, as well as transactions in inactive or illiquid markets. In these instances,internal models that maximize the use of observable inputs are used to estimate fair value. The chosen valuation technique incorporates all the factorsthat market participants would take into account in pricing a transaction. When all significant inputs to models are observable, the valuation isclassified as Level 2. Financial instruments traded in a less active market are valued using indicative market prices, present value of cash-flows or othervaluation techniques. Fair value estimates normally do not consider forced or liquidation sales.
Where financial instruments trade in inactive markets or when using models where observable parameters do not exist, greater managementjudgment is required for valuation purposes. Valuations that require the significant use of unobservable inputs are considered Level 3.
The specific inputs and valuation techniques used in determining the fair value of financial instruments are noted below. For Level 3 instruments,additional information is disclosed in the Level 3 sensitivity analysis on page 155.
The fair values of cash and deposits with banks, securities purchased under resale agreements and securities borrowed, customers’ liability underacceptances, obligations related to securities sold under repurchase agreements and securities lent, acceptances, and obligations related to securitiessold short are assumed to approximate their carrying values, either due to their short-term nature or because they are frequently repriced to currentmarket rates.
Trading loansTrading loans as they relate to precious metals (primarily gold and silver) are valued using a discounted cash flow model incorporating market-observable inputs, including precious metals spot and forward prices and interest rate curves (Level 2). Other trading loans that serve as hedges toloan-based credit total return swaps are valued using consensus prices from Bank approved independent pricing services (Level 2).
Government issued or guaranteed securitiesThe fair values of government issued or guaranteed debt securities are primarily based on quoted prices in active markets, where available. Wherequoted prices are not available, the fair value is determined by utilizing recent transaction prices, broker quotes, or pricing services (Level 2).
For securities that are not actively traded, the Bank uses a discounted cash flow method, using the effective yield of a similar instrument adjusted forinstrument-specific risk factors such as credit spread and contracted features (Level 2).
Corporate and other debtCorporate and other debt securities are valued using prices from independent market data providers or third-party broker quotes. Where prices arenot available consistently, the last available data is used and verified with a yield-based valuation approach (Level 2). In some instances, interpolated
150 | 2 0 1 7 S C O T I A B A N K A N N U A L R E P O R T

CO
NSO
LIDA
TEDFIN
AN
CIA
LSTA
TEMEN
TS
yields of similar bonds are used to price securities (Level 2). The Bank uses pricing models with observable inputs from market sources such as creditspread, interest rate curves, and recovery rates (Level 2). These inputs are verified through an IPV process on a monthly basis.
For certain securities where there is no active market, no consensus market pricing and no indicative or executable independent third-party quotes,the Bank uses pricing by third-party providers or internal pricing models and cannot readily observe the market inputs used to price such instruments(Level 3).
Mortgage-backed securitiesThe fair value of residential mortgage-backed securities is primarily determined using third-party broker quotes and independent market dataproviders, where the market is more active (Level 2). Where the market is inactive, an internal price-based model is used (Level 3).
Equity securitiesThe fair value of equity securities is based on quoted prices in active markets, where available. Where equity securities are less frequently traded, themost recent exchange-quoted pricing is used to determine fair value. Where there is a wide bid-offer spread, fair value is determined based on quotedmarket prices for similar securities (Level 2).
Where quoted prices in active markets are not readily available, such as for private equity securities, the fair value is determined as a multiple of theunderlying earnings or percentage of underlying assets obtained from third-party general partner statements (Level 3).
Income funds and hedge fundsThe fair value of income funds and hedge funds is based on observable quoted prices where available. Where quoted or active market prices areunavailable, the last available Net Asset Value, fund statements and other financial information available from third-party fund managers at the fundlevel are used in arriving at the fair value. These inputs are not considered observable because the Bank cannot redeem these funds at Net Asset Value(Level 3).
DerivativesFair values of exchange-traded derivatives are based on quoted market prices. Fair values of over-the-counter (OTC) derivatives or inactive exchange-traded derivatives are determined using pricing models, which take into account input factors such as current market and contractual prices of theunderlying instruments, as well as time value and yield curve or volatility factors underlying the positions (Level 2). The determination of the fair valueof derivatives includes consideration of credit risk, estimated funding costs and ongoing direct costs over the life of the instruments.
Derivative products valued using a valuation technique with market-observable inputs mainly include interest rate swaps and options, currency swapsand forward foreign exchange contracts. The most frequently applied valuation techniques include forward pricing and swap models, using presentvalue calculations. The models incorporate various inputs including foreign exchange spot and forward rates and interest rate curves (Level 2).
Derivative products valued using a valuation technique with significant unobservable inputs are long dated contracts (interest rate swaps, currencyswaps, forward foreign exchange contracts, option contracts and certain credit default swaps) and other derivative products that reference a basket ofassets, commodities or currencies. These models incorporate certain significant non-observable inputs such as volatility and correlation (Level 3).
LoansThe estimated fair value of loans carried at amortized cost reflects changes in the general level of interest rates and credit worthiness of borrowersthat have occurred since the loans were originated or purchased. The particular valuation methods used are as follows:Š Canadian fixed rate residential mortgages are fair valued by discounting the expected future contractual cash flows, taking into account expected
prepayments and using management’s best estimate of average market interest rates currently offered for mortgages with similar remaining terms(Level 3).
Š For fixed rate business and government loans, fair value is determined by discounting the expected future contractual cash flows of these loans atinterest rates estimated by using the appropriate currency swap curves for the remaining term, adjusted for a credit mark of the expected losses inthe portfolio (Level 3).
Š For all other fixed rate loans, fair value is determined by discounting the expected future contractual cash flows of these loans at interest ratesestimated by using the appropriate currency swap curves for the remaining term (Level 3).
Š For all floating rate loans fair value is assumed to equal book value.
The fair value of loans is not adjusted for the value of any credit protection the Bank has purchased to mitigate credit risk.
DepositsThe fair values of deposits payable on demand or after notice or floating rate deposits payable on a fixed date is assumed to equal book value.
The estimated fair values of Canadian personal fixed rate deposits payable on a fixed date are fair valued by discounting the expected futurecontractual cash outflows, using management’s best estimate of average market interest rates currently offered for deposits with similar remainingterms (Level 2).
Deposits under the Canada Mortgage Bond (CMB) program are fair valued by discounting expected future contractual cash flows using marketobservable inputs (Level 2).
For all other fixed rate deposits, fair value is determined by discounting the expected future contractual cash flows of these deposits at interest ratesestimated by using the appropriate currency swap curves for the remaining term (Level 2).
For structured deposit notes containing embedded features that are bifurcated from the deposit notes, the fair value of the embedded derivatives isdetermined using option pricing models with inputs similar to other interest rate or equity derivative contracts (Level 2). The fair value of certainembedded derivatives is determined using net asset values (Level 3).
2 0 1 7 S C O T I A B A N K A N N U A L R E P O R T | 151

CONSOLIDATED FINANCIAL STATEMENTS
Subordinated debentures and other liabilitiesThe fair values of subordinated debentures, including debentures issued by subsidiaries which are included in other liabilities, are determined byreference to quoted market prices where available or market prices for debt with similar terms and risks (Level 2). The fair values of other liabilities isdetermined by the discounted contractual cash flow method with appropriate currency swap curves for the remaining term (Level 2).
Fair value of financial instrumentsThe following table sets out the fair values of financial instruments of the Bank using the valuation methods and assumptions described above. Thefair values disclosed do not include non-financial assets, such as property and equipment, investments in associates, precious metals, goodwill andother intangible assets.
2017 2016
As at October 31 ($ millions)
Totalfair
value
Totalcarrying
valueFavourable/
(Unfavourable)
Totalfair
value
Totalcarrying
valueFavourable/
(Unfavourable)
Assets:Cash and deposits with financial institutions $ 59,663 $ 59,663 $ – $ 46,344 $ 46,344 $ –Trading assets 98,464 98,464 – 108,561 108,561 –Financial instruments designated at fair value through profit
or loss 13 13 – 221 221 –Securities purchased under resale agreements and securities
borrowed 95,319 95,319 – 92,129 92,129 –Derivative financial instruments 35,364 35,364 – 41,657 41,657 –Investment securities – available-for-sale 50,504 50,504 – 50,509 50,509 –Investment securities – held-to-maturity 18,716 18,765 (49) 22,567 22,410 157Loans 507,276 504,369 2,907 484,815 480,164 4,651Customers’ liability under acceptances 13,560 13,560 – 11,978 11,978 –Other financial assets 9,314 9,314 – 9,973 9,973 –Liabilities:Deposits 625,964 625,367 (597) 613,858 611,877 (1,981)Financial instruments designated at fair value through profit
or loss 4,663 4,663 – 1,459 1,459 –Acceptances 13,560 13,560 – 11,978 11,978 –Obligations related to securities sold short 30,766 30,766 – 23,312 23,312 –Derivative financial instruments 34,200 34,200 – 42,387 42,387 –Obligations related to securities sold under repurchase
agreements and securities lent 95,843 95,843 – 97,083 97,083 –Subordinated debentures 6,105 5,935 (170) 7,804 7,633 (171)Other financial liabilities 27,531 27,118 (413) 24,304 23,796 (508)
Changes in interest rates, credit spreads and liquidity costs are the main cause of changes in the fair value of the Bank’s financial instruments resultingin a favourable or unfavourable variance compared to carrying value. For the Bank’s financial instruments carried at cost or amortized cost, thecarrying value is not adjusted to reflect increases or decreases in fair value due to market fluctuations, including those due to interest rate changes. Foravailable-for-sale investment securities, derivatives and financial instruments held for trading purposes or designated as fair value through profit andloss, the carrying value is adjusted regularly to reflect the fair value.
152 | 2 0 1 7 S C O T I A B A N K A N N U A L R E P O R T

CO
NSO
LIDA
TEDFIN
AN
CIA
LSTA
TEMEN
TS
Fair value hierarchyThe following table outlines the fair value hierarchy of instruments carried at fair value on a recurring basis and of instruments not carried at fair value.
2017 2016
As at October 31 ($ millions) Level 1 Level 2 Level 3 Total Level 1 Level 2 Level 3 Total
Instruments carried at fair value on arecurring basis:
Assets:Precious metals(1) $ – $ 5,717 $ – $ 5,717 $ – $ 8,442 $ – $ 8,442Trading assetsLoans – 17,312 – 17,312 – 19,421 – 19,421Canadian federal government and
government guaranteed debt 10,343 – – 10,343 10,830 – – 10,830Canadian provincial and municipal debt – 7,325 – 7,325 – 9,608 – 9,608US treasury and other US agencies’ debt 6,894 – – 6,894 10,182 – – 10,182Other foreign governments’ debt 5,680 1,149 – 6,829 4,724 1,783 – 6,507Corporate and other debt 44 7,920 22 7,986 75 9,844 31 9,950Income funds 180 165 – 345 1,424 648 1,186 3,258Equity securities 38,760 170 – 38,930 36,814 133 5 36,952Other(2) 2,500 – – 2,500 1,853 – – 1,853
$ 64,401 $ 39,758 $ 22 $ 104,181 $ 65,902 $ 49,879 $ 1,222 $ 117,003
Financial assets designated at fairvalue through profit or loss $ 13 $ – $ – $ 13 $ 16 $ 205 $ – $ 221
Investment securities(3)
Canadian federal government andgovernment guaranteed debt 9,677 2,416 – 12,093 11,464 2,157 – 13,621
Canadian provincial and municipal debt 593 4,230 – 4,823 934 2,558 – 3,492US treasury and other US agencies’ debt 6,305 367 – 6,672 9,901 176 – 10,077Other foreign governments’ debt 10,944 8,746 113 19,803 6,703 8,473 355 15,531Corporate and other debt 750 3,584 53 4,387 745 3,852 81 4,678Mortgage-backed securities 539 876 – 1,415 276 751 – 1,027Equity securities 590 177 544 1,311 1,411 199 473 2,083
$ 29,398 $ 20,396 $ 710 $ 50,504 $ 31,434 $ 18,166 $ 909 $ 50,509
Derivative financial instrumentsInterest rate contracts $ – $ 9,742 $ 36 $ 9,778 $ – $ 15,653 $ 54 $ 15,707Foreign exchange and gold contracts 4 21,496 – 21,500 17 21,642 – 21,659Equity contracts 615 1,720 – 2,335 321 1,546 64 1,931Credit contracts – 175 – 175 – 148 – 148Commodity contracts 133 1,443 – 1,576 321 1,891 – 2,212
$ 752 $ 34,576 $ 36 $ 35,364 $ 659 $ 40,880 $ 118 $ 41,657
Liabilities:Deposits(4) $ – $ (7) $ – $ (7) $ – $ (36) $ 1,163 $ 1,127Financial liabilities designated at fair
value through profit or loss – 4,663 – 4,663 – 1,459 – 1,459Obligations related to securities sold
short 27,796 2,970 – 30,766 19,870 3,442 – 23,312
Derivative financial instrumentsInterest rate contracts – 10,823 267 11,090 – 14,299 187 14,486Foreign exchange and gold contracts 3 17,646 – 17,649 3 21,640 – 21,643Equity contracts 502 2,724 7 3,233 327 1,886 167 2,380Credit contracts – 179 – 179 – 1,475 – 1,475Commodity contracts 268 1,781 – 2,049 312 2,091 – 2,403
$ 773 $ 33,153 $ 274 $ 34,200 $ 642 $ 41,391 $ 354 $ 42,387
Instruments not carried at fair value(5):Assets:Investment securities – Held to maturity $ 4,240 $ 14,476 $ – $ 18,716 $ 4,972 $ 17,595 $ – $ 22,567Loans(6) – – 286,621 286,621 – – 276,462 276,462
Liabilities:Deposits(6)(7) – 266,995 – 266,995 – 271,170 – 271,170Subordinated debt – 6,105 – 6,105 – 7,804 – 7,804Other liabilities – 13,363 – 13,363 – 11,303 – 11,303
(1) The fair value of precious metals is determined based on quoted market prices and forward spot prices.(2) Consists primarily of base metal positions. The fair value of these positions is determined based on quoted prices in active markets.(3) Excludes investments which are held-to-maturity of $18,765 (2016 – $22,410).(4) These amounts represent embedded derivatives bifurcated from structured deposit notes.(5) Represents the fair value of financial assets and liabilities where the carrying amount is not a reasonable approximation of fair value.(6) Excludes floating rate instruments as carrying value approximates fair value.(7) Excludes embedded derivatives bifurcated from structured deposit notes.
2 0 1 7 S C O T I A B A N K A N N U A L R E P O R T | 153

CONSOLIDATED FINANCIAL STATEMENTS
Level 3 instrument fair value changesFinancial instruments categorized as Level 3 as at October 31, 2017, in the fair value hierarchy comprise certain illiquid government bonds, highly-structured corporate bonds, illiquid investments in private equity securities, and complex derivatives.
The following table summarizes the changes in Level 3 instruments carried at fair value for the year ended October 31, 2017.
All positive balances represent assets and negative balances represent liabilities. Consequently, positive amounts indicate purchases of assets orsettlements of liabilities and negative amounts indicate sales of assets or issuances of liabilities.
As at October 31, 2017
($ millions)
Fair valueNovember 1
2016
Gains/(losses)recorded in
income(1)
Gains/(losses)recorded in
OCI(2)
Purchases/Issuances
Sales/Settlements
Transfersinto/out of
Level 3
Fair valueOctober 31
2017
Change inunrealized
gains/(losses)recorded inincome for
instrumentsstill held(3)
Trading assets(4)
Corporate and other debt $ 31 $ (9) $ – $ – $ – $ – $ 22 $ (9)Income funds 1,186 (6) – – (1,180) – – –Equity securities 5 (5) – – – – – –
1,222 (20) – – (1,180) – 22 (9)
Investment securitiesOther foreign governments’ debt 355 6 (8) – (240) – 113 n/aCorporate and other debt 81 3 (8) 13 (33) (3) 53 n/aEquity securities 473 (33) 54 109 (59) – 544 n/a
909 (24) 38 122 (332) (3) 710 n/a
Derivative financial instruments – assetsInterest rate contracts 54 (33) – 36 (21) – 36 (36)Equity contracts 64 108 – 9 (46) (135) – –
Derivative financial instruments –liabilitiesInterest rate contracts (187) (67) – (45) 32 – (267) (68)(6)
Equity contracts (167) 2 – (6) 38 126 (7) (8)(5)
(236) 10 – (6) 3 (9) (238) (112)
Deposits(7) (1,163) 6 – – 1,157 – – –
Total $ 732 $ (28) $ 38 $ 116 $ (352) $ (12) $ 494 $ (121)
(1) Gains and losses on trading assets and all derivative financial instruments are included in trading revenues in the Consolidated Statement of Income. Gains and losses on disposal ofinvestment securities are included in net gain on sale of investment securities in the Consolidated Statement of Income.
(2) Gains and losses from fair value changes of investment securities are presented in the net change in unrealized gains (losses) on available-for-sale securities in the ConsolidatedStatement of Comprehensive Income.
(3) These amounts represent the gains and losses from fair value changes of Level 3 instruments still held at the end of the period that are recorded in the Consolidated Statement ofIncome.
(4) Trading assets include an insignificant amount of financial assets designated at fair value through profit or loss.(5) Certain unrealized gains and losses on derivative assets and liabilities are largely offset by mark-to-market changes on other instruments included in trading revenues in the
Consolidated Statement of Income, since these instruments act as an economic hedge to certain derivative assets and liabilities.(6) Certain unrealized losses on interest rate derivative contracts are largely offset by mark-to-market changes on embedded derivatives on certain deposit notes in the Consolidated
Statement of Income.(7) These amounts represent embedded derivatives bifurcated from structured deposit notes.
The following table summarizes the changes in Level 3 instruments carried at fair value for the year ended October 31, 2016.
As at October 31, 2016
($ millions)
Fair valueNovember 1
2015
Gains/(losses)recorded in
income(1)
Gains/(losses)recorded
in OCIPurchases/Issuances
Sales/Settlements
Transfersinto/out of
Level 3
Fair valueOctober 31
2016
Trading assets(2) $ 1,315 $ (22) $ – $ – $ (71) $ – $ 1,222Investment securities 1,740 195 (217) 706 (1,515) – 909Derivative financial instruments (125) (85) – (139) 147 (34) (236)Deposits(3) (1,192) 29 – – – – (1,163)
(1) Gains or losses for items in Level 3 may be offset with losses or gains on related hedges in Level 1 or Level 2.(2) Trading assets include an insignificant amount of financial assets designated at fair value through profit or loss.(3) These amounts represent embedded derivatives bifurcated from structured deposit notes.
154 | 2 0 1 7 S C O T I A B A N K A N N U A L R E P O R T

CO
NSO
LIDA
TEDFIN
AN
CIA
LSTA
TEMEN
TS
Significant transfersSignificant transfers can occur between the fair value hierarchy levels when additional or new information regarding valuation inputs and theirrefinement and observability become available. The Bank recognizes transfers between levels of the fair value hierarchy as of the end of the reportingperiod during which the change has occurred.
The following significant transfers were made among Levels 1, 2 and 3 for the year ended October 31, 2017:
A net amount of derivative assets of $135 million and derivative liabilities of $126 million was transferred out of Level 3 into Level 2 for equityderivatives. Transfers were primarily as a result of assessment and consideration of volatility as an insignificant input for certain equity derivativecontracts.
The following significant transfers were made among Levels 1, 2 and 3 for the year ended October 31, 2016:
A net amount of derivative assets of $162 million was transferred into Level 3 from Level 2 for equity derivatives. A net amount of derivative liabilitiesof $196 million was transferred into Level 3 from Level 2 primarily for equity derivatives.
All transfers were as a result of new information being obtained regarding the observability of inputs used in the valuation.
Level 3 sensitivity analysisThe table below sets out information about significant unobservable inputs used in measuring financial instruments categorized as Level 3 in the fairvalue hierarchy.
Valuation techniqueSignificant
unobservable inputsRange of estimates forunobservable inputs(1)
Changes in fair valuefrom reasonably
possible alternatives($ millions)
Derivative financial instruments
Interest rate contracts Option pricing Interest rate
(35)/35model volatility 9% - 212%
Equity contracts Option pricing Equity volatility 4% - 95%
(6)/6model Single stock correlation (77)% - 97%
(1) The range of estimates represents the actual lowest and highest level inputs used to fair value financial instruments within each financial statement category.
The Bank applies judgment in determining unobservable inputs used to calculate the fair value of Level 3 instruments.
The following section discusses the significant unobservable inputs for Level 3 instruments.
CorrelationCorrelation in a credit derivative or debt instrument refers to the likelihood of a single default causing a succession of defaults. It affects thedistribution of the defaults throughout the portfolio and therefore affects the valuation of instruments such as collateralized debt obligation tranches.A higher correlation may increase or decrease fair value depending on the seniority of the instrument.
Correlation becomes an input into equity derivative pricing when the relationship between price movements of two or more of the underlying assets isrelevant.
VolatilityVolatility is a measure of security price fluctuation. Historic volatility is often calculated as the annualized standard deviation of daily price variation fora given time period. Implied volatility is volatility, when input into an option pricing model, that returns a value equal to the current market value ofthe option.
2 0 1 7 S C O T I A B A N K A N N U A L R E P O R T | 155

CONSOLIDATED FINANCIAL STATEMENTS
7 Trading Assets
(a) Trading securitiesAn analysis of the carrying value of trading securities is as follows:
As at October 31, 2017 ($ millions) Remaining term to maturity
Within threemonths
Three totwelve
monthsOne to
five yearsFive to ten
yearsOver ten
yearsNo specific
maturityCarrying
value
Trading securities:Canadian federal government issued or
guaranteed debt $ 950 $ 1,696 $ 4,283 $ 1,333 $ 2,081 $ – $ 10,343Canadian provincial and municipal debt 1,230 1,127 1,536 1,269 2,163 – 7,325U.S. treasury and other U.S. agency debt 113 980 3,301 2,214 286 – 6,894Other foreign government debt 1,172 819 2,716 1,132 990 – 6,829Common shares – – – – – 39,275 39,275Other 530 1,134 4,702 1,088 532 – 7,986Total $ 3,995 $ 5,756 $ 16,538 $ 7,036 $ 6,052 $ 39,275 $ 78,652
Total by currency (in Canadian equivalent):Canadian dollar $ 2,368 $ 3,064 $ 5,130 $ 3,068 $ 4,524 $ 8,619 $ 26,773U.S. dollar 372 1,771 6,807 2,777 526 12,016 24,269Mexican peso 249 235 488 1 1 997 1,971Other currencies 1,006 686 4,113 1,190 1,001 17,643 25,639Total trading securities $ 3,995 $ 5,756 $ 16,538 $ 7,036 $ 6,052 $ 39,275 $ 78,652
As at October 31, 2016 ($ millions) Remaining term to maturity
Within threemonths
Three totwelve
monthsOne to
five yearsFive to ten
yearsOver ten
yearsNo specific
maturityCarrying
value
Trading securities:Canadian federal government issued or
guaranteed debt $ 235 $ 2,620 $ 4,651 $ 1,079 $ 2,245 $ – $ 10,830Canadian provincial and municipal debt 1,713 950 1,483 2,907 2,555 – 9,608U.S. treasury and other U.S. agency debt 2,688 400 4,304 957 1,833 – 10,182Other foreign government debt 1,346 760 1,924 1,369 1,108 – 6,507Common shares – – – – – 40,210 40,210Other 913 1,504 4,853 1,693 987 – 9,950Total $ 6,895 $ 6,234 $ 17,215 $ 8,005 $ 8,728 $ 40,210 $ 87,287
Total by currency (in Canadian equivalent):Canadian dollar $ 2,161 $ 3,714 $ 6,832 $ 4,442 $ 5,185 $ 15,033 $ 37,367U.S. dollar 3,199 1,502 7,792 2,156 2,448 8,178 25,275Mexican peso 176 82 160 6 8 1,536 1,968Other currencies 1,359 936 2,431 1,401 1,087 15,463 22,677Total trading securities $ 6,895 $ 6,234 $ 17,215 $ 8,005 $ 8,728 $ 40,210 $ 87,287
(b) Trading loansThe following table provides the geographic breakdown of trading loans:
As at October 31 ($ millions) 2017 2016
Trading loans(1)(2)
U.S.(3) $ 10,654 $ 11,235Europe(4) 3,824 4,163Asia Pacific(4) 1,605 2,555Canada(4) 376 340Other(4) 853 1,128Total $ 17,312 $ 19,421
(1) Geographic segmentation of trading loans is based upon the location of the ultimate risk of the underlying asset.(2) Loans are denominated in U.S. dollars.(3) Includes trading loans that serve as a hedge to loan-based credit total return swaps of $7,390 (2016 – $7,098), while the remaining relates to short-term precious metals trading
and lending activities.(4) These loans are primarily related to short-term precious metals trading and lending activities.
156 | 2 0 1 7 S C O T I A B A N K A N N U A L R E P O R T

CO
NSO
LIDA
TEDFIN
AN
CIA
LSTA
TEMEN
TS
8 Financial Instruments Designated at Fair Value Through Profit or Loss
In accordance with its risk management strategy, the Bank has elected to designate certain investments, loans and deposit note liabilities at fair valuethrough profit or loss to reduce an accounting mismatch between fair value changes in these instruments and fair value changes in related derivatives,and where a hybrid instrument contains one or more embedded derivatives that are not closely related to the host contract. Changes in fair valuearising from changes in the Bank’s own credit risk are recognized in other comprehensive income, without subsequent reclassification to net income.
The cumulative fair value adjustment due to own credit risk is determined at a point in time by comparing the present value of expected future cashflows over the term of these liabilities discounted at the Bank’s effective funding rate, and the present value of expected future cash flows discountedunder a benchmark rate. The change in fair value attributable to change in credit risk is determined by the change in the cumulative fair valueadjustment due to own credit risk.
The following table presents the fair value of financial assets and liabilities designated at fair value through profit or loss and their changes in fairvalue.
Fair value Change in fair value Cumulative change in FV(1)
As at For the year ended
October 31 ($ millions) 2017 2016 2017 2016 2017 2016
Investment securities(2) $ 13 $ 16 $ – $ (1) $ 11 $ 11Loans(3) – 205 (205) (9) (197) 8Deposit note liabilities(4) 4,663 1,459 103 245 (91) 15
(1) The cumulative change in fair value is measured from the instruments’ date of initial recognition.(2) Changes in fair value are recorded in non-interest income – other.(3) Changes in fair value are recorded in non-interest income – trading revenues.(4) Changes in fair value attributable to changes in the Bank’s own credit risk are recorded in other comprehensive income. Other changes in fair value are recorded in non-interest
income – trading revenues.
The following tables present the changes in fair value attributable to changes in the Bank’s own credit risk for financial liabilities designated at fairvalue through profit or loss as well as their contractual maturity and carrying amounts.
Deposit Note Liabilities
Contractualmaturity
amount(1)
CarryingValue
Differencebetween
carrying valueand
contractualmaturityamount
Changes in fair valuefor the periodattributable to
changes in owncredit risk recorded
in othercomprehensive
income
Cumulative changesin fair value
attributable tochanges in own
credit risk(1)
As at October 31, 2017 $ 4,572 $ 4,663 $ (91) $ (28) $ (36)
As at October 31, 2016 $ 1,474 $ 1,459 $ 15 $ (23) $ (8)
(1) The cumulative change in fair value is measured from the instruments’ date of initial recognition.
2 0 1 7 S C O T I A B A N K A N N U A L R E P O R T | 157

CONSOLIDATED FINANCIAL STATEMENTS
9 Derivative Financial Instruments
(a) Notional amounts(1)
The following table provides the aggregate notional amounts of derivative financial instruments outstanding by type and segregated between thoseused by the Bank in its dealer capacity (Trading) and those derivatives designated in hedging relationships. The notional amounts of these contractsrepresent the derivatives volume outstanding and do not represent the potential gain or loss associated with the market risk or credit risk of suchinstruments. Credit derivatives within other derivative contracts are comprised primarily of purchased and sold credit default swap transactions. To alesser extent, this category also includes total return swaps referenced to loans and debt securities. Other derivative contracts – other includes preciousmetals other than gold, and other commodities including energy and base metal derivatives.
2017 2016
As at October 31 ($ millions) Trading Hedging Total Trading Hedging Total
Interest rate contractsExchange-traded:
Futures $ 161,590 $ – $ 161,590 $ 112,196 $ – $ 112,196Options purchased 5,474 – 5,474 15,427 – 15,427Options written 2,894 – 2,894 3,283 – 3,283
169,958 – 169,958 130,906 – 130,906Over-the-counter:
Forward rate agreements 208 – 208 1,721 – 1,721Swaps 441,607 18,609 460,216 479,029 25,537 504,566Options purchased 34,190 – 34,190 35,404 – 35,404Options written 38,099 – 38,099 36,864 – 36,864
514,104 18,609 532,713 553,018 25,537 578,555Over-the-counter (settled through central
counterparties):Forward rate agreements 329,853 – 329,853 308,186 – 308,186Swaps 2,236,148 106,979 2,343,127 1,702,488 87,480 1,789,968Options purchased – – – – – –Options written – – – – – –
2,566,001 106,979 2,672,980 2,010,674 87,480 2,098,154Total $ 3,250,063 $ 125,588 $ 3,375,651 $ 2,694,598 $ 113,017 $ 2,807,615Foreign exchange and gold contractsExchange-traded:
Futures $ 32,452 $ – $ 32,452 $ 35,862 $ – $ 35,862Options purchased 16 – 16 257 – 257Options written 481 – 481 – – –
32,949 – 32,949 36,119 – 36,119Over-the-counter:
Spot and forwards 427,112 21,623 448,735 425,033 24,244 449,277Swaps 321,567 63,300 384,867 302,107 51,355 353,462Options purchased 39,100 – 39,100 16,359 – 16,359Options written 39,547 – 39,547 16,245 – 16,245
827,326 84,923 912,249 759,744 75,599 835,343Over-the-counter (settled through central
counterparties):Spot and forwards – – – 13 – 13Swaps – – – – – –Options purchased – – – – – –Options written – – – – – –
– – – 13 – 13Total $ 860,275 $ 84,923 $ 945,198 $ 795,876 $ 75,599 $ 871,475Other derivative contractsExchange-traded:
Equity $ 33,287 $ – $ 33,287 $ 19,625 $ – $ 19,625Credit – – – – – –Commodity and other contracts 45,938 – 45,938 41,888 – 41,888
79,225 – 79,225 61,513 – 61,513Over-the-counter:
Equity 64,444 796 65,240 67,604 679 68,283Credit 26,737 – 26,737 37,910 – 37,910Commodity and other contracts 34,715 – 34,715 36,508 – 36,508
125,896 796 126,692 142,022 679 142,701Over-the-counter (settled through central
counterparties):Equity 2,863 – 2,863 – – –Credit 10,855 – 10,855 11,148 – 11,148Commodity and other contracts 6,762 – 6,762 357 – 357
20,480 – 20,480 11,505 – 11,505Total $ 225,601 $ 796 $ 226,397 $ 215,040 $ 679 $ 215,719Total notional amounts outstanding $ 4,335,939 $ 211,307 $ 4,547,246 $ 3,705,514 $ 189,295 $ 3,894,809
(1) The notional amounts represent the amount to which a rate or price is applied to determine the amount of cash flows to be exchanged.
158 | 2 0 1 7 S C O T I A B A N K A N N U A L R E P O R T

CO
NSO
LIDA
TEDFIN
AN
CIA
LSTA
TEMEN
TS
(b) Remaining term to maturityThe following table summarizes the remaining term to maturity of the notional amounts of the Bank’s derivative financial instruments by type:
As at October 31, 2017 ($ millions) Within one year One to five years Over five years Total
Interest rate contractsFutures $ 62,152 $ 98,731 $ 707 $ 161,590Forward rate agreements 282,062 47,999 – 330,061Swaps 971,003 1,172,422 659,918 2,803,343Options purchased 10,690 17,036 11,938 39,664Options written 5,809 23,800 11,384 40,993
1,331,716 1,359,988 683,947 3,375,651
Foreign exchange and gold contractsFutures 4,810 27,474 168 32,452Spot and forwards 401,461 47,210 64 448,735Swaps 96,767 185,747 102,353 384,867Options purchased 36,291 2,825 – 39,116Options written 37,309 2,719 – 40,028
576,638 265,975 102,585 945,198
Other derivative contractsEquity 73,983 26,514 893 101,390Credit 18,249 15,272 4,071 37,592Commodity and other contracts 50,253 37,021 141 87,415
142,485 78,807 5,105 226,397
Total $ 2,050,839 $ 1,704,770 $ 791,637 $ 4,547,246
As at October 31, 2016 ($ millions) Within one year One to five years Over five years Total
Interest rate contractsFutures $ 112,183 $ – $ 13 $ 112,196Forward rate agreements 279,035 30,872 – 309,907Swaps 663,184 1,114,988 516,362 2,294,534Options purchased 13,169 29,392 8,270 50,831Options written 6,956 24,700 8,491 40,147
1,074,527 1,199,952 533,136 2,807,615
Foreign exchange and gold contractsFutures 858 35,004 – 35,862Spot and forwards 400,914 47,590 786 449,290Swaps 61,029 203,554 88,879 353,462Options purchased 8,375 8,241 – 16,616Options written 9,690 6,555 – 16,245
480,866 300,944 89,665 871,475
Other derivative contractsEquity 63,485 24,265 158 87,908Credit 22,911 22,852 3,295 49,058Commodity and other contracts 37,001 41,612 140 78,753
123,397 88,729 3,593 215,719
Total $ 1,678,790 $ 1,589,625 $ 626,394 $ 3,894,809
(c) Credit riskAs with other financial assets, derivative instruments are subject to credit risk. Credit risk arises from the possibility that counterparties may default ontheir obligations to the Bank. However, whereas the credit risk of other financial assets is represented by the principal amount net of any applicableallowance for credit losses, the credit risk associated with derivatives is normally a small fraction of the notional amount of the derivative instrument.
Derivative contracts generally expose the Bank to credit loss if changes in market rates affect a counterparty’s position unfavourably and thecounterparty defaults on payment. Accordingly, exposure to credit risk of derivatives is represented by the positive fair value of the instrument.
Negotiated over-the-counter derivatives generally present greater credit exposure than exchange-traded contracts. The net change in the exchange-traded contracts is normally settled daily in cash with the exchange. Holders of these contracts look to the exchange for performance under thecontract.
The Bank strives to limit credit risk by dealing with counterparties that it believes are creditworthy, and investment grade counterparties account for asignificant portion of the credit risk exposure arising from the Bank’s derivative transactions as at October 31, 2017. To control credit risk associatedwith derivatives, the Bank uses the same credit risk management activities and procedures that are used in the lending business in assessing and
2 0 1 7 S C O T I A B A N K A N N U A L R E P O R T | 159
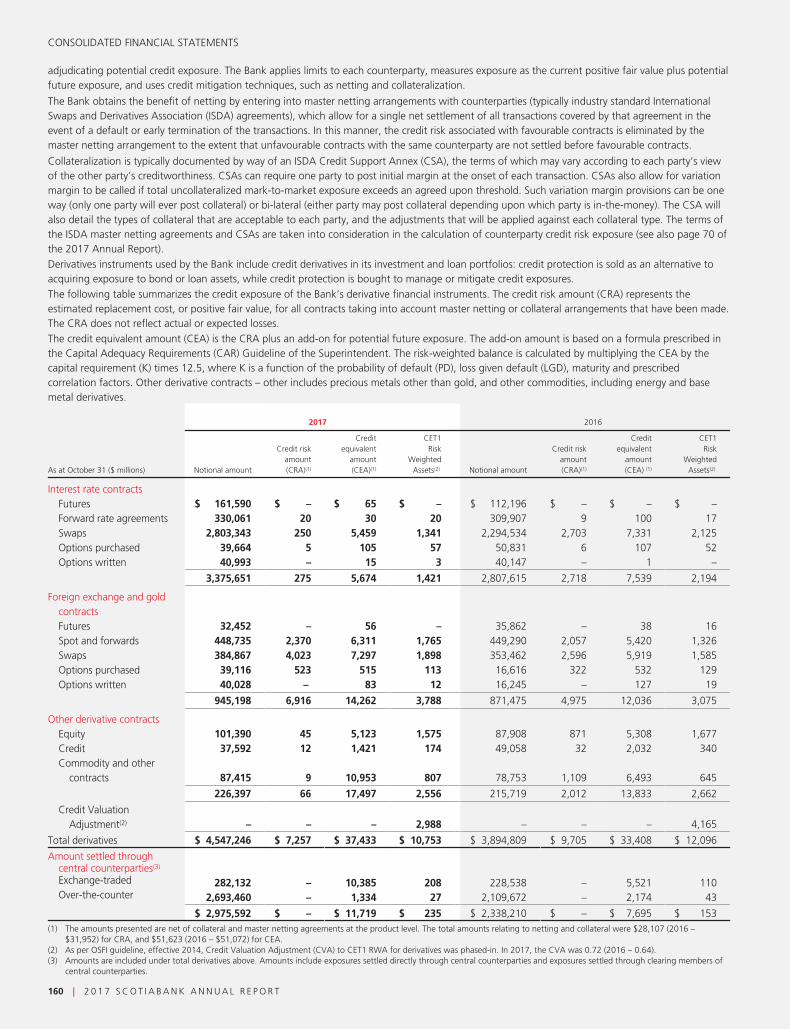
CONSOLIDATED FINANCIAL STATEMENTS
adjudicating potential credit exposure. The Bank applies limits to each counterparty, measures exposure as the current positive fair value plus potentialfuture exposure, and uses credit mitigation techniques, such as netting and collateralization.
The Bank obtains the benefit of netting by entering into master netting arrangements with counterparties (typically industry standard InternationalSwaps and Derivatives Association (ISDA) agreements), which allow for a single net settlement of all transactions covered by that agreement in theevent of a default or early termination of the transactions. In this manner, the credit risk associated with favourable contracts is eliminated by themaster netting arrangement to the extent that unfavourable contracts with the same counterparty are not settled before favourable contracts.
Collateralization is typically documented by way of an ISDA Credit Support Annex (CSA), the terms of which may vary according to each party’s viewof the other party’s creditworthiness. CSAs can require one party to post initial margin at the onset of each transaction. CSAs also allow for variationmargin to be called if total uncollateralized mark-to-market exposure exceeds an agreed upon threshold. Such variation margin provisions can be oneway (only one party will ever post collateral) or bi-lateral (either party may post collateral depending upon which party is in-the-money). The CSA willalso detail the types of collateral that are acceptable to each party, and the adjustments that will be applied against each collateral type. The terms ofthe ISDA master netting agreements and CSAs are taken into consideration in the calculation of counterparty credit risk exposure (see also page 70 ofthe 2017 Annual Report).Derivatives instruments used by the Bank include credit derivatives in its investment and loan portfolios: credit protection is sold as an alternative toacquiring exposure to bond or loan assets, while credit protection is bought to manage or mitigate credit exposures.The following table summarizes the credit exposure of the Bank’s derivative financial instruments. The credit risk amount (CRA) represents theestimated replacement cost, or positive fair value, for all contracts taking into account master netting or collateral arrangements that have been made.The CRA does not reflect actual or expected losses.The credit equivalent amount (CEA) is the CRA plus an add-on for potential future exposure. The add-on amount is based on a formula prescribed inthe Capital Adequacy Requirements (CAR) Guideline of the Superintendent. The risk-weighted balance is calculated by multiplying the CEA by thecapital requirement (K) times 12.5, where K is a function of the probability of default (PD), loss given default (LGD), maturity and prescribedcorrelation factors. Other derivative contracts – other includes precious metals other than gold, and other commodities, including energy and basemetal derivatives.
2017 2016
As at October 31 ($ millions) Notional amount
Credit riskamount(CRA)(1)
Creditequivalent
amount(CEA)(1)
CET1Risk
WeightedAssets(2) Notional amount
Credit riskamount(CRA)(1)
Creditequivalent
amount(CEA) (1)
CET1Risk
WeightedAssets(2)
Interest rate contractsFutures $ 161,590 $ – $ 65 $ – $ 112,196 $ – $ – $ –Forward rate agreements 330,061 20 30 20 309,907 9 100 17Swaps 2,803,343 250 5,459 1,341 2,294,534 2,703 7,331 2,125Options purchased 39,664 5 105 57 50,831 6 107 52Options written 40,993 – 15 3 40,147 – 1 –
3,375,651 275 5,674 1,421 2,807,615 2,718 7,539 2,194
Foreign exchange and goldcontractsFutures 32,452 – 56 – 35,862 – 38 16Spot and forwards 448,735 2,370 6,311 1,765 449,290 2,057 5,420 1,326Swaps 384,867 4,023 7,297 1,898 353,462 2,596 5,919 1,585Options purchased 39,116 523 515 113 16,616 322 532 129Options written 40,028 – 83 12 16,245 – 127 19
945,198 6,916 14,262 3,788 871,475 4,975 12,036 3,075
Other derivative contractsEquity 101,390 45 5,123 1,575 87,908 871 5,308 1,677Credit 37,592 12 1,421 174 49,058 32 2,032 340Commodity and other
contracts 87,415 9 10,953 807 78,753 1,109 6,493 645
226,397 66 17,497 2,556 215,719 2,012 13,833 2,662
Credit ValuationAdjustment(2) – – – 2,988 – – – 4,165
Total derivatives $ 4,547,246 $ 7,257 $ 37,433 $ 10,753 $ 3,894,809 $ 9,705 $ 33,408 $ 12,096
Amount settled throughcentral counterparties(3)
Exchange-traded 282,132 – 10,385 208 228,538 – 5,521 110Over-the-counter 2,693,460 – 1,334 27 2,109,672 – 2,174 43
$ 2,975,592 $ – $ 11,719 $ 235 $ 2,338,210 $ – $ 7,695 $ 153(1) The amounts presented are net of collateral and master netting agreements at the product level. The total amounts relating to netting and collateral were $28,107 (2016 –
$31,952) for CRA, and $51,623 (2016 – $51,072) for CEA.(2) As per OSFI guideline, effective 2014, Credit Valuation Adjustment (CVA) to CET1 RWA for derivatives was phased-in. In 2017, the CVA was 0.72 (2016 – 0.64).(3) Amounts are included under total derivatives above. Amounts include exposures settled directly through central counterparties and exposures settled through clearing members of
central counterparties.
160 | 2 0 1 7 S C O T I A B A N K A N N U A L R E P O R T

CO
NSO
LIDA
TEDFIN
AN
CIA
LSTA
TEMEN
TS
(d) Fair valueThe following table summarizes the fair value of derivatives segregated by type and segregated between trading and those derivatives designated inhedging relationships.
As at October 31 ($ millions) 2017 2017 2016
Average fair value Year-end fair value Year-end fair value(1)
Favourable Unfavourable Favourable Unfavourable Favourable Unfavourable
TradingInterest rate contracts
Forward rate agreements $ 35 $ 2 $ 27 $ 1 $ 63 $ 3Swaps 9,809 11,484 8,895 10,330 14,153 13,814Options 75 101 53 75 65 82
9,919 11,587 8,975 10,406 14,281 13,899
Foreign exchange and gold contractsForwards 5,786 5,907 5,973 5,223 5,939 5,362Swaps 10,589 10,134 10,945 8,774 11,506 12,369Options 678 618 730 681 410 325
17,053 16,659 17,648 14,678 17,855 18,056
Other derivative contractsEquity 2,010 3,129 2,274 3,233 1,905 2,380Credit 109 429 175 179 148 1,475Commodity and other contracts 1,689 2,228 1,576 2,049 2,212 2,403
3,808 5,786 4,025 5,461 4,265 6,258Trading derivatives’ market valuation $ 30,780 $ 34,032 $ 30,648 $ 30,545 $ 36,401 $ 38,213
HedgingInterest rate contracts
Swaps $ 803 $ 684 $ 1,426 $ 587
Foreign exchange and gold contractsForwards 634 215 333 241Swaps 3,218 2,756 3,471 3,346
$ 3,852 $ 2,971 $ 3,804 $ 3,587Other derivative contracts
Equity $ 61 $ – $ 26 $ –Hedging derivatives’ market valuation $ 4,716 $ 3,655 $ 5,256 $ 4,174
Total derivative financial instruments as per Statement ofFinancial Position $ 35,364 $ 34,200 $ 41,657 $ 42,387
Less: impact of master netting and collateral(2) 28,107 28,107 31,952 31,952Net derivative financial instruments(2) $ 7,257 $ 6,093 $ 9,705 $ 10,435(1) The average fair value of trading derivatives’ market valuation for the year ended October 31, 2016 was: favourable $38,623 and unfavourable $42,651. Average fair value
amounts are based on the latest 13 month-end balances.(2) Master netting agreement amounts are based on the capital adequacy criteria of the Basel Committee on Banking Supervision (BCBS) and OSFI. These criteria allow netting where
there are legally enforceable contracts which enable net settlement in the event of a default, bankruptcy, liquidation or similar circumstances.
(e) Hedging activitiesThe Bank’s hedging activities that qualify for hedge accounting consist of fair value hedges, cash flow hedges, and net investment hedges.
Ineffectiveness of hedge relationshipsDue to the ineffective portion of designated hedges, the Bank recorded the following amounts in non-interest income – other:
For the year ended October 31 ($ millions) 2017 2016
Fair value hedgesGain (loss) recorded on hedged items $ 574 $ 11Gain (loss) recorded on hedging instruments (588) (51)Ineffectiveness $ (14) $ (40)
Cash flow hedgesIneffectiveness $ 24 $ 11
Hedging instrumentsMarket valuation is disclosed by the type of relationship:
2017 2016
As at October 31 ($ millions) Favourable Unfavourable Favourable Unfavourable
Derivatives designated in fair value hedging relationships(1) $ 687 $ 751 $ 1,622 $ 643Derivatives designated in cash flow hedging relationships 3,746 2,749 3,568 3,291Derivatives designated in net investment hedging relationships(1) 283 155 66 240Total derivatives designated in hedging relationships $ 4,716 $ 3,655 $ 5,256 $ 4,174
(1) As at October 31, 2017, the fair value of non-derivative instruments designated as net investment hedges and fair value hedges was $6,183 (2016 – $6,905). These non-derivativehedging instruments are presented as deposits – financial institutions on the Consolidated Statement of Financial Position.
2 0 1 7 S C O T I A B A N K A N N U A L R E P O R T | 161

CONSOLIDATED FINANCIAL STATEMENTS
Cash flow hedgesThe period when cash flows of designated hedged items are expected to occur and impact the Consolidated Statement of Income are as follows:
As at October 31, 2017 ($ millions)Within
one yearWithin one
to five yearsMore than
five years
Cash inflows from assets $ 11,235 $ 19,866 $ 4,178Cash outflows from liabilities (31,542) (26,863) (4,746)
Net cash flows $ (20,307) $ (6,997) $ (568)
As at October 31, 2016 ($ millions)Within
one yearWithin one to
five yearsMore than
five years
Cash inflows from assets $ 12,672 $ 26,838 $ 8,998Cash outflows from liabilities (22,187) (30,870) (7,666)
Net cash flows $ (9,515) $ (4,032) $ 1,332
Income related to interest cash flows is recognized using the effective interest method over the life of the underlying instrument. Foreign currencygains and losses related to future cash flows of on-balance sheet monetary items are recognized as incurred. Forecasted revenue is recognized overthe period to which it relates.
10 Offsetting Financial Assets and Financial Liabilities
The Bank is eligible to present certain financial assets and financial liabilities as listed in the table below on a net basis on the Consolidated Statementof Financial Position pursuant to criteria described in Note 3 – Significant accounting policies.
The following tables provide information on the impact of offsetting on the Bank’s Consolidated Statement of Financial Position, as well as thefinancial impact of netting for instruments that are subject to enforceable master netting arrangements or similar agreements, but do not qualify foroffsetting in the Consolidated Statement of Financial Position, as well as available cash and financial instrument collateral.
As at October 31, 2017 ($ millions)
Types of financial assets
Gross amountsof recognized
financial assets
Gross amounts ofrecognized financial
liabilities offset inthe consolidated
statement offinancial position
Net amounts offinancial assets
presented in theconsolidatedstatement of
financial position
Related amounts not offsetin the consolidated statement
of financial position
Net amount(3)
Impact ofmaster nettingarrangements
or similaragreements(1) Collateral(2)
Derivative financial instruments(4) $ 49,512 $ (14,148) $ 35,364 $ (22,400) $ (5,915) $ 7,049Securities purchased under resale agreements
and securities borrowed 106,721 (11,402) 95,319 (11,649) (75,675) 7,995
Total $ 156,233 $ (25,550) $ 130,683 $ (34,049) $ (81,590) $ 15,044
As at October 31, 2017 ($ millions)
Types of financial liabilities
Gross amountsof recognized
financial liabilities
Gross amounts ofrecognized financial
assets offset inthe consolidated
statement offinancial position
Net amounts offinancial liabilitiespresented in the
consolidatedstatement of
financial position
Related amounts not offsetin the consolidated statement
of financial position
Net amount
Impact ofmaster nettingarrangements
or similaragreements(1) Collateral(2)
Derivative financial instruments(4) $ 48,348 $ (14,148) $ 34,200 $ (22,400) $ (4,700) $ 7,100Obligations related to securities sold under
repurchase agreements and securities lent 107,245 (11,402) 95,843 (11,649) (72,311) 11,883
Total $ 155,593 $ (25,550) $ 130,043 $ (34,049) $ (77,011) $ 18,983
(1) Amounts that are subject to master netting arrangements or similar agreements but were not offset in the Consolidated Statement of Financial Position because they did not meetthe net settlement/simultaneous settlement criteria; or because the rights of set off are conditional upon the default of the counterparty only.
(2) Cash and financial instrument collateral amounts received or pledged in relation to the total amounts of financial assets and financial liabilities, including those that were not offsetin the Consolidated Statement of Financial Position. These amounts are disclosed at fair value and the rights of set off are conditional upon the default of the counterparty.
(3) Not intended to represent the Bank’s actual exposure to credit risk, as a variety of credit mitigation strategies are employed in addition to offsetting and collateral arrangements.(4) For fiscal 2017, the cash collateral received against the positive market values of derivative financial instruments of $793 and the cash collateral pledged towards the negative mark
to market of derivative financial instruments of $1,112 are recorded within other liabilities and other assets, respectively.
162 | 2 0 1 7 S C O T I A B A N K A N N U A L R E P O R T

CO
NSO
LIDA
TEDFIN
AN
CIA
LSTA
TEMEN
TS
As at October 31, 2016 ($ millions)
Types of financial assets
Gross amountsof recognized
financial assets
Gross amounts ofrecognized financial
liabilities offset inthe consolidated
statement offinancial position
Net amounts offinancial assets
presented in theconsolidatedstatement of
financial position
Related amounts not offsetin the consolidated statement
of financial position
Impact ofmaster nettingarrangements
or similaragreements(1) Collateral(2) Net amount(3)
Derivative financial instruments(4) $ 63,329 $ (21,672) $ 41,657 $ (25,115) $ (7,184) $ 9,358Securities purchased under resale agreements
and securities borrowed 98,909 (6,780) 92,129 (9,447) (75,365) 7,317
Total $ 162,238 $ (28,452) $ 133,786 $ (34,562) $ (82,549) $ 16,675
As at October 31, 2016 ($ millions)
Types of financial liabilities
Gross amountsof recognized
financial liabilities
Gross amounts ofrecognized financial
assets offset inthe consolidated
statement offinancial position
Net amounts offinancial liabilitiespresented in the
consolidatedstatement of
financial position
Related amounts not offsetin the consolidated statement
of financial position
Impact ofmaster nettingarrangements
or similaragreements(1) Collateral(2) Net amount
Derivative financial instruments(4) $ 64,059 $ (21,672) $ 42,387 $ (25,115) $ (7,318) $ 9,954Obligations related to securities sold under
repurchase agreements and securities lent 103,863 (6,780) 97,083 (9,447) (73,929) 13,707
Total $ 167,922 $ (28,452) $ 139,470 $ (34,562) $ (81,247) $ 23,661(1) Amounts that are subject to master netting arrangements or similar agreements but were not offset in the Consolidated Statement of Financial Position because they did not meet
the net settlement/simultaneous settlement criteria; or because the rights of set off are conditional upon the default of the counterparty only.(2) Cash and financial instrument collateral amounts received or pledged in relation to the total amounts of financial assets and financial liabilities, including those that were not offset
in the Consolidated Statement of Financial Position. These amounts are disclosed at fair value and the rights of set off are conditional upon the default of the counterparty.(3) Not intended to represent the Bank’s actual exposure to credit risk, as a variety of credit mitigation strategies are employed in addition to offsetting and collateral arrangements.(4) For fiscal 2016, the cash collateral received against the positive market values of derivative financial instruments of $1,398 and the cash collateral pledged towards the negative
mark to market of derivative financial instruments of $875 are recorded within other liabilities and other assets, respectively.
2 0 1 7 S C O T I A B A N K A N N U A L R E P O R T | 163

CONSOLIDATED FINANCIAL STATEMENTS
11 Investment Securities
Investment securities includes held-to-maturity securities and available-for-sale securities.
(a) An analysis of the carrying value of investment securities is as follows:
Remaining term to maturity
As at October 31, 2017 ($ millions)
Withinthree
months
Three totwelve
monthsOne to
five yearsFive to
ten yearsOver ten
yearsNo specific
maturityCarrying
value
Available-for-saleCanadian federal government issued or
guaranteed debt $ 8 $ 291 $ 9,780 $ 905 $ 1,109 $ – $ 12,093Yield(1) % 0.9 1.1 1.1 2.7 3.2 – 1.4
Canadian provincial and municipal debt 99 737 3,698 284 5 – 4,823Yield(1) % 0.6 1.5 1.7 2.4 2.9 – 1.7
U.S. treasury and other U.S. agency debt 106 1,260 2,374 2,704 228 – 6,672Yield(1) % 1.0 1.5 1.0 1.6 1.5 – 1.3
Other foreign government debt 7,810 5,283 5,313 1,259 138 – 19,803Yield(1) % 0.6 2.8 4.1 5.7 6.2 – 2.5
Other debt 1,082 1,541 2,784 210 185 – 5,802Yield(1) % 0.6 0.8 1.6 2.5 2.5 – 1.2
Preferred shares – – – – – 311 311Common shares – – – – – 1,000 1,000
Total available-for-sale securities 9,105 9,112 23,949 5,362 1,665 1,311 50,504
Held-to-maturityCanadian federal and provincial government
issued or guaranteed debt 65 860 4,854 – – – 5,779U.S. treasury and other U.S. agency debt 1,290 – 2,703 – – – 3,993Other foreign government debt – 683 1,914 102 6 – 2,705Corporate debt 167 821 5,300 – – – 6,288
Total held-to-maturity assets 1,522 2,364 14,771 102 6 – 18,765
Total investment securities $ 10,627 $ 11,476 $ 38,720 $ 5,464 $ 1,671 $ 1,311 $ 69,269
Total by currency (in Canadian equivalent):Canadian dollar $ 76 $ 1,165 $ 15,500 $ 1,276 $ 1,130 $ 539 $ 19,686U.S. dollar 1,961 4,178 19,344 3,023 419 372 29,297Mexican peso 420 579 1,568 285 – 9 2,861Other currencies 8,170 5,554 2,308 880 122 391 17,425
Total investment securities $ 10,627 $ 11,476 $ 38,720 $ 5,464 $ 1,671 $ 1,311 $ 69,269(1) Represents the weighted-average yield of fixed income securities.
164 | 2 0 1 7 S C O T I A B A N K A N N U A L R E P O R T

CO
NSO
LIDA
TEDFIN
AN
CIA
LSTA
TEMEN
TS
Remaining term to maturity
As at October 31, 2016 ($ millions)
Withinthree
months
Three totwelve
monthsOne to
five yearsFive to
ten yearsOver ten
yearsNo specific
maturityCarrying
value
Available-for-saleCanadian federal government issued or guaranteed
debt $ 51 $ 53 $ 11,507 $ 857 $ 1,153 $ – $ 13,621Yield(1) % 0.8 1.0 1.0 2.5 3.0 – 1.3
Canadian provincial and municipal debt – 252 2,869 352 19 – 3,492Yield(1) % 0.0 1.0 1.4 2.1 2.9 – 1.5
U.S. treasury and other U.S. agency debt 481 2,134 5,823 1,296 343 – 10,077Yield(1) % 0.3 0.6 1.0 0.9 1.2 – 0.9
Other foreign government debt 4,645 3,620 5,602 1,424 240 – 15,531Yield(1) % 1.7 3.0 3.2 4.4 5.2 – 2.9
Other debt 846 1,145 3,454 81 179 – 5,705Yield(1) % 1.7 0.1 1.4 3.0 2.5 – 1.2
Preferred shares – – – – – 264 264Common shares – – – – – 1,819 1,819
Total available-for-sale securities 6,023 7,204 29,255 4,010 1,934 2,083 50,509
Held-to-maturityCanadian federal and provincial government issued
or guaranteed debt 123 432 5,335 281 – – 6,171U.S. treasury and other U.S. agency debt – 335 4,281 – – – 4,616Other foreign government debt – 344 2,547 7 – – 2,898Corporate debt 523 1,578 6,617 7 – – 8,725
Total held-to-maturity assets 646 2,689 18,780 295 – – 22,410
Total investment securities $ 6,669 $ 9,893 $ 48,035 $ 4,305 $ 1,934 $ 2,083 $ 72,919
Total by currency (in Canadian equivalent):Canadian dollar $ 8 $ 430 $ 16,588 $ 1,239 $ 1,192 $ 721 $ 20,178U.S. dollar 1,485 5,146 26,959 2,086 514 930 37,120Mexican peso 878 264 1,496 247 77 12 2,974Other currencies 4,298 4,053 2,992 733 151 420 12,647
Total investment securities $ 6,669 $ 9,893 $ 48,035 $ 4,305 $ 1,934 $ 2,083 $ 72,919(1) Represents the weighted-average yield of fixed income securities.
(b) An analysis of unrealized gains and losses on available-for-sale securities is as follows:
As at October 31, 2017 ($ millions) Cost
Grossunrealized
gains
Grossunrealized
losses Fair value
Canadian federal government issued or guaranteed debt $ 12,069 $ 119 $ 95 $ 12,093Canadian provincial and municipal debt 4,839 13 29 4,823U.S. treasury and other U.S. agency debt 6,761 1 90 6,672Other foreign government debt 19,788 49 34 19,803Other debt 5,792 34 24 5,802Preferred shares 397 1 87 311Common shares 899 164 63 1,000
Total available-for-sale securities $ 50,545 $ 381 $ 422 $ 50,504
As at October 31, 2016 ($ millions) Cost
Grossunrealized
gains
Grossunrealized
losses Fair value
Canadian federal government issued or guaranteed debt $ 13,347 $ 280 $ 6 $ 13,621Canadian provincial and municipal debt 3,469 33 10 3,492U.S. treasury and other U.S. agency debt 10,050 53 26 10,077Other foreign government debt 15,490 62 21 15,531Other debt 5,650 59 4 5,705Preferred shares 414 10 160 264Common shares 1,634 243 58 1,819
Total available-for-sale securities $ 50,054 $ 740 $ 285 $ 50,509
The net unrealized loss on available-for-sale securities of $41 million (2016 – gain of $455 million) increases to a net unrealized loss of $48 million(2016 – gain of $26 million) after the impact of qualifying hedges is taken into account. The net unrealized loss on available-for-sale securities isrecorded in Accumulated Other Comprehensive Income.
2 0 1 7 S C O T I A B A N K A N N U A L R E P O R T | 165

CONSOLIDATED FINANCIAL STATEMENTS
(c) An analysis of the fair value and carrying value of held-to-maturity securities is as follows:
Fair value Carrying value
As at October 31 ($ millions) 2017 2016 2017 2016
Canadian federal and provincial government issued or guaranteed debt $ 5,748 $ 6,207 $ 5,779 $ 6,171U.S. treasury and other U.S. agency debt 3,991 4,672 3,993 4,616Other foreign government debt 2,690 2,901 2,705 2,898Corporate debt 6,287 8,787 6,288 8,725
Total held-to-maturity securities $ 18,716 $ 22,567 $ 18,765 $ 22,410
(d) An analysis of available-for-sale securities with continuous unrealized losses:
Less than twelve months Twelve months or greater Total
As at October 31, 2017 ($ millions) Cost Fair valueUnrealized
losses Cost Fair valueUnrealized
losses Cost Fair valueUnrealized
losses
Canadian federal government issued orguaranteed debt $ 4,457 $ 4,414 $ 43 $ 1,944 $ 1,892 $ 52 $ 6,401 $ 6,306 $ 95
Canadian provincial and municipal debt 2,547 2,525 22 237 230 7 2,784 2,755 29U.S. treasury and other U.S. agency debt 4,653 4,624 29 1,881 1,820 61 6,534 6,444 90Other foreign government debt 11,082 11,058 24 419 409 10 11,501 11,467 34Other debt 2,440 2,418 22 322 320 2 2,762 2,738 24Preferred shares – – – 380 293 87 380 293 87Common shares 140 121 19 202 158 44 342 279 63
Total available-for-sale securities $ 25,319 $ 25,160 $ 159 $ 5,385 $ 5,122 $ 263 $ 30,704 $ 30,282 $ 422
Less than twelve months Twelve months or greater Total
As at October 31, 2016 ($ millions) Cost Fair valueUnrealized
losses Cost Fair valueUnrealized
losses Cost Fair valueUnrealized
losses
Canadian federal government issued orguaranteed debt $ 1,867 $ 1,861 $ 6 $ 1,104 $ 1,104 $ – $ 2,971 $ 2,965 $ 6
Canadian provincial and municipal debt 807 798 9 193 192 1 1,000 990 10U.S. treasury and other U.S. agency debt 2,238 2,212 26 – – – 2,238 2,212 26Other foreign government debt 2,812 2,799 13 575 567 8 3,387 3,366 21Other debt 877 875 2 409 407 2 1,286 1,282 4Preferred shares 6 6 – 382 222 160 388 228 160Common shares 303 280 23 140 105 35 443 385 58Total available-for-sale securities $ 8,910 $ 8,831 $ 79 $ 2,803 $ 2,597 $ 206 $ 11,713 $ 11,428 $ 285
As at October 31, 2017, the cost of 631 (2016 – 474) available-for-sale securities exceeded their fair value by $422 million (2016 – $285 million). Thisunrealized loss is recorded in accumulated other comprehensive income as part of unrealized gains (losses) on available-for- sale securities. Of the 631(2016 – 474) available-for-sale securities, 142 (2016 – 140) have been in an unrealized loss position continuously for more than a year, amounting toan unrealized loss of $263 million (2016 – $206 million).
Investment securities are considered to be impaired only if objective evidence indicates one or more loss events have occurred and have affected theestimated future cash flows after considering available collateral.
Collateral is not generally obtained directly from the issuers of debt securities. However, certain debt securities may be collateralized by specificallyidentified assets that would be obtainable in the event of default.
Investment securities are evaluated for impairment at the end of each reporting date, or more frequently, if events or changes in circumstancesindicate the existence of objective evidence of impairment.
(e) Net gain on sale of investment securitiesAn analysis of net gain on sale of investment securities is as follows:
For the year ended October 31 ($ millions) 2017 2016 2015
Net realized gains $ 399 $ 570 $ 646Impairment losses(1) 19 36 7Net gain on sale of investment securities $ 380 $ 534 $ 639(1) Impairment losses (gains) are comprised of $14 from equity securities (2016 – $36; 2015 – $8) and $5 from other debt securities (2016 – nil; 2015 – $(1)).
166 | 2 0 1 7 S C O T I A B A N K A N N U A L R E P O R T

CO
NSO
LIDA
TEDFIN
AN
CIA
LSTA
TEMEN
TS
12 Loans, Impaired Loans and Allowance for Credit Losses
(a) Loans and acceptances outstanding by geography(1)
As at October 31 ($ millions) 2017 2016
Canada:Residential mortgages $ 205,793 $ 193,303Personal and credit cards 77,790 74,698Business and government 52,935 48,653
336,518 316,654
United States:Personal and credit cards 1,228 1,844Business and government 35,702 36,613
36,930 38,457
Mexico:Residential mortgages 6,911 6,346Personal and credit cards 3,584 3,079Business and government 13,635 11,384
24,130 20,809
Chile:Residential mortgages 7,302 6,300Personal and credit cards 5,331 4,632Business and government 10,109 8,466
22,742 19,398
Peru:Residential mortgages 2,735 2,586Personal and credit cards 5,092 4,573Business and government 10,617 10,661
18,444 17,820
Colombia:Residential mortgages 1,999 1,497Personal and credit cards 3,591 3,850Business and government 3,838 3,948
9,428 9,295
Other International:Residential mortgages 12,176 12,855Personal and credit cards 6,715 6,827Business and government 41,613 42,675
60,504 62,357
Total loans 508,696 484,790
Acceptances(2) 13,560 11,978
Total loans and acceptances(3) 522,256 496,768
Allowance for credit losses (4,327) (4,626)
Total loans and acceptances net of allowances for loan losses $ 517,929 $ 492,142
(1) Geographic segmentation is based on the location of the property for residential mortgages; otherwise, the residence of the borrower.(2) 1% of borrowers reside outside Canada.(3) Loans and acceptances denominated in U.S. dollars were $100,452 (2016 – $103,503), in Mexican pesos $18,857 (2016 – $15,954), Chilean pesos $17,824 (2016 – $15,214), and
in other foreign currencies $44,176 (2016 – $44,870).
2 0 1 7 S C O T I A B A N K A N N U A L R E P O R T | 167

CONSOLIDATED FINANCIAL STATEMENTS
(b) Loan maturities
As at October 31, 2017 Remaining term to maturity Rate sensitivity
($ millions)Within
one yearOne to
five yearsFive to
ten yearsOver
ten yearsNo specific
maturity Total Floating Fixed rateNon-ratesensitive Total
Residential mortgages $ 45,462 $ 171,908 $ 9,098 $ 8,919 $ 1,529 $ 236,916 $ 56,862 $ 178,044 $ 2,010 $ 236,916Personal and credit cards 15,952 31,500 4,478 815 50,586 103,331 43,737 58,508 1,086 103,331Business and government 77,724 80,124 4,597 760 5,244 168,449 119,515 47,162 1,772 168,449
Total $ 139,138 $ 283,532 $ 18,173 $ 10,494 $ 57,359 $ 508,696 $ 220,114 $ 283,714 $ 4,868 $ 508,696
Allowance for credit losses – – – – (4,327) (4,327) – – (4,327) (4,327)
Total loans net of allowancefor credit losses $ 139,138 $ 283,532 $ 18,173 $ 10,494 $ 53,032 $ 504,369 $ 220,114 $ 283,714 $ 541 $ 504,369
As at October 31, 2016 Remaining term to maturity Rate sensitivity
($ millions)Within
one yearOne to
five yearsFive to
ten yearsOver
ten yearsNo specific
maturity Total Floating Fixed rateNon-ratesensitive Total
Residential mortgages $ 41,127 $ 160,713 $ 9,745 $ 9,520 $ 1,783 $ 222,888 $ 55,543 $ 165,189 $ 2,156 $ 222,888Personal and credit cards 14,107 31,191 4,820 993 48,391 99,502 40,163 58,439 900 99,502Business and government 70,051 79,960 6,278 495 5,616 162,400 111,384 48,183 2,833 162,400
Total loans $ 125,285 $ 271,864 $ 20,843 $ 11,008 $ 55,790 $ 484,790 $ 207,090 $ 271,811 $ 5,889 $ 484,790Allowance for credit losses – – – – (4,626) (4,626) – – (4,626) (4,626)
Total loans net of allowancefor credit losses $ 125,285 $ 271,864 $ 20,843 $ 11,008 $ 51,164 $ 480,164 $ 207,090 $ 271,811 $ 1,263 $ 480,164
(c) Impaired loans(1)(2)
2017 2016
As at October 31 ($ millions)
Grossimpaired
loans(1)
Allowancefor credit
losses Net
Grossimpaired
loans(1)
Allowancefor credit
losses Net
Residential mortgages $ 1,445 $ 326(3) $ 1,119 $ 1,608 $ 458(3) $ 1,150Personal and credit cards 1,610 1,583(3) 27 1,622 1,596 (3) 26Business and government 1,810 713(4) 1,097 2,164 894 (4) 1,270
Total $ 4,865 $ 2,622 $ 2,243 $ 5,394 $ 2,948 $ 2,446
By geography:Canada $ 1,049 $ 1,258United States 140 210Mexico 303 301Peru 704 764Chile 565 499Colombia 462 381Other International 1,642 1,981
Total $ 4,865 $ 5,394(1) Interest income recognized on impaired loans during the year ended October 31, 2017 was $23 (2016 – $18).(2) Excludes loans acquired under FDIC guarantee related to the acquisition of R-G Premier Bank of Puerto Rico. For loans where the guarantee has expired, the total amount of loans
considered impaired is $59 (2016 – $94).(3) Allowance for credit losses for residential mortgages and personal and credit card loans is assessed on a collective basis.(4) Allowance for credit losses for business and government loans is individually assessed.
For the years ended October 31, 2017 and 2016, the Bank would have recorded additional interest income of $363 million and $367 million,respectively, on impaired loans, if these impaired loans were classified as performing loans.
168 | 2 0 1 7 S C O T I A B A N K A N N U A L R E P O R T

CO
NSO
LIDA
TEDFIN
AN
CIA
LSTA
TEMEN
TS
(d) Allowance for credit losses
As at October 31, 2017
($ millions)
Balance atbeginning
of year Write-offs(1) Recoveries
Provisionfor credit
losses
Other, includingforeign currency
adjustment(3)
Balance atend of
year
Individual $ 894 $ (501) $ 55 $ 304 $ (39) $ 713Collective 3,498 (2,658) 571 1,952 (8) 3,355
Total before loans acquired under FDIC guarantee 4,392 (3,159) 626 2,256 (47) 4,068Loans acquired under FDIC guarantee(2) 234 (14) 54 (7) (8) 259
$ 4,626 $ (3,173) $ 680 $ 2,249 $ (55) $ 4,327
As at October 31, 2016
($ millions)
Balance atbeginning
of year Write-offs(1) Recoveries
Provisionfor credit
losses
Other, includingforeign currency
adjustment(3)
Balance atend of
year
Individual $ 717 $ (428) $ 40 $ 585 $ (20) $ 894Collective 3,260 (2,151) 542 1,827 20 3,498
Total before loans acquired under FDIC guarantee 3,977 (2,579) 582 2,412 – 4,392Loans acquired under FDIC guarantee(2) 220 (9) 18 – 5 234
$ 4,197 $ (2,588) $ 600 $ 2,412 $ 5 $ 4,626
2017 2016
Represented by:Allowance against impaired loans $ 2,622 $ 2,948Allowance against performing loans and loans past due but not impaired(4) 1,446 1,444
Total before loans acquired under FDIC guarantee 4,068 4,392Loans acquired under FDIC guarantee(2) 259 234
$ 4,327 $ 4,626
(1) For the wholesale portfolios, impaired loans restructured during the year amounted to $260 (2016 – $111). Write-offs of impaired loans restructured during the year were $12(2016 – nil). Non-impaired loans restructured during the year amounted to $104 (2016 – $55).
(2) This represents the gross amount of allowance for credit losses as the receivable from FDIC is separately recorded in other assets.(3) Includes rebalancing of reserves between off-balance sheet and on-balance sheet credit exposures.(4) The allowance for performing loans is attributable to business and government loans $625 (2016 – $662) with the remainder allocated to personal and credit card loans $720
(2016 – $662) and residential mortgages $101 (2016 – $120).
(e) Loans acquired under FDIC guarantee
As at October 31, 2017 ($ millions)
Non-singlefamily home
loans
Singlefamily home
loans Total
R-G Premier BankNet carrying value 412 1,508 1,920Allowance for credit losses (138) (121) (259)
$ 274 $1,387 $1,661
As at October 31, 2016 ($ millions)
Non-singlefamily home
loans
Singlefamily home
loans Total
R-G Premier BankNet carrying value 488 1,728 2,216Allowance for credit losses (157) (77) (234)
$ 331 $1,651 $1,982
Loans purchased as part of the acquisition of R-G Premier Bank of Puerto Rico are subject to loss share agreements with the FDIC. Under thisagreement, the FDIC guarantees 80% of loan losses. The provision for credit losses in the Consolidated Statement of Income related to these loans isreflected net of the amount expected to be reimbursed by the FDIC. Allowance for credit losses in the Consolidated Statement of Financial Position isreflected on a gross basis. The FDIC guarantee on non-single family loans expired in 2015. The guarantee for single family home loans will expire inApril 2020.
A net receivable of $106 million (2016 – $116 million) from the FDIC is included in Other assets in the Consolidated Statement of Financial Position.
2 0 1 7 S C O T I A B A N K A N N U A L R E P O R T | 169

CONSOLIDATED FINANCIAL STATEMENTS
(f) Loans past due but not impaired(1)
A loan is considered past due when a counterparty has not made a payment by the contractual due date. The following table presents the carryingvalue of loans that are contractually past due but not classified as impaired because they are either less than 90 days past due or fully secured andcollection efforts are reasonably expected to result in repayment, or restoring it to a current status in accordance with the Bank’s policy.
2017(2)(3) 2016(2)(3)
As at October 31 ($ millions)31 – 60
days61 – 90
days
91 daysand
greater Total31 – 60
days61 – 90
days
91 daysand
greater Total
Residential mortgages $ 1,035 $ 446 $ 122 $ 1,603 $ 1,194 $ 472 $ 123 $ 1,789Personal and credit cards 724 423 75 1,222 784 447 94 1,325Business and government 215 55 187 457 186 44 189 419Total $ 1,974 $ 924 $ 384 $ 3,282 $ 2,164 $ 963 $ 406 $ 3,533
(1) Loans past due 30 days or less are not presented in this analysis as they are not administratively considered past due.(2) Excludes loans acquired under the FDIC guarantee related to the acquisition of R-G Premier Bank of Puerto Rico.(3) These loans would be considered in the determination of an appropriate level of collective allowances despite not being individually classified as impaired.
13 Derecognition of Financial Assets
Securitization of residential mortgage loansThe Bank securitizes fully insured residential mortgage loans, Bank originated and others, through the creation of mortgage backed securities (MBS)under the National Housing Act (NHA) MBS program, sponsored by Canada Mortgage Housing Corporation (CMHC). MBS created under the programare sold to Canada Housing Trust (the Trust), a government sponsored entity, under the Canada Mortgage Bond (CMB) program and/or third-partyinvestors. The Trust issues securities to third-party investors.
The sale of mortgages under the above programs does not meet the derecognition requirements, as the Bank retains the pre-payment and interestrate risk associated with the mortgages, which represents substantially all the risk and rewards associated with the transferred assets.
The transferred mortgages continue to be recognized on the Consolidated Statement of Financial Position as residential mortgage loans. Cashproceeds from the transfer are treated as secured borrowings and included in Deposits – Business and government on the Consolidated Statement ofFinancial Position.
The following table provides the carrying amount of transferred assets that do not qualify for derecognition and the associated liabilities:
As at October 31 ($ millions) 2017(1) 2016(1)
AssetsCarrying value of residential mortgage loans $ 18,178 $ 17,570Other related assets(2) 2,293 3,102LiabilitiesCarrying value of associated liabilities 19,278 19,836
(1) The fair value of the transferred assets is $20,580 (2016 – $20,776) and the fair value of the associated liabilities is $19,863 (2016 – $20,493), for a net position of $717 (2016 –$283).
(2) These include cash held in trust and trust permitted investment assets acquired as part of principal reinvestment account that the Bank is required to maintain in order to participatein the programs.
Securitization of personal lines of credit, credit cards and auto loansThe Bank securitizes a portion of its unsecured personal lines of credit, credit card and auto loan receivables through consolidated structured entities.These receivables continue to be recognized on the Consolidated Statement of Financial Position as personal and credit cards loans. For further details,refer to Note 14.
Securities sold under repurchase agreements and securities lentThe Bank enters into transactions, such as repurchase agreements and securities lending agreements, where the Bank transfers assets underagreements to repurchase them on a future date and retains all the substantial risks and rewards associated with the assets. The transferred assetsremain on the Consolidated Statement of Financial Position.
The following table provides the carrying amount of the transferred assets and the associated liabilities:
As at October 31 ($ millions) 2017(1) 2016(1)
Carrying value of assets associated with:Repurchase agreements(2) $ 86,789 $ 87,402Securities lending agreements 40,535 38,668
Total 127,324 126,070
Carrying value of associated liabilities(3) $ 95,843 $ 97,033(1) The fair value of transferred assets is $127,324 (2016 – $126,070) and the fair value of the associated liabilities is $95,843 (2016 – $97,033), for a net position of $31,481 (2016 –
$29,037).(2) Does not include over-collateralization of assets pledged.(3) Liabilities for securities lending arrangements only include amounts related to cash collateral received. In most cases, securities are received as collateral.
170 | 2 0 1 7 S C O T I A B A N K A N N U A L R E P O R T

CO
NSO
LIDA
TEDFIN
AN
CIA
LSTA
TEMEN
TS
14 Structured Entities
(a) Consolidated structured entities
U.S. multi-seller conduitThe Bank-sponsored U.S. multi-seller conduit purchases high-quality financial assets from independent third parties (the sellers) funded by the issuanceof highly rated asset-backed commercial paper. The sellers continue to service the financial assets and provide credit enhancements throughovercollateralization protection and cash reserves.
Each asset purchased by the conduit has a deal-specific liquidity facility provided by the Bank in the form of a liquidity asset purchase agreement(LAPA). The primary purpose of the backstop liquidity facility is to provide an alternative source of financing in the event the conduit is unable toaccess the asset-backed commercial paper market. The administration agent can require the Bank in its capacity as liquidity provider to perform underits asset-specific LAPA agreements, in which case the Bank is obliged to purchase an interest in the related assets owned by the conduit. The Bank isnot obligated to perform under the LAPA agreements in the event the conduit itself is insolvent.
The Bank’s liquidity agreements with the conduit call for the Bank to fund full par value of the assets, including defaulted assets, if any, of theconduit. This facility is available to absorb the losses on defaulted assets, if any, in excess of losses absorbed by deal-specific seller creditenhancements. Further, the Bank holds the subordinated note issued by the conduit.
The Bank’s exposure from the U.S. conduit through the LAPA, including the obligation to purchase defaulted assets and investment in the conduit’ssubordinated note, give the Bank the obligation to absorb losses that could potentially be significant to the conduit, which in conjunction with powerto direct the conduit’s activities, result in the Bank consolidating the U.S. multi-seller conduit.
The conduit’s assets are primarily included in business and government loans on the Bank’s Consolidated Statement of Financial Position.
There are contractual restrictions on the ability of the Bank’s consolidated U.S. multi-seller conduit to transfer funds to the Bank. The Bank is restrictedfrom accessing the conduit’s assets under the relevant arrangements. The Bank has no rights to the assets owned by the conduit. In the normal courseof business, the assets of the conduit can only be used to settle the obligations of the conduit.
Bank funding vehiclesThe Bank uses funding vehicles to facilitate cost-efficient financing of its own operations, including the issuance of covered bonds and notes. Thesevehicles include Scotia Covered Bond Trust, Scotiabank Covered Bond Guarantor Limited Partnership, Hollis Receivables Term Trust II, Trillium CreditCard Trust II and Securitized Term Auto Receivables Trust 2016-1, 2017-1, and 2017-2.
Activities of these structured entities are generally limited to holding an interest in a pool of assets or receivables generated by the Bank.
These structured entities are consolidated due to the Bank’s decision-making power and ability to use the power to affect the Bank’s returns.
Covered bond programsScotia Covered Bond TrustUnder the Bank’s global covered bond program, the Bank issued debt to investors that is guaranteed by Scotia Covered Bond Trust (the “Trust”).Under the program, the Trust purchased CMHC insured residential mortgages from the Bank, which it acquired with funding provided by the Bank.
All of the Bank’s outstanding covered bonds issued under this program have matured in March 2017. As at October 31, 2016, $6.0 billion coveredbonds were outstanding and included in Deposits – Business and government on the Consolidated Statement of Financial Position and $4.8 billionassets pledged in relation to these covered bonds were insured residential mortgages denominated in Canadian dollars.
Scotiabank Covered Bond Guarantor Limited PartnershipThe Bank has a registered covered bond program through which it issues debt that is guaranteed by Scotiabank Covered Bond Guarantor LimitedPartnership (the “LP”). Under this program, the LP purchases uninsured residential mortgages from the Bank, which it acquires with funding providedby the Bank.
As at October 31, 2017, $25.7 billion (2016 – $23.9 billion) covered bonds were outstanding and included in Deposits – Business and government onthe Consolidated Statement of Financial Position. The Bank’s outstanding covered bonds are denominated in U.S. dollars, Australian dollars, Britishpounds and Euros. As at October 31, 2017, assets pledged in relation to these covered bonds were uninsured residential mortgages denominated inCanadian dollars of $27.8 billion (2016 – $25.7 billion).
Personal line of credit securitization trustThe Bank securitizes a portion of its unsecured personal line of credit receivables (receivables) through Hollis Receivables Term Trust II (Hollis), a Bank-sponsored structured entity. Hollis issues notes to third-party investors and the Bank, proceeds of which are used to purchase co-ownership interestsin receivables originated by the Bank. Recourse of the note holders is limited to the purchased interests.
The Bank is responsible for servicing the transferred receivables as well as performing administrative functions for Hollis. The subordinated notesissued by Hollis are held by the Bank. As at October 31, 2017, $1 billion notes (2016 – $1.5 billion) were outstanding and included in Deposits –Business and government on the Consolidated Statement of Financial Position. As at October 31, 2017, assets pledged in relation to these notes were$1.3 billion (2016 – $1.8 billion).
Credit card receivables securitization trustThe Bank securitizes a portion of its credit card receivables (receivables) through Trillium Credit Card Trust II (Trillium), a Bank-sponsored structuredentity. Trillium issues notes to third-party investors and the Bank, and the proceeds of such issuance are used to purchase co-ownership interests inreceivables originated by the Bank. Recourse of the note holders is limited to the purchased interest.
The Bank is responsible for servicing the transferred receivables as well as performing administrative functions for Trillium. The subordinated notesissued by Trillium are held by the Bank. As at October 31, 2017, US $0.9 billion ($1.2 billion Canadian dollars) (2016 – US $0.9 billion, $1.2 billion
2 0 1 7 S C O T I A B A N K A N N U A L R E P O R T | 171

CONSOLIDATED FINANCIAL STATEMENTS
Canadian dollars) Class A notes were outstanding and included in Deposits – Business and government on the Consolidated Statement of FinancialPosition. As at October 31, 2017 assets pledged in relation to these notes were credit card receivables, denominated in Canadian dollars, of$1.3 billion (2016 – $1.3 billion).
Auto loan receivables securitization trustsThe Bank securitizes a portion of its Canadian auto loan receivables (receivables) through Securitized Term Auto Receivables Trust 2016-1, 2017-1 and2017-2 (START). Each Trust is a Bank-sponsored structured entity. START issues multiple series of Class A notes to third-party investors andsubordinated notes to the Bank, and the proceeds of such issuances are used to purchase discrete pools of retail indirect auto loan receivables fromthe Bank on a fully serviced basis. Recourse of the note holders is limited to the receivables.
The Bank is responsible for servicing the transferred receivables as well as performing administrative functions for START. The subordinated notesissued by START are held by the Bank. As at October 31, 2017, the following Class A notes were outstanding and included in Deposits – Business andgovernment on the Consolidated Statement of Financial Position: US $0.3 billion ($0.4 billion Canadian dollars) (2016 – US $0.5 billion, $0.7 billionCanadian dollars) for 2016-1, US $0.5 billion ($0.7 billion Canadian dollars) for 2017-1 and US $0.8 billion ($1.0 billion Canadian dollars) for 2017-2.As at October 31, 2017, assets pledged in relation to these notes were Canadian auto loan receivables denominated in Canadian dollars of$0.4 billion (2016 – $0.7 billion) for 2016-1, $0.8 billion for 2017-1 and $1.1 billion for 2017-2.
OtherAssets of other consolidated structured entities are comprised of securities, deposits with banks and other assets to meet the Bank’s and customerneeds.
(b) Unconsolidated structured entitiesThe following table provides information about other structured entities in which the Bank has a significant interest but does not control andtherefore does not consolidate. A significant interest is generally considered to exist where the Bank is exposed to 10% or more of the unconsolidatedstructured entities’ maximum exposure to loss.
As at October 31, 2017
($ millions)
Canadian multi-sellerconduits that theBank administers
Structuredfinanceentities
Capitalfundingvehicles Other Total
Total assets (on structured entity’s financial statements) $ 3,127 $ 3,991 $ 1,520 $ – $ 8,638
Assets recognized on the Bank’s financial statementsTrading assets – 5 – – 5Investment securities – 1,091 15 – 1,106Loans(1) – 731 40 – 771
– 1,827 55 – 1,882
Liabilities recognized on the Bank’s financial statementsDeposits – Business and government – – 1,465 – 1,465
Derivative financial instruments 6 – – – 6
6 – 1,465 – 1,471
Bank’s maximum exposure to loss $ 3,127 $ 1,827 $ 55 $ – $ 5,009
As at October 31, 2016
($ millions)
Canadian multi-sellerconduits that theBank administers
Structuredfinanceentities
Capitalfundingvehicles Other Total
Total assets (on structured entity’s financial statements) $ 4,401 $ 7,653 $ 1,520 $ 68 $ 13,642
Assets recognized on the Bank’s financial statementsTrading assets 2 467 – – 469Investment securities – 1,147 15 20 1,182Loans(1) – 712 47 – 759
2 2,326 62 20 2,410
Liabilities recognized on the Bank’s financial statementsDeposits – Business and government – – 1,400 – 1,400Derivative financial instruments 2 – – – 2
2 – 1,400 – 1,402
Bank’s maximum exposure to loss $ 4,401 $ 2,326 $ 62 $ 20 $ 6,809
(1) Loan balances are presented net of allowance for credit losses.
The Bank’s maximum exposure to loss represents the notional amounts of guarantees, liquidity facilities, and other credit support relationships withthe structured entities, the credit risk amount for certain derivative contracts with the entities and the amount invested where the Bank holds anownership interest in the structured entities. Of the aggregate amount of maximum exposure to loss as at October 31, 2017, the Bank has recorded$1.8 billion (2016 – $2.4 billion), primarily its interest in the structured entities, on its Consolidated Statement of Financial Position.
172 | 2 0 1 7 S C O T I A B A N K A N N U A L R E P O R T

CO
NSO
LIDA
TEDFIN
AN
CIA
LSTA
TEMEN
TS
Canadian multi-seller conduits that the Bank administersThe Bank sponsors two Canadian multi-seller conduits. The conduits purchase assets from independent third parties (the sellers) funded by theissuance of asset-backed commercial paper. The sellers continue to service the assets and provide credit enhancements through overcollateralizationprotection and cash reserves. The Bank has no rights to these assets as they are available to support the obligations of the respective programs, butmanages for a fee the commercial paper selling programs. To ensure timely repayment of the commercial paper, each asset pool financed by themulti-seller conduits has a deal-specific liquidity asset purchase agreement (LAPA) with the Bank. Pursuant to the terms of the LAPA, the Bank as theliquidity provider is obligated to purchase non-defaulted assets, transferred by the conduit at the conduit’s original cost as reflected in the table above.In most cases, the liquidity agreements do not require the Bank to purchase defaulted assets. Additionally, the Bank has not provided any program-wide credit enhancement to these conduits. The Bank provides additional liquidity facilities to these multi-seller conduits to a maximum amount of$1.9 billion (2016 – $1.4 billion) based on future asset purchases by these conduits.
Although the Bank has power over the relevant activities of the conduits, it has limited exposure to variability in returns, which results in the Bank notconsolidating the two Canadian conduits.
Structured finance entitiesThe Bank has interests in structured entities used to assist corporate clients in accessing cost-efficient financing through their securitization structures.The Bank may act as an administrator, an investor or a combination of both in these types of structures.
Capital funding vehiclesThese entities are designed to pass the Bank’s credit risk to the holders of the securities. Therefore the Bank does not have exposure or rights tovariable returns from these entities.
OtherOther includes investments in managed funds, collateralized debt obligation entities, and other structured entities. The Bank’s maximum exposure toloss is limited to its net investment in these funds.
c) Other unconsolidated Bank-sponsored entitiesThe Bank sponsors unconsolidated structured entities including mutual funds, in which it has insignificant or no interest at the reporting date. TheBank is a sponsor when it is significantly involved in the design and formation at inception of the structured entities, and the Bank’s name is used bythe structured entities to create an awareness of the instruments being backed by the Bank’s reputation and obligation. The Bank also considers otherfactors, such as its continuing involvement and obligations to determine if, in substance, the Bank is a sponsor. The Bank considers mutual funds andmanaged companies as sponsored entities.
The following table provides information on revenue from unconsolidated Bank-sponsored entities.
2017 2016
As at October 31 ($ millions) Funds(1)
ScotiaManaged
Companies Total Funds(1)
ScotiaManaged
Companies Total
Revenue $ 2,016 $ 5 $ 2,021 $ 1,960 $ 8 $ 1,968
(1) Includes mutual funds, other funds and trusts.
The Bank earned revenue of $2,021 million (2016 – $1,968 million) from its involvement with the unconsolidated Bank-sponsored structured entitiesincluding mutual funds, for the year ended October 31, 2017, which was comprised of interest income of $1 million (2016 – $2 million), non-interestincome – banking of $134 million (2016 – $134 million) and non-interest income – wealth management of $1,886 million (2016 – $1,832 million),including mutual fund, brokerage and investment management and trust fees.
2 0 1 7 S C O T I A B A N K A N N U A L R E P O R T | 173

CONSOLIDATED FINANCIAL STATEMENTS
15 Property and Equipment
($ millions)Land &
Building EquipmentTechnology
AssetsLeasehold
Improvements Total
CostBalance as at October 31, 2015 $ 1,983 $ 1,592 $ 1,947 $ 1,305 $ 6,827Acquisitions 156 18 42 26 242Additions 256 209 14 98 577Disposals (286) (83) (19) (61) (449)Foreign currency adjustments and other (38) (8) (1) (11) (58)
Balance as at October 31, 2016 $ 2,071 $ 1,728 $ 1,983 $ 1,357 $ 7,139Additions 169 147 161 126 603Disposals (224) (52) (41) (28) (345)Foreign currency adjustments and other (294) 69 (15) (45) (285)
Balance as at October 31, 2017 $ 1,722 $ 1,892 $ 2,088 $ 1,410 $ 7,112
Accumulated depreciationBalance as at October 31, 2015 $ 754 $ 1,372 $ 1,606 $ 809 $ 4,541Depreciation 99 104 66 56 325Disposals (69) (103) (18) (18) (208)Foreign currency adjustments and other (18) (11) (1) (9) (39)
Balance as at October 31, 2016 $ 766 $ 1,362 $ 1,653 838 $ 4,619Depreciation 47 91 131 71 340Disposals (58) (37) (40) (17) (152)Foreign currency adjustments and other (69) 34 (25) (16) (76)
Balance as at October 31, 2017 $ 686 $ 1,450 $ 1,719 $ 876 4,731
Net book valueBalance as at October 31, 2016 $ 1,305 $ 366 $ 330 $ 519 $ 2,520(1)
Balance as at October 31, 2017 $ 1,036 $ 442 $ 369 $ 534 $ 2,381(1)
(1) Includes $16 (2016 – $20) of investment property.
16 Investments in Associates
The Bank had significant investments in the following associates:
2017 2016
As at October 31 ($ millions)Country of
incorporation Nature of businessOwnershippercentage
Date of financialstatements(1)
Carryingvalue
Carryingvalue
Thanachart Bank Public CompanyLimited Thailand Banking 49.0% September 30, 2017 $ 2,789 $ 2,612
Canadian Tire’s Financial Servicesbusiness (CTFS)(2) Canada Financial Services 20.0% September 30, 2017 542 532
Bank of Xi’an Co. Ltd. China Banking 19.9% September 30, 2017 711 654Maduro & Curiel’s Bank N.V.(3) Curacao Banking 48.1% September 30, 2017 284 280Banco del Caribe(4) Venezuela Banking 26.6% September 30, 2017 35 26
(1) Represents the date of the most recent published financial statements. Where available, financial statements prepared by the associates’ management or other publishedinformation is used to estimate the change in the Bank’s interest since the most recent published financial statements.
(2) Canadian Tire has an option to sell to the Bank up to an additional 29% equity interest within the next 10 years at the then fair value, that can be settled, at the Bank’s discretion,by issuance of common shares or cash. After 10 years, for a period of six months, the Bank has the option to sell its equity interest back to Canadian Tire at the then fair value. Asat October 1, 2014 CTFS had total assets of $5,351 and total liabilities of $4,387.
(3) The local regulator requires financial institutions to set aside reserves for general banking risks. These reserves are not required under IFRS, and represent undistributed retainedearnings related to a foreign associated corporation, which are subject to local regulatory restrictions. As of October 31, 2017 these reserves amounted to $61 (2016 – $63).
(4) As at October 31, 2017, the Bank’s total net investment in Banco del Caribe, along with monetary assets, comprising of cash and dividend receivable was translated at theDICOM exchange rate of 1 USD to 3,345 VEF (2016 – 1 USD to 660 VEF).
174 | 2 0 1 7 S C O T I A B A N K A N N U A L R E P O R T
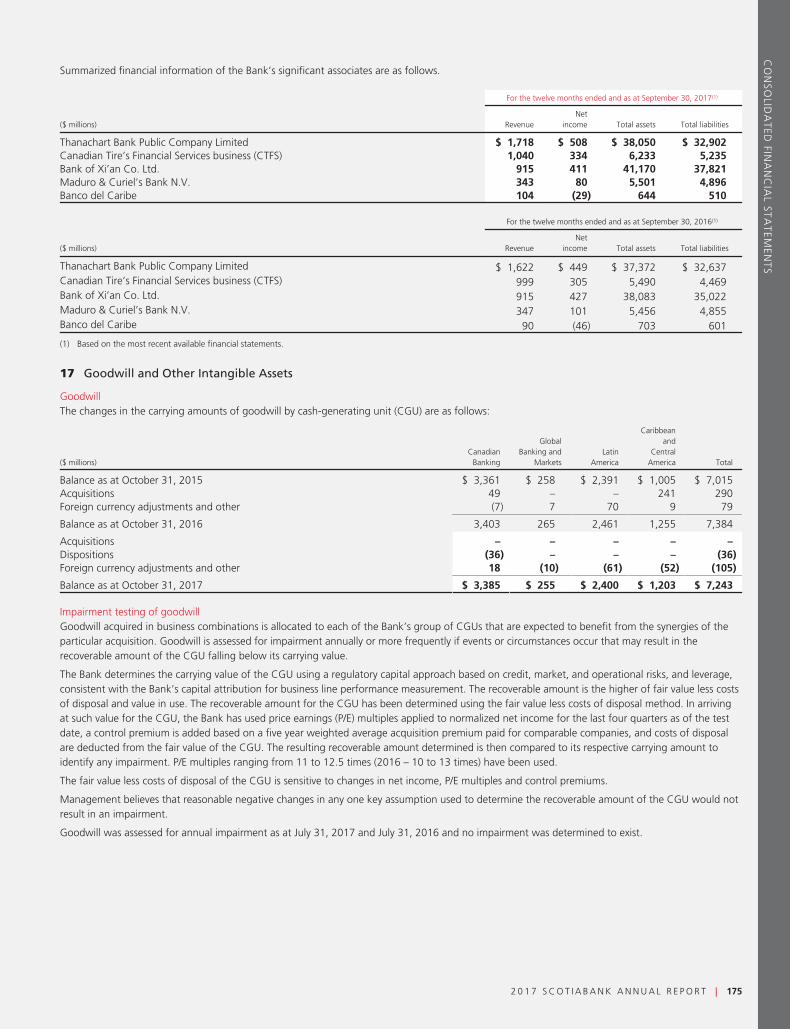
CO
NSO
LIDA
TEDFIN
AN
CIA
LSTA
TEMEN
TS
Summarized financial information of the Bank’s significant associates are as follows.
For the twelve months ended and as at September 30, 2017(1)
($ millions) RevenueNet
income Total assets Total liabilities
Thanachart Bank Public Company Limited $ 1,718 $ 508 $ 38,050 $ 32,902Canadian Tire’s Financial Services business (CTFS) 1,040 334 6,233 5,235Bank of Xi’an Co. Ltd. 915 411 41,170 37,821Maduro & Curiel’s Bank N.V. 343 80 5,501 4,896Banco del Caribe 104 (29) 644 510
For the twelve months ended and as at September 30, 2016(1)
($ millions) RevenueNet
income Total assets Total liabilities
Thanachart Bank Public Company Limited $ 1,622 $ 449 $ 37,372 $ 32,637Canadian Tire’s Financial Services business (CTFS) 999 305 5,490 4,469Bank of Xi’an Co. Ltd. 915 427 38,083 35,022Maduro & Curiel’s Bank N.V. 347 101 5,456 4,855Banco del Caribe 90 (46) 703 601
(1) Based on the most recent available financial statements.
17 Goodwill and Other Intangible Assets
GoodwillThe changes in the carrying amounts of goodwill by cash-generating unit (CGU) are as follows:
($ millions)Canadian
Banking
GlobalBanking and
MarketsLatin
America
Caribbeanand
CentralAmerica Total
Balance as at October 31, 2015 $ 3,361 $ 258 $ 2,391 $ 1,005 $ 7,015Acquisitions 49 – – 241 290Foreign currency adjustments and other (7) 7 70 9 79
Balance as at October 31, 2016 3,403 265 2,461 1,255 7,384
Acquisitions – – – – –Dispositions (36) – – – (36)Foreign currency adjustments and other 18 (10) (61) (52) (105)
Balance as at October 31, 2017 $ 3,385 $ 255 $ 2,400 $ 1,203 $ 7,243
Impairment testing of goodwillGoodwill acquired in business combinations is allocated to each of the Bank’s group of CGUs that are expected to benefit from the synergies of theparticular acquisition. Goodwill is assessed for impairment annually or more frequently if events or circumstances occur that may result in therecoverable amount of the CGU falling below its carrying value.
The Bank determines the carrying value of the CGU using a regulatory capital approach based on credit, market, and operational risks, and leverage,consistent with the Bank’s capital attribution for business line performance measurement. The recoverable amount is the higher of fair value less costsof disposal and value in use. The recoverable amount for the CGU has been determined using the fair value less costs of disposal method. In arrivingat such value for the CGU, the Bank has used price earnings (P/E) multiples applied to normalized net income for the last four quarters as of the testdate, a control premium is added based on a five year weighted average acquisition premium paid for comparable companies, and costs of disposalare deducted from the fair value of the CGU. The resulting recoverable amount determined is then compared to its respective carrying amount toidentify any impairment. P/E multiples ranging from 11 to 12.5 times (2016 – 10 to 13 times) have been used.
The fair value less costs of disposal of the CGU is sensitive to changes in net income, P/E multiples and control premiums.
Management believes that reasonable negative changes in any one key assumption used to determine the recoverable amount of the CGU would notresult in an impairment.
Goodwill was assessed for annual impairment as at July 31, 2017 and July 31, 2016 and no impairment was determined to exist.
2 0 1 7 S C O T I A B A N K A N N U A L R E P O R T | 175

CONSOLIDATED FINANCIAL STATEMENTS
Intangible assetsIntangible assets consist of assets with indefinite and finite useful lives. Indefinite life intangible assets consist substantially of fund managementcontracts. The fund management contracts are for the management of open-ended funds. Finite life intangible assets include assets such as computersoftware, customer relationships and core deposit intangibles.
Finite life Indefinite life
($ millions)Computer
softwareOther
intangiblesFund management
contracts(1)
Otherintangibles Total
CostBalance as at October 31, 2015 $ 2,193 $ 1,510 $ 2,325 $ 68 $ 6,096
Acquisitions – 61 – – 61Additions 584 31 – – 615Foreign currency adjustments and other (40) 29 – – (11)
Balance as at October 31, 2016 $ 2,737 $ 1,631 $ 2,325 $ 68 $ 6,761
Additions 584 5 – – 589Disposals (3) (56) – – (59)Foreign currency adjustments and other (40) (17) – – (57)
Balance as at October 31, 2017 $ 3,278 $ 1,563 $ 2,325 $ 68 $ 7,234
Accumulated amortizationBalance as at October 31, 2015 $ 778 $ 884 $ – $ – $ 1,662
Amortization 255 104 – – 359Foreign currency adjustments and other (24) 7 – – (17)
Balance as at October 31, 2016 $ 1,009 $ 995 $ – $ – $ 2,004
Amortization 339 82 – – 421Disposals (2) (18) – – (20)Foreign currency adjustments and other (25) (9) – – (34)
Balance as at October 31, 2017 $ 1,321 $ 1,050 $ – $ – $ 2,371
Net book valueAs at October 31, 2016 $ 1,728(2) $ 636 $ 2,325 $ 68 $ 4,757
As at October 31, 2017 $ 1,957(2) $ 513 $ 2,325 $ 68 $ 4,863(1) Fund management contracts are attributable to HollisWealth Inc. (formerly DundeeWealth Inc.).(2) Computer software comprises of purchased software of $500 (2016 – $377), internally generated software of $981 (2016 – $948), and in process software not subject to
amortization of $476 (2016 – $403).
Impairment testing of intangible assetsIndefinite life intangible assets are not amortized and are assessed for impairment annually or more frequently if events or changes in circumstancesindicate that the asset may be impaired. Impairment is assessed by comparing the carrying value of the indefinite life intangible asset to its recoverableamount. The recoverable amount of the fund management contracts is based on a value in use approach using the multi-period excess earningsmethod. This approach uses cash flow projections from management-approved financial budgets which include key assumptions related to marketappreciation, net sales of funds, and operating margins taking into consideration past experience and market expectations. The forecast cash flowscover a 5-year period, with a terminal growth rate of 4.5% (2016 – 4.5%) applied thereafter. These cash flows have been discounted at a rate of10% (2016 – 10%). Management believes that reasonable negative changes in any one key assumption used to determine the recoverable amountwould not result in an impairment.
Indefinite life intangible assets were assessed for annual impairment as at July 31, 2017 and July 31, 2016 and no impairment was determined toexist.
18 Other Assets
As at October 31 ($ millions) 2017 2016
Accrued interest $ 2,176 $ 1,986Accounts receivable and prepaids 1,674 1,939Current tax assets 327 422Margin deposit derivatives 3,041 4,604Pension assets (Note 27) 256 184Receivable from brokers, dealers and clients 913 796Receivable from the Federal Deposit Insurance Corporation (Note 12) 106 116Other 4,256 2,823
Total $ 12,749 $ 12,870
176 | 2 0 1 7 S C O T I A B A N K A N N U A L R E P O R T

CO
NSO
LIDA
TEDFIN
AN
CIA
LSTA
TEMEN
TS
19 Deposits
2017 2016
Payable on demand(1)
As at October 31 ($ millions)Interest-bearing
Non-interestbearing
Payable afternotice(2)
Payable on afixed date(3) Total
Personal $ 8,514 $ 6,541 $ 119,111 $ 65,864 $ 200,030 $ 199,302Business and government 81,132 23,805 32,850 247,201 384,988 372,303Financial institutions 5,066 1,706 2,162 31,415 40,349 40,272
Total $ 94,712 $ 32,052 $ 154,123(4) $ 344,480 $ 625,367 $ 611,877
Recorded in:Canada $ 76,776 $ 17,742 $ 121,441 $ 229,528 $ 445,487 $ 434,884United States 10,403 171 5,773 41,723 58,070 54,997United Kingdom – – 277 11,764 12,041 15,256Mexico 8 4,167 5,949 9,295 19,419 16,264Peru 2,467 555 3,734 8,460 15,216 15,547Chile 375 2,020 72 9,107 11,574 10,801Colombia 46 388 3,062 4,091 7,587 7,272Other International 4,637 7,009 13,815 30,512 55,973 56,856
Total(5) $ 94,712 $ 32,052 $ 154,123 $ 344,480 $ 625,367 $ 611,877
(1) Deposits payable on demand include all deposits for which we do not have the right to notice of withdrawal, generally chequing accounts.(2) Deposits payable after notice include all deposits for which we require notice of withdrawal, generally savings accounts.(3) All deposits that mature on a specified date, generally term deposits, guaranteed investments certificates and similar instruments.(4) Includes $141 (2016 – $135) of non-interest bearing deposits.(5) Deposits denominated in U.S. dollars amount to $216,018 (2016 – $217,850), deposits denominated in Mexican pesos amount to $17,156 (2016 – $14,464) and deposits
denominated in other foreign currencies amount to $81,283 (2016 – $76,777).
The following table presents the maturity schedule for term deposits in Canada greater than $100,000(1).
($ millions)Within three
monthsThree to six
monthsSix to
twelve monthsOne to
five yearsOver
five years Total
As at October 31, 2017 $ 33,678 $ 26,579 $ 31,190 $ 94,563 $ 16,073 $ 202,083
As at October 31, 2016 $ 40,211 $ 24,077 $ 23,690 $ 99,905 $ 12,451 $ 200,334
(1) The majority of foreign term deposits are in excess of $100,000.
20 Subordinated Debentures
These debentures are direct, unsecured obligations of the Bank and are subordinate to the claims of the Bank’s depositors and other creditors. TheBank, where appropriate, enters into interest rate and cross-currency swaps to hedge the related risks.
As at October 31 ($ millions) 2017 2016
Maturity dateInterestrate (%) Terms(1)
Carryingvalue(2)
Carryingvalue(2)
August 2022 2.898 Redeemed on August 3, 2017. $ – $ 1,500October 2024 3.036 Redeemable on or after October 18, 2017. After October 18, 2019, interest will be
payable at an annual rate equal to the 90-day bankers’ acceptance rate plus 1.14%. 1,756 1,798June 2025 8.90 Redeemable at any time. 260 262December 2025(3) 3.367 Redeemable on or after December 8, 2020. After December 8, 2020, interest will be
payable at an annual rate equal to the 90 day bankers’ acceptance rate plus 2.19%. 737 759December 2025(3) 4.50 US$1,250 million. Interest will be payable semi-annually in arrears on June 16 and
December 16 of each year. 1,613 1,677March 2027(3) 2.58 Redeemable on or after March 30, 2022. After March 30, 2022, interest will be
payable at an annual rate equal to the 90-day bankers’ acceptance rate plus 1.19%. 1,219 1,271November 2037 3.015 JPY ¥10 billion. Redeemed on November 20, 2017. 113 118April 2038 3.37 JPY ¥10 billion. Redeemable on April 9, 2018. 110 116August 2085 Floating US$99 million bearing interest at a floating rate of the offered rate for six-month
Eurodollar deposits plus 0.125%. Redeemable on any interest payment date. 127 132$ 5,935 $ 7,633
(1) In accordance with the provisions of the Capital Adequacy Guideline of the Superintendent, all redemptions are subject to regulatory approval and subject to the terms in therelevant prospectus.
(2) The carrying value of subordinated debentures may differ from par value due to adjustments related to hedge accounting.(3) These debentures contain non-viability contingent capital (NVCC) provisions. Under such NVCC provisions, the debentures are convertible into a variable number of common shares
if OSFI announces that the Bank has ceased, or is about to cease, to be viable, or if a federal or provincial government in Canada publicly announces that the Bank has accepted oragreed to accept a capital injection, or equivalent support, from the federal government or any provincial government or political subdivision or agent thereof without which theBank would have been determined by OSFI to be non-viable. If such a conversion were to occur, the debentures would be converted into common shares pursuant to an automaticconversion formula defined as 150% of the par value plus accrued and unpaid interest divided by the conversion price. The conversion price is based on the greater of: (i) a floorprice of $5.00 or, where applicable, the US dollar equivalent of $5.00 (subject to, in each case, adjustments in certain events as set out in the respective prospectus supplements),and (ii) the current market price of the Bank’s common shares at the time of the trigger event (10-day weighted average), where applicable converted from CAD to USD.
2 0 1 7 S C O T I A B A N K A N N U A L R E P O R T | 177

CONSOLIDATED FINANCIAL STATEMENTS
21 Other Liabilities
As at October 31 ($ millions) 2017 2016
Accrued interest $ 2,172 $ 2,033Accounts payable and accrued expenses 5,867 5,427Current tax liabilities 408 587Deferred tax liabilities (Note 26) 697 611Gold and silver certificates and bullion 6,819 8,430Margin and collateral accounts 7,129 6,708Payables to brokers, dealers and clients 796 528Provisions (Note 22) 333 536Pension liabilities (Note 27) 808 1,613Other liabilities of subsidiaries and structured entities 12,954 10,950Other 5,331 5,293
Total $ 43,314 $ 42,716
22 Provisions
($ millions)Off-balance sheet
credit risks Restructuring Other Total
As at November 1, 2015 $ 112 $ 49 $ 154 $ 315Provisions made during the year 26 378 85 489Provisions utilized / released during the year – (150) (118) (268)
Balance as at October 31, 2016 $ 138 $ 277 $ 121 $ 536Provisions made during the year – – 27 27Provisions utilized / released during the year (18) (174) (38) (230)Balance as at October 31, 2017 $ 120 $ 103 $ 110 $ 333
Off-balance sheet credit risksThe provision for off-balance sheet credit risks relates primarily to credit risks such as undrawn lending commitments, letters of credit and letters ofguarantee. These are collectively assessed at each reporting period in a manner consistent with the collective allowance for performing on-balancesheet credit risks.
Restructuring chargeDuring fiscal 2016, the Bank recorded a restructuring provision of $378 million ($278 million after tax) as part of the Bank’s efforts to enhancecustomer experience, reduce costs in a sustainable manner, to achieve greater operational efficiencies, and to simplify the organization. Therestructuring charge primarily related to employee severance and was recorded within non-interest expenses. As at October 31, 2017, $103 million ofthe restructuring provision remains and is expected to be utilized in line with the approved plans, during fiscal 2018. This amount represents theBank’s best estimate of the amount required to settle the obligation. Uncertainty exists with respect to when the obligation will be settled and theamounts ultimately paid, as this will largely depend upon individual facts and circumstances.
Litigation and OtherOther primarily includes provisions related to litigation. In the ordinary course of business, the Bank and its subsidiaries are routinely defendants in, orparties to a number of pending and threatened legal actions and regulatory proceedings, including actions brought on behalf of various classes ofclaimants. In view of the inherent difficulty of predicting the outcome of such matters, the Bank cannot state what the eventual outcome of suchmatters will be.
Legal provisions are established when it becomes probable that the Bank will incur an expense related to a legal action and the amount can be reliablyestimated. Such provisions are recorded at the best estimate of the amount required to settle any obligation related to these legal actions as at thebalance sheet date, taking into account the risks and uncertainties surrounding the obligation. Management and internal and external experts areinvolved in estimating any amounts that may be required. The actual costs of resolving these claims may vary significantly from the amount of thelegal provisions. The Bank’s estimate involves significant judgement, given the varying stages of the proceedings, the fact that the Bank’s liability, ifany, has yet to be determined and the fact that the underlying matters will change from time to time. As such, there is a possibility that the ultimateresolution of those legal actions may be material to the Bank’s consolidated results of operations for any particular reporting period.
178 | 2 0 1 7 S C O T I A B A N K A N N U A L R E P O R T

CO
NSO
LIDA
TEDFIN
AN
CIA
LSTA
TEMEN
TS
23 Common shares, preferred shares and other equity instruments
a) Common shares
Authorized:An unlimited number of common shares without nominal or par value.
Issued and fully paid:
2017 2016
As at October 31 ($ millions) Number of shares Amount Number of shares Amount
Outstanding at beginning of year 1,207,893,604 $ 15,513 1,202,937,205 $ 15,141Issued under Shareholder Dividend and Share Purchase Plan(1) – – 2,234,037 153Issued in relation to share-based payments, net (Note 25) 5,338,111 313 4,228,124 236Issued in relation to the acquisition of a subsidiary or associated corporation – – 29,138 2Repurchased for cancellation under the Normal Course Issuer Bid (14,000,000) (182) (1,534,900) (19)Outstanding at end of year 1,199,231,715(2) $ 15,644 1,207,893,604(2) $ 15,513(1) Effective November 29, 2016, the Bank discontinued the issuance of shares from Treasury for the Dividend and Share Purchase options of the Plan. Purchases of Common Shares
under the Plan were made by Computershare Trust Company of Canada, as agent under the Plan (the “Agent”), at the average market price in the secondary market in accordancewith the provisions of the plan. As at October 31, 2017, there were 7,786,784 common shares held in reserve for issuance under the Plan.
(2) In the normal course of business, the Bank’s regulated Dealer subsidiary purchases and sells the Bank’s common shares to facilitate trading/institutional client activity. During fiscal2017, the number of such shares bought and sold was 15,856,738 (2016 – 13,912,150).
DividendThe dividends paid on common shares in fiscal 2017 and 2016 were $3,668 million ($3.05 per share) and $3,468 million ($2.88 per share),respectively. The Board of Directors approved a quarterly dividend of 79 cents per common share at its meeting on November 27, 2017. This quarterlydividend applies to shareholders of record as of January 2, 2018, and is payable January 29, 2018.
Normal Course Issuer BidDuring the year ended October 31, 2017, under normal course issuer bids, the Bank repurchased and cancelled approximately 14 million commonshares (2016 – 1.5 million) at an average price of $72.09 per share (2016 – $52.34) for a total amount of approximately $1,009 million(2016 – $80 million).
On May 30, 2017, the Bank announced that OSFI and the TSX approved a NCIB pursuant to which it may repurchase for cancellation up to 24 millionof the Bank’s common shares. Purchases under this NCIB may commence on June 2, 2017 and will terminate upon the earlier of: (i) the Bankpurchasing the maximum number of common shares under the NCIB, (ii) the Bank providing a notice of termination, or (iii) June 1, 2018. On aquarterly basis, the Bank will notify OSFI prior to making purchases.
On May 31, 2016, the Bank announced that OSFI and the Toronto Stock Exchange (TSX) approved a normal course issuer bid pursuant to which itmay repurchase for cancellation up to 12 million of the Bank’s common shares. On January 4, 2017 and March 17, 2017 the TSX approvedamendments to the NCIB to allow the Bank to purchase common shares under the NCIB, including by private agreement or under a specific sharerepurchase program, respectively. The bid ended on June 1, 2017.
Non-viability Contingent CapitalThe maximum number of common shares issuable on conversion of NVCC subordinated debentures, NVCC subordinated additional tier 1 capitalsecurities and NVCC preferred shares as at October 31, 2017 would be 1,757 million common shares (2016 – 1,373 million common shares) based onthe floor price and excluding the impact of any accrued and unpaid interest and any declared but unpaid dividends (refer to Note 20 – Subordinateddebentures and Note 23 (b) – Preferred shares and Other Equity Instruments for further details).
2 0 1 7 S C O T I A B A N K A N N U A L R E P O R T | 179

CONSOLIDATED FINANCIAL STATEMENTS
b) Preferred shares and other equity instruments
Preferred shares
Authorized:An unlimited number of preferred shares without nominal or par value.
Issued and fully paid:
2017 2016
As at October 31 ($ millions)Number
of shares Amount
Dividendsdeclared
per shareConversion
featureNumber
of shares Amount
Dividendsdeclared
per shareConversion
feature
Preferred shares:(a)
Series 16(b) – – 0.328125 – 13,800,000 345 1.312500 –Series 17(c) – – 0.700000 – 9,200,000 230 1.400000 –Series 18(d)(e) 7,497,663 187 0.837500 Series 19 7,497,663 187 0.837500 Series 19Series 19(d)(e) 6,302,337 158 0.642626 Series 18 6,302,337 158 0.628938 Series 18Series 20(d)(f) 8,039,268 201 0.902500 Series 21 8,039,268 201 0.902500 Series 21Series 21(d)(f) 5,960,732 149 0.554501 Series 20 5,960,732 149 0.541438 Series 20Series 22(d)(g) 9,376,944 234 0.957500 Series 23 9,376,944 234 0.957500 Series 23Series 23(d)(g) 2,623,056 66 0.600126 Series 22 2,623,056 66 0.586438 Series 22Series 30(d)(h) 6,142,738 154 0.455000 Series 31 6,142,738 154 0.455000 Series 31Series 31(d)(h) 4,457,262 111 0.380126 Series 30 4,457,262 111 0.366438 Series 30Series 32(d)(i) 11,161,422 279 0.515752 Series 33 11,161,422 279 0.638235 Series 33Series 33(d)(i) 5,184,345 130 0.465159 Series 32 5,184,345 130 0.334959 Series 32Series 34(d)(j)(m) 14,000,000 350 1.375000 Series 35 14,000,000 350 1.184800 Series 35Series 36(d)(k)(m) 20,000,000 500 1.375000 Series 37 20,000,000 500 0.852350 Series 37Series 38(d)(l)(m) 20,000,000 500 1.351175 Series 39 20,000,000 500 – –
Total preferred shares 120,745,767 $ 3,019 143,745,767 $ 3,594
Terms of preferred shares
Issue dateIssueprice
Initialdividend
Initial dividendpayment date
Ratereset
spread Redemption dateRedemption
price
Preferred shares(a):Series 16(b) October 12, 2007 25.00 0.391950 January 29, 2008 – January 27, 2017 25.00Series 17(c) January 31, 2008 25.00 0.337530 April 28, 2008 – April 26, 2017 25.00Series 18(d)(e) March 25, 2008
March 27, 200825.00 0.431500 July 29, 2008 2.05% April 26, 2018 25.00
Series 19(d)(e) April 26, 2013 25.00 0.189250 July 29, 2013 2.05% April 26, 2013 toApril 26, 2018
25.50
Series 20(d)(f) June 10, 2008 25.00 0.167800 July 29, 2008 1.70% October 26, 2018 25.00Series 21(d)(f) October 26, 2013 25.00 0.167875 January 29, 2014 1.70% October 26, 2013 to
October 26, 201825.50
Series 22(d)(g) September 9, 2008 25.00 0.482900 January 28, 2009 1.88% January 26, 2019 25.00Series 23(d)(g) January 26, 2014 25.00 0.173875 April 28, 2014 1.88% January 26, 2014 to
January 26, 201925.50
Series 30(d)(h) April 12, 2010 25.00 0.282200 July 28, 2010 1.00% April 26, 2020 25.00Series 31(d)(h) April 26, 2015 25.00 0.095500 July 29, 2015 1.00% April 26, 2015 to
April 26, 202025.50
Series 32(d)(i) February 1, 2011February 28, 2011
25.00 0.215410 April 27, 2011 1.34% February 2, 2021 25.00
Series 33(d)(i) February 2, 2016 25.00 0.105690 April 27, 2016 1.34% February 2, 2016 toFebruary 2, 2021
25.50
Series 34(d)(j)(m) December 17, 2015 25.00 0.497300 April 27, 2016 4.51% April 26, 2021 25.00Series 36(d)(k)(m) March 14, 2016 25.00 0.508600 July 27, 2016 4.72% July 26, 2021 25.00Series 38(d)(l)(m) September 16, 2016 25.00 0.441800 January 27, 2017 4.19% January 27, 2022 25.00
(a) Non-cumulative preferential cash dividends on all series are payable quarterly, as and when declared by the Board. Dividends on theNon-cumulative 5-Year Rate Reset Preferred Shares (Series 18, 20, 22, 30 and 32) and the Non-cumulative 5-Year Rate Reset Preferred SharesNon Viability Contingent Capital (NVCC) (Series 34, 36, and 38) are payable at the applicable rate for the initial five-year fixed rate period endingone day prior to the redemption date. Subsequent to the initial five-year fixed rate period, and resetting every five years thereafter, the dividendon such Rate Reset Preferred Shares will be determined by the sum of the 5-year Government of Canada Yield plus the indicated rate resetspread, multiplied by $25.00. If outstanding, non-cumulative preferential cash dividends on the Series 19, 21, 23, 31, 33, 35, 37 and 39 arepayable quarterly, as and when declared by the Board. Dividends on the Non-cumulative 5-Year Rate Reset Preferred Shares (Series 19, 21, 23, 31
180 | 2 0 1 7 S C O T I A B A N K A N N U A L R E P O R T

CO
NSO
LIDA
TEDFIN
AN
CIA
LSTA
TEMEN
TS
and 33) and the Non-cumulative 5-Year Rate Reset Preferred Shares NVCC (Series 35, 37 and 39) are payable, at a rate equal to the sum of thethree month Government of Canada Treasury Bill rate plus the rate reset spread of the converted preferred shares, multiplied by $25.00. For eachof the years presented, the Bank paid all of the non-cumulative preferred share dividends.
(b) On January 27, 2017, the Bank redeemed all outstanding Non-cumulative Preferred shares Series 16 and paid a dividend of $0.328125 per share.(c) On April 26, 2017, the Bank redeemed all outstanding Non-cumulative Preferred shares Series 17 and paid a dividend of $0.350000 per share.(d) Holders of Fixed Rate Reset Preferred Shares will have the option to convert shares into an equal number of the relevant series of Floating Rate
Preferred Shares on the applicable Rate Reset Series conversion date and every five years thereafter. Holders of Floating Rate Reset PreferredShares have reciprocal conversion options into the relevant series of Fixed Rate Reset Preferred Shares. With respect to Series 18 and 19, 20 and21, 22 and 23, 30 and 31, 32 and 33, 34 and 35, 36 and 37, and 38 and 39, if the Bank determines that, after giving effect to any ElectionNotices received, there would be less than 1,000,000 Fixed Rate or Floating Rate Preferred Shares of such Series issued and outstanding on anapplicable conversion date, then all of the issued and outstanding preferred shares of such Series will automatically be converted into an equalnumber of the preferred shares of the other relevant Series.
(e) Holders of Series 18 Non-cumulative 5-Year Rate Reset Preferred Shares will have the option to convert shares into an equal number of Series 19non-cumulative floating rate preferred shares on April 26, 2018 and on April 26 every five years thereafter. With regulatory approval, theSeries 18 preferred shares may be redeemed by the Bank on April 26, 2018 and every five years thereafter, respectively, at $25.00 per share,together with declared and unpaid dividends. With regulatory approval, the Series 19 Non-cumulative Preferred Shares may be redeemed by theBank at (i) $25.00 together with all declared and unpaid dividends to the date fixed for redemption in the case of redemptions on April 26, 2018and on April 26 every five years thereafter, or (ii) $25.50 together with all declared and unpaid dividends to the date fixed for redemption on anyother date on or after April 26, 2013.
(f) Holders of Series 20 Non-cumulative 5-Year Rate Reset Preferred Shares will have the option to convert shares into an equal number of Series 21non-cumulative floating rate preferred shares on October 26, 2018, and on October 26 every five years thereafter. With regulatory approval, theSeries 20 preferred shares may be redeemed by the Bank on October 26, 2018, and every five years thereafter, respectively, at $25.00 per share,together with declared and unpaid dividends. With regulatory approval, the Series 21 Non-cumulative Preferred Shares may be redeemed by theBank at (i) $25.00 together with all declared and unpaid dividends to the date fixed for redemption in the case of redemptions on October 26,2018 and on October 26 every five years thereafter, or (ii) $25.50 together with all declared and unpaid dividends to the date fixed forredemption on any other date on or after October 26, 2013.
(g) Holders of Series 22 Non-cumulative 5-Year Rate Reset Preferred Shares will have the option to convert shares into an equal number of Series 23non-cumulative floating rate preferred shares on January 26, 2019, and on January 26 every five years thereafter. With regulatory approval, theSeries 22 preferred shares may be redeemed by the Bank on January 26, 2019, and every five years thereafter, respectively, at $25.00 per share,together with declared and unpaid dividends. With regulatory approval, the Series 23 Non-cumulative Preferred Shares may be redeemed by theBank at (i) $25.00 together with all declared and unpaid dividends to the date fixed for redemption in the case of redemptions on January 26,2019 and on January 26 every five years thereafter, or (ii) $25.50 together with all declared and unpaid dividends to the date fixed forredemption on any other date after January 26, 2014.
(h) Holders of Series 30 Non-cumulative 5-Year Rate Reset Preferred Shares will have the option to convert shares into an equal number of Series 31non-cumulative floating rate preferred shares on April 26, 2020, and on April 26 every five years thereafter. With regulatory approval, theSeries 30 preferred shares may be redeemed by the Bank on April 26, 2020, and every five years thereafter, respectively, at $25.00 per share,together with declared and unpaid dividends. With regulatory approval, the Series 31 Non-cumulative Preferred Shares may be redeemed by theBank at (i) $25.00 together with all declared and unpaid dividends to the date fixed for redemption in the case of redemptions on April 26, 2020and on April 26 every five years thereafter, or (ii) $25.50 together with all declared and unpaid dividends to the date fixed for redemption on anyother date after April 26, 2015.
(i) Holders of Series 32 Non-cumulative 5-Year Rate Reset Preferred Shares will have the option to convert shares into an equal number of Series 33non-cumulative floating rate preferred shares on February 2, 2021 and on February 2 every five years thereafter. With regulatory approval, theSeries 32 preferred shares may be redeemed by the Bank on February 2, 2021, and every five years thereafter, respectively, at $25.00 per share,together with declared and unpaid dividends. With regulatory approval, the Series 33 Non-cumulative Preferred Shares may be redeemed by theBank at (i) $25.00 together with all declared and unpaid dividends to the date fixed for redemption in the case of redemptions on February 2,2021 and on February 2 every five years thereafter, or (ii) $25.50 together with all declared and unpaid dividends to the date fixed redemption onany other date after February 2, 2016.
(j) Holders of Series 34 Non-cumulative 5-Year Rate Reset Preferred Shares (NVCC) will have the option to convert shares into an equal number ofSeries 35 non-cumulative floating rate preferred shares on April 26, 2021, and on April 26 every five years thereafter. With regulatory approval,Series 34 preferred shares may be redeemed by the Bank on April 26, 2021, and for Series 35 preferred shares (NVCC), if applicable, on April 26,2026 and every five years thereafter, respectively, at $25.00 per share, together with declared and unpaid dividends.
(k) Holders of Series 36 Non-cumulative 5-Year Rate Reset Preferred Shares (NVCC) will have the option to convert shares into an equal number ofSeries 37 non-cumulative floating rate preferred shares (NVCC) on July 26, 2021, and on July 26 every five years thereafter. With regulatoryapproval, Series 36 preferred shares may be redeemed by the Bank on July 26, 2021, and for Series 37 preferred shares, if applicable, on July 26,2026 and every five years thereafter, respectively, at $25.00 per share, together with declared and unpaid dividends.
(l) Holders of Series 38 Non-cumulative 5-Year Rate Reset Preferred Shares (NVCC) will have the option to convert shares into an equal number ofSeries 39 non-cumulative floating rate preferred shares (NVCC) on January 27, 2022, and on January 27 every five years thereafter. Withregulatory approval, Series 38 preferred shares may be redeemed by the Bank on January 27, 2022, and for Series 39 preferred shares, ifapplicable, on January 27, 2027 and every five years thereafter, respectively, at $25.00 per share, together with declared and unpaid dividends.The initial dividend was paid on January 27, 2017 at $0.4418 per share of Preferred Shares Series 38.
(m) These preferred shares contain NVCC provisions necessary for the shares to qualify as Tier 1 regulatory capital under Basel III.
2 0 1 7 S C O T I A B A N K A N N U A L R E P O R T | 181

CONSOLIDATED FINANCIAL STATEMENTS
Under NVCC provisions, NVCC preferred shares Series 34, 35, 36, 37, 38 and 39, if outstanding, are convertible into a variable number of commonshares if OSFI announces that the Bank has ceased, or is about to cease, to be viable, or if a federal or provincial government in Canada publiclyannounces that the Bank has accepted or agreed to accept a capital injection, or equivalent support, from the federal government or any provincialgovernment or political subdivision or agent thereof without which the Bank would have been determined by OSFI to be non-viable. If such aconversion were to occur, NVCC preferred shares Series 34, 35, 36, 37, 38 and 39, if outstanding, would be converted into common shares pursuantto an automatic conversion formula defined as 100% times the share value of $25.00 plus declared and unpaid dividends divided by the conversionprice. The conversion price is based on the greater of: (i) a floor price of $5.00 or (subject to adjustments in certain events as set out in their respectiveprospectus supplements), and (ii) the current market price of the Bank’s common shares at the time of the trigger event (10-day weighted average).
Other equity instrumentsOther equity instruments of $1,560 million (US$1.25 billion) include USD-denominated perpetual fixed to floating rate non-cumulative subordinatedadditional Tier 1 capital securities (NVCC) issued by the Bank on October 12, 2017.
The terms of the notes are described below:Š The price per note is USD $1,000, with interest paid semi-annually in arrears at 4.65% per annum, for the initial five years. Thereafter, the interest
will reset quarterly and accrue at a rate per annum equal to three-month LIBOR plus 2.648%.Š While interest is payable on a semi-annual basis for the initial five year period, and quarterly thereafter, the Bank may, at its discretion, with notice,
cancel the payments. If the Bank does not pay the interest in full to the note holders, the Bank will not declare dividends on its common orpreferred shares or redeem, purchase or otherwise retire such shares until the month commencing after the Bank resumes full interest payments onthe notes.
Š The notes are redeemable at par 5 years after issuance solely at the option of the Bank, or following a regulatory or tax event, as described in theoffering documents. All redemptions are subject to regulatory consent.
Š The notes are the Bank’s direct unsecured obligations, ranking subordinate to all of the Bank’s subordinated indebtedness.Š NVCC provisions require the conversion of these capital instruments into a variable number of common shares if OSFI announces that the Bank has
ceased, or is about to cease, to be viable, or if a federal or provincial government in Canada publicly announces that the Bank has accepted oragreed to accept a capital injection, or equivalent support, from the federal government or any provincial government or political subdivision oragent thereof without which the Bank would have been determined by OSFI to be non-viable. If such a conversion were to occur, outstandingNVCC subordinated additional Tier 1 capital securities, would be converted into common shares pursuant to an automatic conversion formuladefined as 125% of the par value plus accrued and unpaid interest divided by the conversion price. The conversion price is based on the greater of:(i) the U.S. dollar equivalent of $5.00 (subject to adjustments in certain events as set out in their respective prospectus supplements), and (ii) the U.S.dollar equivalent of the current market price of the Bank’s common shares at the time of the trigger event (10-day weighted average). The U.S.dollar equivalents of the floor price and the current market price are based on the mid-day CAD/USD exchange rate on the day prior to the triggerevent.
The notes have been determined to be compound instruments that have both equity and liability features. At inception, the fair value of the liabilitycomponent is initially measured with any residual amount assigned to the equity component. On the date of issuance, the Bank has assigned aninsignificant value to the liability component of the notes and, as a result, the proceeds received upon issuance of the notes have been presented asequity. The Bank will continue to monitor events that could impact the value of the liability component.
c) Restrictions on dividend paymentsUnder the Bank Act, the Bank is prohibited from declaring any dividends on its common or preferred shares when the Bank is, or would be placed bysuch a declaration, in contravention of the capital adequacy, liquidity or any other regulatory directives issued under the Bank Act. In addition,common share dividends cannot be paid unless all dividends to which preferred shareholders are then entitled have been paid or sufficient funds havebeen set aside to do so.
In the event that applicable cash distributions on any of the Scotiabank Trust Securities are not paid on a regular distribution date, the Bank hasundertaken not to declare dividends of any kind on its preferred or common shares. Similarly, should the Bank fail to declare regular dividends on anyof its directly issued outstanding preferred or common shares, cash distributions will also not be made on any of the Scotiabank Trust Securities.
In the event that distributions on the Bank’s subordinated additional Tier 1 capital securities (NVCC) are not paid in full, the Bank has undertaken notto declare dividends on its common or preferred shares until the month commencing after such distributions have been made in full.
Currently, these limitations do not restrict the payment of dividends on preferred or common shares.
24 Capital Management
The primary regulator over the Bank’s consolidated capital adequacy is the Office of the Superintendent of Financial Institutions, Canada (OSFI). Thecapital adequacy regulations in Canada are largely consistent with international standards set by the Basel Committee on Banking Supervision (BCBS).OSFI requires Canadian deposit-taking institutions to fully implement the 2019 Basel III reforms, without the transitional phase-in provisions for capitaldeductions (referred to as ‘all-in’), and achieve minimums of 7%, 8.5% and 10.5% for CET1, Tier 1 and Total Capital, respectively. OSFI has alsodesignated the Bank as a domestic systemically important bank (D-SIB), increasing its minimum capital ratio requirements by 1% across all tiers ofcapital effective January 1, 2016, in line with the requirements for global systemically important banks.
In addition to risk-based capital requirements, the Basel III reforms introduced a simpler, non risk-based Leverage ratio requirement to act as asupplementary measure to its risk-based capital requirements. Institutions are expected to maintain a material operating buffer above the 3%minimum.
182 | 2 0 1 7 S C O T I A B A N K A N N U A L R E P O R T

CO
NSO
LIDA
TEDFIN
AN
CIA
LSTA
TEMEN
TS
The Bank’s regulatory capital ratios were as follows:2017 2016
As at October 31 ($ millions) All-in Transitional All-in Transitional
CapitalCommon Equity Tier 1 Capital $ 43,352 $ 46,051 $ 39,989 $ 45,816Net Tier 1 Capital $ 49,473 $ 50,623 $ 45,066 $ 47,668Total regulatory capital $ 56,113 $ 57,222 $ 53,330 $ 55,824
Risk-weighted assets/exposures used in calculation of capital ratiosCET1 risk-weighted assets(1)(2) $ 376,379 $ 387,292 $ 364,048 $ 368,215Tier 1 risk-weighted assets(1)(2) $ 376,379 $ 387,292 $ 364,504 $ 368,215Total risk-weighted assets(1)(2) $ 376,379 $ 387,292 $ 364,894 $ 368,215Leverage exposures $ 1,052,891 $1,053,928 $ 1,010,987 $ 1,013,346
Capital ratiosCommon Equity Tier 1 Capital ratio 11.5% 11.9% 11.0% 12.4%Tier 1 capital ratio 13.1% 13.1% 12.4% 12.9%Total capital ratio 14.9% 14.8% 14.6% 15.2%Leverage ratio 4.7% 4.8% 4.5% 4.7%
(1) In accordance with OSFI’s requirements, scalars for CVA risk-weighted assets of 0.72, 0.77 and 0.81 (0.64, 0.71 and 0.77 in 2016) were used to compute the CET1 capital ratio,Tier 1 capital ratio and Total capital ratio, respectively.
(2) Since the introduction of Basel II in 2008, OSFI has prescribed a minimum capital floor for institutions that use the advanced internal ratings-based approach for credit risk. TheBasel I capital floor add-on is determined by comparing a capital requirement calculated by reference to Basel I against the Basel III calculation, as specified by OSFI. A shortfall in theBasel III capital requirement as compared with the Basel I floor is added to RWA. As at October 31, 2017, CET1, Tier 1 and Total Capital RWA include Basel I floor adjustments of$12.8 billion, $12.6 billion and $12.4 billion, respectively (2016 - nil).
The Bank substantially exceeded the OSFI capital targets as at October 31, 2017. OSFI has also prescribed an authorized leverage ratio and the Bankwas above the regulatory minimum as at October 31, 2017.
25 Share-Based Payments
(a) Stock option plansThe Bank grants stock options and stand-alone stock appreciation rights (SARs) as part of the Employee Stock Option Plan. Options to purchasecommon shares and/or to receive an equivalent cash payment, as applicable, may be granted to selected employees at an exercise price of the higherof the closing price of the Bank’s common shares on the Toronto Stock Exchange (TSX) on the trading day prior to the grant date or the volumeweighted average trading price for the five trading days immediately preceding the grant date.
Stock Options granted since December 2014 vest 50% at the end of the third year and 50% at the end of the fourth year. This change is prospectiveand does not impact prior period grants. Stock Options are exercisable no later than 10 years after the grant date. In the event that the expiry datefalls within an insider trading blackout period, the expiry date will be extended for 10 business days after the end of the blackout period. As approvedby the shareholders, a total of 129 million common shares have been reserved for issuance under the Bank’s Employee Stock Option Plan of which104.6 million common shares have been issued as a result of the exercise of options and 15.4 million common shares are committed underoutstanding options, leaving 9.0 million common shares available for issuance as options. Outstanding options expire on dates ranging fromDecember 11, 2017 to December 1, 2026.
The cost of these options is recognized on a graded vesting basis except where the employee is eligible to retire prior to a tranche’s vesting date, inwhich case the cost is recognized between the grant date and the date the employee is eligible to retire.
The stock option plans include:
Š Tandem stock appreciation rightsEmployee stock options granted between December 2, 2005 to November 1, 2009 have Tandem SARs, which provide the employee the choice toeither exercise the stock option for shares, or to exercise the Tandem SARs and thereby receive the intrinsic value of the stock option in cash. As atOctober 31, 2017, 5,900 Tandem SARs were outstanding (2016 – 57,800).
The share-based payment liability recognized for vested Tandem SARs as at October 31, 2017 was nil (2016 – $2 million). The correspondingintrinsic value of this liability as at October 31, 2017 was nil (2016 – $2 million).
In 2017, an expense of $0.4 million (2016 – $0.4 million expense) was recorded in salaries and employee benefits in the Consolidated Statement ofIncome. This expense is net of gains arising from derivatives used to manage the volatility of share-based payments of $0.3 million (2016 –$0.6 million gains).
Š Stock optionsEmployee stock options granted beginning December 2009 are equity-classified stock options which call for settlement in shares and do not haveTandem SARs features.
The amount recorded in equity – other reserves for vested stock options as at October 31, 2017 was $177 million (2016 – $161 million).
In 2017, an expense of $7 million (2016 – $7 million) was recorded in salaries and employee benefits in the Consolidated Statement of Income. Asat October 31, 2017, future unrecognized compensation cost for non-vested stock options was $4 million (2016 – $4 million) which is to berecognized over a weighted-average period of 1.90 years (2016 – 1.80 years).
Š Stock appreciation rightsStand-alone SARs are granted instead of stock options to selected employees in countries where local laws may restrict the Bank from issuingshares. When a SAR is exercised, the Bank pays the appreciation amount in cash equal to the rise in the market price of the Bank’s common sharessince the grant date.
2 0 1 7 S C O T I A B A N K A N N U A L R E P O R T | 183

CONSOLIDATED FINANCIAL STATEMENTS
During fiscal 2017, 60,840 SARs were granted (2016 – 77,298) and as at October 31, 2017, 1,275,608 SARs were outstanding (2016 – 1,541,368),of which 1,229,330 SARs were vested (2016 – 1,478,854).
The share-based payment liability recognized for vested SARs as at October 31, 2017 was $31 million (2016 – $25 million). The correspondingintrinsic value of this liability as at October 31, 2017 was $28 million (2016 – $25 million).
In 2017, a benefit of $2 million (2016 – benefit of $2 million) was recorded in salaries and employee benefits in the Consolidated Statement ofIncome. This benefit is net of gains arising from derivatives used to manage the volatility of share-based payment of $20 million (2016 – $18 milliongains).
Determination of fair valuesThe share-based payment liability and corresponding expense for SARs and options with Tandem SAR features were quantified using the Black-Scholes option pricing model with the following assumptions and resulting fair value per award:
As at October 31 2017 2016
AssumptionsRisk-free interest rate% 1.38% - 1.59% 0.56% - 0.81%Expected dividend yield 3.61% 3.92%Expected price volatility 15.3% - 23.38% 16.28% - 30.40%Expected life of option 0.00 - 4.53 years 0.00 - 4.48 yearsFair valueWeighted-average fair value $ 25.72 $ 17.69
The share-based payment expense for stock options, i.e., without Tandem SAR features, was quantified using the Black-Scholes option pricing modelon the date of grant. The fiscal 2017 and 2016 stock option grants were fair valued using the following weighted-average assumptions and resultingfair value per award:
2017 Grant 2016 Grant
AssumptionsRisk-free interest rate % 1.27% 1.20%Expected dividend yield 3.81% 4.49%Expected price volatility 17.24% 20.10%Expected life of option 6.67 years 6.65 yearsFair valueWeighted-average fair value $ 6.51 $ 5.27
The risk-free rate is based on Canadian treasury bond rates interpolated for the maturity equal to the expected life until exercise of the options.Expected dividend yield is based on historical dividend payout. Expected price volatility is determined based on the historical volatility forcompensation. For accounting purposes, an average of the market consensus implied volatility for traded options on our common shares and thehistorical volatility is used.
Details of the Bank’s Employee Stock Option Plan are as follows(1):
2017 2016
As at October 31Number of stock
options (000’s)Weighted average
exercise priceNumber of stock
options (000’s)Weighted average
exercise price
Outstanding at beginning of year 19,852 $ 54.55 22,957 $ 53.19Granted 1,141 74.14 1,263 60.67Exercised as options (5,338) 50.25 (4,224) 48.81Exercised as Tandem SARs (33) 52.59 (28) 48.41Forfeited (67) 65.97 (92) 62.49Expired – – (24) 61.47
Outstanding at end of year(2) 15,555 $ 57.42 19,852 $ 54.55
Exercisable at end of year(2) 10,980 $ 53.44 14,617 $ 51.57Available for grant 9,156 10,198
Options Outstanding Options Exercisable
As at October 31, 2017Number of stock
options (000’s)
Weightedaverage remaining
contractual life (years)Weighted average
exercise priceNumber of stock
options (000’s)Weighted average
exercise price
Range of exercise prices$33.89 to $47.75 2,337 1.78 $ 43.28 2,337 $ 43.28$49.93 to $55.21 2,285 3.75 $ 50.43 2,285 $ 50.43$55.63 to $60.67 5,585 5.04 $ 56.74 4,357 $ 55.63$63.98 to $74.14 5,348 6.85 $ 67.31 2,001 $ 63.98
15,555 4.98 $ 57.42 10,980 $ 53.44
(1) Excludes SARs.(2) Includes options of 5,900 Tandem SARs (2016 – 57,800) and 156,520 options originally issued under HollisWealth plans (2016 – 257,170).
184 | 2 0 1 7 S C O T I A B A N K A N N U A L R E P O R T

CO
NSO
LIDA
TEDFIN
AN
CIA
LSTA
TEMEN
TS
(b) Employee share ownership plansEligible employees can contribute up to a specified percentage of salary towards the purchase of common shares of the Bank. In general, the Bankmatches 50% of eligible contributions, up to a maximum dollar amount, which is expensed in salaries and employee benefits. In Canada, themaximum dollar amounts were increased effective January 1, 2016. During 2017, the Bank’s contributions totalled $54 million (2016 – $49 million).Contributions, which are used to purchase common shares in the open market, do not result in a subsequent expense to the Bank from share priceappreciation.
As at October 31, 2017, an aggregate of 18 million common shares were held under the employee share ownership plans (2016 – 19 million). Theshares in the employee share ownership plans are considered outstanding for computing the Bank’s basic and diluted earnings per share.
(c) Other share-based payment plansOther share-based payment plans use notional units that are valued based on the Bank’s common share price on the TSX. These units accumulatedividend equivalents in the form of additional units based on the dividends paid on the Bank’s common shares. These plans are settled in cash and, asa result, are liability-classified. Fluctuations in the Bank’s share price change the value of the units, which affects the Bank’s share-based paymentexpense. As described below, the value of a portion of the Performance Share Unit notional units also varies based on Bank performance. Uponexercise or redemption, payments are made to the employees with a corresponding reduction in the accrued liability.
In 2017, an aggregate expense of $203 million (2016 – $237 million) was recorded in salaries and employee benefits in the Consolidated Statementof Income for these plans. This expense includes gains from derivatives used to manage the volatility of share-based payment of $160 million (2016 –$121 million gains).
As at October 31, 2017, the share-based payment liability recognized for vested awards under these plans was $946 million (2016 –$849 million).
Details of these other share-based payment plans are as follows:
Deferred Stock Unit Plan (DSU)Under the DSU Plan, senior executives may elect to receive all or a portion of their cash bonus under the Annual Incentive Plan (which is expensed forthe year awarded in salaries and employee benefits in the Consolidated Statement of Income) in the form of deferred stock units which vestimmediately. In addition the DSU plan allows for eligible executives of the Bank to participate in grants that are not allocated from the AnnualIncentive Plan election. These grants are subject to specific vesting schedules. Units are redeemable in cash only when an executive ceases to be aBank employee, and must be redeemed by December 31 of the year following that event. As at October 31, 2017, there were 755,472 units (2016 –703,168) awarded and outstanding of which 684,017 units were vested (2016 – 703,168).
Directors’ Deferred Stock Unit Plan (DDSU)Under the DDSU Plan, non-officer directors of the Bank may elect to receive all or a portion of their fee for that fiscal year (which is expensed by theBank in other expenses in the Consolidated Statement of Income) in the form of deferred stock units which vest immediately. Units are redeemable incash, only following resignation or retirement, and must be redeemed by December 31 of the year following that event. As at October 31, 2017,there were 299,867 units outstanding (2016 – 348,197).
Restricted Share Unit Plan (RSU)Under the RSU Plan, selected employees receive an award of restricted share units which, for the majority of grants, vest at the end of three years.There are certain grants that provide for a graduated vesting schedule. Upon vesting all RSU units are paid in cash to the employee. The share-basedpayment expense is recognized evenly over the vesting period except where the employee is eligible to retire prior to the vesting date in which case,the expense is recognized between the grant date and the date the employee is eligible to retire. As at October 31, 2017, there were 2,197,100 units(2016 – 2,214,543) awarded and outstanding of which 1,497,340 were vested (2016 –1,537,076).
Performance Share Unit Plan (PSU)Eligible executives receive an award of performance share units, for the majority of grants vest at the end of three years. One grant provides for agraduated vesting schedule which includes a specific performance factor calculation. A portion of the PSU awards are subject to performance criteriameasured over a three-year period whereby a multiplier factor is applied which impacts the incremental number of outstanding shares due toemployees. The three-year performance measures include return on equity compared to target and total shareholder return relative to a comparatorgroup selected prior to the granting of the award. The Bank uses a probability-weighted-average of potential outcomes to estimate the multiplierimpact. The share-based payment expense is recognized over the vesting period except where the employee is eligible to retire prior to the vestingdate; in which case, the expense is recognized between the grant date and the date the employee is eligible to retire. This expense varies based onchanges in the Bank’s share price and the Bank’s performance compared to the performance measures. Upon vesting, the units are paid in cash to theemployee. As at October 31, 2017, there were 8,250,143 units (2016 – 8,588,753) outstanding subject to performance criteria, of which 6,718,738units were vested (2016 – 7,035,242).
Deferred Performance PlanUnder the Deferred Performance Plan, a portion of the bonus received by Global Banking and Markets employees (which is accrued and expensed inthe year to which it relates) is allocated to qualifying employees in the form of units. These units are subsequently paid in cash to the employees overeach of the following three years. Changes in the value of the units, which arise from fluctuations in the market price of the Bank’s common shares,are expensed in the same manner as the Bank’s other liability-classified share-based payment plans in the salaries and employee benefits expense inthe Consolidated Statement of Income. As at October 31, 2017, there were 1,587,037 units outstanding (2016 – 1,802,540).
2 0 1 7 S C O T I A B A N K A N N U A L R E P O R T | 185

CONSOLIDATED FINANCIAL STATEMENTS
26 Corporate Income Taxes
Corporate income taxes recorded in the Bank’s consolidated financial statements for the years ended October 31 are as follows:
(a) Components of income tax provision
For the year ended October 31 ($ millions) 2017 2016 2015
Provision for income taxes in the Consolidated Statement of Income:
Current income taxes:Domestic:
Federal $ 533 $ 467 $ 528Provincial 424 386 459Adjustments related to prior periods 24 4 23
Foreign 903 935 897Adjustments related to prior periods (29) (19) 2
1,855 1,773 1,909
Deferred income taxes:Domestic:
Federal 33 141 (16)Provincial 16 70 (20)
Foreign 129 46 (20)
178 257 (56)
Total provision for income taxes in the Consolidated Statement of Income $2,033 $ 2,030 $ 1,853
Provision for income taxes in the Consolidated Statement of Changes in Equity:Current income taxes $ 82 $ (158) $ (496)Deferred income taxes 198 (168) (8)
280 (326) (504)
Reported in:Other Comprehensive Income 275 (322) (464)Retained earnings (1) (10) (43)Common shares 1 1 1Other reserves 5 5 2
Total provision for income taxes in the Consolidated Statement of Changes in Equity 280 (326) (504)Total provision for income taxes $2,313 $ 1,704 $ 1,349
Provision for income taxes in the Consolidated Statement of Income includes:Deferred tax expense (benefit) relating to origination/reversal of temporary differences $ 191 $ 372 $ 118Deferred tax expense (benefit) of tax rate changes (2) (4) (2)Deferred tax expense (benefit) of previously unrecognized tax losses, tax credits and temporary differences (11) (111) (172)
$ 178 $ 257 $ (56)
(b) Reconciliation to statutory rateIncome taxes in the Consolidated Statement of Income vary from the amounts that would be computed by applying the composite federal andprovincial statutory income tax rate for the following reasons:
2017 2016 2015
For the year ended October 31 ($ millions) Amount
Percentof pre-tax
income Amount
Percentof pre-tax
income Amount
Percentof pre-tax
income
Income taxes at Canadian statutory rate $ 2,715 26.4% $ 2,485 26.4% $ 2,386 26.3%Increase (decrease) in income taxes resulting from:
Lower average tax rate applicable to subsidiaries and foreignbranches (286) (2.8) (234) (2.5) (233) (2.6)
Tax-exempt income from securities (407) (3.9) (220) (2.3) (281) (3.1)Deferred income tax effect of substantively enacted tax rate changes (2) – (4) – (2) –Other, net 13 0.1 3 – (17) (0.2)
Total income taxes and effective tax rate $ 2,033 19.8% $ 2,030 21.6% $ 1,853 20.4%
186 | 2 0 1 7 S C O T I A B A N K A N N U A L R E P O R T

CO
NSO
LIDA
TEDFIN
AN
CIA
LSTA
TEMEN
TS
(c) Deferred taxesSignificant components of the Bank’s deferred tax assets and liabilities are as follows:
Statement of Income Statement of Financial Position
For the year ended As at
October 31 ($ millions) 2017 2016 2017 2016
Deferred tax assets:Loss carryforwards $ 62 $ 57 $ 417 $ 484Allowance for credit losses 45 3 793 852Deferred compensation (25) (14) 219 224Deferred income (124) 18 405 289Property and equipment (19) 99 133 101Pension and other post-retirement benefits (6) 18 720 937Securities (17) 139 169 162Other (169) 57 640 511
Total deferred tax assets $ (253) $ 377 $3,496 $ 3,560
Deferred tax liabilities:Deferred income $ (21) $ 5 $ 133 $ 122Property and equipment (32) 7 138 75Pension and other post-retirement benefits (9) 25 136 146Securities 111 19 126 221Intangible assets (53) (129) 1,094 1,043Other (427) 193 853 543
Total deferred tax liabilities $ (431) $ 120 $2,480 $ 2,150Net deferred tax assets (liabilities)(1) $ 178 $ 257 $1,016 $ 1,410(1) For Consolidated Statement of Financial Position presentation, deferred tax assets and liabilities are assessed by legal entity. As a result, the net deferred tax assets of $1,016 (2016
– $1,410) are represented by deferred tax assets of $1,713 (2016 – $2,021), and deferred tax liabilities of $697 (2016 – $611) on the Consolidated Statement of Financial Position.
The major changes to net deferred taxes were as follows:
For the year ended October 31 ($ millions) 2017 2016
Balance at beginning of year $ 1,410 $ 1,435Deferred tax benefit (expense) for the year recorded in income (178) (257)Deferred tax benefit (expense) for the year recorded in equity (198) 168Acquired in business combinations – 71Other (18) (7)
Balance at end of year $ 1,016 $ 1,410
The tax related to temporary differences, unused tax losses and unused tax credits for which no deferred tax asset is recognized in the ConsolidatedStatement of Financial Position amounts to $82 million (October 31, 2016 – $55 million). The amount related to unrecognized losses is $9 million,which will expire as follows: $4 million in 2021 and beyond and $5 million have no fixed expiry date.
Included in the net deferred tax asset are tax benefits of $92 million (2016 – $73 million) that have been recognized in certain Canadian and foreignsubsidiaries that have incurred losses in either the current or the preceding year. In determining if it is appropriate to recognize these tax benefits, theBank relied on projections of future taxable profits.
The amount of taxable temporary differences associated with investments in subsidiaries, associates and interests in joint ventures for which deferredtax liabilities have not been recognized at October 31, 2017 is $27 billion (2016 – $24 billion).
Reassessment of dividend deductionsIn November 2016 the Bank received a federal reassessment of $179 million for tax and interest as a result of the Canada Revenue Agency denyingthe tax deductibility of certain Canadian dividends received during the 2011 taxation year. In August 2017, the Bank received a reassessment of$185 million for tax and interest for the 2012 taxation year. The circumstances of the dividends subject to the reassessment are similar to thoseprospectively addressed by recently enacted rules which had been introduced in the 2015 Canadian federal budget. The Bank is confident that its taxfiling position was appropriate and in accordance with the relevant provisions of the Income Tax Act (Canada), and intends to vigorously defend itsposition.
2 0 1 7 S C O T I A B A N K A N N U A L R E P O R T | 187

CONSOLIDATED FINANCIAL STATEMENTS
27 Employee Benefits
The Bank sponsors a number of employee benefit plans, including pensions (defined benefit and defined contribution) and other benefit plans (post-retirement benefits and other long-term employee benefits) for most of its employees globally. The information presented below relates to the Bank’sprincipal plans; other plans operated by certain subsidiaries of the Bank are not considered material and are not included in these disclosures.
Global pension plansThe principal pension plans include plans in Canada, the US, Mexico, the UK, Ireland, Jamaica, Trinidad & Tobago and other countries in theCaribbean in which the Bank operates. The Bank has a strong and well defined governance structure to manage these global obligations. Theinvestment policy for each principal plan is reviewed periodically and all plans are in good standing with respect to legislation and local regulations.
Actuarial valuations for funding purposes for the Bank’s funded pension plans are conducted as required by applicable legislation. The purpose of theactuarial valuation is to determine the funded status of the plans on a going-concern and statutory basis and to determine the required contributions.The plans are funded in accordance with applicable pension legislation and the Bank’s funding policies such that future benefit promises based onplan provisions are well secured. The assumptions used for the funding valuations are set by independent plan actuaries on the basis of therequirements of the local actuarial standards of practice and statutes.
Scotiabank Pension Plan (Canada)The most significant pension plan is the Scotiabank Pension Plan (SPP) in Canada, a defined benefit pension plan, which includes an optional definedcontribution (DC) component for employees in Canada hired on or after January 1, 2016. As the administrator of the SPP, the Bank has established awell-defined governance structure and policies to ensure compliance with legislative and regulatory requirements under OSFI and the Canada RevenueAgency. The Bank appoints a number of committees to oversee and make decisions related to the administration of the SPP. Certain committees arealso responsible for the investment of the assets of the SPP Fund and for monitoring the investment managers and performance.Š The Human Resources Committee (HRC) of the Board approves the charter of the Pension Administration and Investment Committee (PAIC),
reviews reports, and approves the investment policy. The HRC also reviews and recommends any amendments to the SPP to the Board of Directors.Š PAIC is responsible for recommending the investment policy to the HRC, for appointing and monitoring investment managers, and for reviewing
auditor and actuary reports. PAIC also monitors the administration of member pension benefits.Š The Scotiabank Master Trust Committee (MTC) invests assets in accordance with the investment policy and all applicable legislation. The MTC
assigns specific mandates to investment managers. PAIC and the MTC both have independent member representation on the committees.Š The Capital Accumulation Plans (CAP) Committee is responsible for the administration and investment of the DC component of the SPP including
the selection and monitoring of investment options available to DC participants.
Actuarial valuations for funding purposes for the SPP are conducted on an annual basis. The most recent funding valuation was conducted as ofNovember 1, 2016. Contributions are being made to the SPP in accordance with this valuation and are shown in the table in b) below. Theassumptions used for the funding valuation are set by independent plan actuaries on the basis of the requirements of the Canadian Institute ofActuaries and applicable regulation.
Other benefit plansThe principal other benefit plans include plans in Canada, the US, Mexico, Uruguay, the UK, Jamaica, Trinidad & Tobago, Colombia and othercountries in the Caribbean in which the Bank operates. The most significant other benefit plans provided by the Bank are in Canada.
Key assumptionsThe financial information reported below in respect of pension and other benefit plans are based on a number of assumptions. The most significantassumption is the discount rate used to determine the defined benefit obligation, which is set by reference to the yields on high quality corporatebonds that have durations that match the terms of the Bank’s obligations. Prior to 2016, the discount rate used to determine the annual benefitexpense was the same as the rate used to determine the defined benefit obligation at the beginning of the period. Beginning in 2016, separatediscount rates are used to determine the annual benefit expense in Canada and the US. These rates are determined with reference to the yields onhigh quality corporate bonds with durations that match the various components of the annual benefit expense. The discount rate used to determinethe annual benefit expense for all other plans continues to be same as the rate used to determine the defined benefit obligation at the beginning ofthe period. Other assumptions set by management are determined in reference to market conditions, plan-level experience, best practices and futureexpectations. The key weighted-average assumptions used by the Bank for the measurement of the benefit obligation and benefit expense for all ofthe Bank’s principal plans are summarized in the table in f) below.
Risk managementThe Bank’s defined benefit pension plans and other benefit plans expose the Bank to a number of risks. Some of the more significant risks includeinterest rate risk, investment risk, longevity risk and health care cost increases, among others. These risks could result in higher defined benefitexpense and a higher defined benefit obligation to the extent that:Š there is a decline in discount rates; and/orŠ plan assets returns are less than expected; and/orŠ plan members live longer than expected; and/orŠ health care costs are higher than assumed.
In addition to the governance structure and policies in place, the Bank manages risks by regularly monitoring market developments and assetinvestment performance. The Bank also monitors regulatory and legislative changes along with demographic trends and revisits the investmentstrategy and/or plan design as warranted.
188 | 2 0 1 7 S C O T I A B A N K A N N U A L R E P O R T

CO
NSO
LIDA
TEDFIN
AN
CIA
LSTA
TEMEN
TS
a) Relative size of plan obligations and assets
Pension plans Other benefit plans
Canada
For the year ended October 31, 2017 SPP Other International Canada International
Percentage of total benefit obligations 74% 11% 15% 63% 37%Percentage of total plan assets 76% 6% 18% 18% 82%Percentage of total benefit expense(1) 80% 16% 4% 51% 49%
Pension plans Other benefit plans
Canada
For the year ended October 31, 2016 SPP Other International Canada International
Percentage of total benefit obligations 73% 11% 16% 63% 37%Percentage of total plan assets 76% 6% 18% 19% 81%Percentage of total benefit expense(1) 76% 17% 7% 46% 54%(1) Excludes non-routine benefit expense items such as past service costs, curtailment charges and settlement charges.
b) Cash contributions and paymentsThe table below shows the cash contributions and payments made by the Bank to its principal plans in 2017, and the two prior years.
Contributions to the principal plans for the year ended October 31 ($ millions) 2017 2016 2015
Defined benefit pension plans (cash contributions to fund the plans, including paying beneficiaries under theunfunded pension arrangements)SPP $ 286 $ 187 $ 236All other plans 185 77 60
Other benefit plans (cash contributions mainly in the form of benefit payments to beneficiaries) 51 45 42Defined contribution pension plans (cash contributions) 35 31 29
Total contributions(1) $ 557 $ 340 $ 367(1) Based on preliminary estimates, the Bank expects to make contributions of $290 to the SPP, $35 to all other defined benefit pension plans, $58 to other benefit plans and $39 to all
other defined contribution plans for the year ending October 31, 2018.
c) Funded and unfunded plansThe excess (deficit) of the fair value of assets over the benefit obligation at the end of the year includes the following amounts for plans that arewholly unfunded and plans that are wholly or partly funded.
Pension plans Other benefit plans
As at October 31 ($ millions) 2017 2016 2015 2017 2016 2015
Benefit obligationBenefit obligation of plans that are wholly unfunded $ 418 $ 408 $ 373 $ 1,324 $ 1,310 $ 1,231Benefit obligation of plans that are wholly or partly funded 8,424 8,731 7,740 334 372 408
Funded statusBenefit obligation of plans that are wholly or partly funded $8,424 $ 8,731 $ 7,740 $ 334 $ 372 $ 408Fair value of assets 8,329 7,770 7,615 266 284 307
Excess (deficit) of fair value of assets over benefit obligation ofwholly or partly funded plans $ (95) $ (961) $ (125) $ (68) $ (88) $ (101)
Benefit obligation of plans that are wholly unfunded 418 408 373 1,324 1,310 1,231
Excess (deficit) of fair value of assets over total benefit obligation $ (513) $ (1,369) $ (498) $(1,392) $ (1,398) $ (1,332)Effect of asset limitation and minimum funding requirement (39) (60) (41) – – –
Net asset (liability) at end of year $ (552) $ (1,429) $ (539) $(1,392) $ (1,398) $ (1,332)
2 0 1 7 S C O T I A B A N K A N N U A L R E P O R T | 189

CONSOLIDATED FINANCIAL STATEMENTS
d) Financial informationThe following tables present financial information related to the Bank’s principal plans.
Pension plans Other benefit plans
For the year ended October 31 ($ millions) 2017 2016 2015 2017 2016 2015
Change in benefit obligationBenefit obligation at beginning of year $ 9,139 $ 8,113 $ 7,947 $ 1,682 $ 1,639 $ 1,619Current service cost 330 284 304 39 39 43Interest cost on benefit obligation 297 314 350 72 77 84Employee contributions 24 24 23 – – –Benefits paid (724) (593) (498) (76) (71) (73)Actuarial loss (gain) (46) 1,119 152 (36) 95 (52)Past service cost – (16) (241) 4 (77) 3Business combination – – – 1 9 –Settlements (157) – (48) – – (2)Foreign exchange (21) (106) 124 (28) (29) 17Benefit obligation at end of year $ 8,842 $ 9,139 $ 8,113 $ 1,658 $ 1,682 $ 1,639
Change in fair value of assetsFair value of assets at beginning of year 7,770 7,615 7,323 284 307 341Interest income on fair value of assets 273 310 343 19 22 23Return on plan assets in excess of interest income on fair value of
assets 700 275 55 1 5 (12)Employer contributions 471 264 296 51 45 42Employee contributions 24 24 23 – – –Benefits paid (724) (593) (498) (76) (71) (73)Administrative expenses (13) (12) (12) – – –Business combination – – – – 2 –Settlements (157) – (39) (1) – –Foreign exchange (15) (113) 124 (12) (26) (14)Fair value of assets at end of year $ 8,329 $ 7,770 $ 7,615 $ 266 $ 284 $ 307
Funded statusExcess (deficit) of fair value of assets over benefit obligation at end of
year (513) (1,369) (498) (1,392) (1,398) (1,332)Effect of asset limitation and minimum funding requirement(1) (39) (60) (41) – – –Net asset (liability) at end of year $ (552) $ (1,429) $ (539) $ (1,392) $ (1,398) $ (1,332)Recorded in:Other assets in the Bank’s Consolidated Statement of Financial Position 256 184 183 1 – –Other liabilities in the Bank’s Consolidated Statement of Financial
Position (808) (1,613) (722) (1,393) (1,398) (1,332)Net asset (liability) at end of year $ (552) $ (1,429) $ (539) $ (1,392) $ (1,398) $ (1,332)
Annual benefit expenseCurrent service cost 330 284 304 39 39 43Net interest expense (income) 29 9 15 53 55 60Administrative expenses 11 13 10 – – –Past service costs – (16) (241) 4 (77) 4Amount of settlement (gain) loss recognized – – (9) – – (2)Remeasurement of other long-term benefits – – – (3) (20) 4Benefit expense (income) recorded in the Consolidated Statement of
Income $ 370 $ 290 $ 79 $ 93 $ (3) $ 109Defined contribution benefit expense $ 35 $ 31 $ 29 $ – $ – $ –
Remeasurements(Return) on plan assets in excess of interest income on fair value of
assets (700) (275) (55) 1 (3) 13Actuarial loss (gain) on benefit obligation (46) 1,119 152 (35) 113 (58)Change in the asset limitation (25) 18 (49) – – –Remeasurements recorded in OCI $ (771) $ 862 $ 48 $ (34) $ 110 $ (45)
Total benefit cost $ (366) $ 1,183 $ 156 $ 59 $ 107 $ 64
Additional details on actual return on assets and actuarial (gains) andlosses
Actual return on assets (net of administrative expenses) $ 960 $ 573 $ 386 $ 20 $ 27 $ 11Actuarial (gains) and losses from changes in demographic assumptions (6) 9 91 – (5) (22)Actuarial (gains) and losses from changes in financial assumptions (71) 1,116 22 (13) 133 (28)Actuarial (gains) and losses from changes in experience 31 (6) 39 (23) (33) (2)
Additional details on fair value of pension plan assets investedIn Scotiabank securities (stock, bonds) 457 410 404 4 – –In property occupied by Scotiabank 4 5 5 – – –
Change in asset ceiling/onerous liabilityAsset ceiling /onerous liability at end of prior year 60 41 77 – – –Interest expense 5 5 8 – – –Remeasurements (25) 18 (49) – – –Foreign exchange (1) (4) 5 – – –Asset ceiling /onerous liability at end of year $ 39 $ 60 $ 41 $ – $ – $ –(1) The recognized asset is limited by the present value of economic benefits available from a reduction in future contributions to a plan and from the ability to pay plan expenses from
the fund.
190 | 2 0 1 7 S C O T I A B A N K A N N U A L R E P O R T
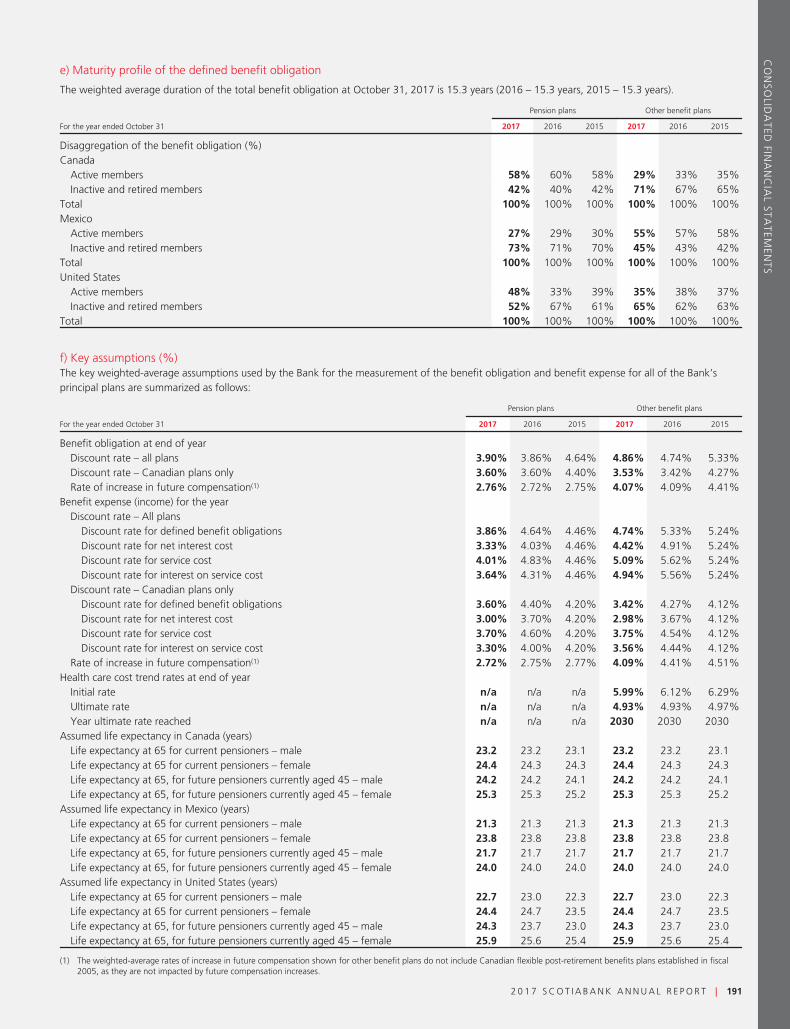
CO
NSO
LIDA
TEDFIN
AN
CIA
LSTA
TEMEN
TS
e) Maturity profile of the defined benefit obligation
The weighted average duration of the total benefit obligation at October 31, 2017 is 15.3 years (2016 – 15.3 years, 2015 – 15.3 years).
Pension plans Other benefit plans
For the year ended October 31 2017 2016 2015 2017 2016 2015
Disaggregation of the benefit obligation (%)Canada
Active members 58% 60% 58% 29% 33% 35%Inactive and retired members 42% 40% 42% 71% 67% 65%
Total 100% 100% 100% 100% 100% 100%Mexico
Active members 27% 29% 30% 55% 57% 58%Inactive and retired members 73% 71% 70% 45% 43% 42%
Total 100% 100% 100% 100% 100% 100%United States
Active members 48% 33% 39% 35% 38% 37%Inactive and retired members 52% 67% 61% 65% 62% 63%
Total 100% 100% 100% 100% 100% 100%
f) Key assumptions (%)The key weighted-average assumptions used by the Bank for the measurement of the benefit obligation and benefit expense for all of the Bank’sprincipal plans are summarized as follows:
Pension plans Other benefit plans
For the year ended October 31 2017 2016 2015 2017 2016 2015
Benefit obligation at end of yearDiscount rate – all plans 3.90% 3.86% 4.64% 4.86% 4.74% 5.33%Discount rate – Canadian plans only 3.60% 3.60% 4.40% 3.53% 3.42% 4.27%Rate of increase in future compensation(1) 2.76% 2.72% 2.75% 4.07% 4.09% 4.41%
Benefit expense (income) for the yearDiscount rate – All plans
Discount rate for defined benefit obligations 3.86% 4.64% 4.46% 4.74% 5.33% 5.24%Discount rate for net interest cost 3.33% 4.03% 4.46% 4.42% 4.91% 5.24%Discount rate for service cost 4.01% 4.83% 4.46% 5.09% 5.62% 5.24%Discount rate for interest on service cost 3.64% 4.31% 4.46% 4.94% 5.56% 5.24%
Discount rate – Canadian plans onlyDiscount rate for defined benefit obligations 3.60% 4.40% 4.20% 3.42% 4.27% 4.12%Discount rate for net interest cost 3.00% 3.70% 4.20% 2.98% 3.67% 4.12%Discount rate for service cost 3.70% 4.60% 4.20% 3.75% 4.54% 4.12%Discount rate for interest on service cost 3.30% 4.00% 4.20% 3.56% 4.44% 4.12%
Rate of increase in future compensation(1) 2.72% 2.75% 2.77% 4.09% 4.41% 4.51%Health care cost trend rates at end of year
Initial rate n/a n/a n/a 5.99% 6.12% 6.29%Ultimate rate n/a n/a n/a 4.93% 4.93% 4.97%Year ultimate rate reached n/a n/a n/a 2030 2030 2030
Assumed life expectancy in Canada (years)Life expectancy at 65 for current pensioners – male 23.2 23.2 23.1 23.2 23.2 23.1Life expectancy at 65 for current pensioners – female 24.4 24.3 24.3 24.4 24.3 24.3Life expectancy at 65, for future pensioners currently aged 45 – male 24.2 24.2 24.1 24.2 24.2 24.1Life expectancy at 65, for future pensioners currently aged 45 – female 25.3 25.3 25.2 25.3 25.3 25.2
Assumed life expectancy in Mexico (years)Life expectancy at 65 for current pensioners – male 21.3 21.3 21.3 21.3 21.3 21.3Life expectancy at 65 for current pensioners – female 23.8 23.8 23.8 23.8 23.8 23.8Life expectancy at 65, for future pensioners currently aged 45 – male 21.7 21.7 21.7 21.7 21.7 21.7Life expectancy at 65, for future pensioners currently aged 45 – female 24.0 24.0 24.0 24.0 24.0 24.0
Assumed life expectancy in United States (years)Life expectancy at 65 for current pensioners – male 22.7 23.0 22.3 22.7 23.0 22.3Life expectancy at 65 for current pensioners – female 24.4 24.7 23.5 24.4 24.7 23.5Life expectancy at 65, for future pensioners currently aged 45 – male 24.3 23.7 23.0 24.3 23.7 23.0Life expectancy at 65, for future pensioners currently aged 45 – female 25.9 25.6 25.4 25.9 25.6 25.4
(1) The weighted-average rates of increase in future compensation shown for other benefit plans do not include Canadian flexible post-retirement benefits plans established in fiscal2005, as they are not impacted by future compensation increases.
2 0 1 7 S C O T I A B A N K A N N U A L R E P O R T | 191

CONSOLIDATED FINANCIAL STATEMENTS
g) Sensitivity analysisThe sensitivity analysis presented represents the impact of a change in a single assumption with other assumptions left unchanged. For purposes ofthe sensitivity analysis, the present value of the defined benefit obligation has been calculated using the projected unit credit method at the end of thereporting period, which is the same as that applied in calculating the defined benefit obligation recognized in the statement of financial position.
Pension plans Other benefit plans
For the year ended October 31, 2017 ($ millions)Benefit
obligationBenefit
expenseBenefit
obligationBenefit
expense
Impact of the following changes:1% decrease in discount rate $ 1,529 $ 106 $ 257 $ 130.25% increase in rate of increase in future compensation 94 9 1 –1% increase in health care cost trend rate n/a n/a 153 161% decrease in health care cost trend rate n/a n/a (122) (12)1 year increase in Canadian life expectancy 162 9 24 11 year increase in Mexican life expectancy 3 – 3 –1 year increase in the United States life expectancy 5 – 5 –
h) AssetsThe Bank’s principal pension plans’ assets are generally invested with the long-term objective of maximizing overall expected returns, at an acceptablelevel of risk relative to the benefit obligation. A key factor in managing long-term investment risk is asset mix. Investing the pension assets in differentasset classes and geographic regions helps to mitigate risk and to minimize the impact of declines in any single asset class, particular region or type ofinvestment. Investment managers – including related-party managers – are typically hired and assigned specific mandates within each asset class.
Pension plan asset mix guidelines are set for the long term, and are documented in each plan’s investment policy. Asset mix policy typically alsoreflects the nature of the plan’s benefit obligations. Legislation places certain restrictions on asset mix – for example, there are usually limits onconcentration in any one investment. Other concentration and quality limits are also set forth in the investment policies. The use of derivatives isgenerally prohibited without specific authorization; currently, the main use of derivatives is for currency hedging. Asset mix guidelines are reviewed atleast once each year, and adjusted, where appropriate, based on market conditions and opportunities. However, large asset class shifts are rare, andtypically reflect a change in the pension plan’s situation (e.g. a plan termination). Actual asset mix is reviewed regularly, and rebalancing back to targetasset mix is considered – as needed – generally on a semi-annual basis. The Bank’s other benefit plans are generally not funded, with the exception ofcertain programs in Canada and Mexico.
The tables below shows the weighted-average actual and target asset allocations for the Bank’s principal plans at October 31, by asset category.
Pension plans Other benefit plans
Asset category %Actual2017
Actual2016
Actual2015
Actual2017
Actual2016
Actual2015
Cash and cash equivalents 2% 2% 2% 1% 2% 2%
Equity investmentsQuoted in an active market 43% 44% 44% 46% 45% 45%Non quoted 16% 16% 19% –% –% –%
59% 60% 63% 46% 45% 45%Fixed income investments
Quoted in an active market 5% 4% 5% 32% 29% 28%Non quoted 26% 27% 25% 21% 24% 25%
31% 31% 30% 53% 53% 53%Property
Quoted in an active market –% –% –% –% –% –%Non quoted –% –% –% –% –% –%
–% –% –% –% –% –%
OtherQuoted in an active market –% 1% –% –% –% –%Non quoted 8% 6% 5% –% –% –%
8% 7% 5% –% –% –%Total 100% 100% 100% 100% 100% 100%
Target asset allocation at October 31, 2017Asset category % Pension plans Other benefit plans
Cash and cash equivalents –% 2%Equity investments 59% 45%Fixed income investments 32% 53%Property 1% –%Other 8% –%Total 100% 100%
192 | 2 0 1 7 S C O T I A B A N K A N N U A L R E P O R T

CO
NSO
LIDA
TEDFIN
AN
CIA
LSTA
TEMEN
TS
28 Operating Segments
Scotiabank is a diversified financial services institution that provides a wide range of financial products and services to retail, commercial and corporatecustomers around the world. The Bank’s businesses are grouped into three business lines: Canadian Banking, International Banking and GlobalBanking and Markets. Other smaller business segments are included in the Other segment. The results of these business segments are based upon theinternal financial reporting systems of the Bank. The accounting policies used in these segments are generally consistent with those followed in thepreparation of the consolidated financial statements as disclosed in Note 3 of the consolidated financial statements. Notable accounting measurementdifferences are:
Š tax normalization adjustments related to the gross-up of income from associated corporations. This adjustment normalizes the effective tax rate inthe divisions to better present the contribution of the associated companies to the divisional results.
Š the grossing up of tax-exempt net interest income and non-interest income to an equivalent before-tax basis for those affected segments.
These differences in measurement enable comparison of net interest income and non-interest income arising from taxable and tax-exempt sources.
Scotiabank’s results, and average assets and liabilities, allocated by these operating segments, are as follows:
For the year ended October 31, 2017
Taxable equivalent basis ($ millions)Canadian
BankingInternational
BankingGlobal Banking
and Markets Other(1) Total
Net interest income(2) $ 7,363 $ 6,726 $ 1,336 $ (390) $ 15,035Non-interest income(3) 5,488 3,688 3,288 (344) 12,120
Total revenues 12,851 10,414 4,624 (734) 27,155Provision for credit losses 913 1,294 42 – 2,249Depreciation and amortization 412 283 55 11 761Non-interest expenses 6,075 5,381 2,105 308 13,869Income tax expense 1,387 828 604 (786) 2,033
Net income $ 4,064 $ 2,628 $ 1,818 $ (267) $ 8,243
Net income attributable to non-controlling interests in subsidiaries – 238 – – 238
Net income attributable to equity holders of the Bank 4,064 2,390 1,818 (267) 8,005
Average assets ($ billions) 323 148 336 106 913
Average liabilities ($ billions) 244 115 267 228 854
(1) Includes all other smaller operating segments and corporate adjustments, such as the elimination of the tax-exempt income gross-up reported in net interest income andnon-interest income and provision for income taxes for the year ended October 31, 2017 amounting to $562 to arrive at the amounts reported in the Consolidated Statement ofIncome, differences in the actual amount of costs incurred and charged to the operating segments.
(2) Interest income is reported net of interest expense as management relies primarily on net interest income as a performance measure.(3) Includes net income from investments in associated corporations for Canadian Banking – $66; International Banking – $482 and Other – $(141).
For the year ended October 31, 2016
Taxable equivalent basis ($ millions)Canadian
BankingInternational
BankingGlobal Banking
and Markets Other(1) Total
Net interest income(2) $ 7,024 $ 6,359 $ 1,293 $ (384) $ 14,292Non-interest income(3) 5,164 3,482 3,139 273 12,058
Total revenues 12,188 9,841 4,432 (111) 26,350Provision for credit losses 832 1,281 249 50 2,412Depreciation and amortization 340 265 68 11 684Non-interest expenses 5,984 5,258 1,972 642 13,856Income tax expense 1,296 707 572 (545) 2,030
Net income $ 3,736 $ 2,330 $ 1,571 $ (269) $ 7,368
Net income attributable to non-controlling interests in subsidiaries – 251 – – 251
Net income attributable to equity holders of the Bank 3,736 2,079 1,571 (269) 7,117
Average assets ($ billions) 309 143 351 111 914Average liabilities ($ billions) 232 109 270 247 858
(1) Includes all other smaller operating segments and corporate adjustments, such as the elimination of the tax-exempt income gross-up reported in net interest income andnon-interest income and provision for income taxes for the year ended October 31, 2016 amounting to $299 to arrive at the amounts reported in the Consolidated Statement ofIncome, differences in the actual amount of costs incurred and charged to the operating segments.
(2) Interest income is reported net of interest expense as management relies primarily on net interest income as a performance measure.(3) Includes net income from investments in associated corporations for Canadian Banking – $78; International Banking – $473 and Other – $(137).
2 0 1 7 S C O T I A B A N K A N N U A L R E P O R T | 193

CONSOLIDATED FINANCIAL STATEMENTS
For the year ended October 31, 2015
Taxable equivalent basis ($ millions)Canadian
BankingInternational
BankingGlobal Banking
and Markets Other(1) Total
Net interest income(2) $ 6,415 $ 5,706 $ 1,071 $ (100) $ 13,092Non-interest income(3) 4,832 3,137 2,953 35 10,957
Total revenues 11,247 8,843 4,024 (65) 24,049Provision for credit losses 687 1,128 67 60 1,942Depreciation and amortization 272 242 57 13 584Non-interest expenses 5,742 4,853 1,789 73 12,457Income tax expense 1,202 568 558 (475) 1,853
Net income $ 3,344 $ 2,052 $ 1,553 $ 264 $ 7,213
Net income attributable to non-controlling interests in subsidiaries – 199 – – 199
Net income attributable to equity holders of the Bank 3,344 1,853 1,553 264 7,014
Average assets ($ billions) 300 128 342 91 861Average liabilities ($ billions) 218 94 240 257 809
(1) Includes all other smaller operating segments and corporate adjustments, such as the elimination of the tax-exempt income gross-up reported in net interest income andnon-interest income and provision for income taxes for the year ended October 31, 2015 amounting to $390, to arrive at the amounts reported in the Consolidated Statement ofIncome, differences in the actual amount of costs incurred and charged to the operating segments.
(2) Interest income is reported net of interest expense as management relies primarily on net interest income as a performance measure.(3) Includes net income from investments in associated corporations for Canadian Banking – $66; International Banking – $476 and Other – $(137).
Geographical segmentationThe following table summarizes the Bank’s financial results by geographic region. Revenues and expenses which have not been allocated back tospecific operating business lines are reflected in corporate adjustments.
For the year ended October 31, 2017 ($ millions) CanadaUnitedStates Mexico Peru Chile Colombia
OtherInternational Total
Net interest income $ 7,440 $ 460 $ 1,380 $ 1,287 $ 817 $ 710 $ 2,999 $ 15,093Non-interest income(1) 6,924 830 536 635 409 455 2,502 12,291
Total revenues(2) 14,364 1,290 1,916 1,922 1,226 1,165 5,501 27,384Provision for credit losses 906 (14) 193 329 145 337 353 2,249Non-interest expenses 7,650 606 1,123 762 630 620 3,069 14,460Income tax expense 1,066 147 125 225 77 71 506 2,217
$ 4,742 $ 551 $ 475 $ 606 $ 374 $ 137 $ 1,573 $ 8,458Corporate adjustments (215)Net income $ 8,243Net income attributable to
non-controlling interests insubsidiaries 238
Net income attributable to equityholders of the Bank $ 8,005
Total average assets ($ billions) $ 539 $ 111 $ 28 $ 24 $ 23 $ 11 $ 162 $ 898Corporate adjustments 15Total average assets, including
corporate adjustments $ 913
(1) Includes net income from investments in associated corporations for Canada – $66; Peru – $6 and Other International – $476.(2) Revenues are attributed to countries based on where services are performed or assets are recorded.
For the year ended October 31, 2016 ($ millions) CanadaUnitedStates Mexico Peru Chile Colombia
OtherInternational Total
Net interest income $ 7,022 $ 479 $ 1,224 $ 1,231 $ 763 $ 674 $ 2,950 $ 14,343Non-interest income(1) 6,893 871 554 600 325 419 2,409 12,071
Total revenues(2) 13,915 1,350 1,778 1,831 1,088 1,093 5,359 26,414Provision for credit losses 876 112 225 315 113 320 401 2,362Non-interest expenses 7,339 633 1,121 740 605 550 3,036 14,024Income tax expense 1,235 155 69 201 45 89 497 2,291
$ 4,465 $ 450 $ 363 $ 575 $ 325 $ 134 $ 1,425 $ 7,737Corporate adjustments (369)Net income $ 7,368Net income attributable to non-controlling interests in
subsidiaries 251Net income attributable to equity holders of the Bank $ 7,117Total average assets ($ billions) $ 529 $ 126 $ 27 $ 23 $ 20 $ 10 $ 165 $ 900Corporate adjustments 14Total average assets, including corporate adjustments $ 914
(1) Includes net income from investments in associated corporations for Canada – $78; Peru – $5 and Other International – $468.(2) Revenues are attributed to countries based on where services are performed or assets are recorded.
194 | 2 0 1 7 S C O T I A B A N K A N N U A L R E P O R T

CO
NSO
LIDA
TEDFIN
AN
CIA
LSTA
TEMEN
TS
For the year ended October 31, 2015 ($ millions) CanadaUnitedStates Mexico Peru Chile Colombia
OtherInternational Total
Net interest income $ 6,458 $ 472 $ 1,246 $ 1,077 $ 554 $ 677 $ 2,631 $ 13,115Non-interest income(1) 6,272 882 561 601 231 372 2,163 11,082
Total revenues(2) 12,730 1,354 1,807 1,678 785 1,049 4,794 24,197Provision for credit losses 728 6 260 266 108 246 268 1,882Non-interest expenses 6,936 507 1,160 744 431 541 2,745 13,064Income tax expense 1,038 267 27 195 24 84 401 2,036
$ 4,028 $ 574 $ 360 $ 473 $ 222 $ 178 $ 1,380 $ 7,215Corporate adjustments (2)Net income $ 7,213
Net income attributable to non-controlling interests insubsidiaries 199
Net income attributable to equity holders of the Bank $ 7,014
Total average assets ($ billions) $ 502 $ 125 $ 26 $ 21 $ 17 $ 10 $ 148 $ 849Corporate adjustments 12Total average assets, including corporate adjustments $ 861
(1) Includes net income from investments in associated corporations for Canada – $66; Peru – $4 and Other International – $472.(2) Revenues are attributed to countries based on where services are performed or assets are recorded.
29 Related Party Transactions
Compensation of key management personnel of the BankKey management personnel are those persons having authority and responsibility for planning, directing and controlling the activities of the Bank,directly or indirectly, and comprise the directors of the Bank, the President and Chief Executive Officer, certain direct reports of the President andChief Executive Officer and Group Heads.
For the year ended October 31 ($ millions) 2017 2016
Salaries and cash incentives(1) $ 17 $ 20Equity-based payment(2) 25 24Pension and other benefits(1) 3 3
Total $ 45 $ 47(1) Expensed during the year.(2) Awarded during the year.
Directors can use some or all of their director fees earned to buy common shares of the Bank at market rates through the Director’s Share PurchasePlan. Non-officer directors may elect to receive all or a portion of their fees in the form of deferred stock units which vest immediately. Refer toNote 25 for further details of these plans.
Loans and deposits of key management personnel
As at October 31 ($ millions) 2017 2016
Loans $ 6 $ 6Deposits $ 8 $ 11
The Bank’s committed credit exposure to companies controlled by directors totaled $145.2 million as at October 31, 2017 (2016 – $99.5 million),while actual utilized amounts were $11.5 million (2016 – $3.9 million).
Transactions with associates and joint venturesIn the ordinary course of business, the Bank provides normal banking services and enters into transactions with its associated and other relatedcorporations on terms similar to those offered to non-related parties. If these transactions are eliminated on consolidation, they are not disclosed asrelated party transactions. Transactions between the Bank and its associated companies and joint ventures also qualify as related party transactionsand were recorded as follows:
As at and for the year ended October 31 ($ millions) 2017 2016 2015
Net income / (loss) $ (46) $ (45) $ (27)Loans 703 788 747Deposits 217 338 187Guarantees and commitments 114 99 84
Scotiabank principal pension planThe Bank manages assets of $3.0 billion (2016 – $1.9 billion) which is a portion of the Scotiabank principal pension plan assets and earned$3.7 million (2016 – $3.9 million) in fees.
2 0 1 7 S C O T I A B A N K A N N U A L R E P O R T | 195

CONSOLIDATED FINANCIAL STATEMENTS
30 Principal Subsidiaries and Non-Controlling Interests in Subsidiaries
(a) Principal subsidiaries(1)
The following table presents the major operating subsidiaries the Bank owns, directly or indirectly. All of these subsidiaries are included in the Bank’sconsolidated financial statements.
Carrying value of shares
As at October 31 ($ millions) Principal office 2017 2016(2)
Canadian
1832 Asset Management L.P. Toronto, Ontario $ 2,006 $ 1,7071985275 Ontario Inc. (previously HollisWealth Inc.)(3) Toronto, Ontario 3,604 3,427ADS Canadian Bank (previously Hollis Canadian Bank) Toronto, Ontario 399 387BNS Investments Inc. Toronto, Ontario 13,551 13,277
Montreal Trust Company of Canada Montreal, QuebecNational Trustco Inc. Toronto, Ontario 574 716
The Bank of Nova Scotia Trust Company Toronto, OntarioNational Trust Company Stratford, Ontario
RoyNat Inc. Calgary, Alberta 239 185Scotia Capital Inc. Toronto, Ontario 1,024 649Scotia Dealer Advantage Inc. Burnaby, British Columbia 567 504Scotia Life Insurance Company Toronto, Ontario 189 167Scotia Mortgage Corporation Toronto, Ontario 615 926Scotia Securities Inc. Toronto, Ontario 34 32Tangerine Bank Toronto, Ontario 3,488 3,489
International
Banco Colpatria Multibanca Colpatria S.A. (51%) Bogota, Colombia 1,160 1,194The Bank of Nova Scotia Berhad Kuala Lumpur, Malaysia 303 316The Bank of Nova Scotia International Limited Nassau, Bahamas 18,223 18,022
BNS Asia Limited SingaporeThe Bank of Nova Scotia Trust Company (Bahamas) Limited Nassau, BahamasGrupo BNS de Costa Rica, S.A. San Jose, Costa RicaScotiabank & Trust (Cayman) Ltd. Grand Cayman, Cayman IslandsScotiabank (Bahamas) Limited Nassau, BahamasScotiabank (British Virgin Islands) Limited Road Town, Tortola, B.V.I.Scotiabank (Hong Kong) Limited Hong Kong, ChinaScotiabank (Ireland) Designated Activity Company Dublin, IrelandScotiabank (Turks and Caicos) Ltd. Providenciales, Turks and Caicos IslandsBNS International (Panama) S.A.
Grupo Financiero Scotiabank Inverlat, S.A. de C.V. (97.4%) Mexico, D.F., Mexico 3,544 3,204Nova Scotia Inversiones Limitada Santiago, Chile 3,325 3,056
Scotiabank Chile S.A (99.6%) Santiago, ChileScotia Holdings (US) Inc.(4) Houston, Texas
Scotiabanc Inc. Houston, TexasScotia Capital (USA) Inc.(4)(5) New York, New York
Scotia International Limited Nassau, Bahamas 642 641Scotiabank Anguilla Limited The Valley, Anguilla
Scotiabank Brasil S.A. Banco Multiplo Sao Paulo, Brazil 223 227Scotiabank Caribbean Holdings Ltd. Bridgetown, Barbados 1,710 1,634
Scotia Group Jamaica Limited (71.8%) Kingston, JamaicaThe Bank of Nova Scotia Jamaica Limited Kingston, JamaicaScotia Investments Jamaica Limited Kingston, Jamaica
Scotiabank (Belize) Ltd. Belize City, BelizeScotiabank Trinidad and Tobago Limited (50.9%) Port of Spain, Trinidad and TobagoScotiabank (Panama) S.A.
Scotiabank Uruguay S.A. Montevideo, Uruguay 496 491Scotiabank de Puerto Rico San Juan, Puerto Rico 1,395 1,361Scotiabank El Salvador, S.A. (99.4%) San Salvador, El Salvador 659 651Scotiabank Europe plc London, United Kingdom 2,400 2,539Scotiabank Peru S.A.A. (98.05%) Lima, Peru 4,518 3,953
(1) The Bank (or immediate parent of an entity) owns 100% of the outstanding voting shares of each subsidiary unless otherwise noted.(2) Prior period amounts have been restated to conform with current period presentation.(3) Effective November 1, 2017, the name was changed to 1985275 Ontario Inc.(4) The carrying value of this subsidiary is included with that of its parent, BNS Investments Inc.(5) The carrying value of this subsidiary is included with that of its parent, Scotia Holdings (US) Inc.
196 | 2 0 1 7 S C O T I A B A N K A N N U A L R E P O R T
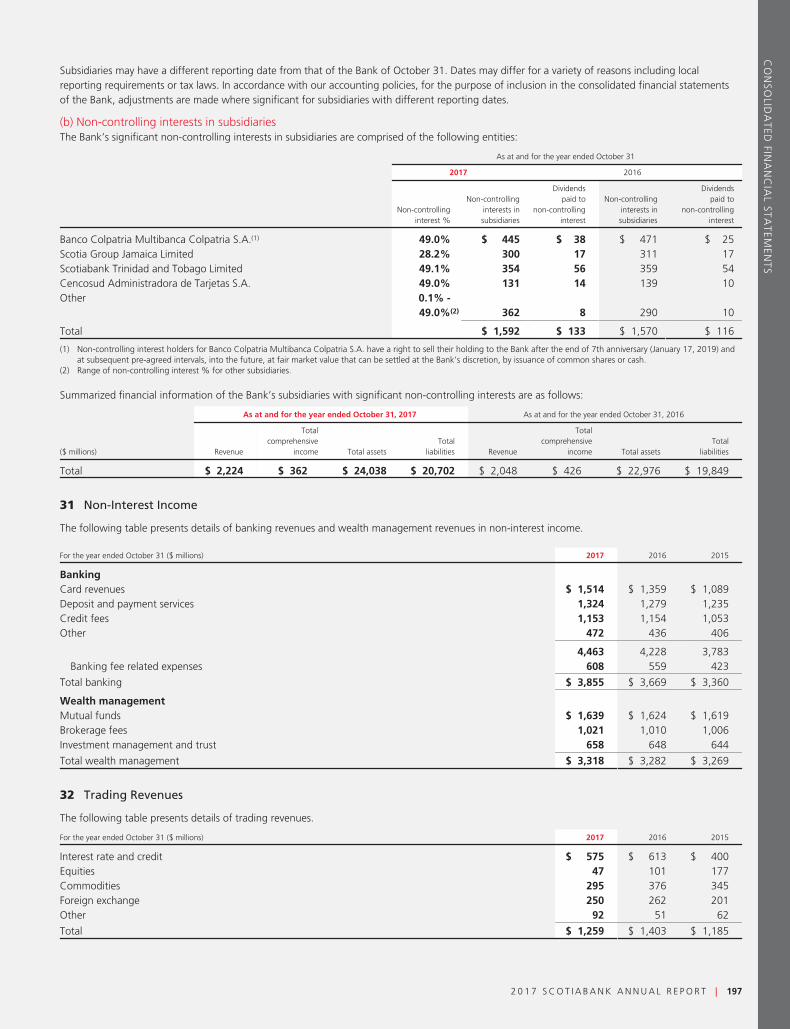
CO
NSO
LIDA
TEDFIN
AN
CIA
LSTA
TEMEN
TS
Subsidiaries may have a different reporting date from that of the Bank of October 31. Dates may differ for a variety of reasons including localreporting requirements or tax laws. In accordance with our accounting policies, for the purpose of inclusion in the consolidated financial statementsof the Bank, adjustments are made where significant for subsidiaries with different reporting dates.
(b) Non-controlling interests in subsidiariesThe Bank’s significant non-controlling interests in subsidiaries are comprised of the following entities:
As at and for the year ended October 31
2017 2016
Non-controllinginterest %
Non-controllinginterests insubsidiaries
Dividendspaid to
non-controllinginterest
Non-controllinginterests insubsidiaries
Dividendspaid to
non-controllinginterest
Banco Colpatria Multibanca Colpatria S.A.(1) 49.0% $ 445 $ 38 $ 471 $ 25Scotia Group Jamaica Limited 28.2% 300 17 311 17Scotiabank Trinidad and Tobago Limited 49.1% 354 56 359 54Cencosud Administradora de Tarjetas S.A. 49.0% 131 14 139 10Other 0.1% -
49.0%(2) 362 8 290 10
Total $ 1,592 $ 133 $ 1,570 $ 116
(1) Non-controlling interest holders for Banco Colpatria Multibanca Colpatria S.A. have a right to sell their holding to the Bank after the end of 7th anniversary (January 17, 2019) andat subsequent pre-agreed intervals, into the future, at fair market value that can be settled at the Bank’s discretion, by issuance of common shares or cash.
(2) Range of non-controlling interest % for other subsidiaries.
Summarized financial information of the Bank’s subsidiaries with significant non-controlling interests are as follows:
As at and for the year ended October 31, 2017 As at and for the year ended October 31, 2016
($ millions) Revenue
Totalcomprehensive
income Total assetsTotal
liabilities Revenue
Totalcomprehensive
income Total assetsTotal
liabilities
Total $ 2,224 $ 362 $ 24,038 $ 20,702 $ 2,048 $ 426 $ 22,976 $ 19,849
31 Non-Interest Income
The following table presents details of banking revenues and wealth management revenues in non-interest income.
For the year ended October 31 ($ millions) 2017 2016 2015
BankingCard revenues $ 1,514 $ 1,359 $ 1,089Deposit and payment services 1,324 1,279 1,235Credit fees 1,153 1,154 1,053Other 472 436 406
4,463 4,228 3,783Banking fee related expenses 608 559 423
Total banking $ 3,855 $ 3,669 $ 3,360
Wealth managementMutual funds $ 1,639 $ 1,624 $ 1,619Brokerage fees 1,021 1,010 1,006Investment management and trust 658 648 644
Total wealth management $ 3,318 $ 3,282 $ 3,269
32 Trading Revenues
The following table presents details of trading revenues.
For the year ended October 31 ($ millions) 2017 2016 2015
Interest rate and credit $ 575 $ 613 $ 400Equities 47 101 177Commodities 295 376 345Foreign exchange 250 262 201Other 92 51 62
Total $ 1,259 $ 1,403 $ 1,185
2 0 1 7 S C O T I A B A N K A N N U A L R E P O R T | 197

CONSOLIDATED FINANCIAL STATEMENTS
33 Earnings Per Share
For the year ended October 31 ($ millions) 2017 2016 2015
Basic earnings per common shareNet income attributable to common shareholders $ 7,876 $ 6,987 $ 6,897Weighted average number of common shares outstanding (millions) 1,203 1,204 1,210
Basic earnings per common share(1) (in dollars) $ 6.55 $ 5.80 $ 5.70
Diluted earnings per common shareNet income attributable to common shareholders $ 7,876 $ 6,987 $ 6,897Adjustments to net income due to share-based payment options and others(2) 59 83 86
Net income attributable to common shareholders (diluted) $ 7,935 $ 7,070 $ 6,983
Weighted average number of common shares outstanding (millions) 1,203 1,204 1,210Adjustments to average shares due to share-based payment options and others(2) (millions) 20 22 22
Weighted average number of diluted common shares outstanding (millions) 1,223 1,226 1,232
Diluted earnings per common share(1) (in dollars) $ 6.49 $ 5.77 $ 5.67
(1) Earnings per share calculations are based on full dollar and share amounts.(2) Certain tandem stock appreciation rights or options that the Bank may settle at its own discretion by issuing common shares were not included in the calculation of diluted earnings
per share as they were anti-dilutive.
34 Guarantees, Commitments and Pledged Assets
(a) GuaranteesThe Bank enters into various types of guarantees and indemnifications in the normal course of business. Guarantees represent an undertaking toanother party to make a payment to that party when certain specified events occur. The various guarantees and indemnifications that the Bankprovides with respect to its customers and other third parties are presented below:
2017 2016
As at October 31 ($ millions)
Maximum potentialamount of future
payments(1)
Maximum potentialamount of future
payments(1)
Standby letters of credit and letters of guarantee $ 35,523 $ 34,520Liquidity facilities 4,996 5,814Derivative instruments 5,398 4,129Indemnifications 587 597
(1) The maximum potential amount of future payments represents those guarantees that can be quantified and excludes other guarantees that cannot be quantified. As many of theseguarantees will not be drawn upon and the maximum potential amount of future payments listed above does not consider the possibility of recovery under recourse or collateralprovisions, the above amounts are not indicative of future cash requirements, credit risk, or the Bank’s expected losses from these arrangements.
(i) Standby letters of credit and letters of guaranteeStandby letters of credit and letters of guarantee are irrevocable undertakings by the Bank on behalf of a customer, to make payments to a third partyin the event that the customer is unable to meet its obligations to the third party. Generally, the term of these guarantees does not exceed four years.The types and amounts of collateral security held by the Bank for these guarantees is generally the same as for loans. As at October 31, 2017,$4 million (2016 – $19 million) was included in other liabilities in the Consolidated Statement of Financial Position with respect to these guarantees.
(ii) Liquidity facilitiesThe Bank’s backstop liquidity facilities are committed liquidity and provided to asset-backed commercial paper conduits, administered by the Bank.These facilities generally provide an alternative source of financing in the event market disruption prevents the conduit from issuing commercial paperor, in some cases, when certain specified conditions or performance measures are not met. These facilities generally have a term of up to three years.
(iii) Derivative instrumentsThe Bank enters into written credit derivative contracts under which a counterparty is compensated for losses on a specified referenced asset, typicallya loan or bond, if certain events occur. The Bank also enters into written option contracts under which a counterparty is granted the right, but not theobligation, to sell a specified quantity of a financial instrument at a pre-determined price on or before a set date. These written option contracts arenormally referenced to interest rates, foreign exchange rates, commodity prices or equity prices. Typically, a corporate or government entity is thecounterparty to the written credit derivative and option contracts that meet the characteristics of guarantees described above. The maximum potentialamount of future payments disclosed in the table above relates to written credit derivatives, puts and floors. However, these amounts exclude certainderivatives contracts, such as written caps, as the nature of these contracts prevents quantification of the maximum potential amount of futurepayments. As at October 31, 2017, $274 million (2016 – $333 million) was included in derivative instrument liabilities in the Consolidated Statementof Financial Position with respect to these derivative instruments.
(iv) IndemnificationsIn the ordinary course of business, the Bank enters into many contracts which contain indemnification provisions, such as purchase contracts, serviceagreements, trademark licensing agreements, director / officer contracts, escrow arrangements, sales of assets or businesses, outsourcing agreements,leasing arrangements, clearing system arrangements, securities lending agency agreements and structured transactions. The Bank cannot estimate themaximum potential future amount that may be payable. The Bank has not made any significant payments under such indemnifications. Historically,
198 | 2 0 1 7 S C O T I A B A N K A N N U A L R E P O R T

CO
NSO
LIDA
TEDFIN
AN
CIA
LSTA
TEMEN
TS
the Bank has not made any significant payments under these indemnities. As at October 31, 2017, $2 million (2016 – $3 million) was included inother liabilities in the Consolidated Statement of Financial Position with respect to indemnifications.
(b) Other indirect commitmentsIn the normal course of business, various other indirect commitments are outstanding which are not reflected on the Consolidated Statement ofFinancial Position. These may include:Š Commercial letters of credit which require the Bank to honour drafts presented by a third-party when specific activities are completed;Š Commitments to extend credit which represent undertakings to make credit available in the form of loans or other financings for specific amounts
and maturities, subject to specific conditions;Š Securities lending transactions under which the Bank, acting as principal or agent, agrees to lend securities to a borrower. The borrower must fully
collateralize the security loan at all times. The market value of the collateral is monitored relative to the amounts due under the agreements, andwhere necessary, additional collateral is obtained; and
Š Security purchase commitments which require the Bank to fund future investments.
These financial instruments are subject to normal credit standards, financial controls and monitoring procedures.
The table below provides a detailed breakdown of the Bank’s other indirect commitments expressed in terms of the contractual amounts of therelated commitment or contract which are not reflected on the Consolidated Statement of Financial Position.
As at October 31 ($ millions) 2017 2016
Commercial letters of credit $ 821 $ 777Commitments to extend credit(1)
Original term to maturity of one year or less 57,321 69,865Original term to maturity of more than one year 128,345 104,380
Securities lending 40,535 38,668Securities purchase and other commitments 614 538
Total $ 227,636 $ 214,228
(1) Includes liquidity facilities.
(c) Lease commitments
Operating lease commitmentsThe Bank leases various offices, branches and other premises under non-cancellable operating lease arrangements. The leases have various terms,escalation and renewal rights. There are no contingent rents payable. The Bank also leases equipment under non-cancellable lease arrangements.Where the Bank is the lessee, the future minimum lease payment under non-cancellable operating leases are as follows:
As at October 31 ($ millions) 2017 2016
Within one year $ 349 $ 344After one year but not more than five years 967 922More than five years 593 536
Total $1,909 $ 1,802
Building rent expense, included in premises and technology expense in the Consolidated Statement of Income, was $444 million (2016 –$428 million).
(d) Assets pledged and repurchase agreementsIn the ordinary course of business, securities and other assets are pledged against liabilities. As well, securities are sold under repurchase agreements.The carrying value of pledged assets and details of related activities are shown below.
As at October 31 ($ millions) 2017 2016
Assets pledged to:Bank of Canada(1) $ 25 $ 25Foreign governments and central banks(1) 2,653 3,080Clearing systems, payment systems and depositories(1) 1,195 1,400Assets pledged in relation to exchange-traded derivative transactions 2,181 2,128Assets pledged in relation to over-the-counter derivative transactions 8,126 10,505Assets pledged as collateral related to securities borrowing and lending 115,987 107,901Assets pledged in relation to covered bond program (Note 14) 27,806 30,491Assets pledged in relation to other securitization programs (Note 14) 4,801 3,919Assets pledged under CMHC programs (Note 13) 20,471 20,672Other 643 1,031
Total assets pledged $ 183,888 $ 181,152Obligations related to securities sold under repurchase agreements 86,789 87,402
Total(2) $ 270,677 $ 268,554
(1) Includes assets pledged in order to participate in clearing and payment systems and depositories, or pledged to have access to the facilities of central banks in foreign jurisdictions.(2) Includes assets that have been received from counterparties through normal course of business in securities financing and derivative transactions.
2 0 1 7 S C O T I A B A N K A N N U A L R E P O R T | 199
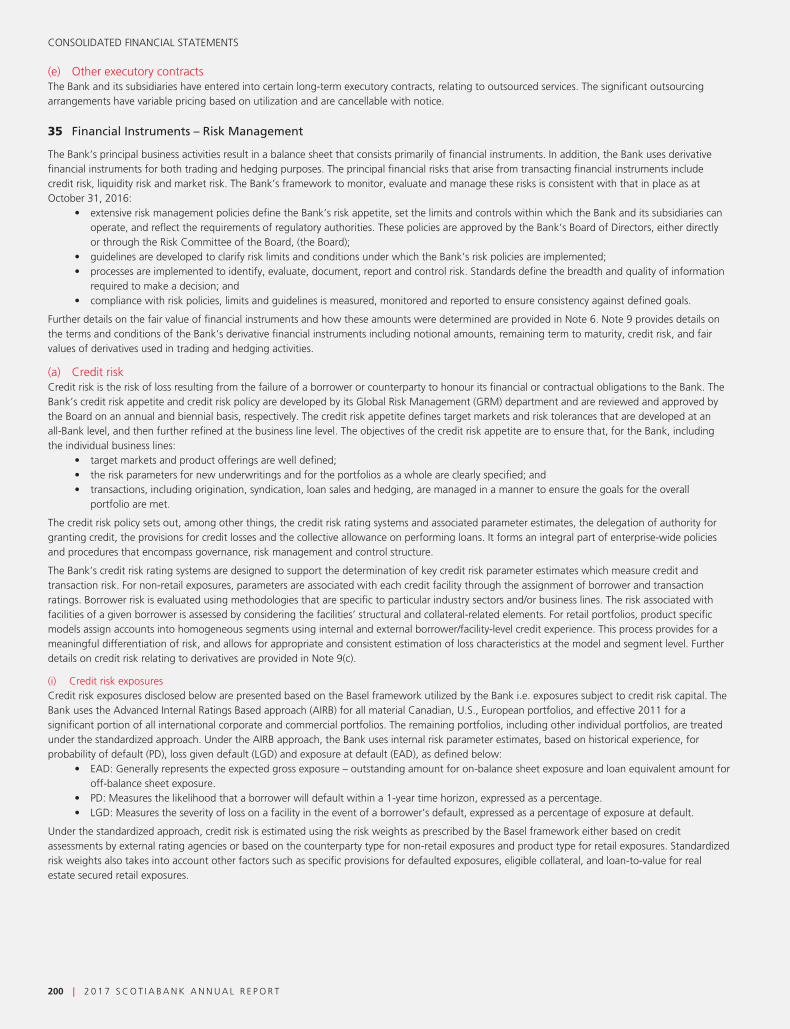
CONSOLIDATED FINANCIAL STATEMENTS
(e) Other executory contractsThe Bank and its subsidiaries have entered into certain long-term executory contracts, relating to outsourced services. The significant outsourcingarrangements have variable pricing based on utilization and are cancellable with notice.
35 Financial Instruments – Risk Management
The Bank’s principal business activities result in a balance sheet that consists primarily of financial instruments. In addition, the Bank uses derivativefinancial instruments for both trading and hedging purposes. The principal financial risks that arise from transacting financial instruments includecredit risk, liquidity risk and market risk. The Bank’s framework to monitor, evaluate and manage these risks is consistent with that in place as atOctober 31, 2016:
• extensive risk management policies define the Bank’s risk appetite, set the limits and controls within which the Bank and its subsidiaries canoperate, and reflect the requirements of regulatory authorities. These policies are approved by the Bank’s Board of Directors, either directlyor through the Risk Committee of the Board, (the Board);
• guidelines are developed to clarify risk limits and conditions under which the Bank’s risk policies are implemented;• processes are implemented to identify, evaluate, document, report and control risk. Standards define the breadth and quality of information
required to make a decision; and• compliance with risk policies, limits and guidelines is measured, monitored and reported to ensure consistency against defined goals.
Further details on the fair value of financial instruments and how these amounts were determined are provided in Note 6. Note 9 provides details onthe terms and conditions of the Bank’s derivative financial instruments including notional amounts, remaining term to maturity, credit risk, and fairvalues of derivatives used in trading and hedging activities.
(a) Credit riskCredit risk is the risk of loss resulting from the failure of a borrower or counterparty to honour its financial or contractual obligations to the Bank. TheBank’s credit risk appetite and credit risk policy are developed by its Global Risk Management (GRM) department and are reviewed and approved bythe Board on an annual and biennial basis, respectively. The credit risk appetite defines target markets and risk tolerances that are developed at anall-Bank level, and then further refined at the business line level. The objectives of the credit risk appetite are to ensure that, for the Bank, includingthe individual business lines:
• target markets and product offerings are well defined;• the risk parameters for new underwritings and for the portfolios as a whole are clearly specified; and• transactions, including origination, syndication, loan sales and hedging, are managed in a manner to ensure the goals for the overall
portfolio are met.
The credit risk policy sets out, among other things, the credit risk rating systems and associated parameter estimates, the delegation of authority forgranting credit, the provisions for credit losses and the collective allowance on performing loans. It forms an integral part of enterprise-wide policiesand procedures that encompass governance, risk management and control structure.
The Bank’s credit risk rating systems are designed to support the determination of key credit risk parameter estimates which measure credit andtransaction risk. For non-retail exposures, parameters are associated with each credit facility through the assignment of borrower and transactionratings. Borrower risk is evaluated using methodologies that are specific to particular industry sectors and/or business lines. The risk associated withfacilities of a given borrower is assessed by considering the facilities’ structural and collateral-related elements. For retail portfolios, product specificmodels assign accounts into homogeneous segments using internal and external borrower/facility-level credit experience. This process provides for ameaningful differentiation of risk, and allows for appropriate and consistent estimation of loss characteristics at the model and segment level. Furtherdetails on credit risk relating to derivatives are provided in Note 9(c).
(i) Credit risk exposuresCredit risk exposures disclosed below are presented based on the Basel framework utilized by the Bank i.e. exposures subject to credit risk capital. TheBank uses the Advanced Internal Ratings Based approach (AIRB) for all material Canadian, U.S., European portfolios, and effective 2011 for asignificant portion of all international corporate and commercial portfolios. The remaining portfolios, including other individual portfolios, are treatedunder the standardized approach. Under the AIRB approach, the Bank uses internal risk parameter estimates, based on historical experience, forprobability of default (PD), loss given default (LGD) and exposure at default (EAD), as defined below:
• EAD: Generally represents the expected gross exposure – outstanding amount for on-balance sheet exposure and loan equivalent amount foroff-balance sheet exposure.
• PD: Measures the likelihood that a borrower will default within a 1-year time horizon, expressed as a percentage.• LGD: Measures the severity of loss on a facility in the event of a borrower’s default, expressed as a percentage of exposure at default.
Under the standardized approach, credit risk is estimated using the risk weights as prescribed by the Basel framework either based on creditassessments by external rating agencies or based on the counterparty type for non-retail exposures and product type for retail exposures. Standardizedrisk weights also takes into account other factors such as specific provisions for defaulted exposures, eligible collateral, and loan-to-value for realestate secured retail exposures.
200 | 2 0 1 7 S C O T I A B A N K A N N U A L R E P O R T

CO
NSO
LIDA
TEDFIN
AN
CIA
LSTA
TEMEN
TS
As at October 31 ($ millions) 2017 2016
Exposure at default(1)
Category Drawn(2)Undrawn
commitmentsOther
exposures(3) Total Total
By counterparty typeNon-retailAIRB portfolio
Corporate $ 134,006 $ 75,962 $ 75,223 $ 285,191 $ 268,154Bank 19,734 2,560 18,609 40,903 49,662Sovereign 189,400 820 5,209 195,429 187,698
343,140 79,342 99,041 521,523 505,514
Standardized portfolioCorporate 50,614 5,252 3,298 59,164 55,682Bank 2,489 96 34 2,619 2,278Sovereign 6,134 203 – 6,337 8,412
59,237 5,551 3,332 68,120 66,372Total non-retail $ 402,377 $ 84,893 $ 102,373 $ 589,643 $ 571,886
RetailAIRB portfolio
Real estate secured 127,804 15,356 – 143,160 121,358Qualifying revolving 16,939 27,445 – 44,384 37,825Other retail 30,372 1,300 – 31,672 29,045
$ 175,115 $ 44,101 $ – $ 219,216 $ 188,228
Standardized portfolioReal estate secured 34,002 – – 34,002 30,865Other retail 35,552 – – 35,552 33,936
69,554 – – 69,554 64,801Total retail $ 244,669 $ 44,101 $ – $ 288,770 $ 253,029
Total $ 647,046 $ 128,994 $ 102,373 $ 878,413 $ 824,915
By geography(4)
Canada $ 379,297 $ 82,001 $ 40,926 $ 502,224 $ 468,923United States 88,623 31,008 37,755 157,386 143,808Mexico 26,841 1,152 2,535 30,528 26,873Peru 23,767 1,551 3,415 28,733 28,328Chile 24,680 754 1,756 27,190 23,510Colombia 10,372 150 337 10,859 10,943Other International
Europe 25,216 6,586 11,228 43,030 41,525Caribbean 36,505 1,554 1,299 39,358 41,168Latin America (other) 8,194 542 299 9,035 8,908All other 23,551 3,696 2,823 30,070 30,929
Total $ 647,046 $ 128,994 $ 102,373 $ 878,413 $ 824,915
(1) Exposure at default is presented after credit risk mitigation. Exposures exclude available-for-sale equity securities and other assets.(2) Non-retail drawn includes loans, acceptances, deposits with financial institutions and available-for-sale debt securities. Retail drawn includes residential mortgages, credit cards, lines
of credit, and other personal loans.(3) Non-retail other exposures include off-balance sheet lending instruments such as letters of credit, letters of guarantees, securitizations including nil first loss protection (2016 – $20),
derivatives and repo-style transactions (reverse repurchase agreements, repurchase agreements, securities lending and securities borrowing), net of related collateral. Not applicablefor retail exposures.
(4) Geographic segmentation is based upon the location of the ultimate risk of the credit exposure.
2 0 1 7 S C O T I A B A N K A N N U A L R E P O R T | 201

CONSOLIDATED FINANCIAL STATEMENTS
Consolidated Statement of Financial Position asset categories cross-referenced to credit risk exposuresThe table below provides mapping of on-balance sheet asset categories that are included in the various Basel III exposure categories as presented inthe credit risk exposure summary table of these consolidated financial statements. In addition, it also provides other exposures which are subject tomarket risk and/or other assets which are not subject to market and credit risk with a reconciliation to the Consolidated Statement of FinancialPosition. The credit risk exposures on certain assets such as cash, precious metals, investment securities (equities) and other assets are not included onthe credit risk exposure summary table. Also excluded from the credit risk exposures are certain trading assets and all assets of the Bank’s insurancesubsidiaries.
Credit Risk Exposures Other Exposures
Drawn Other Exposures Market Risk Exposures
As at October 31, 2017 ($ millions) Non-retail Retail SecuritizationRepo-style
TransactionsOTC
Derivatives Equity
Alsosubject to
Credit Risk All Other(1) Total
Cash and deposits with financialinstitutions $ 57,104 $ – $ – $ – $ – $ – $ – $ – $ 2,559 $ 59,663
Precious metals – – – – – – – 5,717 – 5,717Trading assets
Securities – – – – – – – 78,652 – 78,652Loans 9,087 – – – – – 9,087 8,225 – 17,312Other – – – – – – – 2,500 – 2,500
Financial assets designated at fair valuethrough profit or loss 13 – – – – – – – – 13
Securities purchased under resaleagreements and securities borrowed – – – 95,319 – – – – – 95,319
Derivative financial instruments – – – – 35,364 – 30,648 – – 35,364Investment securities 67,255 – – – – 1,281 – – 733 69,269Loans:
Residential mortgages(2) 95,692 141,066 – – – – – – 158 236,916Personal and credit cards – 100,181 2,038 – – – – – 1,112 103,331Business & government 158,510 2,878 7,032 – – – – – 29 168,449
Allowances for credit losses(3) (649) – – – – – – – (3,678) (4,327)Customers’ liability under acceptances 13,560 – – – – – – – – 13,560Property and equipment – – – – – – – – 2,381 2,381Investment in associates – – – – – – – – 4,586 4,586Goodwill and other intangibles assets – – – – – – – – 12,106 12,106Other (including Deferred tax assets) 1,805 545 – – – – – – 12,112 14,462
Total $402,377 $ 244,670 $ 9,070 $ 95,319 $ 35,364 $ 1,281 $ 39,735 $ 95,094 $ 32,098 $ 915,273
(1) Includes the Bank’s insurance subsidiaries’ assets and all other assets which are not subject to credit and market risks.(2) Includes $91.7 billion in mortgages guaranteed by Canada Mortgage Housing Corporation including 90% of privately insured mortgages.(3) Amounts for AIRB exposures are reported gross of allowances and amounts for standardized exposures are reported net of allowances.
Credit Risk Exposures Other Exposures
Drawn Other Exposures Market Risk Exposures
As at October 31, 2016 ($ millions) Non-retail Retail SecuritizationRepo-style
TransactionsOTC
Derivatives Equity
Alsosubject to
Credit Risk All Other(1) Total
Cash and deposits with financialinstitutions $ 44,001 $ – $ – $ – $ – $ – $ – $ – $ 2,343 $ 46,344
Precious metals – – – – – – – 8,442 – 8,442Trading assets
Securities – – – – – – – 87,287 – 87,287Loans 11,485 – – – – – 11,485 7,936 – 19,421Other – – – – – – – 1,853 – 1,853
Financial assets designated at fair valuethrough profit or loss 16 – – – – – – 205 – 221
Securities purchased under resaleagreements and securities borrowed – – – 92,129 – – – – – 92,129
Derivative financial instruments – – – – 41,657 – 36,401 – – 41,657Investment securities 68,134 – 832 – – 2,042 – – 1,911 72,919Loans:
Residential mortgages(2) 104,890 117,839 – – – – – – 159 222,888Personal and credit cards – 95,825 2,418 – – – – – 1,259 99,502Business & government 152,720 2,489 7,161 – – – – – 30 162,400
Allowances for credit losses(3) (781) – – – – – – – (3,845) (4,626)Customers’ liability under acceptances 11,978 – – – – – – – – 11,978Property and equipment – – – – – – – – 2,520 2,520Investment in associates – – – – – – – – 4,299 4,299Goodwill and other intangibles assets – – – – – – – – 12,141 12,141Other (including Deferred tax assets) 637 383 – – – – – – 13,871 14,891
Total $ 393,080 $ 216,536 $ 10,411 $ 92,129 $ 41,657 $ 2,042 $ 47,886 $ 105,723 $ 34,688 $ 896,266
(1) Includes the Bank’s insurance subsidiaries’ assets and all other assets which are not subject to credit and market risks.(2) Includes $100.9 billion in mortgages guaranteed by Canada Mortgage Housing Corporation including 90% of privately insured mortgages.(3) Amounts for AIRB exposures are reported gross of allowances and amounts for standardized exposures are reported net of allowances.
202 | 2 0 1 7 S C O T I A B A N K A N N U A L R E P O R T

CO
NSO
LIDA
TEDFIN
AN
CIA
LSTA
TEMEN
TS
(ii) Credit quality of non-retail exposuresCredit decisions are made based upon an assessment of the credit risk of the individual borrower or counterparty. Key factors considered in theassessment include: the borrower’s management; the borrower’s current and projected financial results and credit statistics; the industry in which theborrower operates; economic trends; and geopolitical risk. Banking units and Global Risk Management also review the credit quality of the creditportfolio across the organization on a regular basis to assess whether economic trends or specific events may affect the performance of the portfolio.
The Bank’s non-retail portfolio is well diversified by industry. As at October 31, 2017, and October 31, 2016, a significant portion of the authorizedcorporate and commercial lending portfolio was internally assessed at a grade that would generally equate to an investment grade rating by externalrating agencies. There has not been a significant change in concentrations of credit risk since October 31, 2016.
Internal grades (IG) are used to differentiate the risk of default of a borrower. The following table cross references the Bank’s internal borrower gradeswith equivalent ratings categories utilized by external rating agencies:
Cross referencing of internal ratings to external ratings(1)
Equivalent External Rating
S&P Moody’s DBRS Internal GradeInternal Grade
Code PD Range(2)
AAA to AA+ Aaa to Aa1 AAA to AA (high) 99 – 98 0.0000% – 0.0448%AA to A+ Aa2 to A1 AA to A (high) 95 0.0448% – 0.1304%A to A- A2 to A3 A to A (low) Investment grade 90 0.0552% – 0.1402%BBB+ Baa1 BBB (high) 87 0.0876% – 0.2187%BBB Baa2 BBB 85 0.1251% – 0.3176%BBB- Baa3 BBB (low) 83 0.1788% – 0.4610%
BB+ Ba1 BB (high) 80 0.2886% – 0.5134%BB Ba2 BB 77 0.4658% – 0.5716%BB- Ba3 BB (low) Non-Investment grade 75 0.5716% – 0.7518%B+ B1 B (high) 73 0.7518% – 1.4444%B to B- B2 to B3 B to B (low) 70 1.4444% – 2.7749%
CCC+ Caa1 – 65 2.7749% – 10.1814%CCC Caa2 – Watch list 60 10.1814% – 19.4452%CCC- to CC Caa3 to Ca – 40 19.4452% – 35.4088%– – – 30 35.4088% – 59.5053%Default Default 27 – 21 100%
(1) Applies to non-retail portfolio.(2) PD ranges overlap across IG codes as the Bank utilizes two risk rating systems for its AIRB portfolios, and each risk rating system has its own separate IG to PD mapping.
Non-retail AIRB portfolioThe credit quality of the non-retail AIRB portfolio, expressed in terms of risk categories of borrower internal grades is shown in the table below:
2017 2016
Exposure at Default(1)
As at October 31 ($ millions) Category of internal grades IG Code DrawnUndrawn
commitmentsOther
exposures(2) Total Total
Investment grade 99 – 98 $ 71,362 $ 3,062 $ 16,735 $ 91,159 $ 77,44195 27,426 7,538 18,654 53,618 54,00790 24,253 14,774 22,481 61,508 56,84587 21,165 11,989 11,379 44,533 42,39885 19,540 12,691 8,247 40,478 40,27183 22,478 11,218 7,904 41,600 38,044
Non-Investment grade 80 24,162 9,150 2,923 36,235 36,13577 16,810 3,893 2,355 23,058 23,94175 11,459 2,381 6,578 20,418 15,94173 5,347 913 1,011 7,271 7,30770 2,653 776 329 3,758 4,692
Watch list 65 1,945 161 61 2,167 1,29760 434 200 127 761 1,22140 1,035 200 76 1,311 2,46530 159 – – 159 100
Default 27 – 21 1,175 396 181 1,752 2,520
Total $ 251,403 $ 79,342 $ 99,041 $ 429,786 $ 404,625Government guaranteed residential mortgages(3) 91,737 – – 91,737 100,869Total $ 343,140 $ 79,342 $ 99,041 $ 521,523 $ 505,494
(1) After credit risk mitigation.(2) Includes off-balance sheet lending instruments such as letters of credit, letters of guarantee, securitizations, excluding nil first loss protection (2016 – $20), derivatives and repo-style
transactions (reverse repurchase agreements, repurchase agreements and securities lending and borrowing), net of related collateral.(3) These exposures are classified as sovereign exposures and are included in the non-retail category.
2 0 1 7 S C O T I A B A N K A N N U A L R E P O R T | 203

CONSOLIDATED FINANCIAL STATEMENTS
Non-retail standardized portfolioNon-retail standardized portfolio as at October 31, 2017 comprised of drawn, undrawn and other exposures to corporate, bank and sovereigncounterparties amounted to $68 billion (October 31, 2016 – $66 billion). Exposures to most Corporate/Commercial counterparties mainly in theCaribbean and Latin American region are to non-investment grade counterparties based on the Bank’s internal grading systems.
(iii) Credit quality of retail exposuresThe Bank’s retail portfolios consist of a number of relatively small loans to a large number of borrowers. The portfolios are distributed across Canadaand a wide range of countries. As such, the portfolios inherently have a high degree of diversification. In addition, as of October 31, 2017, 49% ofthe Canadian banking residential mortgage portfolio is insured and the average loan-to-value ratio of the uninsured portion of the portfolio is 51%.
Retail AIRB portfolioThe data in the table below provides a distribution of the retail AIRB exposure within each PD range by asset class:
As at October 31 ($ millions) 2017 2016
Exposure at default(1)
Real estate secured
Category of (PD) grades PD range Mortgages HELOCQualifyingrevolving Other retail Total Total
Exceptionally Low 0.0000% – 0.0499% $ 3,600 $ – $ 11,844 $ 582 $ 16,026 $ 44,356Very Low 0.0500% – 0.1999% 35,433 29,297 8,609 7,168 80,507 59,509Low 0.2000% – 0.9999% 61,924 4,771 11,659 15,727 94,081 52,261
Medium Low 1.0000% – 2.9999% 5,517 974 5,836 4,743 17,070 20,851Medium 3.0000% – 9.9999% 398 298 5,493 2,394 8,583 6,265
High 10.0000% – 19.9999% 200 178 – 511 889 1,997Extremely High 20.0000% – 99.9999% 262 62 783 346 1,453 2,312
Default 100% 189 57 160 201 607 677
Total $ 107,523 $ 35,637 $ 44,384 $ 31,672 $ 219,216 $ 188,228
(1) After credit risk mitigation.
Retail standardized portfolioThe retail standardized portfolio of $70 billion as at October 31, 2017 (2016 – $65 billion) was comprised of residential mortgages, personal loans,credit cards and lines of credit to individuals, mainly in the Caribbean and Latin American region. Of the total retail standardized exposures, $34 billion(2016 – $31 billion) was represented by mortgages and loans secured by residential real estate, mostly with a loan-to-value ratio of below 80%.
(iv) Collateral
Collateral heldIn the normal course of business, to reduce its exposure to counterparty credit risk, the Bank receives collateral on derivative, securities lending, andother transactions related to the capital markets. The following are examples of the terms and conditions customary to collateral for these types oftransactions:
• The risks and rewards of the pledged assets reside with the pledgor.• Additional collateral is required when the market value of the transaction exceeds thresholds agreed upon with the pledgor.• The Bank is normally permitted to sell or repledge the collateral it receives, although this right is specific to each agreement under which the
collateral is pledged.• Upon satisfaction of the obligation, the Bank must return the pledged assets, unless the Bank has the right to sell or repledge the collateral it
receives, in which case the Bank must return comparable collateral to the pledgor.
As at October 31, 2017, the approximate market value of collateral accepted that may be sold or repledged by the Bank was $115 billion (2016 –$99 billion). This collateral is held primarily in connection with reverse repurchase agreements, securities lending and derivative transactions.
Collateral pledgedIn the normal course of business, securities and other assets are pledged to secure an obligation, participate in clearing or settlement systems, oroperate in a foreign jurisdiction. Note 34(d) details the nature and extent of the Bank’s asset pledging activities. Asset pledging transactions areconducted under terms that are common and customary to standard derivative, securities financing, and other borrowing activities. Standard riskmanagement controls are applied with respect to asset pledging.
Assets acquired in exchange for loansThe carrying value of non-financial assets acquired in exchange for loans as at October 31, 2017 was $412 million (2016 – $404 million) mainlycomprised of real estate and was classified as either held for sale or held for use as appropriate.
204 | 2 0 1 7 S C O T I A B A N K A N N U A L R E P O R T

CO
NSO
LIDA
TEDFIN
AN
CIA
LSTA
TEMEN
TS
(b) Liquidity riskLiquidity risk is the risk that the Bank is unable to meet its financial obligations in a timely manner at reasonable prices. The Bank’s liquidity risk issubject to extensive risk management controls and is managed within the framework of policies and limits approved by the Board. The Board receivesreports on risk exposures and performance against approved limits. The Asset-Liability Committee (ALCO) provides senior management oversight ofliquidity risk.
The key elements of the Bank’s liquidity risk management framework include:
• liquidity risk measurement and management limits, including limits on maximum net cash outflow by currency over specified short-termhorizons;
• prudent diversification of its wholesale funding activities by using a number of different funding programs to access the global financialmarkets and manage its maturity profile, as appropriate;
• large holdings of liquid assets to support its operations, which can generally be sold or pledged to meet the Bank’s obligations;• liquidity stress testing, including Bank-specific, global-systemic, and combination systemic/specific scenarios; and• liquidity contingency planning.
The Bank’s foreign operations have liquidity management frameworks that are similar to the Bank’s framework. Local deposits are managed from aliquidity risk perspective based on the local management frameworks and regulatory requirements.
(i) Commitments to extend creditIn the normal course of business, the Bank enters into commitments to extend credit in the form of loans or other financings for specific amounts andmaturities, subject to specific conditions. These commitments, which are not reflected on the Consolidated Statement of Financial Position, are subjectto normal credit standards, financial controls and monitoring procedures.
(ii) Derivative instrumentsThe Bank is subject to liquidity risk relating to its use of derivatives to meet customer needs, generate revenues from trading activities, manage marketand credit risks arising from its lending, funding and investment activities, and lower its cost of capital. The maturity profile of the notional amounts ofthe Bank’s derivative instruments is summarized in Note 9(b).
(c) Market riskMarket risk arises from changes in market prices and rates (including interest rates, credit spreads, equity prices, foreign exchange rates andcommodity prices), the correlations between them, and their levels of volatility. Market risk is subject to extensive risk management controls, and ismanaged within the framework of market risk policies and limits approved by the Board. The ALCO and Market Risk Management and PolicyCommittee oversee the application of the framework set by the Board, and monitor the Bank’s market risk exposures and the activities that give riseto these exposures.
The Bank uses a variety of metrics and models to measure and control market risk exposures. The measurements used are selected based on anassessment of the nature of risks in a particular activity. The principal measurement techniques are Value at Risk (VaR), stress testing, sensitivityanalysis and simulation modeling, and gap analysis. The Board reviews results from these metrics quarterly. Models are independently validatedinternally prior to implementation and are subject to formal periodic review.
VaR is a statistical measure that estimates the potential loss in value of the Bank’s trading positions due to adverse market movements over a definedtime horizon with a specified confidence level. The quality of the Bank’s VaR is validated by regular back testing analysis, in which the VaR iscompared to theoretical and actual profit and loss results. To complement VaR, the Bank also uses stress testing to examine the impact thatabnormally large swings in market factors and periods of prolonged inactivity might have on trading portfolios. The stress testing program is designedto identify key risks and ensure that the Bank’s capital can absorb potential losses from abnormal events. The Bank subjects its trading portfolios to aseries of stress tests on a daily, weekly and monthly basis.
In trading portfolios, sensitivity analysis is used to measure the effect of changes in risk factors, including prices and volatility, on financial productsand portfolios. In non-trading portfolios, sensitivity analysis assesses the effect of changes in interest rates on current earnings and on the economicvalue of shareholders’ equity. Simulation modeling under various scenarios is particularly important for managing risk in the deposit, lending andinvestment products the Bank offers to its retail customers. Gap analysis is used to assess the interest rate sensitivity of the Bank’s retail, wholesalebanking and international operations. Under gap analysis, interest rate-sensitive assets, liabilities and derivative instruments are assigned to definedtime periods, on the earlier of contractual repricing or maturity dates on the basis of expected repricing dates.
(i) Non-trading interest rate riskInterest rate risk, inclusive of credit spread risk, is the risk of loss due to the following: changes in the level, slope and curvature of the yield curve; thevolatility of interest rates; mortgage prepayment rates; changes in the market price of credit; and the creditworthiness of a particular issuer. The Bankactively manages its interest rate exposures with the objective of enhancing net interest income within established risk tolerances. Interest rate riskarising from the Bank’s funding and investment activities is managed in accordance with Board-approved policies and global limits, which aredesigned to control the risk to net interest income and economic value of shareholders’ equity. The income limit measures the effect of a specifiedshift in interest rates on the Bank’s annual net income over the next twelve months, while the economic value limit measures the impact of a specifiedchange in interest rates on the present value of the Bank’s net assets. Interest rate exposures in individual currencies are also controlled by gap limits.
2 0 1 7 S C O T I A B A N K A N N U A L R E P O R T | 205

CONSOLIDATED FINANCIAL STATEMENTS
Interest rate sensitivity gapThe following table summarizes carrying amounts of assets, liabilities and equity, and derivative instrument notional amounts in order to arrive at theBank’s interest rate gap based on the earlier of contractual repricing or maturity dates. To arrive at the Bank’s view of its effective interest rate gap,adjustments are made to factor in expected mortgage and loan repayments based on historical patterns and reclassify the Bank’s trading instrumentsto the immediately rate sensitive and within 3 months categories. Consumer behaviour assumptions are used to reclassify certain non-maturity assetsand liabilities.
As at October 31, 2017 ($ millions)Immediately
rate sensitiveWithin
3 monthsThree to
12 months One to 5 years Over 5 yearsNon-ratesensitive Total
Cash and deposits with financialinstitutions $ 35,652 $ 14,901 $ 655 $ 415 $ 5 $ 8,035 $ 59,663
Precious metals – – – – – 5,717 5,717Trading assets – 16,231 8,164 15,284 12,785 46,000 98,464Financial instruments designated at fair
value through profit or loss – – – 13 – – 13Securities purchased under resale
agreements and securities borrowed 23,319 49,409 4,895 – – 17,696 95,319Investment securities – 16,500 12,704 33,280 5,949 836(1) 69,269Loans 26,508 223,268 61,310 174,401 16,933 1,949 (2) 504,369Other assets – – – – – 82,459 82,459
Total assets $ 85,479 $ 320,309 $ 87,728 $ 223,393 $ 35,672 $ 162,692 $ 915,273
Deposits $ 104,680 $ 306,657 $ 70,530 $ 100,204 $ 11,062 $ 32,234 $ 625,367Financial instruments designated at fair
value through profit or loss – 3 255 3,426 979 – 4,663Obligations related to securities sold
short 74 478 1,328 12,541 9,900 6,445 30,766Obligations related to securities sold
under repurchase agreements andsecurities lent 67,035 25,278 1,755 – – 1,775 95,843
Subordinated debentures – 113 241 3,750 1,831 – 5,935Other liabilities 102 4,620 1,048 3,090 4,263 77,951 91,074Equity – 613 388 2,017 – 58,607 61,625
Total liabilities and equity $ 171,891 $ 337,762 $ 75,545 $ 125,028 $ 28,035 $ 177,012 $ 915,273
On-balance sheet gap $ (86,412) $ (17,453) $ 12,183 $ 98,365 $ 7,637 $ (14,320) $ –Off-balance sheet gap – (1,923) (11,273) 4,626 9,140 (570) –
Interest rate sensitivity gap basedon contractual repricing $ (86,412) $ (19,376) $ 910 $ 102,991 $ 16,777 $ (14,890) $ –
Adjustment to expected repricing 132,008 (27,135) 1,024 (58,014) (32,925) (14,958) –
Total interest rate sensitivity gap $ 45,596 $ (46,511) $ 1,934 $ 44,977 $ (16,148) $ (29,848) $ –
As at October 31, 2016 ($ millions)
Total interest rate sensitivity gap $ 48,478 $ (56,382) $ (12,954) $ 67,538 $ (9,441) $ (37,239) $ –
(1) Represents common shares, preferred shares, and equity accounted investments.(2) Includes net impaired loans, less the collective allowance on performing loans.
Interest rate sensitivityBased on the Bank’s interest rate positions, the following table shows the pro-forma after-tax impact on the Bank’s net income over the next twelvemonths and economic value of shareholders’ equity of an immediate and sustained 100 and 200 basis point increase and decrease in interest ratesacross major currencies as defined by the Bank.
As at October 31 ($ millions) 2017 2016
Net income Economic value of equity
Canadiandollar
Othercurrencies Total
Canadiandollar
Othercurrencies Total
Netincome
Economic valueof equity
100 bp increase $(53) $ 117 $ 64 $(119) $(235) $ (354) $ (32) $(785)100 bp decrease $ 53 $(120) $(67) $ (85) $ 268 $ 183 $ 32 $ 650
206 | 2 0 1 7 S C O T I A B A N K A N N U A L R E P O R T

CO
NSO
LIDA
TEDFIN
AN
CIA
LSTA
TEMEN
TS
(ii) Non-trading foreign currency riskForeign currency risk is the risk of loss due to changes in spot and forward rates, and the volatility of currency exchange rates. Non-trading foreigncurrency risk, also referred to as structural foreign exchange risk, arises primarily from the Bank’s net investments in self-sustaining foreign operationsand is controlled by a Board-approved limit. This limit considers potential volatility to shareholders’ equity as well as the potential impact on capitalratios from foreign exchange fluctuations. On a quarterly basis, the Asset-Liability Committee (ALCO) reviews the Bank’s exposures to these netinvestments. The Bank may fully or partially hedge this exposure by funding the investments in the same currency, or by using other financialinstruments, including derivatives.
The Bank is subject to foreign currency risk on the earnings of its foreign operations. To manage this risk, foreign currency revenues and expenses,which are primarily denominated in U.S. dollars, are projected over a number of future fiscal quarters. The ALCO assesses economic data and forecaststo decide on the portion of the estimated future foreign currency revenues and expenses to hedge. Hedging instruments normally include foreigncurrency spot and forward contracts, as well as foreign currency options and swaps.
As at October 31, 2017, a one percent increase (decrease) in the Canadian dollar against all currencies in which the Bank operates decreases(increases) the Bank’s before-tax annual earnings by approximately $58 million (October 31, 2016 – $60 million) in the absence of hedging activity,primarily from exposure to U.S. dollars. A similar change in the Canadian dollar as at October 31, 2017 would increase (decrease) the unrealizedforeign currency translation losses in the accumulated other comprehensive income in equity by approximately $345 million (2016 – $366 million), netof hedging.
(iii) Non-trading equity riskEquity risk is the risk of loss due to adverse movements in equity prices. Equity price risk is often classified into two categories: general equity risk,which refers to the sensitivity of an instrument or portfolio’s value to changes in the overall level of equity prices, and specific equity risk, which refersto that portion of an individual equity instrument’s price volatility that is determined by entity-specific characteristics.
The Bank is exposed to equity risk through its equity investment portfolios, which are controlled by Board-approved portfolio, VaR, and stress-testlimits. Equity investments include common and preferred shares, as well as a diversified portfolio of third-party managed funds.
The majority of the Bank’s equity investment portfolios are managed by Group Treasury under the strategic direction of the ALCO. Group Treasurydelegates the management of a portion of equity and equity-related portfolios to other external fund managers to take advantage of these fundmanagers’ expertise in particular market niches and products.
The fair value of available-for-sale equity securities is shown in Note 11.
(iv) Trading portfolio risk managementThe Bank’s policies, processes and controls for trading activities are designed to achieve a balance between pursuing profitable trading opportunitiesand managing earnings volatility within a framework of sound and prudent practices. Trading activities are primarily customer focused.
Market risk arising from the Bank’s trading activities is managed in accordance with Board-approved policies and limits, including aggregate VaR andstress testing limits.
Trading portfolios are marked-to-market in accordance with the Bank’s valuation policies. Positions are marked-to-market daily and valuations areindependently reviewed by back office, GRM or finance units on a regular basis. These units also provide profit and loss reporting, as well as VaR andlimit compliance reporting to business unit management and executive management for evaluation and action as appropriate. VaR is calculated dailyusing a 99% confidence level, and a one-day holding period. This means that, once in every 100 days, the trading positions are expected to lose morethan the VaR estimate. The Bank calculates general market risk VaR using historical simulation based on 300 days of market data. For debt specific riskVaR, the Bank uses historical resampling. The table below shows the Bank’s VaR by risk factor:
For the year ended October 31, 2017
($ millions) As at October 31, 2017 Average High Low As at October 31, 2016
Credit spread plus interest rate $ 10.1 $ 10.8 $ 15.1 $ 8.0 $ 10.6Credit spread 6.9 6.3 9.1 4.1 8.0Interest rate 8.4 8.4 12.0 5.3 8.5
Equities 3.2 2.2 4.8 1.0 2.0Foreign exchange 2.9 2.2 5.5 0.7 2.1Commodities 1.3 1.4 2.6 0.6 2.0Debt specific 3.3 3.6 5.1 2.4 4.2Diversification effect (10.3) (8.9) n/a n/a (7.6)
All-Bank VaR $ 10.6 $ 11.2 $ 14.9 $ 9.1 $ 13.2
All-Bank stressed VaR $ 34.7 $ 28.5 $ 44.5 $ 19.2 $ 21.2
2 0 1 7 S C O T I A B A N K A N N U A L R E P O R T | 207

CONSOLIDATED FINANCIAL STATEMENTS
Below are the market risk capital requirements as at October 31, 2017.
($ millions)
All-Bank VaR $ 110All-Bank stressed VaR 300Incremental risk charge 174Comprehensive risk measure –Standardized approach 43
Total market risk capital $ 627(1)
(1) Equates to $7,839 of risk-weighted assets (2016 – $10,571).
(d) Operational riskOperational risk is the risk of loss, whether direct or indirect, to which the Bank is exposed due to inadequate or failed internal processes or systems,human error, or external events. Operational risk includes legal and regulatory risk, business process and change risk, fiduciary or disclosure breaches,technology failure, financial crime and environmental risk. Operational risk, in some form, exists in each of the Bank’s business and support activities,and can result in financial loss, regulatory sanctions and damage to the Bank’s reputation. The Bank has developed policies, processes and assessmentmethodologies to ensure that operational risk is appropriately identified and managed with effective controls with a view to safeguarding client assetsand preserving shareholder value.
36 Business Combinations and Divestitures
Divestitures
HollisWealthOn August 4, 2017, the Bank sold HollisWealth, its independent wealth advisory business. The net assets and gain on sale were not material to theBank.
Roynat Lease FinanceOn April 29, 2016, the Bank, through its wholly owned subsidiary, Roynat Inc., completed the sale of the business operations and assets of RoynatLease Finance. Assets sold comprised mainly commercial lease receivables previously classified with Business and government loans. As a result of thetransaction, the Bank recorded a gain on disposal of $116 million pre-tax ($100 million after tax), including deal and transaction costs, in non-interestincome.
Proposed Divestiture
Bank of Nova Scotia Berhad, Malaysia (BNS Berhad)On May 26, 2017, the Bank reached an agreement to sell its wholly owned subsidiary, BNS Berhad. The transaction is subject to applicable regulatoryapprovals. The net assets and gain on sale are not material to the Bank.
Acquisitions
JPMorgan Canadian Credit Card BusinessOn November 16, 2015, the Bank acquired a MasterCard and private label credit card portfolio and the related Canadian credit card operations fromJPMorgan Chase Bank, N.A. for cash consideration of $1.7 billion. The acquisition was accounted for as a business combination and resulted in therecognition of approximately $1.7 billion in assets, primarily credit card loans. The acquisition forms part of the Canadian Banking business operatingsegment. The Bank recorded fair value adjustments to the acquired loans, representing a credit mark of $121 million and an interest rate mark of$28 million, finite life intangible assets of $38 million relating to client relationships, and goodwill of $49 million.
Citibank Panama and Costa Rica Retail Banking OperationsOn February 1, 2016, the Bank acquired 100% of the issued and outstanding common shares of the Citigroup Panama and Citigroup Costa Ricaentities (renamed Scotiabank Transformandose in both countries) for cash consideration of US$360 million. The acquisitions were accounted for as abusiness combination and resulted in the recognition of approximately $1.9 billion in assets (mainly consumer and credit card loans) and $1.6 billion inliabilities (mainly deposits). The acquisition forms part of the International Banking business operating segment. The Bank recorded fair valueadjustments to the acquired loans, representing a credit mark of $190 million, finite life intangible assets of $23 million relating to client relationships,low cost deposits and insurance contracts, and goodwill of $241 million.
37 Event after the Consolidated Statement of Financial Position date
On November 27, 2017 the Bank submitted a binding offer to Banco Bilbao Vizcaya Argentaria, S.A.’s (BBVA) to acquire its 68.19% ownership inBBVA Chile, which BBVA is willing to accept if the minority partner does not exercise its Right of First Refusal under the shareholders agreementbetween BBVA and the minority partner. BBVA owns 68.19% of BBVA Chile and the minority partner owns 31.62% of BBVA Chile. The Bank hasoffered to acquire BBVA’s interests in BBVA Chile, and its interests in certain subsidiaries, for approximately US$2.2 billion (approximatelyCAD$2.9 billion). If the transaction is completed, the Bank’s Common Equity Tier 1 capital ratio will be impacted by approximately 100 basis points.
Pursuant to the mandatory tender offer for all the shares of BBVA Chile required under Chilean law or the minority partner’s tag along rights underthe shareholders agreement of BBVA Chile, the minority partner has the right to sell its shares of BBVA Chile on the same basis to the Bank. TheBank’s Common Equity Tier 1 capital ratio would be impacted by approximately 135 basis points, if the Bank acquires 100% of BBVA Chile.
208 | 2 0 1 7 S C O T I A B A N K A N N U A L R E P O R T

Shareholder InformationAnnual meetingShareholders are invited to attend the 186th Annual Meeting ofHolders of Common Shares, to be held on April 10, 2018, atScotiabank Centre, Scotia Plaza, 40 King Street West, 2nd Floor,Toronto, Ontario beginning at 9:00 a.m. local time. The record date fordetermining shareholders entitled to receive notice of and to vote atthe meeting will be the close of business on February 13, 2018.
Shareholdings and dividendsInformation regarding your shareholdings and dividends may beobtained by contacting the transfer agent.
Direct deposit serviceShareholders may have dividends deposited directly into accounts heldat financial institutions which are members of the Canadian PaymentsAssociation. To arrange direct deposit service, please write to thetransfer agent.
Dividend and Share Purchase PlanScotiabank’s dividend reinvestment and share purchase plan allowscommon and preferred shareholders to purchase additional commonshares by reinvesting their cash dividend without incurring brokerage oradministrative fees. As well, eligible shareholders may invest up to$20,000 each fiscal year to purchase additional common shares of theBank. All administrative costs of the plan are paid by the Bank. Formore information on participation in the plan, please contact thetransfer agent.
Listing of sharesCommon shares of the Bank are listed for trading on the Toronto andNew York stock exchanges.
Series 18, Series 19, Series 20, Series 21, Series 22, Series 23, Series 30,Series 31, Series 32, Series 33, Series 34, Series 36 and Series 38preferred shares of the Bank are listed on the Toronto Stock Exchange.
Stock Symbols
STOCKTICKERSYMBOL
CUSIPNO.
Common shares BNS 064149 10 7Series 18, Preferred BNS.PR.P 064149 74 3Series 19, Preferred BNS.PR.A 064149 73 5Series 20, Preferred BNS.PR.Q 064149 72 7Series 21, Preferred BNS.PR.B 064149 71 9Series 22, Preferred BNS.PR.R 064149 69 3Series 23, Preferred BNS.PR.C 064149 68 5Series 30, Preferred BNS.PR.Y 064149 63 6Series 31, Preferred BNS.PR.D 064149 62 8Series 32, Preferred BNS.PR.Z 064149 61 0Series 33, Preferred BNS.PR.F 064149 59 4Series 34, Preferred BNS.PR.E 064149 55 2Series 36, Preferred BNS.PR.G 064151 20 2Series 38, Preferred BNS.PR.H 064151 11 1
Dividend Dates for 2018Record and payment dates for common and preferred shares, subjectto approval by the Board of Directors.
RECORD DATE PAYMENT DATEJanuary 2 January 29April 3 April 26July 3 July 27October 2 October 29
Valuation day priceFor Canadian income tax purposes, The Bank of Nova Scotia’s commonstock was quoted at $31.13 per share on Valuation Day, December 22,1971. This is equivalent to $2.594 after adjusting for the two-for-onestock split in 1976, the three-for-one stock split in 1984, and thetwo-for-one stock split in 1998. The stock dividend in 2004 did notaffect the Valuation Day amount. The stock received as part of the2004 stock dividend is not included in the pre-1972 pool.
Duplicated communicationSome registered holders of The Bank of Nova Scotia shares mightreceive more than one copy of shareholder mailings, such as thisAnnual Report. Every effort is made to avoid duplication; however, ifyou are registered with different names and/or addresses, multiplemailings may result. If you receive, but do not require, more than onemailing for the same ownership, please contact the transfer agent tocombine the accounts.
Credit ratings
SENIOR LONG-TERM DEBT/DEPOSITSDBRS AAFitch AA -Moody’s A1Standard & Poor’s A+
SHORT TERM DEPOSITS/COMMERCIAL PAPERDBRS R-1(high)Fitch F1+Moody’s P-1Standard & Poor’s A-1
SUBORDINATED DEBT(1)
DBRS AA(low)Fitch A+Moody’s Baa1Standard & Poor’s A -
NON-CUMULATIVE PREFERRED SHARES(1)
DBRS Pfd-2(high)Moody’s Baa3(hyb)Standard & Poor’s BBB/P-2*
(1) Excluding instruments with Non-Viability Contingent Capital Features*Canadian scale
Credit ratings are one of the factors that impact the Bank’s access tocapital markets and borrowing costs, as well as the terms on which theBank can conduct derivatives and hedging transactions and obtainrelated borrowings. The credit ratings and outlook that the ratingagencies assign to the Bank are based on their own views andmethodologies.
On May 10, 2017, Moody’s downgraded the long-term ratings of allCanadian banks, citing concerns around expanding levels of privatesector debt, which could increase the likelihood of weaker asset qualityin the future. Moody’s downgraded the Bank’s long-term ratings byone notch to A1 from Aa3, while affirming the Bank’s short-termdeposit rating of P-1.
The Bank continues to have strong credit ratings and is rated AA byDBRS, A1 by Moody’s, AA- by Fitch and A+ by Standard and Poor’s(S&P). Fitch and S&P have a stable outlook on the Bank. Meanwhile,DBRS and Moody’s continue to maintain their negative outlook for allCanadian banks citing the uncertainty around the federal government’sproposed new bail-in regime for senior unsecured debt, to reflect thegreater likelihood that such debt may incur losses in the unlikely eventof a distress scenario.
2 0 1 7 S C O T I A B A N K A N N U A L R E P O R T | 209

GlossaryAllowance for Credit Losses: An allowance set aside which, inmanagement’s opinion, is adequate to absorb all incurred credit-relatedlosses in the Bank’s portfolio of loans. It includes individual andcollective allowances.
Assets Under Administration (AUA): Assets administered by the Bankwhich are beneficially owned by clients and therefore not reported onthe Bank’s Consolidated Statement of Financial Position. Servicesprovided for AUA are of an administrative nature, such as trusteeship,custodial, safekeeping, income collection and distribution, securitiestrade settlements, customer reporting, and other similar services.
Assets Under Management (AUM): Assets managed by the Bank ona discretionary basis and in respect of which the Bank earns investmentmanagement fees. AUM are beneficially owned by clients and aretherefore not reported on the Bank’s Consolidated Statement ofFinancial Position. Some AUM are also administered assets and aretherefore included in assets under administration.
Bankers’ Acceptances (BAs): Negotiable, short-term debt securities,guaranteed for a fee by the issuer’s bank.
Basis Point: A unit of measure defined as one-hundredth of oneper cent.
Capital: Consists of common shareholders’ equity, non-cumulativepreferred shares and other equity instruments, capital instruments andsubordinated debentures. It can support asset growth, provide againstloan losses and protect depositors.
Common Equity Tier 1 (CET1), Tier 1 and Total Capital Ratios:Under Basel III, there are three primary regulatory capital ratios used toassess capital adequacy, CET1, Tier 1 and Total capital ratios, which aredetermined by dividing those capital components by their respectiverisk-weighted assets.
Basel III introduced a new category of capital, CET1, which consistsprimarily of common shareholders’ equity net of regulatoryadjustments. These regulatory adjustments include goodwill, intangibleassets net of deferred tax liabilities, deferred tax assets that rely onfuture probability, defined-benefit pension fund net assets, shortfall ofcredit provision to expected losses and significant investments incommon equity of other financial institutions.
Tier 1 includes CET1 and additional Tier 1 capital which consistsprimarily of qualifying non-cumulative preferred shares, non-cumulativesubordinated additional Tier 1 capital securities and non-qualifyinginstruments subject to phase-out. Tier 2 capital consists mainly ofqualifying subordinated or non-qualifying debentures subject tophase-out and the eligible allowances for credit losses.
Total capital is comprised of CET1 capital, Tier 1 capital and Tier 2capital.
Core Banking Margin: This ratio represents net interest income onaverage earning assets excluding bankers acceptances and totalaverage assets relating to the Global Capital Markets business withinGlobal Banking and Markets. This is consistent with the fact that netinterest from trading operations is recorded in trading revenuesincluded in non-interest income.
Covered Bonds: Debt obligations of the Bank for which the paymentof all amounts of interest and principal are unconditionally andirrevocably guaranteed by a limited partnership or trust and secured bya pledge of the covered bond portfolio. The assets in the covered bondportfolio held by the limited partnership or trust consist of first lienCanadian uninsured residential mortgages or first lien Canadianresidential mortgages insured under CMHC Mortgage Insurance,respectively, and their related security interest.
Derivative Products: Financial contracts whose value is derived froman underlying price, interest rate, exchange rate or price index.Forwards, options and swaps are all derivative instruments.
Fair Value: The price that would be received to sell an asset or paid totransfer a liability in an orderly transaction between market participantsin the principal, or in its absence, the most advantageous market towhich the Bank has access at the measurement date.
Foreign Exchange Contracts: Commitments to buy or sell a specifiedamount of foreign currency on a set date and at a predetermined rateof exchange.
Forward Rate Agreement (FRA): A contract between two parties,whereby a designated interest rate, applied to a notional principalamount, is locked in for a specified period of time. The differencebetween the contracted rate and prevailing market rate is paid in cashon the settlement date. These agreements are used to protect against,or take advantage of, future interest rate movements.
Futures: Commitments to buy or sell designated amounts ofcommodities, securities or currencies on a specified date at apredetermined price. Futures are traded on recognized exchanges.Gains and losses on these contracts are settled daily, based on closingmarket prices.
Hedging: Protecting against price, interest rate or foreign exchangeexposures by taking positions that are expected to react to marketconditions in an offsetting manner.
Impaired Loans: Loans on which the Bank no longer has reasonableassurance as to the timely collection of interest and principal, or wherea contractual payment is past due for a prescribed period or thecustomer is declared to be bankrupt. Excludes Federal DepositInsurance Corporation (FDIC) guaranteed loans.
Leverage Ratio: The ratio of Basel III Tier 1 capital to a leverageexposure measure which includes on-balance sheet assets andoff-balance sheet commitments, derivatives and securities financingtransactions, as defined within the OSFI Leverage RequirementsGuideline.
Liquidity Coverage Ratio (LCR): The ratio of high quality liquid assetsto stressed net cash outflows over a 30 calendar day time horizon, asdefined within the OSFI Liquidity Adequacy Requirements Guideline.
Marked-To-Market: The valuation of certain financial instruments atfair value as of the Consolidated Statement of Financial Position date.
Notional Principal Amounts: The contract or principal amounts usedto determine payments for certain off-balance sheet instruments andderivatives, such as FRAs, interest rate swaps and cross-currency swaps.The amounts are termed “notional” because they are not usuallyexchanged themselves, serving only as the basis for calculatingamounts that do change hands.
Off-Balance Sheet Instruments: These are indirect creditcommitments, including undrawn commitments to extend credit andderivative instruments.
Operating Leverage: This financial metric measures the rate ofgrowth in total revenue less the rate of growth in operating expenses.
Options: Contracts between buyer and seller giving the buyer of theoption the right, but not the obligation, to buy (call) or sell (put) aspecified commodity, financial instrument or currency at a set price orrate on or before a specified future date.
OSFI: The Office of the Superintendent of Financial InstitutionsCanada, the regulator of Canadian banks.
Pacific Alliance: Comprises the countries of Chile, Colombia, Mexicoand Peru.
Productivity Ratio: Management uses the productivity ratio as ameasure of the Bank’s efficiency. This ratio represents operatingexpenses as a percentage of total revenue. A lower ratio indicatesimproved productivity.
Repos: Repos is short for “obligations related to securities sold underrepurchase agreements” – a short-term transaction where the Banksells assets, normally government bonds, to a client and simultaneouslyagrees to repurchase them on a specified date and at a specified price.It is a form of short-term funding.
Return on Equity (ROE): Net income attributable to commonshareholders, expressed as a percentage of average commonshareholders’ equity. With respect to the Bank’s main businesssegments, the Bank attributes capital that approximates 9.5% of BaselIII common equity capital requirements based on credit, market andoperational risks and leverage inherent in each business segment.Return on equity for the business segments is calculated as a ratio ofnet income attributable to common shareholders of the businesssegment and the capital attributed.
Reverse Repos: Reverse repos is short for “securities purchased underresale agreements” – a short-term transaction where the Bankpurchases assets, normally government bonds, from a client and
210 | 2 0 1 7 S C O T I A B A N K A N N U A L R E P O R T
simultaneously agrees to resell them on a specified date and at aspecified price. It is a form of short-term collateralized lending.
Risk-Weighted Assets: Comprised of three broad categories includingcredit risk, market risk and operational risk, which are computed underthe Basel III Framework. Risk-weighted assets for credit risk arecalculated using formulas specified by the Basel III Framework. Theformulas are based on the degree of credit risk for each class ofcounterparty. Off-balance sheet instruments are converted to onbalance sheet equivalents, using specified conversion factors, beforethe appropriate risk measurements are applied. The Bank uses bothinternal models and standardized approaches to calculate market riskcapital and a standardized approach to calculate operational riskcapital. These capital requirements are converted to risk weightedassets equivalent by multiplying by a 12.5 factor.
Securitization: The process by which financial assets (typically loans)are transferred to a trust, which normally issues a series of differentclasses of asset-backed securities to investors to fund the purchase ofloans.
Structured Entities: A structured entity is defined as an entity createdto accomplish a narrow and well-defined objective. A structured entitymay take the form of a corporation, trust, partnership orunincorporated entity. Structured entities are often created with legalarrangements that impose strict and sometimes permanent limits onthe decision-making powers of their governing board, trustee ormanagement over the operations of the entity.
Standby Letters of Credit and Letters of Guarantee: Writtenundertakings by the Bank, at the request of the customer, to provideassurance of payment to a third-party regarding the customer’sobligations and liabilities to that third-party.
Structured Credit Instruments: A wide range of financial productswhich includes Collateralized Debt Obligations, Collateralized Loan
Obligations, Structured Investment Vehicles, and Asset-BackedSecurities. These instruments represent investments in pools of credit-related assets, whose values are primarily dependent on theperformance of the underlying pools.
Swaps: Interest rate swaps are agreements to exchange streams ofinterest payments, typically one at a floating rate, the other at a fixedrate, over a specified period of time, based on notional principalamounts. Cross-currency swaps are agreements to exchange paymentsin different currencies over predetermined periods of time.
Taxable Equivalent Basis (TEB): The Bank analyzes net interestincome, non-interest income, and total revenue on a taxable equivalentbasis (TEB). This methodology grosses up tax-exempt income earned oncertain securities reported in either net interest income or non-interestincome to an equivalent before tax basis. A corresponding increase ismade to the provision for income taxes; hence, there is no impact onnet income. Management believes that this basis for measurementprovides a uniform comparability of net interest income andnon-interest income arising from both taxable and non-taxable sourcesand facilitates a consistent basis of measurement. While other banksalso use TEB, their methodology may not be comparable to the Bank’smethodology. For purposes of segmented reporting, a segment’srevenue and provision for income taxes are grossed up by the taxableequivalent amount. The elimination of the TEB gross up is recorded inthe Other segment.
Value At Risk (VaR): An estimate of the potential loss that mightresult from holding a position for a specified period of time, with agiven level of statistical confidence.
Yield Curve: A graph showing the term structure of interest rates,plotting the yields of similar quality bonds by term to maturity.
Basel III GlossaryCredit Risk ParametersExposure at Default (EAD): Generally represents the expected grossexposure – outstanding amount for on-balance sheet exposure andloan equivalent amount for off-balance sheet exposure at default.
Probability of Default (PD): Measures the likelihood that a borrowerwill default within a one-year time horizon, expressed as a percentage.
Loss Given Default (LGD): Measures the severity of loss on a facilityin the event of a borrower’s default, expressed as a percentage ofexposure at default.
Exposure TypesNon-retailCorporate: Defined as a debt obligation of a corporation, partnership,or proprietorship.
Bank: Defined as a debt obligation of a bank or bank equivalent(including certain public sector entities (PSEs) treated as bankequivalent exposures).
Sovereign: Defined as a debt obligation of a sovereign, central bank,certain multi development banks and certain PSEs treated as sovereign.
Securitization: On-balance sheet investments in asset-backedsecurities, mortgage-backed securities, collateralized loan obligationsand collateralized debt obligations, off-balance sheet liquidity lines tothe Bank’s own sponsored and third-party conduits and creditenhancements.
RetailResidential Mortgage: Loans to individuals against residentialproperty (four units or less).
Secured Lines Of Credit: Revolving personal lines of credit secured byresidential real estate.
Qualifying Revolving Retail Exposures: Credit cards and unsecuredlines of credit for individuals.
Other Retail: All other personal loans.
Exposure Sub-typesDrawn: Outstanding amounts for loans, leases, acceptances, depositswith banks and available-for-sale debt securities.
Undrawn: Unutilized portion of authorized committed credit lines.
Other ExposuresRepo-Style Transactions: Reverse repurchase agreements (reverserepos) and repurchase agreements (repos), securities lending andborrowing.
OTC Derivatives: Over-the-counter derivatives contracts refers tofinancial instruments which are traded through a dealer network ratherthan through an exchange.
Other Off-balance Sheet: Direct credit substitutes, such as standbyletters of credit and guarantees, trade letters of credit, andperformance letters of credit and guarantees.
Exchange-Traded Derivative Contracts: Exchange-traded derivativecontracts are derivative contracts (e.g., futures contracts and options)that are transacted on an organized futures exchange. These includefutures contracts (both long and short positions), purchased optionsand written options.
Qualifying Central Counterparty (QCCP): A licensed centralcounterparty is considered “qualifying” when it is compliant with theInternational Organization of Securities Commissions (IOSCO) standardsand is able to assist clearing member banks in properly capitalizing forCCP exposures.
Asset Value Correlation Multiplier (AVC): Basel III has increased therisk-weights on exposures to certain Financial Institutions (FIs) relativeto the non-financial corporate sector by introducing an AVC. Thecorrelation factor in the risk-weight formula is multiplied by this AVCfactor of 1.25 for all exposures to regulated FIs whose total assets aregreater than or equal to US $100 billion and all exposures tounregulated FIs.
Specific Wrong-Way Risk (WWR): Specific Wrong-Way Risk ariseswhen the exposure to a particular counterparty is positively correlatedwith the probability of default of the counterparty due to the nature ofthe transactions with the counterparty.
Basel I Regulatory Capital Floor: Since the introduction of Basel II in2008, OSFI has prescribed a minimum capital floor requirement forinstitutions that use the AIRB approach for credit risk. The regulatorycapital floor add-on is determined by comparing a capital requirementcalculated by reference to Basel I against the Basel III calculation, asprescribed by OSFI. A shortfall in the Basel III capital requirement ascompared with the Basel I capital floor requirement is added to RWAs.
2 0 1 7 S C O T I A B A N K A N N U A L R E P O R T | 211

Additional information
CORPORATE HEADQUARTERS FOR FURTHER INFORMATION
Scotiabank Customer Service Centre
Scotia Plaza44 King Street West, Toronto, OntarioCanada M5H 1H1Tel: (416) 866-6161E-mail: [email protected]
1-800-4-SCOTIA
Finance DepartmentScotiabank
44 King Street West, Toronto, OntarioCanada M5H 1H1Tel: (416) 866-4790Fax: (647) 777-1184E-mail: [email protected]
Financial Analysts, Portfolio Managers and other Institutional InvestorsTel: (416) 775-0798
Fax: (416) 866-7867
E-mail: [email protected]
OnlineFor product, corporate, financial and shareholder information: scotiabank.com
Public and Corporate AffairsScotiabank
44 King Street West, Toronto, Ontario
Canada M5H 1H1Tel: (416) 866-6161Fax: (416) 866-4988E-mail: [email protected]
Shareholder ServicesTransfer Agent and Registrar Main AgentComputershare Trust Company of Canada100 University Avenue, 8th Floor, Toronto, OntarioCanada M5J 2Y1Tel: 1-877-982-8767Fax: 1-888-453-0330E-mail: [email protected]
Co-transfer Agent (U.S.A.)Computershare Trust Company N.A.250 Royall Street, Canton, MA 02021, U.S.A.Tel: 1-800-962-4284
212 | 2 0 1 7 S C O T I A B A N K A N N U A L R E P O R T

660,000Canadian students
participated in Talk With Your Kids
About Money day in 2017
More than
$5BILLION
in microlendingglobally in 2017
$80 MILLIONin donations globally in 2017
to support the communities we
operate in
33%
women in leadership
positions(VP+)globally in 2017,
nearly 40% in Canada
$4.7 BILLION in calculated authorized
exposure to the
renewable energy sector globally in 2017
Greenhouse gas reduction target:
10% GLOBALLY BY 2021
based on 2016 levels
We received feedbackfromover
2 MILLIONcustomers in 2017
from “The Pulse” – our customer
experience management
system
WE HAVE THE RESOURCES
WE HAVE FINANCIAL EXPERTISE
WE HAVE THE REACH
OUR ABILITY
88,000+EMPLOYEES
in nearly
50 COUNTRIES
24 MILLIONCUSTOMERSaroundtheglobe
$915BILLIONIN ASSETS
FINANCIAL KNOWLEDGE
ACCESS TO FINANCE
DIVERSITY AND
INCLUSION
INVESTING IN YOUNG
PEOPLE
RESPONSIBLE FINANCING
CLIMATE CHANGE
MAINTAINING TRUST
OUR PRIORITIES
Webelieveeverycustomerhastherighttobecomebetteroff.ThroughourCSRcommitmentsweaimtocreatevalueforbothsocietyandScotiabank,buildingabetterfuture.OUR BELIEF
CORPORATE SOCIAL RESPONSIBILITY AT SCOTIABANK

ScotiabankisCanada’sinternationalbankandaleadingfinancialservicesproviderin
NorthAmerica,LatinAmerica,theCaribbeanandCentralAmerica,andAsia-Pacific.Weare
dedicatedtohelpingour24millioncustomersbecomebetteroffthroughabroadrange
ofadvice,productsandservices,includingpersonalandcommercialbanking,wealth
managementandprivatebanking,corporateandinvestmentbanking,andcapitalmarkets.
®RegisteredtrademarkofTheBankofNovaScotia. ™TrademarkofTheBankofNovaScotia.
9464914
SCOTIABANK.COM


