49
ABN 51 000 617 176 2017 ANNUAL REPORT

ABN 51 000 617 176
2017 ANNUAL REPORT

TANAMI GOLD NL
2
ANNUAL REPORT TABLE OF CONTENTS
MINERAL RESOURCES……......................................................................................................................................3 DIRECTORS’ REPORT...............................................................................................................................................6 LEAD AUDITOR’S INDEPENDENCE STATEMENT.................................................................................................17 CONSOLIDATED STATEMENT OF PROFIT OR LOSS AND OTHER COMPREHENSIVE INCOME.....................................................................................................................................................................18 CONSOLIDATED STATEMENT OF FINANCIAL POSITION....................................................................................19 CONSOLIDATED STATEMENT OF CHANGES IN EQUITY....................................................................................20 CONSOLIDATED STATEMENT OF CASH FLOWS.................................................................................................21 NOTES TO THE FINANCIAL STATEMENTS...........................................................................................................22 DIRECTORS’ DECLARATION..................................................................................................................................43 INDEPENDENT AUDITOR’S REPORT....................................................................................................................44 CORPORATE GOVERNANCE STATEMENT..........................................................................................................47 SHAREHOLDER AND ADDITIONAL INFORMATION……......................................................................................48 SCHEDULE OF MINERAL TENEMENTS….............................................................................................................49

TANAMI GOLD NL MINERAL RESOURCES
3
Table 1: Tanami Gold NL Mineral Resources as at 30 April 2014
Project
Resource Category
Measured Indicated Inferred Total
Tonnes
Grade
Ounces Tonnes
Grade
Ounces Tonnes
Grade
Ounces Tonnes
Grade
Ounces
g/t Au g/t Au g/t Au g/t Au
WTP 482,000 2.8 44,000 1,079,000 6.0 208,000 1,446,000 5.8 271,000 2,931,000 5.6 523,000
CTP10 6,730,000 3.0 648,000 9,491,000 3.0 954,000 9,279,000 3 1,022,000 25,500,000 3 2,625,0000
Sub Total 7,212,000 3.0 692,000 10,570,000 3.4 1,162,000 10,725,000 3.7 1,293,000 28,431,000 3.4 3,148,000
CTP Stockpile10
1,700,000 0.9 48,000 - - - - - - 1,700,000 0.9 48,000
Total 8,912,000 2.6 740,000 10,570,000 3.4 1,162,000 10,725,000 3.7 1,293,000 30,131,000 3.3 3,196,000
Notes to accompany Table 1
1. WTP is Western Tanami Prospect and CTP is Central Tanami Project. 2. Resource estimations completed using MineMap, Vulcan, Surpac, Datamine and Micromine software packages comprising a combination of ellipsoidal inverse
distance and ordinary kriging grade interpolation methods. 3. Variable gold assay top cuts were applied based on geostatistical parameters and historical production reconciliation. 4. Resources reported above relevant cut-offs based on economic extractions, varying between 0.7g/t Au and 5.0g/t Au block model grade. 5. Stockpile figures from previously reported Otter Gold Mines NL 2001 Mineral Resource estimate less recorded treatment by Newmont Asia Pacific. 6. Tonnes and ounces rounded to the nearest thousand and grade rounded to 0.1g/t Au. Rounding may affect tallies. 7. The information in this report pertaining to Mineral Resources was compiled by Mr Bill Makar (MAusIMM), former Consultant Geologist – Tanami Gold NL, Mr
Michael Thomson (MAusIMM), former Principal Geologist for Tanami Gold NL, Mr Steven Nicholls (MAIG), former Senior Geologist for Tanami Gold NL, Mrs Claire Hillyard (MAusIMM), former Resource Geologist for Tanami Gold NL, Mr Mark Drabble (MAusIMM) – Principal Consultant Geologist, Optiro Pty Ltd and Mr Peter Ball (MAusIMM), Director of Datageo Geological Consultants. Mr Makar, Mr Thomson, Mr Nicholls, Mrs Hillyard, Mr Drabble and Mr Ball have sufficient experience which is relevant to the style of mineralisation and type of deposit under consideration to qualify as Competent Persons as defined in the December 2004 edition of the Australasian Code for Reporting of Exploration Results, Mineral Resources and Ore Reserves (JORC Code). Mr Makar, Mr Thomson, Mr Nicholls, Mrs Hillyard, Mr Drabble and Mr Ball consent to the inclusion in this report of the matters based on their information in the form and context in which it appears.
8. The dates referred to in this table titles (30th April 2014) represent the date of the most resent update of a Resource within this table. 9. Within the WTP stated Figures is the Kavanagh Resource that is compliant to the JORC Code 2012, all other Resources were prepared and first disclosed
under the JORC Code 2004 and have not been updated since to comply with the JORC Code 2012 on the basis that the information has not materially changed since it was last reported.
10. On 4th of August 2015, an unincorporated joint venture was formed between the Company and Northern Star Resources Limited who purchased an initial 25% interest in the Company’s Central Tanami Project (“CTP”). At the time of this report, the Company retains a 75% interest in the CTP Resources stated in this table.
Table 2: Central Tanami Project Mineral Resources as at 1 January 2013 (75% Tanami)
Mineral Lease
Resource Category
Measured Indicated Inferred Total
Tonnes Grade Ounces Tonnes Grade Ounces Tonnes Grade Ounces Tonnes Grade Ounces
MLS153 1,051,000 2.2 73,000 3,046,000 2.2 217,000 849,000 2.7 74,000 4,946,000 2.3 365,000
MLS167 2,709,000 3.4 293,000 2,613,000 2.9 244,000 2,050,000 2.9 191,000 7,372,000 3.1 728,000
MLS168 854,000 2.2 60,000 314,000 1.6 16,000 1,094,000 1.6 58,000 2,262,000 1.8 133,000
MLS180 545,000 3.3 57,000 872,000 2.7 76,000 269,000 2 18,000 1,685,000 2.8 151,000
MLSA172 1,096,000 2.7 96,000 176,000 1.8 10,000 142,000 2.7 12,000 1,415,000 2.6 119,000
ML22934 475,000 4.5 69,000 2,470,000 4.9 391,000 4,875,000 4.25 669,000 7,820,000 4.49 1,129,000
Sub Total 6,730,000 2.99 648,000 9,491,000 3.13 954,000 9,279,000 3.43 1,022,000 25,500,000 3.20 2,625,000
Stockpiles 1,700,000 0.9 48,000 - - - - - - 1,700,000 0.9 48,000
Total 8,430,000 2.6 696,000 9,491,000 3.1 954,000 9,279,000 3.4 1,022,000 27,200,000 3.1 2,673,000

TANAMI GOLD NL MINERAL RESOURCES
4
Notes to accompany Table 2 1. Resource estimations completed using MineMap, Vulcan and Micromine software packages comprising a combination of ellipsoidal inverse distance and
ordinary kriging grade interpolation methods. 2. Grade estimation was constrained to material within >0.7g/t mineralisation outlines. 3. Variable gold assay top cuts were applied based on geostatistical parameters and historical production reconciliation. 4. Resources reported above 0.7g/t block model grade. 5. Resources reported above 1.0g/t block model grade. 6. Stockpile figures from previously reported Otter Gold Mines NL 2001 Mineral Resource estimate less recorded treatment by Newmont Asia Pacific. 7. Tonnes and ounces rounded to the nearest thousand and grade rounded to 0.1g/t. Rounding may affect tallies. 8. The information in this report pertaining to Mineral Resources for the Central Tanami Project was compiled by Mr Bill Makar (MAusIMM), former Consultant
Geologist – Tanami Gold NL, Mr Michael Thomson (MAusIMM), former Principal Geologist for Tanami Gold NL, Mr Steven Nicholls (MAIG), former Senior Geologist for Tanami Gold NL, Mrs Claire Hillyard (MAusIMM), former Resource Geologist for Tanami Gold NL and Mr Peter Ball (MAusIMM), Director of Datageo Geological Consultants. Mr Makar, Mr Thomson, Mr Nicholls, Mrs Hillyard and Mr Ball have sufficient experience which is relevant to the style of mineralisation and type of deposit under consideration to qualify as Competent Persons as defined in the December 2004 edition of the Australasian Code for Reporting of Exploration Results, Mineral Resources and Ore Reserves (JORC Code). Mr Makar, Mr Nicholls, Mrs Hillyard and Mr Ball consent to the inclusion in this report of the matters based on their information in the form and context in which it appears.
9. ML22934 Resource consists of two Resources - Groundrush Deposit (6.7million tonnes at 4.8g/t for 1,040,000) and Ripcord Deposit (1.1 Million tonnes at 2.5g/t for 89,000oz).
10. The dates referred to in this table titles (1st January 2013) represent the date of the most recent update of a Resource within this table.
Table 3: Western Tanami Project Mineral Resources as at 30 April 2014
Deposit
Resource Category
Measured Indicated Inferred Total
Tonnes
Grade
Ounces Tonnes
Grade
Ounces Tonnes
Grade
Ounces Tonnes
Grade
Ounces
g/t Au g/t Au g/t Au g/t Au
Coyote 25,000 23.6 19,000 338,300 11.7 127,000 382,500 12.3 151,000 669,000 13.8 297,000
Sandpiper 27,000 3.3 3,000 455,000 4.1 59,000 635,000 4.4 90,000 1,117,000 4.2 152,000
Kookaburra 55,000 2.6 5,000 286,000 2.4 22,000 353,000 2.1 24,000 694,000 2.3 51,000
Pebbles - - - - - - 76,000 2.5 6,000 76,000 2.5 6,000
Stockpiles 375,000 1.4 17,000 - - - - - - 375,000 1.4 17,000
Total 482,000 2.8 44,000 1,079,300 6.0 208,000 1,446,500 5.8 271,000 2,931,000 5.6 523,000
Notes to accompany Table 3: 1. The Western Tanami Project Resource estimations were completed using Micromine, Surpac and Datamine software, comprising inverse distance grade
interpolation within block models constrained by 3D wire framed geological boundaries. The wireframes defining the mineralisation were based on structural, assay and lithological information.
2. Various top cuts have been applied to the drill hole samples based on lode domain analysis. Where top cuts were applied they ranged from 35g/t for Sandpiper, a range of 100-250g/t for Coyote and 100 gram metres for Kavanagh.
3. The Mineral Resource Estimate is reported at a 2.0g/t Au lower cut-off for Coyote, a 5.0g/t Au Cut-off for Kavanagh and 1.0g/t for the remaining Resources. 4. Tonnes and ounces of gold are rounded to significant figures and grade is rounded to the nearest 0.1g/t Au. Rounding may affect tallies. Stockpile ounces
rounded to nearest hundred. 5. Resource estimation for the Muttley and Kavanagh lodes was completed by Michael Thomson, former Principal Geologist of Tanami Gold, the resource
estimation of the remaining Coyote and Sandpiper deposits was completed by Mr Steven Nicholls, former Senior Geologist of Tanami Gold NL. The Kookaburra Resource estimation was conducted by Mr Peter Ball, Director of Datageo Geological Consultants. The Pebbles Resource estimate was completed in 2007 by Mr Malcolm Titley of CSA Australia Pty Ltd.
6. Mr Thomson, Mr Nicholls (MAIG), Mr Ball (MAusIMM) and Mr Titley (MAusIMM, MAIG) qualify as Competent Persons as defined by the December 2004 edition of the Australasian Code for Reporting of Exploration Results, Mineral Resources and Ore Reserves (JORC Code) and consent to the inclusion in this report of the matters based on their information in the form and context in which it appears.
7. The resource presented in this table has not been depleted by 7,675 ounces mined between January 2013 and June 2013 from the Coyote Mine. 8. The dates referred to in this table titles (30th April 2014) represent the date of the most recent update of a Resource within this table.
Mineral Resources Annual Statement and Review
The Company carries out an annual review of its Mineral Resources as required by the ASX Listing Rules. The review was carried out as at 30 June 2017. The estimates for Mineral Resources were prepared and disclosed under the JORC Code 2004 and 2012 Editions. No changes were made to the Mineral Resources in the year ending 30 June 2017. The Company is not aware of any new information or data that materially affects the information included in the Annual Statement with regard to Mineral Resources and confirms that all material assumptions and technical parameters underpinning the estimates continue to apply and have not materially changed.

TANAMI GOLD NL MINERAL RESOURCES
5
Estimation Governance Statement
The Company ensures that all Mineral Resource calculations are subject to appropriate levels of governance and internal controls. Exploration results are collected and managed by an independent competent qualified geologist. All data collection activities are conducted to industry standards based on a framework of quality assurance and quality control protocols covering all aspects of sample collection, topographical and geophysical surveys, drilling, sample preparation, physical and chemical analysis and data and sample management. Mineral Resource estimates are prepared by qualified independent Competent Persons. If there is a material change in the estimate of a Mineral Resource, the estimate and supporting documentation in question is reviewed by a suitable qualified independent Competent Persons. The Company reports it’s Mineral Resources on an annual basis in accordance with JORC Code 2004 and 2012.
Competent Person’s Statement The information in this report that relates to all Mineral Resources other than the Kavanagh April 2014 Resource is based on information compiled by consultant geologist Mr Michael Thomson of MiGeo Enterprise Pty Ltd. Mr Thomson is a member of the Australasian Institute of Mining and Metallurgy and has sufficient experience which is relevant to the style of mineralisation and type of deposit under consideration to qualify as a Competent Person as defined in the December 2004 edition of the Australasian Code for Reporting of Exploration Results, Mineral Resources and Ore Reserves (JORC Code). Mr Thomson consents to the inclusion in this report of the matters based on his information in the form and context in which they appear. This information was prepared and first disclosed under the JORC Code 2004. It has not been updated since to comply with the JORC Code 2012 on the basis that the information has not materially changed since it was last reported. The information in this report that relates to Kavanagh April 2014 Mineral Resource, is based on, and fairly represents information and supporting documentation compiled by consultant geologist Mr Michael Thomson of MiGeo Enterprise Pty Ltd. Mr Thomson is a Member of The Australian Institute of Geoscientists and has sufficient experience which is relevant to the style of mineralisation and type of deposit under consideration and to the activity which he is undertaking to qualify as Competent Person as defined in the 2012 Edition of the “Australasian Code for Reporting of Exploration Results, Mineral Resources and Ore Reserves”. Mr Thomson consents to the inclusion in this report of the matters based on his information in the form and context in which they appear. The information in this report that relates to all Geological Data and Exploration Results is based on, and fairly represents information and supporting documentation compiled by consultant geologist Dr Joanna Pearson of Odyssey Directions Pty Ltd. Dr Pearson is a Member of The Australian Institute of Geoscientists and has sufficient experience which is relevant to the style of mineralisation and type of deposit under consideration and to the activity which she is undertaking to qualify as Competent Person as defined in the 2012 Edition of the “Australasian Code for Reporting of Exploration Results, Mineral Resources and Ore Reserves”. Dr Pearson consents to the inclusion in this report of the matters based on his information in the form and context in which they appear.

TANAMI GOLD NL DIRECTORS’ REPORT CONTINUED FOR THE YEAR ENDED 30 JUNE 2017
6
The Directors present their report together with the consolidated financial report of the Consolidated Entity, being the Company and its subsidiaries for the year ended 30 June 2017 and the auditor’s report thereon. 1. Directors The Directors of the Company at any time during or since the end of the financial year are: Non-Executive Chairman – Gerard J McMahon (appointed 23 April 2013 as a Non-Executive Director and Chairman as of 6 June 2013) Mr Gerard McMahon is admitted as a Barrister in Hong Kong and New South Wales and has been living and working in Hong Kong for over 35 years. He is a Non-Executive Chairman of ASX listed Oriental Technologies Investment Limited (appointed 1999), Non-Executive Director of Hong Kong listed Guangnan (Holdings) Limited (appointed 2000), and Non-Executive Director of Indonesian Investment Fund Limited (appointed 2001) a company listed on the Irish Stock Exchange. Mr McMahon is also a consultant to Asian Capital (Corporate Finance) Limited, a Hong Kong based corporate finance and advisory firm which he co-founded. Over the past 30 years, Mr McMahon has been a Director of other listed Companies in the Asia Pacific region which are involved in the banking, manufacturing, retailing, information technology, medical, telecoms & mining industries. Mr McMahon’s past experience includes extensive involvement in Hong Kong’s Securities and Futures Commission as Chief Counsel, Member and Executive Director and is specialised in Hong Kong company law, securities and banking law and takeovers and mergers regulations.
Special responsibilities - Member of the Audit Committee and the Remuneration and Nomination Committee. Non-Executive Director – Arthur G Dew, B.A., L.L.B. (appointed 2 December 2011) Mr Dew is a non-practising Barrister with a broad range of corporate and business experience and has served as a Director, and in some instances Chairman of the Board of Directors, of a number of publicly listed companies in Australia, Hong Kong and elsewhere. He is Chairman and Non-Executive Director of Hong Kong listed companies Allied Group Limited, Allied Properties (H.K) Limited and APAC Resources Limited and is a Non-Executive Director of Hong Kong listed SHK Hong Kong Industries Limited. He is also Non-Executive Chairman of ASX listed company’s Dragon Mining Limited and Tian An Australian Limited (previously known as PBD Developments Limited). Special responsibilities – Mr Dew was a Member of the Audit Committee and the Remuneration and Nomination Committee until 6 June 2013. Non-Executive Director – Carlisle C Procter, B.Ec, M.Ec, FFin, (appointed 9 December 2011) Mr Carlisle Procter graduated from the University of Sydney with a Bachelor's Degree and a Master's Degree in Economics. He is a fellow of the Financial Services Institute of Australasia (FFin.). Based in Australia, Mr Procter worked in the Reserve Bank of Australia for over 30 years, holding various senior management positions. Since leaving the Reserve Bank, he has worked as a consultant to the International Monetary Fund and the Asian Development Bank, and has also undertaken private consulting work in the Philippines, Indonesia and Papua New Guinea. Mr Procter has been a Non-Executive Director of a number of public companies. He is a Non-Executive Director of ASX listed company Dragon Mining Limited. Special responsibilities – Chairman of the Audit Committee and Member Remuneration and Nomination Committee. Non-Executive Director – Brett Montgomery (appointed 6 February 2013) Mr Brett Montgomery has extensive experience in the management of publicly listed mining companies having previously been the Managing Director of Kalimantan Gold NL, a Director of Grants Patch Mining Limited and Chairman and Joint Managing Director of Eurogold Limited. Mr Montgomery was appointed a Non-Executive Director of Magnum Gas and Power Limited on 9 October 2008 (resigned 19 August 2016) and Non-Executive Director of EZA Corporation Ltd on 19 November 2014 (resigned 18 January 2016) and Non-Executive Director of Bard1 Life Sciences Limited (formerly Eurogold Limited) on 17 November 2014.
Special responsibilities - Member of the Audit Committee and Chairman of the Remuneration and Nomination Committee. 2. Company Secretary Pauline Collinson was appointed Company Secretary on 18 July 2013 and has over 25 years’ experience in the mining industry.

TANAMI GOLD NL DIRECTORS’ REPORT CONTINUED FOR THE YEAR ENDED 30 JUNE 2017
7
3. Directors’ Meetings
Directors Boarding Meetings Audit Committee Meetings Remuneration and Nomination
Committee Meetings
Eligible to attend Attended Eligible to attend Attended Eligible to
attend Attended Mr G McMahon 5 5 2 2 - - Mr A Dew 5 5 2 2 - - Mr C Procter 5 5 2 2 - - Mr B Montgomery 5 5 2 2 - - Mr M Wong* 5 - 2 - - - *Mr M Wong is alternate director to Mr A Dew.
4. Nature of Operations and Principal Activities The Company is a no liability company and is domiciled and incorporated in Australia. The principal activity of the Consolidated Entity during the course of the financial year was gold exploration. The Company’s exploration centres are situated in the Tanami Desert straddling the Western Australian and Northern Territory border. The Company’s main undertaking, the Central Tanami Project (“CTP”) in the Northern Territory is located adjacent to the Tanami Track approximately 90 kilometres east of Coyote and is the subject of an unincorporated joint venture with Northern Star Resources NL. 5. Operating and Financial Review Joint Venture with Northern Star Resources Limited As previously announced, the Company and Northern Star Resources Limited (“NST”) have formed an unincorporated joint venture (“JV”) to advance the Company’s CTP. In accordance with the JV, management of the exploration activities at the Company’s CTP have been handed over to NST which will sole fund all JV expenditure including all CTP exploration and evaluation costs, assessment and development costs, mining of the JV tenements and refurbishing the CTP process plant and associated infrastructure, during the Sole Funding Period. The Sole Funding Period will expire on the date on which the process plant at the CTP has been refurbished to operating condition and has operated for a continuous 30 day period or has produced 5,000 ounces of gold ore (whichever occurs first). On the expiry of the Sole Funding Period, NST will have earned a further 35% undivided interest in the CTP (taking NST’s total JV Interest to 60%). Litigation with Metals X Limited On 23 September 2016, the Company announced that it had reached agreement with Metals X Limited (“MLX”) which ended the legal proceedings (the “Proceedings”) between the parties. The terms of the settlement were: (a) each party provided and received a full discharge and release from any and all claims in respect of, or arising out of or in connection
with the subject matter of the Proceedings; (b) each party will no longer pursue its claims against the other; (c) the Proceedings were dismissed on a no admission of liability basis; each party will bear its own legal costs; and (d) the Company (jointly and severally with Tanami (NT) Pty Ltd) made payment to MLX of $3,000,000. In reaching this settlement with MLX, the Company took into account its legal advice together with the significant costs and inherent uncertainty of litigation, and the substantial time commitments and distraction that the litigation presents for the board and management. Coyote Plant Agreement with ABM Resources NL On 14 July 2016, the Coyote Plant Agreement with ABM Resources NL Initial Lease Term expired and on that date, the management and maintenance of Coyote was handed back to the Company. Sale of NST Shares During the year, the Company sold 250,000 shares at a weighted average price of $5.53 per share to receive approximately $1.37 million net of transaction costs. At 30 June 2017, the Company had 750,000 shares in NST remaining.

TANAMI GOLD NL DIRECTORS’ REPORT CONTINUED FOR THE YEAR ENDED 30 JUNE 2017
8
Exploration
Western Tanami (100% Tanami)
During the year, Aircore drilling (53 holes totalling 3591metres) and follow up Reverse Circulation drilling (33 holes totalling 3252 metres) was completed. Drilling was targeted over the Rabid South and Nugget Patch prospect, areas defined by geological and geochemical mapping using portable XRF (“pXRF”) analysis of termite mounds. Previous studies at Coyote indicate that arsenic provides a broad exploration target for gold even though the relationship can be complicated by multiple partially overlapping geological events. The results from the drilling programme confirm that concept. Intercepts greater than 1 g/t are listed in Table 1 below. Table 1
Prospect Hole type Hole ID Easting Northing RL
Total
Depth
(m)
Azimuth
(degrees)
Dip
(Degrees) Au Intercept g/t
From Depth
(metres down
hole)
RABID SOUTH
Aircore
BWAC0516 488418 7789661 425 73 360 ‐60 1m @ 1.209 60
BWAC0533 488521 7789800 426 70 90 ‐60
1m @ 1.006 30
1m @ 2.905 31
BWAC0534 488500 7789801 429 51 90 ‐60
1m @ 14.427 22
1m @ 2.443 23
BWAC0536 488440 7789802 427 90 90 ‐60
1m @ 1.412 70
1m @ 4.455 86
BWAC0538 488361 7789801 424 78 90 ‐60
1m @ 2.012 49
1m @ 2.573 51
BWAC0542 488501 7789762 417 50 360 ‐60 1m @ 7.524 43
BWAC0547 488701 7789741 422 81 360 ‐60 1m @ 3.888 62
Reverse
Circulation
RSRC0001 488540 7789800 429 132 360 ‐60
1m @ 7.585 3
1m @ 2.87 4
RSRC0003 488417 7789800 424 132 360 ‐60
1m @ 3.099 45
1m @ 2.689 47
1m @ 2.317 83
1m @ 1.196 84
RSRC0009 488520 7789840 425 78 360 ‐60
1m @ 1.49 10
1m @ 13.212 19
RSRC0013 488480 7789760 427 126 360 ‐60 1m @ 2.383 5
NUGGET PACH
Aircore BWAC00548 487860 7790778 417 74 360 ‐60 1m @ 2.441 34
Reverse
Circulation
NPRC0011 487440 7790720 423 90 90 ‐60 1m @ 2.717 19
NPRC0013 487320 7790720 424 126 90 ‐60 1m @ 1.116 100

TANAMI GOLD NL DIRECTORS’ REPORT CONTINUED FOR THE YEAR ENDED 30 JUNE 2017
9
Gold mineralisation at Rabid South appears to be associated with north west (“NW”) trending quartz veins. Individual mineralised veins are hard to correlate between hole, however the broad zone, probably containing discontinuous veins remains open in all directions. Controls on mineralisation at the Nugget Patch remain elusive. Although mineralisation is probably controlled by NW trending veins, as at Rabid South, the presence of a dolerite and its influence on the distribution of mineralisation is not understood. The recognition of mineralisation at Rabid South and the Nugget Patch, brings a total of six significantly mineralised prospects located within 15km of Coyote, all of which are proximal to Tanami Fault or its splays (Figure 1). Exploration License E80/5035 has recently been granted, ensuring that all 6 targets are located on Tanami exploration leases. Figure 1 Significant mineralisation proximal to Tanami Fault
Regional geological and geochemical mapping has continued throughout the year (Figure 2), principally in the areas between mineralisation in the Stubbins formation along the Fremlin trend and mineralisation in the Killi Killi formation in proximity to the Tanami Fault (Road Runner, Rabid South, Rabies, and Nugget Patch). This is an attempt to gain a better understanding of the relationship and regional structural controls on the location of mineralisation and to identify the nature of the contact between the Stubbins and Killi Killi formations. A broad, transported, alluvial filled topographic low masks the contact and both airmagnetic data and surface geochemical responses are subdued. During the year, over 2,000 samples have been analysed by pXRF throughout the tenements, including 3 traverses spanning the known mineralised trend and alluvial low. The arsenic results clearly identify the granite contact in the west and approximately coincide with dolerites interpreted from airmagnetic data. The programme is on-going.

TANAMI GOLD NL DIRECTORS’ REPORT CONTINUED FOR THE YEAR ENDED 30 JUNE 2017
10
Figure 2 Geochemical mapping between Fremlin Trend and Tanami Fault
Central Tanami Exploration (75% Tanami) In accordance with the JV which commenced on 3 August 2015, management of the exploration activities at the Company’s CTP was assumed by NST who will sole fund all JV expenditure including CTP exploration and evaluation costs. The Company has continued to provide input into exploration targeting although NST, as Manager of JV activities, has responsibility to plan and implement ongoing exploration activities and ensure annual exploration commitments are met. Worked completed by NST during the full year consisted of:
Ongoing evaluation of the mineral resource potential within the CTP Mining Leases to identify extensions to existing mining areas and new exploration targets;
Compiling and remapping surface regolith of the CTP mine corridor including the commencement of a Depth of Cover study in conjunction with external consultants;
Commencement of a regional tectono-stratigraphic study which includes detailed geological remapping of the CTP mine corridor/Groundrush domains with extensive use of multi-element geochemical analysis;
Planning and design of regional and infill geochemical sampling programs; Design of first pass and infill regional aeromagnetic/radiometric geophysical surveys; Undertaking of an extensive environmental rehabilitation program within the existing CTP mining leases (legacy drilling and
infrastructure sites); Tanami Regional Exploration Mine Management Plan formally approved by the Department of Mines and Petroleum and security
issued; and Commencement of an extensive airborne magnetic/radiometric survey, which is expected to be completed in the September 2017
quarter. Evaluation of the CTP’s economics will recommence towards the end of 2017. Subject to a positive outcome, the CTP has the potential to be a 75,000 oz a year operation.

TANAMI GOLD NL DIRECTORS’ REPORT CONTINUED FOR THE YEAR ENDED 30 JUNE 2017
11
Financial Overview The Consolidated Entity generated a total comprehensive loss for the financial year ended 30 June 2017 of $5.29m (2016: profit $14.56m). Notable items during the financial year included:
Exploration expenditure of $1.04 million (2016: $0.40 million); A payment of $3.0 million to Metals X Limited in full settlement of the legal proceedings between the Group and Metals X Limited;
and The sale of 250,000 NST shares at an average price of $5.53 per share receiving approximately $1.37 million (net of transactions
costs). Business Strategies and Prospects As the Company holds a 75% interest in the CTP JV, the Board monitors and provides assistance to the JV Manager NST whilst it is earning its further interest (see CTP Exploration above). At Western Tanami, the Company is carrying out exploration in accordance with the Mines Department expenditure commitment required to maintain its tenements. The Board will continue to examine other options following the termination of the Coyote Lease with ABM. Risks Whilst the Board believes the CTP will be returned to commercial production under the NST HoA, there are risks and uncertainties. These include, but are not limited to, the gold price and a risk that the CTP exploration programme being undertaken by NST does not produce a commercial outcome. Environmental risks are noted in section 6 below and financial risks are set out in note 22 of the financial statements. Community Relations The Company recognises the importance of developing relationships with the Traditional Owners that are based on trust and mutual advantage and of are respectful of the needs and concerns of the communities located within the regions in which it operates. The Company has agreements in place with the Traditional Owners and is committed to building strong relationships by:
Being open and transparent in its communications; Improving cross-cultural awareness through training and education; Developing community relations management procedures that include business alliances; Being sensitive to the values and heritage issues of the local communities; and Being a good neighbour.
During the year, one meeting was held with the Central Land Council, representing the Traditional Owners. As a consequence of the NST JV, NST now communicates with the Central Land Council. 6. Environmental Regulation The environment is a key aspect of mining activities. The Consolidated Entity’s operations are subject to environmental regulations under Commonwealth and State legislation. The Directors believe that the Consolidated Entity has adequate systems in place for the management of the requirements under those regulations, and are not aware of any breach of such requirements as they apply to the Consolidated Entity.
7. Significant Changes in the Company’s State of Affairs Significant changes to the Company’s State of Affairs have been set out in the Operating and Financial Review above and in the Events Subsequent to Reporting Date below. 8. Dividends The Directors have not recommended the declaration of a dividend. No dividends were paid or declared during the year.
9. Events Subsequent to Reporting Date There were not reportable events subsequent to reporting date. 10. Likely Developments
Following on from the NST HoA, the Company expects that NST will continue with its exploration and drilling programme at the CTP and refurbishment of the processing facilities.

TANAMI GOLD NL DIRECTORS’ REPORT CONTINUED FOR THE YEAR ENDED 30 JUNE 2017
12
11. Directors’ Interests The relevant interest of each director in shares and options of the Company, as notified by the directors to the Australian Securities Exchange in accordance with section S205G(1) of the Corporations Act 2001, at the date of this report is as follows:
Directors Fully paid shares Unquoted options Mr G McMahon 2,500,000 - Mr A Dew - - Mr C Procter - - Mr B Montgomery 20,000,000 - Mr M Wong - -
12. Share Options Options granted to Directors and Executives of the Company During or since the end of the financial year, the Company has not granted any options over unissued ordinary shares in the Company to any of the directors as part of their remuneration. Unissued shares under option At the date of this report there were no unissued ordinary shares in the Company. During the year, there were no options forfeited due to performance criteria not being achieved or cessation of employment. Shares issued Since the end of the financial year, there were no shares issued. Shares issued on exercise of options During the financial year, no shares were issued by the Company as a result of the exercise of options. 13. Remuneration Report – audited Remuneration is referred to as compensation throughout this report. Key management personnel have authority and responsibility for planning, directing and controlling the activities of the Company and the Consolidated Entity. Key management personnel comprise the directors of the Company and executives of the Company and the Consolidated Entity. Compensation levels for key management personnel of the Company and relevant key management personnel of the Consolidated Entity are competitively set to attract and retain appropriately qualified and experienced directors and executives. The compensation structures explained below are designed to attract suitably qualified candidates, reward the achievement of strategic objectives, and to achieve the broader outcome of creation of value for shareholders. Compensation packages include a mix of fixed compensation and equity-based compensation as well as employer contributions to superannuation funds. Shares and options may only be issued to directors subject to approval by shareholders in a general meeting. The Board has no established retirement or redundancy schemes. 13.1.1 Fixed Compensation Fixed compensation consists of base compensation (which is calculated on a total cost basis and includes any FBT charges related to employee benefits), as well as employer contributions to superannuation funds. Compensation levels are reviewed regularly through a process that considers individual performance and the overall performance of the Consolidated Entity. 13.1.2 Performance-linked Compensation (short-term incentive bonus) The Company has not paid any performance linked short-term incentives to key management personnel during the financial year ended 30 June 2017 (2016: nil).

TANAMI GOLD NL DIRECTORS’ REPORT CONTINUED FOR THE YEAR ENDED 30 JUNE 2017
13
13. Remuneration Report – audited (continued) 13.1.3 Equity-based Compensation (long-term incentive bonus) The Company has in place an Option and Performance Rights Plan. Options may only be issued to directors subject to approval by shareholders in a general meeting. The Remuneration and Nomination Committee uses equity-based long-term incentives (LTIs) where appropriate to promote continuity of employment and to provide additional incentive to increase shareholder wealth. LTIs are provided as options over ordinary shares of the Company and are provided to key management personnel and employees based on their level of seniority and position within the Company and are exercisable on various dates. LTIs shall be in such form and content and with such terms and conditions as the Board determines, including exercise price, vesting conditions, disposal conditions and terms of expiry. If the option holder ceases to be a director and/or employee of the Company during the vesting period for any reason, the options will expire six months after cessation (subject to the exercise of discretion by the Board) and cease to carry any rights or benefits unless otherwise approved by the Remuneration and Nomination Committee. There are no voting or dividend rights attached to the options. Voting rights will be attached to the ordinary issued shares when the options have been exercised. There were no LTI granted during the year. On 20 September 2012, the Company introduced a policy that prohibits those that are granted share-based payments as part of their remuneration from entering into other arrangements that limit their exposure to losses that would result from share price decreases. Entering into such arrangements has been prohibited by law since 1 July 2011. 13.1.4 Consequences of Performance on Shareholder Wealth The Company continues to focus on enhancing shareholder value through the Farm-Out and Joint Venture Agreement with NST at the CTP outlined previously. To assist shareholders in assessing the Consolidated Entity’s performance and benefits for shareholder wealth, the Company reports the following data for the current financial year and the previous five financial years:
2017 2016 2015 2014 2013 $'000 $'000 $'000 $'000 $'000 (Loss)/profit attributable to owners of the Company (4,699) 12,570 (6,612) (19,628) (68,033) Dividends paid - - - - - Share price at 30 June
$ 0.051
$ 0.049
$ 0.028
$ 0.016
$ 0.054
13.1.5 Service Contracts Compensation and other terms of employment for directors and key management personnel are formalised in contracts of employment. The major provisions of the agreements relating to compensation are set out below.
Mr Daniel Broughton – Chief Financial Officer Mr Broughton is employed on a contract basis as Chief Financial Officer. The arrangement can be terminated by either party without notice and without a termination payment. Mr Broughton has been Chief Financial Officer since 8 September 2014. No remuneration consultants were engaged by the Company during the year. 13.2 Non-executive directors
Non-executive directors do not receive performance related compensation. Directors' fees cover all main board activities and membership of any committee. The Board has not established retirement or redundancy schemes in relation to non-executive directors. Non-Executive Directors, Mr Gerard McMahon and Mr Brett Montgomery, each continued their significantly expanded roles in the day-to-day running of the Company.
13.3 Directors’ and executive officers’ remuneration Details of the nature and amounts of each major element of the remuneration of each director of the Company and each of the named officers of the Company and the Consolidated Entity receiving the highest remuneration are:

TANAMI GOLD NL DIRECTORS’ REPORT CONTINUED FOR THE YEAR ENDED 30 JUNE 2017
14
13. Remuneration Report – audited (continued)
2017 Short-term Post-employment
Salary & Fees Superannuation Total
Remuneration
Proportion of Remuneration
Performance Related
$ $ $ % Directors - Non-executive Mr G McMahon 100,000 9,500 109,500 - Mr A Dew 25,000 2,375 27,375 - Mr C Procter 25,000 2,375 27,375 - Mr B Montgomery 120,000 - 120,000 - Executives Mr D Broughton 99,000 - 99,000 - Total 369,000 14,250 383,250 -
2016 Short-term Post-employment
Salary & Fees Superannuation Total
Remuneration
Proportion of Remuneration
Performance Related
$ $ $ % Directors - Non-executive Mr G McMahon 100,000 9,500 109,500 - Mr A Dew 25,000 2,375 27,375 - Mr C Procter 29,275 2,781 32,056 - Mr B Montgomery 120,000 - 120,000 - Executives Mr D Broughton 99,000 - 99,000 - Total 373,275 14,656 387,931 - 13.4 Equity instruments - audited 13.4.1 Options over equity instruments granted as compensation - audited No options over ordinary shares in the Company were granted as compensation to key management personnel during the reporting period and no options vested during the reporting period. 13.4.2 Modifications of terms of equity-settled share-based payment transactions No terms of equity-settled share-based payment transactions (including options and rights granted as compensation to key management personnel) have been altered or modified by the issuing entity during the reporting period or the prior period. 13.4.3 Exercise of options granted as compensation During the financial year, no shares were issued on the exercise of options previously granted as compensation to key management personnel. 13.4.4 Analysis of options and rights over equity instruments granted as compensation - audited No options have been issued, granted or will vest to key management personnel of the Company.

TANAMI GOLD NL DIRECTORS’ REPORT CONTINUED FOR THE YEAR ENDED 30 JUNE 2017
15
13. Remuneration Report – audited (continued) 13.4.5 Analysis of movements in options and rights There were no options granted during the financial year ended 30 June 2017 and 30 June 2016 to key management personnel. 13.4.6 Shareholdings of Directors and Key Management Personnel
Ordinary Fully Paid Shares Balance 1 July 2016Granted as
RemuneratonOn Market
Purchases / (Sales)Balance 30 June
2017Directors - Non-executiveMr G McMahon 1,500,000 - 1,000,000 2,500,000Mr A Dew - - - -Mr C Proctor - - - -Mr B Montgomery 20,000,000 - - 20,000,000
ExecutivesMr D Broughton - - - -
Total 21,500,000 - 1,000,000 22,500,000
Ordinary Fully Paid Shares Balance 1 July 2015Granted as
RemuneratonOn Market
Purchases / (Sales)Balance 30 June
2016Directors - Non-executiveMr G McMahon - - 1,500,000 1,500,000Mr A Dew - - - -Mr C Proctor - - - -Mr B Montgomery 20,000,000 - - 20,000,000
ExecutivesMr D Broughton - - - -
Total 20,000,000 - 1,500,000 21,500,000 13.4.7 Options of Directors and Key Management Personnel No options were issued during the 2017 financial year (2016: nil). 14. Non-Audit Services During the year, KPMG, the Consolidated Entity’s auditor, performed certain other services in addition to their statutory duties.
The Board has established certain procedures to ensure that the provision of non-audit services are compatible with, and do not compromise, the auditor independence requirements of the Corporations Act 2001. These procedures include:
a. Non-audit services will be subject to the corporate governance procedures adopted by the Company and will be reviewed by the Audit Committee to ensure they do not impact the integrity and objectivity of the auditor.
b. Ensuring non-audit services do not involve the auditors reviewing or auditing their own work, acting in a management or decision making capacity for the Company, acting as an advocate for the Company or jointly sharing risks and rewards.
Details of the amounts paid or payable to the auditor of the Company, KPMG, and its related practices for audit and non-audit services provided during the year are set out below.
Auditors Remuneration2017 2016
$ $Audit servicesAmounts paid, or due and payable, to the auditor KPMG for:Audit and review of the financial statements 43,000 40,000
Other servicesAccounting advice - 24,000

TANAMI GOLD NL DIRECTORS’ REPORT CONTINUED FOR THE YEAR ENDED 30 JUNE 2017
16
15. Indemnification and Insurance of Officers Indemnification The Company has agreed to indemnify both the current directors of the Company and former directors against liability incurred to a third party (not being the Company or any related company) that may arise from their positions as directors or officers of the Company and its controlled entities, unless the liability arises out of conduct involving a lack of good faith. The Company has also agreed to cover the costs and expenses incurred in successfully defending civil or criminal proceedings, or in connection with a successful application for relief under the Corporations Act 2001. The Company also provides indemnity against costs and expenses in connection with an application where a court grants relief to a director or officer under the Corporations Act 2001. Insurance Premiums Since the end of the 2012 financial year, the Company has paid insurance premiums in respect of directors' and officers' liability insurance, for the directors of the controlled entity. In accordance with subsection 300(9) of the Corporations Act 2001, further details have not been disclosed due to confidentiality provisions of the insurance contracts. 16. Lead Auditor's Independence Declaration under Section 307C of the Corporations Act 2001 The lead auditor's independence declaration is set out on page 17 and forms part of the directors' report for the financial year ended 30 June 2017. 17. Rounding off The amounts contained in this report and in the financial report have been rounded to the nearest $1,000 (unless otherwise stated) and where noted ($’000) under the option available to the Company under ASIC Corporations (Rounding in Financial/Directors Report) Instrument 2016/191. The Company is an entity to which the instrument applies. Dated at Perth, Western Australia this 15th day of September 2017. Signed in accordance with a resolution of the Directors.
Gerard McMahon Non-Executive Chairman Perth, Western Australia 15 September 2017

TANAMI GOLD NL LEAD AUDITOR’S INDEPENDENCE STATEMENT FOR THE YEAR ENDED 30 JUNE 2017
17

TANAMI GOLD NL CONSOLIDATED STATEMENT OF PROFIT OR LOSS AND OTHER COMPREHENSIVE INCOME FOR THE YEAR ENDED 30 JUNE 2017
18
2017 2016
Note $'000 $'000Revenue 2 167 39Other income 2 160 2,158Profit on sale of assets 2 841 18,040Care and maintenance costs (incl depreciation and amortisation) 2 (3,356) (2,942)Exploration and evaluation expenses 2 (1,036) (704)Corporate and other expenses 2 (1,250) (4,724)Results from operating activities (4,474) 11,867
Financial income 169 162Financial expenses 2 (138) (312)Net finance expense 31 (150)(Loss)/profit before income tax (4,443) 11,717
Deferred Income tax (expense)/benefit 3 (256) 853(Loss)/profit from operations (4,699) 12,570
(Loss)/profit for the year (4,699) 12,570
Other comprehensive incomeItems that may be reclassified subsequently to profit or loss:Net (loss)/gain on financial assets classified as available for sale (net of tax) (598) 1,990Other comprehensive (loss)/gain for the year (net of income tax) (598) 1,990Total comprehensive (loss)/profit for the year attributable to owners of the Company (5,297) 14,560
Earnings per shareBasic (loss)/profit per share (0.004) 0.011Diluted (loss)/profit per share (0.004) 0.011
The consolidated statement of profit or loss and other comprehensive income is to be read in conjunction with the accompanying notes to the financial statements.

TANAMI GOLD NL CONSOLIDATED STATEMENT OF FINANCIAL POSITION FOR THE YEAR ENDED 30 JUNE 2017
19
2017 2016
Assets Note $'000 $'000Current assetsCash and cash equivalents 5 4,573 9,180Other receivables 6 54 314Inventories 7 251 128Available for sale financial assets 8 3,563 4,940Total current assets 8,441 14,562
Non-current assetsOther receivables 6 2,513 2,513Property, plant and equipment 9 1,494 2,646Acquired exploration and evaluation 10 15,539 15,539Total non-current assets 19,546 20,698
Total assets 27,987 35,260
LiabilitiesCurrent liabilitiesTrade and other payables 11 252 411Provisions 12 34 3,018Deferred revenue - 83Total current liabilities 286 3,512
Non-current liabilitiesProvisions 12 11,339 10,090Total non-current liabilities 11,339 10,090
Total liabilities 11,625 13,602
Net assets 16,362 21,658
EquityIssued capital 13 317,637 317,637Accumulated losses (302,667) (298,098)Reserves 1,392 2,120Total equity attributable to equity holders of the Company 16,362 21,659
The consolidated statement of financial position is to be read in conjunction with the accompanying notes to the financial statements.

TANAMI GOLD NL CONSOLIDATED STATEMENT OF CHANGES IN EQUITY FOR THE YEAR ENDED 30 JUNE 2017
20
Issued Capital Accumulated
LossesShare Based
Payment Reserve
Available For Sale Fair
Value Reserve
Total
$'000 $'000 $'000 $'000 $'000Balance at 1 July 2015 317,637 (310,668) 130 - 7,099
Profit for the period - 12,570 - - 12,570
Net change in fair value of available for sale financial assets - - - 1,990 1,990Total comprehensive profit for the period - 12,570 - 1,990 14,560
Transactions with Owners in their Capacity as Owners:Shares issued (net of costs) - - - - -Recognition of share based payments - - - - -Balance at 30 June 2016 317,637 (298,098) 130 1,990 21,659
Balance at 1 July 2016 317,637 (298,098) 130 1,990 21,659
Loss for the period - (4,699) - - (4,699)
Net change in fair value of available for sale financial assets - - - (598) (598)Total comprehensive loss for the period - (4,699) - (598) (5,297)
Transactions with Owners in their Capacity as Owners:Shares issued (net of costs) - - - - -Transfer resulting from options lapsed - 130 (130) - -Balance at 30 June 2017 317,637 (302,667) - 1,392 16,362
The consolidated statement of changes in equity is to be read in conjunction with the accompanying notes to the financial statements.

TANAMI GOLD NL CONSOLIDATED STATEMENT OF CASH FLOWS FOR THE YEAR ENDED 30 JUNE 2017
21
Note 2017 2016
$'000 $'000Cash flows from operating activitiesCash receipts from customers 167 39Cash receipts from ABM lease - 2,192Cash payments in the course of operations (2,370) (2,445)Cash payments for withholding tax - (43)Interest received 171 164Interest paid - (195)Payments for exploration and evaluation (1,025) (848)Cash payment for litigation settlement (3,000) -
Net cash used by operating activities 21 (6,057) (1,136)
Cash flows from investing activitiesProceeds from sale of property, plant and equipment - 11,000Proceeds from sale of financial assets 1,375 10,120
Dividends received 75 -
Net cash from investing activities 1,450 21,120
Cash flows from financing activitiesProceeds from borrowings - 1,000Repayment of borrowings - (12,000)
Net cash (used)/provided from financing activities - (11,000)
Net (decrease)/increase in cash and cash equivalents held (4,607) 8,984
Cash and cash equivalents at beginning of the financial year 9,180 196
Cash and cash equivalents at the end of the financial year 4,573 9,180
The consolidated statement of cash flows is to be read in conjunction with the accompanying notes to the financial statements.

TANAMI GOLD NL NOTES TO THE FINANCIAL STATEMENTS FOR THE YEAR ENDED 30 JUNE 2017
22
1. SIGNIFICANT ACCOUNTING POLICIES
(a) Reporting Entity Tanami Gold NL (‘the Company’) is a company domiciled in Australia. The address of the Company’s registered office is Unit B1, 431 Roberts Road, Subiaco Western Australia 6008. The consolidated financial statements of the Company as at and for the year ended 30 June 2017 comprise the Company and its subsidiaries (together referred to as the “Consolidated Entity”) and the Consolidated Entity’s interest in associates. The Consolidated Entity is a for profit entity and is primarily involved in gold exploration.
(b) Basis of Preparation
Statement of Compliance The consolidated financial statements are general purpose financial statements which have been prepared in accordance with Australian Accounting Standards (AASBs) adopted by the Australian Accounting Standards Board (AASB) and the Corporations Act 2001. The consolidated financial statements comply with International Financial Reporting Standards (IFRSs) adopted by the International Accounting Standards Board (IASB). The consolidated financial statements were authorised for issue by the Board of Directors on 15 September 2017. Basis of Measurement The consolidated financial statements have been prepared on the historical cost basis. Functional and Presentation Currency These consolidated financial statements are presented in Australian dollars, which is the Company’s functional currency. Use of estimates and judgements The preparation of consolidated financial statements requires management to make judgements, estimates and assumptions that affect the application of accounting policies and the reported amounts of assets, liabilities, income and expenses. Actual results may differ from these estimates. Estimates and underlying assumptions are reviewed on an ongoing basis. Revisions to accounting estimates are recognised in the period in which the estimate is revised and in any future periods affected. Judgements made by management in the application of the Australian Accounting Standards that have significant effect on the financial report and estimates with a significant risk of material adjustment in the next year are discussed below. Accounting estimates and judgements Management discussed with the Audit Committee the development, selection and disclosure of the Consolidated Entity's critical accounting policies and estimates and the application of these policies, estimates and judgements. The estimates and judgements that may have a significant impact on the carrying amount of assets and liabilities are discussed below: (i) Mine rehabilitation and site restoration provision The Consolidated Entity assesses its mine rehabilitation and site restoration provision at each balance date in accordance with accounting policy note 1(i). Significant judgement is required in determining the provision for mine rehabilitation and site restoration as there are many transactions and other factors that will affect the ultimate liability payable to rehabilitate and restore the mine sites and related assets. Factors that will affect this liability include future development, changes in technology, price increases and changes in interest rates. When these factors change or become known in the future, such differences will impact the site restoration provision and asset in the period in which they change or become known. (ii) Impairment In accordance with accounting policy note 1(h), the Consolidated Entity, in determining whether the recoverable amount of its cash generating unit is the higher of fair value less costs to sell or value-in-use against which asset impairment is to be considered, undertakes future cash flow calculations which are based on a number of critical estimates and assumptions including, for its mine properties, forward estimates of:
mine life, including quantities of mineral reserves and resources for which there is a high degree of confidence of economic extraction with given technology;
production levels and demand; metal price; inflation; cash costs of production; and discount rates applicable to the cash generating unit; and or offers to purchase the CGU.

TANAMI GOLD NL NOTES TO THE FINANCIAL STATEMENTS FOR THE YEAR ENDED 30 JUNE 2017
23
1. SIGNFIICANT ACCOUNTING POLICIES (CONTINUED) (b) Basis of Preparation (continued) (iii) Impairment of exploration and evaluation of assets, investment in subsidiary and loans to subsidiary The ultimate recoupment of the value of exploration and evaluation assets, the Company’s investment in its subsidiaries and loans to its subsidiaries is dependent on successful development and commercial exploitation, or alternatively, sale, of the underlying mineral exploration properties. The Consolidated Entity undertakes at least on an annual basis, a comprehensive review of indicators of impairment of these assets. There is significant estimation and judgement in determining the inputs and assumptions used in determining the recoverable amounts where there are impairment indicators. The key areas of estimation and judgement that are considered in this review include:
recent drilling results and reserves and resource estimates; environmental issues that may impact the underlying tenements; the estimated market value of assets at the review date; independent valuation of underlying assets that may be available; fundamental economic factors such as the gold price, exchange rates and current and anticipated operating costs in the industry; and the Consolidated Entity’s market capitalisation compared to its net assets.
Information used in the review process is tested against externally available information as appropriate. The accounting policies set out below have been applied consistently to all periods presented in these consolidated financial statements. (c) Basis of Consolidation (i) Subsidiaries The consolidated financial statements comprise the financial statements of Tanami Gold NL and its subsidiaries (including structured entities) as at 30 June each year (the “Group”). Control is achieved when the Group is exposed, or has rights, to variable returns from its involvement with the investee and has the ability to affect those returns through its power over the investee. Specifically, the Group controls an investee if and only if the Group has:
Power over the investee (i.e. existing rights that give it the current ability to direct the relevant activities of the investee); Exposure, or rights, to variable returns from its involvement with the investee; and The ability to use its power over the investee to affect its returns.
When the Group has less than a majority of the voting or similar rights of an investee, the Group considers all relevant facts and circumstances in assessing whether it has power over an investee, including:
The contractual arrangement with the other vote holders of the investee; Rights arising from other contractual arrangements; and The Group’s voting rights and potential voting rights.
The Group reassesses whether or not it controls a subsidiary if facts and circumstances indicate that there are changes to one or more of the three elements of control. Consolidation of a subsidiary begins when the Group obtains control over the subsidiary and ceases when the Group loses control of the subsidiary. Assets, liabilities, income and expenses of a subsidiary acquired or disposed of during the year are included in the Consolidated Statement of Comprehensive Income from the date the Group gains control until the date the Group ceases to control the subsidiary. (i) Subsidiaries (continued) Profit or loss and each component of other comprehensive income are attributed to the equity holders of the parent of the Group and to the non-controlling interests, even if this results in the non-controlling interest having a deficit balance. When necessary, adjustments are made to the financial statements of subsidiaries to bring their accounting policies into line with the Group’s accounting policies. All intra-group assets and liabilities, equity, income, expenses and cash flows relating to transactions between members of the Group are eliminated in full on consolidation. A change in the ownership interest of a subsidiary, without a loss of control, is accounted for as an equity transaction. If the Group loses control over a subsidiary, it:

TANAMI GOLD NL NOTES TO THE FINANCIAL STATEMENTS FOR THE YEAR ENDED 30 JUNE 2017
24
1. SIGNFIICANT ACCOUNTING POLICIES (CONTINUED) (c) Basis of Consolidation (continued)
de-recognises the assets (including goodwill) and liabilities of the subsidiary; de-recognises the carrying amount of any non-controlling interests; de-recognises the cumulative translation differences recorded in equity; recognises the fair value of the consideration received; recognises the fair value of any investment retained; recognises any surplus or deficit in profit or loss; and reclassifies the parent’s share of components previously recognised in other comprehensive income to profit or loss of retained earnings,
as appropriate, as would be required if the Group had directly disposed of the related assets or liabilities. (d) Available for Sale Financial Assets Available for sale financial assets are non-derivative financial assets that are designated as available for sale or are not classified in another category of financial assets. Available for sale financial assets are recognised initially at fair value plus any directly attributable transaction costs. Subsequent to initial recognition, they are measured at fair value and changes therein, other than impairment losses are recognised in other comprehensive income and presented in the available for sale fair value reserve in equity. When an investment is derecognised, the cumulative gain or loss in equity is reclassified to profit or loss. Available for sale financial assets comprise equity securities. The fair value of investments in quoted equity securities is determined by reference to their quoted closing bid price at the reporting date. (e) Property, Plant and Equipment Items of property, plant and equipment are measured at cost less accumulated depreciation and impairment losses. All such assets, except freehold land, are depreciated over their estimated useful lives on a straight line, reducing balance or production output basis, as considered appropriate, commencing from the time the asset is held ready for use. Cost includes expenditures that are directly attributable to the acquisition of the asset. Gains and losses on disposal of an item of property, plant and equipment are determined by comparing the proceeds from disposal with the carrying amount of property, plant and equipment and are recognised net within “Profit on Sale of Assets” in profit or loss. The cost of replacing part of an item of property, plant and equipment is recognised in the carrying amount of the item if it is probable that the future economic benefits embodied within the part will flow to the Consolidated Entity and its cost can be measured reliably. The carrying amount of the replaced part is derecognised. The costs of the day-to-day servicing of property, plant and equipment are recognised in profit or loss as incurred. Depreciation is recognised in profit or loss on a straight-line basis over the estimated useful lives of each part of an item of property, plant and equipment. The estimated depreciation rates for the current and comparative periods are as follows:
Major depreciation periods are: 2017 2016 Buildings 2.5% 2.5% Plant and equipment 15–33% 15–33% Motor vehicles 13-33% 13-25% Furniture and fittings 7.5-40% 7.5-40%
Depreciation methods, useful lives and residual values are reassessed at each reporting date and adjusted if appropriate. (i) Useful lives Mine development costs are depreciated or amortised over the lower of their estimated useful lives and the estimated remaining life of the mine. The estimated remaining life of the mine is based upon geological resources. Assets not linked to the mining operation are depreciated over their estimated useful lives. (ii) Amortisation Amortisation is charged to the income statement, except to the extent that it is included in the carrying amount of another asset as an allocation of production overheads. Any rehabilitation asset is amortised on a straight-line basis over the life of the mine. Amortisation is not charged on costs carried forward in respect of interest in the development phase until commercial production commences.

TANAMI GOLD NL NOTES TO THE FINANCIAL STATEMENTS FOR THE YEAR ENDED 30 JUNE 2017
25
1. SIGNFIICANT ACCOUNTING POLICIES (CONTINUED)
(e) Property, Plant and Equipment (continued) Mining properties in production (including exploration, evaluation and development expenditure) are accumulated and brought to account at cost less accumulated amortisation in respect of each identifiable area of interest. Amortisation of capitalised costs is provided on the production output basis, proportional to the depletion of the mineral resource of each area of interest expected to be ultimately economically recoverable. (f) Exploration and Evaluation Acquisition costs and acquired exploration and evaluation expenditure which are acquired are capitalised, until such times as an impairment is considered. Pre-licence costs are expensed in the period in which they are incurred. Once the legal right to explore has been acquired, exploration and evaluation expenditure incurred on licenses where the technical feasibility and commercial viability of extracting mineral resources has not yet been established is expensed as incurred. The directors of the Company generally consider a project to be economically viable on the satisfactory completion of a feasibility study and a JORC reserve estimate. Exploration and evaluation expenditure incudes the costs of acquiring and maintaining the rights to explore, investigate, examine and evaluate an area of mineralisation, and assessing the technical feasibility and commercial viability of extracting the mineral resources from that area. (g) Acquisition of Assets Assets acquired are recognised at cost. Cost is measured as the fair value of the assets given up, shares issued or liabilities undertaken at the date of acquisition plus incidental costs directly attributable to the acquisition. When equity instruments are issued as consideration, their market price at the date of acquisition is used as fair value. Transaction costs arising on the issue of equity instruments are recognised directly in equity. Where settlement of any part of cash consideration is deferred, the amounts payable are recorded at their present value, discounted at the rate applicable to the Company if a similar borrowing were obtained from an independent financier under comparable terms and conditions. Costs incurred on assets subsequent to initial acquisition are capitalised when it is probable that future economic benefits in excess of the original performance of the asset will flow to the Company in future years. Costs that do not meet the criteria for capitalisation are expensed as incurred. (h) Impairment The carrying amounts of the Consolidated Entity’s assets, other than inventories and deferred tax assets are reviewed at each reporting date to determine whether there is any indication of impairment. If any such indication exists then the asset’s recoverable amount is estimated. An impairment loss is recognised whenever the carrying amount of an asset or its cash-generating unit exceeds its recoverable amount. Impairment losses are recognised in profit or loss. A cash-generating unit is the smallest identifiable asset group that generates cash flows that are largely independent from other assets and groups. Impairment losses recognised in respect of cash-generating units are allocated first to reduce the carrying amount of any goodwill allocated to the units and then to reduce the carrying amount of the other assets in the unit (group of units) on a pro rata basis. The recoverable amount of an asset or cash-generating unit is the greater of its value in use and its fair value less costs of disposal. In assessing value in use, the estimated future cash flows are discounted to their present value using a pre-tax discount rate that reflects current market assessments of the time value of money and the risks specific to the asset. Impairment losses recognised in prior periods are assessed at each reporting date for any indications that the loss has decreased or no longer exists. An impairment loss is reversed if there has been a change in estimates used to determine the recoverable amount. An impairment loss is reversed only to the extent that the asset’s carrying amount does not exceed the carrying amount that would have been determined, net of depreciation or amortisation, if no impairment loss had been recognised. (i) Provision A provision is recognised if, as a result of a past event, the Consolidated Entity has a present legal or constructive obligation that can be measured reliably, and it is probable that an outflow of economic benefits will be required to settle the obligation. Provisions are determined by discounting the expected future cash flows at a pre-tax rate that reflects current market assessments of the time value of money and the risks specific to the liability. A provision is made for the estimated cost of rehabilitation relating to areas disturbed during the mine's operation up to reporting date but not yet rehabilitated. Provision has been made in full for all disturbed areas at the reporting date based on current estimates of costs to rehabilitate such areas, discounted to their present value based on expected future cash flows. The estimated cost of rehabilitation includes the current cost of re-contouring, topsoiling and revegetation, employing legislative requirements. Changes in estimates are dealt with on a prospective basis as they arise. Uncertainty exists as to the amount of rehabilitation obligations which will be incurred due to the impact of changes in environmental legislation. The amount of the provision relating to rehabilitation of mine infrastructure and dismantling obligations is recognised at the commencement of the mining project and/or construction of the assets where a legal or constructive obligation exists at that time. The provision is recognised as a non-current liability with a corresponding asset included in property, plant and equipment.

TANAMI GOLD NL NOTES TO THE FINANCIAL STATEMENTS FOR THE YEAR ENDED 30 JUNE 2017
26
1. SIGNFIICANT ACCOUNTING POLICIES (CONTINUED) (i) Provision (continued) At each reporting date the rehabilitation liability is re-measured in line with changes in discount rates and timing or amount of costs to be incurred. Changes in the liability relating to rehabilitation of mine infrastructure and dismantling obligations are added to or deducted from the related asset, other than the unwinding of the discount which is recognised as finance costs in profit or loss as it occurs. If the change in liability results in a decrease in the liability that exceeds the carrying amount of the asset, the asset is written-down to nil and the excess is recognised immediately in the income statement. If the change in the liability results in an addition to the cost of the asset, the recoverability of the new carrying amount is considered. Where there is an indication that the new carrying amount is not fully recoverable, an impairment test is performed with the write-down recognised in profit or loss in the period in which it occurs. (j) Expenses
(i) Operating lease payments Payments made under operating leases are recognised in profit or loss on a straight-line basis over the term of the lease. Lease incentives received are recognised in profit or loss as an integral part of the total lease expense and spread over the lease term. (ii) Net financing costs Net financing costs comprise interest payable on borrowings calculated using the effective interest method, finance establishment costs, discount unwind on the restoration and rehabilitation provision, interest receivable on funds invested, foreign exchange gains and losses, gains and losses on sale of financial assets, and gains and losses on hedging instruments that are recognised in the income statement. Interest income is recognised in the income statement as it accrues, using the effective interest method. The interest expense component of finance lease payments is recognised in the income statement using the effective interest method. (k) Inventories Raw materials and stores, work in progress (stockpiles and gold in circuit) and finished goods (bullion) are stated at the lower of cost and net realisable value. Cost comprises direct materials, direct labour and an appropriate proportion of variable and fixed overhead expenditure, the latter being allocated on the basis of normal operating capacity. Net realisable value is the estimated selling price in the ordinary course of business less the estimated costs of completion and the estimated costs necessary to make the sale. Costs are assigned to individual items of inventory on the basis of weighted average costs. Cost includes direct material, overburden removal, mining, processing, labour related transportation cost to the point of sale, mine rehabilitation costs incurred in the extraction process and other fixed and variable costs directly related to mining activities. (l) Investments All investments are initially recognised at cost, being the fair value of the consideration given and acquisition charges associated with the investment. After initial recognition, investments, which are classified as held for trading and available-for-sale, are measured at fair value. Gains or losses on investments held for trading are recognised in the income statement. Gains or losses on available for sale investments (which comprise equity securities) are recognised as a separate component of equity until the investment is sold, collected or otherwise disposed of, or until the investment is determined to be impaired, at which time the cumulative gain or loss previously reported in equity is included in the income statement. Non-derivative financial assets with fixed or determinable payments and fixed maturity are classified as held-to-maturity when the Consolidated Entity has the positive intention and ability to hold to maturity. Investments intended to be held for an undefined period are not included in this classification. Other long-term investments that are intended to be held-to-maturity, such as bonds, are subsequently measured at amortised cost using the effective interest method. Amortised cost is calculated by taking into account any discount or premium on acquisition, over the period to maturity. For investments carried at amortised cost, gains and losses are recognised in income when the investments are derecognised or impaired, as well as through the amortisation process. For investments that are actively traded in organised financial markets, fair value is determined by reference to ASX quoted market bid prices at the close of business on the balance sheet date. For investments where there is not a quoted market price, fair value is determined by reference to the current market value of another instrument which is substantially the same or is calculated based on the expected cash flows of the underlying net asset base of the investment. (m) Other Receivables Other receivables are initially recorded at the amount of proceeds due and are subsequently measured at amortised cost.

TANAMI GOLD NL NOTES TO THE FINANCIAL STATEMENTS FOR THE YEAR ENDED 30 JUNE 2017
27
1. SIGNFIICANT ACCOUNTING POLICIES (CONTINUED) (n) Cash and Cash Equivalents Cash and short-term deposits in the balance sheet comprise cash at bank and in hand and short-term deposits with an original maturity of three months or less. For the purpose of the cash flow statement, cash and cash equivalents consist of cash and cash equivalents as defined above, net of outstanding bank overdrafts. (o) Interest-Bearing Liabilities All loans and borrowings are initially recognised at cost, being the fair value of the consideration received net of issue costs associated with the borrowing. After initial recognition, interest-bearing loans and borrowings are subsequently measured at amortised cost using the effective interest method. Amortised cost is calculated by taking into account any issue costs, and any discounts or premium on settlement. Gains and losses are recognised in the income statement when the liabilities are derecognised and as well as through the amortisation process. (p) Employee Benefits Short-term benefits Liabilities for employee benefits for wages, salaries and annual leave represent present obligations resulting from employees’ services provided to reporting date and are calculated at undiscounted amounts based on remuneration wage and salary rates that the Consolidated Entity expects to pay as at reporting date including related on-costs, such as worker’s compensation insurance and payroll tax. No provision is made for non-vesting sick leave as the anticipated pattern of future sick leave taken indicates that accumulated non-vesting leave will never be paid. Other long-term benefits The Consolidated Entity’s net obligation in respect of long-term employee benefits is the amount of future benefit that employees have earned in return for their service in the current and prior periods plus related on-costs. Provision for long service leave together with the associated employment on-costs are measured at their nominal amounts based on remuneration rates expected to be paid when the liability is settled. The non-current portions of long service leave and its associated employment on-costs are measured at the present value of estimated future cash flows. Defined contribution plans A defined contribution plan is a post-employment benefit plan under which an entity pays fixed contributions into a separate entity and will have no legal or constructive obligation to pay further amounts. Obligations for contributions to defined contribution plans are recognised as a personnel expense in profit or loss when they are due. Prepaid contributions are recognised as an asset to the extent that a cash refund or a reduction in future payments is available. Contributions to defined contribution superannuation plans are expensed as incurred. (q) Leases Finance leases, which transfer to the Consolidated Entity substantially all the risks and benefits incidental to ownership of the leased item, are capitalised at the inception of the lease at the fair value of the leased property or, if lower, at the present value of the minimum lease payments. Lease payments are apportioned between the finance charges and reduction of the lease liability so as to achieve a constant rate of interest on the remaining balance of the liability. Finance charges are charged directly against income. Capitalised leased assets are depreciated over the shorter of the estimated useful life of the asset or the lease term. Leases where the lessor retains substantially all the risks and benefits of ownership of the asset are classified as operating leases. Operating lease payments are recognised as an expense in the income statement on a straight-line basis over the lease term. Determining whether an arrangement contains a lease At inception of an arrangement, the Consolidated Entity determines whether such an arrangement is or contains a lease. A specific asset is the subject of a lease if fulfilment of the arrangement is dependent on the use of the specified asset. An arrangement conveys the right to use the asset if the arrangement conveys to the Consolidated Entity the right to control the use of the underlying asset. At inception or upon reassessment of the arrangement, the Consolidated Entity separates payments and other consideration required by such an arrangement into those for the lease and those for other elements on the basis of their relative fair values. If the Consolidated Entity concludes for a finance lease that it is impracticable to separate the payment reliably, an asset and a liability are recognised at an amount equal to the fair value of the underlying asset. Subsequently the liability is reduced as payments are made and an imputed finance charge on the liability is recognised using the Consolidated Entity’s incremental borrowing rate.

TANAMI GOLD NL NOTES TO THE FINANCIAL STATEMENTS FOR THE YEAR ENDED 30 JUNE 2017
28
1. SIGNFIICANT ACCOUNTING POLICIES (CONTINUED) (r) Revenue Goods sold Revenue from the sale of gold is measured at the fair value of the consideration received or receivable, net of returns and allowances. Revenue is recognised when the significant risks and rewards of ownership have been transferred to the buyer, recovery of consideration is probable, the associated costs and possible return of goods can be measured reliably which is generally on receipt of funds from gold sales, and there is no continuing management involvement with the goods. (t) Income Tax Income tax expense comprises current and deferred tax. Income tax expense is recognised in profit or loss except to the extent that it relates to items recognised directly in equity, in which case it is recognised in equity. Current tax is the expected tax payable on the taxable income for the year, using tax rates enacted or substantively enacted at the reporting date, and any adjustment to tax payable in respect of previous years. Deferred tax is recognised using the balance sheet method, providing for temporary differences between the carrying amounts of assets and liabilities for financial reporting purposes and the amounts used for taxation purposes. Deferred tax is not recognised for the following temporary differences: the initial recognition of goodwill, the initial recognition of assets and liabilities in a transaction that is not a business combination and that affects neither accounting nor taxable profit, and differences relating to investments in subsidiaries and jointly controlled entities to the extent that they probably will not reverse in the foreseeable future. Deferred tax is measured at the tax rates that are expected to be applied to the temporary differences when they reverse, based on laws that have been enacted or substantively enacted by the reporting date. In determining the amount of current and deferred tax, the Consolidated Entity takes into account the impact of uncertain tax positions and whether additional taxes and interest may be due. The Consolidated Entity believes its accruals for tax liabilities are adequate for all open tax years based on its assessment of many factors, including interpretations of tax law and prior experience. This assessment relies on estimates and assumptions and may involve a series of judgments about future events. New information may become available that causes the Consolidated Entity to change its judgment regarding the adequacy of existing tax liabilities; such changes to tax liabilities will impact tax expense in the period that such a determination is made. A deferred tax asset is recognised to the extent that it is probable that future taxable profits will be available against which temporary differences can be utilised. Deferred tax assets are reviewed at each reporting date and are reduced to the extent that it is no longer probable that the related tax benefit will be realised. The Company recognises deferred tax assets arising from unused tax losses of the tax-consolidated group to the extent that it is probable that future taxable profits of the tax-consolidated group will be available against which the asset can be utilised. Tax Consolidation The Company and its wholly-owned Australian resident entities have formed a tax-consolidated group with effect from 1 July 2002 and are therefore taxed as a single entity from that date. The head entity within the tax-consolidated group is Tanami Gold NL. (u) Goods and Services Tax Revenue, expenses and assets are recognised net of the amount of goods and services tax (GST), except where the amount of GST incurred is not recoverable from the taxation authority. In these circumstances, the GST is recognised as part of the cost of acquisition of the asset or part of the expense. Receivables and payables are stated with the amount of GST included. The net amount of GST recoverable from, or payable to, the ATO is included as a current asset or liability in the balance sheet. Cash flows are included in the statement of cash flows on a gross basis. The GST components of cash flows arising from investing and financing activities which are recoverable from, or payable to, the ATO are classified as operating cash flows. (v) Issued Capital Issued and paid up capital is recognised at the fair value of the consideration received by the Company. Any transaction costs arising on the issue of ordinary shares are recognised directly in equity as a reduction of the proceeds received. (w) Trade and Other Payables Trade and other payables are stated at their amortised cost. (x) Earnings Per Share The Consolidated Entity presents basic earnings per share data for its ordinary shares. Basic earnings per share is calculated by dividing the profit attributable to ordinary shareholders of the Company by the weighted average number of ordinary shares outstanding during the period. Diluted earnings per share is determined by adjusting the profit attributable to ordinary shareholders and the weighted average number of ordinary shares outstanding, adjusted for shares held by the Company’s sponsored employee share plan trust, for the effects of all dilutive potential ordinary shares, which comprise share options granted to employees.

TANAMI GOLD NL NOTES TO THE FINANCIAL STATEMENTS FOR THE YEAR ENDED 30 JUNE 2017
29
1. SIGNFIICANT ACCOUNTING POLICIES (CONTINUED)
(y) Segment Reporting An operating segment is a component of the Consolidated Entity that engages in business activities from which it may earn revenues and incur expenses. The Consolidated Entity operates in Western Australia and the Northern Territory, in the gold exploration industry. All operating segments’ operating results are regularly reviewed by the Consolidated Entity’s Managing Director/CEO (or equivalent) to make decisions about resources to be allocated to the segment and assess its performance, and for which discrete financial information is available. Segment results that are reported to the Managing Director/CEO (or equivalent) include items directly attributable to a segment as well as those that can be allocated on a reasonable basis. Unallocated items comprise mainly corporate assets, head office expenses, and income tax assets and liabilities. Segment capital expenditure is the total costs incurred during the period to acquire property, plant and equipment. (z) Financial Instruments Derivative financial instruments Derivatives are recognised initially at fair value and attributable transaction costs are recognised in profit or loss when incurred. Subsequent to initial recognition, derivatives are measured at fair value and changes therein are accounted for as described below. Non-trading derivatives When a derivative financial instrument is not held for trading, and is not designated in a qualifying hedge relationship, all changes in its fair value are recognised immediately in profit or loss. (aa) New Accounting Standards and Interpretations In the year ended 30 June 2017, the Directors have reviewed all of the new and revised Standards and Interpretations issued by the Australian Accounting Standards Board that are relevant to the Group and effective for the current annual reporting period. As a result of this review, the Directors have determined that there is no material impact of the new and revised Standards and Interpretations on the Group and, therefore, no material change is necessary to Group accounting policies. (ab) Accounting Standards and Interpretations issued but not yet effective Australian Accounting Standards and Interpretations that have recently been issued or amended but are not yet effective and have not been adopted by the Group for the year ended 30 June 2016. These are outlined in the table below are outlined below. (i) AASB 9 Financial Instruments (effective from 1 January 2018) AASB 9 Financial Instruments addresses the classification, measurement
and de-recognition of financial assets and financial liabilities and introduces new rules for hedge accounting. The changes to the standard do not have a material impact on the Group.
(ii) AASB 15 Revenue from contracts with customers (effective from 1 January 2018) AASB 15 introduces a new framework for accounting for revenue and will replace AASB 118 Revenue, AASB 111 Construction Contracts and IFRIC 13 Customer Loyalty Programs. AASB 15 establishes principals for reporting the nature, amount, timing and uncertainty of revenue and cash flows arising from an entity's contracts with customers. The new standard is based on the principal that revenue is recognised when control of a good or service transfers to a customer, therefore the notion of control replaces the exiting notion of risks and rewards. The Group is assessing the potential impact on its consolidated financial statements resulting from the application of AASB 15. The changes to the standard do not have a material impact on the Group.
(iii) AASB 16 Leases (effective from 1 January 2019) One of the key changes to AASB 16 Leases is that lessees are required to recognise assets and liabilities for all leases with a term of more than 12 months, unless the underlying asset is of low value. AASB 16 will result in lessees recognising most leases on the balance sheet. The Group has not yet determined the impact of this standard.
There are no other standards that are not yet effective and that would be expected to have a material impact on the entity in the current or future reporting periods and on foreseeable future transactions.

TANAMI GOLD NL NOTES TO THE FINANCIAL STATEMENTS FOR THE YEAR ENDED 30 JUNE 2017
30
2. REVENUE & EXPENSES
2017 2016$'000 $'000
Revenue from gold sales (a) 167 39 (a) For the year ended 30 June 2017, the Company was a gold exploration company. Gold sales during the year were from the successful
recovery of approximately 97.792 ounces of gold through continued clean-up of the Coyote processing plant.
Other incomeDividends received 75 191Other receipts 2 -Lease payments from ABM (b) 83 1,967
160 2,158
(b) During the year, the Company recognised $83,333 of deferred revenue relating to the Coyote Plant Agreement with ABM Resources Limited.
Profit on sale of assetsProfit on sale of available for sale financial assets (c) 850 3,218Profit on sale of 25% interest in CTP (d) - 14,822Loss on sale of plant and equipment (9) -
841 18,040 (c) During the year, the Company sold 250,000 (2016: 3,290,228) NST shares at a weighted average price of $5.53 (2016: $3.08) per share. The
shares were initially recognised at $2.10 per share.
(d) On 3 August 2015, the Company announced that the conditions precedent to the NST Heads of Agreement (“NST HoA”) for the Central Tanami Project (“CTP”) had been satisfied and Completion had occurred resulting in the formation of an unincorporated joint venture between the Company (75%) and NST (25%). In accordance with the NST HoA, the Company received consideration of $11.0 million in cash and 4,290,228 NST shares (valued at $2.10 per share based on the VWAP prior to the date of the announcement of the NST HoA on 26 February 2015). A reconciliation of the transaction is as follows:
2016$'000
Cash consideration 11,0004,290,228 NST shares at $2.10 per share 9,000Total consideration 20,000
Assets and liability disposal (25%) of CTP: 100% 25%Exploration and evaluation asset 20,719 (5,180)Property, plant and equipment 1,760 (440)Rehabilitation liability (1,769) 442Carrying value of CTP assets and liabilities 20,710 (5,178)
Profit on sale of 25% interest in CTP 14,822
2017 2016$'000 $'000
2017 2016$'000 $'000

TANAMI GOLD NL NOTES TO THE FINANCIAL STATEMENTS FOR THE YEAR ENDED 30 JUNE 2017
31
2. REVENUE & EXPENSES (CONTINUED)
Care and maintenance costs (incl depreciation and amortisation)Site administration 1,090 630Depreciation - plant and equipment 1,152 1,698Rehabilitation expense 1,114 286Impairment - 328
3,356 2,942 Management of the Group has identified one Cash Generating Unit (‘CGU’), the Coyote Gold Project. The Company carried out impairment testing by comparing the CGU recoverable amount (fair value less costs to sell) represented by current market prices (such as the NST transaction) against the carrying value of the CGU net assets. As a result, the Company determined no impairment should be reflected in the Consolidated Statement of Profit or Loss and Other Comprehensive Income for the full year ending 30 June 2017 (2016: nil).
Exploration and evaluation expenses 1,036 704
Corporate and other expensesConsulting fees 262 875Salaries and wages 218 28Directors' fees 284 289Other provisions (e) - 3,000Other 486 532
1,250 4,724 (e) On 23 September 2016, the Company announced that it had reached agreement with Metals X Limited (“MLX”) that ended the legal
proceedings between the parties. As part of this settlement, the Company agreed to pay $3 million to MLX.
Financial expensesInterest borrowings - 79Borrowing costs 3 40Unwind of discount on site rehabilitation provision 135 193
138 312
2017 2016$'000 $'000
2017 2016$'000 $'000
2017 2016$'000 $'000

TANAMI GOLD NL NOTES TO THE FINANCIAL STATEMENTS FOR THE YEAR ENDED 30 JUNE 2017
32
3. TAXATION
2017 2016$'000 $'000
Major components of income tax expense are as follows:
Income statementCurrent income tax expense/(benefit)Current income tax charge - -Income tax expense not recognised due to availability of group revenue tax losses - -
Prior year adjustment - -
Deferred income tax expenseRelating to origination and reversal of temporary differences (519) 3,425Deferred tax assets not recognised in the current period 775 (4,278)Income tax expense not reported in income statement 256 (853)
The components of recognised deferred tax balance are as follows:CONSOLIDATEDDeferred tax liabilities/assetsMine development - -Exploration - -Property, plant and equipment - -Consumables 39 39Accrued income - -Investments 596 853Unrealised foreign exchange gains - -Other - -Deferred tax asset offset against deferred tax liability (635) (892)Gross deferred income tax liabilities - -
Reconciliation to income tax expense/(benefit) on account profit/(loss)Profit/(loss) before income tax (4,699) 11,716Prima facie tax payable/(receivable) at the statutory income tax rate (1,410) 3,477
Non-deductible expenses 383 -Non-taxable franked dividend 10 (52)Prior period adjustment -Share based payments -Deferred tax assets not recognised 498 -Deferred tax assets not previously recognised 775 (4,278)Tax losses recouped not previously booked - -Income tax (benefit)/expense 256 (853)
Deferred tax asset (30%) not recognised arising on:Tax losses 66,825 64,969Temporary differences 25,569 25,948
92,394 90,917
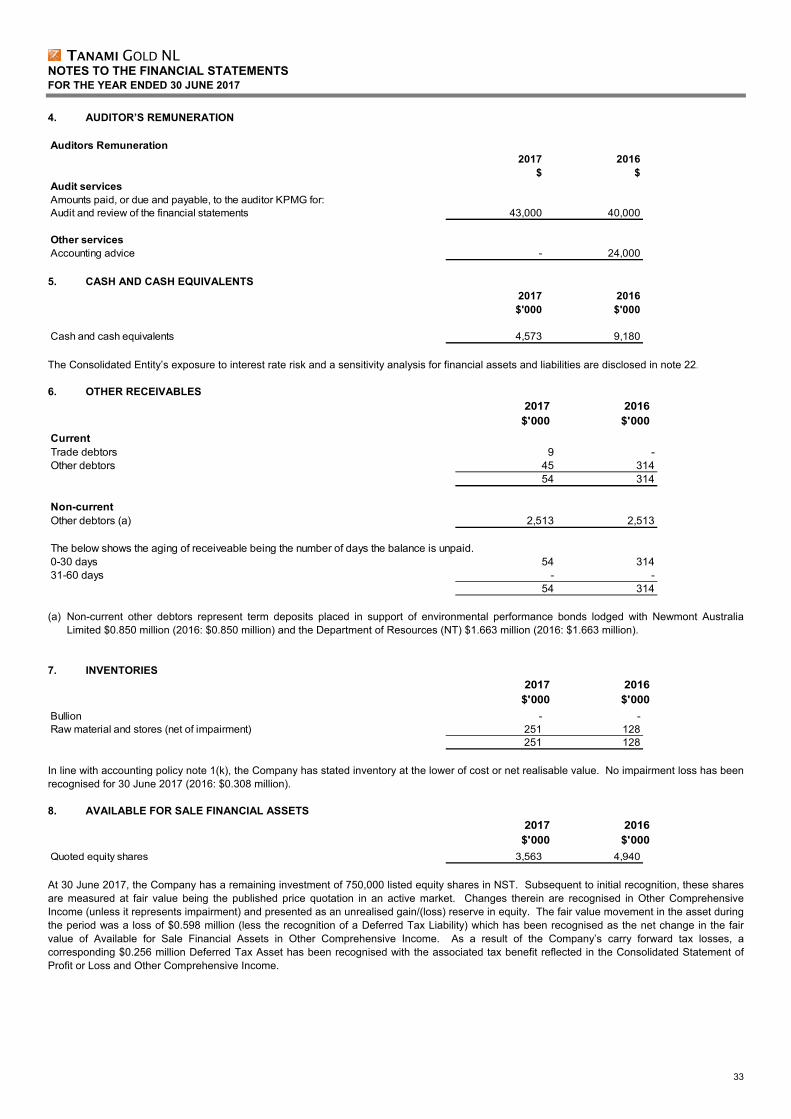
TANAMI GOLD NL NOTES TO THE FINANCIAL STATEMENTS FOR THE YEAR ENDED 30 JUNE 2017
33
4. AUDITOR’S REMUNERATION
Auditors Remuneration
2017 2016$ $
Audit servicesAmounts paid, or due and payable, to the auditor KPMG for:Audit and review of the financial statements 43,000 40,000
Other servicesAccounting advice - 24,000
5. CASH AND CASH EQUIVALENTS
2017 2016$'000 $'000
Cash and cash equivalents 4,573 9,180 The Consolidated Entity’s exposure to interest rate risk and a sensitivity analysis for financial assets and liabilities are disclosed in note 22.
6. OTHER RECEIVABLES
CurrentTrade debtors 9 -Other debtors 45 314
54 314
Non-currentOther debtors (a) 2,513 2,513
The below shows the aging of receiveable being the number of days the balance is unpaid.0-30 days 54 31431-60 days - -
54 314
(a) Non-current other debtors represent term deposits placed in support of environmental performance bonds lodged with Newmont Australia Limited $0.850 million (2016: $0.850 million) and the Department of Resources (NT) $1.663 million (2016: $1.663 million).
7. INVENTORIES
Bullion - -Raw material and stores (net of impairment) 251 128
251 128 In line with accounting policy note 1(k), the Company has stated inventory at the lower of cost or net realisable value. No impairment loss has been recognised for 30 June 2017 (2016: $0.308 million). 8. AVAILABLE FOR SALE FINANCIAL ASSETS
Quoted equity shares 3,563 4,940 At 30 June 2017, the Company has a remaining investment of 750,000 listed equity shares in NST. Subsequent to initial recognition, these shares are measured at fair value being the published price quotation in an active market. Changes therein are recognised in Other Comprehensive Income (unless it represents impairment) and presented as an unrealised gain/(loss) reserve in equity. The fair value movement in the asset during the period was a loss of $0.598 million (less the recognition of a Deferred Tax Liability) which has been recognised as the net change in the fair value of Available for Sale Financial Assets in Other Comprehensive Income. As a result of the Company’s carry forward tax losses, a corresponding $0.256 million Deferred Tax Asset has been recognised with the associated tax benefit reflected in the Consolidated Statement of Profit or Loss and Other Comprehensive Income.
2017 2016$'000 $'000
2017 2016$'000 $'000
2017 2016$'000 $'000

TANAMI GOLD NL NOTES TO THE FINANCIAL STATEMENTS FOR THE YEAR ENDED 30 JUNE 2017
34
9. PROPERTY, PLANT AND EQUIPMENT
BuildingsPlant & Equipment
Motor Vehicles
Furniture & Fittings
Work in Progress Total
$'000 $'000 $'000 $'000 $'000 $'000
At 1 July 2016 net of accumulated depreciation 812 1,737 30 10 57 2,646Depreciation charge (22) (1,111) (17) (2) - (1,152)At 30 June 2017 net of accumulated depreciation 790 626 13 8 57 1,494
At 30 June 2017Cost 892 15,425 1,087 946 57 18,407Accumulated depreciation (102) (14,799) (1,074) (938) - (16,913)Net carrying amount 790 626 13 8 57 1,494
At 1 July 2015 net of accumulated depreciation 880 3,740 87 20 57 4,784Disposal (46) (379) (12) (3) - (440)Depreciation charge (22) (1,624) (45) (7) - (1,698)At 30 June 2016 net of accumulated depreciation 812 1,737 30 10 57 2,646
At 30 June 2016Cost 7,321 44,673 1,301 1,070 57 54,422Accumulated depreciation (80) (13,688) (1,057) (936) - (15,761)Accumulated impairment (6,429) (29,248) (214) (124) - (36,015)Net carrying amount 812 1,737 30 10 57 2,646
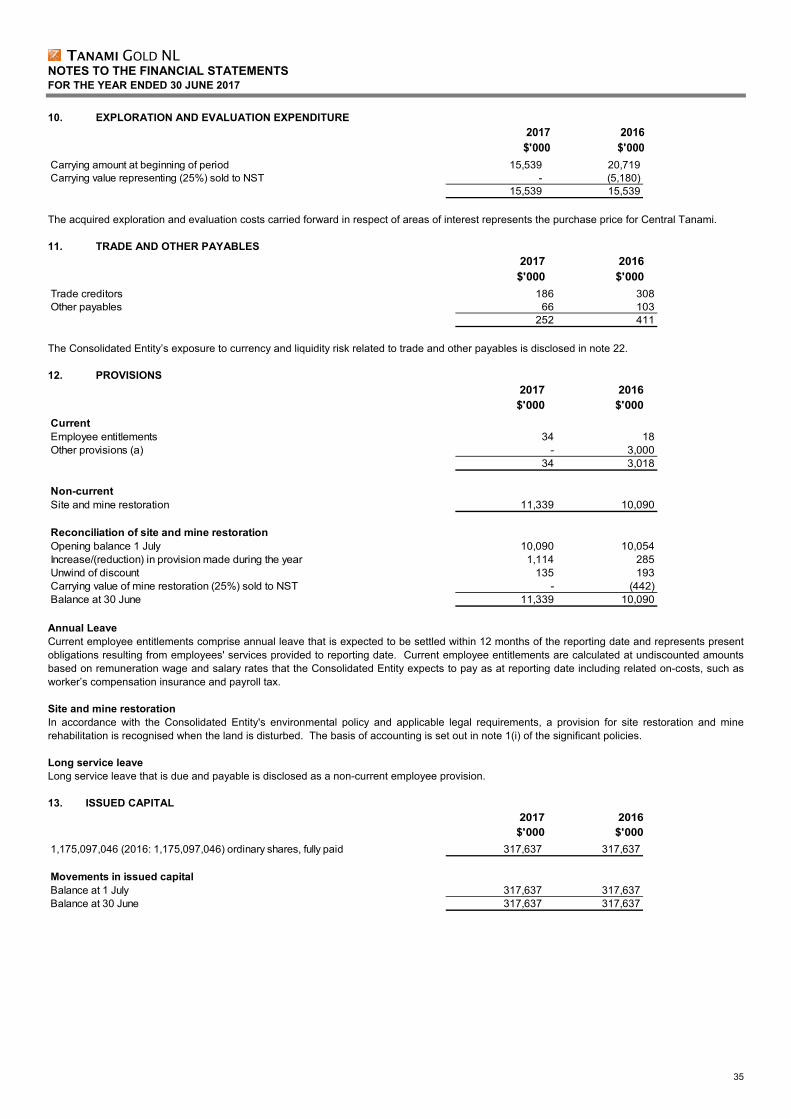
TANAMI GOLD NL NOTES TO THE FINANCIAL STATEMENTS FOR THE YEAR ENDED 30 JUNE 2017
35
10. EXPLORATION AND EVALUATION EXPENDITURE
Carrying amount at beginning of period 15,539 20,719Carrying value representing (25%) sold to NST - (5,180)
15,539 15,539 The acquired exploration and evaluation costs carried forward in respect of areas of interest represents the purchase price for Central Tanami. 11. TRADE AND OTHER PAYABLES
Trade creditors 186 308Other payables 66 103
252 411 The Consolidated Entity’s exposure to currency and liquidity risk related to trade and other payables is disclosed in note 22. 12. PROVISIONS
CurrentEmployee entitlements 34 18Other provisions (a) - 3,000
34 3,018
Non-currentSite and mine restoration 11,339 10,090
Reconciliation of site and mine restorationOpening balance 1 July 10,090 10,054Increase/(reduction) in provision made during the year 1,114 285Unwind of discount 135 193Carrying value of mine restoration (25%) sold to NST - (442)Balance at 30 June 11,339 10,090 Annual Leave Current employee entitlements comprise annual leave that is expected to be settled within 12 months of the reporting date and represents present obligations resulting from employees' services provided to reporting date. Current employee entitlements are calculated at undiscounted amounts based on remuneration wage and salary rates that the Consolidated Entity expects to pay as at reporting date including related on-costs, such as worker’s compensation insurance and payroll tax. Site and mine restoration In accordance with the Consolidated Entity's environmental policy and applicable legal requirements, a provision for site restoration and mine rehabilitation is recognised when the land is disturbed. The basis of accounting is set out in note 1(i) of the significant policies. Long service leave Long service leave that is due and payable is disclosed as a non-current employee provision. 13. ISSUED CAPITAL
1,175,097,046 (2016: 1,175,097,046) ordinary shares, fully paid 317,637 317,637
Movements in issued capitalBalance at 1 July 317,637 317,637Balance at 30 June 317,637 317,637
2017 2016$'000 $'000
2017 2016$'000 $'000
2017 2016$'000 $'000
2017 2016$'000 $'000

TANAMI GOLD NL NOTES TO THE FINANCIAL STATEMENTS FOR THE YEAR ENDED 30 JUNE 2017
36
14. COMMITMENTS a) Exploration Expenditure In order to maintain current rights of tenure to exploration tenements, the Consolidated Entity is required to meet the minimum expenditure requirements specified by various State and Territory Governments. These obligations are subject to renegotiation when application for a mining lease is made and at other times. These obligations are not provided for in this financial report. The level of exploration expenditure committed in the year ending 30 June 2018 for the Consolidated Entity is approximately $0.923m. This includes the minimum amounts required to retain tenure. These obligations are expected to be fulfilled in the normal course of operations. Commitments beyond 2018 are dependent upon whether existing rights of tenure are renewed or new rights of tenure are acquired.
b) Operating lease The Consolidated Entity sub-leases the corporate office under an operating lease. The Company has a new operating sub-lease arrangement which runs for 3 years commencing 12 December 2015. Lease payments are adjusted annually to reflect market rentals. There are no restrictions placed upon the lessee by entering into the sub-lease. Future minimum rentals payable under the non-cancellable operating leases as at 30 June are as follows:
Operating leasesWithin one year 20 20Between two and five years 9 79
29 99
15. SHARE BASED PAYMENTS Options
During the year, no options were issued, exercised or forfeited. 300,000 options lapsed unexercised on 21 December 2016. At 30 June 2017, there were nil (2016: 300,000) unissued ordinary shares, in respect of unquoted options, remaining. Summary of option movements for the financial year: Number of options at 30 June 2016
Grant Date Exercise Date
on or after Expiry Date
Exercise Price
Number of options at beginning
of year
Options Granted
Options Expired/ Forfeited
Options Exercised
On Issue Vested
22 Dec 2011 22 Dec 2011 21 Dec 2016 $1.34 300,000 - 300,000 - - - On 22 December 2011, 300,000 options were granted to Mr Alan Senior, a former Director of the Company. These options expired unexercised on 22 December 2016. 16. KEY MANAGEMENT PERSONNEL DISCLOSURES a) Details of Key Management Personnel
(i) Specified Directors Gerard McMahon (Non-Executive Chairman) (appointed April 2013) Arthur Dew (Non-Executive Director) (appointed December 2011) Carlisle Procter (Non-Executive Director) (appointed December 2011) Brett Montgomery (Non-Executive Director) (appointed February 2013) (ii) Specified Executives Daniel Broughton (Chief Financial Officer) (appointed 8 September 2014) The key management personnel compensation included in ‘Corporate and Other Expenses” is as follows:
2017 2016$ $
Short-term employee benefits 369,000 373,275Post-employment benefits 14,250 14,656
383,250 387,931
2017 2016$'000 $'000

TANAMI GOLD NL NOTES TO THE FINANCIAL STATEMENTS FOR THE YEAR ENDED 30 JUNE 2017
37
16. KEY MANAGEMENT PERSONNEL DISCLOSURES (CONTINUED) (i) Individual directors and executive’s compensation disclosures Information regarding individual director’s and executive’s compensation and some equity instruments disclosures as required by Corporations Regulations 2M.3.03 and 2M.6.04 is provided in the Remuneration Report section of the Directors’ Report. b) Other transactions with the Company or its controlled entities Specified directors hold positions in other entities that resulted in them having control or significant influence over the financial or operating policies of those entities. These entities transacted with the Company or its subsidiaries during the financial year. The terms and conditions of those transactions were no more favourable than those available, or which might reasonably be expected to be available, on similar transactions to unrelated entities on an arm’s length basis. 17. NON-KEY MANAGEMENT PERSONNEL RELATED PARTIES DISCLOSURES Wholly-Owned Group Tanami Exploration NL and Tanami (NT) Pty Ltd are both wholly owned subsidiaries of Tanami Gold NL. 18. SEGMENT INFORMATION The Consolidated Entity operates predominantly in the gold exploration and gold mining industry. Information about reportable segments Gold Production Exploration Total 2017 2016 2017 2016 2017 2016 $'000 $'000 $'000 $'000 $'000 $'000 Revenues 167 39 - - 167 39 Depreciation and amortisation) - - (1,152) (2,138) (1,152) (2,138) Impairment - - - (328) - (328)
Reportable segment loss before income tax (excluding profit on sale of CTP 25% and other income) 167 39 (4,392) (3,776) (4,225) (3,737) Reportable segment profit on sale of CTP 25% - - - 14,822 - 14,822 Reportable segment other income - - 160 2,158 160 2,158 Reportable segment assets - - 19,851 21,013 19,851 21,013 Reportable segment liabilities - - 11,591 10,564 11,591 10,564

TANAMI GOLD NL NOTES TO THE FINANCIAL STATEMENTS FOR THE YEAR ENDED 30 JUNE 2017
38
18. SEGMENT INFORMATION (CONTINUED) Reconciliation of reportable segment revenues, profit or loss, assets and liabilities and other material items:
2017 2016$'000 $'000
Revenue and other incomeTotal revenue and other income for reportable segments 167 39Consolidated revenue and other income 167 39
Profit or lossTotal loss for reportable segments (4,225) (3,737)Profit on sale of CTP 25% - 14,822Profit on sale of other assets/NST shares 850 3,218Other income 160 2,158Unallocated amounts: other corporate expenses (1,228) (4,745)Consolidated profit/(loss) before income tax (4,443) 11,716
AssetsTotal assets for reportable segments 19,851 21,013Other unallocated amounts 8,136 14,247Consolidated total assets 27,987 35,260
LiabilitiesTotal liabilities for reportable segments 11,591 10,564Other unallocated amounts 34 3,038Consolidated total liabilities 11,625 13,602 19. EARNINGS PER SHARE
Number of shares 2017 2016 Weighted average number of ordinary shares used as the denominator in the calculation of basic earnings per share
1,175,097,046 1,175,097,046
Basic earnings/(loss) per share The calculation of basic earnings per share at 30 June 2017 was based on the loss attributable to ordinary shareholders of $4,699,000 (2016: profit $12,568,827) and a weighted average number of ordinary shares outstanding of 1,175,097,046 (2016: 1,175,097,046). Diluted earnings/(loss) per share Diluted earnings per share for 2017 equals’ basic earnings per share as the options on issue are considered anti-dilutive. 20. EVENTS SUBSEQUENT TO BALANCE DATE There were not reportable events subsequent to reporting date.

TANAMI GOLD NL NOTES TO THE FINANCIAL STATEMENTS FOR THE YEAR ENDED 30 JUNE 2017
39
21. NOTES TO STATEMENT OF CASHFLOWS a) Reconciliation of cash and cash equivalents
For the purpose of the Consolidated Statement of Cash Flows, cash includes cash on hand and at bank and short term deposits at call, net of outstanding bank overdrafts. Cash as at the end of the financial year as shown in the Consolidated Statement of Cash Flows is reconciled to the related items in the Consolidated Statement of Financial Position as follows:
Net (loss)/profit (4,699) 12,570
Add/(less) non-cash itemsProvision for rehabilitation 1,114 286Income tax benefit 256 (853)Inventory impairment - 328Depreciation 1,152 1,699Unwinding of interest rate on provision for rehabilitation 135 193Deferred revenue (83) 83
Add/(less) items classified as investing/financing activitiesGain on disposal of 25% CTP - (14,822)Gain on sale of Available for Sale Financial Assets (850) (3,218)SHK loan accrued interest and facility fee payment - (231)Dividends received (75) -
Net cash used by operating activities before changes in assets and liabilities (3,050) (3,965)
Changes in assets and liabilities during the financial year:
Decrease/(increase) in receivables 359 5Decrease/(increase) in inventories (123) 396Decrease/(increase) in prepayments (18) 61Increase/(decrease) in provisions (2,984) 2,950(Decrease)/increase in trade and other payables (241) (582)Net cash flows from operating activities (6,057) (1,135) 22. FINANCIAL RISK MANAGEMENT Overview This note presents information about the Consolidated Entity’s exposure to credit, liquidity and market risks, their objectives, policies and processes for measuring and managing risk, and the management of capital. (a) Credit Risk Credit risk is the risk of financial loss to the Consolidated Entity if a customer or counterparty to a financial instrument fails to meet its contractual obligations. The Consolidated Entity is exposed to credit risk from its operating activities (primarily for trade receivables) and from its financing activities, including deposits with banks and financial institutions, foreign exchange transactions and other financial instruments. Presently, the Consolidated Entity undertakes exploration and evaluation activities exclusively in Australia. At the balance sheet date, there were no significant concentrations of credit risk. Cash and cash equivalents The Consolidated Entity limits its exposure to credit risk by only investing in liquid securities and only with counterparties that have an acceptable credit rating. Other receivables Other receivables includes term deposits place in support of environmental performance bonds lodged with Newmont Australia Limited and the Department of Resources (NT). Management does not consider either of these amounts to be subject to credit risk. Exposure to credit risk The carrying amount of the Consolidated Entity’s financial assets represents the maximum credit exposure. The Consolidated Entity’s maximum exposure to credit risk at the reporting date is:
2017 2016$'000 $'000
Cash and cash equivalents 4,573 9,180Other receivables 2,567 2,827
2017 2016$'000 $'000

TANAMI GOLD NL NOTES TO THE FINANCIAL STATEMENTS FOR THE YEAR ENDED 30 JUNE 2017
40
22. FINANCIAL RISK MANAGEMENT (CONTINUED) The Consolidated Entity is exposed to minimal credit risk in relation to the cash and cash equivalents or other receivables in the preceding table because: The Consolidated Entity invests in or deposits cash with counterparties that have an acceptable credit risk rating, and as a result,
Management consider that there is minimal credit risk attached to the Consolidated Entity's cash and cash equivalents balances;
The Consolidated Entity's other receivables predominantly relate to amounts payable from government institutions which management consider is risk free. Of the $2.567 million (2016: $2.828 million) in other receivables, $2.513 million (2016: $2.513 million) relates to environmental performance bonds lodged with the Northern Territory Department Resources – Mineral and Energy and Newmont Australia Limited $0.023 million (2016: $0.021 million) relates to GST receivables and diesel fuel rebates.
(b) Liquidity risk Liquidity risk is the risk that the Consolidated Entity will not be able to meet its financial obligations as and when they fall due. The Consolidated Entity’s approach to managing liquidity is to ensure, as far as possible, that it will have sufficient liquidity to meet its liabilities when due, under both normal and stressed conditions. The Consolidated Entity manages liquidity risk by maintaining adequate reserves and by continuously monitoring forecast and actual cash flows. The following are the contractual maturities of financial liabilities, including estimated interest payments and excluding the impact of netting agreements:
30-Jun-17 Carrying Amount
Contractual Cash Flows
6 Months or Less
6-12 Months 1-2 Years 2-5 Years More Than
5 Years
$’000 $’000 $’000 $’000 $’000 $’000 $’000 Cash and cash equivalents 4,573 4,573 4,573 - - - - Available for sale financial assets 3,563 3,563 3,563 - - - Trade and other payables (252) (252) (252) - - - - Net inflow/(outflow) 7,883 7,883 4,321 3,563 - - -
30-Jun-16 Carrying Amount
Contractual Cash Flows
6 Months or Less
6-12 Months 1-2 Years 2-5 Years More Than
5 Years
$’000 $’000 $’000 $’000 $’000 $’000 $’000 Cash and cash equivalents 9,180 9,180 9,180 - - - - Available for sale financial assets 4,940 4,940 - 4,940 - - - Trade and other payables (411) (411) (411) - - - - Net inflow/(outflow) 13,709 13,709 8,769 4,940 - - - (c) Market Risk Market risk is the risk that changes in market prices, such as interest rates, commodity prices and equity prices will affect the Consolidated Entity’s income or the value of its holdings of financial instruments. Financial instruments affected by market risk include loans and borrowings, deposits, available for sale financial assets and derivative financial instruments. (d) Currency Risk The Consolidated Entity has no foreign denominated debt or cash. (e) Interest Rate Risk The Consolidated Entity is exposed to interest rate risk (primarily on its cash and cash equivalents), which is the risk that a financial instrument’s value will fluctuate as a result of changes in the market interest rate on interest-bearing financial instruments. The Consolidated Entity does not use derivatives to mitigate these exposures.
Consolidated Carrying Amount2017 2016$'000 $'000
Variable rate instrumentsCash and cash equivalents 4,573 9,180Other receivables* 2,513 2,513
7,086 11,693

TANAMI GOLD NL NOTES TO THE FINANCIAL STATEMENTS FOR THE YEAR ENDED 30 JUNE 2017
41
22. FINANCIAL RISK MANAGEMENT (CONTINUED) * Other receivables which are variable rate instruments includes Newmont Australia Limited $0.850 million (2016: $0.850 million), and the NT Department of Resources $1.663 million (2016: $1.663 million). The term deposits mature on a monthly basis and their value is dependent on a variable interest rate. Fair value sensitivity analysis for fixed instruments The Consolidated Entity does not account for any fixed rate financial assets and liabilities at fair value through profit or loss. Therefore, a change in interest rates at the reporting date would not affect profit or loss. Cash flow sensitivity analysis for variable rate instruments A change of 100 basis points in interest rates at the reporting date would have increased (decreased) equity and profit or loss by the amounts shown below. This analysis assumes that all other variables remain constant. The analysis is performed on the same basis for 2016.
100bp increase 100bp decrease 100bp increase 100bp decrease
$’000 $’000 $’000 $’000Interest income on cash balance 45 (45) (45) 45Interest income on other receivables (termdeposits) 25 (25) (25) 25Cash flow sensitivity (net) 70 (70) (70) 70
100bp increase 100bp decrease 100bp increase 100bp decrease
$’000 $’000 $’000 $’000Interest income on cash balance 92 (92) 92 (92)Interest income on other receivables (termdeposits) 25 (25) 25 (25)Cash flow sensitivity (net) 117 (117) 117 (117)
Profit or Loss Equity
Profit or loss Equity
30-Jun-17
30-Jun-16
(f) Fair Value Fair value versus carrying amounts The fair values of financial assets and liabilities, together with the carrying amounts shown in the balance sheet, are as follows:
ConsolidatedCarrying amount Fair value Carrying amount Fair value
$’000 $’000 $’000 $’000Cash and cash equivalents 4,573 4,573 9,180 9,180Available for sale financial assets 3,563 3,563 4,940 4,940Other receivables 2,567 2,567 2,828 2,828Trade and other payables 253 253 411 411
30-Jun-17 30-Jun-16
(g) Fair Value Hierarchy The table below analyses financial instruments carried at fair value, by valuation method. The different levels have been defined as follows: Level 1: Quoted market prices (unadjusted) in active markets for identical assets or liabilities; Level 2: Inputs other than quoted market prices included within Level 1 that are observable for the asset or liability, either directly (i.e. as
prices) or indirectly (i.e. derived from prices); and Level 3: Inputs for the assets or liabilities that are not based on observable market data (unobservable inputs). For 30 June 2017 and 30 June 2016 available for sale financial assets were valued using level 1 methods. (h) Commodity Price Risk The Consolidated Entity is a gold exploration company which has an indirect exposure to the gold price.

TANAMI GOLD NL NOTES TO THE FINANCIAL STATEMENTS FOR THE YEAR ENDED 30 JUNE 2017
42
22. FINANCIAL RISK MANAGEMENT (CONTINUED) (i) Equity Risk The Consolidated Entity is exposed to equity price risk, which arises from the remaining 750,000 (2016: 1,000,000) NST shares. These shares are listed on the ASX and classified as Available for Sale Financial Assets with which are initially recognised at fair value plus any directly attributable transaction costs. Subsequent to initial recognition, they are measured at fair value and changes therein, other than impairment losses are recognised in other comprehensive income and presented in the Available for Sale Fair Value Reserve in equity. When an investment is derecognised, the cumulative gain or loss in equity is reclassified to the Consolidated Statement of Profit or Loss. A 10% movement in the 30 June 2017 share price would result in an +/- $356,000 (2016: +/- $494,000) movement in the value of the Available for Sale Financial Assets. (j) Capital Management
The Consolidated entity’s objectives when managing capital are to safeguard the Consolidated Entity’s ability to continue as a going concern, so as to maintain a strong capital base sufficient for future exploration and development of its projects. In order to maintain or adjust the capital structure, the Consolidated Entity may return capital to shareholders, issue new shares or sell assets to reduce debt. The Consolidated Entity’s focus has been to raise sufficient funds through debt and or equity to fund development, exploration and evaluation activities. There were no changes in the Consolidated Entity’s approach to capital management during the year. Risk management policies and procedures are established with regular monitoring and reporting. The Consolidated Entity’s debt-to-adjusted capital ratio at the end of the reporting period was as follows:
2017 2016Debt-to-adjusted capital ratio at 30 June 0.00 0.06 23. PARENT ENTITY DISCLOSURES As at, and throughout, the financial year ended 30 June 2017 the parent company of the Consolidated Entity was Tanami Gold NL.
Parent EntityResult of the parent entityProfit/(loss) for the year (140) (99)Total comprehensive loss for the year (99)
Financial position of the parent entity at year endCurrent assets 4,531 9,117Total assets 7,140 7,001
Current liabilities - -Total liabilities - -
Total equity of the parent entity comprising of:Issued capital 317,637 317,637Accumulated losses (310,497) (310,766)Share-based payments reserve - 130
7,140 7,001
2017 2016$'000 $'000
TANAMI GOLD NL DIRECTORS’ DECLARATION FOR THE YEAR ENDED 30 JUNE 2017
43
In accordance with a resolution of the Directors of Tanami Gold NL (the Company), I state that:
1. In the opinion of the directors:
a) the consolidated financial statements and notes and the Remuneration report set out in note 13 in the Directors’ report are in
accordance with the Corporations Act 2001, including:
i. giving a true and fair view of the Consolidated Entity’s financial position as at 30 June 2017 and of its performance for the financial year ended on that date; and
ii. complying with Australian Accounting Standards (including the Australian Accounting Interpretations) and the Corporations Regulations 2001; and
b) the financial statements and notes also comply with International Financial Reporting Standards as disclosed in Note 1(b)
c) there are reasonable grounds to believe that the Company will be able to pay its debts as and when they become due and payable
2. This declaration has been made after receiving the declarations required to be made to the Directors in accordance with section 295A of the
Corporations Act 2001 for the financial year ended 30 June 2017.
On behalf of the board
Gerard McMahon Non-Executive Chairman Perth, Western Australia 15 September 2017

TANAMI GOLD NL INDEPENDENT AUDITOR’S REPORT
44

TANAMI GOLD NL INDEPENDENT AUDITOR’S REPORT
45

TANAMI GOLD NL INDEPENDENT AUDITOR’S REPORT
46

TANAMI GOLD NL CORPORATE GOVERNANCE STATEMENT
47
The Board of Tanami Gold NL has adopted the spirit and intent of the 3rd Edition of the Corporate Governance Principles and Recommendations of the ASX Corporate Governance Council. The Company’s 2017 Corporate Governance Statement is available in the Corporate Governance section of the Company’s website: http://www.tanami.com.au/company/corporate-governance.html. This document is reviewed regularly to address any changes in governance practices and the law.

TANAMI GOLD NL ADDITIONAL INFORMATION
48
Additional information required by the Australian Securities Exchange Limited and not shown elsewhere in this report is as follows. The information is current as at 12 October 2017. Issued Equity Capital
Ordinary Shares Options Number of holders 4,934 Nil Number on issue 1,175,097,046 Nil Voting Rights
Voting rights, on a show of hands, are one vote for every registered holder of Ordinary Shares and on a poll, are one vote for each share held by registered holders of Ordinary Shares. Options do not carry any voting rights.
Distribution of Holdings of Equity Securities
Holding ranges Number of Equity Security Holders Total Holders Units
1 – 1,000 1,647 588,589 1,001 – 5,000 1,125 2,747,324 5,001 – 10,000 386 2,979,521 10,001 – 100,000 1,207 47,108,464 100,001 and over 569 1,121,673,148 TOTAL 4,934 1,175,097,046 Unmarketable Parcels
The number of shareholders holding less than a marketable parcel (which as at 12 October 2017 was 6,554,679 Shares) was: 3,181.
Substantial Shareholders
Number of Ordinary Shares
Percentage (%)
ALLIED PROPS RES LTD* 377,612,786 32.13% SUN HUNG KAI INV SVCS LTD 164,413,248 13.99% *Allied Properties Resources Ltd holds 412,612,786 Tanami shares (35.11%), including 377,612,786 shares held directly in its own name and 35,000,000 shares held through Sun Hung Kai Investment Services Ltd. On Market Buy Back
There is no current on-market buy-back.
Top 20 Shareholders
Rank Name Number of Ordinary Shares
Percentage (%)
1 ALLIED PROPS RES LTD 377,612,786 32.13% 2 SUN HUNG KAI INV SVCS LTD 113,238,736 9.64% 3 SUN HUNG KAI INV SVCS LTD 51,174,512 4.35% 4 ABN AMRO CLRG SYD NOM PL 33,614,773 2.86% 5 PERTH SELECT SEAFOODS PL 32,500,000 2.77% 6 JEMAYA PL 31,500,000 2.68% 7 JEMAYA PL 22,832,270 1.94% 8 GERISE PL 20,000,000 1.70% 9 HSBC CUSTODY NOM AUST LTD 19,706,108 1.68% 10 LCY SUPER PL 19,000,000 1.62% 11 CITICORP NOM PL 11,248,002 0.96% 12 CEN PL 10,250,000 0.87% 13 YANDAL INV PL 8,250,001 0.70% 14 MAMMALIA LTD 7,151,251 0.61% 15 CR INV PL 6,995,147 0.60% 16 WHITEHEAD N R + SMITH J H 6,000,000 0.51% 17 TOUSSAINT PAUL 5,519,764 0.47% 18 SILTON PL 5,300,000 0.45% 19 LAWCAR PL 5,260,000 0.45% 20 BNP PARIBAS NOMS PL 4,895,704 0.42% TOTAL 792,049,054 67.41%
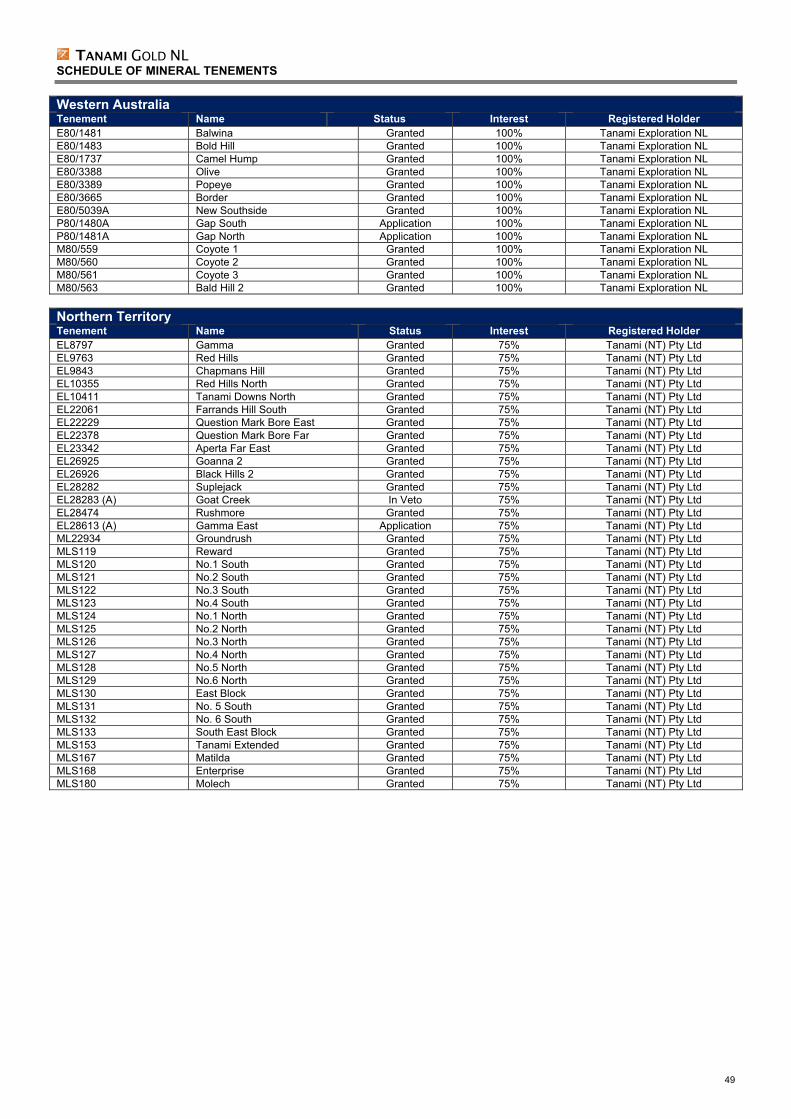
TANAMI GOLD NL SCHEDULE OF MINERAL TENEMENTS
49
Western Australia Tenement Name Status Interest Registered Holder E80/1481 Balwina Granted 100% Tanami Exploration NL E80/1483 Bold Hill Granted 100% Tanami Exploration NL E80/1737 Camel Hump Granted 100% Tanami Exploration NL E80/3388 Olive Granted 100% Tanami Exploration NL E80/3389 Popeye Granted 100% Tanami Exploration NL E80/3665 Border Granted 100% Tanami Exploration NL E80/5039A New Southside Granted 100% Tanami Exploration NL P80/1480A Gap South Application 100% Tanami Exploration NL P80/1481A Gap North Application 100% Tanami Exploration NL M80/559 Coyote 1 Granted 100% Tanami Exploration NL M80/560 Coyote 2 Granted 100% Tanami Exploration NL M80/561 Coyote 3 Granted 100% Tanami Exploration NL M80/563 Bald Hill 2 Granted 100% Tanami Exploration NL
Northern Territory Tenement Name Status Interest Registered Holder EL8797 Gamma Granted 75% Tanami (NT) Pty Ltd EL9763 Red Hills Granted 75% Tanami (NT) Pty Ltd EL9843 Chapmans Hill Granted 75% Tanami (NT) Pty Ltd EL10355 Red Hills North Granted 75% Tanami (NT) Pty Ltd EL10411 Tanami Downs North Granted 75% Tanami (NT) Pty Ltd EL22061 Farrands Hill South Granted 75% Tanami (NT) Pty Ltd EL22229 Question Mark Bore East Granted 75% Tanami (NT) Pty Ltd EL22378 Question Mark Bore Far Granted 75% Tanami (NT) Pty Ltd EL23342 Aperta Far East Granted 75% Tanami (NT) Pty Ltd EL26925 Goanna 2 Granted 75% Tanami (NT) Pty Ltd EL26926 Black Hills 2 Granted 75% Tanami (NT) Pty Ltd EL28282 Suplejack Granted 75% Tanami (NT) Pty Ltd EL28283 (A) Goat Creek In Veto 75% Tanami (NT) Pty Ltd EL28474 Rushmore Granted 75% Tanami (NT) Pty Ltd EL28613 (A) Gamma East Application 75% Tanami (NT) Pty Ltd ML22934 Groundrush Granted 75% Tanami (NT) Pty Ltd MLS119 Reward Granted 75% Tanami (NT) Pty Ltd MLS120 No.1 South Granted 75% Tanami (NT) Pty Ltd MLS121 No.2 South Granted 75% Tanami (NT) Pty Ltd MLS122 No.3 South Granted 75% Tanami (NT) Pty Ltd MLS123 No.4 South Granted 75% Tanami (NT) Pty Ltd MLS124 No.1 North Granted 75% Tanami (NT) Pty Ltd MLS125 No.2 North Granted 75% Tanami (NT) Pty Ltd MLS126 No.3 North Granted 75% Tanami (NT) Pty Ltd MLS127 No.4 North Granted 75% Tanami (NT) Pty Ltd MLS128 No.5 North Granted 75% Tanami (NT) Pty Ltd MLS129 No.6 North Granted 75% Tanami (NT) Pty Ltd MLS130 East Block Granted 75% Tanami (NT) Pty Ltd MLS131 No. 5 South Granted 75% Tanami (NT) Pty Ltd MLS132 No. 6 South Granted 75% Tanami (NT) Pty Ltd MLS133 South East Block Granted 75% Tanami (NT) Pty Ltd MLS153 Tanami Extended Granted 75% Tanami (NT) Pty Ltd MLS167 Matilda Granted 75% Tanami (NT) Pty Ltd MLS168 Enterprise Granted 75% Tanami (NT) Pty Ltd MLS180 Molech Granted 75% Tanami (NT) Pty Ltd


