134
2017 Annual Report

2017 Annual Report
Summary2017 Financial Highlights 2Chairman’s message 4CEO’s message 142017 Sustainable Development and Societal Responsibility Report 31SSQ, Mutual Management Corporation 41CONSOLIDATED FINANCIAL STATEMENTS AS AT DECEMBER 31, 2017
Independent auditor’s report 42
Consolidated statement of income 43
Consolidated statement of comprehensive income 43
Consolidated statement of financial position 44
Consolidated statement of changes in equity 45
Consolidated statement of cash flows 46
Notes to the consolidated financial statements 47
SSQ, Life Insurance Company Inc. 57CONSOLIDATED FINANCIAL STATEMENTS AS AT DECEMBER 31, 2017
Independent auditor’s report 58
Consolidated statement of income 59
Consolidated statement of comprehensive income 60
Consolidated statementof financial position 61
Consolidated statement of changes in equity 62
Consolidated statement of cash flows 63
Notes to the consolidated financial statements 64
Ownership structure 127Boards of directors 128Management team and corporate divisions 129Addresses 130Contact us 130

Communities make us
Community spirit was the cornerstone of SSQ Insurance nearly 75 years ago. Drawing on its various constituent parts, the company has subsequently become an innovative, accessible, committed, respectful and ethical member of the community. The “communities make us” tagline continues to be our driving force. Now more than ever, we believe that the notion of community should lie at the heart of insurance because stronger communities make every individual stronger.
2017 Annual Report2
2017 Financial Highlights
2017 Annual Report 32017 Financial Highlights
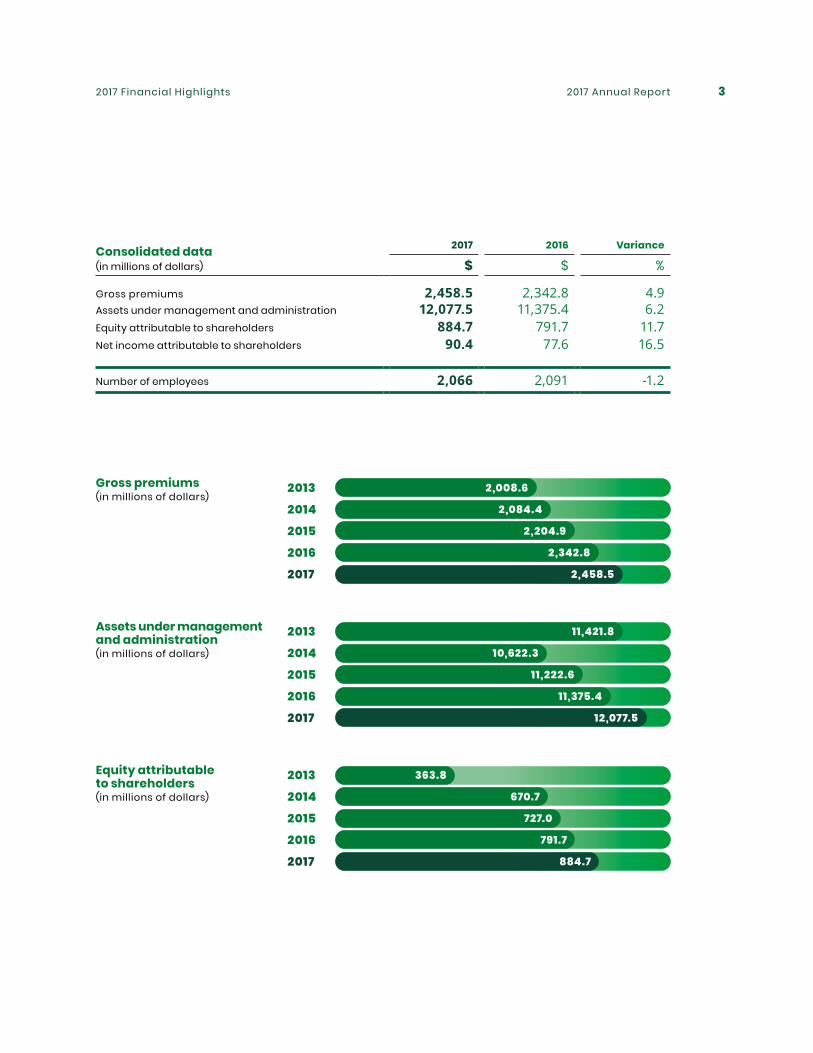
Consolidated data(in millions of dollars)
2017 2016 Variance
$ $ %
Gross premiums 2,458.5 2,342.8 4.9Assets under management and administration 12,077.5 11,375.4 6.2Equity attributable to shareholders 884.7 791.7 11.7Net income attributable to shareholders 90.4 77.6 16.5
Number of employees 2,066 2,091 -1.2
Gross premiums(in millions of dollars)
Assets under management and administration(in millions of dollars)
Equity attributable to shareholders(in millions of dollars)
2013
2013
2013
2014
2014
2014
2015
2015
2015
2016
2016
2016
2,458.5
12,077.5
884.7
2017
2017
2017
2,008.6
11,421.8
363.8
2,084.4
10,622.3
670.7
2,204.9
11,222.6
727.0
2,342.8
11,375.4
791.7

2017 Annual Report4
Chairman’s message
René Hamel Chairman of the Boards
Delegates ConferenceThe 2017 Delegates Conference was another milestone in our company’s democratic life. The delegates expressed their views in an array of workshops concerning SSQ, Mutual Management Corporation and SSQ, Life Insurance Company Inc., and their role within the mutual.
Our progress in 2017 will set the course for the coming years by strengthening the foundations of our mutual’s democratic life. The first concrete results of this consultation will be presented at the Delegates Conference in 2018.
Although this annual report deals primarily with SSQ, Mutual Management Corporation, the activities of SSQ, Life Insurance Company Inc. and its board of directors will also be discussed.
I would like to begin by mentioning two major milestones for our company in 2017.
Pierre Genest has been part of the SSQ family for over 30 years.
Departure of Pierre GenestAt our 2017 annual meeting, we marked the departure of Pierre Genest, who was an SSQ, Life Insurance Company Inc. (SSQ Life) board member from 1993 to 2017 and has been a key part of the SSQ family for over 30 years, including a decade as the company’s Chief Executive Officer. SSQ was founded 74 years ago and Pierre has played a pivotal role in our storied history.
2017 Annual Report 5Chairman’s message
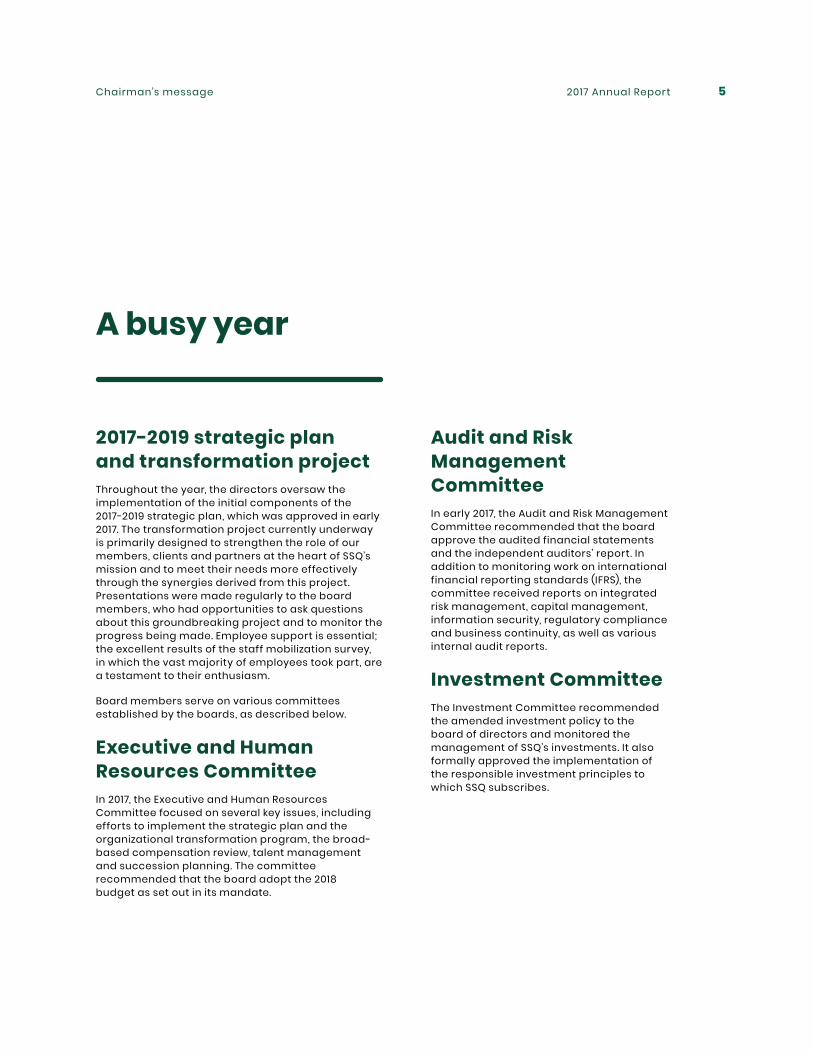
A busy year
2017-2019 strategic plan and transformation projectThroughout the year, the directors oversaw the implementation of the initial components of the 2017-2019 strategic plan, which was approved in early 2017. The transformation project currently underway is primarily designed to strengthen the role of our members, clients and partners at the heart of SSQ’s mission and to meet their needs more effectively through the synergies derived from this project. Presentations were made regularly to the board members, who had opportunities to ask questions about this groundbreaking project and to monitor the progress being made. Employee support is essential; the excellent results of the staff mobilization survey, in which the vast majority of employees took part, are a testament to their enthusiasm.
Board members serve on various committees established by the boards, as described below.
Executive and Human Resources CommitteeIn 2017, the Executive and Human Resources Committee focused on several key issues, including efforts to implement the strategic plan and the organizational transformation program, the broad-based compensation review, talent management and succession planning. The committee recommended that the board adopt the 2018 budget as set out in its mandate.
Audit and Risk Management CommitteeIn early 2017, the Audit and Risk Management Committee recommended that the board approve the audited financial statements and the independent auditors’ report. In addition to monitoring work on international financial reporting standards (IFRS), the committee received reports on integrated risk management, capital management, information security, regulatory compliance and business continuity, as well as various internal audit reports.
Investment CommitteeThe Investment Committee recommended the amended investment policy to the board of directors and monitored the management of SSQ’s investments. It also formally approved the implementation of the responsible investment principles to which SSQ subscribes.
2017 Annual Report6 Chairman’s message
Ethics Committee The Ethics Committee reviewed conflict-of-interest declarations by directors and officers, in addition to ethical compliance declarations, and submitted reports to the regulatory authorities.
Training sessions In addition to their formal meetings, the board members took part in training sessions on the following topics:
• Strategic Planning: Focus on 2020
• Value Added of an ORSA Process (Own RiskSolvency Assessment): Internal Assessmentof Risks and Solvency
• Governance Guideline Updated by theRegulatory Authorities
• The Future of Insurance: TechnologicalInnovations That Will Disrupt the Industry
• Mutualism 2020.
Moreover, the board members regularly receive a management-issued strategic watch bulletin.
Sustained presence Year after year, SSQ’s board members take their roles and responsibilities very seriously, as evidenced by their high levels of attendance and preparation for meetings. In 2017, their attendance at meetings of the various governing bodies was 98%, a remarkable result.
2017 Annual Report 7Chairman’s message
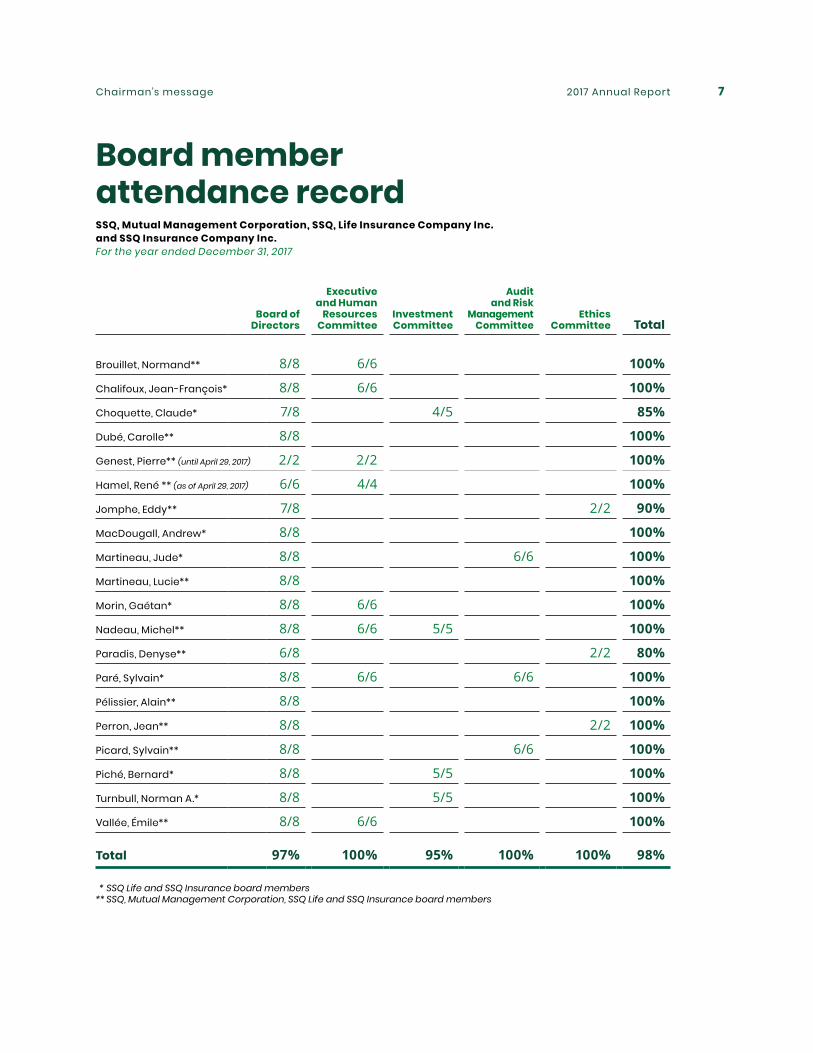
Board member attendance record SSQ, Mutual Management Corporation, SSQ, Life Insurance Company Inc. and SSQ Insurance Company Inc. For the year ended December 31, 2017
Board of Directors
Executive and Human
Resources Committee
Investment Committee
Audit and Risk
Management Committee
Ethics Committee Total
Brouillet, Normand** 8/8 6/6 100%
Chalifoux, Jean-François* 8/8 6/6 100%
Choquette, Claude* 7/8 4/5 85%
Dubé, Carolle** 8/8 100%
Genest, Pierre** (until April 29, 2017) 2/2 2/2 100%
Hamel, René ** (as of April 29, 2017) 6/6 4/4 100%
Jomphe, Eddy** 7/8 2/2 90%
MacDougall, Andrew* 8/8 100%
Martineau, Jude* 8/8 6/6 100%
Martineau, Lucie** 8/8 100%
Morin, Gaétan* 8/8 6/6 100%
Nadeau, Michel** 8/8 6/6 5/5 100%
Paradis, Denyse** 6/8 2/2 80%
Paré, Sylvain* 8/8 6/6 6/6 100%
Pélissier, Alain** 8/8 100%
Perron, Jean** 8/8 2/2 100%
Picard, Sylvain** 8/8 6/6 100%
Piché, Bernard* 8/8 5/5 100%
Turnbull, Norman A.* 8/8 5/5 100%
Vallée, Émile** 8/8 6/6 100%
Total 97% 100% 95% 100% 100% 98%
* SSQ Life and SSQ Insurance board members ** SSQ, Mutual Management Corporation, SSQ Life and SSQ Insurance board members
2017 Annual Report8 Chairman’s message
Giving back to the community
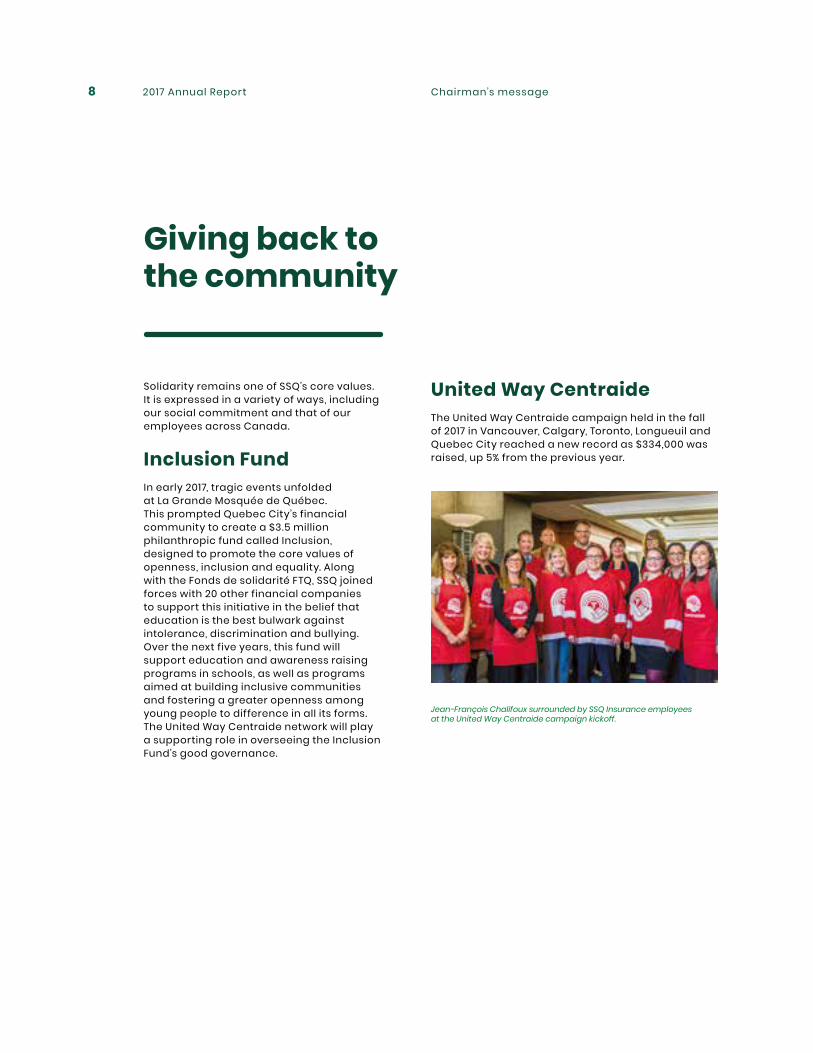
Jean-François Chalifoux surrounded by SSQ Insurance employees at the United Way Centraide campaign kickoff.
United Way CentraideThe United Way Centraide campaign held in the fall of 2017 in Vancouver, Calgary, Toronto, Longueuil and Quebec City reached a new record as $334,000 was raised, up 5% from the previous year.
Solidarity remains one of SSQ’s core values. It is expressed in a variety of ways, including our social commitment and that of our employees across Canada.
Inclusion FundIn early 2017, tragic events unfolded at La Grande Mosquée de Québec. This prompted Quebec City’s financial community to create a $3.5 million philanthropic fund called Inclusion, designed to promote the core values of openness, inclusion and equality. Along with the Fonds de solidarité FTQ, SSQ joined forces with 20 other financial companies to support this initiative in the belief that education is the best bulwark against intolerance, discrimination and bullying. Over the next five years, this fund will support education and awareness raising programs in schools, as well as programs aimed at building inclusive communities and fostering a greater openness among young people to difference in all its forms. The United Way Centraide network will play a supporting role in overseeing the Inclusion Fund’s good governance.
2017 Annual Report 9Chairman’s message
Socially committed employees
SSQ’s employees are socially committed; they are also great promoters of mutualist values. They are encouraged in various ways, particularly via our volunteer support program and training sessions on mutualism.
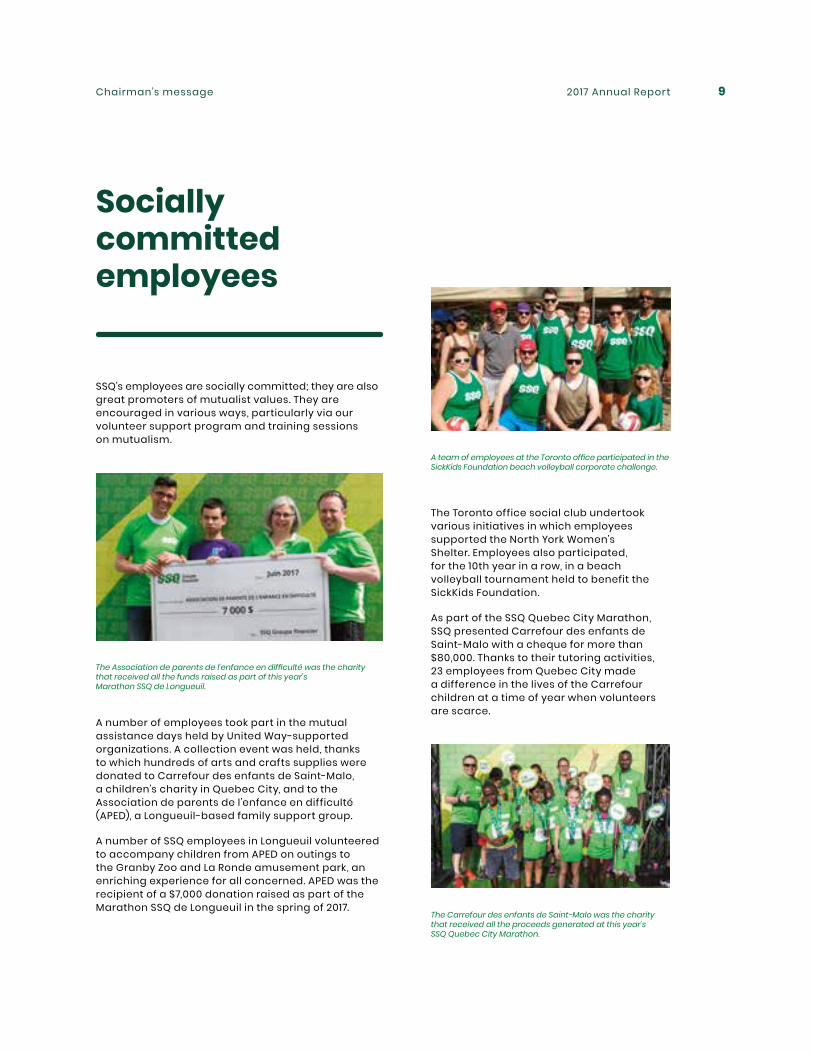
The Association de parents de l’enfance en difficulté was the charity that received all the funds raised as part of this year’s Marathon SSQ de Longueuil.
A team of employees at the Toronto office participated in the SickKids Foundation beach volleyball corporate challenge.
The Carrefour des enfants de Saint-Malo was the charity that received all the proceeds generated at this year’s SSQ Quebec City Marathon.
The Toronto office social club undertook various initiatives in which employees supported the North York Women’s Shelter. Employees also participated, for the 10th year in a row, in a beach volleyball tournament held to benefit the SickKids Foundation.
As part of the SSQ Quebec City Marathon, SSQ presented Carrefour des enfants de Saint-Malo with a cheque for more than $80,000. Thanks to their tutoring activities, 23 employees from Quebec City made a difference in the lives of the Carrefour children at a time of year when volunteers are scarce.
A number of employees took part in the mutual assistance days held by United Way-supported organizations. A collection event was held, thanks to which hundreds of arts and crafts supplies were donated to Carrefour des enfants de Saint-Malo, a children’s charity in Quebec City, and to the Association de parents de l’enfance en difficulté (APED), a Longueuil-based family support group.
A number of SSQ employees in Longueuil volunteered to accompany children from APED on outings to the Granby Zoo and La Ronde amusement park, an enriching experience for all concerned. APED was the recipient of a $7,000 donation raised as part of the Marathon SSQ de Longueuil in the spring of 2017.
2017 Annual Report10 Chairman’s message
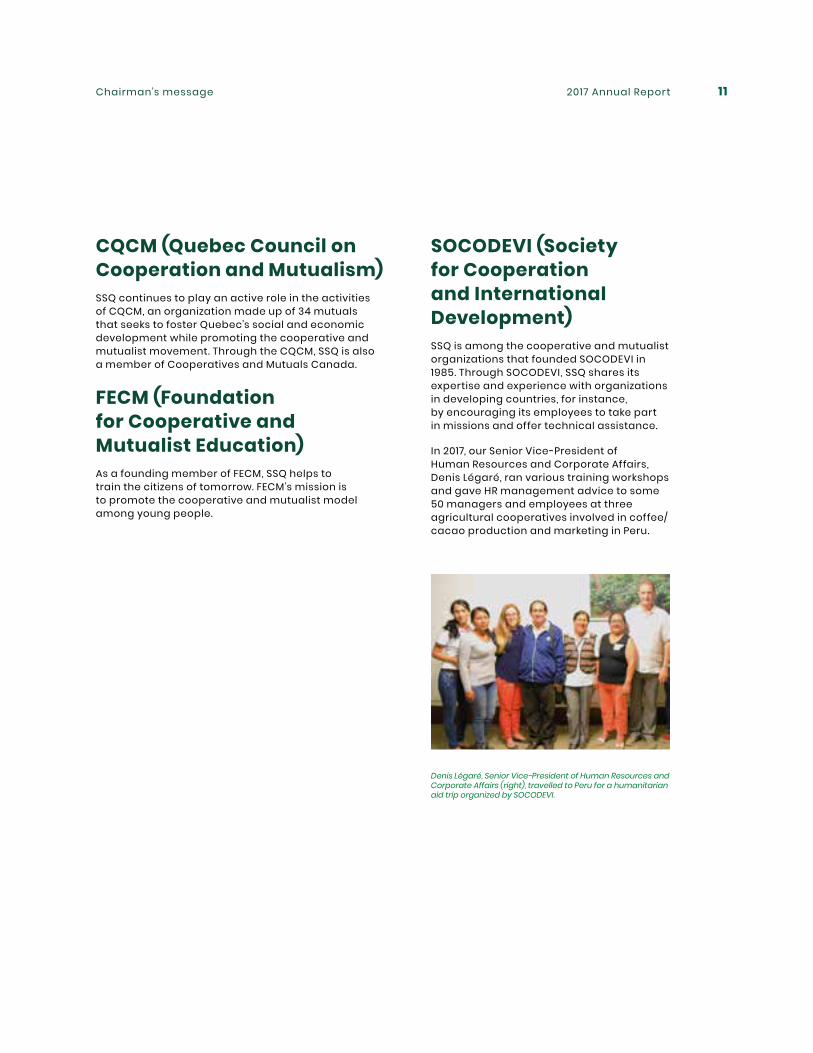
France Rodrigue, Vice-President of Realty, acted as governor of the event while several SSQ employees were involved as volunteers. The event was a dazzling success and raised $405,000.
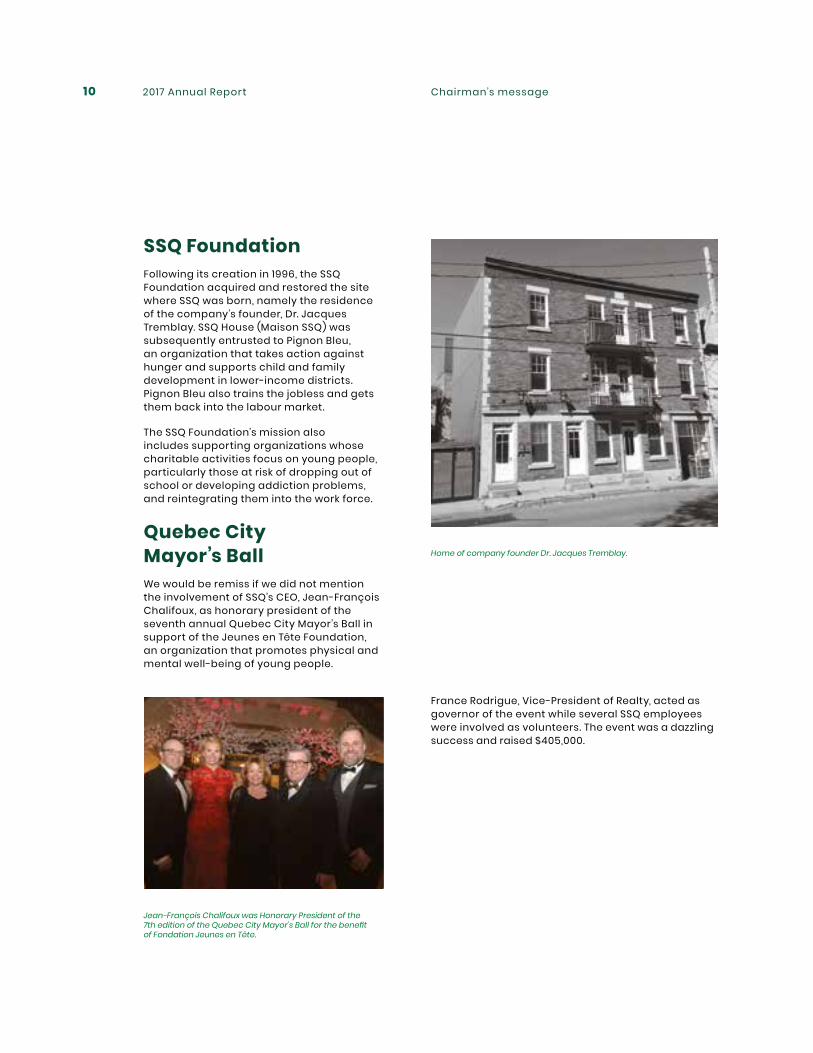
SSQ FoundationFollowing its creation in 1996, the SSQ Foundation acquired and restored the site where SSQ was born, namely the residence of the company’s founder, Dr. Jacques Tremblay. SSQ House (Maison SSQ) was subsequently entrusted to Pignon Bleu, an organization that takes action against hunger and supports child and family development in lower-income districts. Pignon Bleu also trains the jobless and gets them back into the labour market.
The SSQ Foundation’s mission also includes supporting organizations whose charitable activities focus on young people, particularly those at risk of dropping out of school or developing addiction problems, and reintegrating them into the work force.
Quebec City Mayor’s BallWe would be remiss if we did not mention the involvement of SSQ’s CEO, Jean-François Chalifoux, as honorary president of the seventh annual Quebec City Mayor’s Ball in support of the Jeunes en Tête Foundation, an organization that promotes physical and mental well-being of young people.
Jean-François Chalifoux was Honorary President of the 7th edition of the Quebec City Mayor’s Ball for the benefit of Fondation Jeunes en Tête.
Home of company founder Dr. Jacques Tremblay.
2017 Annual Report 11Chairman’s message
CQCM (Quebec Council on Cooperation and Mutualism)SSQ continues to play an active role in the activities of CQCM, an organization made up of 34 mutuals that seeks to foster Quebec’s social and economic development while promoting the cooperative and mutualist movement. Through the CQCM, SSQ is also a member of Cooperatives and Mutuals Canada.
FECM (Foundation for Cooperative and Mutualist Education)As a founding member of FECM, SSQ helps to train the citizens of tomorrow. FECM’s mission is to promote the cooperative and mutualist model among young people.
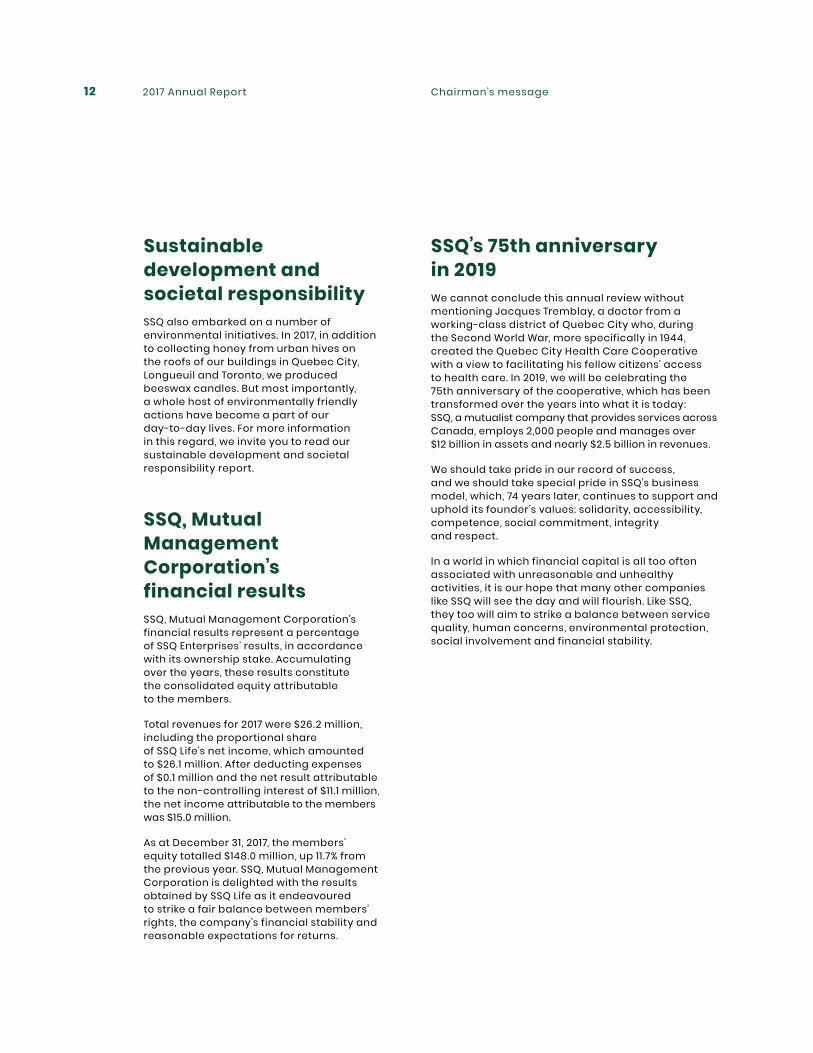
Denis Légaré, Senior Vice-President of Human Resources and Corporate Affairs (right), travelled to Peru for a humanitarian aid trip organized by SOCODEVI.
SOCODEVI (Society for Cooperation and International Development)SSQ is among the cooperative and mutualist organizations that founded SOCODEVI in 1985. Through SOCODEVI, SSQ shares its expertise and experience with organizations in developing countries, for instance, by encouraging its employees to take part in missions and offer technical assistance.
In 2017, our Senior Vice-President of Human Resources and Corporate Affairs, Denis Légaré, ran various training workshops and gave HR management advice to some 50 managers and employees at three agricultural cooperatives involved in coffee/cacao production and marketing in Peru.
2017 Annual Report12 Chairman’s message
Sustainable development and societal responsibilitySSQ also embarked on a number of environmental initiatives. In 2017, in addition to collecting honey from urban hives on the roofs of our buildings in Quebec City, Longueuil and Toronto, we produced beeswax candles. But most importantly, a whole host of environmentally friendly actions have become a part of our day-to-day lives. For more information in this regard, we invite you to read our sustainable development and societal responsibility report.
SSQ’s 75th anniversary in 2019We cannot conclude this annual review without mentioning Jacques Tremblay, a doctor from a working-class district of Quebec City who, during the Second World War, more specifically in 1944, created the Quebec City Health Care Cooperative with a view to facilitating his fellow citizens’ access to health care. In 2019, we will be celebrating the 75th anniversary of the cooperative, which has been transformed over the years into what it is today: SSQ, a mutualist company that provides services across Canada, employs 2,000 people and manages over $12 billion in assets and nearly $2.5 billion in revenues.
We should take pride in our record of success, and we should take special pride in SSQ’s business model, which, 74 years later, continues to support and uphold its founder’s values: solidarity, accessibility, competence, social commitment, integrity and respect.
In a world in which financial capital is all too often associated with unreasonable and unhealthy activities, it is our hope that many other companies like SSQ will see the day and will flourish. Like SSQ, they too will aim to strike a balance between service quality, human concerns, environmental protection, social involvement and financial stability.
SSQ, Mutual Management Corporation’s financial results SSQ, Mutual Management Corporation’s financial results represent a percentage of SSQ Enterprises’ results, in accordance with its ownership stake. Accumulating over the years, these results constitute the consolidated equity attributable to the members.
Total revenues for 2017 were $26.2 million, including the proportional share of SSQ Life’s net income, which amounted to $26.1 million. After deducting expenses of $0.1 million and the net result attributable to the non-controlling interest of $11 .1 million, the net income attributable to the members was $15.0 million.
As at December 31, 2017, the members’ equity totalled $148.0 million, up 11 .7% from the previous year. SSQ, Mutual Management Corporation is delighted with the results obtained by SSQ Life as it endeavoured to strike a fair balance between members’ rights, the company’s financial stability and reasonable expectations for returns.
2017 Annual Report 13Chairman’s message
René Hamel Chairman of the BoardsSSQ, Mutual Management CorporationSSQ Insurance
Acknowledgements
I would like to pay a special tribute to Hélène Plante who retired after more than 27 years with SSQ, 12 of which as Corporate Secretary. On behalf of the delegates, members, board members and myself, I would like to extend our gratitude to Hélène, along with our wishes for a very happy retirement.
The delegates have always responded enthusiastically to our invitations to take part in events surrounding SSQ’s annual meeting. Their contributions are all the more valuable because they clarify and enrich the sense of democratic life at SSQ.
To all our members and partners and our 2,000 employees, I would also like to express my sincere thanks.
Lastly, I would like to acknowledge the tireless efforts of our board members, who represent SSQ’s delegates and members. Thanks to their expertise and value added, they make a huge contribution to SSQ’s democratic health and ongoing viability.
Thank you.
2017 Annual Report14
CEO’s message
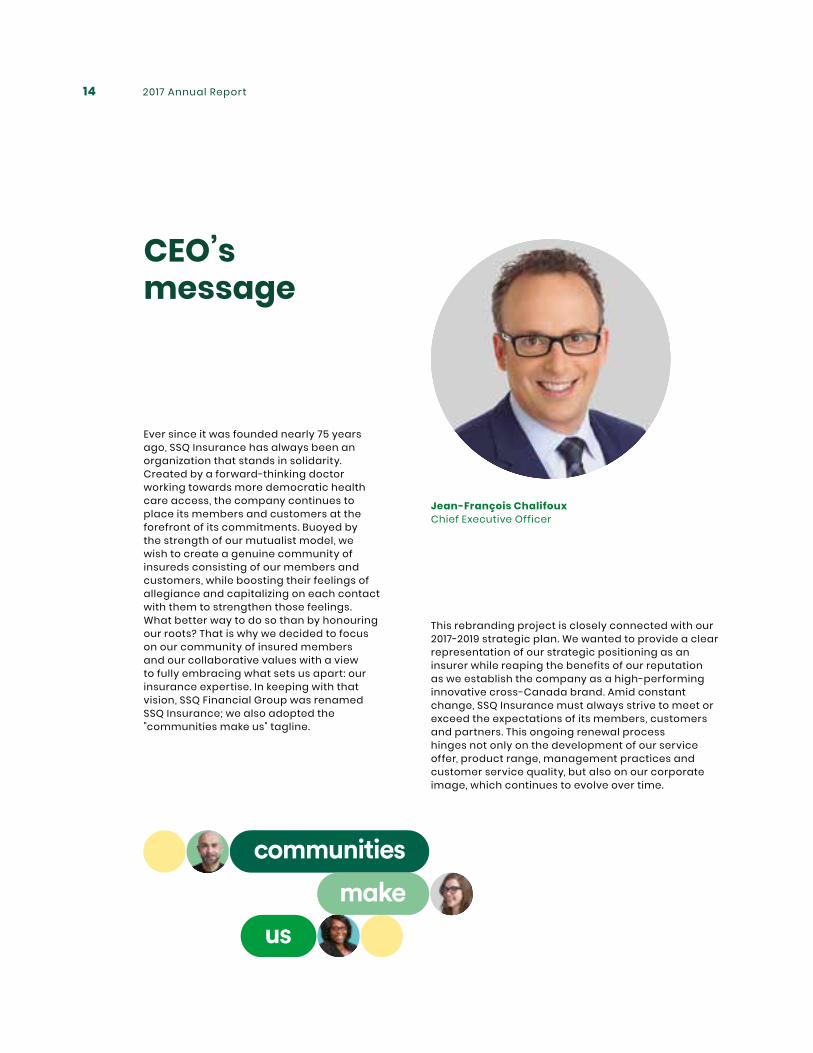
Ever since it was founded nearly 75 years ago, SSQ Insurance has always been an organization that stands in solidarity. Created by a forward-thinking doctor working towards more democratic health care access, the company continues to place its members and customers at the forefront of its commitments. Buoyed by the strength of our mutualist model, we wish to create a genuine community of insureds consisting of our members and customers, while boosting their feelings of allegiance and capitalizing on each contact with them to strengthen those feelings. What better way to do so than by honouring our roots? That is why we decided to focus on our community of insured members and our collaborative values with a view to fully embracing what sets us apart: our insurance expertise. In keeping with that vision, SSQ Financial Group was renamed SSQ Insurance; we also adopted the "communities make us" tagline.
This rebranding project is closely connected with our 2017-2019 strategic plan. We wanted to provide a clear representation of our strategic positioning as an insurer while reaping the benefits of our reputation as we establish the company as a high-performing innovative cross-Canada brand. Amid constant change, SSQ Insurance must always strive to meet or exceed the expectations of its members, customers and partners. This ongoing renewal process hinges not only on the development of our service offer, product range, management practices and customer service quality, but also on our corporate image, which continues to evolve over time.
Jean-François Chalifoux Chief Executive Officer
2017 Annual Report 15Message du président-directeur général
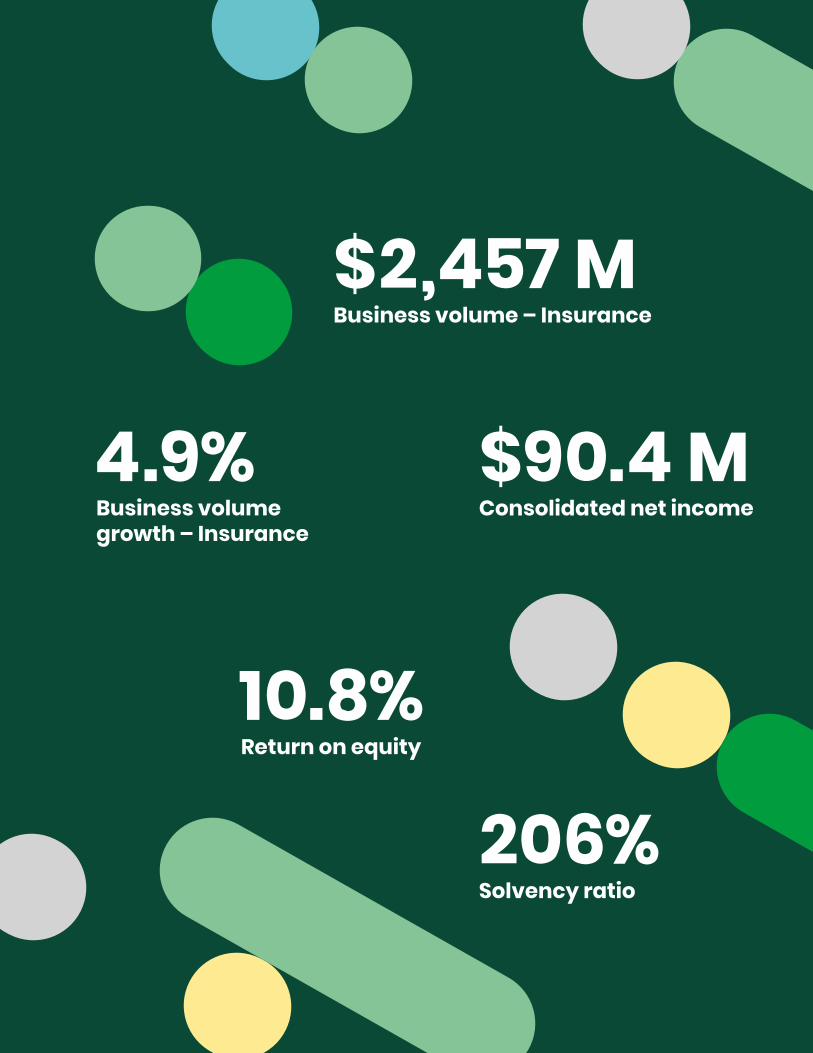
$2,457 M
$90.4 M
Business volume – Insurance
Consolidated net income4.9%
10.8%
206%
Business volume growth – Insurance
Return on equity
Solvency ratio
2017 Annual Report16 CEO’s message
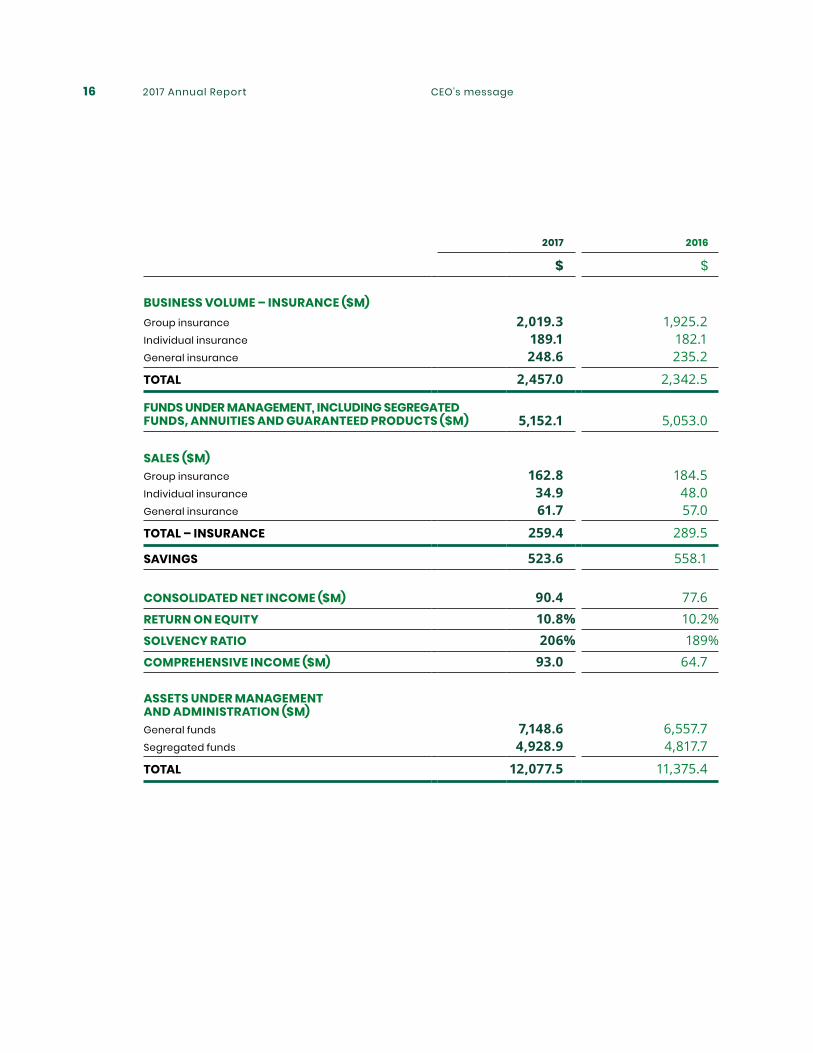
2017 2016
$ $
BUSINESS VOLUME – INSURANCE ($M)Group insurance 2,019.3 1,925.2Individual insurance 189.1 182.1General insurance 248.6 235.2
TOTAL 2,457.0 2,342.5
FUNDS UNDER MANAGEMENT, INCLUDING SEGREGATED FUNDS, ANNUITIES AND GUARANTEED PRODUCTS ($M) 5,152.1 5,053.0
SALES ($M)Group insurance 162.8 184.5Individual insurance 34.9 48.0General insurance 61.7 57.0
TOTAL – INSURANCE 259.4 289.5
SAVINGS 523.6 558.1
CONSOLIDATED NET INCOME ($M) 90.4 77.6RETURN ON EQUITY 10.8% 10.2%SOLVENCY RATIO 206% 189%COMPREHENSIVE INCOME ($M) 93.0 64.7
ASSETS UNDER MANAGEMENT AND ADMINISTRATION ($M)General funds 7,148.6 6,557.7Segregated funds 4,928.9 4,817.7
TOTAL 12,077.5 11,375.4
2017 Annual Report 17CEO’s message
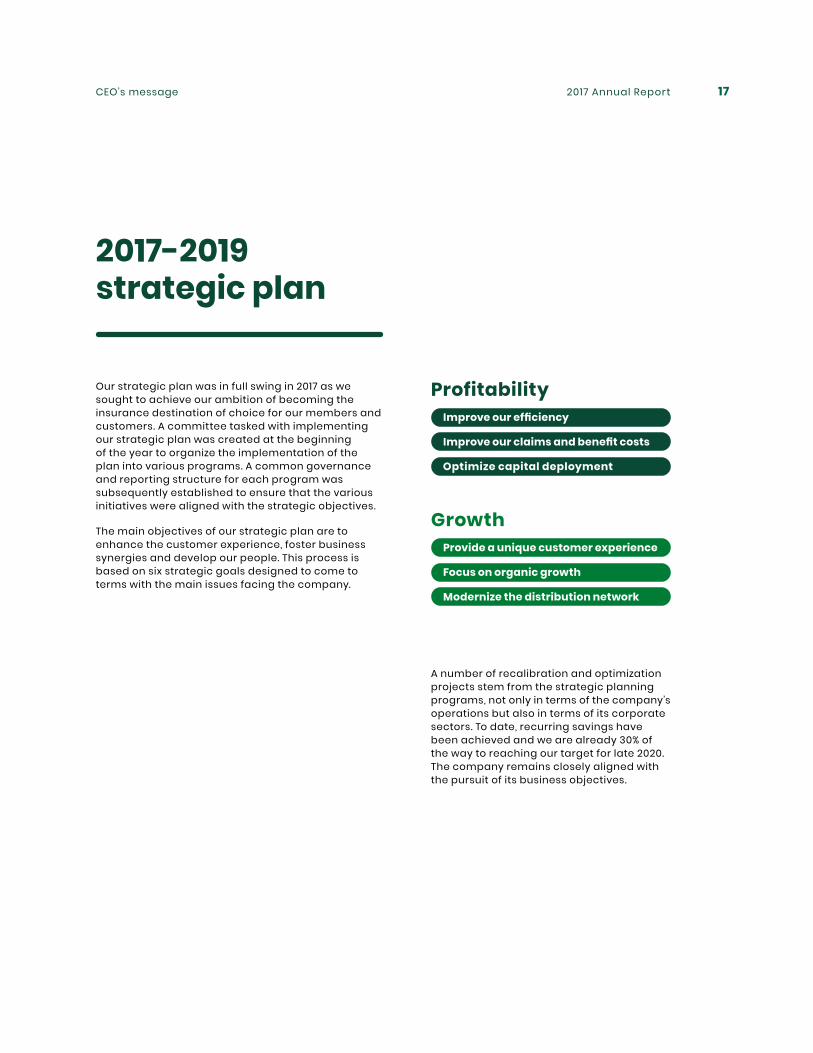
2017-2019 strategic plan
Our strategic plan was in full swing in 2017 as we sought to achieve our ambition of becoming the insurance destination of choice for our members and customers. A committee tasked with implementing our strategic plan was created at the beginning of the year to organize the implementation of the plan into various programs. A common governance and reporting structure for each program was subsequently established to ensure that the various initiatives were aligned with the strategic objectives.
The main objectives of our strategic plan are to enhance the customer experience, foster business synergies and develop our people. This process is based on six strategic goals designed to come to terms with the main issues facing the company.
A number of recalibration and optimization projects stem from the strategic planning programs, not only in terms of the company’s operations but also in terms of its corporate sectors. To date, recurring savings have been achieved and we are already 30% of the way to reaching our target for late 2020. The company remains closely aligned with the pursuit of its business objectives.
Profitability
Growth
Optimize capital deployment
Improve our efficiency
Provide a unique customer experience
Focus on organic growth
Modernize the distribution network
Improve our claims and benefit costs
2017 Annual Report18 CEO’s message
A company in transformation
In 2016, SSQ Insurance undertook a major transformation aimed at consolidating its strengths while seizing all available opportunities. Change management plans were put in place and carried out in 2017 in order to obtain stakeholders’ buy-in.
This transformation enabled us to streamline our corporate structure and revamp the organizational chart with a view to grouping our operating sectors by business function. Effective January 1 , 2017, our two insurance subsidiaries SSQ Insurance Company Inc. and SSQ General Insurance Company Inc. were merged. The new entity is as active in the area of general insurance as it is in the area of life and health insurance — an approach that is highly innovative in Canada. The five distribution subsidiaries were consolidated into one under the newly merged company.
Following this transformation, a number of policies were reviewed and tailored to the new organizational structure, particularly risk management policies for third-party activities, operational continuity, information security, operational risk management and capital management.
A new master plan for the integrated risk management function was laid out. Under the plan, this function was turned into an even larger performance lever by adding a risk-based perspective to the company’s strategic issues and by promoting better management of operational risks.
In terms of internal governance, creating a central registry for cataloguing the company’s information assets was a very mature step to take. This registry lists and classifies all information managed by SSQ Insurance with respect to confidentiality, integrity and availability. The registry will serve as a springboard for sweeping changes in the area of information security, particularly cybersecurity.
2017 Annual Report 19CEO’s message
Main financial results and highlights for 2017
SSQ Insurance posted a satisfactory return on equity of 10.8% in 2017. Net income of $90.4 million was up 16.5% from last year. Total comprehensive income was $93.0 million, 43% higher than in 2016. The net result and the markets’ good performance for the year account for this favourable comprehensive income.
The synergies derived from the 2016 transformation continue to be felt. Efficiency gains were also noted in 2017. These factors, combined with optimization projects stemming from strategic objectives, enabled us to manage a higher business volume by keeping expenses at nearly the same level they were at last year.
Despite a market that is still highly competitive, SSQ Insurance finished the year with an insurance volume of $2,457 million, up 4.9%. In the area of group insurance, SSQ Insurance’s customer service quality and expertise helped us retain our groups. However, achieving new sales targets for all sectors was particularly difficult in 2017.
Group insurance volume was up 4.9% to finish the year at $2,019 million. The improved profitability of short-term and specialized products, including travel insurance, contributed to the favourable net result in this sector. Meanwhile, the profitability of long-term products was consistent with action plan objectives for the coming years.
In the area of individual insurance, 2017 was a difficult year for achieving high sales targets, particularly in comparison with 2016, which was a banner year not only for SSQ Insurance, but also for the industry as a whole. Last year, record sales were fuelled, among other factors, by changes to the tax rules, which took effect on January 1, 2017. Nevertheless, this sector posted growth of 3.8% in 2017. The net result was adversely affected by updates to assumptions, some of which reflect changes to actuarial standards.
Although the profitability of general insurance improved overall in comparison with 2016, auto insurance conditions remained difficult. The competition is strong and sales targets were not reached for traditional insurance products. In contrast, the development of our business with the dealership network shows an overall growth of 5.7% in this sector.
The investment sector also contributed to the good results of 2017, thanks in particular to a reduction in actuarial liabilities. To rectify the profitability of certain individual insurance products and in light of high capital requirements, insurance premiums were raised in 2017. Major outflows following the application of these measures led to the freeing up of reserves and a favourable impact on this sector’s results. Despite these outflows, the savings sector’s business volume posted a growth of 2.0%.
2017 Annual Report20 CEO’s message
SSQ Distribution, the new subsidiary arising from the merger of the distribution entities, turned in a strong performance, with sales of insurance products up 19.4% and warranty products up 35.2%, in comparison with sales figures for the pre-merger entities in 2016. This offset the 37.9% drop in sales of investment products, which was anticipated.
Thanks to the good results for the year and the various initiatives pertaining to the strategic capital deployment objective, the solvency ratio stood at 206% as at December 31, 2017, up from 189% in 2016. Beginning in 2018, the new capital sufficiency requirements guideline issued by Quebec’s Autorité des marchés financiers will be applied. In the run-up to that event, steps were taken to confirm that SSQ Insurance would be well positioned when the new guideline takes effect in 2018.
For the sixth year in a row, the A.M. Best agency issued a financial strength rating of "A- (Excellent)" for the company and an issuer credit rating of "a-". The outlook remains stable. In other words, our financial strength has been confirmed by an internationally recognized external firm specializing in the insurance field.
Stepped-up presence Canada-wide
As part of our breakthrough with consultants outside Quebec, three major clients were added: Toromont, Aon Generation and Aon Choice. We concluded an agreement with Toromont Group to become their insurer and provide coverage to their 3,300 employees across Canada. SSQ Insurance was also enlisted for the Aon Generation product, which is offered to groups of fewer than 50 participants across the country, as well as Aon Choice, which is designed for medium-sized groups. Sales of the Mercer Solution product offering retiring workers an advantageous array of individual insurance products are growing strongly.
2017 Annual Report 21CEO’s message
Multi-network distribution approach
The company’s transformation has given concrete shape to plans to gradually develop business synergies with our customers. For example, under a new agreement signed with Biron Group Santé, its 800 employees will benefit from numerous general insurance products, as well as individual insurance products. Already a group insurance partner, Biron selected SSQ Insurance with a view to enhancing the services offered to its employees.
In parallel, SSQ Insurance concluded a new agreement with the Syndicat national des employés de garage du Québec Inc., a union representing garage employees across the province. As an SSQ Insurance group insurance client for several years, the union selected the company to offer its members a range of auto and home insurance products.
Those are two concrete examples of our efforts to branch out from group insurance and expand into individual insurance, a goal that ties in perfectly with our strategic objectives. The sales teams for affinity groups and group insurance are demonstrating how effective it is to work in synergy!
University of Montreal graduates now have access to SSQ Insurance’s individual insurance and investment services. Under this agreement, our service offer will be optimized. We will also be advantageously positioned in the affinity product market while boosting our growing influence.
The auto dealership network (Réseau des concessionnaires) also turned in a standout performance in 2017 with a growth rate of 53.0%, thanks primarily to the agreement entered into with Albi le Géant. SSQ Insurance and Albi le Géant share the same customer experience goals, which certainly facilitated the signing of this agreement. In this regard, both organizations work on the same basis, i .e. , seeking to provide an improved experience by exclusively offering SSQ’s credit insurance, replacement insurance and extended warranty products to network-affiliated dealerships.
2017 Annual Report22 CEO’s message
Longstanding partners
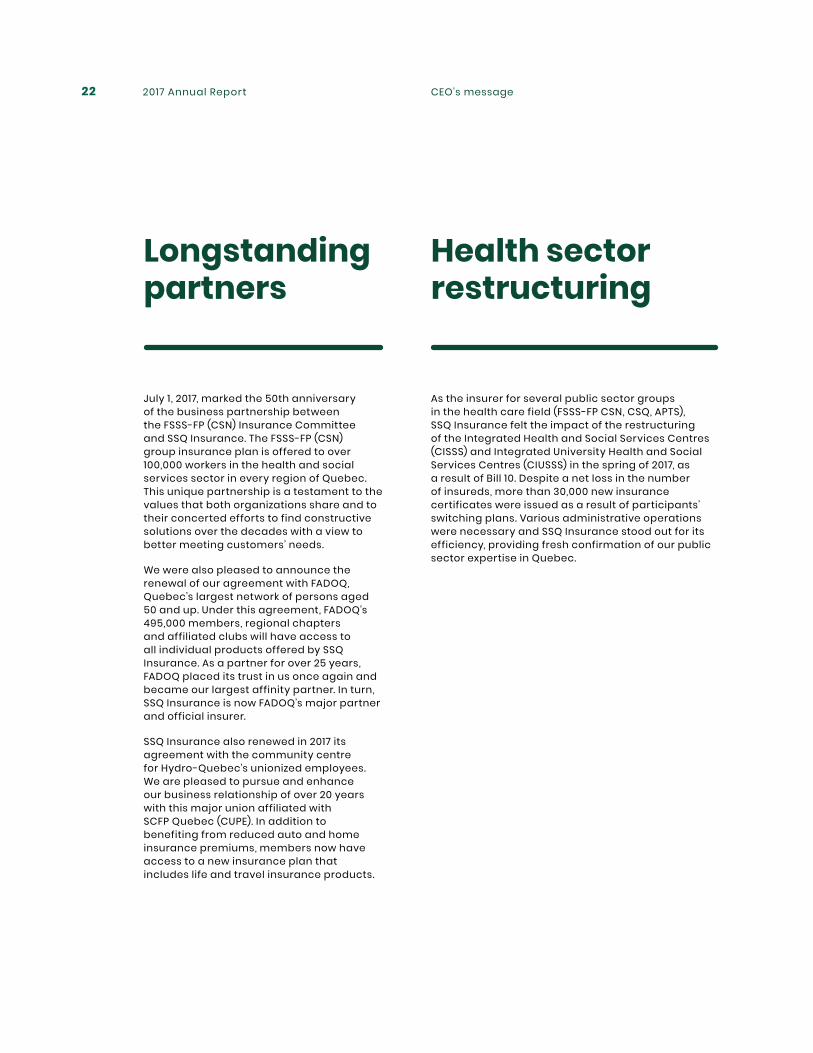
July 1 , 2017, marked the 50th anniversary of the business partnership between the FSSS-FP (CSN) Insurance Committee and SSQ Insurance. The FSSS-FP (CSN) group insurance plan is offered to over 100,000 workers in the health and social services sector in every region of Quebec. This unique partnership is a testament to the values that both organizations share and to their concerted efforts to find constructive solutions over the decades with a view to better meeting customers’ needs.
We were also pleased to announce the renewal of our agreement with FADOQ, Quebec’s largest network of persons aged 50 and up. Under this agreement, FADOQ’s 495,000 members, regional chapters and affiliated clubs will have access to all individual products offered by SSQ Insurance. As a partner for over 25 years, FADOQ placed its trust in us once again and became our largest affinity partner. In turn, SSQ Insurance is now FADOQ’s major partner and official insurer.
SSQ Insurance also renewed in 2017 its agreement with the community centre for Hydro-Quebec’s unionized employees. We are pleased to pursue and enhance our business relationship of over 20 years with this major union affiliated with SCFP Quebec (CUPE). In addition to benefiting from reduced auto and home insurance premiums, members now have access to a new insurance plan that includes life and travel insurance products.
Health sector restructuring
As the insurer for several public sector groups in the health care field (FSSS-FP CSN, CSQ, APTS), SSQ Insurance felt the impact of the restructuring of the Integrated Health and Social Services Centres (CISSS) and Integrated University Health and Social Services Centres (CIUSSS) in the spring of 2017, as a result of Bill 10. Despite a net loss in the number of insureds, more than 30,000 new insurance certificates were issued as a result of participants’ switching plans. Various administrative operations were necessary and SSQ Insurance stood out for its efficiency, providing fresh confirmation of our public sector expertise in Quebec.
2017 Annual Report 23CEO’s message
Rollout of digital services
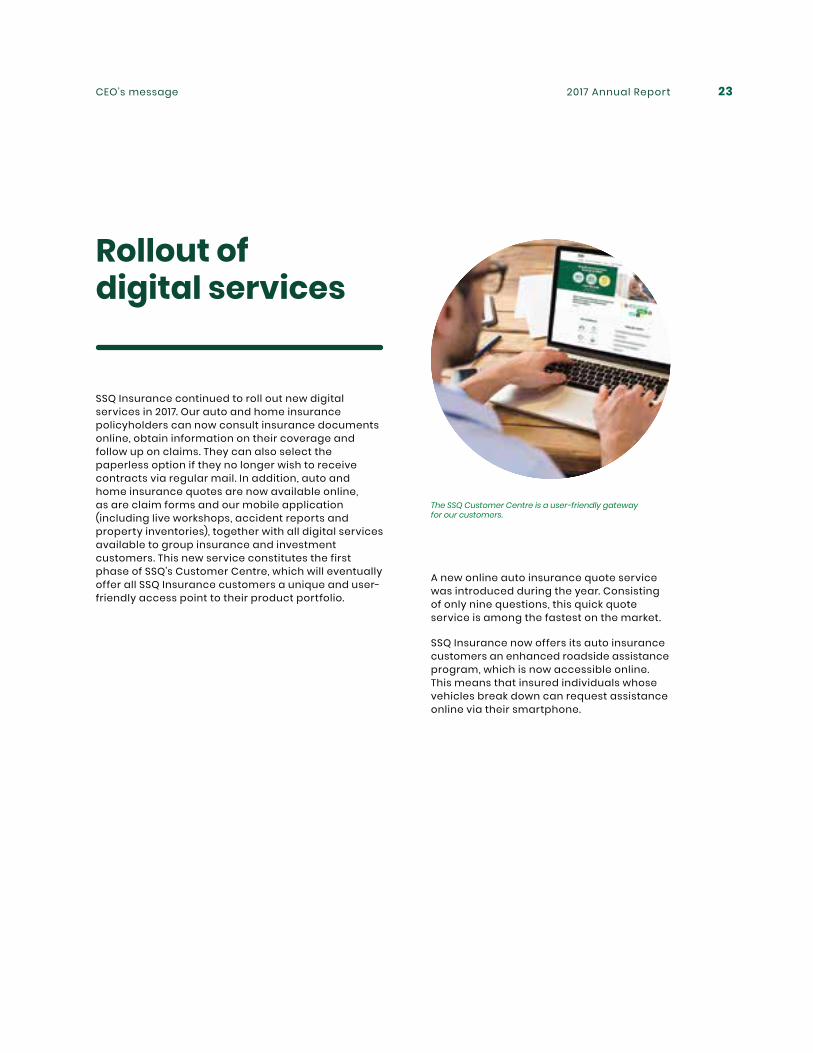
SSQ Insurance continued to roll out new digital services in 2017. Our auto and home insurance policyholders can now consult insurance documents online, obtain information on their coverage and follow up on claims. They can also select the paperless option if they no longer wish to receive contracts via regular mail. In addition, auto and home insurance quotes are now available online, as are claim forms and our mobile application (including live workshops, accident reports and property inventories), together with all digital services available to group insurance and investment customers. This new service constitutes the first phase of SSQ’s Customer Centre, which will eventually offer all SSQ Insurance customers a unique and user-friendly access point to their product portfolio.
A new online auto insurance quote service was introduced during the year. Consisting of only nine questions, this quick quote service is among the fastest on the market.
SSQ Insurance now offers its auto insurance customers an enhanced roadside assistance program, which is now accessible online. This means that insured individuals whose vehicles break down can request assistance online via their smartphone.
The SSQ Customer Centre is a user-friendly gateway for our customers.
2017 Annual Report24 CEO’s message
Customers are at the very heart of our concerns
Myally, offered in conjunction with Optima Global Health, aims to prevent psychological illnesses.
SSQ Insurance also introduced an innovative new service geared towards its insurance customers, known as “myally.” This was launched in connection with SSQ’s health and wellness program Health InSight and serves as an add-on to the HealthWise program. Offered in partnership with Optima Global Health, myally is based on the provision of assistance to employees by colleagues known as "allies" with a view to preventing psychological illnesses. The training of workplace allies is handled by a team of seasoned mental health professionals, supported by a web-based platform providing access to specialized content such as Web conferences, remote training, video clips, reference documents and relevant articles, along with simulated situations.
SSQ Insurance has long been recognized for its customer service quality, even though we seek to constantly improve our performance by offering our customers a distinctive experience in each interaction with us. In this regard, we launched a program to review our management and customer service processes with a view to improving our operational agility while simplifying things for our insureds and offering them an even more satisfying experience. During the year, our optimized services included implementing and registering new group insurance plans, managing health claims and disability benefit cases and issuing individual life insurance policies.
The Customer’s Voice program was also launched for employees. As part of this initiative, platforms are monitored to identify what people are saying about the company and consumers’ expectations in general. The program also measures and evaluates the customer experience using a real-time toolkit. Thanks to the implementation of this state-of-the-art program and industry best practices, the company is more proactive and can go above and beyond customers’ needs in line with customer loyalty objectives.

2017 Annual Report 25CEO’s message
Our employees are our ambassadors
2017 was also marked by concerted efforts to carry out a shift in our organizational culture. This was regarded as essential to consolidate the company’s transformation and to support the implementation of our strategic plan. In the first quarter, the findings of our organizational culture consultation were unveiled. A new lexicon for our cultural ambitions soon began to emerge among our 2,000 employees and managers. An ambitious project, known as the cultural change program, was developed. Various activities and projects were organized to foster the transition of our organizational culture to the desired outcome. These included a review of all HR practices, the appropriation of expected and necessary behaviours and cultural change metrics.
A large-scale employee mobilization survey was carried and the 90% participation rate was truly outstanding. Amid sweeping organizational changes and an evolving culture, we realized that our investments in managerial leadership and change management in recent years have borne fruit. The 2017 mobilization index for our employees was in fact higher than the results in 2014, when the previous survey was carried out.
According to a survey conducted by Forbes Media and Statista, SSQ Insurance ranks among Canada’s Top 300 employers.
2017 Annual Report26 CEO’s message
Successful real estate activities
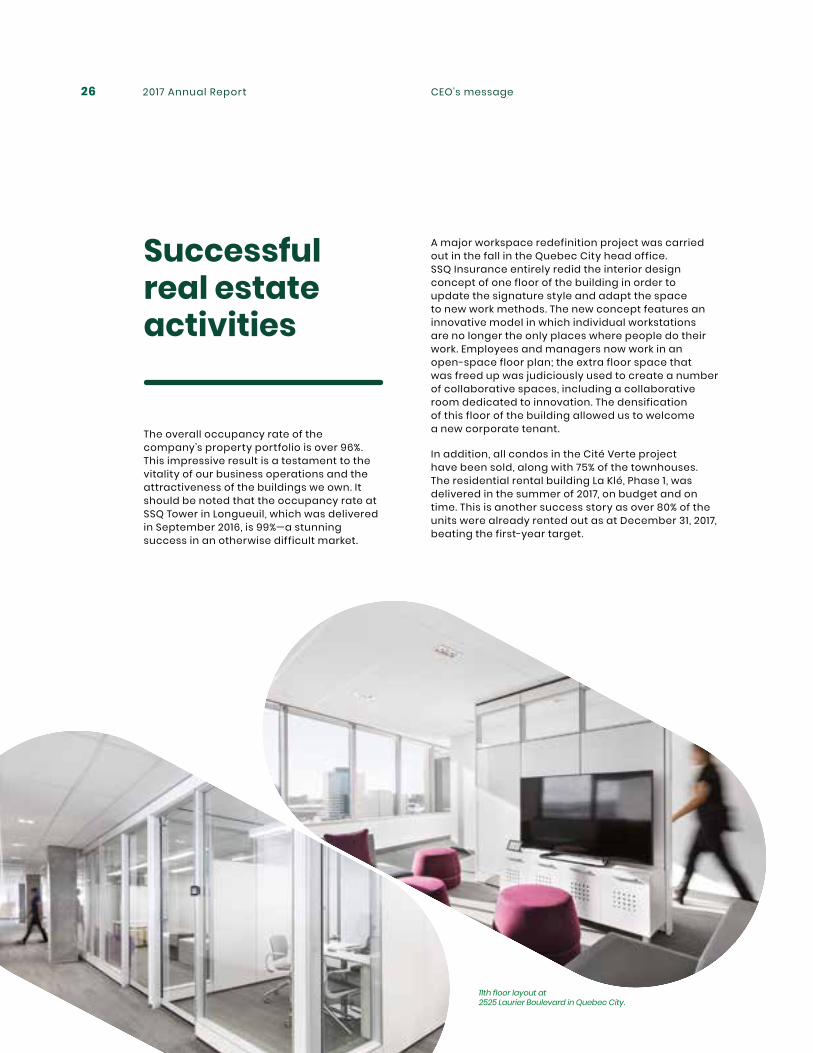
The overall occupancy rate of the company’s property portfolio is over 96%. This impressive result is a testament to the vitality of our business operations and the attractiveness of the buildings we own. It should be noted that the occupancy rate at SSQ Tower in Longueuil, which was delivered in September 2016, is 99%—a stunning success in an otherwise difficult market.
A major workspace redefinition project was carried out in the fall in the Quebec City head office. SSQ Insurance entirely redid the interior design concept of one floor of the building in order to update the signature style and adapt the space to new work methods. The new concept features an innovative model in which individual workstations are no longer the only places where people do their work. Employees and managers now work in an open-space floor plan; the extra floor space that was freed up was judiciously used to create a number of collaborative spaces, including a collaborative room dedicated to innovation. The densification of this floor of the building allowed us to welcome a new corporate tenant.
In addition, all condos in the Cité Verte project have been sold, along with 75% of the townhouses. The residential rental building La Klé, Phase 1, was delivered in the summer of 2017, on budget and on time. This is another success story as over 80% of the units were already rented out as at December 31, 2017, beating the first-year target.
11th floor layout at 2525 Laurier Boulevard in Quebec City.
2017 Annual Report 27CEO’s message
Innovation designed to benefit the community
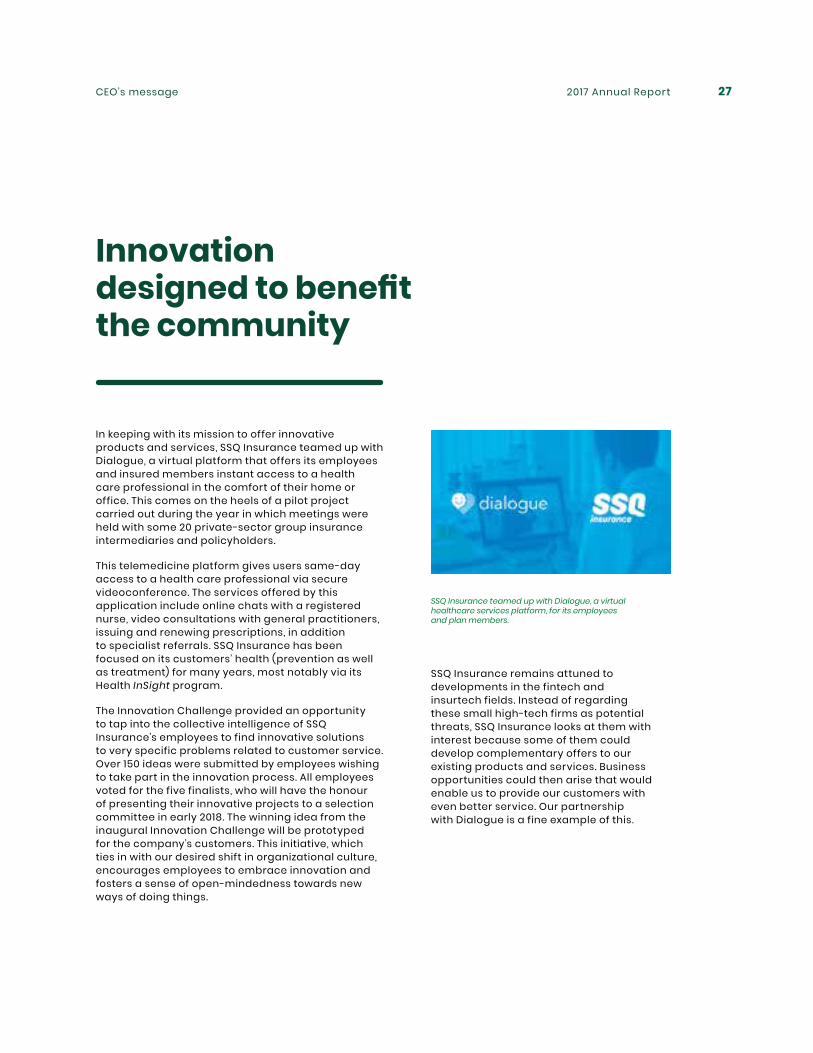
In keeping with its mission to offer innovative products and services, SSQ Insurance teamed up with Dialogue, a virtual platform that offers its employees and insured members instant access to a health care professional in the comfort of their home or office. This comes on the heels of a pilot project carried out during the year in which meetings were held with some 20 private-sector group insurance intermediaries and policyholders.
This telemedicine platform gives users same-day access to a health care professional via secure videoconference. The services offered by this application include online chats with a registered nurse, video consultations with general practitioners, issuing and renewing prescriptions, in addition to specialist referrals. SSQ Insurance has been focused on its customers’ health (prevention as well as treatment) for many years, most notably via its Health InSight program.
The Innovation Challenge provided an opportunity to tap into the collective intelligence of SSQ Insurance’s employees to find innovative solutions to very specific problems related to customer service. Over 150 ideas were submitted by employees wishing to take part in the innovation process. All employees voted for the five finalists, who will have the honour of presenting their innovative projects to a selection committee in early 2018. The winning idea from the inaugural Innovation Challenge will be prototyped for the company’s customers. This initiative, which ties in with our desired shift in organizational culture, encourages employees to embrace innovation and fosters a sense of open-mindedness towards new ways of doing things.
SSQ Insurance teamed up with Dialogue, a virtual healthcare services platform, for its employees and plan members.
SSQ Insurance remains attuned to developments in the fintech and insurtech fields. Instead of regarding these small high-tech firms as potential threats, SSQ Insurance looks at them with interest because some of them could develop complementary offers to our existing products and services. Business opportunities could then arise that would enable us to provide our customers with even better service. Our partnership with Dialogue is a fine example of this.
2017 Annual Report28 CEO’s message
Involved in the community
SSQ Insurance confirmed a significant financial contribution to Université Laval’s major fundraising campaign. The contribution, totalling $700,000 over five years, will support Mon Équilibre UL (the university’s healthy lifestyle program), in addition to a strategic research partnership project dealing with the digital customer experience and the "Rouge et Or" volleyball club. Through this financial commitment, we wish to demonstrate the emphasis we place on the university community, as well as research and personal excellence.
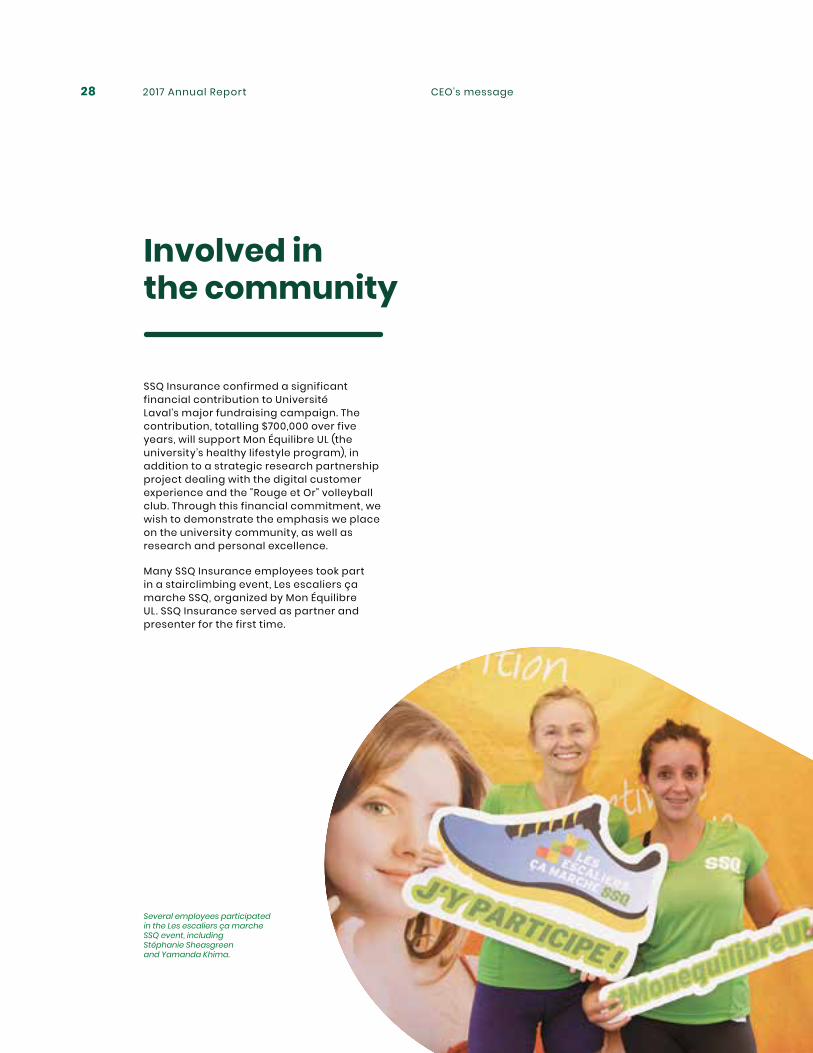
Many SSQ Insurance employees took part in a stairclimbing event, Les escaliers ça marche SSQ, organized by Mon Équilibre UL. SSQ Insurance served as partner and presenter for the first time.
Several employees participated in the Les escaliers ça marche SSQ event, including Stéphanie Sheasgreen and Yamanda Khima.
2017 Annual Report 29CEO’s message
Implementing detailed pharmacy invoicesSince September 15, 2017, invoices for pharmacy-dispensed prescription drugs have been much more detailed. They now clearly indicate the price of each medication, the professional fee charged by the pharmacist for each service provided and the distributor’s margin.
This measure represents an initial step towards more informed choices for insureds. An increase in drug prices and pharmacists’ professional fees, together with increased consumption of prescription drugs, mean that group insurance program costs continue to rise.
Workers in Quebec covered by a group insurance plan and their employers, unions and associations pay more than individuals covered by the public plan because pharmacists’ professional fees are higher for private plans. When consumers make more informed choices, savings can be achieved by better use of resources devoted to group insurance plans. This would benefit both policyholders and insureds.
Publication of a new accounting standard
After years of hard work, the International Accounting Standards Board ("IASB") finally published IFRS 17 "Insurance Contracts" ("IFRS 17") in May 2017. This standard will take effect on January 1 , 2021; SSQ Insurance and all insurers that apply international financial reporting standards ("IFRS") will be required to comply with it. This new standard is designed to harmonize the accounting treatment of insurance contracts between countries and with accounting practices in other industries.
IFRS 17 will have a major impact on the insurance industry. The valuation of insurance contracts will be completely reviewed. Financial statements will be presented differently and the realization of revenues will be modified. IFRS 17 will be beneficial because it will mean greater consistency between the financial statements of insurers applying the IFRS.
This year, SSQ Insurance undertook a number of major projects aimed at putting key success factors in place so as to comply with the new standard within the prescribed timeframe. A formal governance structure was implemented to carry out the project and a team of experts entirely dedicated to IFRS 17 implementation was put together with the support of senior management. The team is also relying on numerous internal and external collaborators. Although the new standard will have a major impact on actuarial, financial and IT services, SSQ Insurance has taken all steps to meet the regulatory requirements of IFRS 17.
2017 Annual Report30 CEO’s message
Communities make us
The launch of our new brand image certainly meets a strategic planning objective—but it also captures a spirit that characterizes our company and our employees.
• By focusing on the customer experience and by redefining how things are done, we are finding practical ways to serve our customers better.
• By making improvements to our processes and procedures and boosting their efficiency, we can simplify interactions with our customers.
• By assuming responsibility for our performance and results and by drawing on our expertise and talent, we contribute to SSQ Insurance’s success.
• By being attached to the SSQ community and by taking pride in our company, we stay true to our identity and our positioning: communities make us.
Every step that is aligned with our ambitions will guide us towards their achievement. In other words, we are well on our way to becoming the insurance destination of choice for our members and our customers.
Acknowledgments
Jean-François Chalifoux Chief Executive Officer
In closing, I would like to thank our members and our customers for placing their trust in us. They are why we strive for excellence day after day.
A warm thanks to all of our employees: I am proud of your openness to change and your professionalism. I also take pride in the skills that you demonstrate and the increased agility that that means for SSQ Insurance.
Thank you as well to the members of our Boards of Directors, and especially to its Chairman, René Hamel, for their support and guidance.
2017 Sustainable Development and Societal Responsibility Report
Sustainable development and societal responsibility
Now more than ever, we believe that communities should be at the heart of insurance because stronger communities make every person stronger. For this reason, SSQ Insurance will continue to be present in the community, be socially responsible and be committed to serving its insured community.
This vision manifests itself in our corporate culture and our business practices, which lead us to reconcile economic and financial issues with social and environmental causes. We have followed this path from the start, as we strongly believe that all companies must serve humankind.
Once again this year, several important milestones were reached in terms of sustainable development and societal responsibility.
Here are a few examples.

2017 Annual Report 33
Innovative and efficient products and services
Delivery of the new SSQ Customer Centre an online platform that lets customers consult their general insurance products and make transactions at any time, in a simplified environment.
Our Net Promoter Score (NPS) ranked as excellentfor group insurance benefits and services as well as general insurance claims.
Over 30,000 surveys compiled and analyzed thanks to the implementation of our interactive survey platform to assess the post-transaction experience of customers.
Deployment of the Customer’s Voice programwhich helps us tap into the opinions of our group insurance and general insurance customers and use that feedback to make decisions in line with improved customer satisfaction.
Sustainable Development and Societal Responsibility Report
2017 Annual Report34
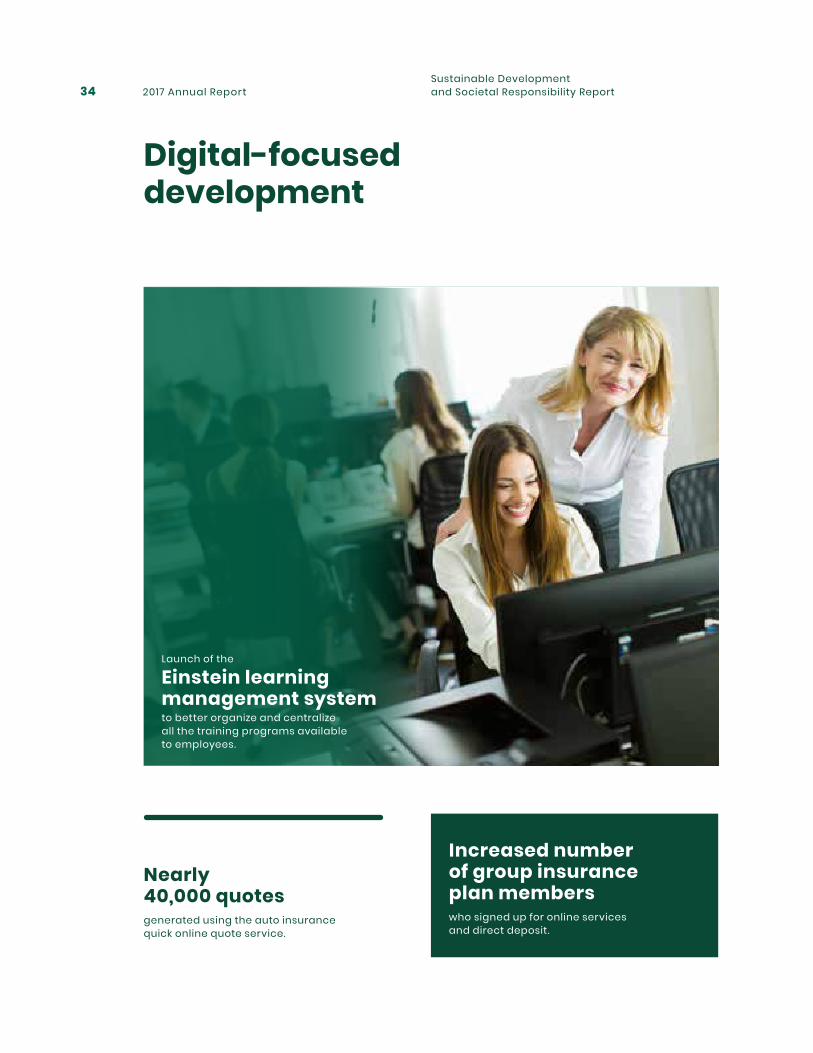
Digital-focused development
Nearly 40,000 quotes generated using the auto insurance quick online quote service.
Increased number of group insurance plan members who signed up for online services and direct deposit.
Launch of the
Einstein learning management system to better organize and centralize all the training programs available to employees.
Sustainable Development and Societal Responsibility Report

2017 Annual Report 35
A company committed to its community
Having formed a strong bond with the Carrefour des enfants de Saint-Malo SSQ Insurance invited children from the Carrefour to run the SSQ Health 5K, one of the events at the SSQ Quebec City Marathon.
SSQ Insurance employees
volunteered their time to help kids from the Carrefour des enfants de Saint-Malo with their homework.
Over $80,000 raised for the Carrefour des enfants de St-Malo as part of SSQ Quebec City Marathon initiatives.
Welcomed high school students to the
Jeunes explorateurs d’un jour activity so that they could experience a day in the life of insurance and financial services, under the auspices of honorary president France Rodrigue, Vice-President of Realty.
Sustainable Development and Societal Responsibility Report
2017 Annual Report36
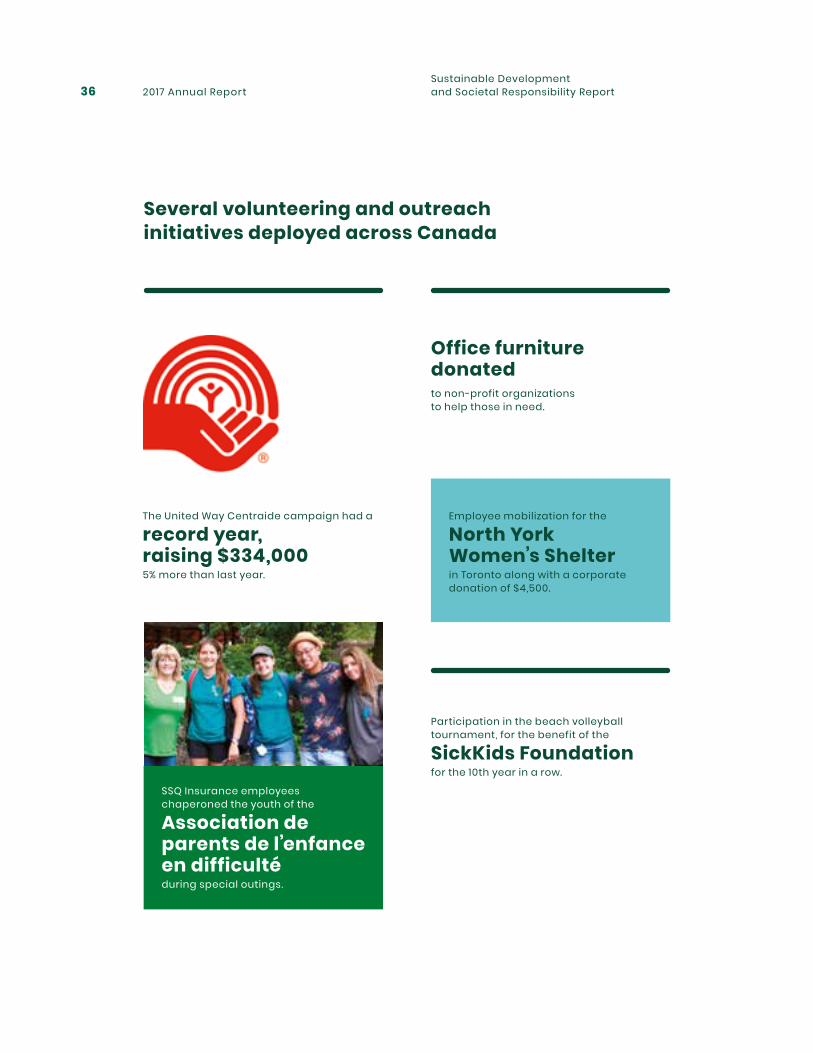
Several volunteering and outreach initiatives deployed across Canada
The United Way Centraide campaign had a
record year, raising $334,000 5% more than last year.
Employee mobilization for the
North York Women’s Shelter in Toronto along with a corporate donation of $4,500.
Office furniture donated to non-profit organizations to help those in need.
SSQ Insurance employees chaperoned the youth of the
Association de parents de l’enfance en difficulté during special outings.
Participation in the beach volleyball tournament, for the benefit of the
SickKids Foundation for the 10th year in a row.
Sustainable Development and Societal Responsibility Report
2017 Annual Report 37
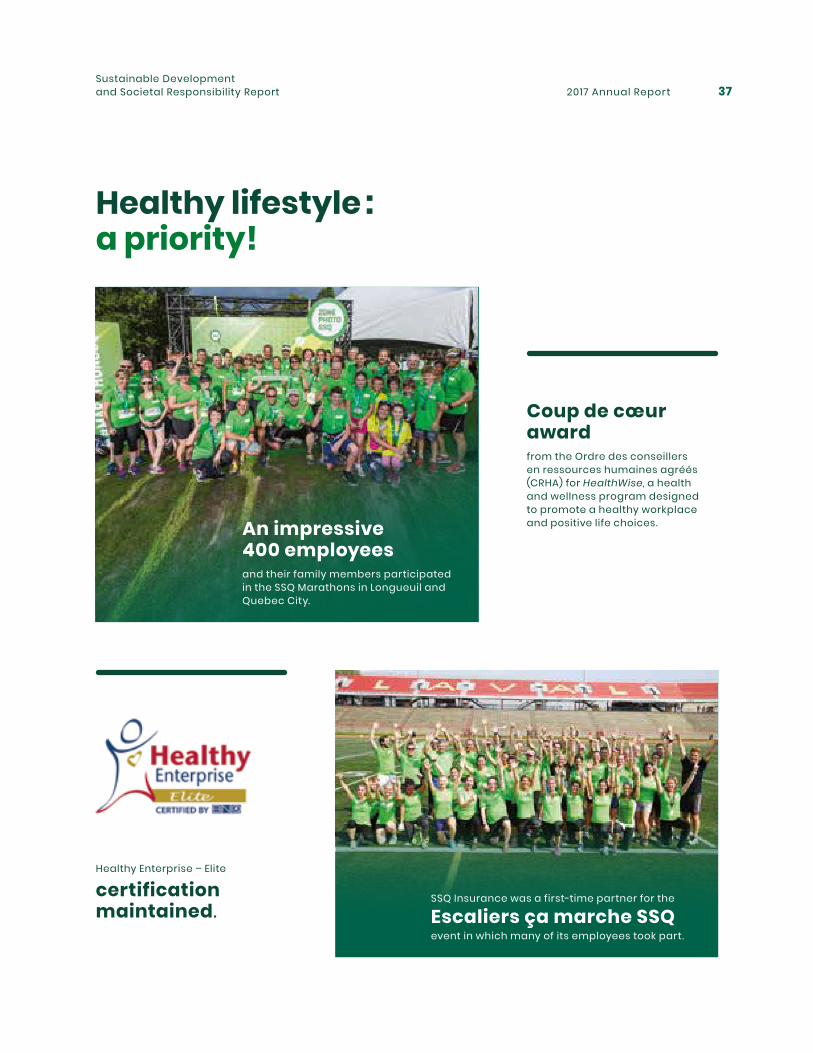
Healthy lifestyle : a priority!
Healthy Enterprise – Elite
certification maintained.
SSQ Insurance was a first-time partner for the
Escaliers ça marche SSQ event in which many of its employees took part.
An impressive 400 employees
and their family members participated in the SSQ Marathons in Longueuil and Quebec City.
Coup de cœur award from the Ordre des conseillers en ressources humaines agréés (CRHA) for HealthWise, a health and wellness program designed to promote a healthy workplace and positive life choices.
Sustainable Development and Societal Responsibility Report
2017 Annual Report38
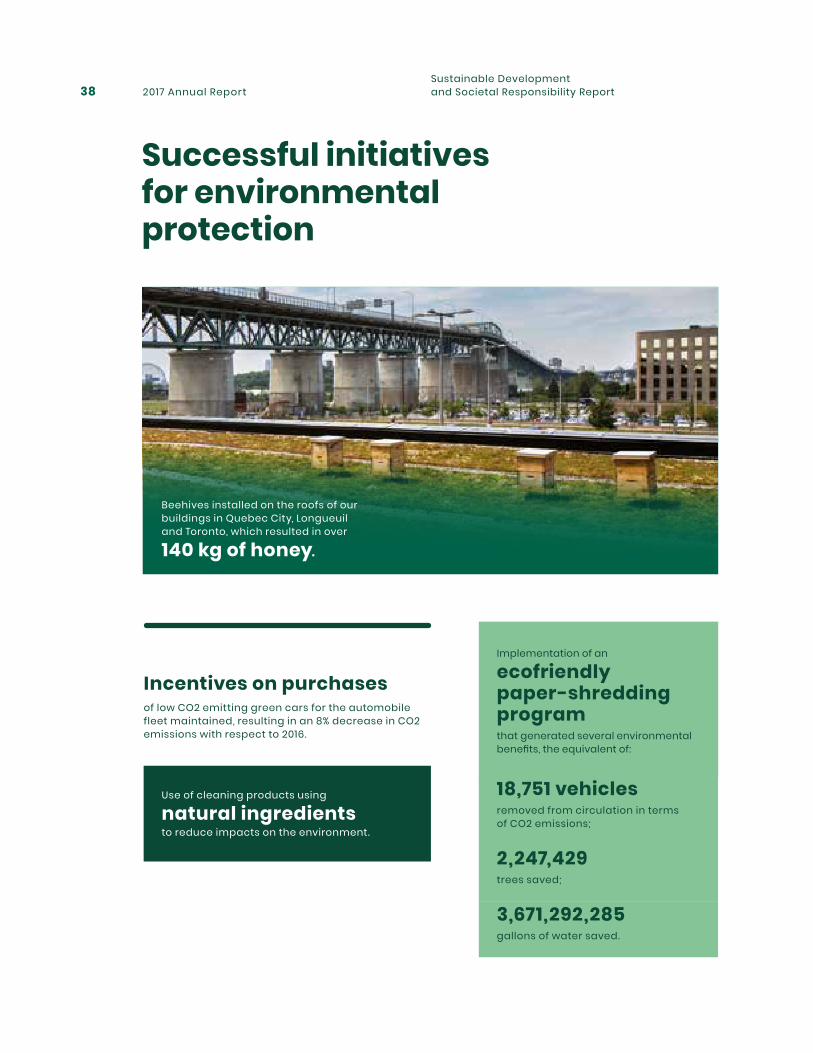
Successful initiatives for environmental protection
Incentives on purchases of low CO2 emitting green cars for the automobile fleet maintained, resulting in an 8% decrease in CO2 emissions with respect to 2016.
Use of cleaning products using
natural ingredients to reduce impacts on the environment.
Implementation of an
ecofriendly paper-shredding program that generated several environmental benefits, the equivalent of:
18,751 vehicles removed from circulation in terms of CO2 emissions;
2,247,429
trees saved;
3,671,292,285
gallons of water saved.
Beehives installed on the roofs of our buildings in Quebec City, Longueuil and Toronto, which resulted in over
140 kg of honey.
Sustainable Development and Societal Responsibility Report

2017 Annual Report 39
WE RECYCLE!
certification maintained.
2017
LEED® Gold Certification for the SSQ Tower in Longueuil.
Electrobac bins installed at the offices in Quebec City and Longueuil to recycle outdated electronic devices.
Sustainable Development and Societal Responsibility Report
2017 Annual Report40
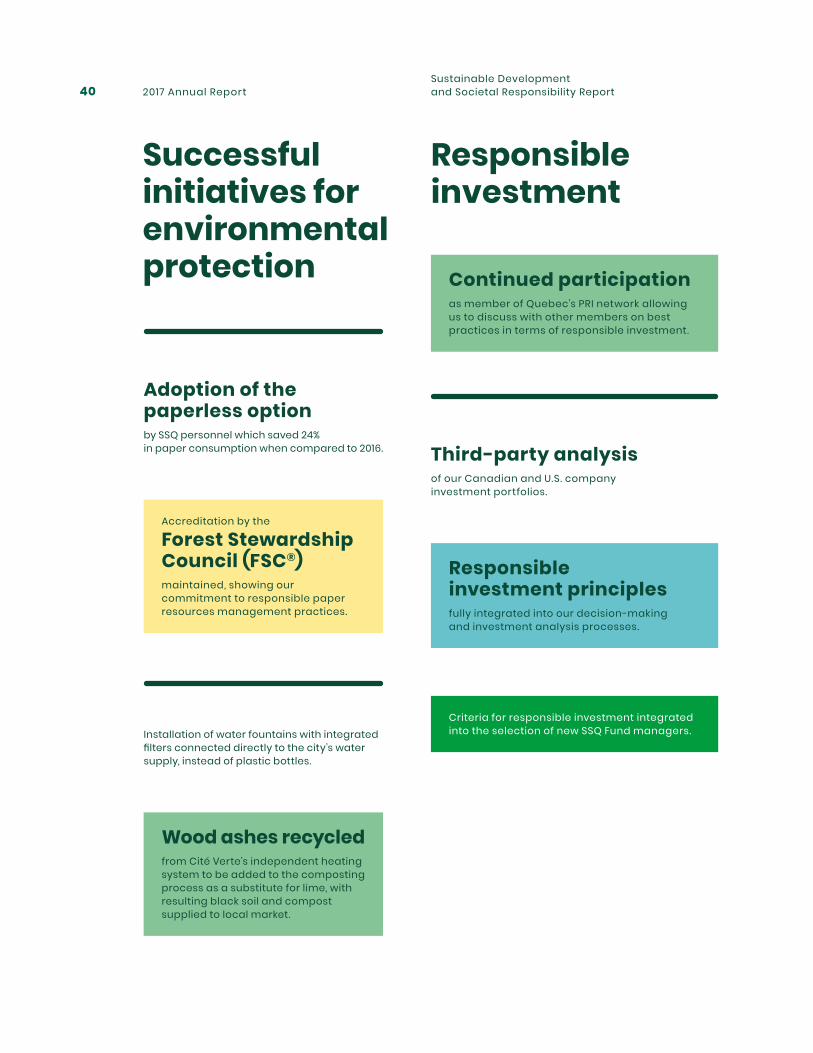
Installation of water fountains with integrated filters connected directly to the city’s water supply, instead of plastic bottles.
Successful initiatives for environmental protection
Responsible investment
Third-party analysis of our Canadian and U.S. company investment portfolios.
Criteria for responsible investment integrated into the selection of new SSQ Fund managers.
Continued participation as member of Quebec’s PRI network allowing us to discuss with other members on best practices in terms of responsible investment.
Adoption of the paperless option by SSQ personnel which saved 24% in paper consumption when compared to 2016.
Accreditation by the
Forest Stewardship Council (FSC®)
maintained, showing our commitment to responsible paper resources management practices.
Wood ashes recycled from Cité Verte’s independent heating system to be added to the composting process as a substitute for lime, with resulting black soil and compost supplied to local market.
Responsible investment principles fully integrated into our decision-making and investment analysis processes.
Sustainable Development and Societal Responsibility Report
2017 Annual Report 41
SSQ, Mutual Management CorporationConsolidated Financial Statements As at December 31, 2017
Together with Independent Auditor’s Report
2017 Annual Report42
Independent auditor’s report
1 CPA auditor, CA, public accountancy permit No. A119429
To the Members of SSQ, Mutual Management Corporation,
We have audited the accompanying consolidated financial statements of SSQ, MUTUAL MANAGEMENT CORPORATION , which comprise the consolidated statement of financial position as at December 31, 2017, and the consolidated statements of income, comprehensive income, changes in equity and cash flows for the year then ended, and a summary of significant accounting policies and other explanatory information.
Management’s Responsibility for the Consolidated Financial StatementsManagement is responsible for the preparation and fair presentation of these consolidated financial statements in accordance with International Financial Reporting Standards, and for such internal control as management determines is necessary to enable the preparation of consolidated financial statements that are free from material misstatement, whether due to fraud or error.
Auditor’s ResponsibilityOur responsibility is to express an opinion on these consolidated financial statements based on our audit. We conducted our audit in accordance with Canadian generally accepted auditing standards. Those standards require that we comply with
ethical requirements, and plan and perform the audit to obtain reasonable assurance about whether the consolidated financial statements are free from material misstatement.
An audit involves performing procedures to obtain audit evidence about the amounts and disclosures in the consolidated financial statements. The procedures selected depend on the auditor’s judgment, including the assessment of the risks of material misstatement of the consolidated financial statements, whether due to fraud or error. In making those risk assessments, the auditor considers internal control relevant to the Mutual’s preparation and fair presentation of the consolidated financial statements in order to design audit procedures that are appropriate in the circumstances, but not for the purpose of expressing an opinion on the effectiveness of the Mutual’s internal control. An audit also includes evaluating the appropriateness of accounting policies used and the reasonableness of accounting estimates made by management, as well as evaluating the overall presentation of the consolidated financial statements.
We believe that the audit evidence we have obtained is sufficient and appropriate to provide a basis for our audit opinion.
OpinionIn our opinion, the consolidated financial statements present fairly, in all material respects, the financial position of SSQ, Mutual Management Corporation as at December 31, 2017, and its financial performance and its cash flows for the year then ended in accordance with International Financial Reporting Standards.
Mallette L .L .P. Partnership of chartered professional accountants
Quebec, Canada February 27, 2018
SSQ, Mutual Management Corporation Consolidated Financial Statements
1
2017 Annual Report 43
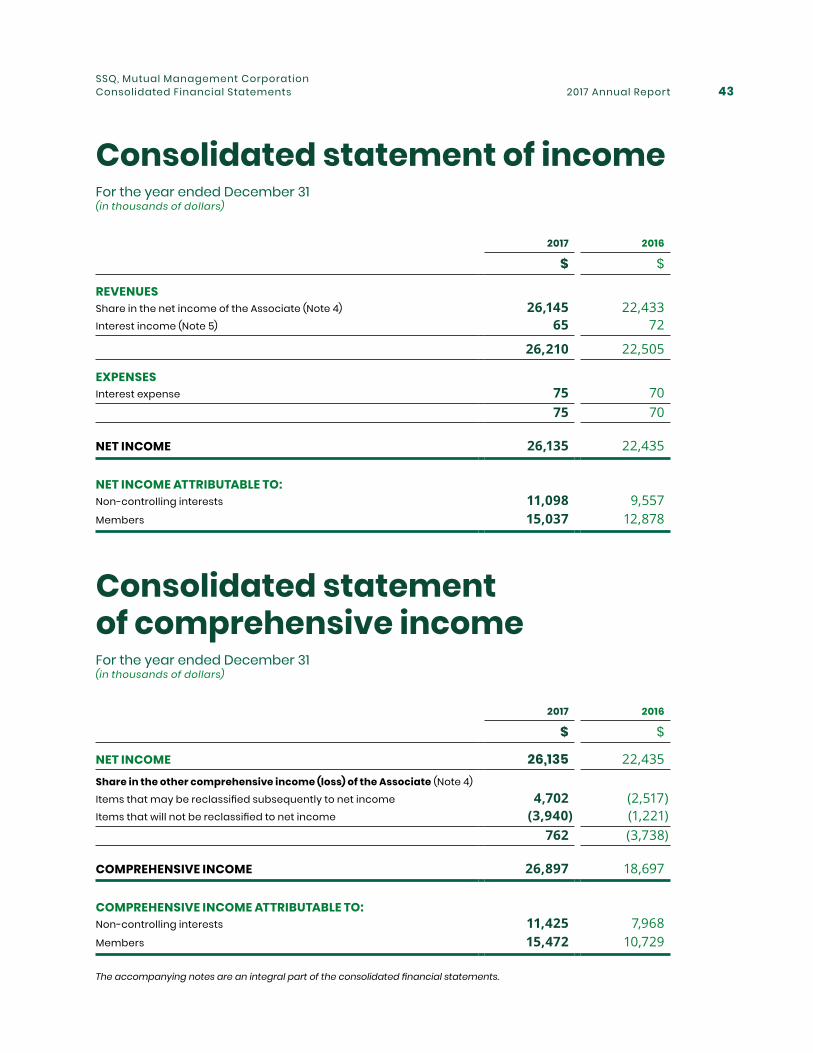
Consolidated statement of incomeFor the year ended December 31(in thousands of dollars)
2017 2016
$ $
REVENUESShare in the net income of the Associate (Note 4) 26,145 22,433 Interest income (Note 5) 65 72
26,210 22,505
EXPENSESInterest expense 75 70
75 70
NET INCOME 26,135 22,435
NET INCOME ATTRIBUTABLE TO:Non-controlling interests 11,098 9,557 Members 15,037 12,878
Consolidated statement of comprehensive incomeFor the year ended December 31(in thousands of dollars)
2017 2016
$ $
NET INCOME 26,135 22,435 Share in the other comprehensive income (loss) of the Associate (Note 4)Items that may be reclassified subsequently to net income 4,702 (2,517)Items that will not be reclassified to net income (3,940) (1,221)
762 (3,738)
COMPREHENSIVE INCOME 26,897 18,697
COMPREHENSIVE INCOME ATTRIBUTABLE TO:Non-controlling interests 11,425 7,968 Members 15,472 10,729
The accompanying notes are an integral part of the consolidated financial statements.
SSQ, Mutual Management Corporation Consolidated Financial Statements
2017 Annual Report44
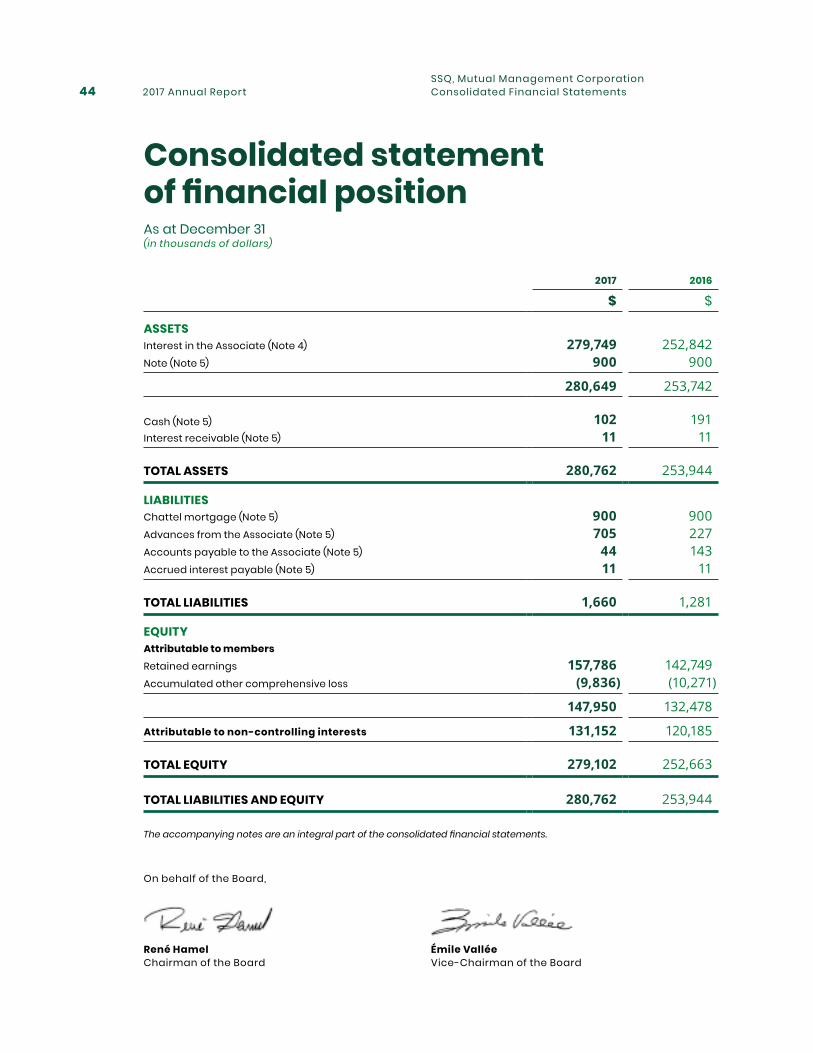
Consolidated statement of financial positionAs at December 31(in thousands of dollars)
2017 2016
$ $
ASSETSInterest in the Associate (Note 4) 279,749 252,842 Note (Note 5) 900 900
280,649 253,742
Cash (Note 5) 102 191 Interest receivable (Note 5) 11 11
TOTAL ASSETS 280,762 253,944
LIABILITIESChattel mortgage (Note 5) 900 900 Advances from the Associate (Note 5) 705 227 Accounts payable to the Associate (Note 5) 44 143 Accrued interest payable (Note 5) 11 11
TOTAL LIABILITIES 1,660 1,281
EQUITYAttributable to membersRetained earnings 157,786 142,749 Accumulated other comprehensive loss (9,836) (10,271)
147,950 132,478
Attributable to non-controlling interests 131,152 120,185
TOTAL EQUITY 279,102 252,663
TOTAL LIABILITIES AND EQUITY 280,762 253,944
The accompanying notes are an integral part of the consolidated financial statements.
On behalf of the Board,
Émile Vallée Vice-Chairman of the Board
René Hamel Chairman of the Board
SSQ, Mutual Management Corporation Consolidated Financial Statements
2017 Annual Report 45
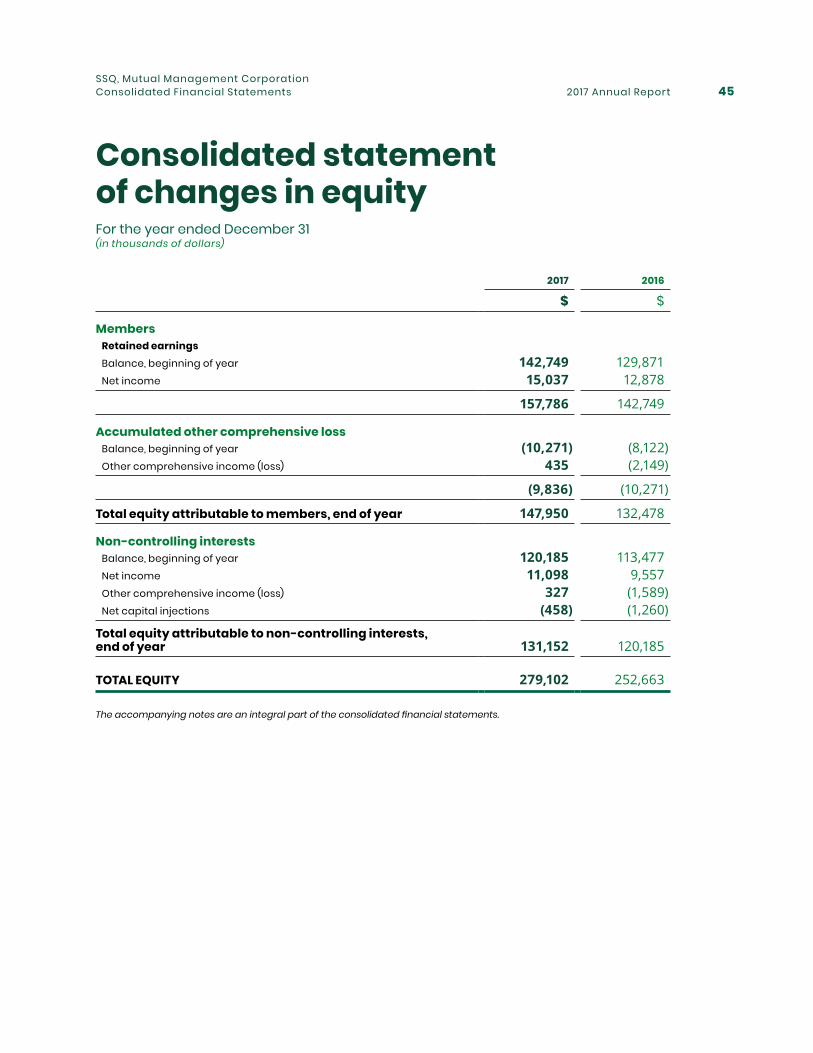
Consolidated statement of changes in equityFor the year ended December 31(in thousands of dollars)
2017 2016
$ $
Members Retained earnings Balance, beginning of year 142,749 129,871 Net income 15,037 12,878
157,786 142,749
Accumulated other comprehensive loss Balance, beginning of year (10,271) (8,122) Other comprehensive income (loss) 435 (2,149)
(9,836) (10,271)
Total equity attributable to members, end of year 147,950 132,478
Non-controlling interests Balance, beginning of year 120,185 113,477 Net income 11,098 9,557 Other comprehensive income (loss) 327 (1,589) Net capital injections (458) (1,260)
Total equity attributable to non-controlling interests, end of year 131,152 120,185
TOTAL EQUITY 279,102 252,663
The accompanying notes are an integral part of the consolidated financial statements.
SSQ, Mutual Management Corporation Consolidated Financial Statements
2017 Annual Report46
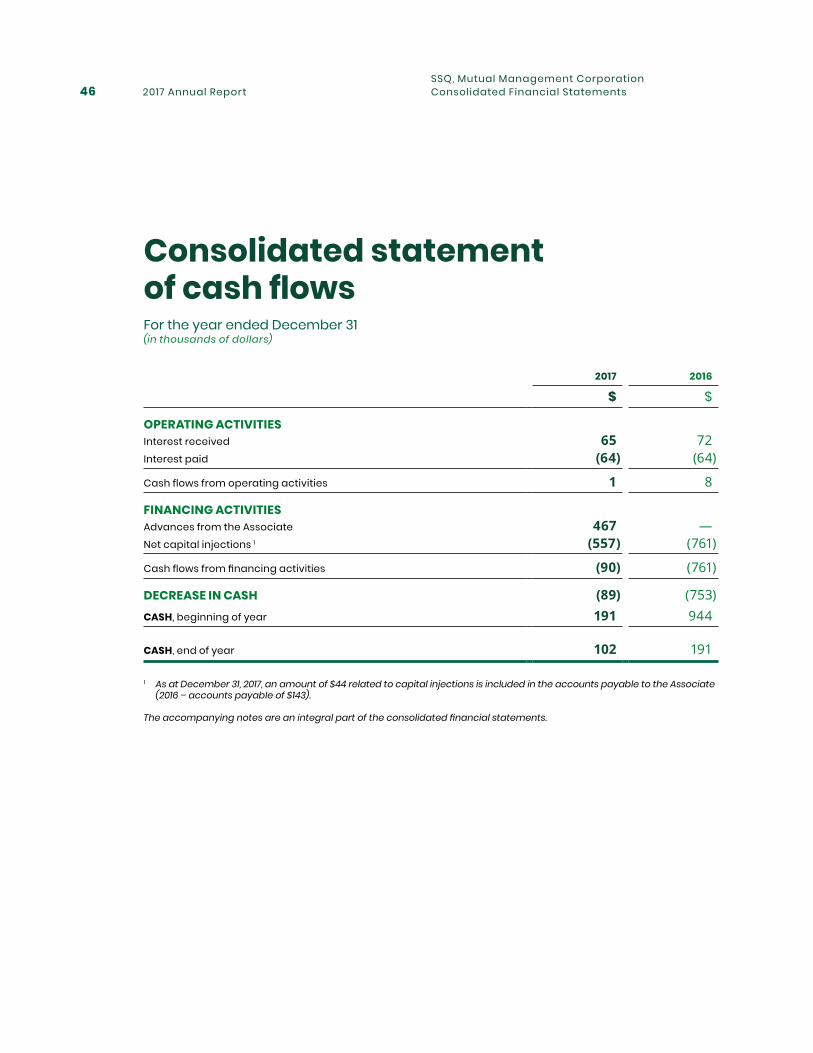
Consolidated statement of cash flowsFor the year ended December 31(in thousands of dollars)
2017 2016
$ $
OPERATING ACTIVITIESInterest received 65 72 Interest paid (64) (64)
Cash flows from operating activities 1 8
FINANCING ACTIVITIES Advances from the Associate 467 —Net capital injections 1 (557) (761)
Cash flows from financing activities (90) (761)
DECREASE IN CASH (89) (753)CASH, beginning of year 191 944
CASH, end of year 102 191
1 As at December 31, 2017, an amount of $44 related to capital injections is included in the accounts payable to the Associate (2016 – accounts payable of $143).
The accompanying notes are an integral part of the consolidated financial statements.
SSQ, Mutual Management Corporation Consolidated Financial Statements
2017 Annual Report 47
1. Governing statutes and nature of activities 482. Significant accounting policies 483. Changes in accounting policies 504. Interest in the Associate 515. Financial instruments 526. Financial instruments risk management 547. Capital management 558. Related party transactions 569. Interests in the Subsidiary 56
Notes to the consolidated financial statementsFor the year ended December 31, 2017
SSQ, Mutual Management Corporation Consolidated Financial Statements
2017 Annual Report48
1. Governing statutes and nature of activitiesSSQ, Mutual Management Corporation (the “Mutual”), was incorporated under the Act respecting Quebec Health Services. The Mutual’s main activity is to hold an investment in SSQ, Life Insurance Company Inc. (the “Associate”). The Mutual’s head office is located at 2525 Laurier Blvd., Quebec City, Quebec, Canada.
The Mutual’s consolidated financial statements were approved by the Board of Directors on February 27, 2018.
2. Significant accounting policiesPresentation of consolidated financial statements
The consolidated financial statements have been prepared in accordance with International Financial Reporting Standards ("IFRS"), as issued by the International Accounting Standards Board ("IASB"). The consolidated financial statements include the accounts of the Mutual and those of SSQ, Mutual Holding Inc. (the “Subsidiary”), owned at 57.60% (2016 – 57.43%), whose principal office is located in Quebec City, Quebec, Canada and which holds an investment in SSQ, Life Insurance Company Inc. The Mutual’s consolidated financial statements are presented in Canadian dollars, which correspond to its functional currency.
Notes to the consolidated financial statementsFor the year ended December 31, 2017(in thousands of dollars, unless otherwise indicated)
Use of estimates and Management’s judgments
The preparation of consolidated financial statements in accordance with IFRS requires Management to rely on the best estimates and assumptions that affect the reported amounts of assets and liabilities and disclosure of contingent assets and liabilities at the date of the consolidated financial statements as well as the reported amounts of revenues and expenses during the reporting year. Actual results may differ from these estimates. Those estimates are periodically reviewed and adjustments are made, if needed, to the year’s results in which they are known. Management uses its judgment to prepare the consolidated financial statements.
Revenue recognition
The share in the net income of the Associate is recognized when it is earned.
The interest income on the note is calculated using the effective interest rate method.
Interest in the Associate
The Mutual accounts for its 28.91% interest in the Associate using the equity method (2016 – 28.91%). Of this ownership interest, 16.65% (2016 – 16.60%) is attributable to members.
SSQ, Mutual Management Corporation Consolidated Financial Statements
2017 Annual Report 49
2. Significant accounting policies (cont’d)Financial instruments – classification and recognition
When financial instruments are initially recognized, the Mutual records them at their fair value. The subsequent measurement of financial instruments depends on their classification.
Financial instruments are classified based on their nature and the Mutual’s use of the financial instrument at the time of its initial recognition.
a) Note
Loans and receivables
The note to the Associate, which is classified as loans and receivables, is recognized at amortized cost using the effective interest rate method. The fair value disclosed for the note is determined by discounting the anticipated cash flows at the rate currently required by the market for this type of receivable and for a term corresponding to the maximum maturity date provided for the note.
b) Cash
Loans and receivables
Cash is made up of bank account balances held with financial institutions. It is classified as loans and receivables and is recognized at amortized cost using the effective interest rate method. Due to their short-term nature, the carrying amount of cash approximates its fair value.
c) Chattel mortgage
Other financial liabilities at amortized cost
The chattel mortgage is classified as other financial liabilities at amortized cost and valued at amortized cost using the effective interest rate method. The fair value of the chattel mortgage disclosed is measured using an expected discounted future cash flows model. The discount rate used corresponds to a rate of return of a benchmark index that has a similar risk profile as the underlying assets and a term matching the maximum term for the chattel mortgage.
d) Other financial assets and liabilities
Other financial assets and liabilities are recognized at amortized cost using the effective interest rate method and classified respectively as loans and receivables and other financial liabilities at amortized cost.
Financial instruments – impairment
A financial asset is impaired if there is objective evidence of impairment as a result of one or more loss events that occurred following the initial recognition and had an impact on the financial asset’s estimated future cash flows.
At the end of each financial reporting period, the Mutual determines whether there is any objective evidence that a financial asset has been impaired.
SSQ, Mutual Management Corporation Consolidated Financial Statements
NOTES TO THE CONSOLIDATED FINANCIAL STATEMENTS For the year ended December 31, 2017 (in thousands of dollars, unless otherwise indicated)
2017 Annual Report50
3. Changes in accounting policiesApplication of a new accounting standard
Statement of cash flows
In February 2016, the IASB issued narrow-scope amendments to IAS 7, “Statement of Cash Flows”, which require companies to provide disclosures on changes in liabilities in the financing section. The amendments are effective January 1 , 2017. The amendments to this standard had no impact on the Mutual’s consolidated financial statements.
New accounting standard not yet in effect
Financial instruments
In July 2014, the IASB issued IFRS 9, “Financial Instruments” ("IFRS 9"), which, effective January 1 , 2018, replaces IAS 39, “Financial Instruments: Recognition and Measurement”, regarding the classification and measurement of financial assets and liabilities, impairment and hedge accounting. The Mutual is currently assessing the impact of IFRS 9 on its consolidated financial statements. An amendment to IFRS 4, “Insurance Contracts”, issued by the IASB on September 12, 2016, sets out measures giving companies, whose business model is predominantly to issue insurance contracts, the option to defer the effective date of IFRS 9 to January 1 , 2021. This exemption remains valid with the issuance of IFRS 17, “Insurance Contracts”, in May 2017. The Associate, in which the Mutual holds an interest, is eligible for the deferral and plans to make use of it until the maximum permissible date. The amendment also sets out certain measures to allow investors that hold an investment in an associate able to use the deferral not to adjust the application of the equity method to make the associate accounting practices uniform with those of the investor, as would be required by IAS 28, “Investments in Associates and Joint Ventures”. The Mutual is eligible for this temporary exemption and plans to apply it until IFRS 9 comes into effect for the Associate.
NOTES TO THE CONSOLIDATED FINANCIAL STATEMENTS For the year ended December 31, 2017 (in thousands of dollars, unless otherwise indicated)
SSQ, Mutual Management Corporation Consolidated Financial Statements
2017 Annual Report 51
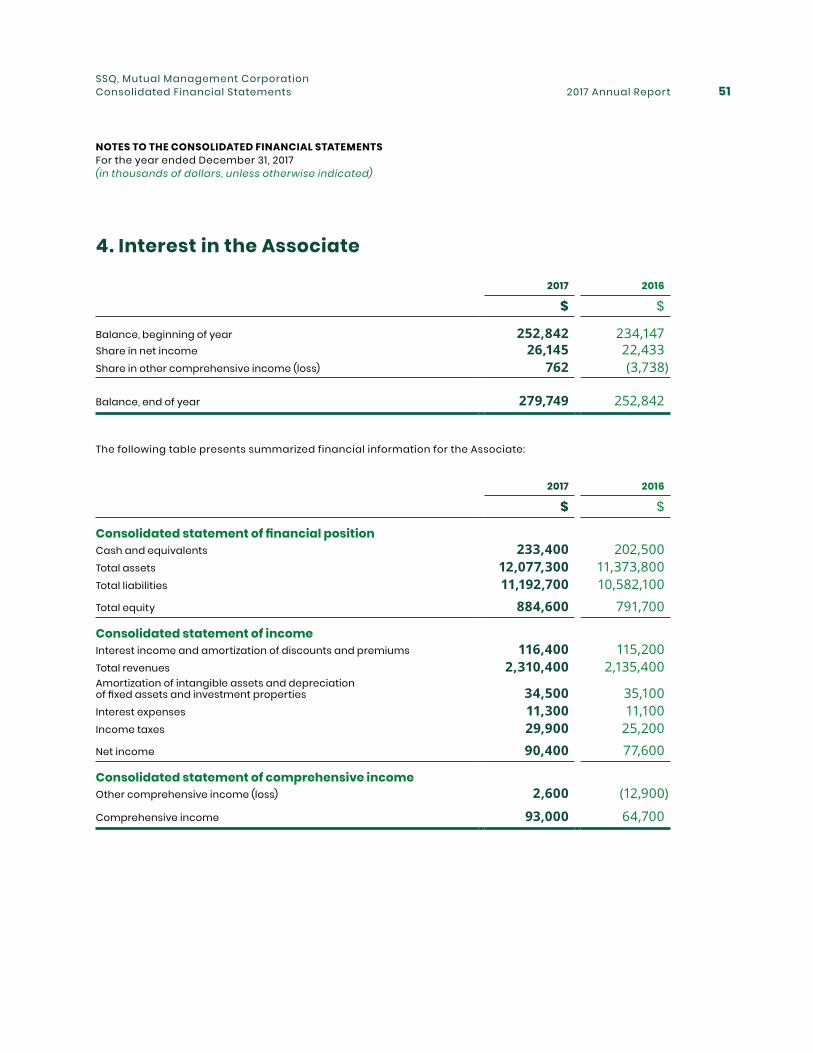
4. Interest in the Associate
NOTES TO THE CONSOLIDATED FINANCIAL STATEMENTS For the year ended December 31, 2017 (in thousands of dollars, unless otherwise indicated)
2017 2016
$ $
Balance, beginning of year 252,842 234,147 Share in net income 26,145 22,433 Share in other comprehensive income (loss) 762 (3,738)
Balance, end of year 279,749 252,842
The following table presents summarized financial information for the Associate:
2017 2016
$ $
Consolidated statement of financial positionCash and equivalents 233,400 202,500 Total assets 12,077,300 11,373,800 Total liabilities 11,192,700 10,582,100
Total equity 884,600 791,700
Consolidated statement of incomeInterest income and amortization of discounts and premiums 116,400 115,200 Total revenues 2,310,400 2,135,400Amortization of intangible assets and depreciation of fixed assets and investment properties 34,500 35,100 Interest expenses 11,300 11,100 Income taxes 29,900 25,200
Net income 90,400 77,600
Consolidated statement of comprehensive incomeOther comprehensive income (loss) 2,600 (12,900)
Comprehensive income 93,000 64,700
SSQ, Mutual Management Corporation Consolidated Financial Statements
2017 Annual Report52
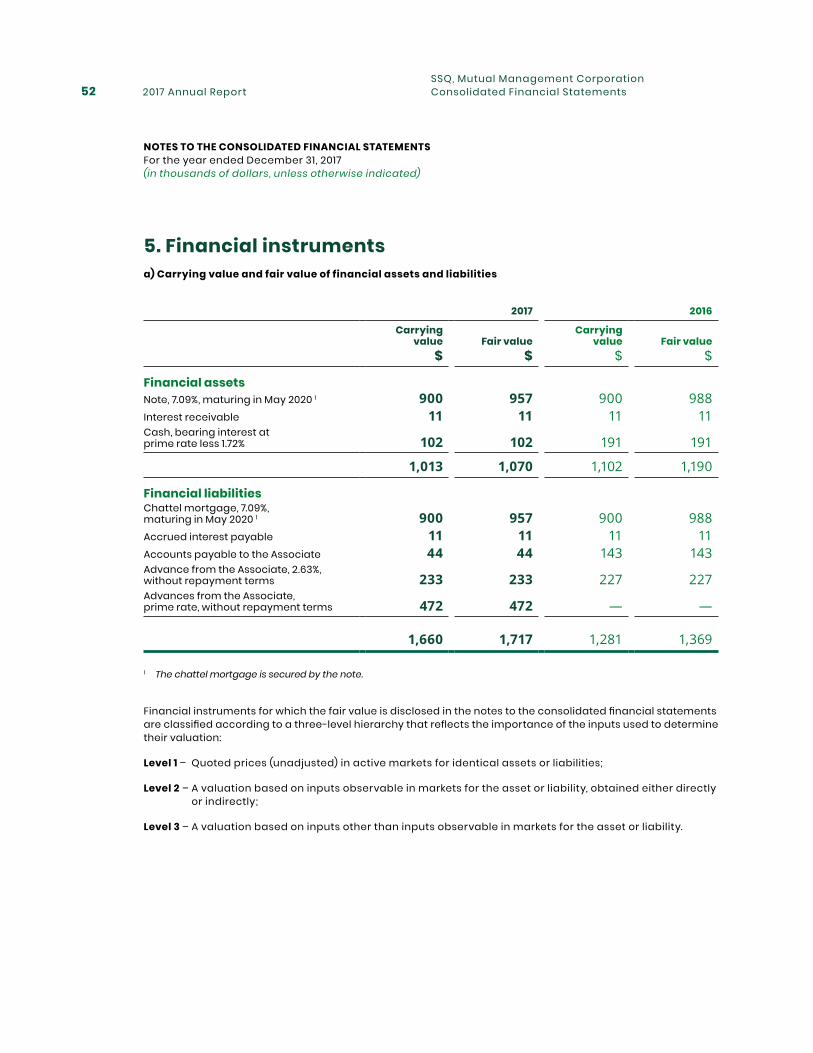
5. Financial instrumentsa) Carrying value and fair value of financial assets and liabilities
2017 2016
Carrying value Fair value
Carrying value Fair value
$ $ $ $
Financial assetsNote, 7.09%, maturing in May 2020 1 900 957 900 988 Interest receivable 11 11 11 11 Cash, bearing interest at prime rate less 1.72% 102 102 191 191
1,013 1,070 1,102 1,190
Financial liabilitiesChattel mortgage, 7.09%, maturing in May 2020 1 900 957 900 988 Accrued interest payable 11 11 11 11 Accounts payable to the Associate 44 44 143 143 Advance from the Associate, 2.63%, without repayment terms 233 233 227 227 Advances from the Associate, prime rate, without repayment terms 472 472 — —
1,660 1,717 1,281 1,369
1 The chattel mortgage is secured by the note.
Financial instruments for which the fair value is disclosed in the notes to the consolidated financial statements are classified according to a three-level hierarchy that reflects the importance of the inputs used to determine their valuation:
Level 1 – Quoted prices (unadjusted) in active markets for identical assets or liabilities;
Level 2 – A valuation based on inputs observable in markets for the asset or liability, obtained either directly or indirectly;
Level 3 – A valuation based on inputs other than inputs observable in markets for the asset or liability.
SSQ, Mutual Management Corporation Consolidated Financial Statements
NOTES TO THE CONSOLIDATED FINANCIAL STATEMENTS For the year ended December 31, 2017 (in thousands of dollars, unless otherwise indicated)
2017 Annual Report 53
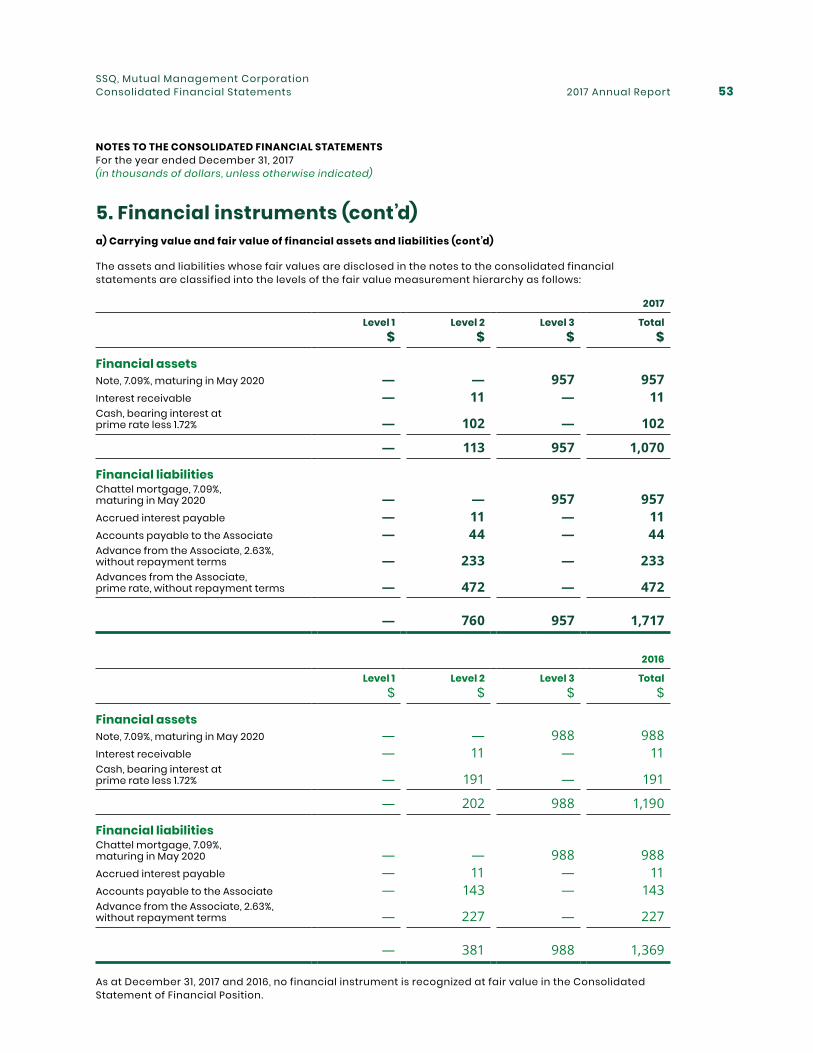
5. Financial instruments (cont’d)a) Carrying value and fair value of financial assets and liabilities (cont’d)
The assets and liabilities whose fair values are disclosed in the notes to the consolidated financial statements are classified into the levels of the fair value measurement hierarchy as follows:
2017
Level 1 Level 2 Level 3 Total$ $ $ $
Financial assetsNote, 7.09%, maturing in May 2020 — — 957 957 Interest receivable — 11 — 11 Cash, bearing interest at prime rate less 1.72% — 102 — 102
— 113 957 1,070
Financial liabilitiesChattel mortgage, 7.09%, maturing in May 2020 — — 957 957 Accrued interest payable — 11 — 11 Accounts payable to the Associate — 44 — 44 Advance from the Associate, 2.63%, without repayment terms — 233 — 233 Advances from the Associate, prime rate, without repayment terms — 472 — 472
— 760 957 1,717
2016
Level 1 Level 2 Level 3 Total$ $ $ $
Financial assetsNote, 7.09%, maturing in May 2020 — — 988 988 Interest receivable — 11 — 11 Cash, bearing interest at prime rate less 1.72% — 191 — 191
— 202 988 1,190
Financial liabilitiesChattel mortgage, 7.09%, maturing in May 2020 — — 988 988 Accrued interest payable — 11 — 11 Accounts payable to the Associate — 143 — 143 Advance from the Associate, 2.63%, without repayment terms — 227 — 227
— 381 988 1,369
As at December 31, 2017 and 2016, no financial instrument is recognized at fair value in the Consolidated Statement of Financial Position.
SSQ, Mutual Management Corporation Consolidated Financial Statements
NOTES TO THE CONSOLIDATED FINANCIAL STATEMENTS For the year ended December 31, 2017 (in thousands of dollars, unless otherwise indicated)
2017 Annual Report54
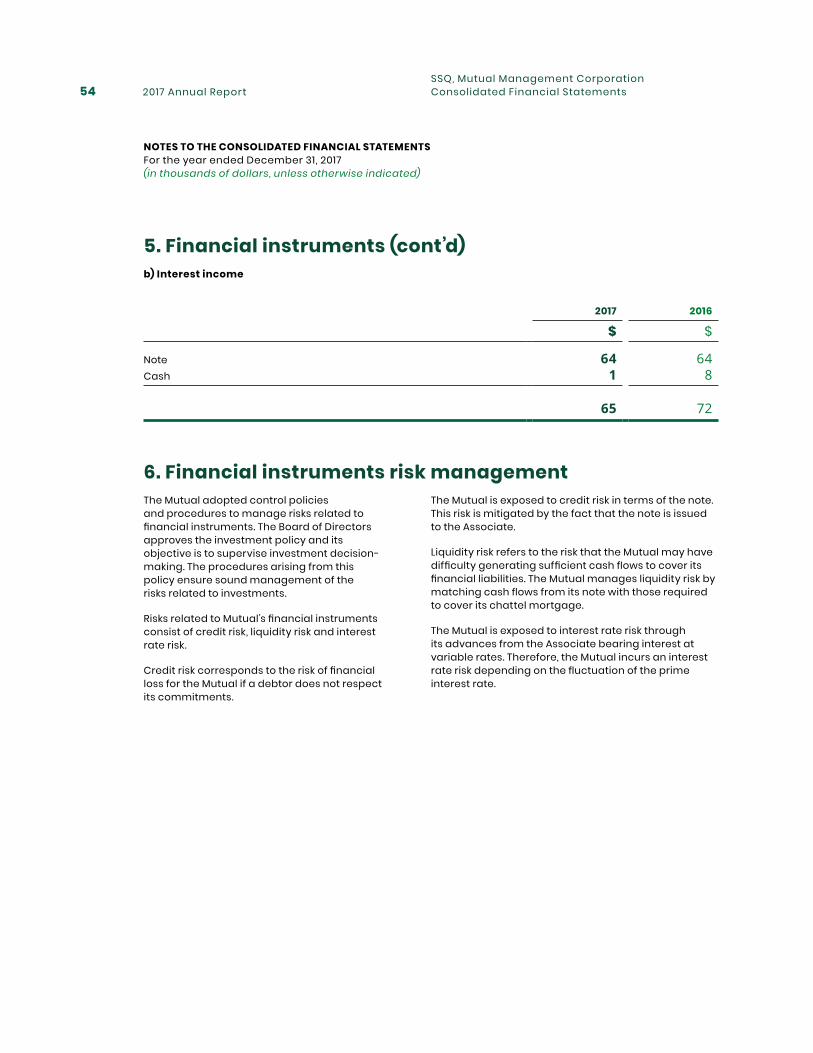
5. Financial instruments (cont’d)b) Interest income
2017 2016
$ $
Note 64 64 Cash 1 8
65 72
6. Financial instruments risk managementThe Mutual is exposed to credit risk in terms of the note. This risk is mitigated by the fact that the note is issued to the Associate.
Liquidity risk refers to the risk that the Mutual may have difficulty generating sufficient cash flows to cover its financial liabilities. The Mutual manages liquidity risk by matching cash flows from its note with those required to cover its chattel mortgage.
The Mutual is exposed to interest rate risk through its advances from the Associate bearing interest at variable rates. Therefore, the Mutual incurs an interest rate risk depending on the fluctuation of the prime interest rate.
The Mutual adopted control policies and procedures to manage risks related to financial instruments. The Board of Directors approves the investment policy and its objective is to supervise investment decision-making. The procedures arising from this policy ensure sound management of the risks related to investments.
Risks related to Mutual’s financial instruments consist of credit risk, liquidity risk and interest rate risk.
Credit risk corresponds to the risk of financial loss for the Mutual if a debtor does not respect its commitments.
SSQ, Mutual Management Corporation Consolidated Financial Statements
NOTES TO THE CONSOLIDATED FINANCIAL STATEMENTS For the year ended December 31, 2017 (in thousands of dollars, unless otherwise indicated)
2017 Annual Report 55
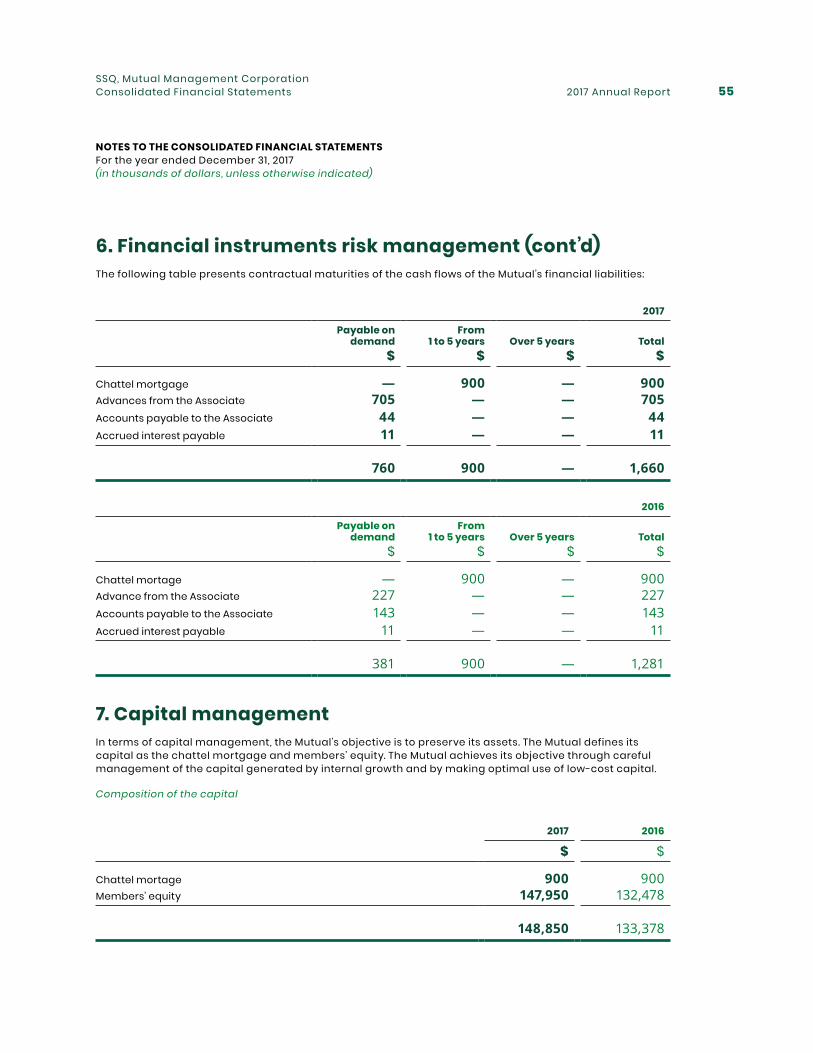
2017
Payable on demand
From 1 to 5 years Over 5 years Total
$ $ $ $
Chattel mortgage — 900 — 900 Advances from the Associate 705 — — 705 Accounts payable to the Associate 44 — — 44 Accrued interest payable 11 — — 11
760 900 — 1,660
2016
Payable on demand
From 1 to 5 years Over 5 years Total
$ $ $ $
Chattel mortage — 900 — 900 Advance from the Associate 227 — — 227 Accounts payable to the Associate 143 — — 143 Accrued interest payable 11 — — 11
381 900 — 1,281
7. Capital managementIn terms of capital management, the Mutual’s objective is to preserve its assets. The Mutual defines its capital as the chattel mortgage and members’ equity. The Mutual achieves its objective through careful management of the capital generated by internal growth and by making optimal use of low-cost capital.
Composition of the capital
2017 2016
$ $
Chattel mortage 900 900 Members’ equity 147,950 132,478
148,850 133,378
6. Financial instruments risk management (cont’d)The following table presents contractual maturities of the cash flows of the Mutual’s financial liabilities:
SSQ, Mutual Management Corporation Consolidated Financial Statements
NOTES TO THE CONSOLIDATED FINANCIAL STATEMENTS For the year ended December 31, 2017 (in thousands of dollars, unless otherwise indicated)
2017 Annual Report56
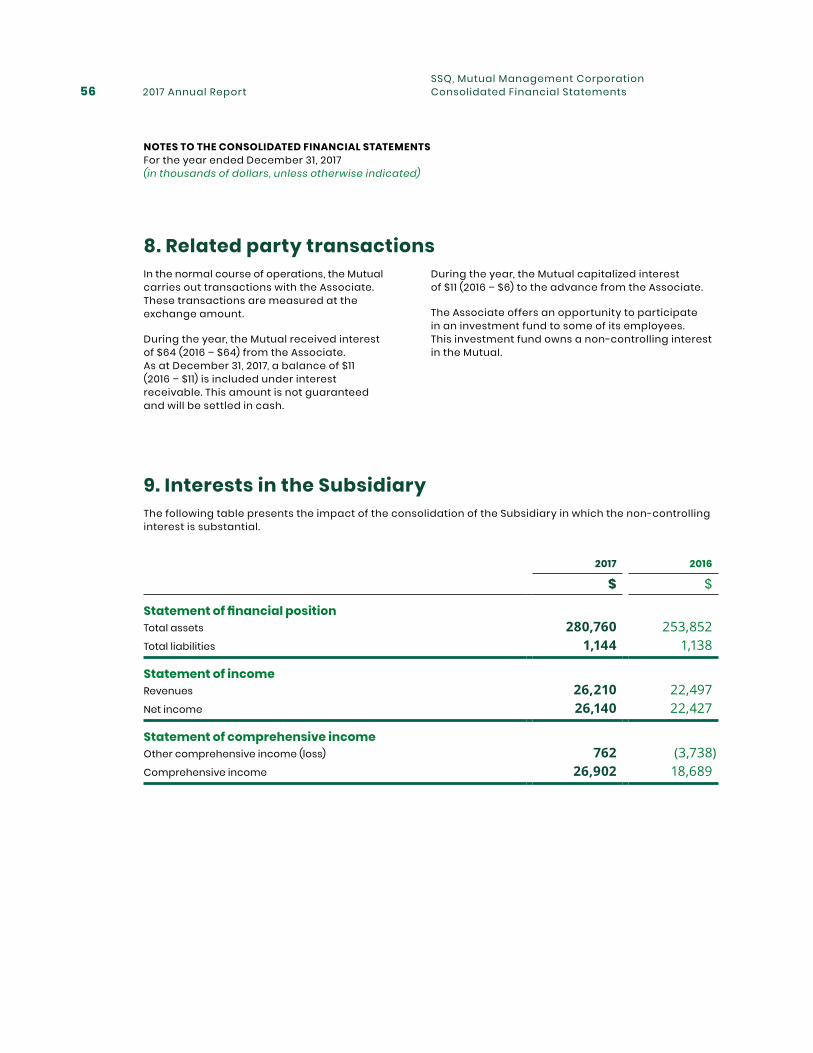
9. Interests in the SubsidiaryThe following table presents the impact of the consolidation of the Subsidiary in which the non-controlling interest is substantial.
8. Related party transactionsDuring the year, the Mutual capitalized interest of $11 (2016 – $6) to the advance from the Associate.
The Associate offers an opportunity to participate in an investment fund to some of its employees. This investment fund owns a non-controlling interest in the Mutual.
In the normal course of operations, the Mutual carries out transactions with the Associate. These transactions are measured at the exchange amount.
During the year, the Mutual received interest of $64 (2016 – $64) from the Associate. As at December 31, 2017, a balance of $11 (2016 – $11) is included under interest receivable. This amount is not guaranteed and will be settled in cash.
SSQ, Mutual Management Corporation Consolidated Financial Statements
NOTES TO THE CONSOLIDATED FINANCIAL STATEMENTS For the year ended December 31, 2017 (in thousands of dollars, unless otherwise indicated)
2017 2016
$ $
Statement of financial positionTotal assets 280,760 253,852 Total liabilities 1,144 1,138
Statement of incomeRevenues 26,210 22,497 Net income 26,140 22,427
Statement of comprehensive incomeOther comprehensive income (loss) 762 (3,738)Comprehensive income 26,902 18,689
2017 Annual Report 57
SSQ, Life Insurance Company Inc.Consolidated Financial Statements As at December 31, 2017
Together with Independent Auditor’s Report
2017 Annual Report58SSQ, Life Insurance Company Inc.Consolidated Financial Statements
Independent auditor’s report
To the Shareholders of SSQ, Life Insurance Company Inc.,
We have audited the accompanying consolidated financial statements of SSQ, LIFE INSURANCE COMPANY INC. , which comprise the consolidated statement of financial position as at December 31, 2017, and the consolidated statements of income, comprehensive income, changes in equity and cash flows for the year then ended and a summary of significant accounting policies and other explanatory information.
Management’s Responsibility for the Consolidated Financial StatementsManagement is responsible for the preparation and fair presentation of these consolidated financial statements in accordance with International Financial Reporting Standards, and for such internal control as management determines is necessary to enable the preparation of consolidated financial statements that are free from material misstatement, whether due to fraud or error.
Auditor’s ResponsibilityOur responsibility is to express an opinion on these consolidated financial statements based on our audit. We conducted our audit in accordance with Canadian generally accepted auditing standards.
Those standards require that we comply with ethical requirements, and plan and perform the audit to obtain reasonable assurance about whether the consolidated financial statements are free from material misstatement.
An audit involves performing procedures to obtain audit evidence about the amounts and disclosures in the consolidated financial statements. The procedures selected depend on the auditor’s judgment, including the assessment of the risks of material misstatement of the consolidated financial statements, whether due to fraud or error. In making those risk assessments, the auditor considers internal control relevant to the Company’s preparation and fair presentation of the consolidated financial statements in order to design audit procedures that are appropriate in the circumstances, but not for the purpose of expressing an opinion on the effectiveness of the Company’s internal control. An audit also includes evaluating the appropriateness of accounting policies used and the reasonableness of accounting estimates made by management, as well as evaluating the overall presentation of the consolidated financial statements.
We believe that the audit evidence we have obtained is sufficient and appropriate to provide a basis for our audit opinion.
OpinionIn our opinion, the consolidated financial statements present fairly, in all material respects, the financial position of SSQ, Life Insurance Company Inc. as at December 31, 2017, and its financial performance and its cash flows for the year then ended in accordance with International Financial Reporting Standards.
Mallette L .L .P. Partnership of chartered professional accountants
Quebec, Canada February 27, 2018
1 CPA auditor, CA, public accountancy permit No. A119429
1
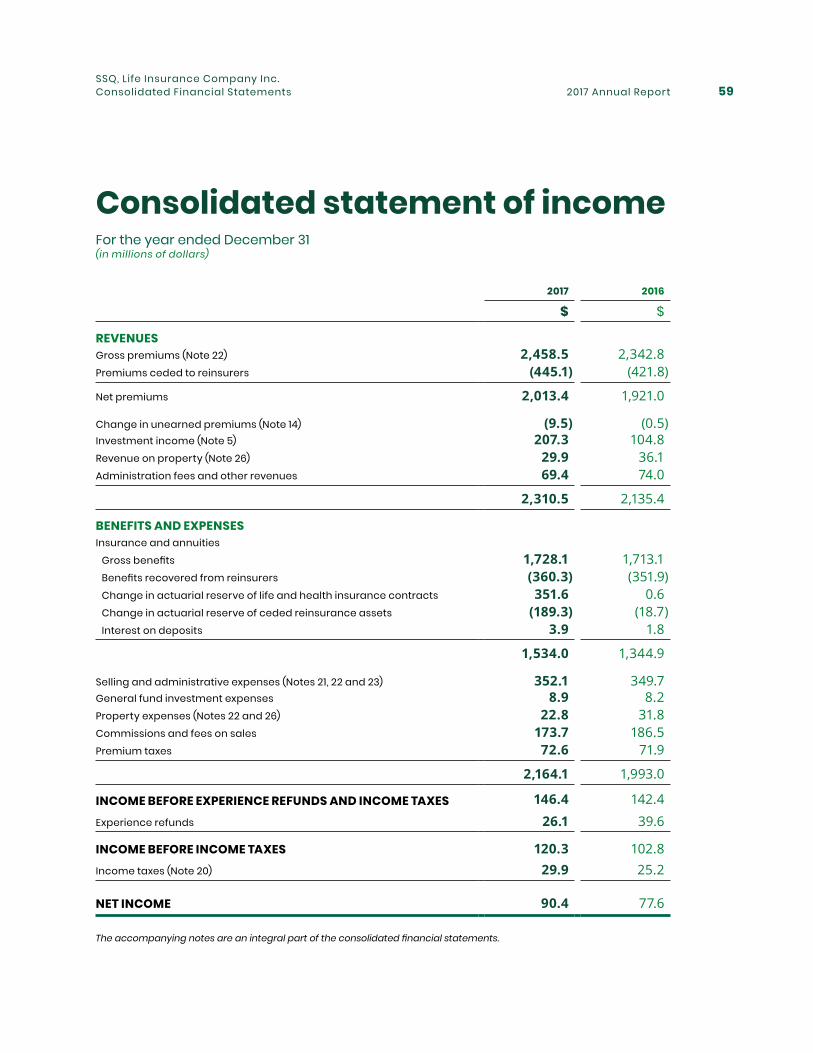
2017 Annual Report 59SSQ, Life Insurance Company Inc.Consolidated Financial Statements
Consolidated statement of incomeFor the year ended December 31(in millions of dollars)
2017 2016
$ $
REVENUESGross premiums (Note 22) 2,458.5 2,342.8 Premiums ceded to reinsurers (445.1) (421.8)
Net premiums 2,013.4 1,921.0
Change in unearned premiums (Note 14) (9.5) (0.5)Investment income (Note 5) 207.3 104.8 Revenue on property (Note 26) 29.9 36.1 Administration fees and other revenues 69.4 74.0
2,310.5 2,135.4
BENEFITS AND EXPENSESInsurance and annuities Gross benefits 1,728.1 1,713.1 Benefits recovered from reinsurers (360.3) (351.9) Change in actuarial reserve of life and health insurance contracts 351.6 0.6 Change in actuarial reserve of ceded reinsurance assets (189.3) (18.7) Interest on deposits 3.9 1.8
1,534.0 1,344.9
Selling and administrative expenses (Notes 21, 22 and 23) 352.1 349.7General fund investment expenses 8.9 8.2Property expenses (Notes 22 and 26) 22.8 31.8Commissions and fees on sales 173.7 186.5Premium taxes 72.6 71.9
2,164.1 1,993.0
INCOME BEFORE EXPERIENCE REFUNDS AND INCOME TAXES 146.4 142.4
Experience refunds 26.1 39.6
INCOME BEFORE INCOME TAXES 120.3 102.8Income taxes (Note 20) 29.9 25.2
NET INCOME 90.4 77.6
The accompanying notes are an integral part of the consolidated financial statements.
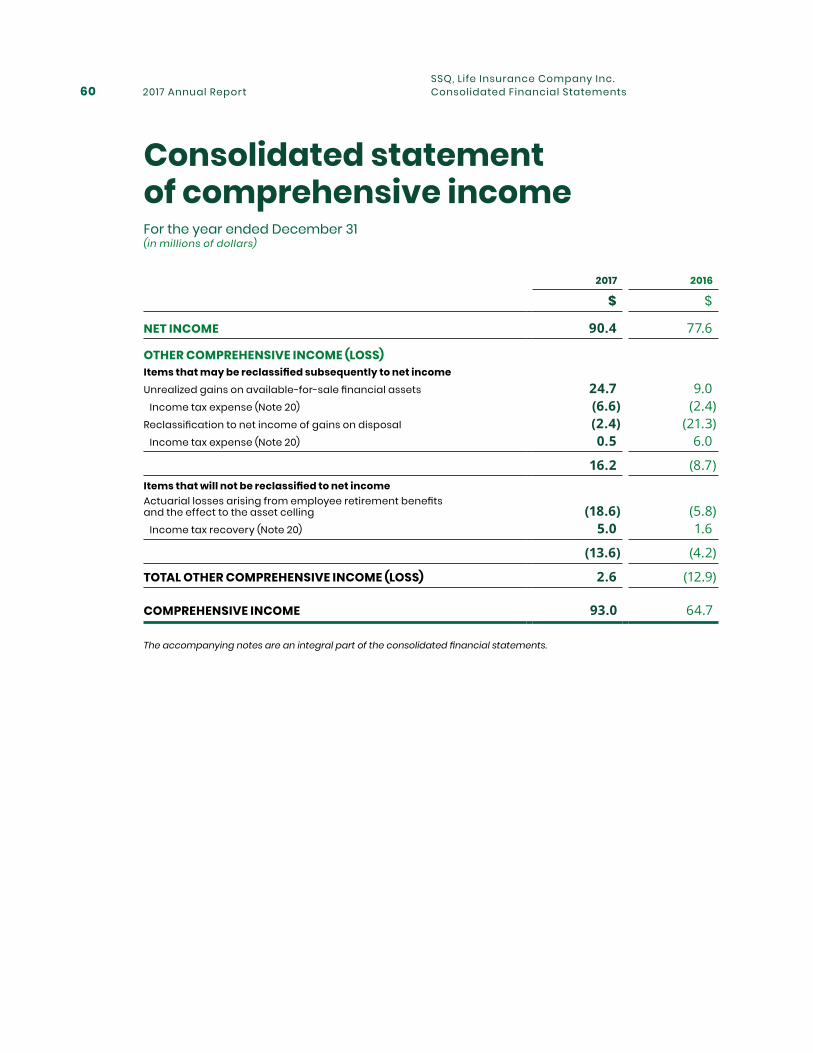
2017 Annual Report60SSQ, Life Insurance Company Inc.Consolidated Financial Statements
Consolidated statement of comprehensive incomeFor the year ended December 31 (in millions of dollars)
2017 2016
$ $
NET INCOME 90.4 77.6
OTHER COMPREHENSIVE INCOME (LOSS) Items that may be reclassified subsequently to net incomeUnrealized gains on available-for-sale financial assets 24.7 9.0 Income tax expense (Note 20) (6.6) (2.4)Reclassification to net income of gains on disposal (2.4) (21.3) Income tax expense (Note 20) 0.5 6.0
16.2 (8.7)Items that will not be reclassified to net incomeActuarial losses arising from employee retirement benefits and the effect to the asset celling (18.6) (5.8) Income tax recovery (Note 20) 5.0 1.6
(13.6) (4.2)
TOTAL OTHER COMPREHENSIVE INCOME (LOSS) 2.6 (12.9)
COMPREHENSIVE INCOME 93.0 64.7
The accompanying notes are an integral part of the consolidated financial statements.
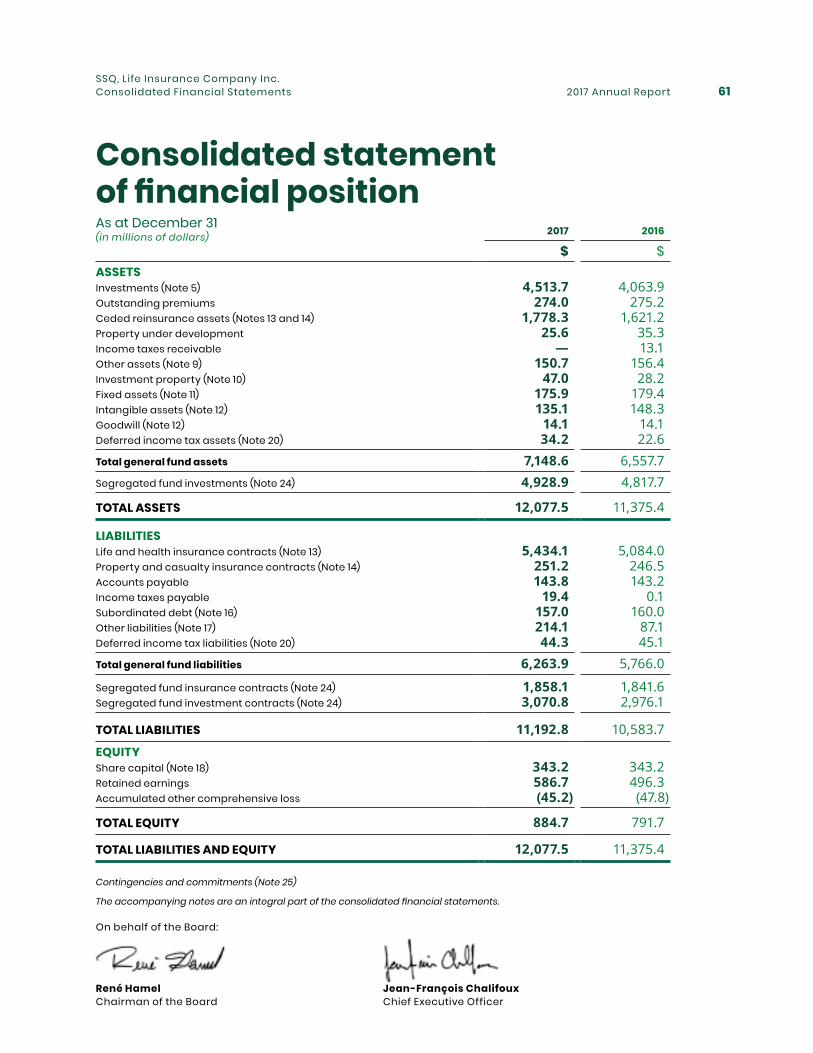
2017 Annual Report 61SSQ, Life Insurance Company Inc.Consolidated Financial Statements
Consolidated statement of financial positionAs at December 31 (in millions of dollars)
On behalf of the Board:
Jean-François Chalifoux Chief Executive Officer
René Hamel Chairman of the Board
2017 2016
$ $ASSETSInvestments (Note 5) 4,513.7 4,063.9Outstanding premiums 274.0 275.2Ceded reinsurance assets (Notes 13 and 14) 1,778.3 1,621.2Property under development 25.6 35.3Income taxes receivable — 13.1Other assets (Note 9) 150.7 156.4Investment property (Note 10) 47.0 28.2Fixed assets (Note 11) 175.9 179.4Intangible assets (Note 12) 135.1 148.3Goodwill (Note 12) 14.1 14.1Deferred income tax assets (Note 20) 34.2 22.6Total general fund assets 7,148.6 6,557.7Segregated fund investments (Note 24) 4,928.9 4,817.7
TOTAL ASSETS 12,077.5 11,375.4
LIABILITIESLife and health insurance contracts (Note 13) 5,434.1 5,084.0Property and casualty insurance contracts (Note 14) 251.2 246.5Accounts payable 143.8 143.2Income taxes payable 19.4 0.1Subordinated debt (Note 16) 157.0 160.0Other liabilities (Note 17) 214.1 87.1Deferred income tax liabilities (Note 20) 44.3 45.1Total general fund liabilities 6,263.9 5,766.0
Segregated fund insurance contracts (Note 24) 1,858.1 1,841.6Segregated fund investment contracts (Note 24) 3,070.8 2,976.1
TOTAL LIABILITIES 11,192.8 10,583.7
EQUITYShare capital (Note 18) 343.2 343.2Retained earnings 586.7 496.3Accumulated other comprehensive loss (45.2) (47.8)
TOTAL EQUITY 884.7 791.7
TOTAL LIABILITIES AND EQUITY 12,077.5 11,375.4
Contingencies and commitments (Note 25)
The accompanying notes are an integral part of the consolidated financial statements.
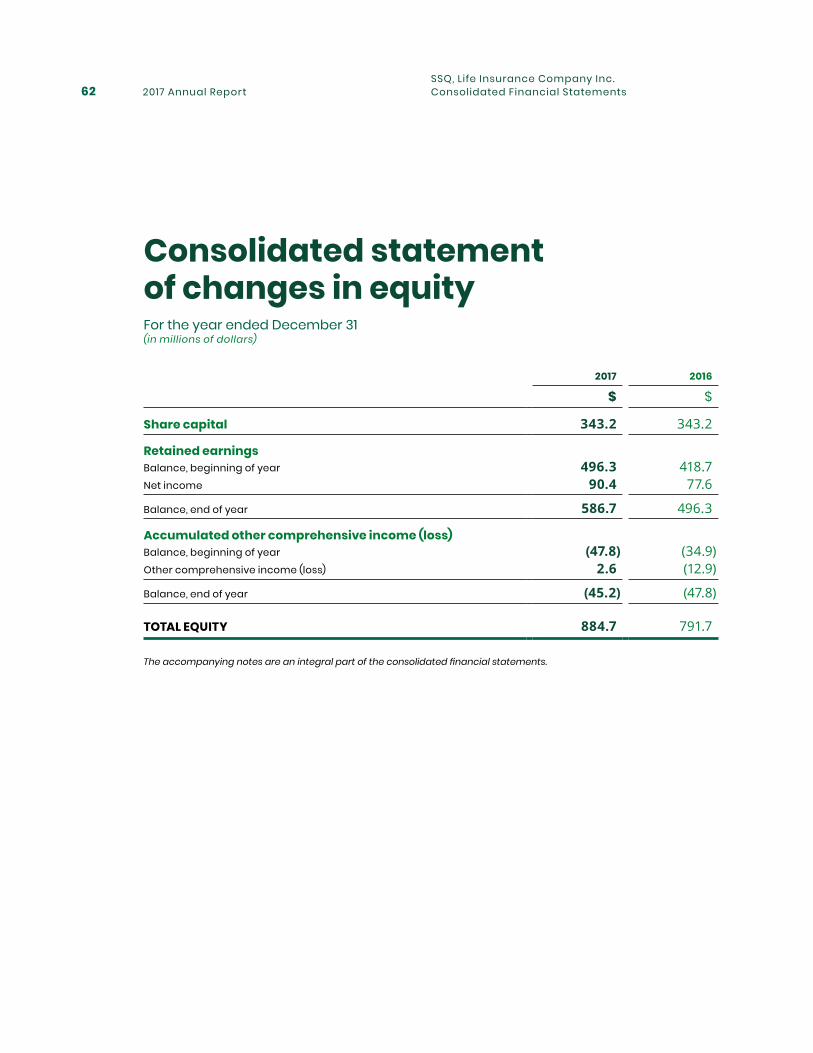
2017 Annual Report62SSQ, Life Insurance Company Inc.Consolidated Financial Statements
Consolidated statement of changes in equityFor the year ended December 31(in millions of dollars)
2017 2016
$ $
Share capital 343.2 343.2
Retained earningsBalance, beginning of year 496.3 418.7Net income 90.4 77.6
Balance, end of year 586.7 496.3
Accumulated other comprehensive income (loss)Balance, beginning of year (47.8) (34.9)Other comprehensive income (loss) 2.6 (12.9)
Balance, end of year (45.2) (47.8)
TOTAL EQUITY 884.7 791.7
The accompanying notes are an integral part of the consolidated financial statements.
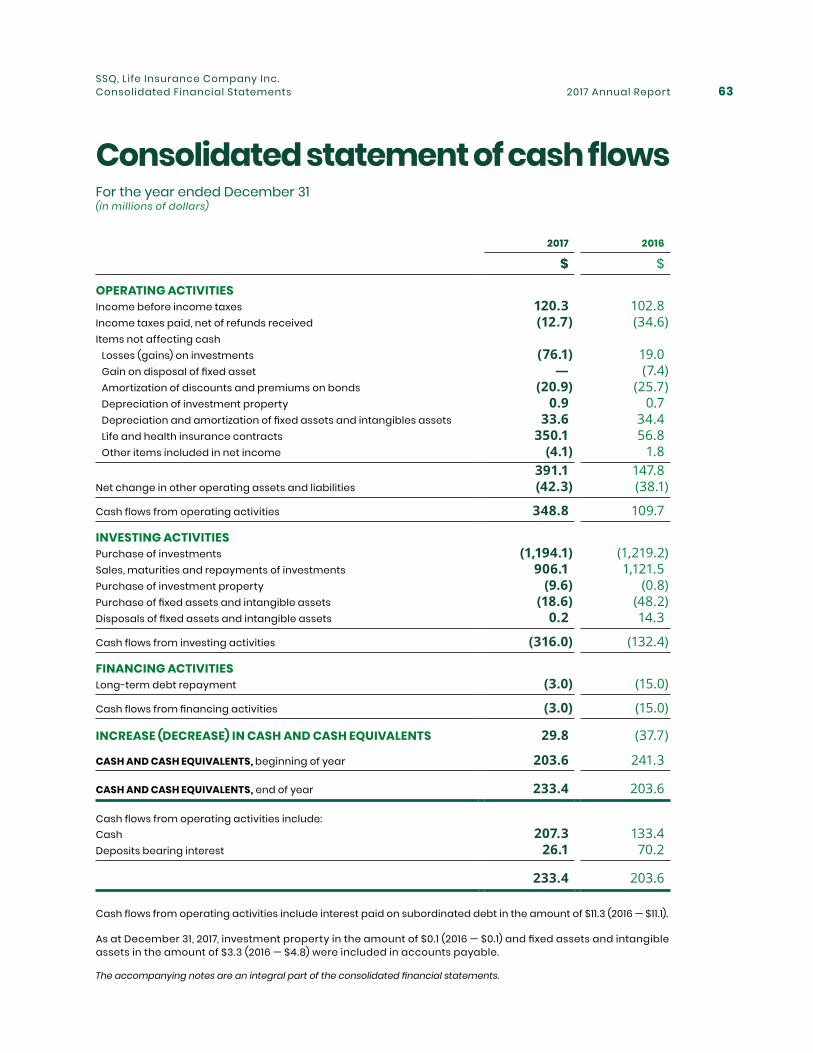
2017 Annual Report 63SSQ, Life Insurance Company Inc.Consolidated Financial Statements
Consolidated statement of cash flowsFor the year ended December 31(in millions of dollars)
2017 2016
$ $
OPERATING ACTIVITIESIncome before income taxes 120.3 102.8Income taxes paid, net of refunds received (12.7) (34.6)Items not affecting cash Losses (gains) on investments (76.1) 19.0 Gain on disposal of fixed asset — (7.4) Amortization of discounts and premiums on bonds (20.9) (25.7) Depreciation of investment property 0.9 0.7 Depreciation and amortization of fixed assets and intangibles assets 33.6 34.4 Life and health insurance contracts 350.1 56.8 Other items included in net income (4.1) 1.8
391.1 147.8Net change in other operating assets and liabilities (42.3) (38.1)
Cash flows from operating activities 348.8 109.7
INVESTING ACTIVITIESPurchase of investments (1,194.1) (1,219.2)Sales, maturities and repayments of investments 906.1 1,121.5Purchase of investment property (9.6) (0.8)Purchase of fixed assets and intangible assets (18.6) (48.2)Disposals of fixed assets and intangible assets 0.2 14.3
Cash flows from investing activities (316.0) (132.4)
FINANCING ACTIVITIES Long-term debt repayment (3.0) (15.0)
Cash flows from financing activities (3.0) (15.0)
INCREASE (DECREASE) IN CASH AND CASH EQUIVALENTS 29.8 (37.7)
CASH AND CASH EQUIVALENTS, beginning of year 203.6 241.3
CASH AND CASH EQUIVALENTS, end of year 233.4 203.6
Cash flows from operating activities include: Cash 207.3 133.4Deposits bearing interest 26.1 70.2
233.4 203.6
Cash flows from operating activities include interest paid on subordinated debt in the amount of $11.3 (2016 — $11.1).
As at December 31, 2017, investment property in the amount of $0.1 (2016 — $0.1) and fixed assets and intangible assets in the amount of $3.3 (2016 — $4.8) were included in accounts payable.
The accompanying notes are an integral part of the consolidated financial statements.
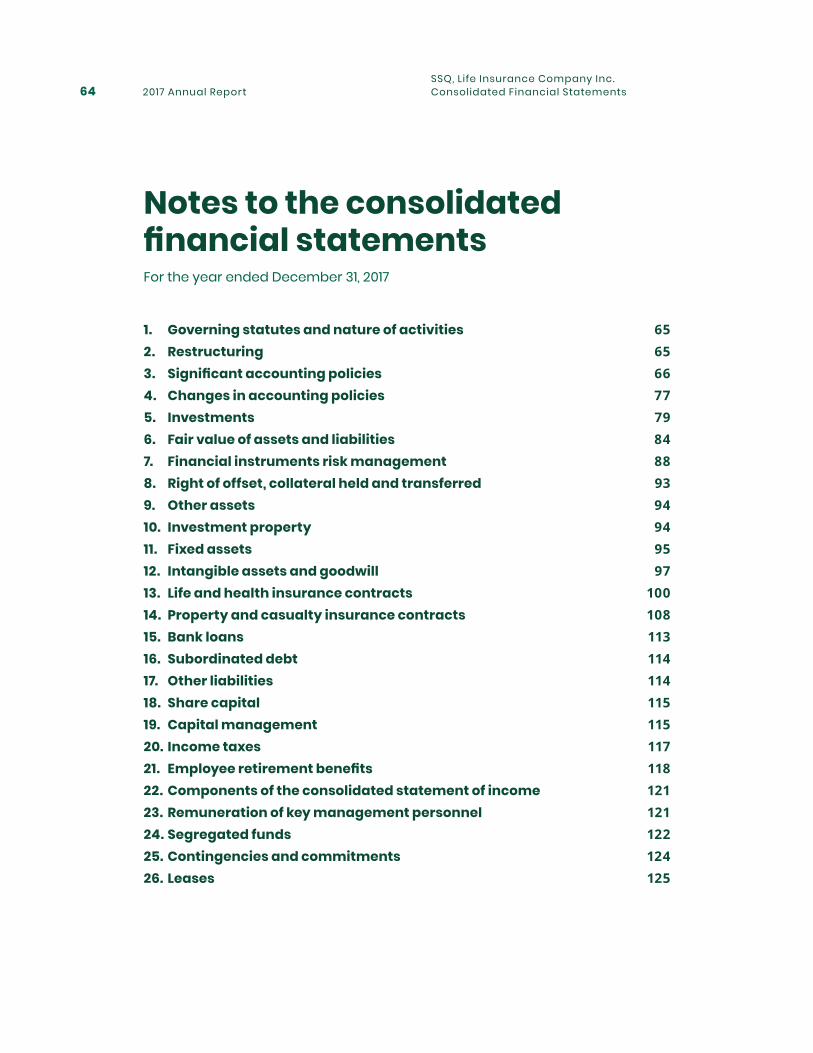
2017 Annual Report64SSQ, Life Insurance Company Inc.Consolidated Financial Statements
Notes to the consolidated financial statementsFor the year ended December 31, 2017
1. Governing statutes and nature of activities 652. Restructuring 653. Significant accounting policies 664. Changes in accounting policies 775. Investments 796. Fair value of assets and liabilities 847. Financial instruments risk management 888. Right of offset, collateral held and transferred 939. Other assets 9410. Investment property 9411. Fixed assets 9512. Intangible assets and goodwill 9713. Life and health insurance contracts 10014. Property and casualty insurance contracts 10815. Bank loans 11316. Subordinated debt 11417. Other liabilities 11418. Share capital 11519. Capital management 11520. Income taxes 11721. Employee retirement benefits 11822. Components of the consolidated statement of income 12123. Remuneration of key management personnel 12124. Segregated funds 12225. Contingencies and commitments 12426. Leases 125
2017 Annual Report 65SSQ, Life Insurance Company Inc.Consolidated Financial Statements
Notes to the consolidated financial statementsFor the year ended December 31, 2017(in millions of dollars, unless otherwise indicated)
1. Governing statutes and nature of activitiesSSQ, Life Insurance Company Inc., majority owned by the Fonds de solidarité des travailleurs du Québec, was incorporated under a private law and is governed by the Insurance Act. SSQ, Life Insurance Company Inc., and its subsidiaries (the “Company”) offer a complete range of financial services including financial protection in the event of death, disability, illness or retirement through a variety of individual and group insurance products as well as savings, retirement and investment products. The Company is also active in property and casualty insurance and real estate management. The Company’s head office is located at 2525 Laurier Blvd., Quebec City, Quebec, Canada.
The Company’s consolidated financial statements were approved by the Board of Directors on February 27, 2018.
2. RestructuringOn June 8, 2016, the Company’s Board of Directors approved a restructuring program (the “SSQ Transformation Program”) essentially intended to combine the Company’s direct and indirect subsidiaries, thereby simplifying its corporate structure and fostering synergies between its business lines and distribution networks.
The following transactions were carried out under the SSQ Transformation Program:
• On December 31, 2016, the Company disposed of its investment in its wholly owned subsidiary, 9352-1839 Québec Inc. (formerly 6801188 Canada Inc.) in favour of SSQ Insurance Company Inc., in consideration for that company’s Class A shares.
• On January 1 , 2017, SSQ General Insurance Company Inc. and SSQ Insurance Company Inc. were merged. The legal name of the merged entity is SSQ Insurance Company Inc. The Company received shares of SSQ Insurance Company Inc. with issued and paid-up capital equal to the total capital of the merged companies.
• On January 1 , 2017, 9352-1839 Québec Inc., SSQ Distribution Inc. (formerly 3669203 Canada Inc.), Garantie supplémentaire 100 limite Inc., SSQ Financial Services Firm Inc. and 9318-3911 Québec Inc., all indirect subsidiaries of the Company, were merged. The legal name of the merged entity is SSQ Distribution Inc. SSQ Distribution Inc. is held directly by the new merged subsidiary of the Company, SSQ Insurance Company Inc., which received shares of SSQ Distribution Inc. with issued and paid-up capital equal to the total capital of the merged companies.
2017 Annual Report66SSQ, Life Insurance Company Inc.Consolidated Financial Statements
3. Significant accounting policiesPresentation of consolidated financial statements
The consolidated financial statements have been prepared in accordance with International Financial Reporting Standards ("IFRS") as issued by the International Accounting Standards Board ("IASB"). Items included in the statement of financial position are presented according to a liquidity principle and each item includes both current and non-current balances. The consolidated financial statements include the accounts of the Company and of its wholly-owned subsidiaries. The following table presents the subsidiaries held by the Company:
NOTES TO THE CONSOLIDATED FINANCIAL STATEMENTS For the year ended December 31, 2017 (in millions of dollars, unless otherwise indicated)
Participation Principal place of business%
SSQ Insurance Company Inc. 100 Quebec (Quebec), CanadaSSQ Reality Inc. 100 Quebec (Quebec), Canada9338-2083 Quebec Inc. 100 Quebec (Quebec), Canada
Use of estimates and Management’s judgments
The preparation of financial statements in accordance with IFRS requires Management to rely on best estimates and assumptions that affect the reported amounts of assets and liabilities and disclosure of contingent assets and liabilities at the date of the financial statements as well as the reported amounts of revenues and expenses during the reporting year. Actual results may differ from those estimates. The most important estimates involve determining:
• liabilities related to life and health insurance contracts, property and casualty insurance contracts and ceded reinsurance assets;
• fair values of financial instruments in the general funds and segregated funds and insurance and investment contracts liabilities in the segregated funds;
• assumptions used in determining provisions, income taxes and write-downs of financial instruments and non-financial assets;
• retirement benefits asset and liability.
Management used its judgment to evaluate the exercise of control for consolidation purposes, to classify insurance and investment contracts and financial instruments. Management’s judgment is also required in the recognition of investment property, fixed assets, intangible assets and goodwill.
Foreign currencies
The Company’s consolidated financial statements are presented in Canadian dollars, which correspond to its functional currency. Fund units and bonds denominated in foreign currencies are converted at the exchange rate in effect at the date of the financial statements.
Insurance contracts and investment contracts – classification
The Company issues contracts that transfer an insurance risk, a financial risk, or both. Insurance contracts are contracts that involve a significant insurance risk. A significant insurance risk exists when the Company agrees to indemnify policyholders or policy beneficiaries should a specified uncertain future event have an adverse effect on the policyholder. Investment contracts are contracts that carry a financial risk with no significant insurance risk.
2017 Annual Report 67SSQ, Life Insurance Company Inc.Consolidated Financial Statements
3. Significant accounting policies (cont’d)Life and health and segregated fund insurance contracts
Revenue recognition and related expenses
Life and health insurance premiums are recognized as revenues when they become due. Once premiums are recognized, liability related to life and health insurance contracts is computed in a manner such that expenses are matched with such revenues. Claims are recognized when a notice is received of an event that gives entitlement to compensation. Furthermore, commissions and premium taxes are recognized on the same basis as life and health insurance premiums.
The Company collects commission revenues on individual contracts ceded to reinsurance. The commissions are recorded when the contracts are ceded to reinsurance and are posted uniformly to the consolidated statement of income over the term of the corresponding ceded contracts. Unearned reinsurance commissions correspond to the portion of the commissions for the unexpired period of the corresponding contracts, prorated over the remaining number of days. The portion attributable to subsequent periods is recognized in liabilities related to life and health insurance.
Life and health insurance contracts
The actuarial reserve, provisions for claims and experience refunds, and deposits related to life and health insurance contracts are established by the actuary in accordance with the standards of practice of the Canadian Institute of Actuaries and reflect the amounts required to meet obligations resulting from insurance contracts in force. The actuarial reserve is calculated according to the Canadian asset liability method, a recognized actuarial method established by the Canadian Institute of Actuaries. This method requires the use of assumptions based on best estimates of future experience, according to the Company’s own experience and that of the industry, and includes additional amounts for plausible adverse deviations related to assumptions made on the different factors considered.
NOTES TO THE CONSOLIDATED FINANCIAL STATEMENTS For the year ended December 31, 2017 (in millions of dollars, unless otherwise indicated)
Some insurance contracts may contain embedded derivative instruments. These derivative instruments either meet the definition of insurance contracts themselves or correspond to an option to surrender an insurance contract for a fixed amount and are not valued separately from the host contract.
Segregated fund insurance contracts
Liabilities for segregated fund insurance contracts include the deposit portion of these contracts, recognized in the same manner as investment contracts. The guaranteed portion recognized from the life and health insurance contracts liability, which is determined by the actuary in accordance with the practice standards of the Canadian Institute of Actuaries, corresponds to the amount required to cover current insurance contract commitments. The insurance contract liabilities of segregated funds are calculated according to the Canadian asset liability method, and include additional amounts for plausible adverse deviations related to assumptions made on the different factors considered.
Segregated fund insurance premiums related to the insurance component of the contract are recognized as revenue when they become due.
Liability adequacy test
On each date of the financial statements, a liability adequacy test is performed to ensure the adequacy of liability related to life and health insurance contracts, net of deferred acquisition costs. Since the concept of liability adequacy is an integral part of the Canadian asset liability method, any inadequacy of provisions is immediately carried to profit or loss in order to ensure compliance.
2017 Annual Report68SSQ, Life Insurance Company Inc.Consolidated Financial Statements
3. Significant accounting policies (cont’d)Property and casualty insurance contracts
Revenue recognition and related expenses
Property and casualty insurance premiums are recognized as revenue when they are due, in pro rata to the duration of the policies. Unearned premiums represent the portion of written premiums for the unexpired in-force policies, according to the daily pro rata method. For some products, unearned premiums are adjusted to account for changes in the related risks. Furthermore, commissions and premium taxes are recognized on the same basis as property and casualty insurance premiums.
Unpaid claims
Unpaid claims are attributable to events associated with the ultimate settlement of claims. The amount of unpaid claims is established in accordance with the standards of practice of the Canadian Institute of Actuaries. It is presented on a discounted basis, based on the experience of the Company and the industry. Claims are recognized when a notice is received of an event that gives entitlement to compensation.
Claims liability adequacy test
The claims liability adequacy analysis is done on each reporting date and reviewed as necessary, if an event that could affect results occurs. To this end, past claims development by business sector are analyzed in order to project anticipated claims at the time of the valuation. Assumptions regarding the rate of payment of liabilities are necessary to value obligations on a discounted basis. Finally, margins for adverse deviations in interest rates, claims development and reinsurance are added to consider the uncertainties related to the assumptions.
Premiums liability adequacy test
Premiums liability adequacy is evaluated on each reporting date. Unearned premiums are decreased by deferred acquisition costs, reinsurance premium, claims and adjustment costs anticipated between the valuation date and the expiry of the contracts, and expected maintenance costs to administer the contracts. In addition, the impact of the time value of money is considered. Finally, margins for adverse deviations in interest rates, claims development and reinsurance are added to consider the uncertainties related to the assumptions.
Ceded reinsurance assets
In the normal course of business, the Company uses reinsurance to manage its level of risk exposure. The risk and the corresponding premium are transferred to duly registered reinsurers that are subject to the same regulatory bodies as the Company. The ceded reinsurance assets are valued in a similar manner to the liabilities related to life and health insurance contracts and property and casualty insurance contracts and in accordance with the terms and conditions of each reinsurance contract. Ceded reinsurance assets represent amounts due to the Company with respect to the liabilities of the ceded policies. Ceding a risk does not release the Company from its obligation to fully comply with the commitments made to its insureds. These assets are subject to an impairment test and, if they are impaired, their carrying value is reduced and the impairment loss is recognized to profit and loss.
Investment contracts
Revenue recognition
Investment contracts fall under the scope of IAS 39, “Financial Instruments: Recognition and Measurement”. Deposit accounting applies to these contracts, which involves recording the premiums received and benefits paid on these contracts as deposits and withdrawals, with no impact on the income statement. Revenues from these contracts consist of fees related to contract issue, administration and surrender as well as asset management, and are recognized in Administration fees and other revenues.
NOTES TO THE CONSOLIDATED FINANCIAL STATEMENTS For the year ended December 31, 2017 (in millions of dollars, unless otherwise indicated)
2017 Annual Report 69SSQ, Life Insurance Company Inc.Consolidated Financial Statements
3. Significant accounting policies (cont’d)Investment contracts (cont’d)
Investment contract liabilities
All investment contracts are designated at fair value through profit or loss, since changes in net income are offset by changes in the value of investments related to the general funds and segregated funds and are managed on a fair value basis.
Recognition of revenue on property
Revenue on property is recognized in net income on a straight-line basis over the term of the lease.
Recognition of administration fees and other revenues
Fees for the management of segregated funds and for the management of administrative service contracts are recognized when earned in Administration fees and other revenues.
Other revenues mainly include gains on disposal of fixed assets and are recognized when earned.
Financial Instruments – classification and recognition
On initial recognition of its financial instruments, the Company records them at their fair value. The subsequent measurement of financial instruments depends on their classification. The Company classifies financial assets into one of the following categories: at fair value through profit or loss, held to maturity, available for sale and loans and receivables. The fair value through profit or loss category includes financial assets held for trading and financial assets designated at fair value through profit or loss. The Company classifies financial liabilities into one of the following categories: designated at fair value through profit or loss and at amortized cost.
Financial instruments are classified based on their nature and the Company’s use of the financial instrument at the time of its initial recognition.
a) Bonds
Designated at fair value through profit or loss
Bonds backing liability related to life and health insurance contracts are designated at fair value through profit or loss, since changes in their fair value on the income statement are offset by changes in liability related to life and health insurance contracts.
Available for sale
Bonds not backing liability related to life and health insurance contracts, property and casualty insurance contracts and investment contracts are classified as assets available for sale. Purchases and disposals of bonds are recognized at trade date. Changes in fair value of these bonds are recorded in other comprehensive income (loss). Upon disposal of these bonds, or upon the recognition of any impairment loss, the gain or loss is reclassified from accumulated other comprehensive income (loss) to net income. Reversals of impairment losses may occur and are recognized in profit or loss when there is objective evidence of recovery.
b) Loans
Loans and receivables
Loans are classified as loans and receivables and are carried at amortized cost according to the effective interest rate method, less the allowance for investment losses. The allowance for investment losses is established on an individual basis from the estimated realizable value measured by discounting the expected future cash flows.
Commissions paid on issuance of new loans are recognized with loans and amortized according to the effective interest rate method.
NOTES TO THE CONSOLIDATED FINANCIAL STATEMENTS For the year ended December 31, 2017 (in millions of dollars, unless otherwise indicated)
2017 Annual Report70SSQ, Life Insurance Company Inc.Consolidated Financial Statements
3. Significant accounting policies (cont’d)Financial Instruments – classification and recognition (cont’d)
c) Fund units and preferred shares
Designated at fair value through profit or loss
Fund units and preferred shares backing liability related to life and health insurance contracts are designated at fair value through profit or loss, since changes in their fair value on the income statement are offset by changes in liability related to life and health insurance contracts.
Available for sale
Fund units and preferred shares not backing liability related to life and health insurance contracts and property and casualty insurance contracts are classified as asset available for sale. Purchases and disposals of fund units and preferred shares are recognized at trade date. They are carried at fair value and all changes in fair value are recorded in other comprehensive income (loss). Transaction costs paid upon purchase, if any, are capitalized at cost. Upon disposal of these fund units and shares, or upon the recognition of any impairment loss, the gain or loss is reclassified from accumulated other comprehensive income (loss) to net income. No reversal of impairment losses is allowed. However, fund units and preferred shares continue to be carried at fair value, even if an impairment loss has previously been recognized.
d) Investment fund
Held for trading
The investment fund is held for trading and includes Canadian equity securities acquired with the proceeds from the offering of certain debentures. In accordance with the debenture acts, the excess fair value of these securities over
the capital of the debentures is recorded to the liability account of the Company. When fair value of the securities is less than the capital value of the debentures, the Company records a receivable from the decline in value equal to the difference.
e) Cash and cash equivalents
Cash and cash equivalents are made up of bank accounts and money market securities held with financial institutions.
Held for trading
Money market securities are designated as held for trading. These include interest-bearing deposits that are readily convertible to known amounts of cash and that are subject to an insignificant risk of change in value or with a maturity of three months or less from the date of acquisition.
Loans and receivables
The bank accounts are classified as loans and receivables and are carried at amortized cost according to the effective interest rate method.
f) Derivative financial instruments
Held for trading
Derivative financial instruments include foreign exchange contracts, stock index contracts settled daily, bond futures and interest rate and currency swaps. Futures contracts, which are negotiated contracts in an organized market, represent firm commitments to buy or sell financial instruments at a given date. Swaps are contracts in which the Company and a third party commit to paying flows based on a notional amount, during a set time period and frequency.
These financial instruments are held for trading. Derivative financial instruments with a positive fair value are presented as investments while derivative financial instruments with a negative fair value are presented as other liabilities.
The Company uses derivative financial instruments in support of the liability related to life and health insurance contracts. Gains and losses related to these contracts are recognized in net income under investment income.
NOTES TO THE CONSOLIDATED FINANCIAL STATEMENTS For the year ended December 31, 2017 (in millions of dollars, unless otherwise indicated)
2017 Annual Report 71SSQ, Life Insurance Company Inc.Consolidated Financial Statements
3. Significant accounting policies (cont’d)Financial Instruments – classification and recognition (cont’d)
f) Derivative financial instruments (cont’d)
Held for trading (cont’d)
The Company also uses foreign exchange contracts and currency swaps under its currency risk management strategy. Such financial instruments hedge fair value of assets and their effectiveness is reviewed on a monthly basis. Foreign exchange gains and losses on forward contracts and changes in fair value related to exchange rate fluctuations of hedge assets are recognized in net income under investment income.
g) Subordinated debt
Other financial liabilities at amortized cost
Subordinated debt is classified as other financial liabilities at amortized cost and measured at amortized cost using the effective interest rate method. Interest expense is recognized in the consolidated statement of income under selling and administrative expenses.
The fair value of subordinated debt disclosed is measured using an expected discounted future cash flows model. The discount rate used corresponds to the rate of return of a benchmark index that has a similar risk profile as the underlying assets and a term matching the maximum term for the subordinated debt.
h) Other financial assets and liabilities
Other financial assets and liabilities are recognized at amortized cost and classified respectively as loans and receivables and other financial liabilities at amortized cost.
Financial instruments – impairment
A financial asset is impaired if there is objective evidence of impairment as a result of one or more loss events after initial recognition and that event has an impact on the estimated future cash flows of the financial asset.
At the end of each reporting period, the Company determines whether there is objective evidence that a financial asset or a group of financial assets, other than those classified or designated at fair value through profit or loss, is impaired. Such financial assets are written off using an impairment model for debt securities, equity interests, or loans and receivables.
The appropriate impairment model is determined based on the specifications of each instrument, the ability of the issuer to pay dividends or interest and the Company’s intention to hold long-term financial assets or sell them.
Impairment model for debt securities
The impairment model for debt securities is used to measure impairment of the Company’s bonds and preferred shares. Under this impairment model, a security is impaired when future cash flows are unlikely to be recovered, based on credit considerations.
Impairment model for equity interests
The impairment model for equity interests is used to measure impairment of the Company’s fund units. Under this impairment model, objective evidence of impairment includes a significant or prolonged decline in the fair value of the investment below cost.
Impairment model for loans and receivables
The impairment model for loans and receivables is used to measure impairment of the Company’s loans. Under this impairment model, loans and receivables are tested for impairment in the event of default or if there is objective evidence that the counterparty will not meet its obligations. When it is determined that a financial asset in this class is impaired, its carrying amount is adjusted to the highest of its estimated realizable value or the fair value of collateral, if applicable.
NOTES TO THE CONSOLIDATED FINANCIAL STATEMENTS For the year ended December 31, 2017 (in millions of dollars, unless otherwise indicated)
2017 Annual Report72SSQ, Life Insurance Company Inc.Consolidated Financial Statements
3. Significant accounting policies (cont’d)Repurchase agreements and securities lending
The Company makes securities lending to generate additional revenue, which is recognized in net income under investment income. The Company receives collateral for at least 102% of the fair value of the loaned securities. This collateral is deposited by the borrower with a custodian where it is kept until the loaned securities have been returned to the Company. The fair value of the loaned securities is monitored daily. Additional collateral is required or a portion of the collateral provided is refunded based on changes in the value of the underlying loaned securities. The loaned securities are not derecognized since the Company retains the risk and rewards of ownership.
The Company sells securities and simultaneously commits to repurchase them in the short term, at a specified date and price. These repurchase agreements are recognized in the consolidated statement of financial position at the consideration received plus accrued interest. Commitments related to securities sold under repurchase agreements are recognized at amortized cost according to the effective interest rate method. Interest related to repurchase operations is recorded in investment income in the consolidated statement of income. Securities sold for repurchase are not derecognized, given that the Company retains the related risks and rewards.
Recognition of investment income
Interest income and amortization of discounts and premiums are calculated using the effective interest rate method.
Dividend income and distributed income are recognized when the right to receive payment is established.
Investments fair value
Cash and cash equivalents
Due to their short-term maturities, the carrying value of cash and cash equivalents represents their fair value.
Bonds
Bonds are measured at bid prices observed in active markets. If prices in active markets are not available, fair value is established by using a valuation technique that makes maximum use of inputs observed from the markets.
Loans
The fair value of loans is established by discounting expected cash flows at rates currently required by the market for this type of receivable and for a term equal to the term of the loan.
Fund units and preferred shares
Fund units and preferred shares are measured at bid prices observed in active markets.
Derivative financial instruments
Future contracts are measured at bid prices observed in active markets. The fair value of financial instruments bought or sold by private contract, the value of which is not observable from the market, is established by using a valuation technique that makes maximum use of inputs observed from the markets.
NOTES TO THE CONSOLIDATED FINANCIAL STATEMENTS For the year ended December 31, 2017 (in millions of dollars, unless otherwise indicated)
2017 Annual Report 73SSQ, Life Insurance Company Inc.Consolidated Financial Statements
3. Significant accounting policies (cont’d)Property under development
Investment property under development consists of a portion of real estate properties under construction held for resale. These properties are valued at the lower of cost and net realizable value. Cost is determined according to the specific identification method, and net realizable value corresponds to the estimated disposal price of the property less estimated completion costs and disposal costs.
Investment property
Investment property held by the Company, real estate properties held either to earn rentals or for capital appreciation, are recognized at acquisition cost less impairment losses. The cost of property is depreciated by major component, using each component’s estimated useful life and according to the straight-line method. Useful lives, residual values and the depreciation method are reviewed at the end of each year. The impact of any change in estimates is recorded prospectively.
The fair value of investment property is measured using a present value of expected cash flows method. The discount rate used is based on the market’s expected rate of return, which is determined based on the type and geographical location of the property. Measurements are made on an annual basis by the Company’s qualified personnel.
The profit or loss on the disposal or retirement of an investment property, which is the difference between proceeds on the asset’s disposal and its carrying value, is recognized in profit or loss.
Depreciation is calculated using the following useful lives:
Government grants
The Company receives government grants to build properties under development and investment properties. It recognizes the grants to reduce the carrying amount of these assets. The grants related to properties under development are recognized in income when the assets are sold and are presented to reduce gains. The grants related to investment properties are recognized in income in proportion to the depreciation of the assets, and presented to reduce the depreciation expense.
Foreclosed assets
Property acquired by foreclosure and held for resale are recorded at the lower of either the investment in the mortgage foreclosed or the estimated net proceeds from the disposal of the property. Gains and losses on resale of these properties are recorded in income in the period in which they arise.
NOTES TO THE CONSOLIDATED FINANCIAL STATEMENTS For the year ended December 31, 2017 (in millions of dollars, unless otherwise indicated)
Structure 100 yearsBuilding envelope 60 yearsMechanical services 40 yearsFixtures and fittings 20 years
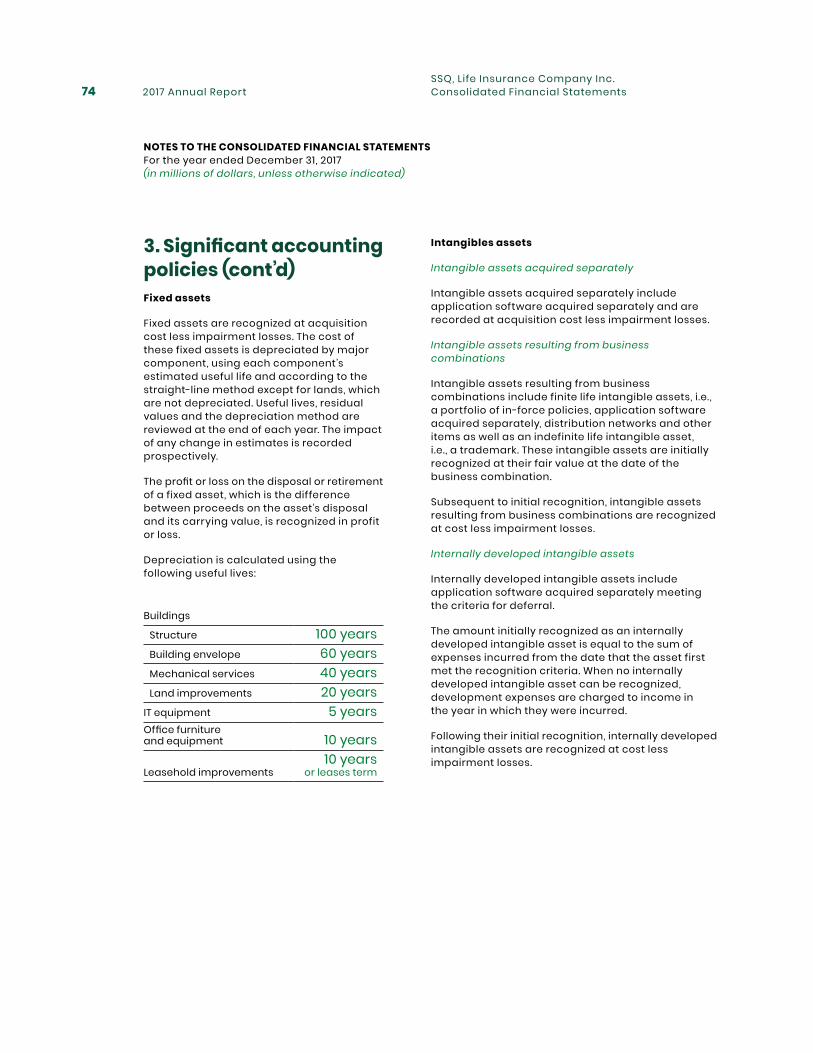
2017 Annual Report74SSQ, Life Insurance Company Inc.Consolidated Financial Statements
3. Significant accounting policies (cont’d)Fixed assets
Fixed assets are recognized at acquisition cost less impairment losses. The cost of these fixed assets is depreciated by major component, using each component’s estimated useful life and according to the straight-line method except for lands, which are not depreciated. Useful lives, residual values and the depreciation method are reviewed at the end of each year. The impact of any change in estimates is recorded prospectively.
The profit or loss on the disposal or retirement of a fixed asset, which is the difference between proceeds on the asset’s disposal and its carrying value, is recognized in profit or loss.
Depreciation is calculated using the following useful lives:
Intangibles assets
Intangible assets acquired separately
Intangible assets acquired separately include application software acquired separately and are recorded at acquisition cost less impairment losses.
Intangible assets resulting from business combinations
Intangible assets resulting from business combinations include finite life intangible assets, i .e. , a portfolio of in-force policies, application software acquired separately, distribution networks and other items as well as an indefinite life intangible asset, i .e. , a trademark. These intangible assets are initially recognized at their fair value at the date of the business combination.
Subsequent to initial recognition, intangible assets resulting from business combinations are recognized at cost less impairment losses.
Internally developed intangible assets
Internally developed intangible assets include application software acquired separately meeting the criteria for deferral.
The amount initially recognized as an internally developed intangible asset is equal to the sum of expenses incurred from the date that the asset first met the recognition criteria. When no internally developed intangible asset can be recognized, development expenses are charged to income in the year in which they were incurred.
Following their initial recognition, internally developed intangible assets are recognized at cost less impairment losses.
Buildings
Structure 100 years Building envelope 60 years Mechanical services 40 years Land improvements 20 yearsIT equipment 5 yearsOffice furniture and equipment 10 years
Leasehold improvements10 years
or leases term
NOTES TO THE CONSOLIDATED FINANCIAL STATEMENTS For the year ended December 31, 2017 (in millions of dollars, unless otherwise indicated)
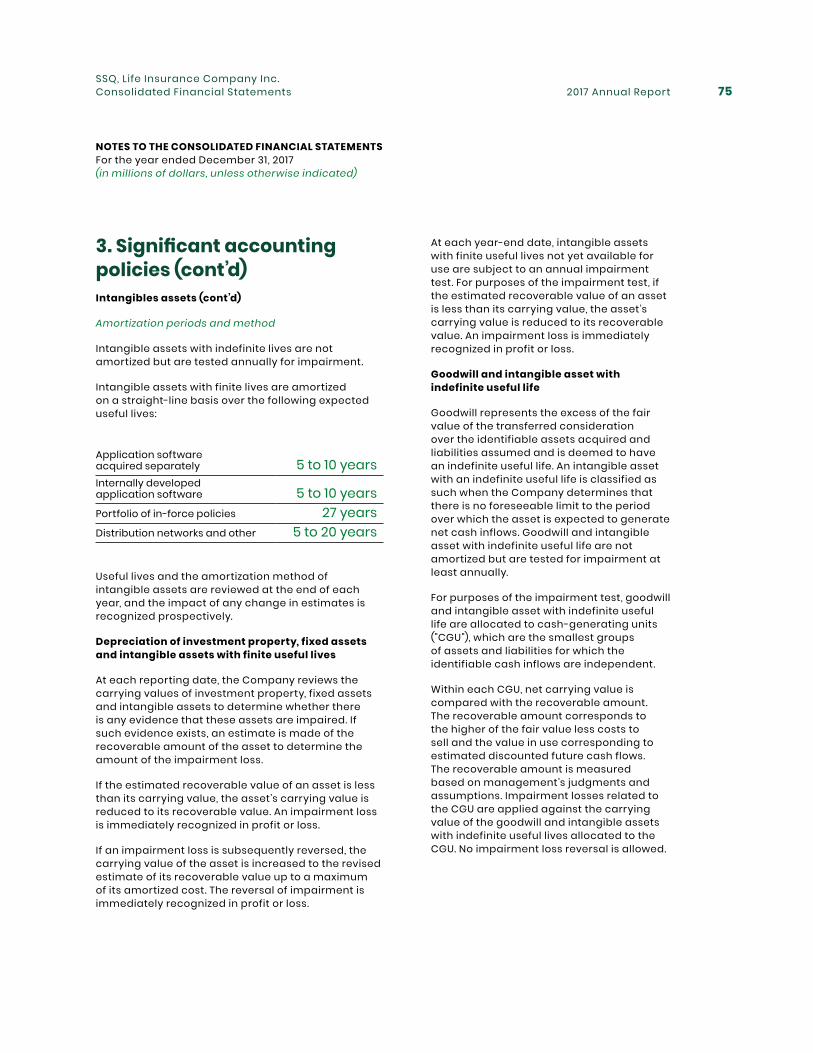
2017 Annual Report 75SSQ, Life Insurance Company Inc.Consolidated Financial Statements
3. Significant accounting policies (cont’d)Intangibles assets (cont’d)
Amortization periods and method
Intangible assets with indefinite lives are not amortized but are tested annually for impairment.
Intangible assets with finite lives are amortized on a straight-line basis over the following expected useful lives:
Application software acquired separately 5 to 10 yearsInternally developed application software 5 to 10 yearsPortfolio of in-force policies 27 yearsDistribution networks and other 5 to 20 years
Useful lives and the amortization method of intangible assets are reviewed at the end of each year, and the impact of any change in estimates is recognized prospectively.
Depreciation of investment property, fixed assets and intangible assets with finite useful lives
At each reporting date, the Company reviews the carrying values of investment property, fixed assets and intangible assets to determine whether there is any evidence that these assets are impaired. If such evidence exists, an estimate is made of the recoverable amount of the asset to determine the amount of the impairment loss.
If the estimated recoverable value of an asset is less than its carrying value, the asset’s carrying value is reduced to its recoverable value. An impairment loss is immediately recognized in profit or loss.
If an impairment loss is subsequently reversed, the carrying value of the asset is increased to the revised estimate of its recoverable value up to a maximum of its amortized cost. The reversal of impairment is immediately recognized in profit or loss.
At each year-end date, intangible assets with finite useful lives not yet available for use are subject to an annual impairment test. For purposes of the impairment test, if the estimated recoverable value of an asset is less than its carrying value, the asset’s carrying value is reduced to its recoverable value. An impairment loss is immediately recognized in profit or loss.
Goodwill and intangible asset with indefinite useful life
Goodwill represents the excess of the fair value of the transferred consideration over the identifiable assets acquired and liabilities assumed and is deemed to have an indefinite useful life. An intangible asset with an indefinite useful life is classified as such when the Company determines that there is no foreseeable limit to the period over which the asset is expected to generate net cash inflows. Goodwill and intangible asset with indefinite useful life are not amortized but are tested for impairment at least annually.
For purposes of the impairment test, goodwill and intangible asset with indefinite useful life are allocated to cash-generating units ("CGU"), which are the smallest groups of assets and liabilities for which the identifiable cash inflows are independent.
Within each CGU, net carrying value is compared with the recoverable amount. The recoverable amount corresponds to the higher of the fair value less costs to sell and the value in use corresponding to estimated discounted future cash flows. The recoverable amount is measured based on management’s judgments and assumptions. Impairment losses related to the CGU are applied against the carrying value of the goodwill and intangible assets with indefinite useful lives allocated to the CGU. No impairment loss reversal is allowed.
NOTES TO THE CONSOLIDATED FINANCIAL STATEMENTS For the year ended December 31, 2017 (in millions of dollars, unless otherwise indicated)
2017 Annual Report76SSQ, Life Insurance Company Inc.Consolidated Financial Statements
3. Significant accounting policies (cont’d)Segregated fund investments
Segregated fund investments are the accumulated net assets of the segregated funds, including inter-fund eliminations. They include bonds, shares, investment fund units and other assets and liabilities, including derivative financial instruments.
The investments are designated at fair value through profit or loss since they are managed and valued on a fair value basis in accordance with the investment strategy approved by Management.
Other assets and liabilities are classified as loans and receivables and other liabilities at amortized cost, respectively, and are recognized at amortized cost, except for derivative financial instruments, which are held for trading and recognized at their fair value.
Employee retirement benefits
The Company offers its employees pension plans and other retirement benefits such as severance pay and life and health insurance coverage. The cost of pensions and other retirement benefits earned by employees is actuarially determined according to the projected benefit method prorated on services and Management’s best estimate of salary increases, retirement ages of employees and expected health care costs. Actuarial gains or losses are recorded immediately in other comprehensive income (loss). The cost of past services is included in the statement of income when a modification arises. The plans’ assets are carried at fair values and are held in separate trustee pension funds.
Income taxes
The income tax expense includes current and deferred taxes. It is recognized in profit or loss, except for income tax on items included under other comprehensive income (loss) or equity. In these specific cases, the income tax expense is recognized in other comprehensive income (loss) and equity, respectively.
Income taxes receivable and payable are obligations to or claims by tax authorities for prior years or the current year that have not been received or paid at the end of the year. Current income taxes are calculated based on taxable income, which is different from net income. The calculation is made based on the tax rates and laws in force at the end of the year.
The Company recognizes income taxes using the deferred tax asset and liability method. According to this method, deferred tax assets and liabilities are determined based on the difference between the carrying value and the taxable value of the assets and liabilities. Any change in the net amount of deferred assets and liabilities is posted to income and accumulated other comprehensive income (loss). Deferred tax assets and liabilities are determined based on currently applicable or applied tax rates and laws which, to the extent that can be predicted, will apply to the taxable income in the periods in which the assets and liabilities will be recovered or paid. Deferred tax assets are recognized when it is probable that they will be realized.
Operating leases
Leases that do not transfer substantially all the risks and rewards of ownership to the Company are classified as operating leases. Payments made under operating leases are presented on the income statement in selling and administrative expenses. The amounts of future rents under operating leases are presented in the note on contingencies and commitments.
NOTES TO THE CONSOLIDATED FINANCIAL STATEMENTS For the year ended December 31, 2017 (in millions of dollars, unless otherwise indicated)
2017 Annual Report 77SSQ, Life Insurance Company Inc.Consolidated Financial Statements
4. Changes in accounting policiesApplication of new accounting standards
Income taxes
In January 2016, the IASB issued an amendment to IAS 12, “Income Taxes” to clarify the accounting of deferred tax assets related to debt instruments measured at fair value. The provisions of this amendment will apply retrospectively to financial statements of annual periods beginning on or after January 1 , 2017. The amendment to this standard had no impact on the Company’s consolidated financial statements.
Statement of cash flows
In February 2016, the IASB issued narrow-scope amendments to IAS 7, “Statement of Cash Flows”, which require companies to provide disclosures on changes in liabilities in the financing section. The amendments will apply prospectively to annual periods beginning on or after January 1 , 2017. The amendments to this standard had no impact on the Company’s consolidated financial statements.
New accounting standards not yet in effect
Financial instruments
In July 2014, the IASB issued IFRS 9, “Financial Instruments” ("IFRS 9"), which replaces IAS 39, “Financial Instruments: Recognition and Measurement”, regarding the classification and measurement of financial assets and liabilities, impairment and hedge accounting as of January 1 , 2018. The Company is currently assessing the impact of this new standard on its consolidated financial statements. An amendment to IFRS 4, “Insurance Contracts”, issued by the IASB on September 12, 2016, sets out measures giving companies whose business model is predominantly to issue insurance contracts the option to defer the effective date of IFRS 9 to January 1 , 2021. This exemption remains valid with the issuance of IFRS 17, “Insurance Contracts”, in May 2017. The Company qualifies for the deferral and expects to apply it until the maximum date permitted.
Revenue from contracts with customers
In May 2014, the IASB issued IFRS 15, “Revenue from Contracts with Customers” ("IFRS 15"), which replaces IAS 18, “Revenue”, and IAS 11 , “Construction Contracts”. This new standard establishes a single framework for how and when to recognize revenue, except in the case of leases, financial instruments and insurance contracts. Following the IASB’s decision to defer the effective date of the standard by one year, IFRS 15 will apply retrospectively or prospectively with a cumulative adjustment as of January 1 , 2018. This new standard will have no impact on the Company’s consolidated financial statements.
Leases
In January 2016, the IASB issued IFRS 16, “Leases”, which replaces IAS 17, “Leases”. This new standard sets out the principles for the recognition, measurement, presentation and disclosure of leases. It provides a single lessee accounting model, requiring the recognition of assets and liabilities for all leases, unless the lease term is 12 months or less or the underlying asset has a low value. However, lessor accounting remains largely unchanged, and the distinction between operating and finance leases is retained. This standard will apply retrospectively to annual periods beginning on or after January 1 , 2019. The Company is currently assessing the impact of this standard on its consolidated financial statements.
NOTES TO THE CONSOLIDATED FINANCIAL STATEMENTS For the year ended December 31, 2017 (in millions of dollars, unless otherwise indicated)
2017 Annual Report78SSQ, Life Insurance Company Inc.Consolidated Financial Statements
4. Changes in accounting policies (cont’d)New accounting standards not yet in effect (cont’d)
Investment property
In December 2016, the IASB published an amendment to IAS 40, “Investment Property”, to clarify the requirements on transfers to, or from, investment property. The provisions of this amendment will apply retrospectively or prospectively with cumulative adjustment as of January 1 , 2018. The Company is currently assessing the impact of this amendment on its consolidated financial statements.
Insurance contracts
In May 2017, the IASB issued IFRS 17, “Insurance Contracts” ("IFRS 17"), which replaces IFRS 4, “Insurance Contracts”. IFRS 17 establishes the principles for the recognition, measurement and presentation of insurance contracts. The standard establishes a general recognition model, as well as a variable fee approach, applicable to all insurance and reinsurance contracts. The standard also allows for a simplified approach for insurance contracts that meet certain criteria. The provisions of this standard will apply retrospectively as of January 1 , 2021. In cases where retrospective application is impracticable, the standard proposes alternative methods. The Company is currently assessing the impact of this new standard on its consolidated financial statements.
Uncertainty over income tax treatments
In June 2017, the IASB issued IFRIC 23, “Uncertainty over Income Tax Treatments”. This interpretation clarifies some issues regarding the application of IAS 12, “Income Taxes”, regarding the recognition and measurement of uncertainty concerning income taxes. The provisions of this interpretation will apply retrospectively for annual periods beginning on or after January 1 , 2019. The Company is currently assessing the impact of this new standard on its consolidated financial statements.
NOTES TO THE CONSOLIDATED FINANCIAL STATEMENTS For the year ended December 31, 2017 (in millions of dollars, unless otherwise indicated)
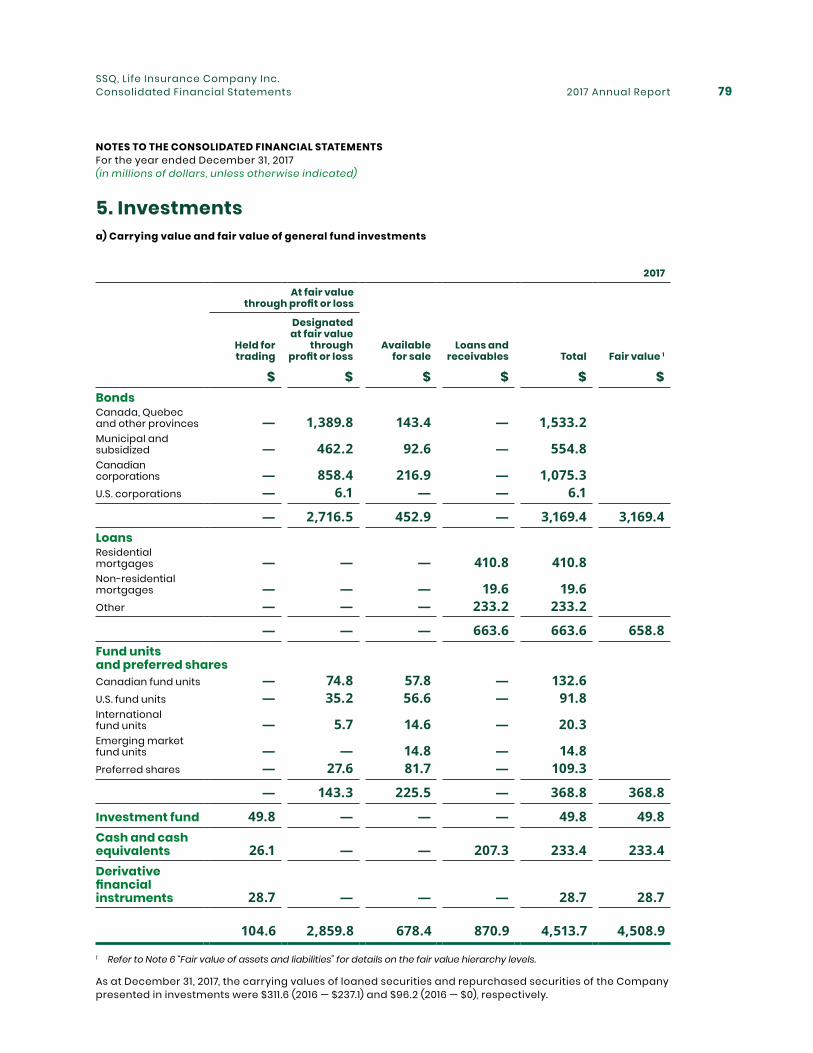
2017 Annual Report 79SSQ, Life Insurance Company Inc.Consolidated Financial Statements
5. Investmentsa) Carrying value and fair value of general fund investments
2017
At fair value through profit or loss
Held for trading
Designated at fair value
through profit or loss
Available for sale
Loans and receivables Total Fair value 1
$ $ $ $ $ $BondsCanada, Quebec and other provinces — 1,389.8 143.4 — 1,533.2Municipal and subsidized — 462.2 92.6 — 554.8Canadian corporations — 858.4 216.9 — 1,075.3U.S. corporations — 6.1 — — 6.1
— 2,716.5 452.9 — 3,169.4 3,169.4LoansResidential mortgages — — — 410.8 410.8Non-residential mortgages — — — 19.6 19.6Other — — — 233.2 233.2
— — — 663.6 663.6 658.8Fund units and preferred sharesCanadian fund units — 74.8 57.8 — 132.6U.S. fund units — 35.2 56.6 — 91.8International fund units — 5.7 14.6 — 20.3Emerging market fund units — — 14.8 — 14.8Preferred shares — 27.6 81.7 — 109.3
— 143.3 225.5 — 368.8 368.8
Investment fund 49.8 — — — 49.8 49.8Cash and cash equivalents 26.1 — — 207.3 233.4 233.4Derivative financial instruments 28.7 — — — 28.7 28.7
104.6 2,859.8 678.4 870.9 4,513.7 4,508.9
1 Refer to Note 6 “Fair value of assets and liabilities” for details on the fair value hierarchy levels.
As at December 31, 2017, the carrying values of loaned securities and repurchased securities of the Company presented in investments were $311.6 (2016 — $237.1) and $96.2 (2016 — $0), respectively.
NOTES TO THE CONSOLIDATED FINANCIAL STATEMENTS For the year ended December 31, 2017 (in millions of dollars, unless otherwise indicated)
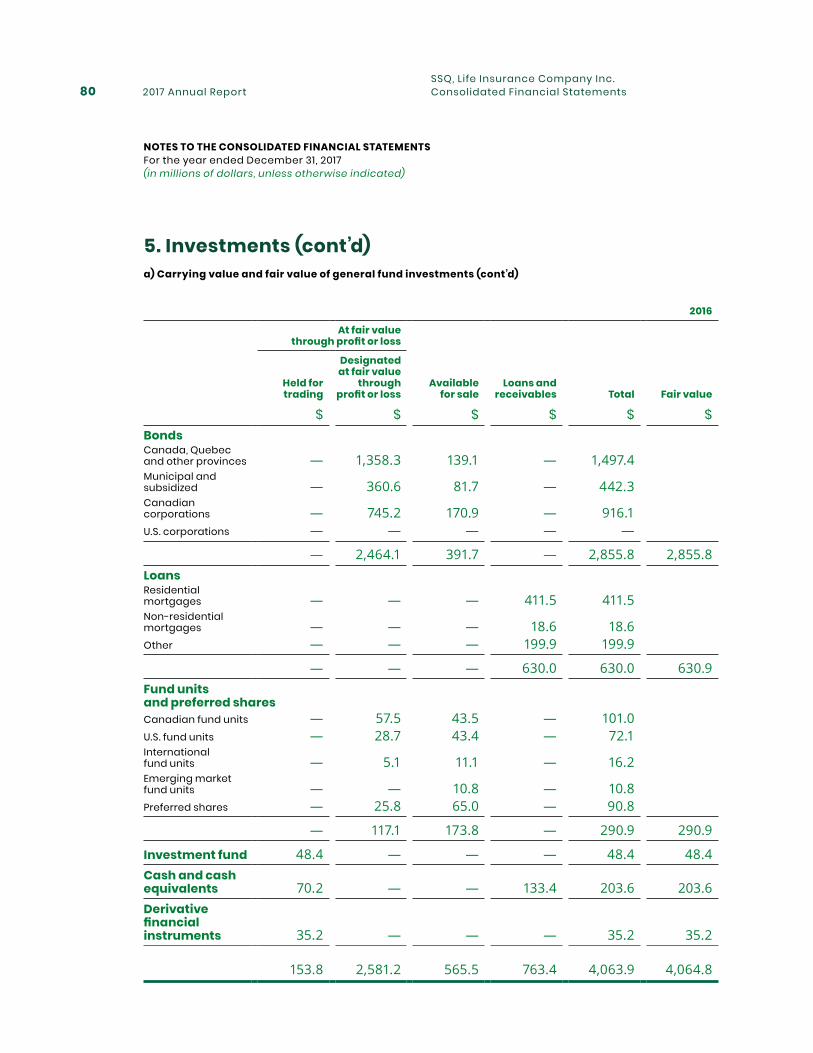
2017 Annual Report80SSQ, Life Insurance Company Inc.Consolidated Financial Statements
5. Investments (cont’d)a) Carrying value and fair value of general fund investments (cont’d)
2016
At fair value through profit or loss
Held for trading
Designated at fair value
through profit or loss
Available for sale
Loans and receivables Total Fair value
$ $ $ $ $ $BondsCanada, Quebec and other provinces — 1,358.3 139.1 — 1,497.4Municipal and subsidized — 360.6 81.7 — 442.3Canadian corporations — 745.2 170.9 — 916.1U.S. corporations — — — — —
— 2,464.1 391.7 — 2,855.8 2,855.8LoansResidential mortgages — — — 411.5 411.5Non-residential mortgages — — — 18.6 18.6Other — — — 199.9 199.9
— — — 630.0 630.0 630.9Fund units and preferred sharesCanadian fund units — 57.5 43.5 — 101.0U.S. fund units — 28.7 43.4 — 72.1International fund units — 5.1 11.1 — 16.2Emerging market fund units — — 10.8 — 10.8Preferred shares — 25.8 65.0 — 90.8
— 117.1 173.8 — 290.9 290.9
Investment fund 48.4 — — — 48.4 48.4Cash and cash equivalents 70.2 — — 133.4 203.6 203.6Derivative financial instruments 35.2 — — — 35.2 35.2
153.8 2,581.2 565.5 763.4 4,063.9 4,064.8
NOTES TO THE CONSOLIDATED FINANCIAL STATEMENTS For the year ended December 31, 2017 (in millions of dollars, unless otherwise indicated)
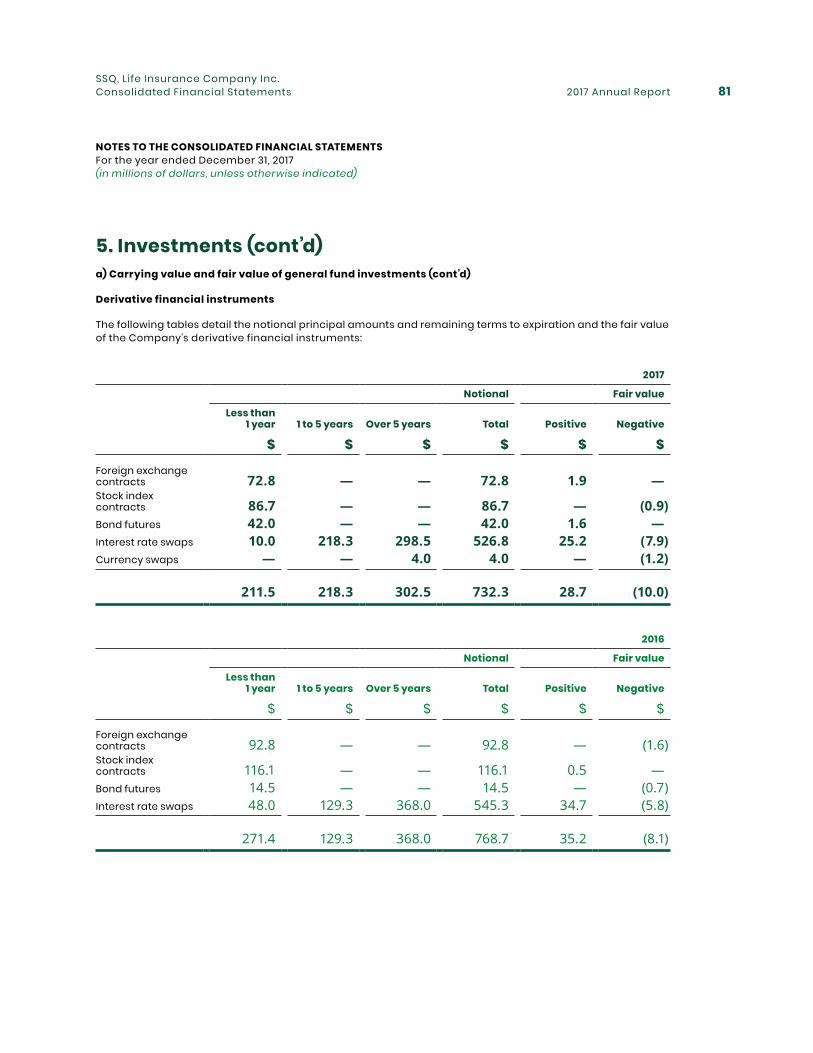
2017 Annual Report 81SSQ, Life Insurance Company Inc.Consolidated Financial Statements
5. Investments (cont’d)a) Carrying value and fair value of general fund investments (cont’d)
Derivative financial instruments
The following tables detail the notional principal amounts and remaining terms to expiration and the fair value of the Company’s derivative financial instruments:
2017
Notional Fair value
Less than 1 year 1 to 5 years Over 5 years Total Positive Negative
$ $ $ $ $ $
Foreign exchange contracts 72.8 — — 72.8 1.9 —Stock index contracts 86.7 — — 86.7 — (0.9)Bond futures 42.0 — — 42.0 1.6 —Interest rate swaps 10.0 218.3 298.5 526.8 25.2 (7.9)Currency swaps — — 4.0 4.0 — (1.2)
211.5 218.3 302.5 732.3 28.7 (10.0)
2016
Notional Fair value
Less than 1 year 1 to 5 years Over 5 years Total Positive Negative
$ $ $ $ $ $
Foreign exchange contracts 92.8 — — 92.8 — (1.6)Stock index contracts 116.1 — — 116.1 0.5 —Bond futures 14.5 — — 14.5 — (0.7)Interest rate swaps 48.0 129.3 368.0 545.3 34.7 (5.8)
271.4 129.3 368.0 768.7 35.2 (8.1)
NOTES TO THE CONSOLIDATED FINANCIAL STATEMENTS For the year ended December 31, 2017 (in millions of dollars, unless otherwise indicated)
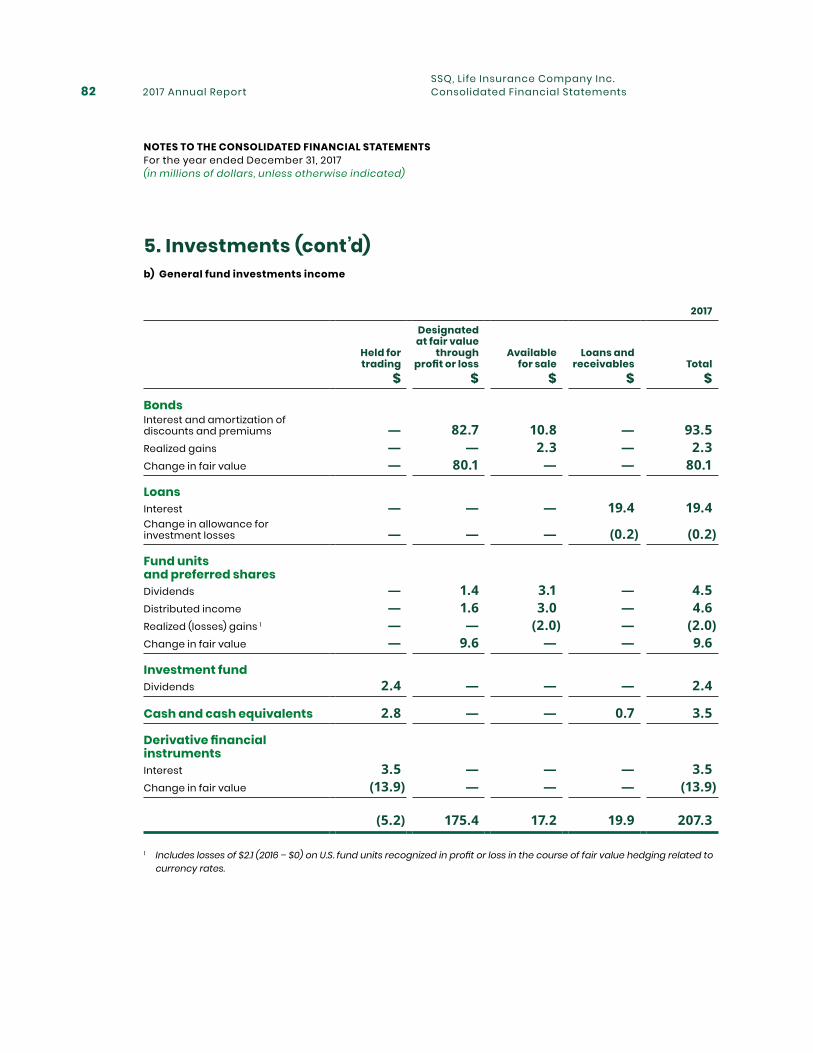
2017 Annual Report82SSQ, Life Insurance Company Inc.Consolidated Financial Statements
5. Investments (cont’d)b) General fund investments income
2017
Held for trading
Designated at fair value
through profit or loss
Available for sale
Loans and receivables Total
$ $ $ $ $
BondsInterest and amortization of discounts and premiums — 82.7 10.8 — 93.5Realized gains — — 2.3 — 2.3Change in fair value — 80.1 — — 80.1
LoansInterest — — — 19.4 19.4Change in allowance for investment losses — — — (0.2) (0.2)
Fund units and preferred sharesDividends — 1.4 3.1 — 4.5Distributed income — 1.6 3.0 — 4.6Realized (losses) gains 1 — — (2.0) — (2.0)Change in fair value — 9.6 — — 9.6
Investment fundDividends 2.4 — — — 2.4
Cash and cash equivalents 2.8 — — 0.7 3.5
Derivative financial instrumentsInterest 3.5 — — — 3.5Change in fair value (13.9) — — — (13.9)
(5.2) 175.4 17.2 19.9 207.3
1 Includes losses of $2.1 (2016 – $0) on U.S. fund units recognized in profit or loss in the course of fair value hedging related to currency rates.
NOTES TO THE CONSOLIDATED FINANCIAL STATEMENTS For the year ended December 31, 2017 (in millions of dollars, unless otherwise indicated)
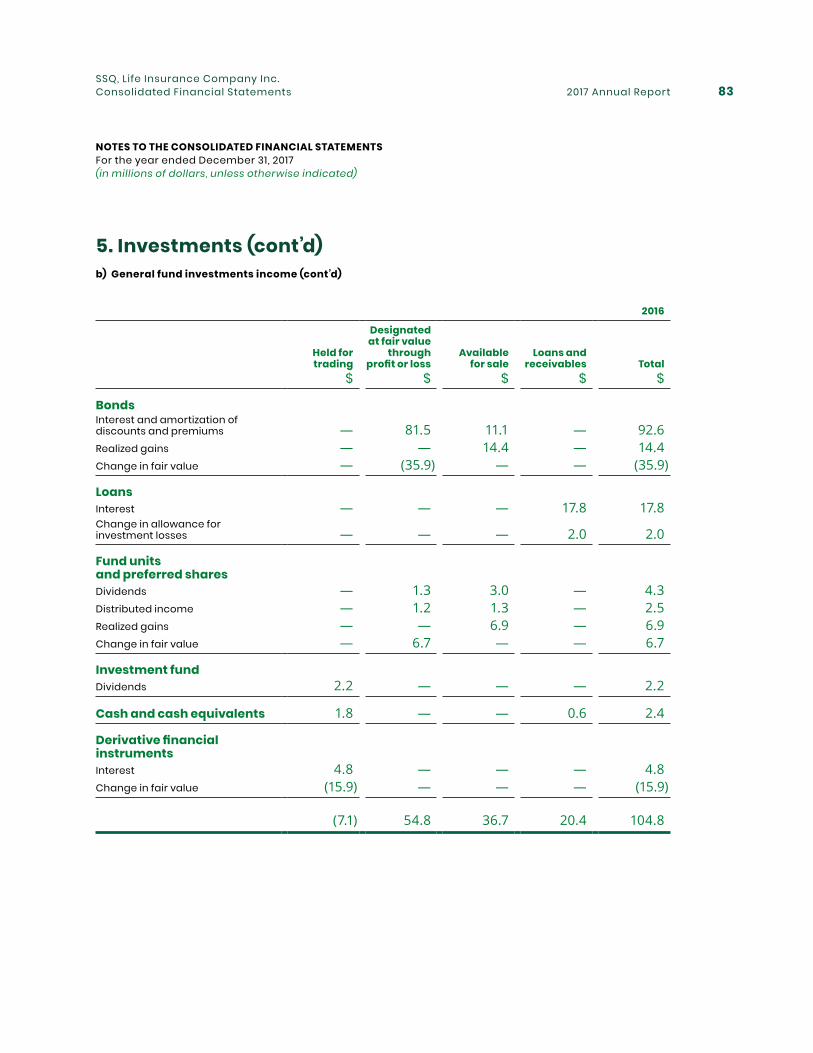
2017 Annual Report 83SSQ, Life Insurance Company Inc.Consolidated Financial Statements
5. Investments (cont’d)b) General fund investments income (cont’d)
2016
Held for trading
Designated at fair value
through profit or loss
Available for sale
Loans and receivables Total
$ $ $ $ $
BondsInterest and amortization of discounts and premiums — 81.5 11.1 — 92.6Realized gains — — 14.4 — 14.4Change in fair value — (35.9) — — (35.9)
LoansInterest — — — 17.8 17.8Change in allowance for investment losses — — — 2.0 2.0
Fund units and preferred sharesDividends — 1.3 3.0 — 4.3Distributed income — 1.2 1.3 — 2.5Realized gains — — 6.9 — 6.9Change in fair value — 6.7 — — 6.7
Investment fundDividends 2.2 — — — 2.2
Cash and cash equivalents 1.8 — — 0.6 2.4
Derivative financial instrumentsInterest 4.8 — — — 4.8Change in fair value (15.9) — — — (15.9)
(7.1) 54.8 36.7 20.4 104.8
NOTES TO THE CONSOLIDATED FINANCIAL STATEMENTS For the year ended December 31, 2017 (in millions of dollars, unless otherwise indicated)
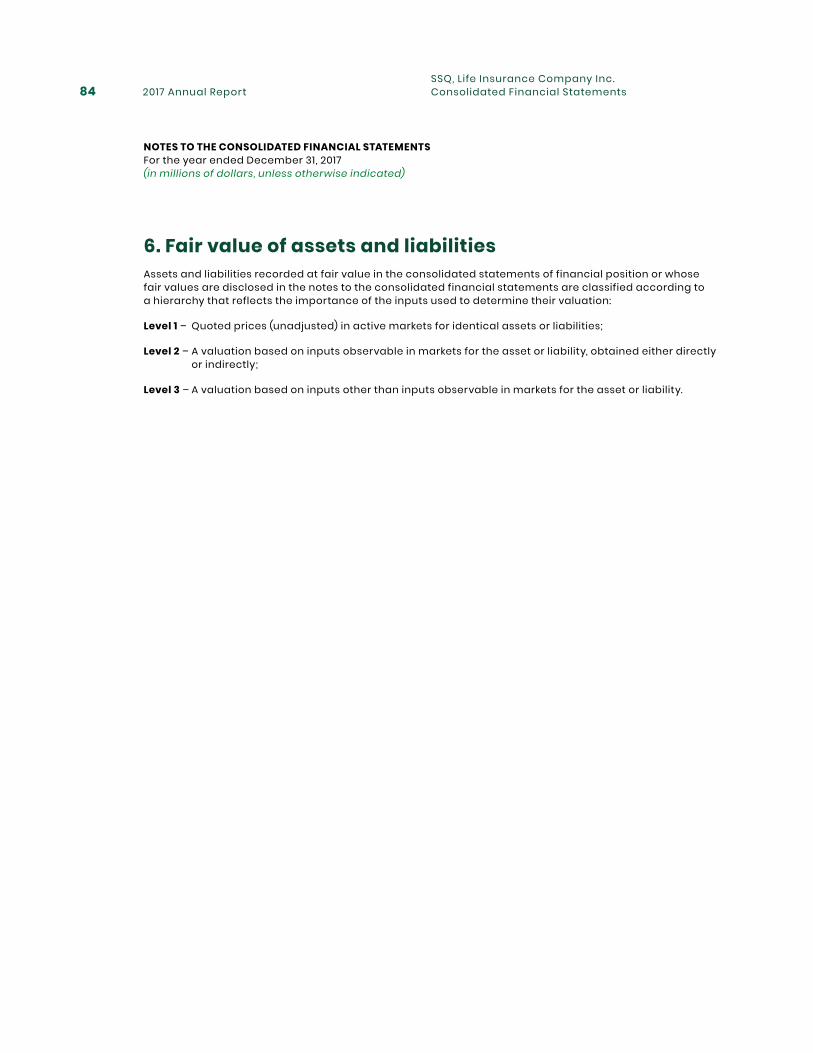
2017 Annual Report84SSQ, Life Insurance Company Inc.Consolidated Financial Statements
6. Fair value of assets and liabilitiesAssets and liabilities recorded at fair value in the consolidated statements of financial position or whose fair values are disclosed in the notes to the consolidated financial statements are classified according to a hierarchy that reflects the importance of the inputs used to determine their valuation:
Level 1 – Quoted prices (unadjusted) in active markets for identical assets or liabilities;
Level 2 – A valuation based on inputs observable in markets for the asset or liability, obtained either directly or indirectly;
Level 3 – A valuation based on inputs other than inputs observable in markets for the asset or liability.
NOTES TO THE CONSOLIDATED FINANCIAL STATEMENTS For the year ended December 31, 2017 (in millions of dollars, unless otherwise indicated)
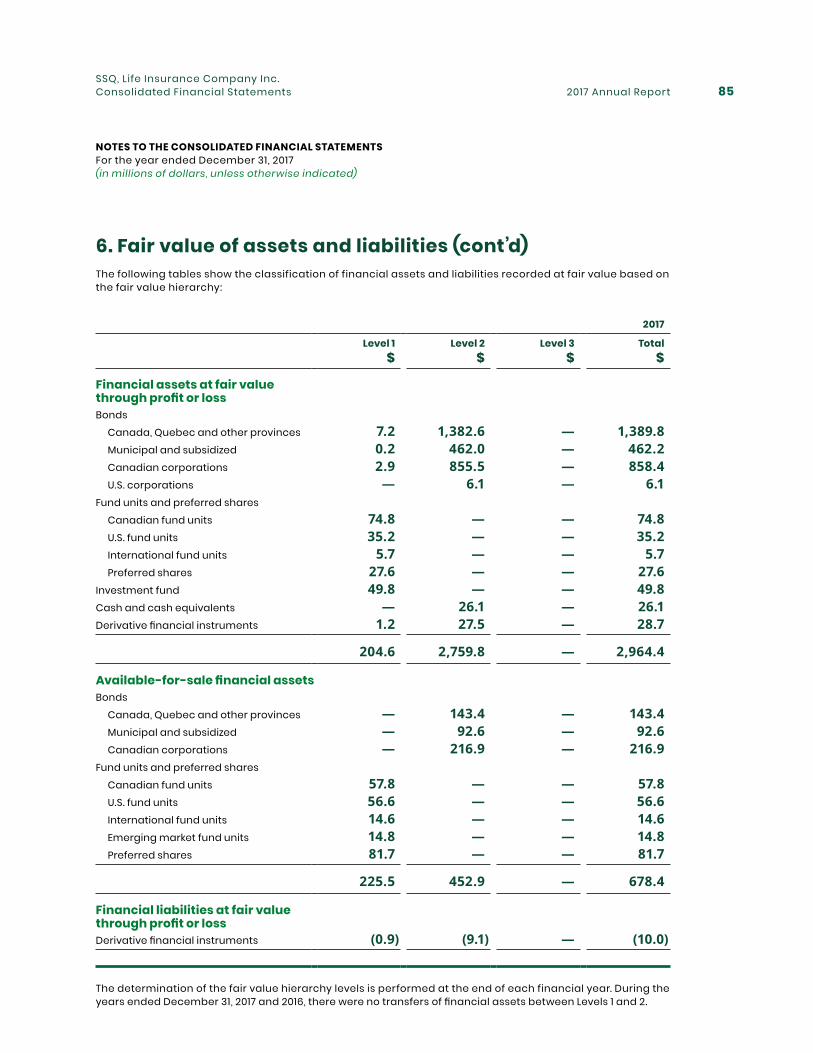
2017 Annual Report 85SSQ, Life Insurance Company Inc.Consolidated Financial Statements
6. Fair value of assets and liabilities (cont’d)The following tables show the classification of financial assets and liabilities recorded at fair value based on the fair value hierarchy:
2017
Level 1 Level 2 Level 3 Total$ $ $ $
Financial assets at fair value through profit or lossBonds Canada, Quebec and other provinces 7.2 1,382.6 — 1,389.8 Municipal and subsidized 0.2 462.0 — 462.2 Canadian corporations 2.9 855.5 — 858.4 U.S. corporations — 6.1 — 6.1Fund units and preferred shares Canadian fund units 74.8 — — 74.8 U.S. fund units 35.2 — — 35.2 International fund units 5.7 — — 5.7 Preferred shares 27.6 — — 27.6Investment fund 49.8 — — 49.8Cash and cash equivalents — 26.1 — 26.1Derivative financial instruments 1.2 27.5 — 28.7
204.6 2,759.8 — 2,964.4
Available-for-sale financial assetsBonds Canada, Quebec and other provinces — 143.4 — 143.4 Municipal and subsidized — 92.6 — 92.6 Canadian corporations — 216.9 — 216.9Fund units and preferred shares Canadian fund units 57.8 — — 57.8 U.S. fund units 56.6 — — 56.6 International fund units 14.6 — — 14.6 Emerging market fund units 14.8 — — 14.8 Preferred shares 81.7 — — 81.7
225.5 452.9 — 678.4
Financial liabilities at fair value through profit or lossDerivative financial instruments (0.9) (9.1) — (10.0)
The determination of the fair value hierarchy levels is performed at the end of each financial year. During the years ended December 31, 2017 and 2016, there were no transfers of financial assets between Levels 1 and 2.
NOTES TO THE CONSOLIDATED FINANCIAL STATEMENTS For the year ended December 31, 2017 (in millions of dollars, unless otherwise indicated)
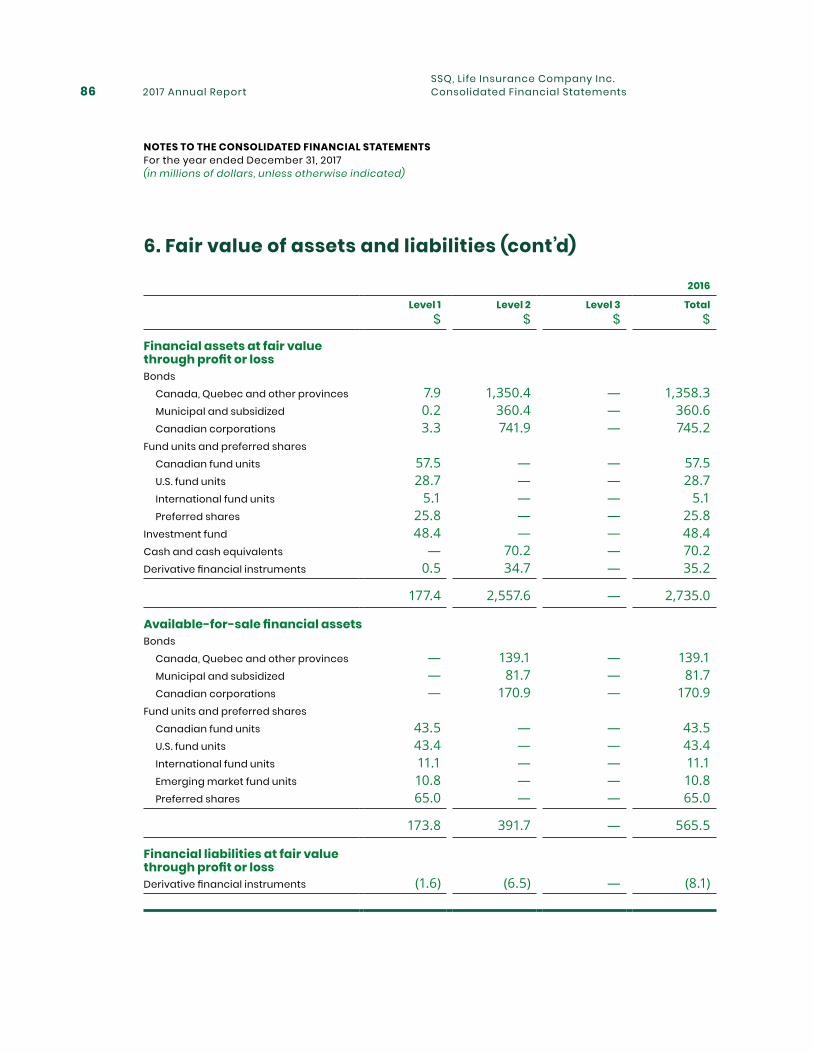
2017 Annual Report86SSQ, Life Insurance Company Inc.Consolidated Financial Statements
6. Fair value of assets and liabilities (cont’d)
2016
Level 1 Level 2 Level 3 Total$ $ $ $
Financial assets at fair value through profit or lossBonds Canada, Quebec and other provinces 7.9 1,350.4 — 1,358.3 Municipal and subsidized 0.2 360.4 — 360.6 Canadian corporations 3.3 741.9 — 745.2Fund units and preferred shares Canadian fund units 57.5 — — 57.5 U.S. fund units 28.7 — — 28.7 International fund units 5.1 — — 5.1 Preferred shares 25.8 — — 25.8Investment fund 48.4 — — 48.4Cash and cash equivalents — 70.2 — 70.2Derivative financial instruments 0.5 34.7 — 35.2
177.4 2,557.6 — 2,735.0
Available-for-sale financial assetsBonds Canada, Quebec and other provinces — 139.1 — 139.1 Municipal and subsidized — 81.7 — 81.7 Canadian corporations — 170.9 — 170.9Fund units and preferred shares Canadian fund units 43.5 — — 43.5 U.S. fund units 43.4 — — 43.4 International fund units 11.1 — — 11.1 Emerging market fund units 10.8 — — 10.8 Preferred shares 65.0 — — 65.0
173.8 391.7 — 565.5
Financial liabilities at fair value through profit or lossDerivative financial instruments (1.6) (6.5) — (8.1)
NOTES TO THE CONSOLIDATED FINANCIAL STATEMENTS For the year ended December 31, 2017 (in millions of dollars, unless otherwise indicated)
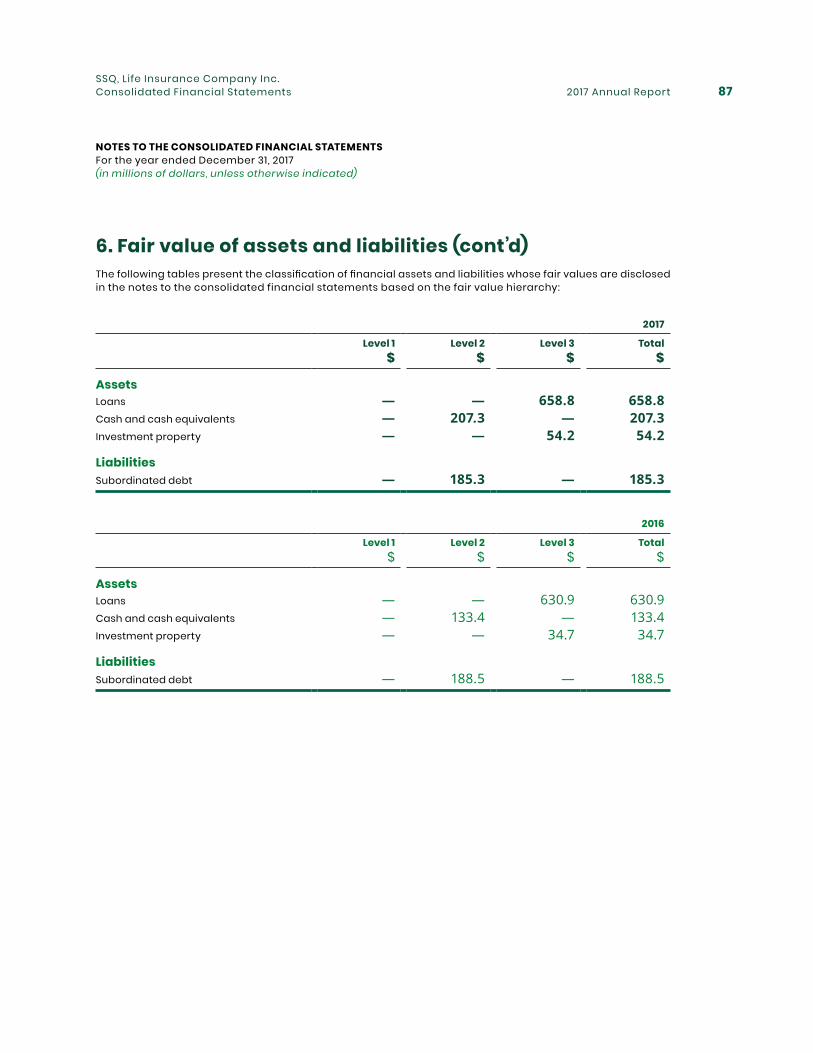
2017 Annual Report 87SSQ, Life Insurance Company Inc.Consolidated Financial Statements
6. Fair value of assets and liabilities (cont’d)The following tables present the classification of financial assets and liabilities whose fair values are disclosed in the notes to the consolidated financial statements based on the fair value hierarchy:
2017
Level 1 Level 2 Level 3 Total$ $ $ $
AssetsLoans — — 658.8 658.8Cash and cash equivalents — 207.3 — 207.3Investment property — — 54.2 54.2
LiabilitiesSubordinated debt — 185.3 — 185.3
2016
Level 1 Level 2 Level 3 Total$ $ $ $
AssetsLoans — — 630.9 630.9Cash and cash equivalents — 133.4 — 133.4Investment property — — 34.7 34.7
LiabilitiesSubordinated debt — 188.5 — 188.5
NOTES TO THE CONSOLIDATED FINANCIAL STATEMENTS For the year ended December 31, 2017 (in millions of dollars, unless otherwise indicated)
2017 Annual Report88SSQ, Life Insurance Company Inc.Consolidated Financial Statements
7. Financial instruments risk managementThe Company has adopted control policies and procedures to manage risks related to financial instruments. An investment policy was approved by the Board of Directors to provide a framework for making investment decisions. The control procedures arising from this policy ensure sound management of investment risks.
Segregated funds are excluded from the financial instruments risk management analysis since the policyholders assume the risks and benefit from the rewards of the segregated fund contracts.
Risks related to financial instruments are credit risk, liquidity risk and market risk.
Credit risk
Credit risk is the risk of financial loss to the Company if a debtor fails to honour its obligations. The Company is exposed to this type of risk through its investment portfolios and, in particular, through credit extended as loans. The Company is also exposed to credit risk with regard to outstanding premiums, amounts receivable from reinsurers and other assets. Securities lending operations also expose the Company to credit risk. It manages credit risk by applying the following control procedures:
• utilization guidelines that set minimum and maximum limits are established for each class of investment to meet the specific needs of each business sector;
• the guidelines allocate liability among various quality Canadian issuers with credit ratings from recognized sources of BBB or higher at trade date;
• an overall limit is established for each credit rating quality level;
• an overall limit is also established for investments of a related issuer or group of issuers to mitigate concentration risk;
• a detailed mortgage loan policy specifies the requirements for guarantees and credit;
• loans to insureds, included in other loans, correspond to the unpaid capital balances of policy loans and are fully secured by the cash surrender value of the insurance contracts on which the respective loans are made;
• the Investment Committee of the Board of Directors carries out regular reviews of the investment portfolio and its transactions;
• the Company enters into reinsurance agreements only with certified and non-certified reinsurers that have undergone an independent financial analysis. In addition, no non-traditional reinsurance agreements are entered into;
• for securities lending operations, credit risk is considered to be minimal since the value of the assets held as collateral by the Company represents at least 102% of the fair value of the securities loaned.
Exposure to credit risk is mainly mitigated by the minimum quality levels for bond issuers imposed by the investment policy, the consideration payable for futures contracts and the monitoring of the reinsurance process. In addition, the Company’s cash is invested with Canadian chartered banks and recognized financial institutions with superior credit ratings.
NOTES TO THE CONSOLIDATED FINANCIAL STATEMENTS For the year ended December 31, 2017 (in millions of dollars, unless otherwise indicated)
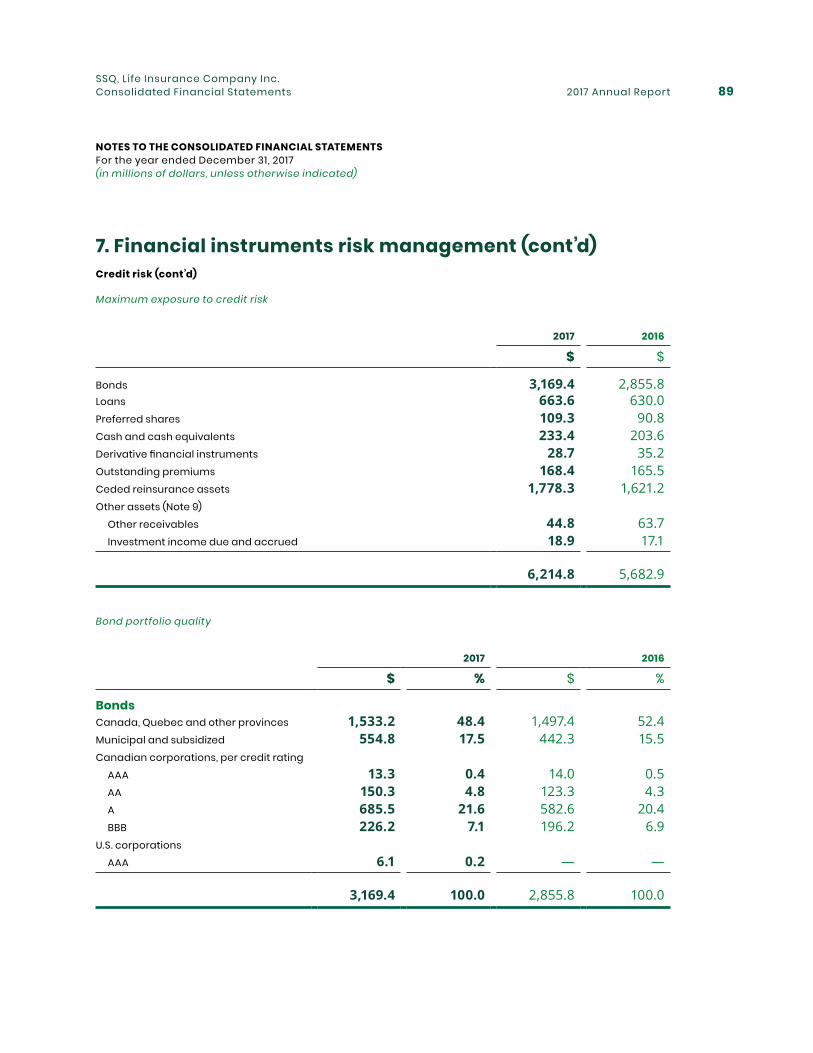
2017 Annual Report 89SSQ, Life Insurance Company Inc.Consolidated Financial Statements
7. Financial instruments risk management (cont’d)Credit risk (cont’d)
Maximum exposure to credit risk
2017 2016
$ $
Bonds 3,169.4 2,855.8Loans 663.6 630.0Preferred shares 109.3 90.8Cash and cash equivalents 233.4 203.6Derivative financial instruments 28.7 35.2Outstanding premiums 168.4 165.5Ceded reinsurance assets 1,778.3 1,621.2Other assets (Note 9) Other receivables 44.8 63.7 Investment income due and accrued 18.9 17.1
6,214.8 5,682.9
Bond portfolio quality
2017 2016
$ % $ %
BondsCanada, Quebec and other provinces 1,533.2 48.4 1,497.4 52.4Municipal and subsidized 554.8 17.5 442.3 15.5Canadian corporations, per credit rating AAA 13.3 0.4 14.0 0.5 AA 150.3 4.8 123.3 4.3 A 685.5 21.6 582.6 20.4 BBB 226.2 7.1 196.2 6.9U.S. corporations AAA 6.1 0.2 — —
3,169.4 100.0 2,855.8 100.0
NOTES TO THE CONSOLIDATED FINANCIAL STATEMENTS For the year ended December 31, 2017 (in millions of dollars, unless otherwise indicated)
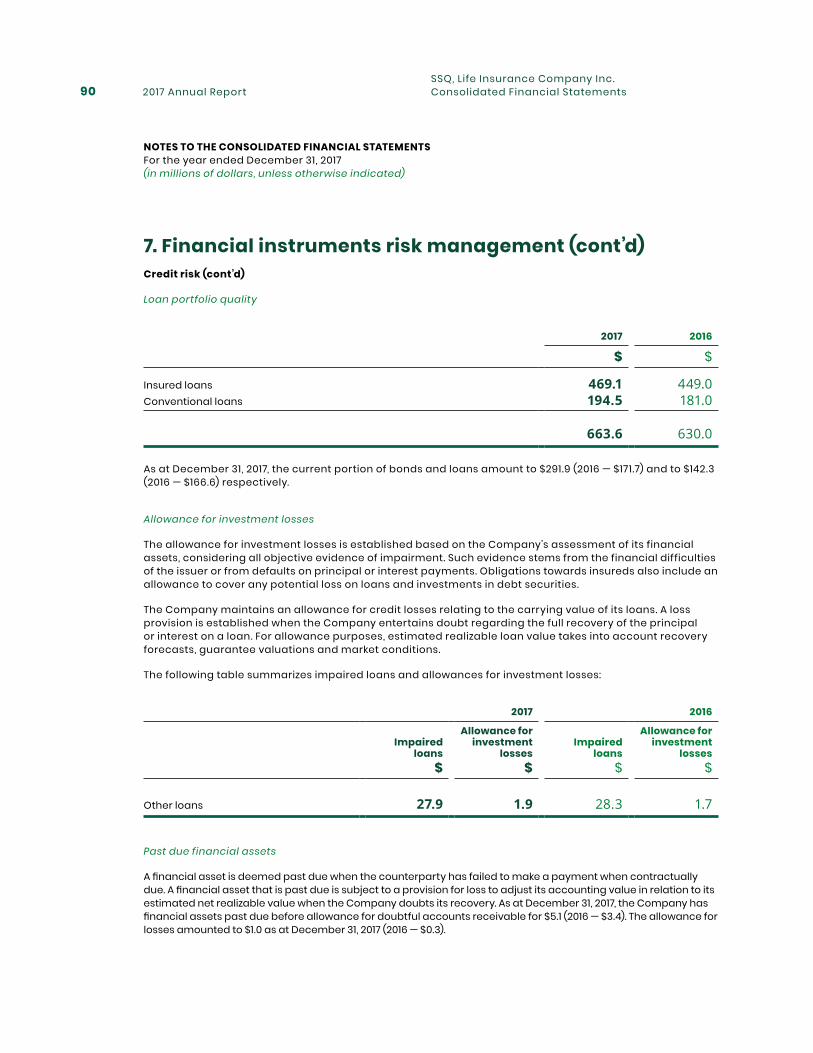
2017 Annual Report90SSQ, Life Insurance Company Inc.Consolidated Financial Statements
7. Financial instruments risk management (cont’d)Credit risk (cont’d)
Loan portfolio quality
2017 2016
$ $
Insured loans 469.1 449.0Conventional loans 194.5 181.0
663.6 630.0
As at December 31, 2017, the current portion of bonds and loans amount to $291.9 (2016 — $171.7) and to $142.3 (2016 — $166.6) respectively.
Allowance for investment losses
The allowance for investment losses is established based on the Company’s assessment of its financial assets, considering all objective evidence of impairment. Such evidence stems from the financial difficulties of the issuer or from defaults on principal or interest payments. Obligations towards insureds also include an allowance to cover any potential loss on loans and investments in debt securities.
The Company maintains an allowance for credit losses relating to the carrying value of its loans. A loss provision is established when the Company entertains doubt regarding the full recovery of the principal or interest on a loan. For allowance purposes, estimated realizable loan value takes into account recovery forecasts, guarantee valuations and market conditions.
The following table summarizes impaired loans and allowances for investment losses:
2017 2016
Impaired loans
Allowance for investment
lossesImpaired
loans
Allowance for investment
losses$ $ $ $
Other loans 27.9 1.9 28.3 1.7
Past due financial assets
A financial asset is deemed past due when the counterparty has failed to make a payment when contractually due. A financial asset that is past due is subject to a provision for loss to adjust its accounting value in relation to its estimated net realizable value when the Company doubts its recovery. As at December 31, 2017, the Company has financial assets past due before allowance for doubtful accounts receivable for $5.1 (2016 — $3.4). The allowance for losses amounted to $1.0 as at December 31, 2017 (2016 — $0.3).
NOTES TO THE CONSOLIDATED FINANCIAL STATEMENTS For the year ended December 31, 2017 (in millions of dollars, unless otherwise indicated)
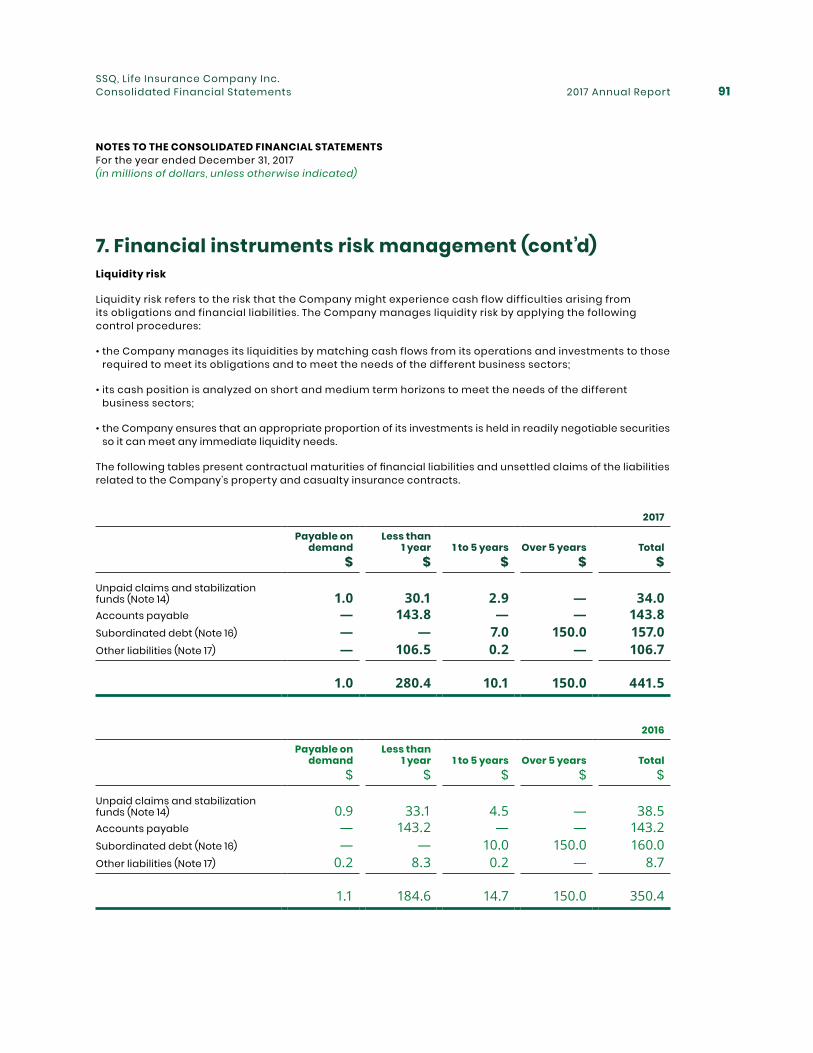
2017 Annual Report 91SSQ, Life Insurance Company Inc.Consolidated Financial Statements
7. Financial instruments risk management (cont’d)Liquidity risk
Liquidity risk refers to the risk that the Company might experience cash flow difficulties arising from its obligations and financial liabilities. The Company manages liquidity risk by applying the following control procedures:
• the Company manages its liquidities by matching cash flows from its operations and investments to those required to meet its obligations and to meet the needs of the different business sectors;
• its cash position is analyzed on short and medium term horizons to meet the needs of the different business sectors;
• the Company ensures that an appropriate proportion of its investments is held in readily negotiable securities so it can meet any immediate liquidity needs.
The following tables present contractual maturities of financial liabilities and unsettled claims of the liabilities related to the Company’s property and casualty insurance contracts.
2017
Payable on demand
Less than 1 year 1 to 5 years Over 5 years Total
$ $ $ $ $
Unpaid claims and stabilization funds (Note 14) 1.0 30.1 2.9 — 34.0Accounts payable — 143.8 — — 143.8Subordinated debt (Note 16) — — 7.0 150.0 157.0Other liabilities (Note 17) — 106.5 0.2 — 106.7
1.0 280.4 10.1 150.0 441.5
2016
Payable on demand
Less than 1 year 1 to 5 years Over 5 years Total
$ $ $ $ $
Unpaid claims and stabilization funds (Note 14) 0.9 33.1 4.5 — 38.5Accounts payable — 143.2 — — 143.2Subordinated debt (Note 16) — — 10.0 150.0 160.0Other liabilities (Note 17) 0.2 8.3 0.2 — 8.7
1.1 184.6 14.7 150.0 350.4
NOTES TO THE CONSOLIDATED FINANCIAL STATEMENTS For the year ended December 31, 2017 (in millions of dollars, unless otherwise indicated)
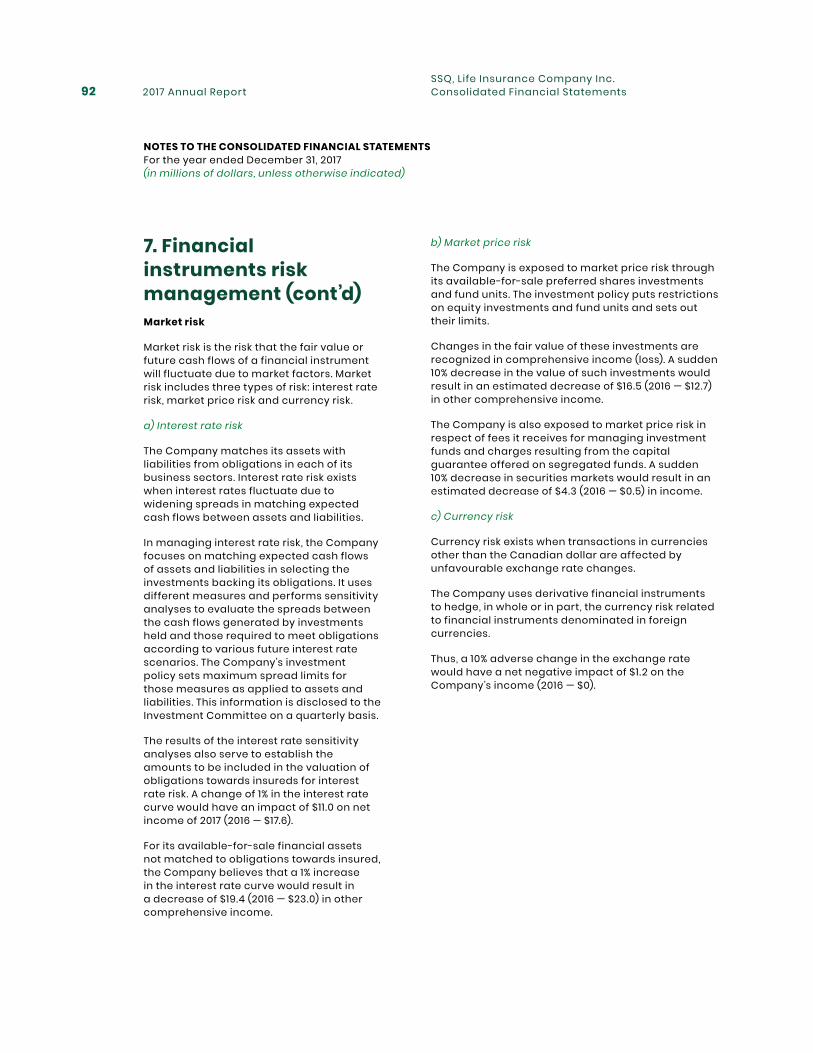
2017 Annual Report92SSQ, Life Insurance Company Inc.Consolidated Financial Statements
7. Financial instruments risk management (cont’d)Market risk
Market risk is the risk that the fair value or future cash flows of a financial instrument will fluctuate due to market factors. Market risk includes three types of risk: interest rate risk, market price risk and currency risk.
a) Interest rate risk
The Company matches its assets with liabilities from obligations in each of its business sectors. Interest rate risk exists when interest rates fluctuate due to widening spreads in matching expected cash flows between assets and liabilities.
In managing interest rate risk, the Company focuses on matching expected cash flows of assets and liabilities in selecting the investments backing its obligations. It uses different measures and performs sensitivity analyses to evaluate the spreads between the cash flows generated by investments held and those required to meet obligations according to various future interest rate scenarios. The Company’s investment policy sets maximum spread limits for those measures as applied to assets and liabilities. This information is disclosed to the Investment Committee on a quarterly basis.
The results of the interest rate sensitivity analyses also serve to establish the amounts to be included in the valuation of obligations towards insureds for interest rate risk. A change of 1% in the interest rate curve would have an impact of $11 .0 on net income of 2017 (2016 — $17.6).
For its available-for-sale financial assets not matched to obligations towards insured, the Company believes that a 1% increase in the interest rate curve would result in a decrease of $19.4 (2016 — $23.0) in other comprehensive income.
b) Market price risk
The Company is exposed to market price risk through its available-for-sale preferred shares investments and fund units. The investment policy puts restrictions on equity investments and fund units and sets out their limits.
Changes in the fair value of these investments are recognized in comprehensive income (loss). A sudden 10% decrease in the value of such investments would result in an estimated decrease of $16.5 (2016 — $12.7) in other comprehensive income.
The Company is also exposed to market price risk in respect of fees it receives for managing investment funds and charges resulting from the capital guarantee offered on segregated funds. A sudden 10% decrease in securities markets would result in an estimated decrease of $4.3 (2016 — $0.5) in income.
c) Currency risk
Currency risk exists when transactions in currencies other than the Canadian dollar are affected by unfavourable exchange rate changes.
The Company uses derivative financial instruments to hedge, in whole or in part, the currency risk related to financial instruments denominated in foreign currencies.
Thus, a 10% adverse change in the exchange rate would have a net negative impact of $1.2 on the Company’s income (2016 — $0).
NOTES TO THE CONSOLIDATED FINANCIAL STATEMENTS For the year ended December 31, 2017 (in millions of dollars, unless otherwise indicated)
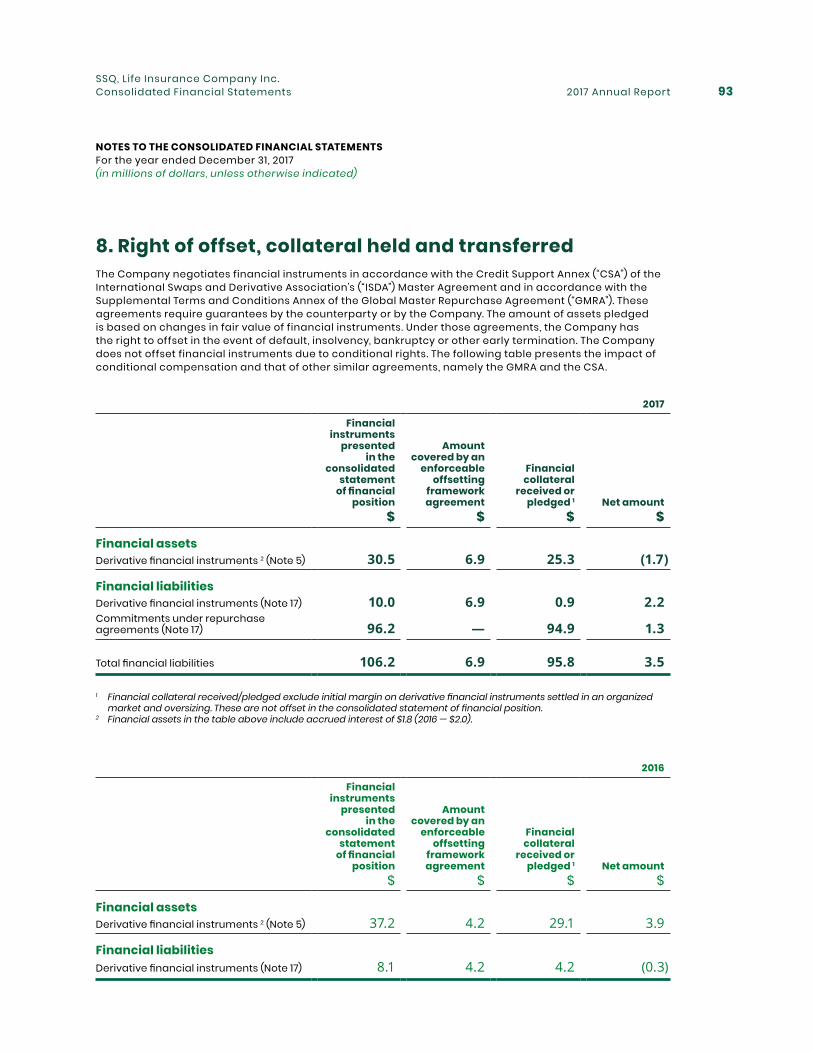
2017 Annual Report 93SSQ, Life Insurance Company Inc.Consolidated Financial Statements
8. Right of offset, collateral held and transferredThe Company negotiates financial instruments in accordance with the Credit Support Annex (“CSA”) of the International Swaps and Derivative Association’s (“ISDA”) Master Agreement and in accordance with the Supplemental Terms and Conditions Annex of the Global Master Repurchase Agreement (“GMRA”). These agreements require guarantees by the counterparty or by the Company. The amount of assets pledged is based on changes in fair value of financial instruments. Under those agreements, the Company has the right to offset in the event of default, insolvency, bankruptcy or other early termination. The Company does not offset financial instruments due to conditional rights. The following table presents the impact of conditional compensation and that of other similar agreements, namely the GMRA and the CSA.
2017
Financial instruments
presented in the
consolidated statement
of financial position
Amount covered by an
enforceable offsetting
framework agreement
Financial collateral
received or pledged 1 Net amount
$ $ $ $
Financial assetsDerivative financial instruments 2 (Note 5) 30.5 6.9 25.3 (1.7)
Financial liabilitiesDerivative financial instruments (Note 17) 10.0 6.9 0.9 2.2Commitments under repurchase agreements (Note 17) 96.2 — 94.9 1.3
Total financial liabilities 106.2 6.9 95.8 3.5
1 Financial collateral received/pledged exclude initial margin on derivative financial instruments settled in an organized market and oversizing. These are not offset in the consolidated statement of financial position.
2 Financial assets in the table above include accrued interest of $1.8 (2016 — $2.0).
2016
Financial instruments
presented in the
consolidated statement
of financial position
Amount covered by an
enforceable offsetting
framework agreement
Financial collateral
received or pledged 1 Net amount
$ $ $ $
Financial assetsDerivative financial instruments 2 (Note 5) 37.2 4.2 29.1 3.9
Financial liabilitiesDerivative financial instruments (Note 17) 8.1 4.2 4.2 (0.3)
NOTES TO THE CONSOLIDATED FINANCIAL STATEMENTS For the year ended December 31, 2017 (in millions of dollars, unless otherwise indicated)
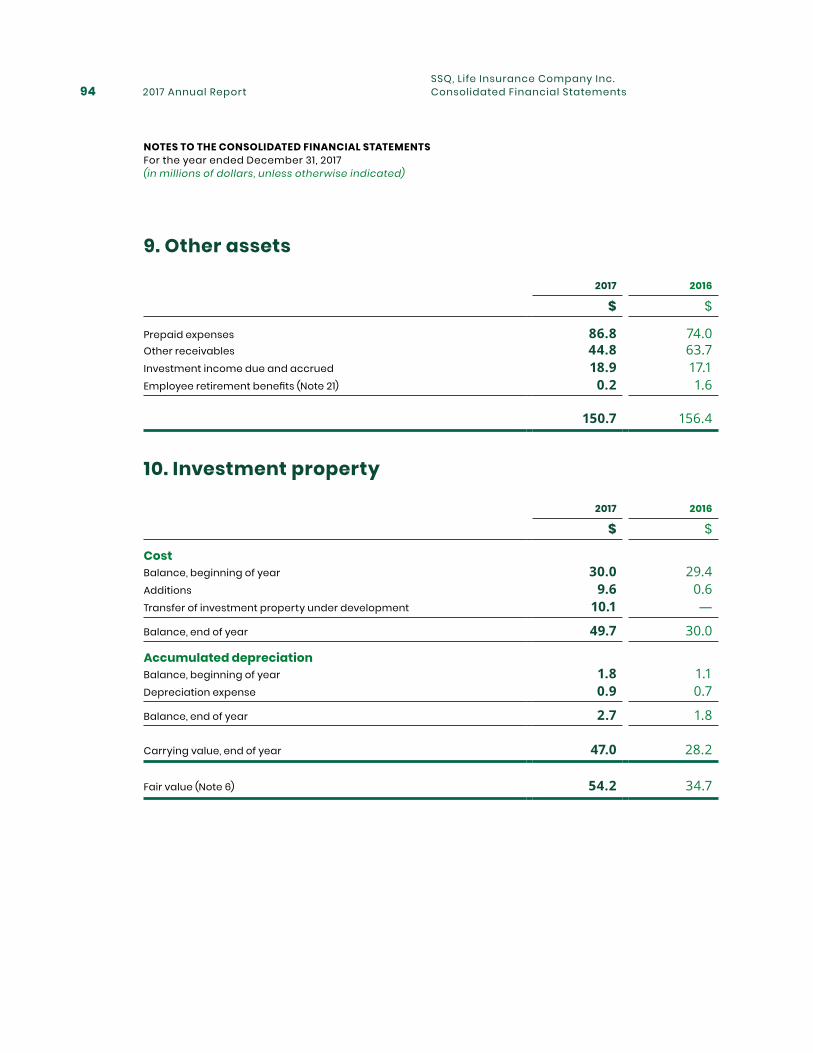
2017 Annual Report94SSQ, Life Insurance Company Inc.Consolidated Financial Statements
9. Other assets
2017 2016
$ $
Prepaid expenses 86.8 74.0Other receivables 44.8 63.7Investment income due and accrued 18.9 17.1Employee retirement benefits (Note 21) 0.2 1.6
150.7 156.4
10. Investment property
2017 2016
$ $
CostBalance, beginning of year 30.0 29.4Additions 9.6 0.6Transfer of investment property under development 10.1 —
Balance, end of year 49.7 30.0
Accumulated depreciationBalance, beginning of year 1.8 1.1Depreciation expense 0.9 0.7
Balance, end of year 2.7 1.8
Carrying value, end of year 47.0 28.2
Fair value (Note 6) 54.2 34.7
NOTES TO THE CONSOLIDATED FINANCIAL STATEMENTS For the year ended December 31, 2017 (in millions of dollars, unless otherwise indicated)
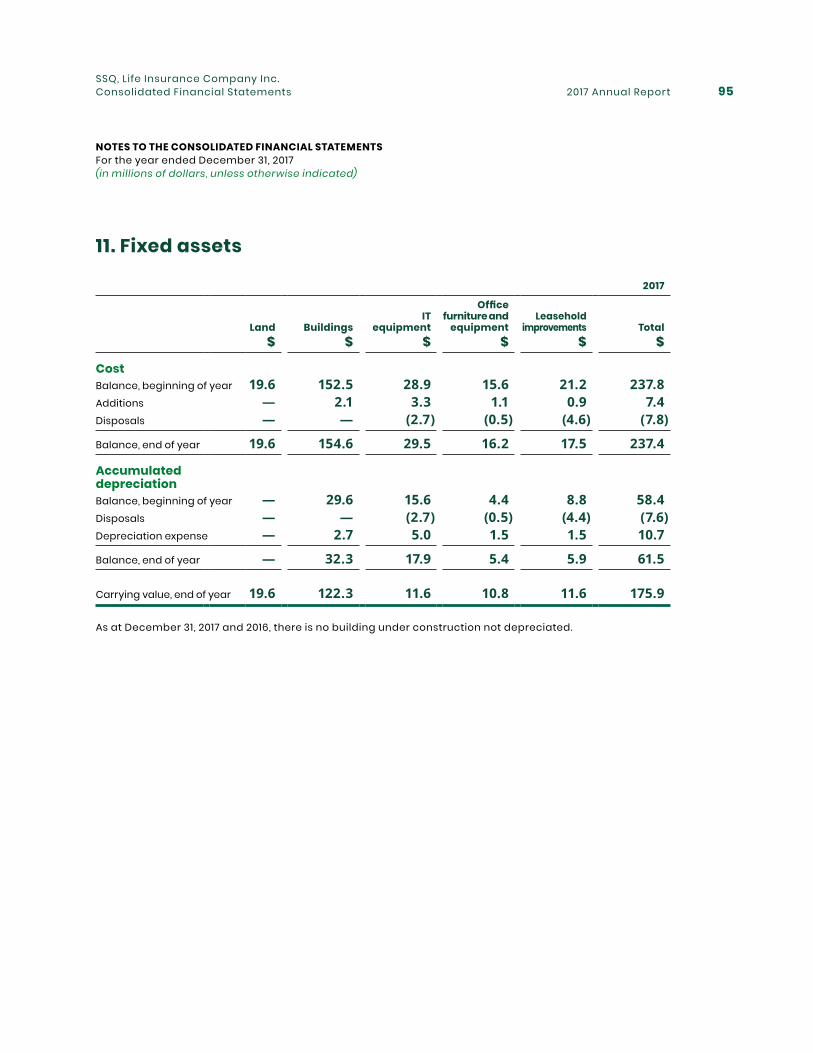
2017 Annual Report 95SSQ, Life Insurance Company Inc.Consolidated Financial Statements
11. Fixed assets
2017
Land BuildingsIT
equipment
Office furniture and
equipmentLeasehold
improvements Total$ $ $ $ $ $
CostBalance, beginning of year 19.6 152.5 28.9 15.6 21.2 237.8Additions — 2.1 3.3 1.1 0.9 7.4Disposals — — (2.7) (0.5) (4.6) (7.8)
Balance, end of year 19.6 154.6 29.5 16.2 17.5 237.4
Accumulated depreciationBalance, beginning of year — 29.6 15.6 4.4 8.8 58.4 Disposals — — (2.7) (0.5) (4.4) (7.6)Depreciation expense — 2.7 5.0 1.5 1.5 10.7
Balance, end of year — 32.3 17.9 5.4 5.9 61.5
Carrying value, end of year 19.6 122.3 11.6 10.8 11.6 175.9
As at December 31, 2017 and 2016, there is no building under construction not depreciated.
NOTES TO THE CONSOLIDATED FINANCIAL STATEMENTS For the year ended December 31, 2017 (in millions of dollars, unless otherwise indicated)
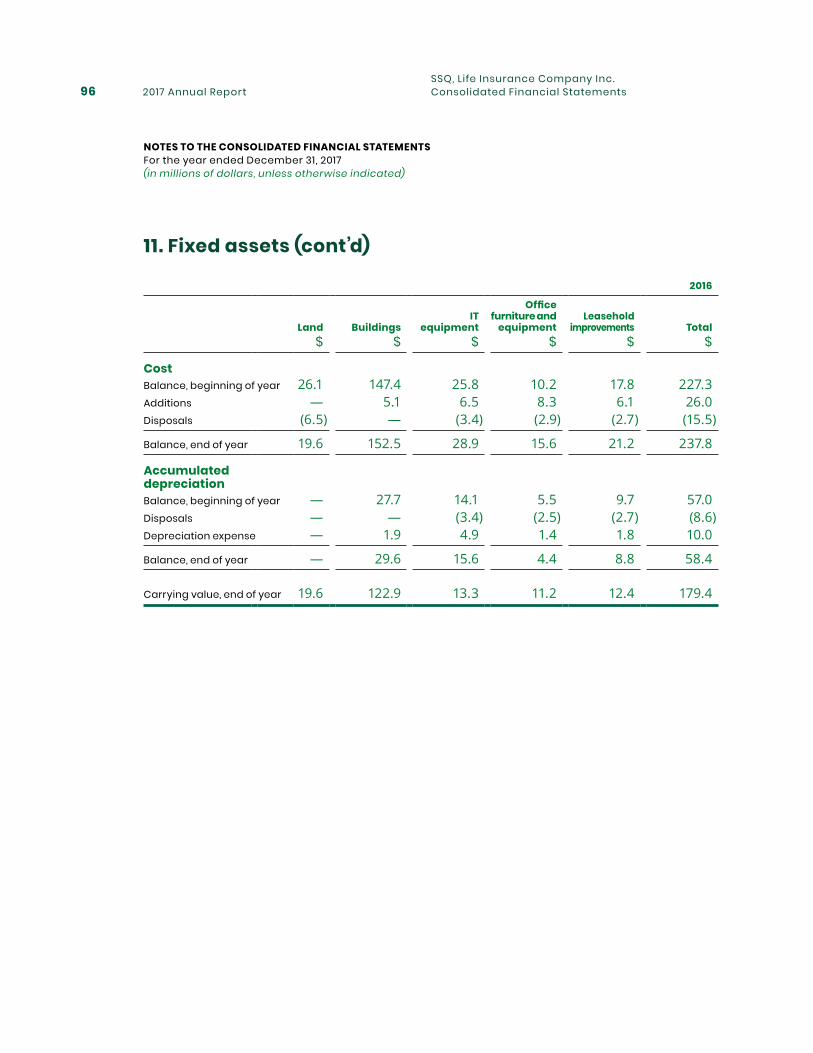
2017 Annual Report96SSQ, Life Insurance Company Inc.Consolidated Financial Statements
11. Fixed assets (cont’d)
2016
Land BuildingsIT
equipment
Office furniture and
equipmentLeasehold
improvements Total$ $ $ $ $ $
CostBalance, beginning of year 26.1 147.4 25.8 10.2 17.8 227.3Additions — 5.1 6.5 8.3 6.1 26.0Disposals (6.5) — (3.4) (2.9) (2.7) (15.5)
Balance, end of year 19.6 152.5 28.9 15.6 21.2 237.8
Accumulated depreciationBalance, beginning of year — 27.7 14.1 5.5 9.7 57.0Disposals — — (3.4) (2.5) (2.7) (8.6)Depreciation expense — 1.9 4.9 1.4 1.8 10.0
Balance, end of year — 29.6 15.6 4.4 8.8 58.4
Carrying value, end of year 19.6 122.9 13.3 11.2 12.4 179.4
NOTES TO THE CONSOLIDATED FINANCIAL STATEMENTS For the year ended December 31, 2017 (in millions of dollars, unless otherwise indicated)
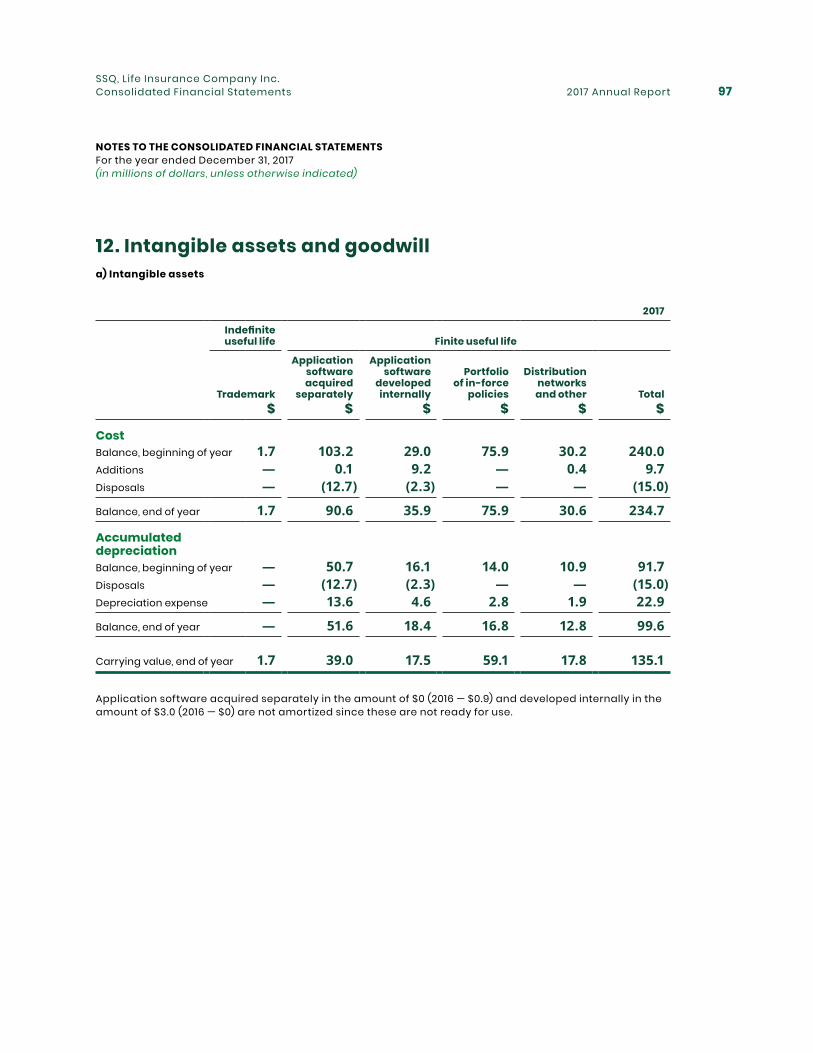
2017 Annual Report 97SSQ, Life Insurance Company Inc.Consolidated Financial Statements
12. Intangible assets and goodwilla) Intangible assets
2017
Indefinite useful life Finite useful life
Trademark
Application software acquired
separately
Application software
developed internally
Portfolio of in-force
policies
Distribution networks
and other Total$ $ $ $ $ $
CostBalance, beginning of year 1.7 103.2 29.0 75.9 30.2 240.0Additions — 0.1 9.2 — 0.4 9.7Disposals — (12.7) (2.3) — — (15.0)
Balance, end of year 1.7 90.6 35.9 75.9 30.6 234.7
Accumulated depreciationBalance, beginning of year — 50.7 16.1 14.0 10.9 91.7Disposals — (12.7) (2.3) — — (15.0)Depreciation expense — 13.6 4.6 2.8 1.9 22.9
Balance, end of year — 51.6 18.4 16.8 12.8 99.6
Carrying value, end of year 1.7 39.0 17.5 59.1 17.8 135.1
Application software acquired separately in the amount of $0 (2016 — $0.9) and developed internally in the amount of $3.0 (2016 — $0) are not amortized since these are not ready for use.
NOTES TO THE CONSOLIDATED FINANCIAL STATEMENTS For the year ended December 31, 2017 (in millions of dollars, unless otherwise indicated)
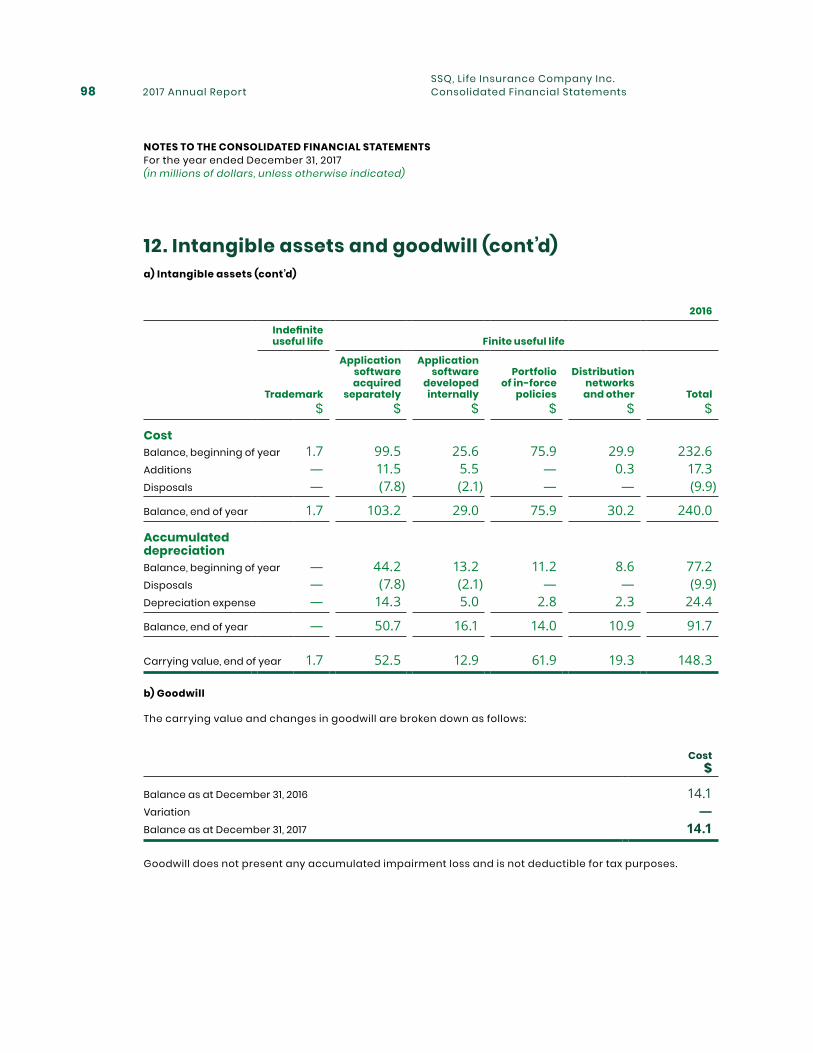
2017 Annual Report98SSQ, Life Insurance Company Inc.Consolidated Financial Statements
12. Intangible assets and goodwill (cont’d)a) Intangible assets (cont’d)
2016
Indefinite useful life Finite useful life
Trademark
Application software acquired
separately
Application software
developed internally
Portfolio of in-force
policies
Distribution networks
and other Total$ $ $ $ $ $
CostBalance, beginning of year 1.7 99.5 25.6 75.9 29.9 232.6Additions — 11.5 5.5 — 0.3 17.3Disposals — (7.8) (2.1) — — (9.9)
Balance, end of year 1.7 103.2 29.0 75.9 30.2 240.0
Accumulated depreciationBalance, beginning of year — 44.2 13.2 11.2 8.6 77.2Disposals — (7.8) (2.1) — — (9.9)Depreciation expense — 14.3 5.0 2.8 2.3 24.4
Balance, end of year — 50.7 16.1 14.0 10.9 91.7
Carrying value, end of year 1.7 52.5 12.9 61.9 19.3 148.3
b) Goodwill
The carrying value and changes in goodwill are broken down as follows:
Cost$
Balance as at December 31, 2016 14.1Variation —Balance as at December 31, 2017 14.1
Goodwill does not present any accumulated impairment loss and is not deductible for tax purposes.
NOTES TO THE CONSOLIDATED FINANCIAL STATEMENTS For the year ended December 31, 2017 (in millions of dollars, unless otherwise indicated)
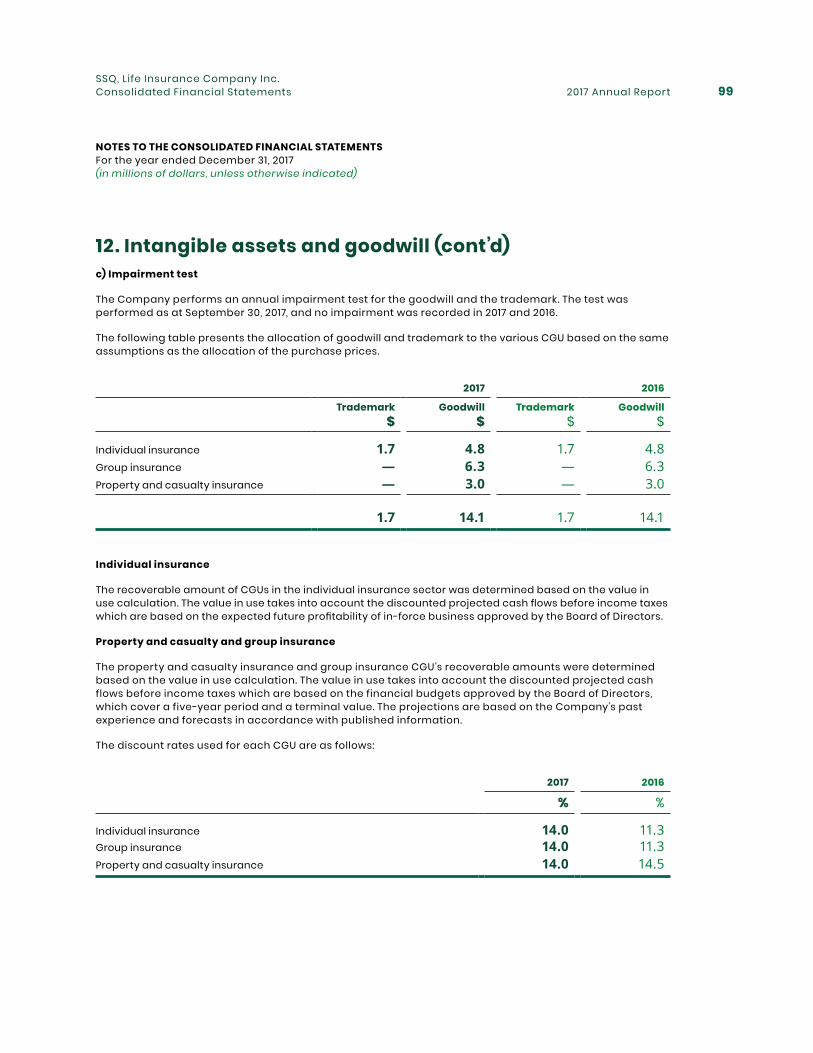
2017 Annual Report 99SSQ, Life Insurance Company Inc.Consolidated Financial Statements
12. Intangible assets and goodwill (cont’d)c) Impairment test
The Company performs an annual impairment test for the goodwill and the trademark. The test was performed as at September 30, 2017, and no impairment was recorded in 2017 and 2016.
The following table presents the allocation of goodwill and trademark to the various CGU based on the same assumptions as the allocation of the purchase prices.
2017 2016
Trademark Goodwill Trademark Goodwill$ $ $ $
Individual insurance 1.7 4.8 1.7 4.8Group insurance — 6.3 — 6.3Property and casualty insurance — 3.0 — 3.0
1.7 14.1 1.7 14.1
Individual insurance
The recoverable amount of CGUs in the individual insurance sector was determined based on the value in use calculation. The value in use takes into account the discounted projected cash flows before income taxes which are based on the expected future profitability of in-force business approved by the Board of Directors.
Property and casualty and group insurance
The property and casualty insurance and group insurance CGU’s recoverable amounts were determined based on the value in use calculation. The value in use takes into account the discounted projected cash flows before income taxes which are based on the financial budgets approved by the Board of Directors, which cover a five-year period and a terminal value. The projections are based on the Company’s past experience and forecasts in accordance with published information.
The discount rates used for each CGU are as follows:
2017 2016
% %
Individual insurance 14.0 11.3Group insurance 14.0 11.3Property and casualty insurance 14.0 14.5
NOTES TO THE CONSOLIDATED FINANCIAL STATEMENTS For the year ended December 31, 2017 (in millions of dollars, unless otherwise indicated)
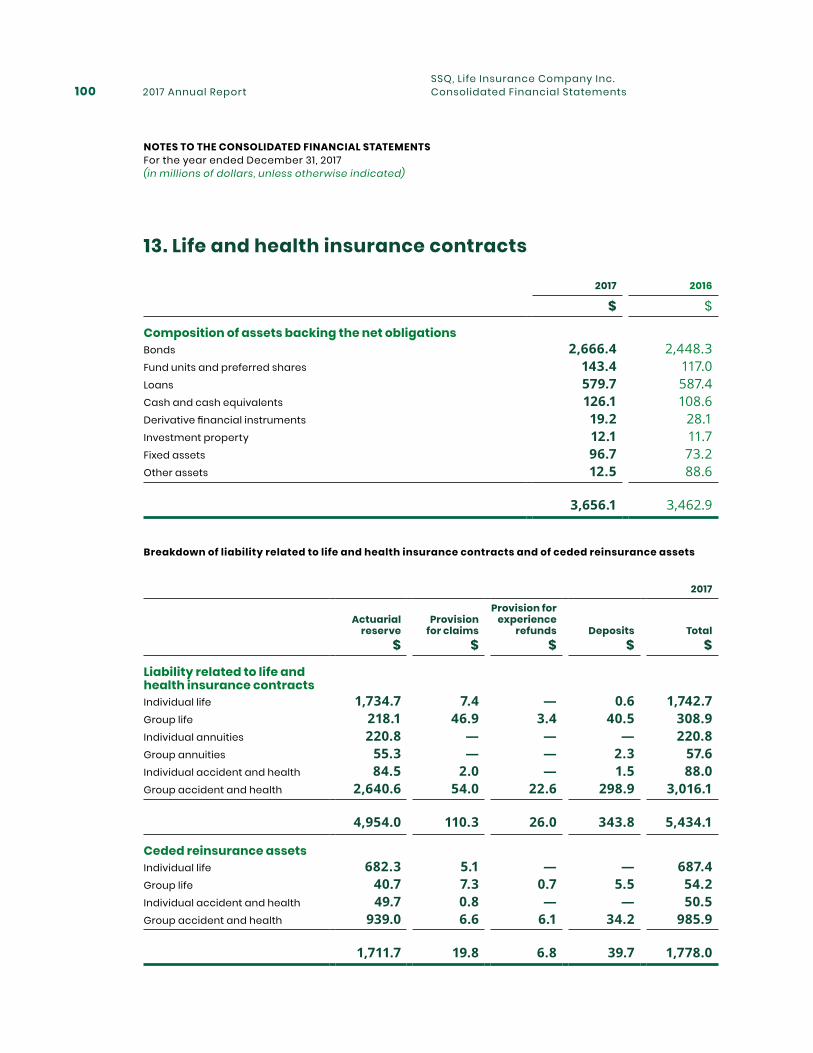
2017 Annual Report100SSQ, Life Insurance Company Inc.Consolidated Financial Statements
13. Life and health insurance contracts
2017 2016
$ $
Composition of assets backing the net obligationsBonds 2,666.4 2,448.3Fund units and preferred shares 143.4 117.0Loans 579.7 587.4Cash and cash equivalents 126.1 108.6Derivative financial instruments 19.2 28.1Investment property 12.1 11.7Fixed assets 96.7 73.2Other assets 12.5 88.6
3,656.1 3,462.9
Breakdown of liability related to life and health insurance contracts and of ceded reinsurance assets
2017
Actuarial reserve
Provision for claims
Provision for experience
refunds Deposits Total$ $ $ $ $
Liability related to life and health insurance contractsIndividual life 1,734.7 7.4 — 0.6 1,742.7Group life 218.1 46.9 3.4 40.5 308.9Individual annuities 220.8 — — — 220.8Group annuities 55.3 — — 2.3 57.6Individual accident and health 84.5 2.0 — 1.5 88.0Group accident and health 2,640.6 54.0 22.6 298.9 3,016.1
4,954.0 110.3 26.0 343.8 5,434.1
Ceded reinsurance assetsIndividual life 682.3 5.1 — — 687.4Group life 40.7 7.3 0.7 5.5 54.2Individual accident and health 49.7 0.8 — — 50.5Group accident and health 939.0 6.6 6.1 34.2 985.9
1,711.7 19.8 6.8 39.7 1,778.0
NOTES TO THE CONSOLIDATED FINANCIAL STATEMENTS For the year ended December 31, 2017 (in millions of dollars, unless otherwise indicated)
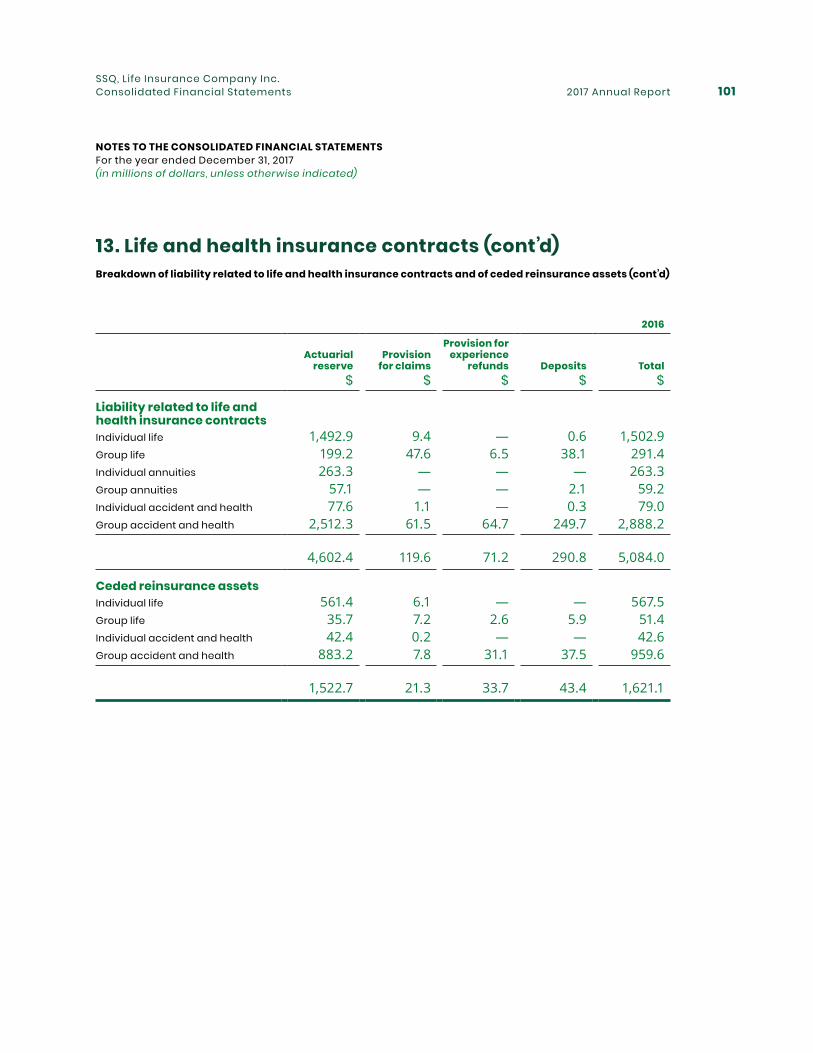
2017 Annual Report 101SSQ, Life Insurance Company Inc.Consolidated Financial Statements
13. Life and health insurance contracts (cont’d)Breakdown of liability related to life and health insurance contracts and of ceded reinsurance assets (cont’d)
2016
Actuarial reserve
Provision for claims
Provision for experience
refunds Deposits Total$ $ $ $ $
Liability related to life and health insurance contractsIndividual life 1,492.9 9.4 — 0.6 1,502.9Group life 199.2 47.6 6.5 38.1 291.4Individual annuities 263.3 — — — 263.3Group annuities 57.1 — — 2.1 59.2Individual accident and health 77.6 1.1 — 0.3 79.0Group accident and health 2,512.3 61.5 64.7 249.7 2,888.2
4,602.4 119.6 71.2 290.8 5,084.0
Ceded reinsurance assetsIndividual life 561.4 6.1 — — 567.5Group life 35.7 7.2 2.6 5.9 51.4Individual accident and health 42.4 0.2 — — 42.6Group accident and health 883.2 7.8 31.1 37.5 959.6
1,522.7 21.3 33.7 43.4 1,621.1
NOTES TO THE CONSOLIDATED FINANCIAL STATEMENTS For the year ended December 31, 2017 (in millions of dollars, unless otherwise indicated)
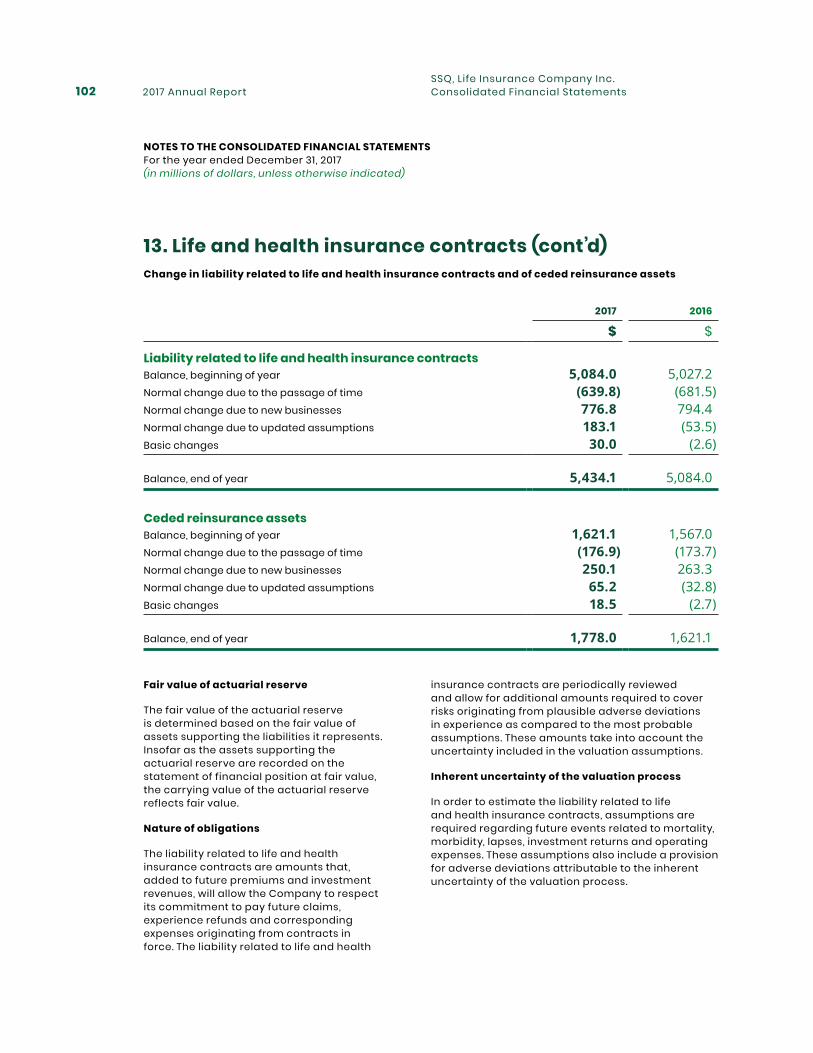
2017 Annual Report102SSQ, Life Insurance Company Inc.Consolidated Financial Statements
13. Life and health insurance contracts (cont’d)Change in liability related to life and health insurance contracts and of ceded reinsurance assets
2017 2016
$ $
Liability related to life and health insurance contracts Balance, beginning of year 5,084.0 5,027.2Normal change due to the passage of time (639.8) (681.5)Normal change due to new businesses 776.8 794.4Normal change due to updated assumptions 183.1 (53.5)Basic changes 30.0 (2.6)
Balance, end of year 5,434.1 5,084.0
Ceded reinsurance assetsBalance, beginning of year 1,621.1 1,567.0Normal change due to the passage of time (176.9) (173.7)Normal change due to new businesses 250.1 263.3Normal change due to updated assumptions 65.2 (32.8)Basic changes 18.5 (2.7)
Balance, end of year 1,778.0 1,621.1
Fair value of actuarial reserve
The fair value of the actuarial reserve is determined based on the fair value of assets supporting the liabilities it represents. Insofar as the assets supporting the actuarial reserve are recorded on the statement of financial position at fair value, the carrying value of the actuarial reserve reflects fair value.
Nature of obligations
The liability related to life and health insurance contracts are amounts that, added to future premiums and investment revenues, will allow the Company to respect its commitment to pay future claims, experience refunds and corresponding expenses originating from contracts in force. The liability related to life and health
insurance contracts are periodically reviewed and allow for additional amounts required to cover risks originating from plausible adverse deviations in experience as compared to the most probable assumptions. These amounts take into account the uncertainty included in the valuation assumptions.
Inherent uncertainty of the valuation process
In order to estimate the liability related to life and health insurance contracts, assumptions are required regarding future events related to mortality, morbidity, lapses, investment returns and operating expenses. These assumptions also include a provision for adverse deviations attributable to the inherent uncertainty of the valuation process.
NOTES TO THE CONSOLIDATED FINANCIAL STATEMENTS For the year ended December 31, 2017 (in millions of dollars, unless otherwise indicated)
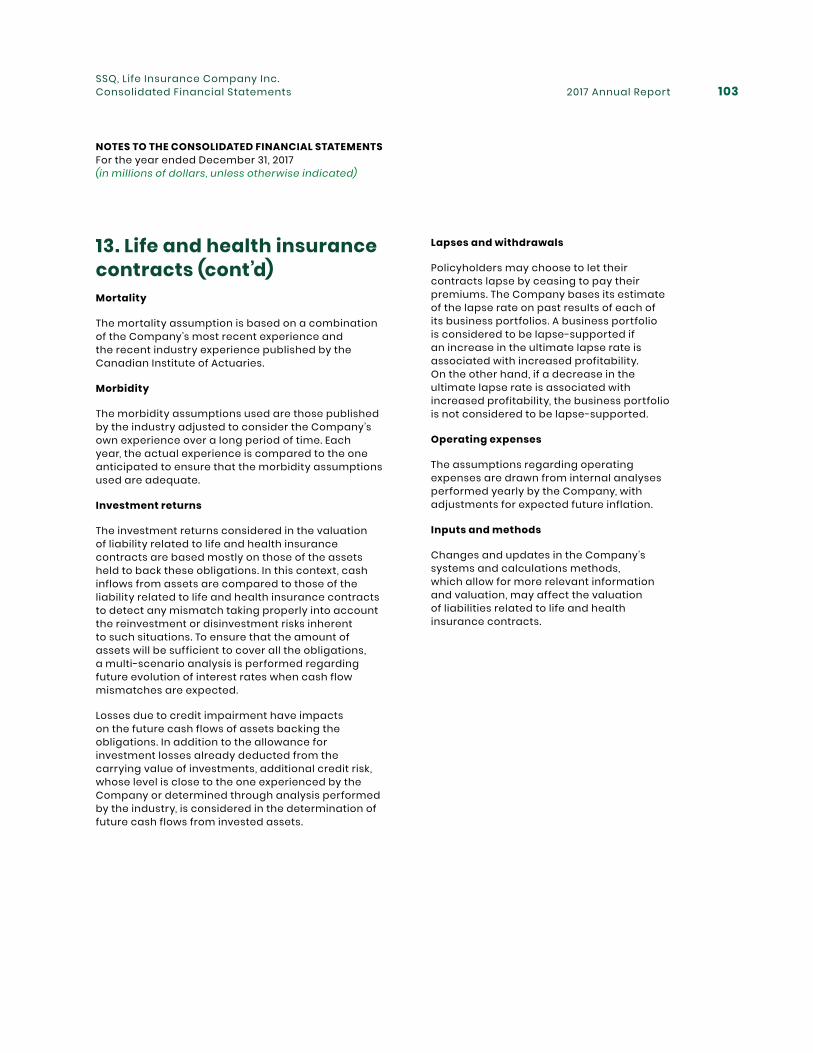
2017 Annual Report 103SSQ, Life Insurance Company Inc.Consolidated Financial Statements
13. Life and health insurance contracts (cont’d)Mortality
The mortality assumption is based on a combination of the Company’s most recent experience and the recent industry experience published by the Canadian Institute of Actuaries.
Morbidity
The morbidity assumptions used are those published by the industry adjusted to consider the Company’s own experience over a long period of time. Each year, the actual experience is compared to the one anticipated to ensure that the morbidity assumptions used are adequate.
Investment returns
The investment returns considered in the valuation of liability related to life and health insurance contracts are based mostly on those of the assets held to back these obligations. In this context, cash inflows from assets are compared to those of the liability related to life and health insurance contracts to detect any mismatch taking properly into account the reinvestment or disinvestment risks inherent to such situations. To ensure that the amount of assets will be sufficient to cover all the obligations, a multi-scenario analysis is performed regarding future evolution of interest rates when cash flow mismatches are expected.
Losses due to credit impairment have impacts on the future cash flows of assets backing the obligations. In addition to the allowance for investment losses already deducted from the carrying value of investments, additional credit risk, whose level is close to the one experienced by the Company or determined through analysis performed by the industry, is considered in the determination of future cash flows from invested assets.
Lapses and withdrawals
Policyholders may choose to let their contracts lapse by ceasing to pay their premiums. The Company bases its estimate of the lapse rate on past results of each of its business portfolios. A business portfolio is considered to be lapse-supported if an increase in the ultimate lapse rate is associated with increased profitability. On the other hand, if a decrease in the ultimate lapse rate is associated with increased profitability, the business portfolio is not considered to be lapse-supported.
Operating expenses
The assumptions regarding operating expenses are drawn from internal analyses performed yearly by the Company, with adjustments for expected future inflation.
Inputs and methods
Changes and updates in the Company’s systems and calculations methods, which allow for more relevant information and valuation, may affect the valuation of liabilities related to life and health insurance contracts.
NOTES TO THE CONSOLIDATED FINANCIAL STATEMENTS For the year ended December 31, 2017 (in millions of dollars, unless otherwise indicated)
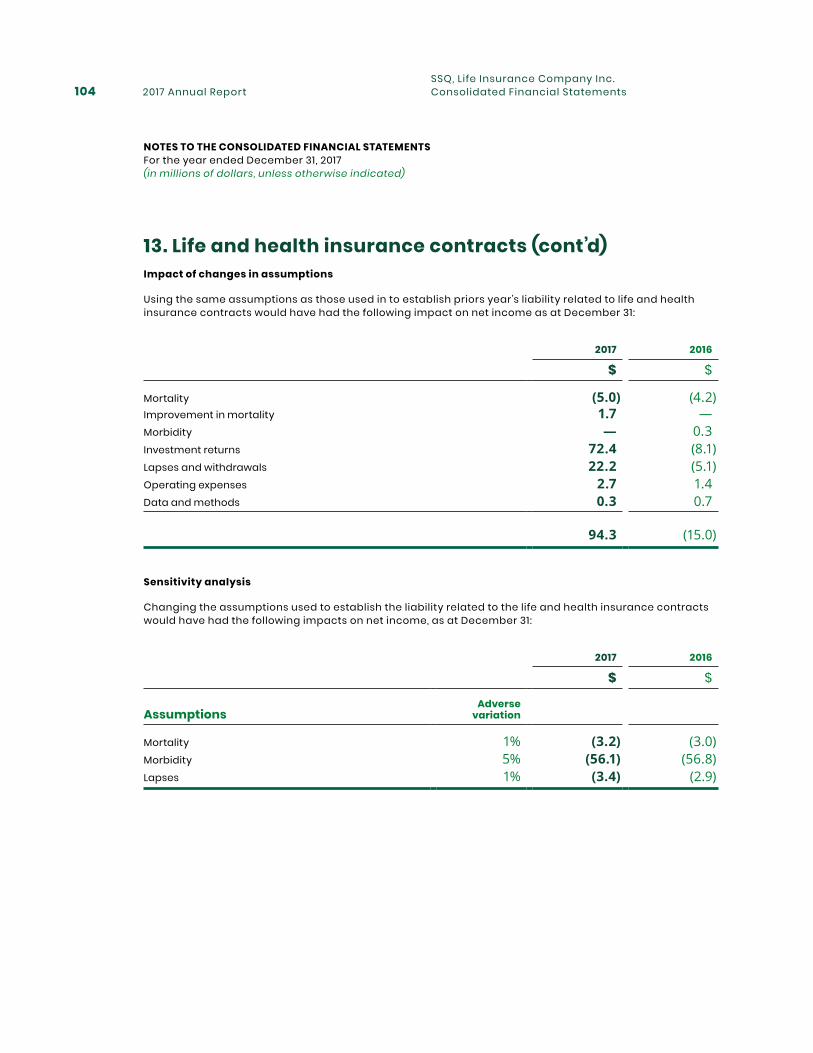
2017 Annual Report104SSQ, Life Insurance Company Inc.Consolidated Financial Statements
13. Life and health insurance contracts (cont’d)Impact of changes in assumptions
Using the same assumptions as those used in to establish priors year’s liability related to life and health insurance contracts would have had the following impact on net income as at December 31:
2017 2016
$ $
Mortality (5.0) (4.2)Improvement in mortality 1.7 —Morbidity — 0.3Investment returns 72.4 (8.1)Lapses and withdrawals 22.2 (5.1)Operating expenses 2.7 1.4Data and methods 0.3 0.7
94.3 (15.0)
Sensitivity analysis
Changing the assumptions used to establish the liability related to the life and health insurance contracts would have had the following impacts on net income, as at December 31:
2017 2016
$ $
AssumptionsAdverse
variation
Mortality 1% (3.2) (3.0)Morbidity 5% (56.1) (56.8)Lapses 1% (3.4) (2.9)
NOTES TO THE CONSOLIDATED FINANCIAL STATEMENTS For the year ended December 31, 2017 (in millions of dollars, unless otherwise indicated)
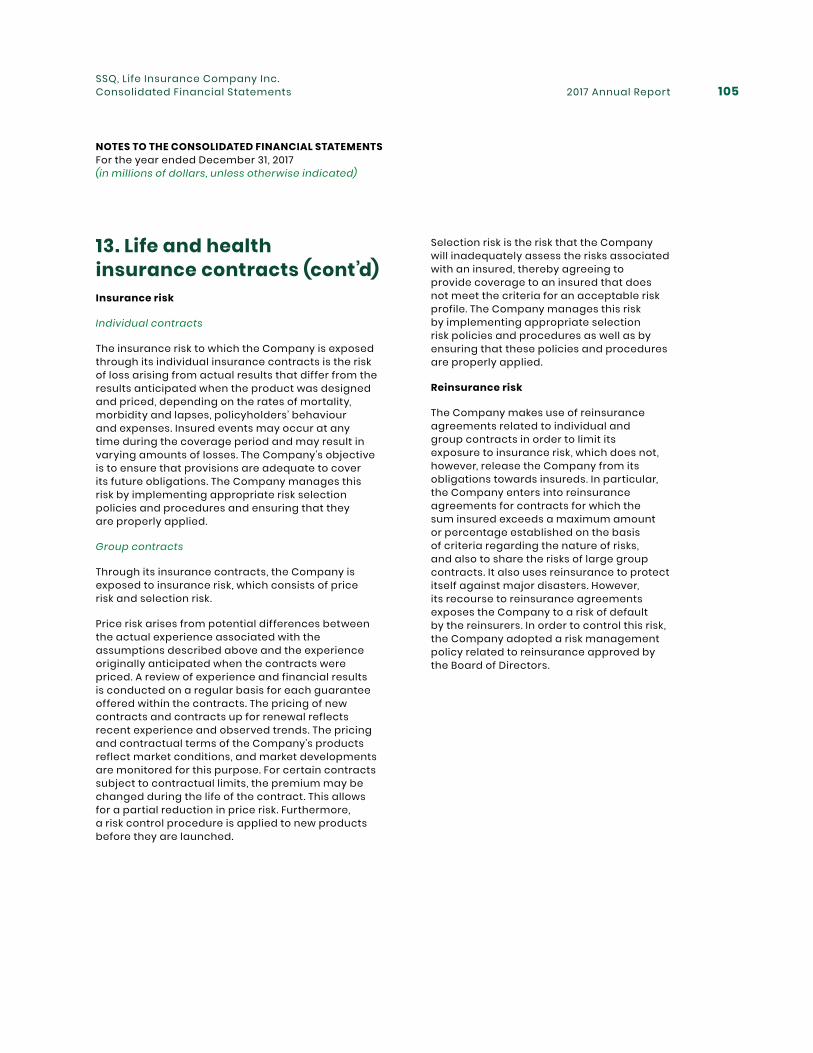
2017 Annual Report 105SSQ, Life Insurance Company Inc.Consolidated Financial Statements
13. Life and health insurance contracts (cont’d)Insurance risk
Individual contracts
The insurance risk to which the Company is exposed through its individual insurance contracts is the risk of loss arising from actual results that differ from the results anticipated when the product was designed and priced, depending on the rates of mortality, morbidity and lapses, policyholders’ behaviour and expenses. Insured events may occur at any time during the coverage period and may result in varying amounts of losses. The Company’s objective is to ensure that provisions are adequate to cover its future obligations. The Company manages this risk by implementing appropriate risk selection policies and procedures and ensuring that they are properly applied.
Group contracts
Through its insurance contracts, the Company is exposed to insurance risk, which consists of price risk and selection risk.
Price risk arises from potential differences between the actual experience associated with the assumptions described above and the experience originally anticipated when the contracts were priced. A review of experience and financial results is conducted on a regular basis for each guarantee offered within the contracts. The pricing of new contracts and contracts up for renewal reflects recent experience and observed trends. The pricing and contractual terms of the Company’s products reflect market conditions, and market developments are monitored for this purpose. For certain contracts subject to contractual limits, the premium may be changed during the life of the contract. This allows for a partial reduction in price risk. Furthermore, a risk control procedure is applied to new products before they are launched.
Selection risk is the risk that the Company will inadequately assess the risks associated with an insured, thereby agreeing to provide coverage to an insured that does not meet the criteria for an acceptable risk profile. The Company manages this risk by implementing appropriate selection risk policies and procedures as well as by ensuring that these policies and procedures are properly applied.
Reinsurance risk
The Company makes use of reinsurance agreements related to individual and group contracts in order to limit its exposure to insurance risk, which does not, however, release the Company from its obligations towards insureds. In particular, the Company enters into reinsurance agreements for contracts for which the sum insured exceeds a maximum amount or percentage established on the basis of criteria regarding the nature of risks, and also to share the risks of large group contracts. It also uses reinsurance to protect itself against major disasters. However, its recourse to reinsurance agreements exposes the Company to a risk of default by the reinsurers. In order to control this risk, the Company adopted a risk management policy related to reinsurance approved by the Board of Directors.
NOTES TO THE CONSOLIDATED FINANCIAL STATEMENTS For the year ended December 31, 2017 (in millions of dollars, unless otherwise indicated)
2017 Annual Report106SSQ, Life Insurance Company Inc.Consolidated Financial Statements
13. Life and health insurance contracts (cont’d)Mortality and morbidity risk
Mortality and morbidity risk represents the risk of loss for the Company in the event that the number and/or severity of claims for life, accident and health insurance are higher than estimated. This might happen as a result of an epidemic, a natural disaster or a change in the population’s living habits.
The Company manages this risk by implementing procedures to collect information on policyholders that is used for pricing insurance contracts and by setting up procedures to examine claims in order to identify unfounded or fraudulent claims.
Lapse risk
For lapse-supported policies, this represents the risk of loss for the Company in the event that the number of insureds who decide to let their contracts lapse by ceasing to pay their premiums is lower than estimated. For non-lapse-supported policies, it represents the risk of loss for the Company in the event that the number of insureds who decide to let their contracts lapse by ceasing to pay their premiums is higher than forecast. The Company takes this risk into account in setting its actuarial reserve.
Investment income risk
This is the risk of loss for the Company in the event that actual investment income is lower than estimated. The projected future investment income is an essential element in establishing the amount of the actuarial reserve. Thus, future disbursements are discounted on the basis of the anticipated rate of return on the investments supporting the actuarial reserve.
Segregated fund risk
The Company offers individual annuity contracts in its segregated funds, guaranteeing a level of income or a value upon death or contract maturity. Policyholder behaviour risk is combined with market risk to define the presence of risk, which emerges from the combination of maintaining contracts in force and a market decline. In order to limit the Company’s exposure by association to policyholder mortality risk and behaviour risk, the Company has implemented a program to hedge the market risk. The Company regularly monitors the effectiveness of this program.
NOTES TO THE CONSOLIDATED FINANCIAL STATEMENTS For the year ended December 31, 2017 (in millions of dollars, unless otherwise indicated)
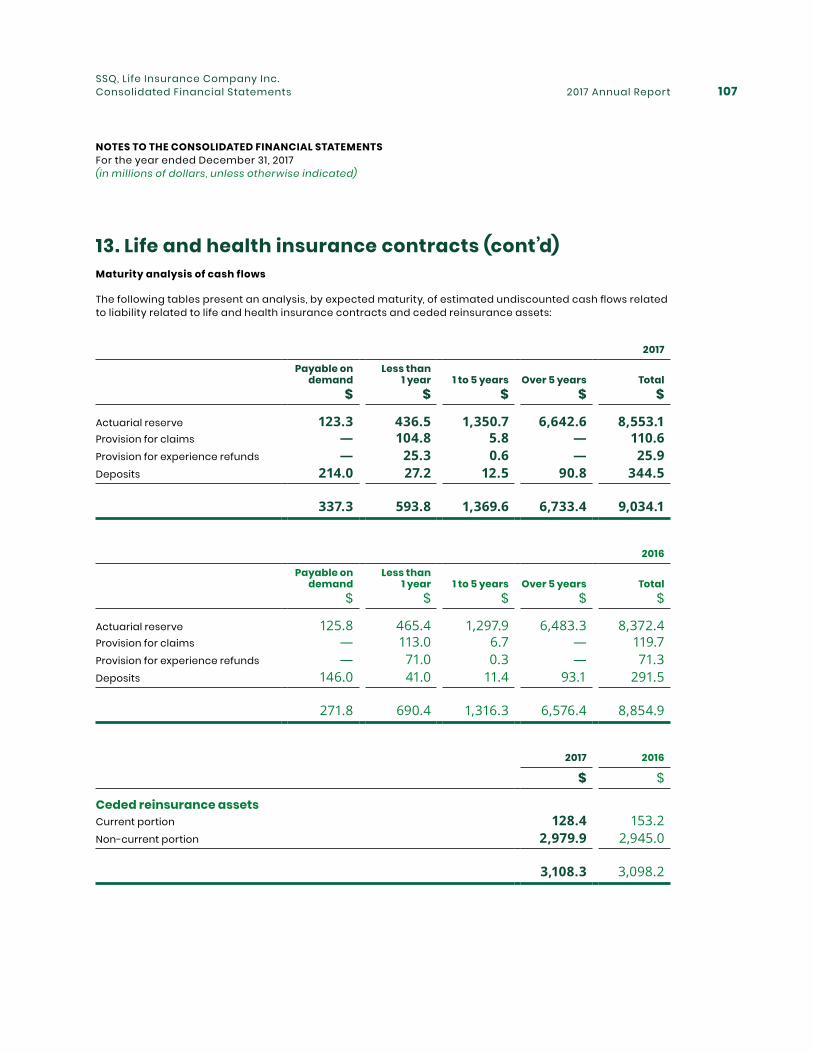
2017 Annual Report 107SSQ, Life Insurance Company Inc.Consolidated Financial Statements
13. Life and health insurance contracts (cont’d)Maturity analysis of cash flows
The following tables present an analysis, by expected maturity, of estimated undiscounted cash flows related to liability related to life and health insurance contracts and ceded reinsurance assets:
2017
Payable on demand
Less than 1 year 1 to 5 years Over 5 years Total
$ $ $ $ $
Actuarial reserve 123.3 436.5 1,350.7 6,642.6 8,553.1 Provision for claims — 104.8 5.8 — 110.6 Provision for experience refunds — 25.3 0.6 — 25.9 Deposits 214.0 27.2 12.5 90.8 344.5
337.3 593.8 1,369.6 6,733.4 9,034.1
2016
Payable on demand
Less than 1 year 1 to 5 years Over 5 years Total
$ $ $ $ $
Actuarial reserve 125.8 465.4 1,297.9 6,483.3 8,372.4 Provision for claims — 113.0 6.7 — 119.7 Provision for experience refunds — 71.0 0.3 — 71.3 Deposits 146.0 41.0 11.4 93.1 291.5
271.8 690.4 1,316.3 6,576.4 8,854.9
2017 2016
$ $
Ceded reinsurance assetsCurrent portion 128.4 153.2 Non-current portion 2,979.9 2,945.0
3,108.3 3,098.2
NOTES TO THE CONSOLIDATED FINANCIAL STATEMENTS For the year ended December 31, 2017 (in millions of dollars, unless otherwise indicated)
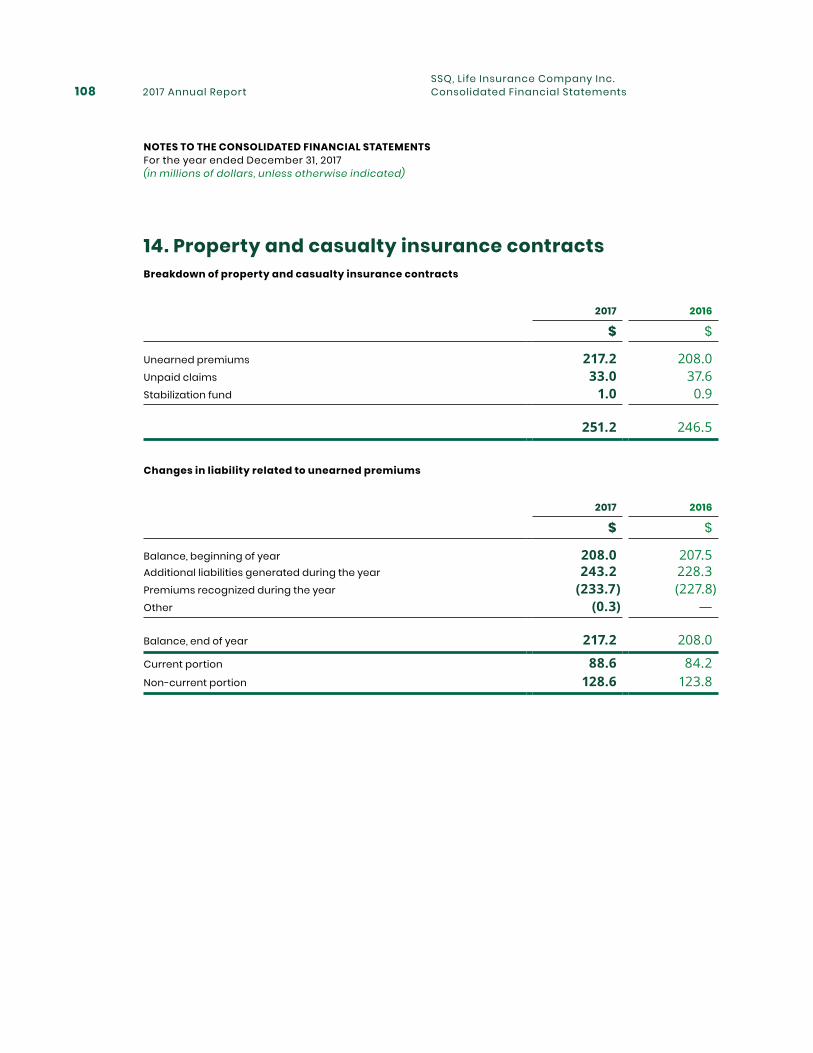
2017 Annual Report108SSQ, Life Insurance Company Inc.Consolidated Financial Statements
14. Property and casualty insurance contractsBreakdown of property and casualty insurance contracts
2017 2016
$ $
Unearned premiums 217.2 208.0Unpaid claims 33.0 37.6Stabilization fund 1.0 0.9
251.2 246.5
Changes in liability related to unearned premiums
2017 2016
$ $
Balance, beginning of year 208.0 207.5Additional liabilities generated during the year 243.2 228.3Premiums recognized during the year (233.7) (227.8)Other (0.3) —
Balance, end of year 217.2 208.0
Current portion 88.6 84.2Non-current portion 128.6 123.8
NOTES TO THE CONSOLIDATED FINANCIAL STATEMENTS For the year ended December 31, 2017 (in millions of dollars, unless otherwise indicated)
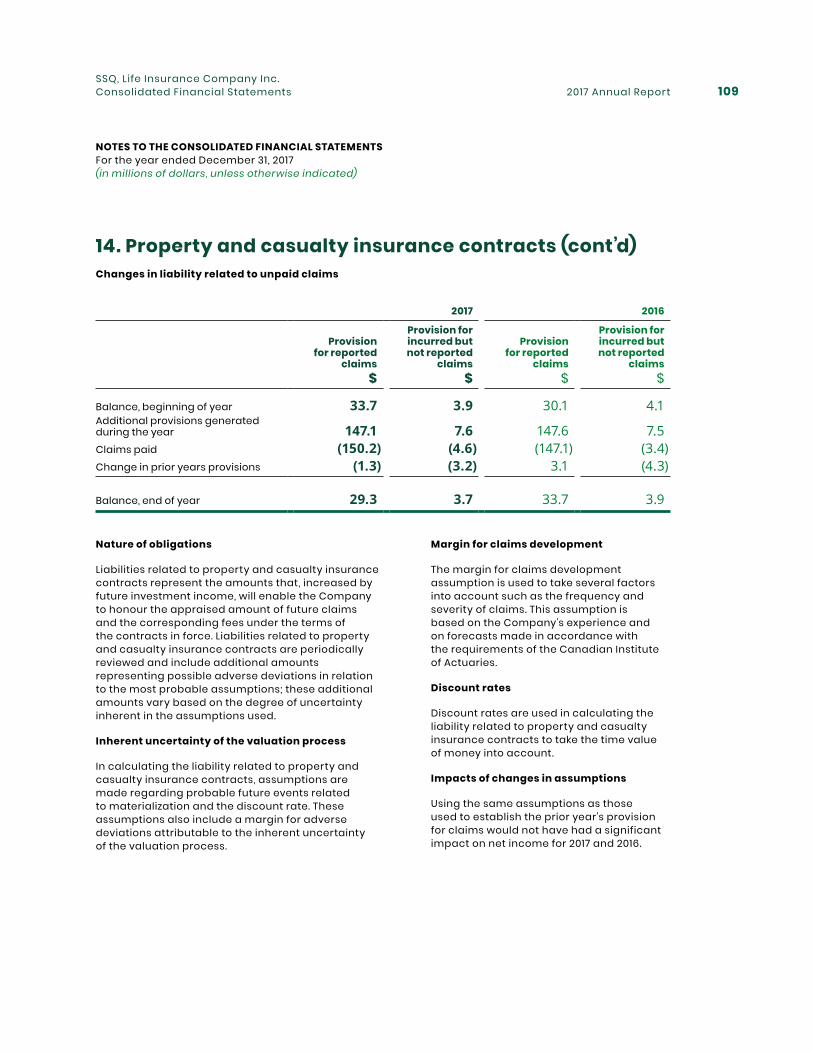
2017 Annual Report 109SSQ, Life Insurance Company Inc.Consolidated Financial Statements
Nature of obligations
Liabilities related to property and casualty insurance contracts represent the amounts that, increased by future investment income, will enable the Company to honour the appraised amount of future claims and the corresponding fees under the terms of the contracts in force. Liabilities related to property and casualty insurance contracts are periodically reviewed and include additional amounts representing possible adverse deviations in relation to the most probable assumptions; these additional amounts vary based on the degree of uncertainty inherent in the assumptions used.
Inherent uncertainty of the valuation process
In calculating the liability related to property and casualty insurance contracts, assumptions are made regarding probable future events related to materialization and the discount rate. These assumptions also include a margin for adverse deviations attributable to the inherent uncertainty of the valuation process.
14. Property and casualty insurance contracts (cont’d)Changes in liability related to unpaid claims
2017 2016
Provision for reported
claims
Provision for incurred but not reported
claims
Provision for reported
claims
Provision for incurred but not reported
claims$ $ $ $
Balance, beginning of year 33.7 3.9 30.1 4.1Additional provisions generated during the year 147.1 7.6 147.6 7.5Claims paid (150.2) (4.6) (147.1) (3.4)Change in prior years provisions (1.3) (3.2) 3.1 (4.3)
Balance, end of year 29.3 3.7 33.7 3.9
Margin for claims development
The margin for claims development assumption is used to take several factors into account such as the frequency and severity of claims. This assumption is based on the Company’s experience and on forecasts made in accordance with the requirements of the Canadian Institute of Actuaries.
Discount rates
Discount rates are used in calculating the liability related to property and casualty insurance contracts to take the time value of money into account.
Impacts of changes in assumptions
Using the same assumptions as those used to establish the prior year’s provision for claims would not have had a significant impact on net income for 2017 and 2016.
NOTES TO THE CONSOLIDATED FINANCIAL STATEMENTS For the year ended December 31, 2017 (in millions of dollars, unless otherwise indicated)
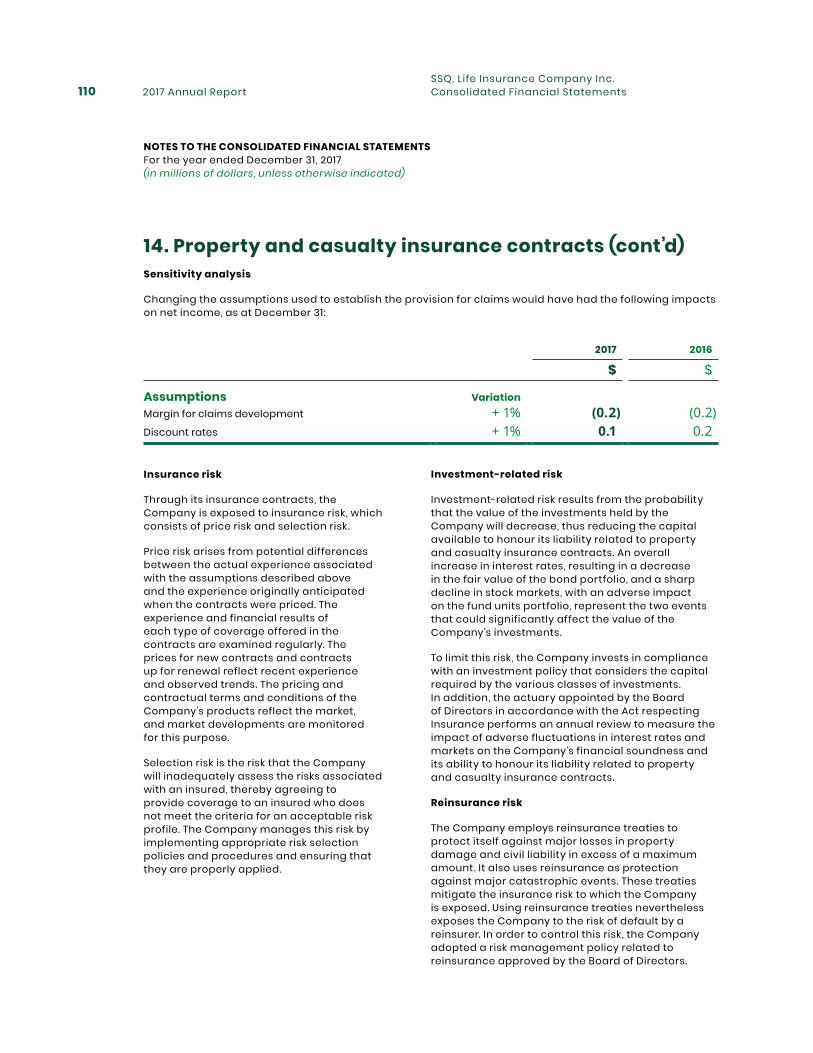
2017 Annual Report110SSQ, Life Insurance Company Inc.Consolidated Financial Statements
14. Property and casualty insurance contracts (cont’d)Sensitivity analysis
Changing the assumptions used to establish the provision for claims would have had the following impacts on net income, as at December 31:
2017 2016
$ $
Assumptions VariationMargin for claims development + 1% (0.2) (0.2)Discount rates + 1% 0.1 0.2
Insurance risk
Through its insurance contracts, the Company is exposed to insurance risk, which consists of price risk and selection risk.
Price risk arises from potential differences between the actual experience associated with the assumptions described above and the experience originally anticipated when the contracts were priced. The experience and financial results of each type of coverage offered in the contracts are examined regularly. The prices for new contracts and contracts up for renewal reflect recent experience and observed trends. The pricing and contractual terms and conditions of the Company’s products reflect the market, and market developments are monitored for this purpose.
Selection risk is the risk that the Company will inadequately assess the risks associated with an insured, thereby agreeing to provide coverage to an insured who does not meet the criteria for an acceptable risk profile. The Company manages this risk by implementing appropriate risk selection policies and procedures and ensuring that they are properly applied.
Investment-related risk
Investment-related risk results from the probability that the value of the investments held by the Company will decrease, thus reducing the capital available to honour its liability related to property and casualty insurance contracts. An overall increase in interest rates, resulting in a decrease in the fair value of the bond portfolio, and a sharp decline in stock markets, with an adverse impact on the fund units portfolio, represent the two events that could significantly affect the value of the Company’s investments.
To limit this risk, the Company invests in compliance with an investment policy that considers the capital required by the various classes of investments. In addition, the actuary appointed by the Board of Directors in accordance with the Act respecting Insurance performs an annual review to measure the impact of adverse fluctuations in interest rates and markets on the Company’s financial soundness and its ability to honour its liability related to property and casualty insurance contracts.
Reinsurance risk
The Company employs reinsurance treaties to protect itself against major losses in property damage and civil liability in excess of a maximum amount. It also uses reinsurance as protection against major catastrophic events. These treaties mitigate the insurance risk to which the Company is exposed. Using reinsurance treaties nevertheless exposes the Company to the risk of default by a reinsurer. In order to control this risk, the Company adopted a risk management policy related to reinsurance approved by the Board of Directors.
NOTES TO THE CONSOLIDATED FINANCIAL STATEMENTS For the year ended December 31, 2017 (in millions of dollars, unless otherwise indicated)
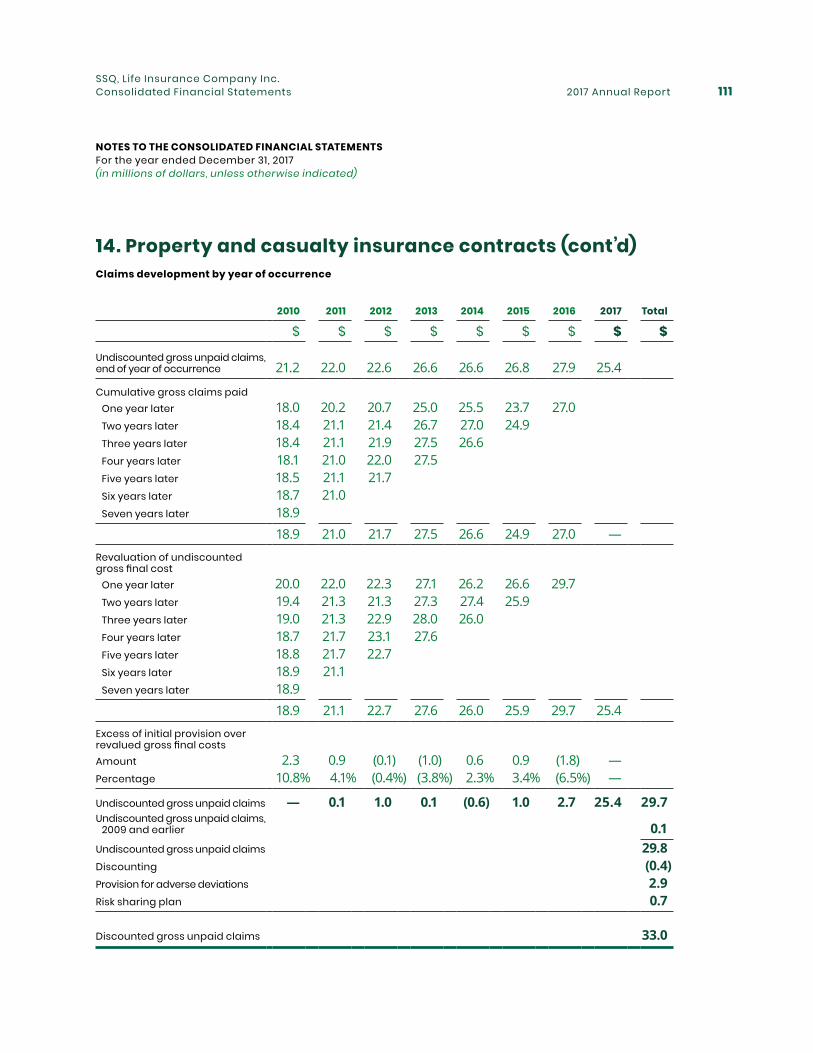
2017 Annual Report 111SSQ, Life Insurance Company Inc.Consolidated Financial Statements
14. Property and casualty insurance contracts (cont’d)Claims development by year of occurrence
2010 2011 2012 2013 2014 2015 2016 2017 Total
$ $ $ $ $ $ $ $ $
Undiscounted gross unpaid claims, end of year of occurrence 21.2 22.0 22.6 26.6 26.6 26.8 27.9 25.4
Cumulative gross claims paid One year later 18.0 20.2 20.7 25.0 25.5 23.7 27.0 Two years later 18.4 21.1 21.4 26.7 27.0 24.9 Three years later 18.4 21.1 21.9 27.5 26.6 Four years later 18.1 21.0 22.0 27.5 Five years later 18.5 21.1 21.7 Six years later 18.7 21.0 Seven years later 18.9 18.9 21.0 21.7 27.5 26.6 24.9 27.0 — Revaluation of undiscounted gross final cost One year later 20.0 22.0 22.3 27.1 26.2 26.6 29.7 Two years later 19.4 21.3 21.3 27.3 27.4 25.9 Three years later 19.0 21.3 22.9 28.0 26.0 Four years later 18.7 21.7 23.1 27.6 Five years later 18.8 21.7 22.7 Six years later 18.9 21.1 Seven years later 18.9 18.9 21.1 22.7 27.6 26.0 25.9 29.7 25.4 Excess of initial provision over revalued gross final costsAmount 2.3 0.9 (0.1) (1.0) 0.6 0.9 (1.8) —Percentage 10.8% 4.1% (0.4%) (3.8%) 2.3% 3.4% (6.5%) —
Undiscounted gross unpaid claims — 0.1 1.0 0.1 (0.6) 1.0 2.7 25.4 29.7Undiscounted gross unpaid claims, 2009 and earlier 0.1Undiscounted gross unpaid claims 29.8Discounting (0.4)Provision for adverse deviations 2.9Risk sharing plan 0.7
Discounted gross unpaid claims 33.0
NOTES TO THE CONSOLIDATED FINANCIAL STATEMENTS For the year ended December 31, 2017 (in millions of dollars, unless otherwise indicated)
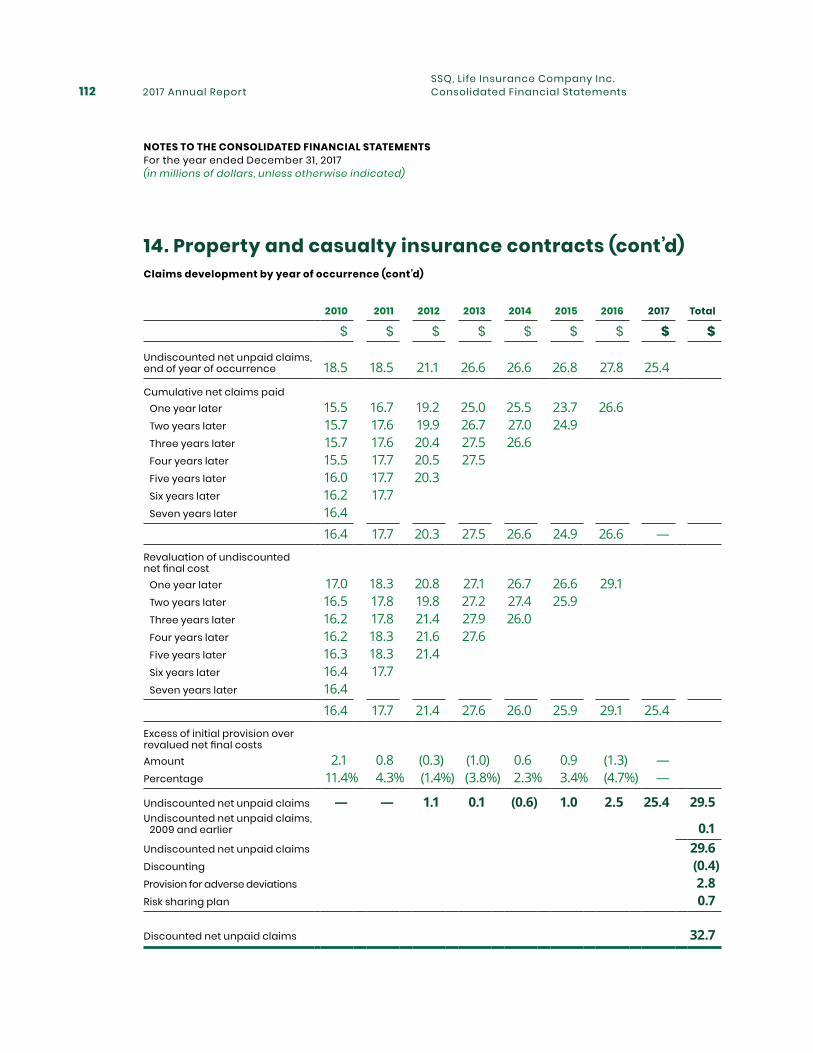
2017 Annual Report112SSQ, Life Insurance Company Inc.Consolidated Financial Statements
14. Property and casualty insurance contracts (cont’d)Claims development by year of occurrence (cont’d)
2010 2011 2012 2013 2014 2015 2016 2017 Total
$ $ $ $ $ $ $ $ $
Undiscounted net unpaid claims, end of year of occurrence 18.5 18.5 21.1 26.6 26.6 26.8 27.8 25.4
Cumulative net claims paid One year later 15.5 16.7 19.2 25.0 25.5 23.7 26.6 Two years later 15.7 17.6 19.9 26.7 27.0 24.9 Three years later 15.7 17.6 20.4 27.5 26.6 Four years later 15.5 17.7 20.5 27.5 Five years later 16.0 17.7 20.3 Six years later 16.2 17.7 Seven years later 16.4 16.4 17.7 20.3 27.5 26.6 24.9 26.6 — Revaluation of undiscounted net final cost One year later 17.0 18.3 20.8 27.1 26.7 26.6 29.1 Two years later 16.5 17.8 19.8 27.2 27.4 25.9 Three years later 16.2 17.8 21.4 27.9 26.0 Four years later 16.2 18.3 21.6 27.6 Five years later 16.3 18.3 21.4 Six years later 16.4 17.7 Seven years later 16.4 16.4 17.7 21.4 27.6 26.0 25.9 29.1 25.4 Excess of initial provision over revalued net final costsAmount 2.1 0.8 (0.3) (1.0) 0.6 0.9 (1.3) —Percentage 11.4% 4.3% (1.4%) (3.8%) 2.3% 3.4% (4.7%) —
Undiscounted net unpaid claims — — 1.1 0.1 (0.6) 1.0 2.5 25.4 29.5Undiscounted net unpaid claims, 2009 and earlier 0.1Undiscounted net unpaid claims 29.6Discounting (0.4)Provision for adverse deviations 2.8Risk sharing plan 0.7
Discounted net unpaid claims 32.7
NOTES TO THE CONSOLIDATED FINANCIAL STATEMENTS For the year ended December 31, 2017 (in millions of dollars, unless otherwise indicated)
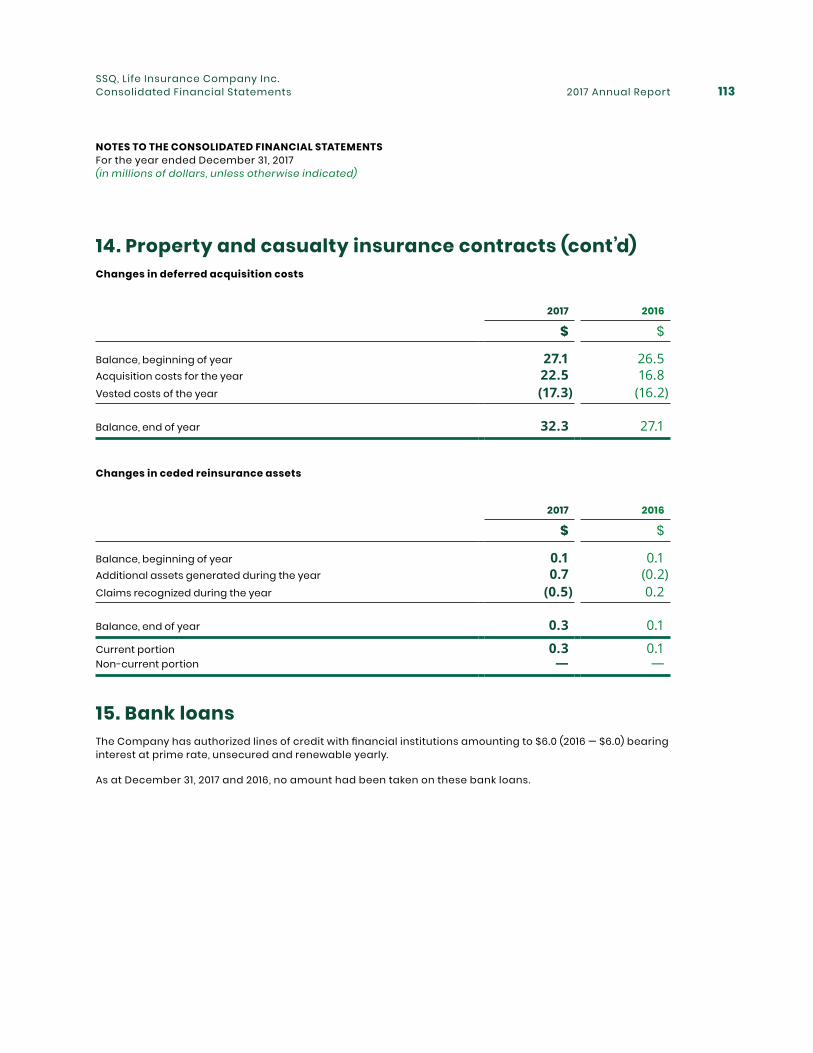
2017 Annual Report 113SSQ, Life Insurance Company Inc.Consolidated Financial Statements
14. Property and casualty insurance contracts (cont’d)Changes in deferred acquisition costs
2017 2016
$ $
Balance, beginning of year 27.1 26.5Acquisition costs for the year 22.5 16.8Vested costs of the year (17.3) (16.2)
Balance, end of year 32.3 27.1
Changes in ceded reinsurance assets
2017 2016
$ $
Balance, beginning of year 0.1 0.1Additional assets generated during the year 0.7 (0.2)Claims recognized during the year (0.5) 0.2
Balance, end of year 0.3 0.1
Current portion 0.3 0.1Non-current portion — —
15. Bank loansThe Company has authorized lines of credit with financial institutions amounting to $6.0 (2016 — $6.0) bearing interest at prime rate, unsecured and renewable yearly.
As at December 31, 2017 and 2016, no amount had been taken on these bank loans.
NOTES TO THE CONSOLIDATED FINANCIAL STATEMENTS For the year ended December 31, 2017 (in millions of dollars, unless otherwise indicated)
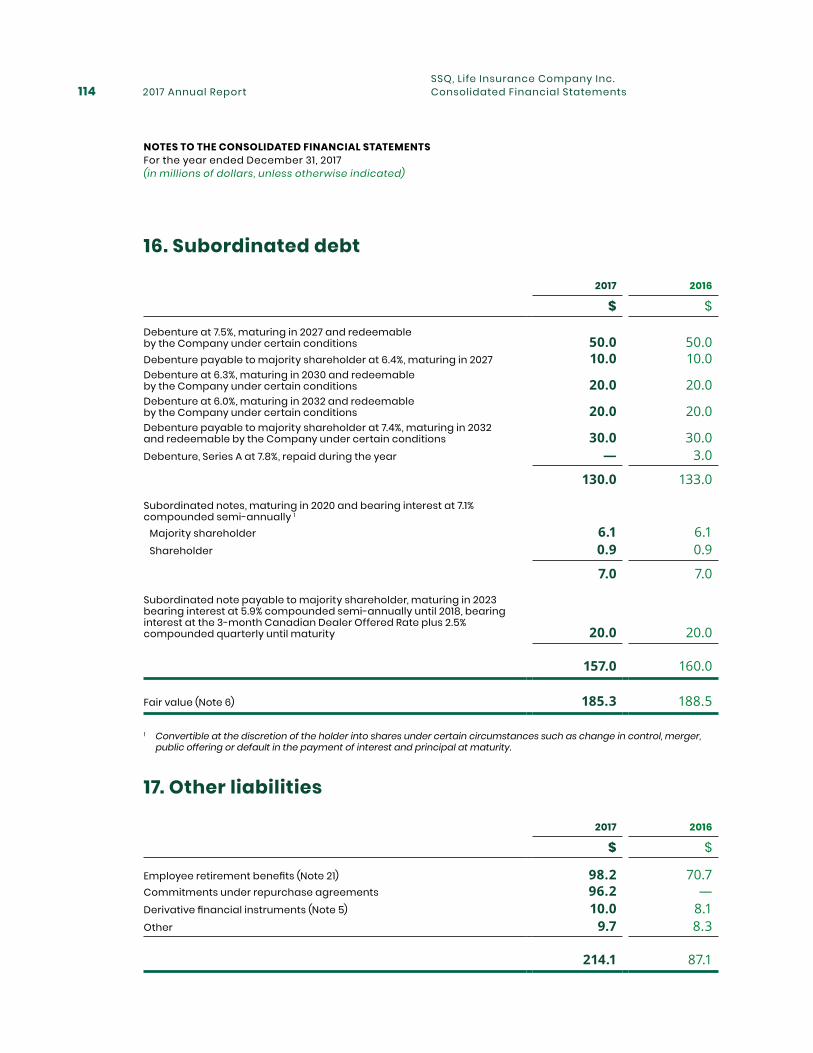
2017 Annual Report114SSQ, Life Insurance Company Inc.Consolidated Financial Statements
16. Subordinated debt
17. Other liabilities
2017 2016
$ $
Debenture at 7.5%, maturing in 2027 and redeemable by the Company under certain conditions 50.0 50.0Debenture payable to majority shareholder at 6.4%, maturing in 2027 10.0 10.0Debenture at 6.3%, maturing in 2030 and redeemable by the Company under certain conditions 20.0 20.0Debenture at 6.0%, maturing in 2032 and redeemable by the Company under certain conditions 20.0 20.0Debenture payable to majority shareholder at 7.4%, maturing in 2032 and redeemable by the Company under certain conditions 30.0 30.0Debenture, Series A at 7.8%, repaid during the year — 3.0
130.0 133.0
Subordinated notes, maturing in 2020 and bearing interest at 7.1% compounded semi-annually 1
Majority shareholder 6.1 6.1 Shareholder 0.9 0.9
7.0 7.0
Subordinated note payable to majority shareholder, maturing in 2023 bearing interest at 5.9% compounded semi-annually until 2018, bearing interest at the 3-month Canadian Dealer Offered Rate plus 2.5% compounded quarterly until maturity 20.0 20.0
157.0 160.0
Fair value (Note 6) 185.3 188.5
1 Convertible at the discretion of the holder into shares under certain circumstances such as change in control, merger, public offering or default in the payment of interest and principal at maturity.
2017 2016
$ $
Employee retirement benefits (Note 21) 98.2 70.7Commitments under repurchase agreements 96.2 —Derivative financial instruments (Note 5) 10.0 8.1Other 9.7 8.3
214.1 87.1
NOTES TO THE CONSOLIDATED FINANCIAL STATEMENTS For the year ended December 31, 2017 (in millions of dollars, unless otherwise indicated)
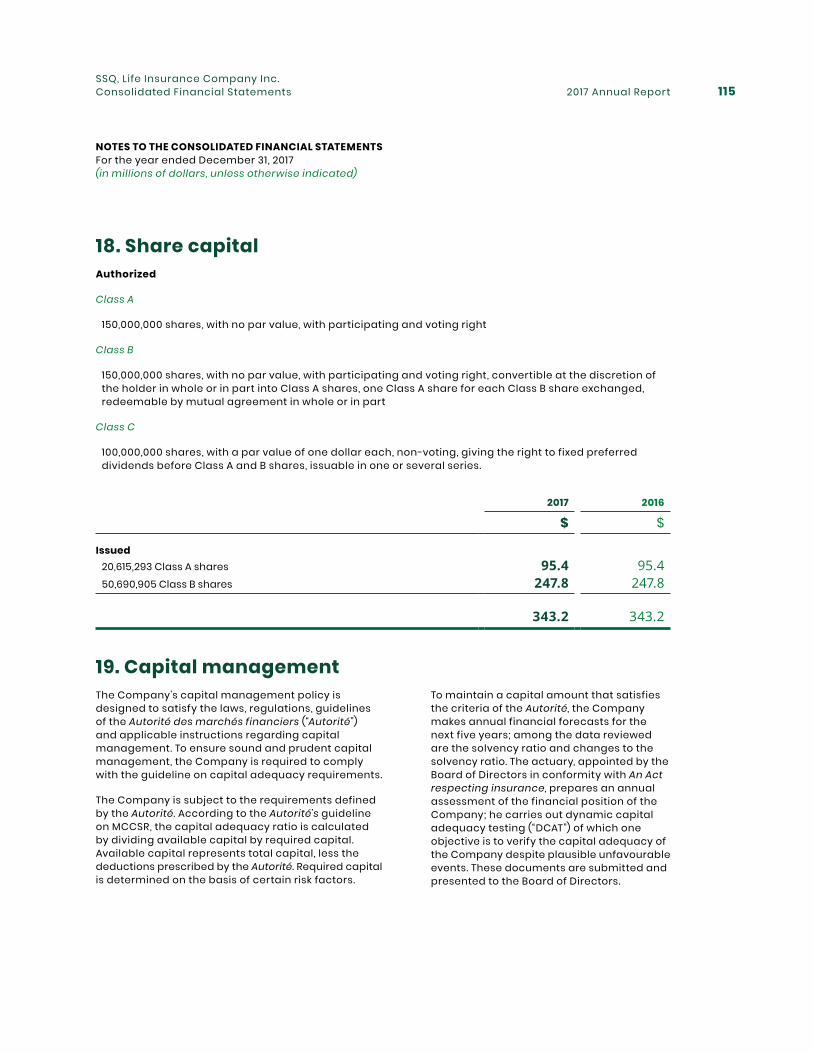
2017 Annual Report 115SSQ, Life Insurance Company Inc.Consolidated Financial Statements
18. Share capitalAuthorized
Class A
150,000,000 shares, with no par value, with participating and voting right
Class B
150,000,000 shares, with no par value, with participating and voting right, convertible at the discretion of the holder in whole or in part into Class A shares, one Class A share for each Class B share exchanged, redeemable by mutual agreement in whole or in part
Class C
100,000,000 shares, with a par value of one dollar each, non-voting, giving the right to fixed preferred dividends before Class A and B shares, issuable in one or several series.
2017 2016
$ $
Issued 20,615,293 Class A shares 95.4 95.4 50,690,905 Class B shares 247.8 247.8
343.2 343.2
19. Capital managementThe Company’s capital management policy is designed to satisfy the laws, regulations, guidelines of the Autorité des marchés financiers (“Autorité”) and applicable instructions regarding capital management. To ensure sound and prudent capital management, the Company is required to comply with the guideline on capital adequacy requirements.
The Company is subject to the requirements defined by the Autorité. According to the Autorité’s guideline on MCCSR, the capital adequacy ratio is calculated by dividing available capital by required capital. Available capital represents total capital, less the deductions prescribed by the Autorité. Required capital is determined on the basis of certain risk factors.
To maintain a capital amount that satisfies the criteria of the Autorité, the Company makes annual financial forecasts for the next five years; among the data reviewed are the solvency ratio and changes to the solvency ratio. The actuary, appointed by the Board of Directors in conformity with An Act respecting insurance, prepares an annual assessment of the financial position of the Company; he carries out dynamic capital adequacy testing (“DCAT”) of which one objective is to verify the capital adequacy of the Company despite plausible unfavourable events. These documents are submitted and presented to the Board of Directors.
NOTES TO THE CONSOLIDATED FINANCIAL STATEMENTS For the year ended December 31, 2017 (in millions of dollars, unless otherwise indicated)
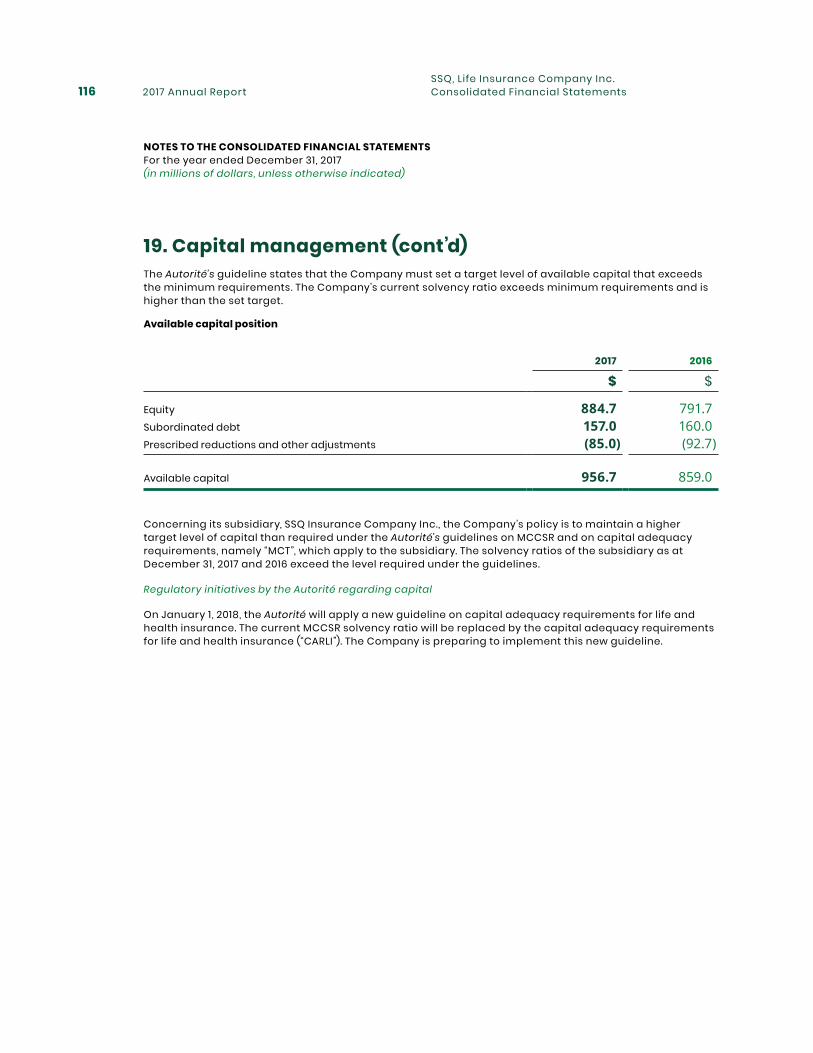
2017 Annual Report116SSQ, Life Insurance Company Inc.Consolidated Financial Statements
19. Capital management (cont’d)The Autorité’s guideline states that the Company must set a target level of available capital that exceeds the minimum requirements. The Company’s current solvency ratio exceeds minimum requirements and is higher than the set target.
Available capital position
2017 2016
$ $
Equity 884.7 791.7Subordinated debt 157.0 160.0Prescribed reductions and other adjustments (85.0) (92.7)
Available capital 956.7 859.0
Concerning its subsidiary, SSQ Insurance Company Inc., the Company’s policy is to maintain a higher target level of capital than required under the Autorité’s guidelines on MCCSR and on capital adequacy requirements, namely “MCT”, which apply to the subsidiary. The solvency ratios of the subsidiary as at December 31, 2017 and 2016 exceed the level required under the guidelines.
Regulatory initiatives by the Autorité regarding capital
On January 1 , 2018, the Autorité will apply a new guideline on capital adequacy requirements for life and health insurance. The current MCCSR solvency ratio will be replaced by the capital adequacy requirements for life and health insurance (“CARLI”). The Company is preparing to implement this new guideline.
NOTES TO THE CONSOLIDATED FINANCIAL STATEMENTS For the year ended December 31, 2017 (in millions of dollars, unless otherwise indicated)
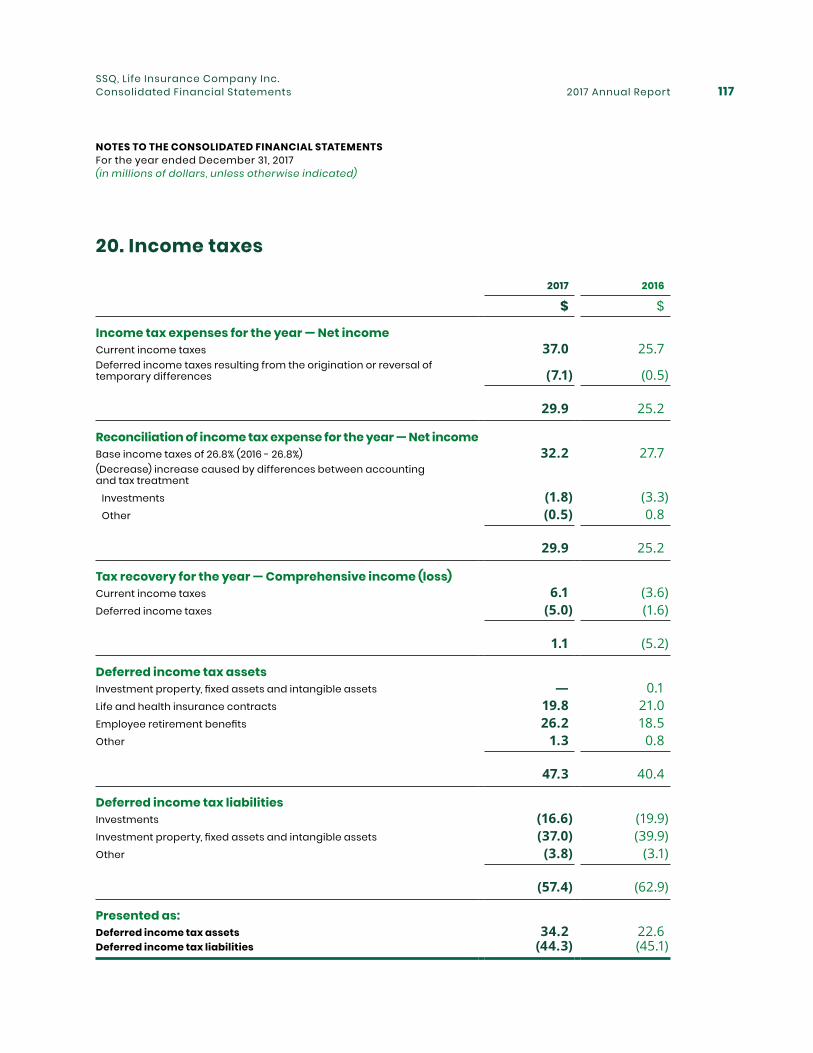
2017 Annual Report 117SSQ, Life Insurance Company Inc.Consolidated Financial Statements
20. Income taxes
2017 2016
$ $
Income tax expenses for the year — Net incomeCurrent income taxes 37.0 25.7Deferred income taxes resulting from the origination or reversal of temporary differences (7.1) (0.5)
29.9 25.2
Reconciliation of income tax expense for the year — Net incomeBase income taxes of 26.8% (2016 - 26.8%) 32.2 27.7(Decrease) increase caused by differences between accounting and tax treatment Investments (1.8) (3.3) Other (0.5) 0.8
29.9 25.2
Tax recovery for the year — Comprehensive income (loss)Current income taxes 6.1 (3.6)Deferred income taxes (5.0) (1.6)
1.1 (5.2)
Deferred income tax assetsInvestment property, fixed assets and intangible assets — 0.1Life and health insurance contracts 19.8 21.0Employee retirement benefits 26.2 18.5Other 1.3 0.8
47.3 40.4
Deferred income tax liabilitiesInvestments (16.6) (19.9)Investment property, fixed assets and intangible assets (37.0) (39.9)Other (3.8) (3.1)
(57.4) (62.9)
Presented as:Deferred income tax assets 34.2 22.6Deferred income tax liabilities (44.3) (45.1)
NOTES TO THE CONSOLIDATED FINANCIAL STATEMENTS For the year ended December 31, 2017 (in millions of dollars, unless otherwise indicated)
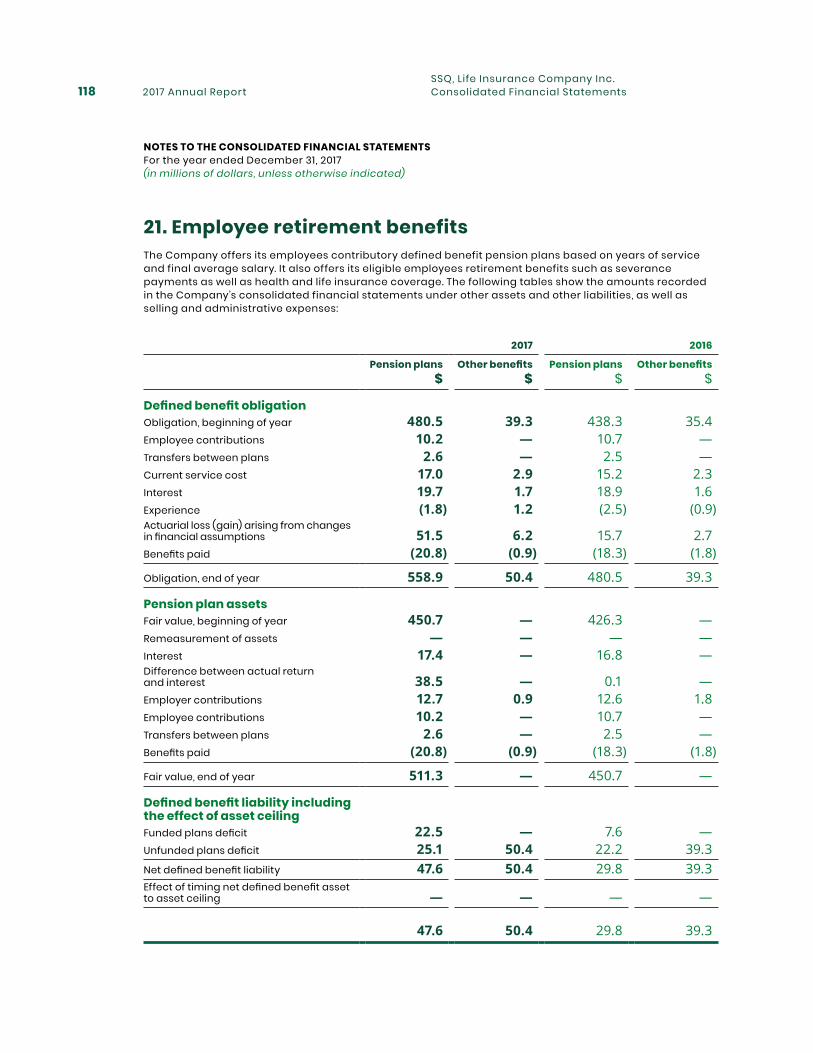
2017 Annual Report118SSQ, Life Insurance Company Inc.Consolidated Financial Statements
21. Employee retirement benefitsThe Company offers its employees contributory defined benefit pension plans based on years of service and final average salary. It also offers its eligible employees retirement benefits such as severance payments as well as health and life insurance coverage. The following tables show the amounts recorded in the Company’s consolidated financial statements under other assets and other liabilities, as well as selling and administrative expenses:
2017 2016
Pension plans Other benefits Pension plans Other benefits$ $ $ $
Defined benefit obligationObligation, beginning of year 480.5 39.3 438.3 35.4Employee contributions 10.2 — 10.7 —Transfers between plans 2.6 — 2.5 —Current service cost 17.0 2.9 15.2 2.3Interest 19.7 1.7 18.9 1.6Experience (1.8) 1.2 (2.5) (0.9)Actuarial loss (gain) arising from changes in financial assumptions 51.5 6.2 15.7 2.7Benefits paid (20.8) (0.9) (18.3) (1.8)
Obligation, end of year 558.9 50.4 480.5 39.3
Pension plan assetsFair value, beginning of year 450.7 — 426.3 — Remeasurement of assets — — — — Interest 17.4 — 16.8 — Difference between actual return and interest 38.5 — 0.1 — Employer contributions 12.7 0.9 12.6 1.8Employee contributions 10.2 — 10.7 — Transfers between plans 2.6 — 2.5 — Benefits paid (20.8) (0.9) (18.3) (1.8)
Fair value, end of year 511.3 — 450.7 —
Defined benefit liability including the effect of asset ceilingFunded plans deficit 22.5 — 7.6 —Unfunded plans deficit 25.1 50.4 22.2 39.3Net defined benefit liability 47.6 50.4 29.8 39.3Effect of timing net defined benefit asset to asset ceiling — — — —
47.6 50.4 29.8 39.3
NOTES TO THE CONSOLIDATED FINANCIAL STATEMENTS For the year ended December 31, 2017 (in millions of dollars, unless otherwise indicated)
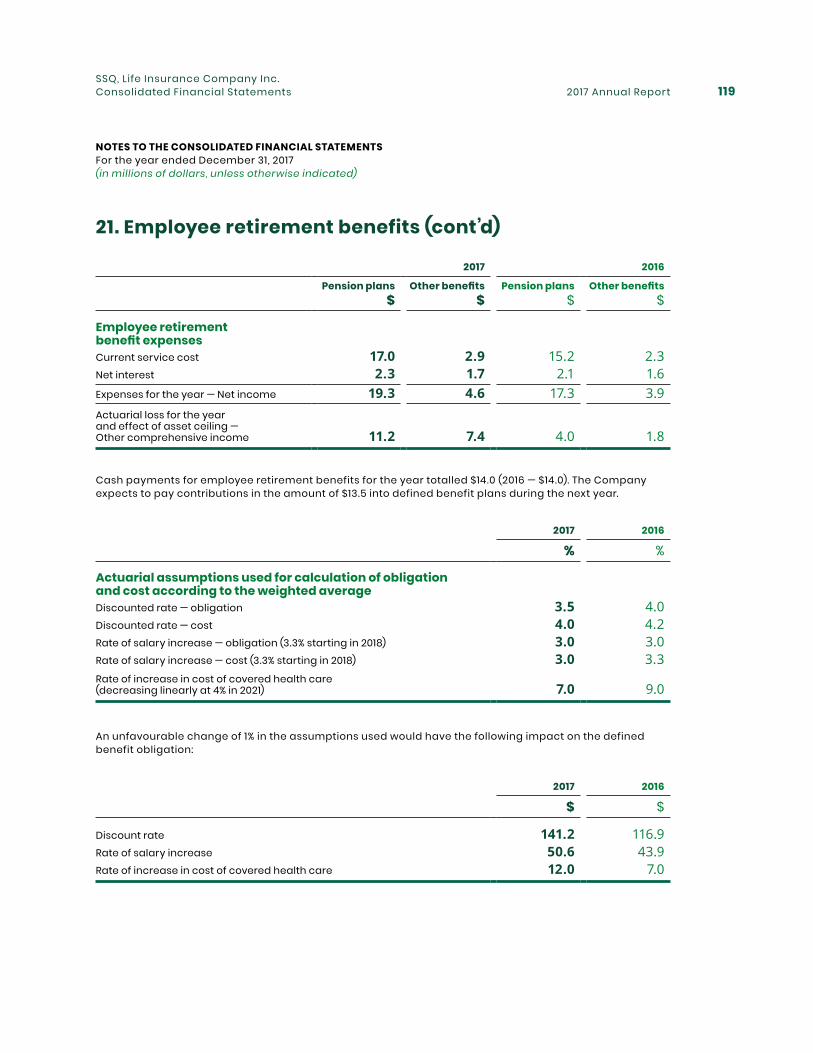
2017 Annual Report 119SSQ, Life Insurance Company Inc.Consolidated Financial Statements
21. Employee retirement benefits (cont’d)
2017 2016
Pension plans Other benefits Pension plans Other benefits$ $ $ $
Employee retirement benefit expensesCurrent service cost 17.0 2.9 15.2 2.3Net interest 2.3 1.7 2.1 1.6Expenses for the year — Net income 19.3 4.6 17.3 3.9Actuarial loss for the year and effect of asset ceiling — Other comprehensive income 11.2 7.4 4.0 1.8
Cash payments for employee retirement benefits for the year totalled $14.0 (2016 — $14.0). The Company expects to pay contributions in the amount of $13.5 into defined benefit plans during the next year.
2017 2016
% %
Actuarial assumptions used for calculation of obligation and cost according to the weighted averageDiscounted rate — obligation 3.5 4.0Discounted rate — cost 4.0 4.2Rate of salary increase — obligation (3.3% starting in 2018) 3.0 3.0Rate of salary increase — cost (3.3% starting in 2018) 3.0 3.3Rate of increase in cost of covered health care (decreasing linearly at 4% in 2021) 7.0 9.0
An unfavourable change of 1% in the assumptions used would have the following impact on the defined benefit obligation:
2017 2016
$ $
Discount rate 141.2 116.9Rate of salary increase 50.6 43.9Rate of increase in cost of covered health care 12.0 7.0
NOTES TO THE CONSOLIDATED FINANCIAL STATEMENTS For the year ended December 31, 2017 (in millions of dollars, unless otherwise indicated)
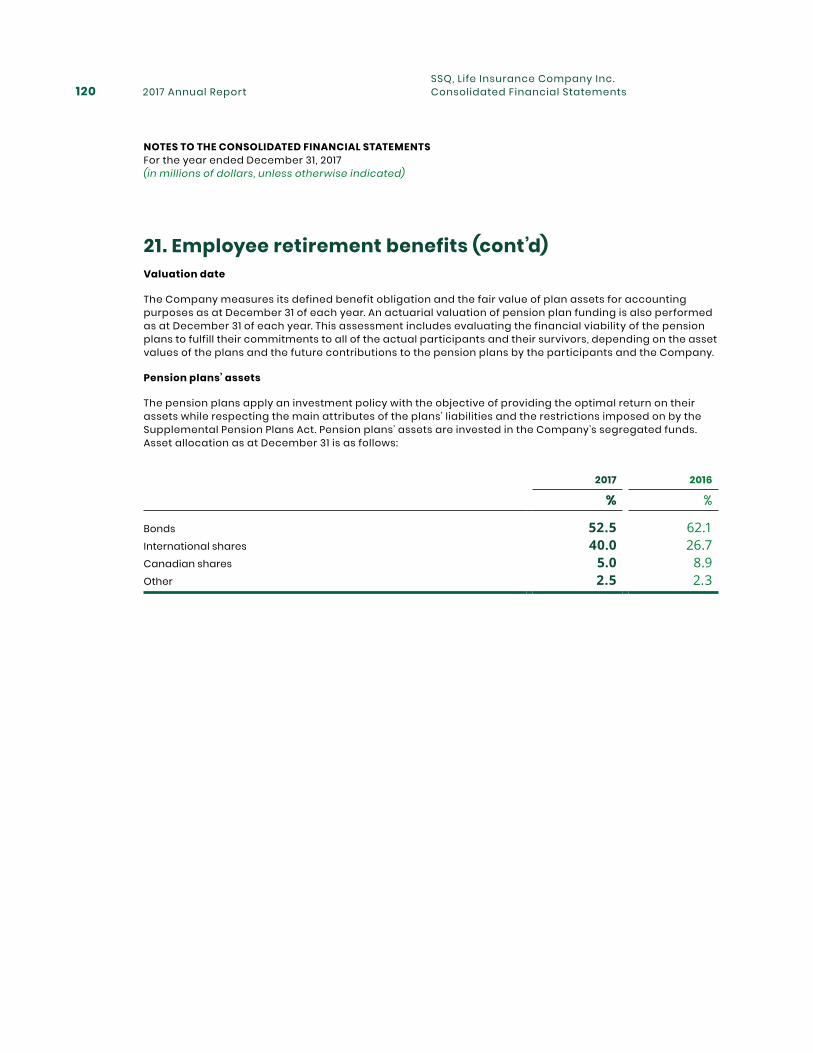
2017 Annual Report120SSQ, Life Insurance Company Inc.Consolidated Financial Statements
2017 2016
% %
Bonds 52.5 62.1International shares 40.0 26.7Canadian shares 5.0 8.9Other 2.5 2.3
21. Employee retirement benefits (cont’d)Valuation date
The Company measures its defined benefit obligation and the fair value of plan assets for accounting purposes as at December 31 of each year. An actuarial valuation of pension plan funding is also performed as at December 31 of each year. This assessment includes evaluating the financial viability of the pension plans to fulfill their commitments to all of the actual participants and their survivors, depending on the asset values of the plans and the future contributions to the pension plans by the participants and the Company.
Pension plans’ assets
The pension plans apply an investment policy with the objective of providing the optimal return on their assets while respecting the main attributes of the plans’ liabilities and the restrictions imposed on by the Supplemental Pension Plans Act. Pension plans’ assets are invested in the Company’s segregated funds. Asset allocation as at December 31 is as follows:
NOTES TO THE CONSOLIDATED FINANCIAL STATEMENTS For the year ended December 31, 2017 (in millions of dollars, unless otherwise indicated)
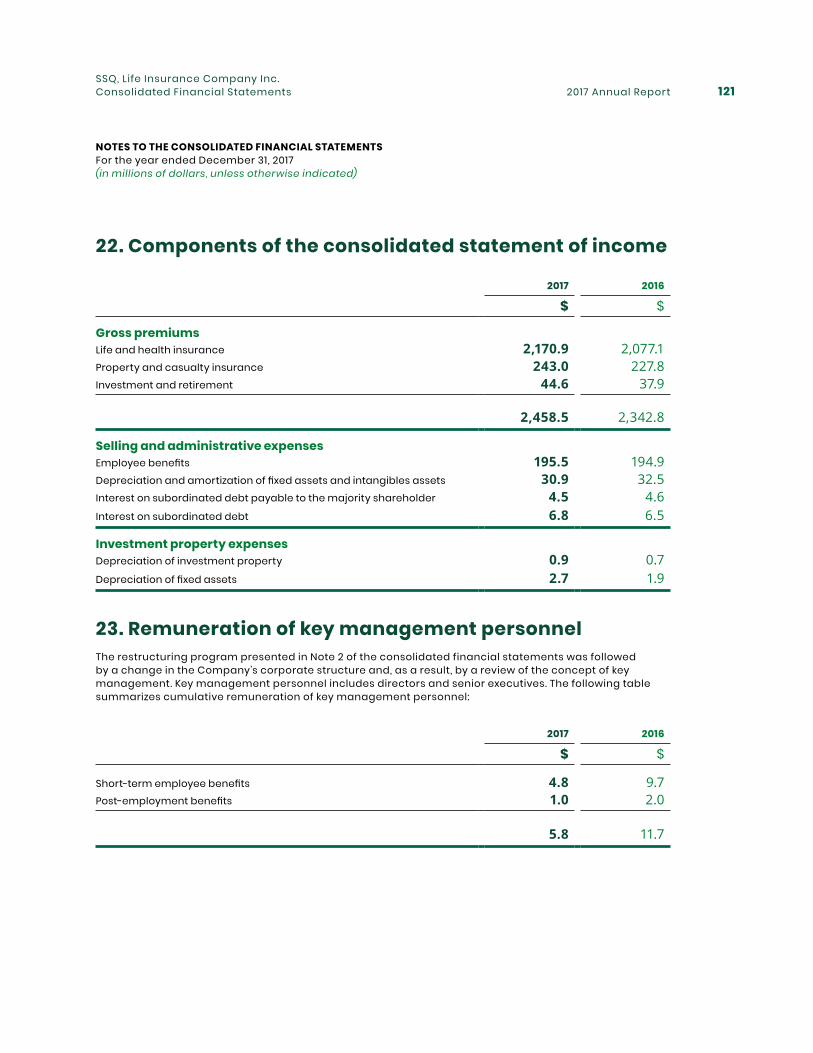
2017 Annual Report 121SSQ, Life Insurance Company Inc.Consolidated Financial Statements
23. Remuneration of key management personnelThe restructuring program presented in Note 2 of the consolidated financial statements was followed by a change in the Company’s corporate structure and, as a result, by a review of the concept of key management. Key management personnel includes directors and senior executives. The following table summarizes cumulative remuneration of key management personnel:
22. Components of the consolidated statement of income
2017 2016
$ $
Gross premiumsLife and health insurance 2,170.9 2,077.1Property and casualty insurance 243.0 227.8Investment and retirement 44.6 37.9
2,458.5 2,342.8
Selling and administrative expensesEmployee benefits 195.5 194.9Depreciation and amortization of fixed assets and intangibles assets 30.9 32.5Interest on subordinated debt payable to the majority shareholder 4.5 4.6Interest on subordinated debt 6.8 6.5
Investment property expensesDepreciation of investment property 0.9 0.7Depreciation of fixed assets 2.7 1.9
2017 2016
$ $
Short-term employee benefits 4.8 9.7Post-employment benefits 1.0 2.0
5.8 11.7
NOTES TO THE CONSOLIDATED FINANCIAL STATEMENTS For the year ended December 31, 2017 (in millions of dollars, unless otherwise indicated)
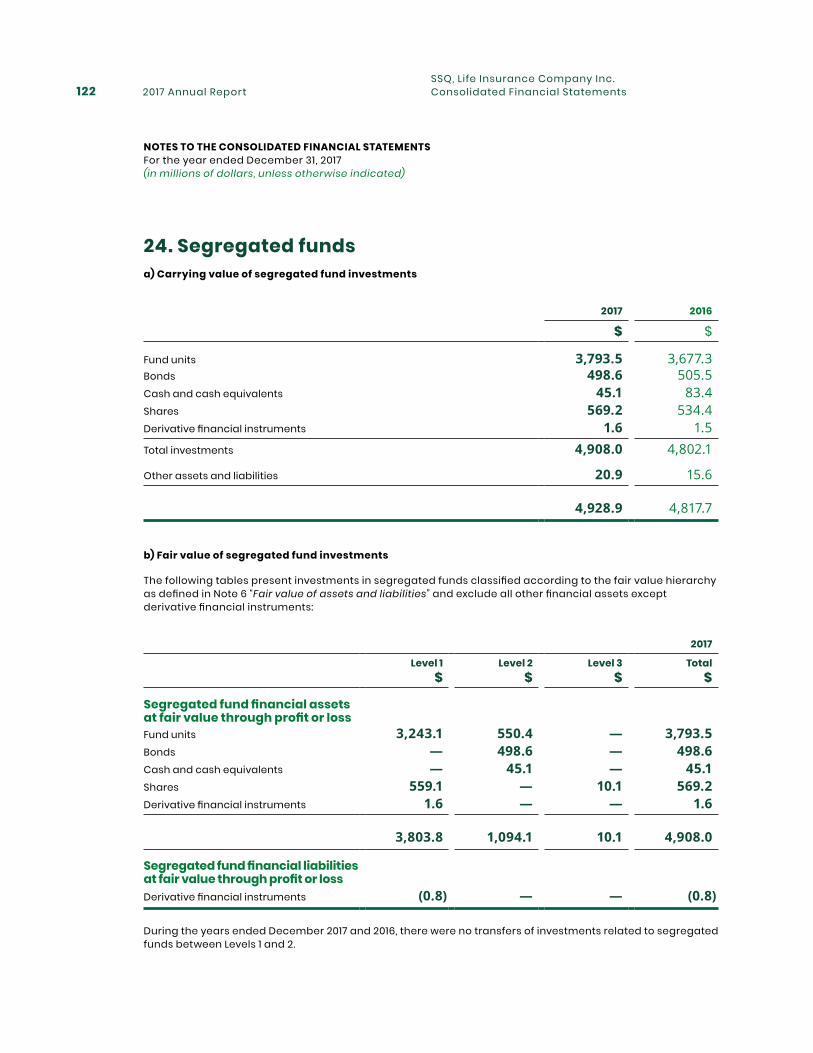
2017 Annual Report122SSQ, Life Insurance Company Inc.Consolidated Financial Statements
24. Segregated fundsa) Carrying value of segregated fund investments
2017 2016
$ $
Fund units 3,793.5 3,677.3Bonds 498.6 505.5Cash and cash equivalents 45.1 83.4Shares 569.2 534.4Derivative financial instruments 1.6 1.5Total investments 4,908.0 4,802.1
Other assets and liabilities 20.9 15.6
4,928.9 4,817.7
b) Fair value of segregated fund investments
The following tables present investments in segregated funds classified according to the fair value hierarchy as defined in Note 6 “Fair value of assets and liabilities” and exclude all other financial assets except derivative financial instruments:
2017
Level 1 Level 2 Level 3 Total$ $ $ $
Segregated fund financial assets at fair value through profit or lossFund units 3,243.1 550.4 — 3,793.5Bonds — 498.6 — 498.6Cash and cash equivalents — 45.1 — 45.1Shares 559.1 — 10.1 569.2Derivative financial instruments 1.6 — — 1.6
3,803.8 1,094.1 10.1 4,908.0
Segregated fund financial liabilities at fair value through profit or lossDerivative financial instruments (0.8) — — (0.8)
During the years ended December 2017 and 2016, there were no transfers of investments related to segregated funds between Levels 1 and 2.
NOTES TO THE CONSOLIDATED FINANCIAL STATEMENTS For the year ended December 31, 2017 (in millions of dollars, unless otherwise indicated)
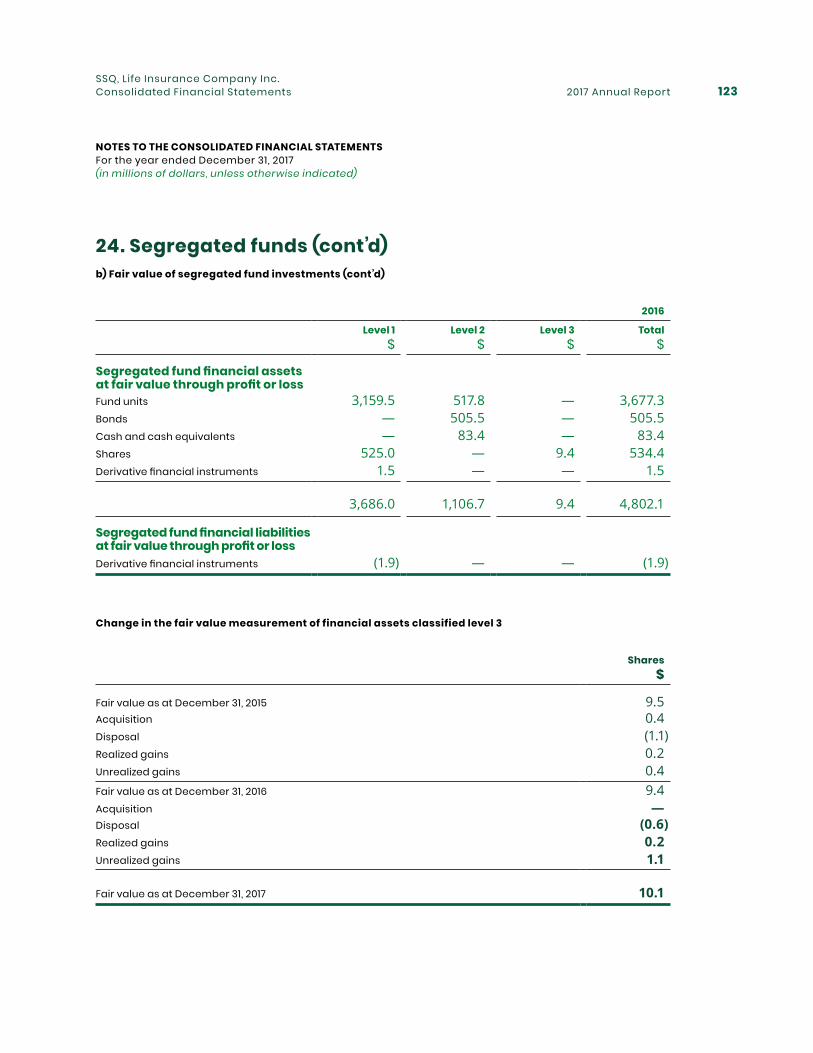
2017 Annual Report 123SSQ, Life Insurance Company Inc.Consolidated Financial Statements
24. Segregated funds (cont’d)b) Fair value of segregated fund investments (cont’d)
Change in the fair value measurement of financial assets classified level 3
NOTES TO THE CONSOLIDATED FINANCIAL STATEMENTS For the year ended December 31, 2017 (in millions of dollars, unless otherwise indicated)
2016
Level 1 Level 2 Level 3 Total$ $ $ $
Segregated fund financial assets at fair value through profit or lossFund units 3,159.5 517.8 — 3,677.3Bonds — 505.5 — 505.5Cash and cash equivalents — 83.4 — 83.4Shares 525.0 — 9.4 534.4Derivative financial instruments 1.5 — — 1.5
3,686.0 1,106.7 9.4 4,802.1
Segregated fund financial liabilities at fair value through profit or lossDerivative financial instruments (1.9) — — (1.9)
Shares$
Fair value as at December 31, 2015 9.5Acquisition 0.4Disposal (1.1)Realized gains 0.2Unrealized gains 0.4Fair value as at December 31, 2016 9.4Acquisition —Disposal (0.6)Realized gains 0.2Unrealized gains 1.1
Fair value as at December 31, 2017 10.1
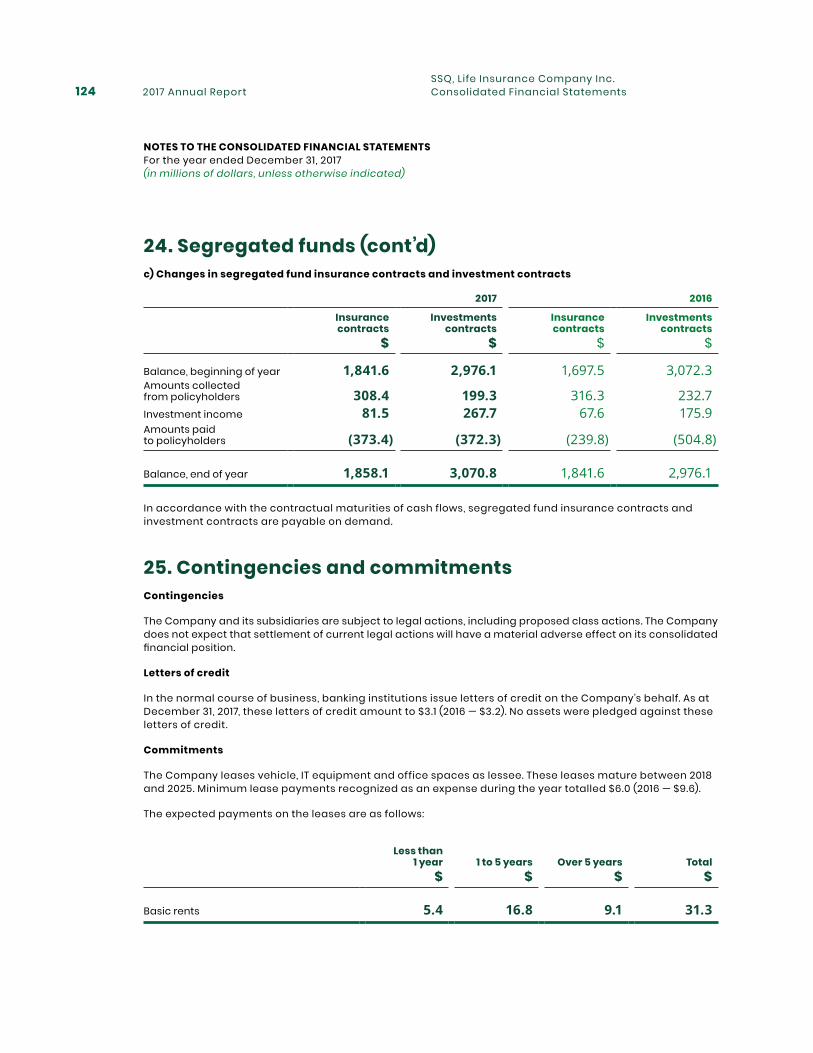
2017 Annual Report124SSQ, Life Insurance Company Inc.Consolidated Financial Statements
24. Segregated funds (cont’d)c) Changes in segregated fund insurance contracts and investment contracts
2017 2016
Insurance contracts
Investments contracts
Insurance contracts
Investments contracts
$ $ $ $
Balance, beginning of year 1,841.6 2,976.1 1,697.5 3,072.3Amounts collected from policyholders 308.4 199.3 316.3 232.7Investment income 81.5 267.7 67.6 175.9Amounts paid to policyholders (373.4) (372.3) (239.8) (504.8)
Balance, end of year 1,858.1 3,070.8 1,841.6 2,976.1
In accordance with the contractual maturities of cash flows, segregated fund insurance contracts and investment contracts are payable on demand.
25. Contingencies and commitmentsContingencies
The Company and its subsidiaries are subject to legal actions, including proposed class actions. The Company does not expect that settlement of current legal actions will have a material adverse effect on its consolidated financial position.
Letters of credit
In the normal course of business, banking institutions issue letters of credit on the Company’s behalf. As at December 31, 2017, these letters of credit amount to $3.1 (2016 — $3.2). No assets were pledged against these letters of credit.
Commitments
The Company leases vehicle, IT equipment and office spaces as lessee. These leases mature between 2018 and 2025. Minimum lease payments recognized as an expense during the year totalled $6.0 (2016 — $9.6).
The expected payments on the leases are as follows:
Less than 1 year 1 to 5 years Over 5 years Total
$ $ $ $
Basic rents 5.4 16.8 9.1 31.3
NOTES TO THE CONSOLIDATED FINANCIAL STATEMENTS For the year ended December 31, 2017 (in millions of dollars, unless otherwise indicated)
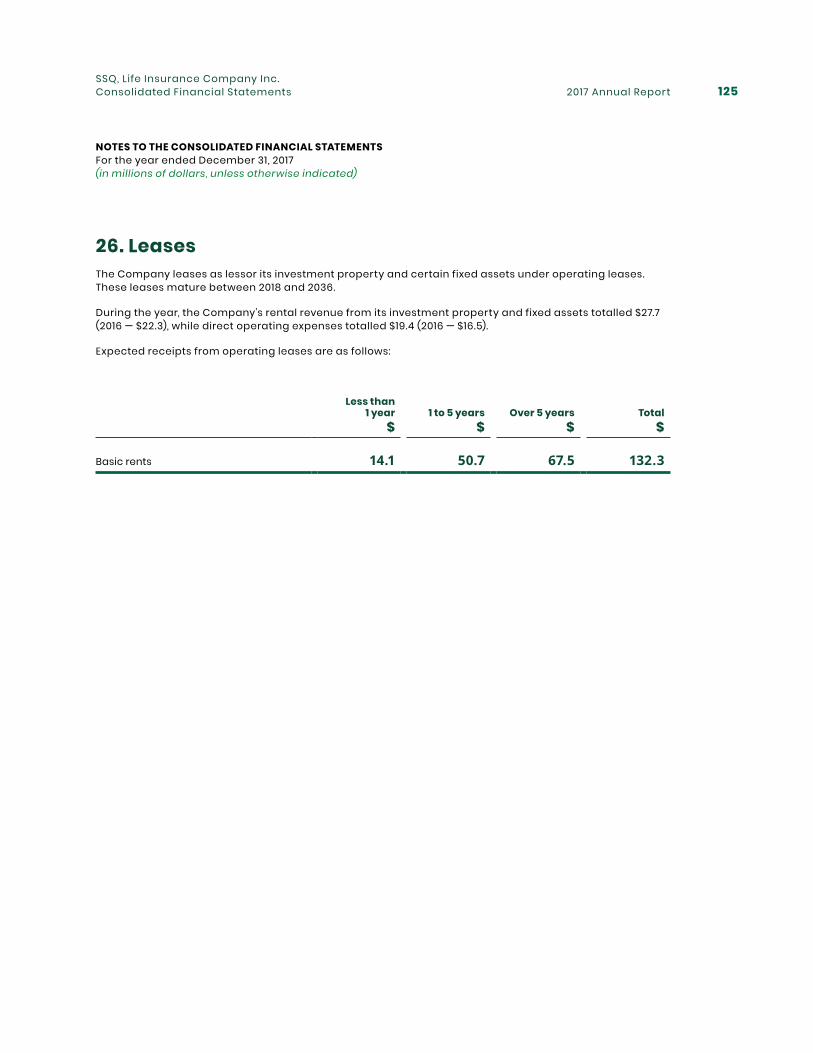
2017 Annual Report 125SSQ, Life Insurance Company Inc.Consolidated Financial Statements
26. Leases The Company leases as lessor its investment property and certain fixed assets under operating leases. These leases mature between 2018 and 2036.
During the year, the Company’s rental revenue from its investment property and fixed assets totalled $27.7 (2016 — $22.3), while direct operating expenses totalled $19.4 (2016 — $16.5).
Expected receipts from operating leases are as follows:
Less than 1 year 1 to 5 years Over 5 years Total
$ $ $ $
Basic rents 14.1 50.7 67.5 132.3
NOTES TO THE CONSOLIDATED FINANCIAL STATEMENTS For the year ended December 31, 2017 (in millions of dollars, unless otherwise indicated)

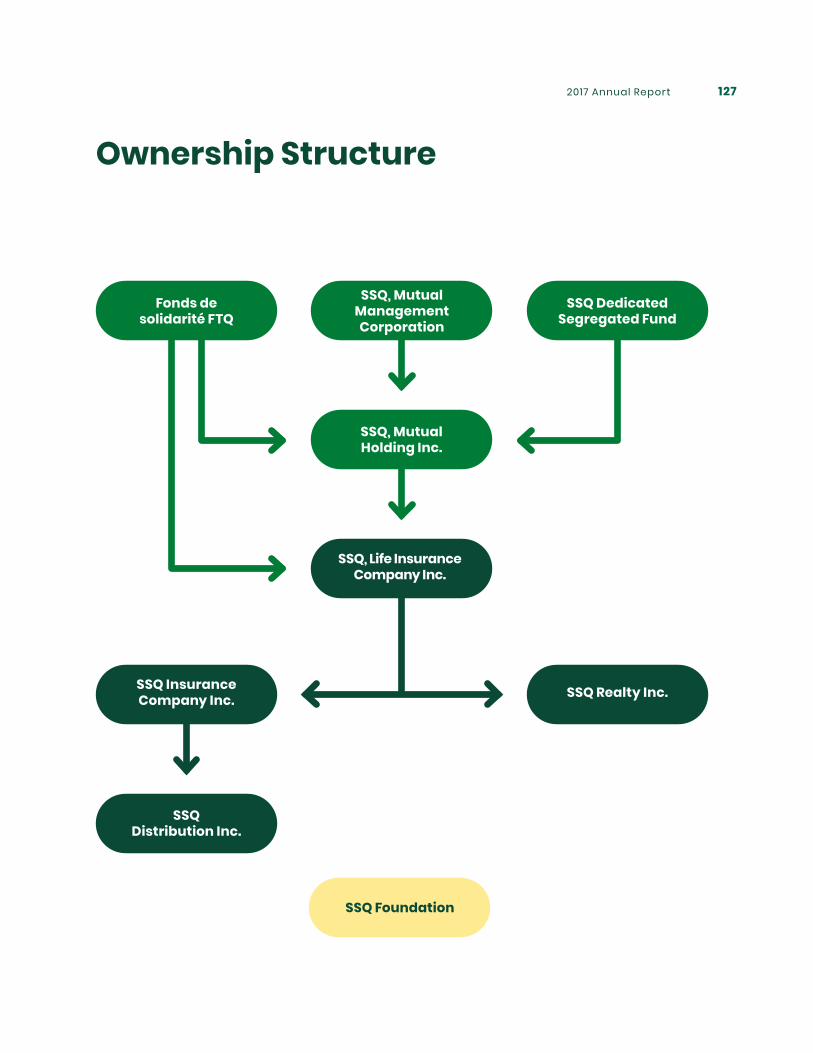
2017 Annual Report 127
Ownership Structure
SSQ InsuranceCompany Inc.
SSQ Distribution Inc.
SSQ, Mutual Holding Inc.
SSQ Foundation
SSQ Realty Inc.
SSQ, Life InsuranceCompany Inc.
Fonds de solidarité FTQ
SSQ DedicatedSegregated Fund
SSQ, Mutual Management Corporation
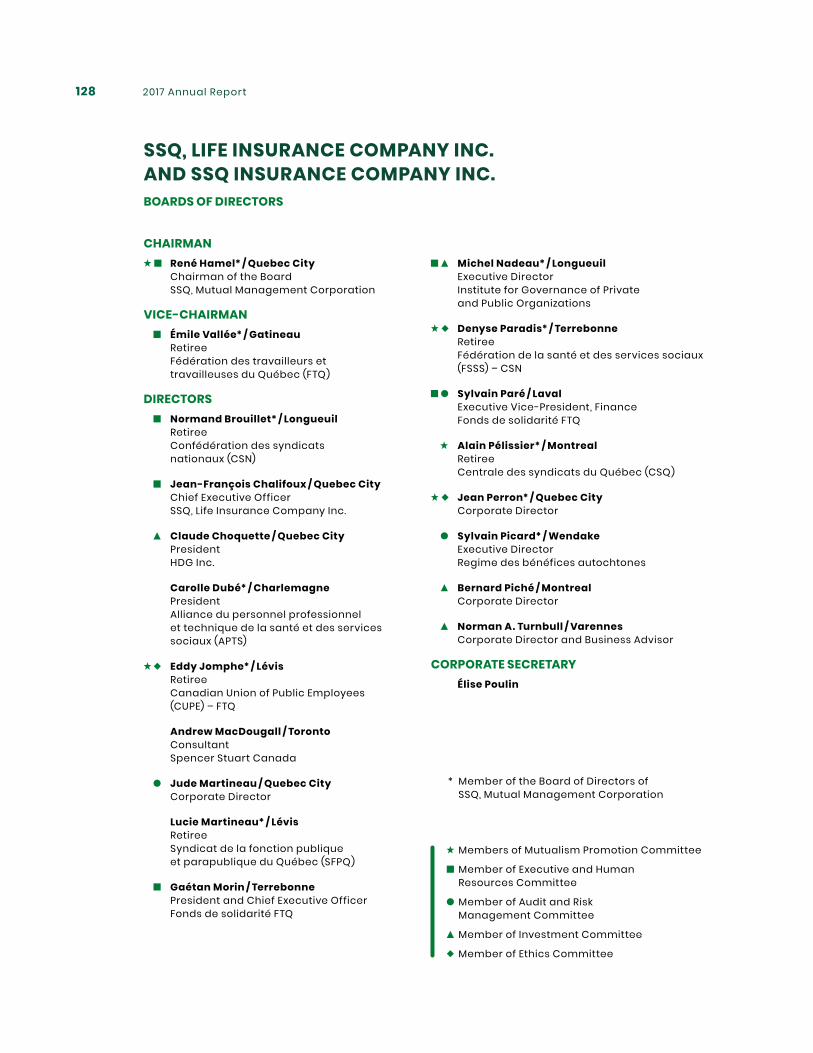
2017 Annual Report128
SSQ, LIFE INSURANCE COMPANY INC. AND SSQ INSURANCE COMPANY INC.BOARDS OF DIRECTORS
CHAIRMAN René Hamel* / Quebec City Chairman of the Board SSQ, Mutual Management Corporation
VICE-CHAIRMAN Émile Vallée* / Gatineau Retiree Fédération des travailleurs et travailleuses du Québec (FTQ)
DIRECTORS Normand Brouillet* / Longueuil Retiree Confédération des syndicats nationaux (CSN)
Jean-François Chalifoux / Quebec City Chief Executive Officer SSQ, Life Insurance Company Inc.
Claude Choquette / Quebec City President HDG Inc.
Carolle Dubé* / Charlemagne President Alliance du personnel professionnel et technique de la santé et des services sociaux (APTS)
Eddy Jomphe* / Lévis Retiree Canadian Union of Public Employees (CUPE) – FTQ
Andrew MacDougall / Toronto Consultant Spencer Stuart Canada
Jude Martineau / Quebec City Corporate Director
Lucie Martineau* / Lévis Retiree Syndicat de la fonction publique et parapublique du Québec (SFPQ)
Gaétan Morin / Terrebonne President and Chief Executive Officer Fonds de solidarité FTQ
Michel Nadeau* / Longueuil Executive Director Institute for Governance of Private and Public Organizations
Denyse Paradis* / Terrebonne Retiree Fédération de la santé et des services sociaux (FSSS) – CSN
Sylvain Paré / Laval Executive Vice-President, Finance Fonds de solidarité FTQ
Alain Pélissier* / Montreal Retiree Centrale des syndicats du Québec (CSQ)
Jean Perron* / Quebec City Corporate Director
Sylvain Picard* / Wendake Executive Director Regime des bénéfices autochtones
Bernard Piché / Montreal Corporate Director
Norman A. Turnbull / Varennes Corporate Director and Business Advisor
CORPORATE SECRETARY Élise Poulin
Members of Mutualism Promotion Committee
Member of Executive and Human Resources Committee
Member of Audit and Risk Management Committee
Member of Investment Committee
Member of Ethics Committee
* Member of the Board of Directors of SSQ, Mutual Management Corporation
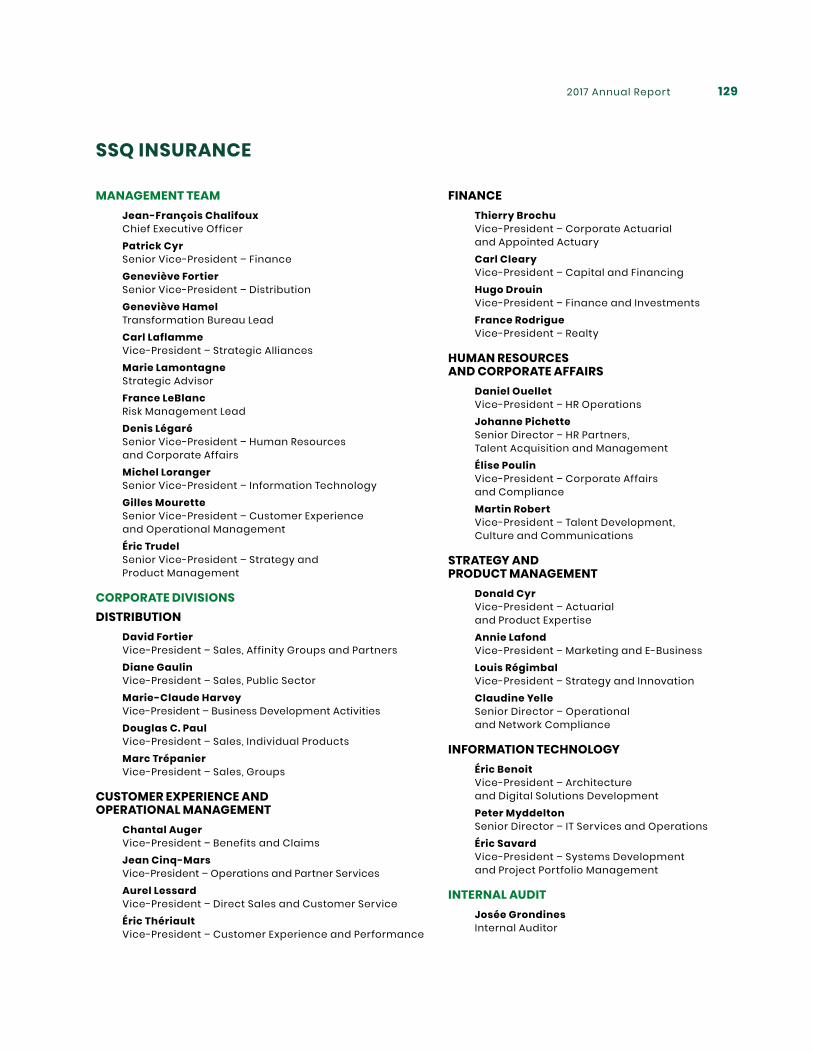
2017 Annual Report 129
SSQ INSURANCE
MANAGEMENT TEAM Jean-François Chalifoux Chief Executive Officer Patrick Cyr Senior Vice-President – Finance Geneviève Fortier Senior Vice-President – Distribution Geneviève Hamel Transformation Bureau Lead Carl Laflamme Vice-President – Strategic Alliances Marie Lamontagne Strategic Advisor France LeBlanc Risk Management Lead Denis Légaré Senior Vice-President – Human Resources and Corporate Affairs Michel Loranger Senior Vice-President – Information Technology Gilles Mourette Senior Vice-President – Customer Experience and Operational Management Éric Trudel Senior Vice-President – Strategy and Product Management
CORPORATE DIVISIONSDISTRIBUTION David Fortier Vice-President – Sales, Affinity Groups and Partners Diane Gaulin Vice-President – Sales, Public Sector Marie-Claude Harvey Vice-President – Business Development Activities Douglas C. Paul Vice-President – Sales, Individual Products Marc Trépanier Vice-President – Sales, Groups
CUSTOMER EXPERIENCE AND OPERATIONAL MANAGEMENT Chantal Auger Vice-President – Benefits and Claims Jean Cinq-Mars Vice-President – Operations and Partner Services Aurel Lessard Vice-President – Direct Sales and Customer Service Éric Thériault Vice-President – Customer Experience and Performance
FINANCE Thierry Brochu Vice-President – Corporate Actuarial and Appointed Actuary Carl Cleary Vice-President – Capital and Financing Hugo Drouin Vice-President – Finance and Investments France Rodrigue Vice-President – Realty
HUMAN RESOURCES AND CORPORATE AFFAIRS Daniel Ouellet Vice-President – HR Operations Johanne Pichette Senior Director – HR Partners, Talent Acquisition and Management Élise Poulin Vice-President – Corporate Affairs and Compliance Martin Robert Vice-President – Talent Development, Culture and Communications
STRATEGY AND PRODUCT MANAGEMENT Donald Cyr Vice-President – Actuarial and Product Expertise Annie Lafond Vice-President – Marketing and E-Business Louis Régimbal Vice-President – Strategy and Innovation Claudine Yelle Senior Director – Operational and Network Compliance
INFORMATION TECHNOLOGY Éric Benoit Vice-President – Architecture and Digital Solutions Development Peter Myddelton Senior Director – IT Services and Operations Éric Savard Vice-President – Systems Development and Project Portfolio Management
INTERNAL AUDIT Josée Grondines Internal Auditor
2017 Annual Report130
ADDRESSESHead Office 2525 Laurier Boulevard Quebec City, QC G1V 2L2 Tel. : 418-650-3457 1-888-900-3457
1225 St. Charles Street West, Suite 200 Longueuil, QC J4K 0B9 Tel. : 514-521-9097 1-855-233-7056
110 Sheppard Avenue East, Suite 500 Toronto, ON M2N 6Y8 Tel. : 416-221-3477 1-866-696-6001
1610 Bellefeuille Street, Suite 201 Trois-Rivières, QC G9A 6H7 Tel. : 819-373-7717
193 Denison Street East, Suite 202 Granby, QC J2H 2R4 Tel. : 1-888-900-3457
800 6th Avenue SW, Suite 650 Calgary, AB T2P 3G3 Tel. : 403-592-8516 1-855-772-3082
1680 Bedford Row PO Box 1001 Halifax, NS B3J 2X1 Tel. : 1-800-848-0158
701 Georgia Street West, Suite 1558 Vancouver, BC V7Y 1C6 Tel. : 1-855-803-5797
CONTACT USCommunications Tel. : 1-866-332-3806 [email protected]
You can also visit us at ssq.ca.
ISSN-1700 0688 Legal Deposit – 2nd Quarter 2018 Bibliothèque et Archives nationales du Québec National Library of Canada


BMG
115A
(201
8-04
)


