128
2017 Annual Report Sydbank Group

2017 Annual ReportSydbank Group

2 S Y D B A N K / 2 0 1 7 A n n u a l R e p o r t

2 0 1 7 A n n u a l R e p o r t / S Y D B A N K 3
A highly satisfactory result ensures a record-high dividend per share and a new share buyback programme of DKK 500m. Total distribution represents 83% of profit for the year after tax.
Sydbank’s 2017 financial statements show a profit before tax
of DKK 1,956m compared with DKK 1,869m in 2016. The
improvement is due to a reversal of impairment charges and
very satisfactory investment portfolio earnings. Profit before
tax equals a return of 16.8% p.a. on average shareholders’
equity. The profit exceeds the expectations presented in the
2016 financial statements.
Profit for the year represents DKK 1,531m against DKK
1,472m in 2016, equal to a return on average shareholders’
equity of 13.1% after tax.
CEO Karen Frøsig comments on the year’s result: - As a result of the negative interest rate environment combi-ned with fierce competition in the sector, the Group’s net inte-rest income continues to be under pressure. I am therefore very happy that we have succeeded in holding total core income at the same level as in 2016, which is in no small part thanks to the efforts of Sydbank’s many competent employees.
Chairman of Sydbank’s Board of Directors Torben Nielsen ela-borates:- We have generated a return of 13.1% on shareholders’ equity in a highly competitive market and ensured a record-high divi-dend per share as well as the launch of a new share buyback programme of DKK 500m. After a total distribution of DKK 1,266m, the Bank will continue to be highly capitalised.
2017 highlights• A 1% decrease in total income
• A 2% rise in costs (core earnings)
• A reversal of DKK 51m in impairment charges
• A rise in core earnings of DKK 56m to DKK 1,814m
• Investment portfolio earnings of DKK 182m
• Bank loans and advances of DKK 64.3bn
• Deposits of DKK 82.7bn
• A capital ratio of 20.8%, including a Common Equity Tier 1
capital ratio of 17.3%
• A proposed dividend of DKK 11.31 per share.
Outlook for 2018Limited growth is projected for the Danish economy in 2018.
Total income is expected to be on a par with the income
generated in 2017.
Costs (core earnings) are projected to rise slightly in 2018.
Impairment charges for 2018 are forecast to be at a low level.
The uncertainty surrounding price developments in the
agricultural sector may however affect impairment charges.
Non-recurring costs are expected to represent around DKK
75m.
In 2017 very satisfactory investment portfolio earnings and the reversal of impairment charges had a positive effect on profit for the year. However we cannot be sure that this will be the case also in 2018.As a result profit after tax of DKK 1,200-1,400m is projected for 2018.
The outlook is subject to uncertainty and depends among other
things on macroeconomic factors.

4 S Y D B A N K / 2 0 1 7 A n n u a l R e p o r t

2 0 1 7 A n n u a l R e p o r t / S Y D B A N K 5
Contents
The 2017 Annual Report is available in Danish at sydbank.dk/regnskab and in English at sydbank.com.In case of doubt the Danish version will apply.
Financial Review
Highlights .......................................................................................................................................................................................................................................................6
Group Financial Highlights .....................................................................................................................................................................................................................8
Summary .......................................................................................................................................................................................................................................................9
Performance in 2017 ............................................................................................................................................................................................................................12
Capital Management .............................................................................................................................................................................................................................22
Investor Relations ....................................................................................................................................................................................................................................24
Mission Statement and Business Goals .........................................................................................................................................................................................25
Organisation and Corporate Governance ......................................................................................................................................................................................30
Corporate Social Responsibility .........................................................................................................................................................................................................36
Financial Statements
Financial Statements - contents .......................................................................................................................................................................................................41
Income Statement ...................................................................................................................................................................................................................................42
Statement of Comprehensive Income ............................................................................................................................................................................................42
Balance Sheet ...........................................................................................................................................................................................................................................43
Statement of Changes in Equity .......................................................................................................................................................................................................44
Cash Flow Statement ............................................................................................................................................................................................................................46
Notes ............................................................................................................................................................................................................................................................47
Statements and Reports
Management Statement ...................................................................................................................................................................................................................110
Auditors’ Reports ..................................................................................................................................................................................................................................112
Management, Organisation etc
Notice Convening the Annual General Meeting ......................................................................................................................................................................116
Board of Directors ...............................................................................................................................................................................................................................118
Group Executive Management.......................................................................................................................................................................................................124
Organisation ...........................................................................................................................................................................................................................................126

6 S Y D B A N K / 2 0 1 7 A n n u a l R e p o r t
A highly satisfactory result ensures a record-high dividend per share and a new share buyback programme
Record-high dividend per share (DKK 11.31 per share)
We build on relationships
Market shares
50% 33%
Dividend
Meetings with adviser Online meetings with adviser
Corporate (SME) Retail
Share buyback766 DKKm
114,000 15,000
13% 6%
500 DKKm

2 0 1 7 A n n u a l R e p o r t / S Y D B A N K 7 Å r s r a p p o r t 2 0 1 6 / S Y D B A N K
Profit for the year
1,531DKKm
(+4%)
Return on shareholders’ equity
13.1%
Core income
4,167DKKm(-1%)
Impairment charges forloans and advances
(51)DKKm
Customer satisfaction
4th 5th
Corporate Retail(among the 6 largest banks)
Costs (core earnings)
2,637DKKm(+2%)
Bank loans and advances
64.3DKKbn
Dividend of DKK 11.31per share
50% of profit for the year

8 S Y D B A N K / 2 0 1 7 A n n u a l R e p o r t
Group Financial Highlights
2017 2016Index 17/16 2015 2014 2013
Income statement (DKKm)Core income 4,167 4,198 99 4,329 4,319 4,058
Trading income 233 237 98 215 196 229
Total income 4,400 4,435 99 4,544 4,515 4,287Costs, core earnings 2,637 2,590 102 2,675 2,619 2,514
Core earnings before impairment 1,763 1,845 96 1,869 1,896 1,773Impairment of loans and advances etc (51) 87 - 316 707 1,861
Core earnings 1,814 1,758 103 1,553 1,189 (88)Investment portfolio earnings 182 104 175 (80) 76 319
Profit before non-recurring items 1,996 1,862 107 1,473 1,265 231Non-recurring items, net (40) 7 - - 64 (60)
Profit before tax 1,956 1,869 105 1,473 1,329 171Tax 425 397 107 325 277 (16)
Profit for the year 1,531 1,472 104 1,148 1,052 187
Balance sheet highlights (DKKbn)Loans and advances at amortised cost 64.3 77.2 83 74.3 68.5 66.6
Loans and advances at fair value 5.2 6.1 85 10.2 6.9 4.9
Deposits and other debt 82.7 81.1 102 79.9 73.9 70.0
Bonds issued at amortised cost 3.7 3.7 100 3.7 3.7 6.5
Subordinated capital 1.9 2.1 90 2.1 1.4 1.8
Shareholders’ equity 11.9 11.8 101 11.4 11.3 10.2
Total assets 138.5 146.7 94 142.7 152.3 147.9
Financial ratios per share (DKK per share of DKK 10) EPS Basic 22.4 20.9 15.8 14.3 2.5EPS Diluted 22.4 20.9 15.8 14.3 2.5Share price at year-end 249.9 219.2 221.8 190.2 144.0Book value 178.3 169.2 160.2 154.2 139.7Share price/book value 1.40 1.30 1.38 1.23 1.03Average number of shares outstanding (in millions) 68.4 70.4 72.5 73.3 73.4Proposed dividend 11.31 10.46 11.12 7.08 -
Other financial ratios and key figuresCommon Equity Tier 1 capital ratio 17.3 16.1 14.5 13.9 13.4Tier 1 capital ratio 17.7 17.4 15.9 15.5 15.3Capital ratio 20.8 19.2 17.6 16.0 15.7Pre-tax profit as % of average shareholders’ equity 16.8 16.6 13.3 12.4 1.6
Post-tax profit as % of average shareholders’ equity 13.1 13.1 10.2 9.6 1.8Costs (core earnings) as % of total income 59.9 58.4 58.9 58.0 58.6Return on assets (%) 1.07 1.02 0.78 0.70 0.12Interest rate risk 0.8 1.6 2.8 0.0 0.6Foreign exchange position 1.2 2.2 2.2 1.8 2.1Foreign exchange risk 0.0 0.0 0.0 0.0 0.0Loans and advances relative to deposits 0.6 0.8 0.8 0.8 0.8Loans and advances relative to shareholders’ equity 5.4 6.6 6.5 6.1 6.5Growth in loans and advances for the year (16.7) 3.9 8.5 2.8 (2.3)Excess cover relative to statutory liquidity requirements (section 152 of the Danish Financial Business Act) 232.1 186.5 166.8 142.2 179.8Total large exposures 0.0 0.0 0.0 0.0 25.8Accumulated impairment ratio 3.6 3.6 4.7 5.1 5.4Impairment ratio for the year (0.1) 0.1 0.4 0.8 2.3Number of full-time staff at year-end 2,064 2,037 101 2,044 2,101 2,231Financial ratio definitions on page 94.

2 0 1 7 A n n u a l R e p o r t / S Y D B A N K 9
Summary
A highly satisfactory result ensures a record-high dividend per share and a new share buyback programme of DKK 500m. Total distribution represents 83% of profit for the year after tax.
Sydbank’s 2017 financial statements show a profit before tax
of DKK 1,956m compared with DKK 1,869m in 2016. The
improvement is due to a reversal of impairment charges and
very satisfactory investment portfolio earnings. Profit before
tax equals a return of 16.8% p.a. on average shareholders’
equity. The profit exceeds the expectations presented in the
2016 financial statements.
Profit for the year after tax represents DKK 1,531m against
DKK 1,472m in 2016, equal to a return on average
shareholders’ equity of 13.1%.
The 3-year plan “Blue growth”The plan for the 3-year period 2016-2018 is named “Blue
growth”. The plan must ensure that the positive development in
the Group’s profitability is sustained.
Blue growth – financial targets • Realise a return on shareholders’ equity of a minimum of
12% after tax or be in the top 3 of the 6 largest banks
• Maintain top 3 ranking among the 6 largest banks in terms
of customer satisfaction.
Status – targets
Target Objective Status at 31 December 2017 Comment
Return on shareholders’ equityafter tax
Over 12%* 13.1% Progressing as planned
Customer satisfaction- Corporate
Top 3** 4th - Aalund Not met in 2017
Customer satisfaction- Retail
Top 3** 5th - EPSI Not met in 2017
Common Equity Tier 1 capital ratio Around 14.0% 17.3% Met from Q3 2013
Capital ratio Around 18.0% 20.8% Met from Q1 2015
Dividend30-50% of profit for the year after tax
50% of profit after tax(proposed)
Met in 2017(proposed dividend)
* or top 3 ranking among the 6 largest banks
** among the 6 largest banks
among the 6 largest banks
* or top 3 ranking amongthe 6 largest banks
Return on shareholders’ equity
12%
Top 3Customer satisfaction
after tax*
Targets - Blue growth

10 S Y D B A N K / 2 0 1 7 A n n u a l R e p o r t
Results for 2017As a result of the negative interest rate environment combined
with fierce competition in the sector, the Group’s net interest
income remains under pressure. Net interest income has
decreased by DKK 330m or 14% to DKK 1,993m. DKK 129m
of the decline is attributable to the effects of the amended
funding agreement concerning mortgage-like loans. The
funding agreement was changed from an offsetting model
according to which the Bank covers losses as regards the entire
loan to a guarantee model according to which the Bank
provides a guarantee for the part of the loan in the LTV range
of 60-80%. As a consequence of the amendment of the
agreement, funded mortgage-like loans will not be recognised
in the balance sheet in future and income will be recognised as
mortgage credit income.
Mortgage credit income has increased by DKK 175m or 44%
compared with 2016.
Other core income has risen by DKK 124m or 8% compared
with 2016.
Total core income has decreased by DKK 31m or 1% compared
with 2016.
Trading income has dropped by DKK 4m or 2% compared with
2016.
Total income has declined by DKK 35m or 1% compared with
2016.
Costs (core earnings) have increased by DKK 47m or 2%
compared with 2016. The increase is a consequence of general
pay rises for the financial sector and a payroll tax increase of
0.5 percentage points.
The Group’s impairment charges for loans and advances
constitute an income of DKK 51m in 2017.
Core earnings have increased by DKK 56m to DKK 1,814m
compared with DKK 1,758m in 2016. The improvement is
attributable to the decrease in impairment charges for loans
and advances.
Together the Group’s position-taking and liquidity handling
generated investment portfolio earnings of DKK 182m in 2017
compared with DKK 104m in 2016.
Profit before tax rose to DKK 1,956m in 2017 compared to
DKK 1,869m in 2016. Tax has been calculated at DKK 425m.
Profit for the year amounts to DKK 1,531m compared with
DKK 1,472m in 2016.
Bank loans and advances decreased by DKK 12.9bn in 2017.
DKK 10.0bn of the decline is attributable to funded mortgage-
like loans no longer being recognised in the balance sheet.
Return on shareholders’ equity before and after tax constitutes
16.8% and 13.1% respectively against 16.6% and 13.1% in
2016.
Earnings per share has increased to DKK 22.4 from DKK 20.9
in 2016.
During the year shareholders’ equity grew by DKK 169m to
DKK 11,926m.
Less the proposed dividend, the Common Equity Tier 1 capital
ratio and the capital ratio stand at 17.3% and 20.8%
respectively at year-end 2017 compared to 16.1% and 19.2%
at year-end 2016.
At 31 December 2017 the individual solvency need
represented 11.0% (2016: 10.2%).
Total credit intermediationIn addition to traditional bank loans and advances the Group
arranges for mortgage loans from Totalkredit and DLR Kredit.
The Group’s total credit intermediation comprises bank loans
and advances, mortgage-like loans funded by Totalkredit as well
as mortgage loans arranged through Totalkredit and DLR Kredit
respectively. At 31 December 2017 credit intermediation totalled
DKK 144.0bn – a drop of DKK 3.9bn compared with year-end
2016.
Total credit intermediation
Group – year-end (DKKbn) 2017 2016
Bank loans and advances 64.3 77.2
Funded mortgage-like loans 10.0 -
Arranged mortgage loans – Totalkredit 58.0 58.3
Arranged mortgage loans – DLR 11.7 12.4
Total 144.0 147.9
SIFISydbank has been designated as a SIFI (systemically important
financial institution) in Denmark. As a result the Bank is subject
to an additional buffer requirement of 0.6% as regards
Common Equity Tier 1 capital in 2017. The requirement will
gradually rise to 1.0% in 2019.
Summary

2 0 1 7 A n n u a l R e p o r t / S Y D B A N K 11
Capital targetsThe Group’s capital targets have been raised to a Common
Equity Tier 1 capital ratio of around 14.0% and a capital ratio
of around 18.0%. Before the change the capital targets were a
Common Equity Tier 1 capital ratio of around 13.5% and a
capital ratio of around 17.0%.
Proposed dividend for 2017The Board of Directors proposes – in compliance with the Bank’s
dividend policy – that a dividend of DKK 11.31 per share, equal to
50% of the Group’s profit after tax, be distributed and that DKK
10m be donated to the sponsorship fund Sydbank Fonden.
No dividend will be distributed as regards the shares acquired in
connection with the share buyback programme completed in
2017.
Share buyback in 2018Following distribution of the proposed dividend, the capital
ratios will remain above the capital targets. As a result the
Board of Directors has resolved to implement a share buyback
totalling DKK 500m in 2018.
The Group will continue to be highly capitalised after the
proposed dividend distribution and the share buyback.
Outlook for 2018Limited growth is projected for the Danish economy in 2018.
Total income is expected to be on a par with the income
generated in 2017.
Costs (core earnings) are projected to rise slightly in 2018.
Impairment charges for 2018 are forecast to be at a low level.
The uncertainty surrounding price developments in the
agricultural sector may however affect impairment charges.
Non-recurring costs are expected to represent around DKK
75m.
In 2017 very satisfactory investment portfolio earnings and the reversal of impairment charges had a positive effect on pro-fit for the year. However we cannot be sure that this will be the case also in 2018.As a result profit after tax of DKK 1,200-1,400m is projected for 2018.
The outlook is subject to uncertainty and depends among
other things on macroeconomic factors.

12 S Y D B A N K / 2 0 1 7 A n n u a l R e p o r t
Performance in 2017
The Sydbank Group has recorded a profit before tax of DKK
1,956m (2016: DKK 1,869m). The performance exceeds the
expectations at the beginning of the year. Profit before tax
equals a return of 16.8% p.a. on average shareholders’ equity.
Profit for the year represents DKK 1,531m against DKK
1,472m in 2016, equal to a return on average shareholders’
equity of 13.1% after tax.
The financial statements are characterised by the following:
2017• A 1% decrease in total income
• A 2% increase in costs (core earnings)
• A reversal of DKK 51m in impairment charges
• A rise in core earnings of DKK 56m to DKK 1,814m
• Investment portfolio earnings of DKK 182m
• Bank loans and advances of DKK 64.3bn (2016: DKK 77.2bn)
• Deposits of DKK 82.7bn (2016: DKK 81.1bn)
• A capital ratio of 20.8%, including a Common Equity Tier 1
capital ratio of 17.3%
• A proposed dividend of DKK 11.31 per share.
Q4• Impairment charges for loans and advances constitute an
income of DKK 13m
• Profit for the period amounts to DKK 327m.
Income statement
Group (DKKm) 2017 2016
Core income 4,167 4,198
Trading income 233 237
Total income 4,400 4,435
Costs, core earnings 2,637 2,590
Core earnings before impairment 1,763 1,845
Impairment of loans and advances etc (51) 87
Core earnings 1,814 1,758
Investment portfolio earnings 182 104
Profit before non-recurring items 1,996 1,862
Non-recurring items, net (40) 7
Profit before tax 1,956 1,869
Tax 425 397
Profit for the year 1,531 1,472
Core incomeTotal core income has declined by DKK 31m to DKK 4,167m.
As a result of the negative interest rate environment combined
with fierce competition in the sector, the Group’s net interest
income remains under pressure. Net interest income has
decreased by DKK 330m or 14% to DKK 1,993m. DKK 129m
of the decline is attributable to the effects of the amended
funding agreement concerning mortgage-like loans. The fund-
ing agreement was changed from an offsetting model accord-
ing to which the Bank covers losses as regards the entire loan
to a guarantee model according to which the Bank provides a
guarantee for the part of the loan in the LTV range of 60-80%.
As a consequence of the amendment of the agreement, funded
mortgage-like loans will not be recognised in the balance sheet
in future and income will be recognised as mortgage credit
income.
Net income from the cooperation with Totalkredit represents
DKK 420m (2016: DKK 291m) after a set-off of loss of DKK
27m (2016: DKK 23m). The cooperation with DLR Kredit has
generated an income of DKK 152m (2016: DKK 107m).
Compared to 2016 mortgage credit income has gone up by a
total of DKK 175m to DKK 575m – an increase of 44%. DKK
113m of the DKK 175m increase is attributable to funded
mortgage-like loans.
Income from remortgaging and loan fees has risen by DKK 63m
to DKK 133m compared to 2016 – a rise of 90%.
Commission and brokerage income has gone up by DKK 11m
to DKK 365m – an increase of 3% compared to 2016.
Income from asset management has climbed by DKK 44m to
DKK 264m – a rise of 20% compared with 2016. DKK 14m of
the income is attributable to performance-related fees.
The remaining income components have risen by DKK 6m
compared to 2016, equal to 1%.

2 0 1 7 A n n u a l R e p o r t / S Y D B A N K 13
Core income
Group (DKKm) 2017 2016
Net interest etc 1,993 2,323
Mortgage credit 575 400
Payment services 202 199
Remortgaging and loan fees 133 70
Commission and brokerage 365 354
Commission etc investment funds and pooled pension plans 388 381
Asset management 264 220
Custory account fees 69 71
Other operating income 178 180
Total 4,167 4,198
Trading incomeCompared with 2016 trading income has decreased by DKK
4m to DKK 233m and is composed as follows in terms of busi-
ness units:
Trading income
Group (DKKm) 2017 2016Fixed Income 143 135
Equities 58 65
Money Market and Foreign Exchange 32 37
Total 233 237
Fixed Income has generated an income of DKK 143m, an
increase of DKK 8m compared with 2016. A high level of activi-
ty was recorded in Fixed Income in 2017.
Equities has recorded an income of DKK 58m, a fall of DKK 7m
compared to 2016.
Money Market and Foreign Exchange has generated an income
of DKK 32m, a decrease of DKK 5m compared with 2016.
Costs and depreciationThe Group’s costs and depreciation totalled DKK 2,684m, equal
to an increase of DKK 63m compared with 2016.
Costs (core earnings) represent DKK 2,637m compared with
DKK 2,590m in 2016. The increase is a consequence of general
pay rises for the financial sector and a payroll tax increase of 0.5
percentage points.
At year-end 2017 the Group’s staff numbered 2,064 (full-time
equivalent).
Costs and depreciation
Group (DKKm) 2017 2016
Staff costs 1,561 1,519
Other administrative expenses 976 968
Amortisation/depreciation and impairment of intangible assets and property, plant and equipment 122 115
Other operating expenses 25 19
Total 2,684 2,621Distributed as follows:
Costs, core earnings 2,637 2,590
Costs, investment portfolio earnings 7 7
Non-recurring costs 40 24
In connection with the opening of the new regional head office
in Odense, the number of branches was reduced by 2 in 2017,
bringing the number of branches to 62 in Denmark and 3 in
Germany.
Core earnings before impairment of loans and advancesCore earnings before impairment charges for loans and advanc-
es represent DKK 1,763m – a decrease of DKK 82m compared
with 2016.
Impairment of loans and advances etcImpairment charges for loans and advances represent an
income of DKK 51m compared with an expense of DKK 87m in
2016, equal to a fall of DKK 138m.
Impairment charges for the year by industry
Group (DKKm) 2017 2016
Agriculture etc 4 231
Trade 65 14
Real property (53) (40)
Other corporate lending 133 37
Total corporate 149 242
Retail (95) (38)
Total individual impairment charges 54 204
Collective impairment charges (105) (117)
Total impairment charges (51) 87
In 2017 collective impairment charges fell by DKK 105m
(2016: DKK 117m). Collective impairment charges constitute
DKK 75m at 31 December 2017. They were positively affected
by the reduction in collective impairment charges for agricultural
exposures of DKK 75m in 2017 (2016: reduction of DKK 75m).

14 S Y D B A N K / 2 0 1 7 A n n u a l R e p o r t
In 2017 the agricultural sector saw a considerable improvement
in earnings compared to the period from 2014 to 2016.
However the sector continues to be characterised by an overall
large debt burden.
Lower earnings are expected in the agricultural sector for 2018
as a consequence of expectations of lower settlement prices.
Reference is made to the separate publication Credit Risk 2017
for further elaboration.
At year-end 2017 the impairment ratio for the year represents
minus 0.08% relative to bank loans and advances and minus
0.06% relative to bank loans and advances and guarantees. At
year-end 2017 accumulated impairment and provisions
amount to DKK 2,887m (2016: DKK 3,289m).
Individually impaired bank loans and advances
DKKm
6,000
4,000
2,000
0
%
8.0
6.0
4.0
2.0
0.0
Impaired bank loans and advancesIndividual impairment charges for bank loans and advancesImpaired bank loans and advances, netImpaired bank loans and advances as % of bank loans and advances
Q1
16
Q2
16
Q3
16
Q4
16
Q1
17
Q2
17
Q3
17
Q4
17
During the year impaired bank loans and advances before
impairment charges declined by DKK 471m to DKK 4,391m
(2016: DKK 4,862m). During the same period individually
impaired bank loans and advances after impairment charges
decreased by DKK 126m, equal to 6%. Impairment charges for
bank loans and advances subject to individual impairment rep-
resent 54.2% (2016: 56.1%).
Individually impaired bank loans and advances
Group (DKKm) 2017 2016Non-defaulted bank loans and advances 3,468 3,637
Defaulted bank loans and advances 923 1,225
Impaired bank loans and advances 4,391 4,862
Impairment charges for bank loans and advances subject to individual impairment 2,381 2,726
Impaired bank loans and advances after impairment charges 2,010 2,136
Impaired bank loans and advances as % of bank loans and advances before impairment charges 6.6 6.1
Impairment charges as % of bank loans and advances before impairment charges 3.6 3.4
Impaired as % of impaired bank loans and advances 54.2 56.1
Impairment charges as % of defaulted bank loans and advances 258.0 222.5
The figure below shows the breakdown of impaired bank loans
and advances in terms of defaulted bank loans and advances
and non-defaulted bank loans and advances. The bulk of
impaired bank loans and advances concern non-defaulted bank
loans and advances.
Breakdown of impaired bank loans and advances
DKKm
6,000
4,000
2,000
0
Defaulted bank loans and advances Non-defaulted bank loans and advances
4,515
1,708 1,665 1,603 1,225 1,246 1,144 1,030 923
4,546 4,346 3,637 3,369 3,412 3,364 3,468
Q1
16
Q1
17
Q2
16
Q2
17
Q3
16
Q3
17
Q4
16
Q4
17
Defaulted bank loans and advances declined by DKK 302m in
2017 and non-defaulted bank loans and advances decreased
by DKK 169m. The considerable drop in impaired bank loans
and advances of DKK 1,087m in Q4 2016 is attributable to a
decrease in impaired loans and advances as regards agricultural
exposures of DKK 879m. The decline regarding agricultural
exposures is primarily a consequence of the conversion of the
debt concerning 48 agricultural exposures to subordinated loan
capital in Q4 2106. The subordinated loan capital has been
written off for accounting purposes.
Performance in 2017

2 0 1 7 A n n u a l R e p o r t / S Y D B A N K 15
Core earnings Core earnings for 2017 represent DKK 1,814m – an increase of
DKK 56m compared with 2016.
Investment portfolio earningsTogether the Group’s position-taking and liquidity handling
generated earnings of DKK 182m in 2017 compared with DKK
104m in 2016.
Investment portfolio earnings
Group (DKKm) 2017 2016Position-taking 118 100
Liquidity generation and liquidity reserves 52 9
Strategic positions 19 2
Costs (7) (7)
Total 182 104
The satisfactory result for 2017 is a consequence of the excess
yield on Danish mortgage bonds relative to the risk-free inter-
est rate, a narrowing of the credit spreads on mortgage bonds
as well as gains on interest rate fluctuations – notably in the
early months of the year.
At year-end 2017 the interest rate risk is composed so that the
Group will profit from an interest rate increase.
Margin expenses as regards the Group’s senior issues are
included under liquidity generation and liquidity reserves and
represent DKK 21m in 2017 compared to DKK 35m in 2016.
Non-recurring items, netNon-recurring items etc total an expense of DKK 40m compared
with a net income of DKK 7m in 2016. The item consists of pro-
cess digitization costs related to Blue growth as well as the estab-
lishment of a new mortgage platform. In 2016 this item included
one-off income of DKK 31m concerning the adjustment of the
purchase sum from the sale of the shares in Nets Holding in 2014
as well as process optimisation costs of DKK 24m.
Profit for the yearProfit before tax amounts to DKK 1,956m (2016: DKK
1,869m). Tax represents DKK 425m (2016: DKK 397m), equiv-
alent to an effective tax rate of 21.7%. Profit for the year
amounts to DKK 1,531m (2016: DKK 1,472m).
Return Return on shareholders’ equity before and after tax constitutes
16.8% and 13.1% respectively against 16.6% and 13.1% in
2016. Earnings per share has increased to DKK 22.4 from DKK
20.9 in 2016.
Sydbank – the parentThe Bank’s total income before costs and impairment charges
for loans and advances represents DKK 4,510m (2016: DKK
4,489m). The income includes the consolidated loss on hold-
ings in associates and subsidiaries of DKK 26m (2016: profit of
DKK 71m).
Total costs including non-recurring costs of DKK 40m (2016:
DKK 24m) constitute DKK 2,608m (2016: DKK 2,552m).
A reversal of impairment charges for bank loans and advances
of DKK 51m (2016: impairment charge of DKK 87m) has been
recorded.
Pre-tax profit amounts to DKK 1,947m (2016: DKK 1,839m).
SubsidiariesProfit after tax of the subsidiaries represents minus DKK 12m
(2016: DKK 76m).
Group – Q4 2017The Group’s profit before tax for the quarter represents DKK
412m. Tax represents DKK 85m and profit for the period
amounts to DKK 327m.
Compared with Q3 2017 profit before tax shows:
• a core income of DKK 1,038m (Q3: DKK 1,036m)
• a trading income of DKK 36m (Q3: DKK 58m)
• costs (core earnings) of DKK 645m (Q3: DKK 623m)
• impairment charges for loans and advances of minus DKK 13m
(Q3: minus DKK 29m)
• investment portfolio earnings of minus DKK 13m (Q3: DKK 8m).

16 S Y D B A N K / 2 0 1 7 A n n u a l R e p o r t
Performance in 2017
Profit for the period
Group (DKKm) Q4 2017 Q3 2017 Q2 2017 Q1 2017 Q4 2016Core income 1,038 1,036 1,040 1,053 1,067
Trading income 36 58 46 93 49
Total income 1,074 1,094 1,086 1,146 1,116
Costs, core earnings 645 623 678 691 632
Core earnings before impairment 429 471 408 455 484
Impairment of loans and advances etc (13) (29) (20) 11 (27)
Core earnings 442 500 428 444 511
Investment portfolio earnings (13) 8 51 136 63
Profit before non-recurring items 429 508 479 580 574
Non-recurring items, net (17) (11) (6) (6) (14)
Profit before tax 412 497 473 574 560
Tax 85 109 104 127 116
Profit for the period 327 388 369 447 444
Total assetsThe Group’s total assets made up DKK 138.5bn at year-end
2017 against DKK 146.7bn at year-end 2016.
Assets
Group – year-end (DKKbn) 2017 2016
Amounts owed by credit institutions etc 14.6 9.0
Loans and advances at fair value (reverse transactions) 5.2 6.1
Loans and advances at amortised cost(bank loans and advances) 64.3 77.2
Securities and holdings etc 28.1 28.3
Assets related to pooled plans 16.5 13.8
Other assets etc 9.8 12.3
Total 138.5 146.7
The Group’s bank loans and advances total DKK 64.3bn.
Compared to 2016 this constitutes a decrease of DKK 12.9bn.
DKK 10.0bn of the decline is attributable to funded mortgage-
like loans no longer being recognised in the balance sheet.
Corporate lending has declined by DKK 0.7bn and retail lending
has decreased by DKK 1.9bn when the effects of the amended
funding agreement are taken into account.
Shareholders’ equity and liabilities
Group – year-end (DKKbn) 2017 2016
Amounts owed to credit institutions etc 6.0 17.6
Deposits and other debt 82.7 81.1
Deposits in pooled plans 16.5 13.8
Bonds issued 3.7 3.7
Other liabilities etc 15.4 16.2
Provisions 0.4 0.4
Subordinated capital 1.9 2.1
Shareholders’ equity 11.9 11.8
Total 138.5 146.7
Amounts owed to credit institutions etc represent DKK 6.0bn, a
decrease of DKK 11.6bn compared to 2016. One reason for
this is that the funding agreement concerning mortgage-like
loans was changed effective 1 January 2017 after which date
the funding of mortgage-like loans is no longer recognised in
the balance sheet. The funding represented DKK 5.3bn at year-
end 2016 and was included in “Amounts owed to credit
institutions etc”.
The Group’s deposits make up DKK 82.7bn. This is an increase
of DKK 1.6bn compared to 2016. Deposits have increased due
to a rise in time deposits of DKK 2.7bn, a rise in demand deposits
of DKK 2.0bn, a decrease in deposits at notice of DKK 2.7bn and
a decrease of DKK 0.4bn regarding special categories of deposits.
2 0 1 7 A n n u a l R e p o r t / S Y D B A N K 17
The Sydbank share
Number 2017 2016
Average number of shares outstanding 68,364,550 70,392,671
Number of shares outstanding at year-end 66,900,704 69,501,452
Number of shares issued at year-end 70,361,174 72,240,199
Share capitalAs a result of a capital reduction implemented in 2017 the
share capital has declined from DKK 722,401,990 at year-end
2016 to DKK 703,611,740 at year-end 2017.
The number of shares outstanding has decreased from
69,501,452 (96.21%) at the end of 2016 to 66,900,704
(95.08%) at the end of 2017. The book value of the Sydbank
share represents 178.3 (2016: 169.2). At year-end 2017 the
closing price of the Sydbank share stood at 249.9 and the share
price/book value at 1.40.
Shareholders’ equityAt year-end 2017 shareholders’ equity constitutes DKK
11,926m – an increase of DKK 169m since the beginning of
the year. The change comprises an addition from profit for the
year of DKK 1,531m, net purchases of own shares of DKK
642m as well as dividend distribution etc of DKK 720m.
CapitalThe Bank issued Tier 2 capital worth EUR 75m on 2 November
2017. The issue is a 12-year issue with a first call option after 7
years.
The Bank has prepaid Additional Tier 1 capital of EUR 100m
and DKK 85m. The prepayments were made on 25 April 2017
and 15 May 2017 respectively.
The Bank implemented a share buyback programme of DKK
664m in 2017. The share buyback commenced on 2 March
2017 and was completed on 29 December 2017. 2,690,220
shares were repurchased.
The share buyback is part of the capital adjustment to optimise
the capital structure in accordance with the Group’s capital
policy.
In 2018 the Bank will continue to optimise the capital structure,
possibly by issuing subordinated capital and consequently the
possibilities for issuing subordinated capital in the market are
monitored on an ongoing basis.
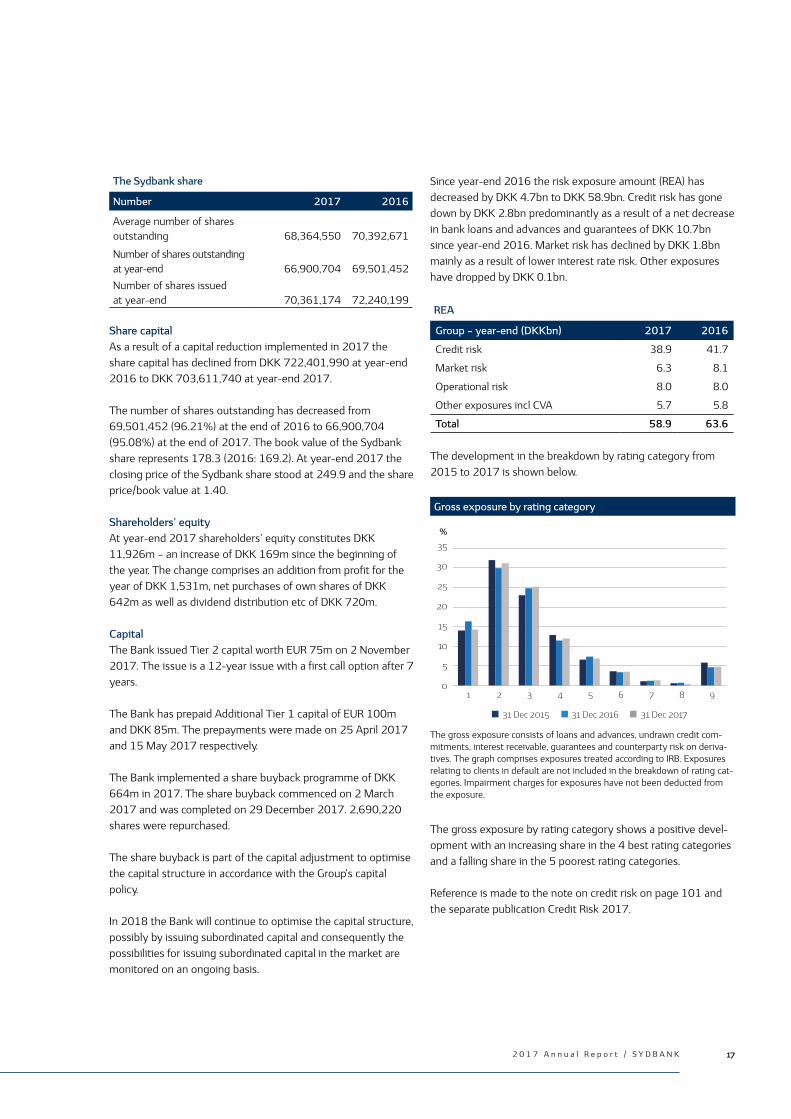
Since year-end 2016 the risk exposure amount (REA) has
decreased by DKK 4.7bn to DKK 58.9bn. Credit risk has gone
down by DKK 2.8bn predominantly as a result of a net decrease
in bank loans and advances and guarantees of DKK 10.7bn
since year-end 2016. Market risk has declined by DKK 1.8bn
mainly as a result of lower interest rate risk. Other exposures
have dropped by DKK 0.1bn.
REA
Group – year-end (DKKbn) 2017 2016
Credit risk 38.9 41.7
Market risk 6.3 8.1
Operational risk 8.0 8.0
Other exposures incl CVA 5.7 5.8
Total 58.9 63.6
The development in the breakdown by rating category from
2015 to 2017 is shown below.
Gross exposure by rating category
%
35
30
25
20
15
10
5
01
31 Dec 2015 31 Dec 2016 31 Dec 2017
2 3 4 5 6 7 8 9
The gross exposure consists of loans and advances, undrawn credit com-mitments, interest receivable, guarantees and counterparty risk on deriva-tives. The graph comprises exposures treated according to IRB. Exposures relating to clients in default are not included in the breakdown of rating cat-egories. Impairment charges for exposures have not been deducted from the exposure.
The gross exposure by rating category shows a positive devel-
opment with an increasing share in the 4 best rating categories
and a falling share in the 5 poorest rating categories.
Reference is made to the note on credit risk on page 101 and
the separate publication Credit Risk 2017.

18 S Y D B A N K / 2 0 1 7 A n n u a l R e p o r t
Performance in 2017
Solvency
Group - year-end (DKKm) 2017 2016
REA 58,889 63,607
Common Equity Tier 1 capital 10,167 10,213
Tier 1 capital 10,446 11,044
Total capital 12,240 12,242
Common Equity Tier 1 capital ratio 17.3 16.1
Tier 1 capital ratio 17.7 17.4
Capital ratio 20.8 19.2
At year-end 2017 the Common Equity Tier 1 capital ratio and
the capital ratio stand at 17.3% and 20.8% respectively com-
pared to 16.1% and 19.2% at year-end 2016.
In 2017 the capital ratio was positively affected by profit for the
year (+2.4 percentage points), the issue of new Tier 2 capital
(+0.9 percentage points) and the reduction in risk exposure
(+1.5 percentage points) and negatively affected by the pro-
posed dividend (-1.2 percentage points), the completed share
buyback programme (-1.0 percentage points), the repayment of
Additional Tier 1 capital (-0.8 percentage points) and other ele-
ments (-0.2 percentage points).
Capital ratio in 2017
Capital ratioat 1 Jan 2017
Share buybackDKK 664m
Repayment of Additional Tier 1 capital
Issue ofTier 2 capital
Profit
19.2
1.0
0.8
0.9
2.4
1.2
1.5
20.8
0.2
Proposed dividend 2017
Decline inrisk exposure
Capital ratioat 31 Dec 2017
Increase Decrease
17.0 18.0 19.0 20.0 21.0
Deductions etc
At 31 December 2017 the individual solvency need
represented 11.0% (2016: 10.2%).
Solvency of the parentAt year-end 2017 the Common Equity Tier 1 capital ratio and
the capital ratio stand at 16.7% and 20.1% respectively.
Advanced IRB – corporate exposuresToday Sydbank applies the advanced IRB approach to calculate
the capital requirement as regards retail exposures and the
foundation IRB approach to calculate the capital requirement as
regards corporate exposures.
Sydbank is working on a project with the aim of gaining approv-
al to apply the advanced IRB approach to calculate the capital
requirement as regards corporate exposures. The objective is to
gain approval in 2019.
Capital policyThe Group’s capital policy consistently supports the Group’s
strategy and at the same time takes into account Sydbank’s sta-
tus as a SIFI as well as full implementation of capital regulations.
The Group’s capital targets have been raised and the current
targets are a Common Equity Tier 1 capital ratio of around
14.0% (previously: 13.5%) and a capital ratio of around 18.0%
(previously: 17.0%). The capital targets have been set to ensure
that the Group complies with all capital requirements, including
buffer requirements, once these have been fully implemented.
Reference is made to Capital Management on page 22.
Dividend policyThe Group’s dividend policy must contribute to creating long-
term shareholder value. The objective is to distribute 30-50%
of profit for the year after tax while taking into account growth
plans and capital policy.
Interest rate risk etcThe Group’s interest rate risk represents minus DKK 86m at 31
December 2017 (2016: DKK 177m). As a result the Group will
profit from an interest rate increase.
The Group’s exchange rate risk continues to be very low and its
equity risk modest as regards its trading portfolio.
Funding and liquidityThe guidelines for calculating the Liquidity Coverage Ratio –
LCR – specify a run-off of exposures, while taking into account
counterparties, funding size, hedging and duration.
Consequently the most stable deposits are favoured relative to
large deposits, in particular large deposits from business enter-
prises and financial counterparties.

2 0 1 7 A n n u a l R e p o r t / S Y D B A N K 19
As a SIFI in Denmark, Sydbank must fully meet the LCR. The
Group’s LCR constituted 176% at 31 December 2017 (2016:
166%).
The Group has met the LCR requirement of 100% throughout
the year and as can be seen its excess cover is significant at 31
December 2017.
Joint funding The Bank’s agreement on joint funding with Totalkredit was
changed effective 1 January 2017. The agreement was changed
from an offsetting model according to which the Bank covers
losses as regards the entire loan to a guarantee model according
to which the Bank provides a guarantee for the part of the loans
in the LTV range of 60-80%. The Group no longer has a credit
risk as regards the part of the loan in the LTV range of 0-60%.
As a consequence of the amendment of the agreement, funded
mortgage-like loans are no longer recognised in the Group’s bal-
ance sheet.
At 31 December 2017 funded mortgage-like loans amount to
DKK 10.0bn (31 December 2016: DKK 5.3bn). Had the agree-
ment been effective as of 31 December 2016, bank loans and
advances would have been recognised at DKK 5.3bn less at this
date and the Bank would instead have registered guarantees for
DKK 1.2bn as regards the guarantee amount in the range of
60-80%. At the beginning of 2018 funded mortgage-like loans
represent DKK 10.9bn.
Accounting estimatesEstimates in relation to the measurement of assets and liabili-
ties are based on assumptions considered reasonable by man-
agement but which by their nature are uncertain. They may
prove to be incomplete or inaccurate as a result of develop-
ments differing from projections, in the external environment in
which the Group operates or in other respects relating to cus-
tomers or business relations.
RatingMoody’s most recent rating of Sydbank:
Outlook: Positive
Long-term deposit: A3
Baseline credit assessment: Baa1
Senior unsecured: Baa1
Short-term deposit: P-2.
ShareholdersIn 2017 the Sydbank share yielded a return of 14% (2016:
minus 1%) as a result of the increase in the share price during
the year. Moreover dividend distribution represented DKK
10.46 per share. Consequently the total return in 2017 repre-
sented 19% (2016: 4%).
The Board of Directors will propose to the AGM that 50% of the
Group’s profit after tax, equal to a dividend of DKK 11.31 per
share, be distributed and that DKK 10m be donated to the
sponsorship fund Sydbank Fonden.
Supervisory DiamondThe Supervisory Diamond sets up a number of benchmarks to
indicate banking activities that initially should be regarded as
involving a higher risk. Any breach of the Supervisory Diamond
is subject to reactions by the Danish FSA.
The calculations at the end of 2017 are shown below:
Supervisory Diamond benchmarks
Group 2017 2016
Sum of large exposures < 125% 0 0
Lending growth < 20% annually (17) 4
Commercial property exposure < 25% 8 9
Funding ratio < 1 0.69 0.80
Excess cover relative to statutory liquidity requirement > 50%(section 152 of the Danish Financial Business Act) 232 186
At 31 December 2017 the Group as well as the parent comply
with all the benchmarks of the Supervisory Diamond.
Leverage ratioThe CRR/CRD IV rules require credit institutions to calculate,
report, monitor and disclose their leverage ratio, which is defined
as Tier 1 capital as a percentage of total exposures. The
European Commission’s proposal for a revision of CRR includes
a proposal to introduce a minimum leverage ratio requirement
of 3%.
The Group’s leverage ratio stood at 6.9% at 31 December 2017
(2016: 7.0%) taking into account the transitional rules.
Assuming fully loaded Tier 1 capital under CRR/CRD IV without
any refinancing of non-eligible Additional Tier 1 capital, the lever-
age ratio would be 6.7% (2016: 6.5%).
The introduction of a minimum leverage ratio requirement is not
expected to be of significance to the Group.

20 S Y D B A N K / 2 0 1 7 A n n u a l R e p o r t
Performance in 2017
SIFISydbank has been designated as a SIFI in Denmark and in 2017
there is an additional buffer requirement of 0.6% as regards
Common Equity Tier 1 capital. The requirement will gradually
rise to 1% in 2019. The intention is to bring Danish SIFI capital
requirements on a par with the requirements in other compara-
ble European countries.
IFRS 9With IFRS 9, which came into force on 1 January 2018, a new
impairment model has been introduced according to which
impairment charges must be recognised for all loans and
advances and guarantees on the basis of expected losses.
Under the existing rules impairment charges are recognised
only when there is objective evidence of impairment.
Under IFRS 9 exposures are divided into 3 groups for calculat-
ing impairment and classified into different stages (1, 2 or 3),
depending on the risk of credit loss. The staging assessment
and the calculation of expected loss will to a large extent be
based on the Group’s existing rating models and credit manage-
ment.
Based on the Danish FSA’s national guidelines concerning
impairment charges in accordance with IFRS 9 impairment
charges are expected to increase by around DKK 200m at 1
January 2018.
In general the projected increase in the Group’s impairment
charges will reduce the Group’s shareholders’ equity and will
consequently have a corresponding negative impact on regula-
tory capital. To counter an unintended impact on regulatory
capital and hence banks’ possibilities of supporting lending, a
transitional arrangement has been adopted so that any adverse
impact from the new impairment model will be phased in over a
number of years. Sydbank has decided to apply the transitional
rules.
Bank Recovery and Resolution DirectiveThe directive, including the bail-in provisions, was implemented
in Danish law on 1 June 2015. According to legislation each
credit institution must meet a minimum requirement for eligible
liabilities (MREL). The Danish FSA has been authorised to set
the requirement for Sydbank.
Uncertainty continues to surround the deadline for compliance
with the minimum requirement. The final minimum requirement
may affect the Group’s capital and funding structure.
The general resolution principle for SIFIs is that it should be
possible to restructure them and send them back to the market
with adequate capitalisation to ensure market confidence. In
accordance with this principle the MREL for SIFIs is expected to
be set at 2 times the total capital requirement. It is expected
that the MREL will have to be met with convertible instruments
(“contractual bail-in”).
The Danish FSA will have discussions with the industry on
phase-in and the specific requirements regarding capital that
can be used to comply with the MREL. The discussions will take
into consideration international developments in the area.
During 2018 the Danish FSA is expected to set the MREL for
the Group effective as of 1 January 2019.
The establishment of a resolution fund began in 2015. Credit
institutions must make contributions to the fund according to
their relative size and risk in Denmark. The resolution fund must
be established and have assets at its disposal equal to at least
1% of the covered deposits of all Danish credit institutions by
31 December 2024.
The Group’s contribution to the resolution fund for 2017 repre-
sents DKK 18m.
Basel IVOn 7 December 2017 the Basel Committee on Banking
Supervision (BCBS) published its recommendations for a num-
ber of changes to the calculation of the capital requirements for
credit institutions. These recommendations are also known as
Basel IV. Among other things, Basel IV proposes to constrain
the use of internal models and introduce a permanent floor for
the risk exposure amount.
The recommendations are expected to have a limited impact on
the Group’s capital.
The recommendations must be implemented in the EU before
they will apply to Danish institutions. The Group is following
developments closely. At present the extent of the changes in
relation to the Basel Committee’s recommendations when
implemented into EU regulation is unknown. The effective date
is expected to be 1 January 2022 on which date the floor
requirement is also expected to be implemented, starting at
50% and gradually increasing until finally reaching 72.5% at 1
January 2027.

2 0 1 7 A n n u a l R e p o r t / S Y D B A N K 21
Outlook for 2018Limited growth is projected for the Danish economy in 2018.
Total income is expected to be on a par with the income
generated in 2017.
Costs (core earnings) are projected to rise slightly in 2018.
Impairment charges for 2018 are forecast to be at a low level.
The uncertainty surrounding price developments in the
agricultural sector may however affect impairment charges.
Non-recurring costs are expected to represent around DKK
75m.
In 2017 very satisfactory investment portfolio earnings and the reversal of impairment charges had a positive effect on profit for the year. However we cannot be sure that this will be the case also in 2018.As a result profit after tax of DKK 1,200-1,400m is projected for 2018.
The outlook is subject to uncertainty and depends among
other things on macroeconomic factors.

22 S Y D B A N K / 2 0 1 7 A n n u a l R e p o r t
Capital Management
The Group’s capital management ensures efficient deployment
of capital relative to the Group’s overall capital targets. The
Group’s risk profile is determined on the basis of the capital
targets which ensure first and foremost that there is adequate
capital to meet the Group’s growth expectations and cover
fluctuations in the risks assumed by the Group.
The Group applies internal ratings based approaches to manage
the credit risk of the Group’s corporate and retail client
portfolios. The Group applies the advanced IRB approach as
regards retail clients and the foundation IRB approach as
regards corporate clients to determine the Group’s capital
requirements.
The Group applies the Standardised Approach to credit risk in
relation to exposures to governments and credit institutions.
Further details, also concerning the risk exposure amount
(REA), capital information and capital ratios, are found in note 3.
The Group’s capital management focuses on 4 capital elements:
minimum capital, adequate total capital, capital requirements
including buffers and total capital.
Capital and solvency and capital requirements
% of REA31 Dec
2017Fully
loaded*Capital and solvency
Common Equity Tier 1 capital ratio 17.3 17.3
Capital ratio 20.8 20.8
Capital requirements (incl buffers)**Total capital requirement 12.9 14.5
CET1 capital requirement 8.0 9.7
- of which countercyclical capital buffer 0.0 0.0
- of which capital conservation buffer 1.3 2.5
- of which SIFI buffer 0.6 1.0
Excess capitalCommon Equity Tier 1 capital 9.3 7.6
Total capital 7.9 6.3
* Based on fully loaded CRR/CRD IV rules and requirements.** The total capital requirement consists of an individual solvency need
and a combined buffer requirement. The fully loaded countercyclical capital buffer is based on the national buffer rate as at 31 December 2017.
Minimum capital represents the necessary capital in compliance
with CRR and adequate total capital is the Group’s determination
of the capital sufficient to protect depositors against loss under
the prevailing economic conditions. The solvency need is
defined as adequate total capital in percentage terms of the risk
exposure amount.
The capital requirement including buffers is based on the
solvency need to which a combined buffer requirement is
added. The combined buffer requirement for the Group
constitutes 1.9% at 31 December 2017. When fully loaded the
combined buffer requirement will represent 3.5% bringing the
fully loaded CET1 capital ratio requirement to 9.7%.
In December 2017 the Systemic Risk Council recommended
that a countercyclical buffer rate of 0.5% be set in Denmark
effective 31 March 2019. If a countercyclical capital buffer is
implemented in Denmark the Group’s fully loaded CET1 capital
ratio requirement will go up by approx 0.4 percentage points.
The committees in the Group’s risk organisation report directly
to the Group Executive Management. The committees identify,
monitor and assess risks within the individual risk areas and
ensure that models and principles are formulated to calculate
risks. The committees ensure that the Bank’s business units
proactively carry out their operations and analyse identified
risks. The Group’s Chief Risk Officer is a member of all
committees, see Risk Management on page 100.
A risk assessment is carried out annually to determine the
Group’s risk profile. The Board of Directors considers the
assessment and determines the adequate total capital and the
individual solvency need in continuation of this assessment.
The adequate total capital is determined on the basis of the
Danish FSA approach (8+). A proposal for the determination of
the adequate total capital is prepared by Risk and is presented
to the Group Executive Management. The Board of Directors
discusses and determines the adequate total capital on the
basis of this proposal.
The proposal is based on the capital adequacy rules (Pillar I)
with add-ons for any risks deemed not to be sufficiently
covered under Pillar I. At year-end 2017 add-ons were allocated
in relation to credit risk, market risk and operational risk.
The models used to calculate the Pillar I capital requirement are
described in detail in note 3.

2 0 1 7 A n n u a l R e p o r t / S Y D B A N K 23
The adequate total capital/solvency need can be broken down
as follows:
Adequate total capital/solvency need
DKKm% of REA
Credit risk 4,547 7.7
Market risk 600 1.0
Operational risk 892 1.5
Other exposures 456 0.8
Adequate total capital/solvency need 6,495 11.0
Other exposures include property, plant and equipment and the
Group’s equity investments.
Total capital is the actual capital that the Group has at its
disposal.
Based on the adequate total capital the Group’s capital
structure can be specified as follows at 31 December 2017:
Capital structure
DKKm% of REA
Adequate total capital/solvency need 6,495 11.0
Combined buffer requirement 1,089 1.9
Capital requirement inclcombined buffer requirement 7,584 12.9
Excess capital 4,656 7.9
Total capital 12,240 20.8
Stress testing is another important element when determining
the adequate total capital.
The object of stress testing is to assess the impact of adverse
events on capital needed and income. Stress test calculations
show the impact for the coming years in given economic
scenarios.
At 31 December 2017 the Group has based its stress test
calculations on the following macroeconomic scenarios:
Base case scenario which reflects the Group’s forecast of
developments in the economy.
Mild recession which reflects deteriorated economic conditions
compared with the base case scenario. Annualised GDP is
expected to develop positively in 2018 and 2019.
Unemployment will remain at its current level in 2018 and 2019.
Global crisis which reflects that the Danish economy will be hit
by 2 blows: a domestic blow where confidence among Danish
consumers and businesses will weaken significantly and a
foreign blow where the international economy will be hit by a
new cyclical downturn. This scenario resembles a very deep
recession and in terms of GDP it is on a par with the recession
during the period 2008-2009. Unemployment will increase
substantially. GDP developments will be negative in 2018 and
2019 and house prices will drop sharply during the same
period.
Lending freeze which reflects a scenario resembling the global
crisis scenario. However Danish households and consumers will
be more reluctant to borrow money. This can be construed as a
more severe domestic blow to the Danish economy. The
recession will be slightly deeper than in the global crisis scenario.
Deflation which reflects that inflation will continue to decrease
in Denmark and the euro area leading to deflation where the
overall level of prices will drop. Compared with the global crisis
scenario, Denmark will see more significant declines in prices
and lending.
Interest rate increase which reflects a steep rise in oil prices. In
the light of sharply rising inflation the central banks in USA and
the euro area will hike interest rates considerably. Danish
economic growth will come to a standstill, unemployment will
rise slightly and property prices and lending will decline.
Debt crisis which could reflect Greece abandoning the euro,
prompting renewed uncertainty as regards other debt-ridden
euro area countries. Another scenario could be the bank crisis
or the political instability in Italy having a severe adverse impact
on the Italian economy. Both scenarios involve a setback for
Europe’s economy and investors fleeing from debt-ridden
countries. Danish economic growth will be slightly negative and
unemployment will be higher than in the mild recession
scenario. At the same time Denmark, via its status as a safe
haven, will attract foreign capital, which will push interest rates
lower than in the base case scenario.
The scenarios and their relevance are subject to ongoing
assessment and the scenarios are approved by management as
the basis for further stress test calculations. The impacts of the
scenarios are included in the assessment of the adequate total
capital. The stress tests conducted show that the Group is
adequately capitalised.
Throughout 2017 the Group has fully complied with external as
well as internal capital requirements.
24 S Y D B A N K / 2 0 1 7 A n n u a l R e p o r t
To support its strategic goals the Group ensures that stakehold-
ers receive accurate and complete information. This is done by
targeting investor communication according to best practice
and by maintaining a high degree of professionalism.
The Group strengthens and expands relations with investors
and analysts by conducting roadshows when its financial state-
ments are published.
In addition management interacts with analysts, shareholders
and potential investors at a number of seminars and conferenc-
es where current issues concerning Sydbank are presented and
discussed.
In 2017 Sydbank held approximately 150 meetings with inves-
tors in Western Europe and USA.
The Sydbank share The Sydbank share is listed on Nasdaq Copenhagen and forms
part of the OMX Copenhagen Large Cap index.
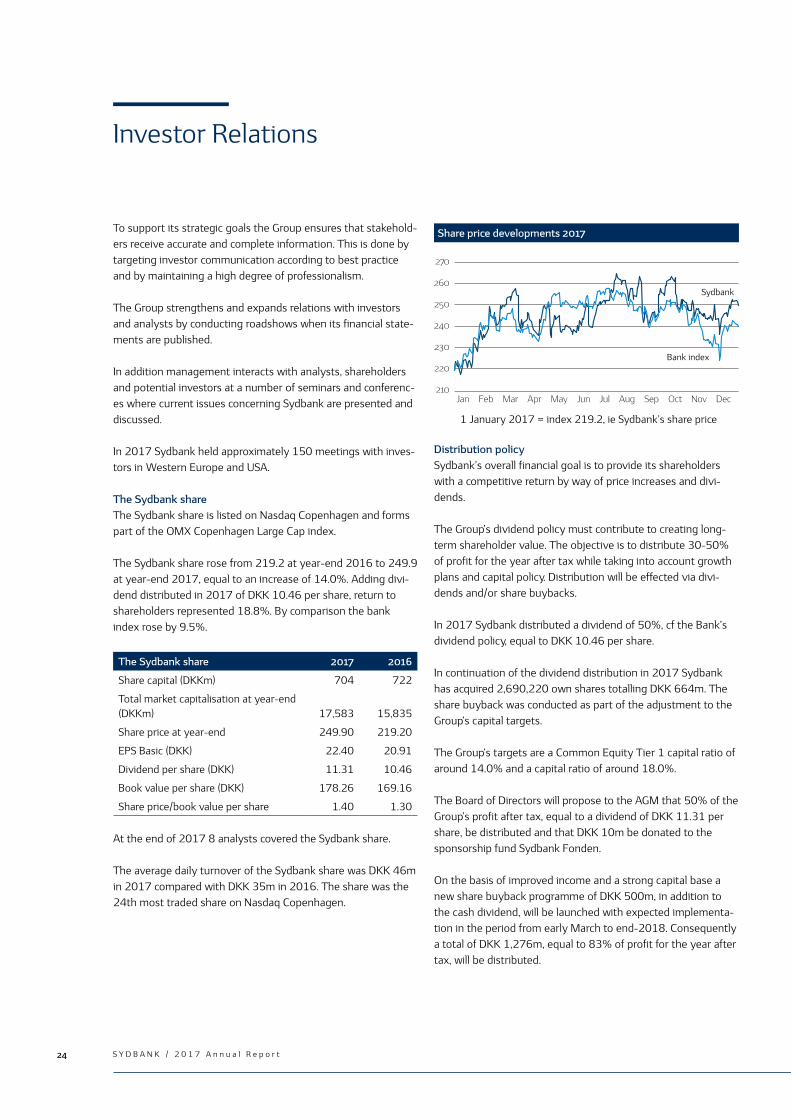
The Sydbank share rose from 219.2 at year-end 2016 to 249.9
at year-end 2017, equal to an increase of 14.0%. Adding divi-
dend distributed in 2017 of DKK 10.46 per share, return to
shareholders represented 18.8%. By comparison the bank
index rose by 9.5%.
The Sydbank share 2017 2016
Share capital (DKKm) 704 722
Total market capitalisation at year-end (DKKm) 17,583 15,835
Share price at year-end 249.90 219.20
EPS Basic (DKK) 22.40 20.91
Dividend per share (DKK) 11.31 10.46
Book value per share (DKK) 178.26 169.16
Share price/book value per share 1.40 1.30
At the end of 2017 8 analysts covered the Sydbank share.
The average daily turnover of the Sydbank share was DKK 46m
in 2017 compared with DKK 35m in 2016. The share was the
24th most traded share on Nasdaq Copenhagen.
Share price developments 2017
Distribution policySydbank’s overall financial goal is to provide its shareholders
with a competitive return by way of price increases and divi-
dends.
The Group’s dividend policy must contribute to creating long-
term shareholder value. The objective is to distribute 30-50%
of profit for the year after tax while taking into account growth
plans and capital policy. Distribution will be effected via divi-
dends and/or share buybacks.
In 2017 Sydbank distributed a dividend of 50%, cf the Bank’s
dividend policy, equal to DKK 10.46 per share.
In continuation of the dividend distribution in 2017 Sydbank
has acquired 2,690,220 own shares totalling DKK 664m. The
share buyback was conducted as part of the adjustment to the
Group’s capital targets.
The Group’s targets are a Common Equity Tier 1 capital ratio of
around 14.0% and a capital ratio of around 18.0%.
The Board of Directors will propose to the AGM that 50% of the
Group’s profit after tax, equal to a dividend of DKK 11.31 per
share, be distributed and that DKK 10m be donated to the
sponsorship fund Sydbank Fonden.
On the basis of improved income and a strong capital base a
new share buyback programme of DKK 500m, in addition to
the cash dividend, will be launched with expected implementa-
tion in the period from early March to end-2018. Consequently
a total of DKK 1,276m, equal to 83% of profit for the year after
tax, will be distributed.
Investor Relations
270
260
250
240
230
220
210
1 January 2017 = index 219.2, ie Sydbank’s share price
Sydbank
Bank index
Jan Feb Mar Apr May Jun Jul Aug Sep Oct Nov Dec

252 0 1 7 A n n u a l R e p o r t / S Y D B A N K
AarhusRegion
14%
HerningRegion
9%Vejle
Region
13%
KoldingRegion
8% OdenseRegion
9%
NæstvedRegion
8%
CopenhagenRegion
14%
AabenraaRegion
14%
EsbjergRegion
11%
Geographical distribution of Sydbank’s business volume in Denmark
Mission Statement and Business Goals
Sydbank has a solid financial foundation that offers room for
more business with new customers as well as existing custom-
ers. Our growth will be built on a firm and sound footing.
Sydbank wishes to remain a bank operating on its own terms
and we aim to be the preferred business partner. We focus on
our own products but use business partners for a wide variety
of financial services, for instance mortgage credit, pension and
insurance.
As an advisory and service undertaking Sydbank’s primary
objective is to meet the financial requirements of its customers.
Sydbank achieves this objective by striving to be among the
absolute top performers in Denmark in terms of operating a
bank and providing advisory services to customers based on
their unique situation. As a nationwide bank Sydbank is present
in all parts of Denmark.
Sydbank’s business volume is evenly distributed across 9
Danish regions which form the basis of the direct advisory ser-
vices to the Bank’s customers. The total business volume con-
sists of loans and advances, deposits, guarantees and custody
accounts. Depending on customer segment and type of busi-
ness Sydbank has a market share of between 6 and 13%. The
Bank’s largest market share is within the SME segment.
Moreover Sydbank has 3 branches in Northern Germany and
together they constitute the Bank’s 10th region.
2 0 1 7 A n n u a l R e p o r t / S Y D B A N K
Sydbank’s business model
• Sydbank is a bank operating on its own terms.
• Sydbank is a competent and value-creating advisory
bank.
• Sydbank is a relationship bank and professional
relationships are the reason why we can create,
maintain and build on long-term customer relationships.
• We strive for simplicity in our work.
• Sydbank wants to be known for its belief that excellent
and committed employees are its most important asset.

26 S Y D B A N K / 2 0 1 7 A n n u a l R e p o r t
Values and attitudesSydbank’s interaction with its customers and other stakeholders
is based on a number of values and business principles and is
expressed in the statement: “Excellence and relationships create
value”. In addition the Bank’s stakeholder policy serves as a
guideline for its efforts in this respect.
Sydbank is convinced that the combination of excellent employ-
ees and good relationships creates value for customers – and the
Bank. Moreover Sydbank believes that strong relationships with
all stakeholders is an important business advantage. At Sydbank
we have a simple organisation to ensure high accessibility and
easy access to decisions so we can act quickly on behalf of our
customers and on our own behalf. Sydbank makes 3 promises –
to its customers, to its employees and to its shareholders.
Banking – pure and simple Sydbank’s mission is to be a bank that is close to its customers.
We are an advisory bank and find solutions where they are –
quickly and efficiently. Sydbank builds on relationships between
people. And we focus on what is important – banking and
sound business. Banking – pure and simple.
Sydbank is a bank for most people but not the same bank for
everyone. We serve our customers on the basis of their require-
ments and offer digital self-service solutions that enable cus-
tomers to carry out everyday banking transactions in an easy
and flexible manner. Sydbank provides the services in demand
by customers and sees technology as a way to bring us even
closer to customers.
Sydbank has a large number of online and digital solutions. In
NetBank and MobilBank customers can carry out their everyday
banking transactions whether they are corporate clients, Private
Banking clients or retail clients. For instance Sydbank offers
MobilBank Corporate and Online Banking, both of which are
fully integrated with the customer’s ERP systems. Sydbank is
also part of the MobilePay cooperation and part of the Bolighed
property portal.
Moreover customers can get in touch with Sydbank via the
branches in the Bank’s 9 Danish regions, its branches in
Germany and its specialist functions at the head office in
Aabenraa. Providing full service to all customers, the Danish
regions are organised in Corporate, Private Banking and Retail
sections and service the Bank’s branches.
Sydbank Direct is the Bank’s online advisory and service offer-
ing using a number of different channels. This enables custom-
ers to contact the Bank when and how it suits them best. In
addition Sydbank Direct has a special advisory department for
young customers aged between 18 and 29.
Sydbank Direct staff have a background in banking. The depart-
ment is open all weekdays between 8am and 8pm and is only
closed on public holidays, 24 and 31 December.
Customers As a large nationwide bank Sydbank has customers in all cate-
gories. Guided by Sydbank’s service philosophy “What can we
do for you”, the Bank wishes to increase the following customer
segments:
• Sound and well-run SMEs
• Retail clients with healthy finances
• Young customers undergoing education and training and
with a foreseeable potential
• Wealthy retail clients.
The Bank aims to have a diversified customer portfolio with only
few large exposures and diversification across industries corre-
sponding as far as possible to the Danish corporate structure.
CorporateSydbank aims to be the preferred business partner for SMEs
and prioritises building and maintaining value-creating relation-
ships with all corporate clients.
Consequently the Bank’s corporate clients receive advisory ser-
vices from a personal adviser who knows the individual enter-
prise and its situation. When needed the personal adviser
draws upon the expertise of the Bank’s many specialists in the
development of and the collaboration with the enterprise.
Sydbank is a full-scale corporate bank offering all financing solu-
tions tailored to the requirements of the individual enterprise.
Our corporate clients have access to efficient international com-
mercial banking services. Sydbank offers payment services and
Mission Statement and Business Goals
Sydbank’s stakeholder policy
• Sydbank will act as an open and credible
organisation proactively seeking dialogue with its
stakeholders and the surrounding community.
• Sydbank will treat its stakeholders responsibly,
properly and respectfully.
• Sydbank will base its decisions on dialogue with
significant stakeholders.
• Sydbank will communicate based on facts, in due
time, comprehensibly and precisely with relevant
stakeholders.

272 0 1 7 A n n u a l R e p o r t / S Y D B A N K
cash management solutions virtually worldwide. This is effected
through the Bank’s branches in Germany and the Connector banks.
As a rule corporate clients are served by one of the Bank’s
regional head offices or by special corporate branches. Sydbank
wishes primarily to have SMEs with growth potential as cus-
tomers. The enterprises must have a sound financial footing and
use the main part of the Bank’s palette of products and services.
Corporate clients are divided into 5 segments and are served by
the following entities:
• Corporate by Corporate Banking & Finance
• Corporate Large by the corporate centres
• Corporate Medium by the corporate departments
• Corporate Local by retail branches with corporate local
departments
• Agricultural clients by the agricultural centres.
Private BankingPrivate Banking at Sydbank strives to provide qualified advisory
services at all times. As a result the Bank focuses on long-term
relationships with each customer.
Within Private Banking Sydbank has a physical Private Banking
centre in each of the Bank’s 9 regions as well as 1 in Northern
Germany. Advisory services are provided by dedicated Private
Bankers who are are assisted by a team of experts tailored to
the specific requirements of the individual customer. The team
at the customer’s disposal provides advisory services on eg
investments, wealth management and current financial issues.
In addition special experts from the Bank’s central functions are
called upon as required.
Sydbank’s Private Banking concept is offered to wealthy retail
clients with investable assets or a household income above a
specified level. As an add-on to the Private Banking concept,
Sydbank offers its wealthiest customers Sydbank’s Private
Banking Elite.
The Private Banking concept consists of advisory services as
well as a range of benefits, thereby providing customers with
attractive terms regarding eg payment cards, insurance, invest-
ment products and related services as well as fees and charges.
For many years Sydbank has targeted the investment area and
the Bank has primarily focused on providing personal and indi-
vidual advisory services to its customers. The extent of invest-
ment advisory services depends in general on a customer’s
investment preferences.
RetailOur loyalty programme Sydbank Favorit is offered to retail cli-
ents. The flexible programme lets customers choose the bene-
fits that best suit them from a total of 10 benefits. In addition to
Sydbank Favorit’s optional benefits we offer our customers a
number of fixed benefits, eg a discount on general insurance
and a loyalty discount that is a special reward for the customer’s
years as a customer with Sydbank.
Sydbank cooperates with a number of sub-suppliers to ensure
our customers receive competitive quality products. The prima-
ry mortgage credit partners are Totalkredit, Nykredit and DLR
Kredit and Sydbank’s life insurance partners are Letpension and
PFA. Sydbank’s non-life insurance partner is Topdanmark.
Sydbank Favorit customers with a large business volume have a
personal adviser in their branch who acts as the customer’s
account manager. Sydbank Favorit customers with a limited
business volume are mainly served by Sydbank Direct.
The objective is that Sydbank’s advisers always provide compe-
tent advice to customers on the basis of the Bank’s knowledge
of a customer’s preferences and profile. This is ensured by:
• regularly updating advisers’ professional qualifications
• analysing customers using customer data from the Bank’s
Data Warehouse as well as customers’ choice of Sydbank
Favorit benefits.
Asset management Sydbank offers advice and asset management to for instance
investment funds, pooled pension plans, foundations and insti-
tutional clients. In addition the Bank offers asset management
to wealthy customers through individual portfolio management
agreements where the customer is assigned 2 managers
responsible for the customer’s portfolio.
Corporate Retail
PrivateBanking

28 S Y D B A N K / 2 0 1 7 A n n u a l R e p o r t
Moreover the Bank offers investment management products to
its different customer segments. The Bank cooperates with a
number of sub-suppliers in the investment fund area, eg
Sydinvest, BankInvest, Valueinvest, Sparinvest and Maj Invest.
Asset Management is also responsible for the Bank’s macro,
equity and fixed income research activities.
Asset management
DKKbn 2017 2016
Pooled pension plans 17 14
PengePlan® 7 10
PM mandates 13 11
Management agreements 4 4
Investment funds and hedge funds 56 50
Total 97 89
Custody account volume
DKKbn 2017 2016
Retail and corporate clients 113 102
Pooled pension plans 16 14
Financial institutions 6 4
Investment funds and hedge funds 54 48
Total 189 168
Custody account volume distribution – retail and corporate clients
DKKbn 2017 2016
Danish bonds 11 10
Foreign bonds 3 4
Danish shares 39 33
Foreign shares 8 7
Investment funds and hedge funds 52 48
Total 113 102
During 2017 assets under management rose to DKK 97bn at
year-end 2017 compared with DKK 89bn at the beginning of
the year. The growth is attributable to a combination of signifi-
cant new sales and increases in value in financial markets as a
consequence of generally rising share and bond prices.
The ban on receiving commission on investment products
imposed by the MiFID II rules came into effect on 1 July 2017
with the main purpose of creating added price transparency in
the investment product market. At Sydbank this first and fore-
most affected the investment product PengePlan®, for which
we have implemented a number of price changes as a result of
the amended legislation. The new fee to replace eg the commis-
sion payment is however subject to VAT and consequently
PengePlan® has generally become slightly more expensive for
customers. As a result the overall demand among customers
has fallen, which has prompted a decrease in assets under man-
agement in PengePlan® of DKK 3bn, part of which has been
reallocated to pooled pension plans.
In addition to invested savings the increases in value in financial
markets also affect the total custody account volume of the
Bank’s retail and corporate clients which increased from DKK
168bn at the beginning of 2017 to DKK 189bn at the end of
2017. This relatively sharp rise is especially reflected in the sig-
nificant portfolio of Danish shares held by many customers in
their custody accounts so Danish shares rose about twice as
much as global shares in 2017, ie 17% compared with 9%.
Sydbank MarketsSydbank Markets offers advice and quotes prices as regards
bonds, shares and foreign exchange as well as undertakes mar-
ket-making obligations. Sydbank Markets services institutional
clients, central banks, asset managers, foreign clients, major cli-
ents, banks as well as Sydbank’s investment centres and
departments.
Moreover Sydbank Markets is a primary dealer in Danish gov-
ernment bonds and mortgage bonds and the Bank’s primary
mortgage credit partners are Nykredit, DLR Kredit, Realkredit
Danmark and Nordea Kredit.
Human Resources and staffSydbank believes that excellent and committed employees are
its most important asset. Excellent and dedicated employees
are key to ensuring the Bank’s continued success and value cre-
ation for Sydbank’s customers as well as the Bank itself.
By means of training and recruitment the Bank aims to have
highly skilled and competent employees who are committed to
building relationships. Sydbank wants to be a workplace offering
excellent career opportunities and personal development oppor-
tunities. Sydbank wants the Bank to be an attractive and socially
responsible workplace with a healthy work environment.
The Bank’s employees are motivated to improve their skill set
on an ongoing basis and Sydbank offers in-house and external
education and training activities. The Bank has an introduction
programme for new employees.
Mission Statement and Business Goals

292 0 1 7 A n n u a l R e p o r t / S Y D B A N K
In connection with recruitment Human Resources tests qualified
applicants to ensure that vacancies are filled by the most eligi-
ble candidates. Every 2 years Human Resources conducts an
comprehensive employee satisfaction survey in cooperation
with an external supplier. Smaller surveys to gauge the temper-
ature among employees are carried out every 6 months, also in
cooperation with an external supplier.
Customer policyAs stated in Sydbank’s customer policy each customer should
experience being or becoming a customer of Sydbank as some-
thing special irrespective of whether the customer is a retail cli-
ent, a Private Banking client or a corporate client.
Sydbank wants to be seen as a flexible bank putting itself in the
customer’s place. In its customer contact Sydbank wishes to be
known as a bank that is close to its customers and through this
closeness build long-term relationships and provide advisory
services that create value for the customer and the Bank.
Sydbank seeks to ensure high accessibility and gives customers
the possibility of contacting the Bank whenever and however it
is convenient for them.
ITIT is an essential part of the Bank’s business model. Sydbank
adapts its products and services on an ongoing basis to an
increasingly digitized everyday life. The Bank’s business is thus
dynamically adapting to customers’ demand for self-service and
advisory services outside the traditional branch.
Sydbank has outsourced a considerable part of its IT operations
and development to JN Data/Bankdata, which performs these
activities on behalf of Sydbank.
Bankdata and Sydbank’s own specialists work together to
develop new IT systems. Focus is on the digitization of process-
es, creating a better online customer experience and new capital
market systems. Development activities are divided into 3 areas:
• IT systems and applications
• Process management
• Data Warehouse.
In all 3 areas Bankdata as well as Sydbank have a role in terms
of development activities.
Sydbank sees technology as a means to bring the Bank closer
to the customer and to reduce complexity thus creating a sim-
ple and seamless customer experience.
IT security and safety at branchesIT security is a high priority as virtually all the Bank’s business
transactions involve the use of IT. Sydbank works to ensure
that security goes hand in hand with user-friendliness as
regards the Bank’s IT-based platforms.
IT breakdowns and cybercrime pose considerable risks to bank-
ing operations, especially in light of increasing digitization.
These risks are minimised via Sydbank’s policy in this area,
which includes a description of the contingency plans in place
according to the type of event and how it is tackled depending
on the cause.
Sydbank also gives high priority to safety in its branches. The
fact that a growing number of branches are cashierless and/or
cashless in response to the change in customer needs increases
safety. Furthermore all branches with cashier services are
equipped with time locks and other robbery-prevention meas-
ures.
National Banks in DenmarkSydbank is a member of the industry association National
Banks in Denmark together with Arbejdernes Landsbank,
Nykredit Bank and Spar Nord Bank. The main object of the
association is to strengthen members’ position in relation to
sector policy.
Customers can contact Sydbank through many channels.We meet you where you are.
Customer dialogue - channels
Social mediaEmail
TelephoneBranch

30 S Y D B A N K / 2 0 1 7 A n n u a l R e p o r t
Sydbank’s management backs and actively addresses corporate
governance.
Sydbank’s Board of Directors and Group Executive Management
consider corporate governance to be a basic prerequisite for
meeting the Bank’s financial and non-financial targets and
maintaining a good dialogue and a good relationship with inter-
nal and external stakeholders alike.
The Bank complies with the recommendations of the
Committee on Corporate Governance. As a SIFI Sydbank pub-
lishes the statutory corporate governance report on the Bank’s
website. The overall position of the Board of Directors as
regards the recommendations appears from Sydbank’s
Corporate Governance Principles. Read more at sydbank.com.
Sydbank’s Board of Directors has also considered the
management code of conduct of the Danish Bankers
Association and follows all 12 recommendations. The overall
position of the Bank as regards the management code of
conduct of the Danish Bankers Association is available at
sydbank.com.
The management of Sydbank is carried out by:
• the general meeting
• the Shareholders’ Committee
• the Board of Directors
• the Group Executive Management.
ShareholdersA positive and ongoing dialogue with shareholders is important
for Sydbank so that private and professional investors gain an
insight into the Bank’s strategy, business model and results.
To promote the dialogue with the Bank’s private shareholders,
shareholders’ meetings are held each year where more than
10,000 of the Bank’s private investors can gain insight into the
Bank’s operations and engage in dialogue with management.
Moreover Sydbank takes part in investor presentations, investor
conferences and roadshows where institutional investors can
engage in dialogue with management and gain an insight into
the Bank’s development.
All the Bank’s shareholders can get a fuller picture of Sydbank
via the Bank’s website, sydbank.com, where company announce-
ments, interim reports and annual reports are available.
General meetingShareholders’ voting rights are exercised at the general meet-
ing. Sydbank complies with the recommendations of the
Committee on Corporate Governance regarding organising the
Bank’s general meeting and appointing proxies. Sydbank’s
Articles of Association contain information on convening the
general meeting, the right to submit proposals as well as
attendance and voting rights. The Bank’s Articles of Association
are available at sydbank.com.
Resolutions to amend the Articles of Association and resolu-
tions to dissolve the Bank and/or to merge the Bank with other
companies will only be adopted if at least 2/3 of the voting
share capital is represented at the general meeting and the res-
olution is carried by at least 2/3 of the votes cast and of the
voting share capital represented at the general meeting.
If at least 2/3 of the voting share capital is not represented at
the general meeting but the resolution is carried by at least 2/3
of both the votes cast and the voting share capital represented
at the general meeting, the resolution can be adopted at a new
general meeting by the majority of votes cast as prescribed
above irrespective of the proportion of voting share capital rep-
resented.
Resolutions to amend the Articles of Association submitted by
the Shareholders’ Committee or the Board of Directors may be
finally adopted at a single general meeting by at least 2/3 of
both the votes cast and the share capital represented at the
general meeting.
Sydbank has a voting right limitation according to which no
shareholder may cast a vote of more than 20,000 shares on his
own behalf.
The Board of Directors may authorise a share capital increase of
up to DKK 72,240,199 in one or more issues. The authorisation
applies until 1 March 2021. Increases in share capital pursuant
to such authorisation may be effected without any pre-emption
rights for the Bank’s existing shareholders, if effected by an
unrestricted public subscription at market price or by conver-
sion of debt.
The general meeting has authorised the Board of Directors to
allow the Bank to acquire own holdings within a total nominal
value of 10% of the Bank’s share capital. At 31 December
2017 the Bank had acquired 4.9% of the Bank’s share capital
under the current authorisation, which will expire in 2022.
Shareholders’ CommitteeThe Bank’s Shareholders’ Committee is elected by the general
meeting. On the recommendation of the Board of Directors the
general meeting determines the total number of Shareholders’
Committee members and their distribution by region.
Organisation and Corporate Governance

312 0 1 7 A n n u a l R e p o r t / S Y D B A N K
The Shareholders’ Committee elects the members of the Board
of Directors and determines their remuneration.
The Shareholders’ Committee is obliged to work for the pros-
perity of the Bank as well as to represent the Bank to the best
of its ability and assist the Board of Directors and the Group
Executive Management.
Shareholders’ Committee members are elected for a term of 3
years. Members are eligible for re-election.
Board of DirectorsThe Board of Directors consists of between 6 and 10 members
elected by and from among the members of the Shareholders’
Committee. Shareholder-elected board members are elected for
a term of 3 years. Members are eligible for re-election. If the
number of shareholder-elected board members is reduced to
less than 6, the Shareholders’ Committee will add to the num-
ber as soon as possible in order to increase the number to at
least 6.
The Bank has no age limit applying to board members in the
Articles of Association. The maximum term of office for share-
holder-elected board members is 12 years.
The Board of Directors holds at least 11 ordinary meetings each
year. In addition an annual strategy seminar is held as well as 2
annual training days. The Board of Directors carries out an
annual self-evaluation where the work and results of the Board
of Directors and its individual members are assessed. The
competences required for the work of the Board of Directors are
determined in connection with the evaluation. In continuation
hereof the competences present are assessed with a view to
identifying any need for further competences. The evaluation is
carried out by the Bank’s Nomination Committee and every 3rd
year external assistance is received. In 2017 the self-evaluation
was conducted with external assistance. The conclusions of the
Nomination Committee’s discussions are presented to the
Board of Directors.
On the basis of Sydbank’s business model the conclusion of the
evaluation of the Board of Directors for 2017 is that the coop-
eration of the Board of Directors works in a satisfactory manner
and that the Board of Directors has the competences required
at the present time.
Other directorships held by the Board of Directors can be seen
on pp 118-123.
Board committeesSydbank’s Board of Directors has set up 4 committees that
supervise special areas or prepare matters for subsequent con-
sideration by the full Board of Directors.
• Audit Committee
• Risk Committee
• Remuneration Committee
• Nomination Committee.
The terms of reference of the committees are available at
sydbank.dk/organisation (in Danish only), which also contains
an introduction to the members and their qualifications.
Audit CommitteeThe Audit Committee reports to the Board of Directors and con-
venes as a minimum 4 times a year.
The Audit Committee reviews accounting, auditing and security
issues including issues which the Board of Directors, Internal
Audit, the Audit Committee or the independent auditors wish to
discuss.
The Audit Committee follows up on measures taken to rectify
weaknesses in internal controls reported by Internal Audit or
independent auditors and ensures that material errors and
omissions in the financial statements are corrected. Moreover
the Audit Committee monitors the Bank’s compliance with
orders issued by the Danish FSA.
The Audit Committee supervises the financial reporting process
including accounting policies and reviews significant accounting
estimates etc before the full-year and interim financial state-
ments are presented to the Board of Directors.
The Audit Committee convened 8 times in 2017.
The Board of Directors has appointed John Lesbo, State
Authorised Public Accountant, as the board member who pos-
sesses special qualifications. Until his appointment to the
Bank’s Board of Directors John Lesbo was a partner in KPMG
and Ernst & Young. During his many years as an accountant
John Lesbo has participated in national and international train-
ing programmes, which has placed him in a position to audit
and advise large companies with international activities. John
Lesbo was on the board of the auditing firm for many years and
is a former member of the Expert Opinion Committee of FSR
(Danish Auditors).

32 S Y D B A N K / 2 0 1 7 A n n u a l R e p o r t
The Audit Committee consists of John Lesbo (Chairman), State
Authorised Public Accountant; Torben Nielsen, former Central
Bank Governor; Jacob Chr. Nielsen, General Manager; and Lars
Mikkelgaard-Jensen, Managing Director.
Reference is made to
sydbank.dk/omsydbank/organisation/revisionsudvalg (in Danish
only).
Risk CommitteeThe Risk Committee reports to the Board of Directors and con-
venes as a minimum 4 times a year.
The Risk Committee must provide the Board of Directors with
an overview of the Group’s current risk scenario and prepare the
determination of the Group’s overall risk profile and risk strate-
gy including the risks associated with the Group’s business
model.
Moreover the Risk Committee must evaluate the Group’s inter-
nal procedure for risk identification and the correlation with risk
reporting and the calculation of the Group’s solvency need. The
Risk Committee is regularly informed of the models and meas-
urement methods that form the basis of the Group’s capital
management including trends in and expectations of regulatory
requirements.
The Risk Committee ensures that the policies and guidelines of
the Board of Directors as regards risk are implemented and
function effectively in the Group.
The Group’s Chief Risk Officer must assist the committee with
information and attend its meetings with a view to discussing
the Group’s risk management.
The Risk Committee convened 4 times in 2017.
The committee consists of Torben Nielsen (Chairman), former
Central Bank Governor; Peder Damgaard, General Manager and
former Principal; and Jarl Oxlund, Chairman of Sydbank Kreds.
Reference is made to
sydbank.dk/omsydbank/organisation/risikoudvalg (in Danish
only).
Remuneration CommitteeThe Remuneration Committee reports to the Board of Directors
and convenes as a minimum once a year.
The Remuneration Committee formulates the Bank’s remunera-
tion policy and decides which of the Bank’s functions are cov-
ered by the concept of “material risk takers”. Following approval
by the Board of Directors the remuneration policy is submitted
to the general meeting which will make the final decision. The
Remuneration Committee ensures that the remuneration policy
in force is complied with.
As a result of an amendment to the Danish Financial Business
Act in 2016 the requirements as regards the Remuneration
Committee were extended. Accordingly the Remuneration
Committee must review information about remuneration issues
presented to the general meeting, perform assessments and
controls of the Bank’s remuneration processes and ensure that
the use of variable remuneration complies with the rules of the
remuneration policy and legislation.
The Remuneration Committee also prepares a recommendation
to the Board of Directors concerning the remuneration of the
members of the Shareholders’ Committee.
The Remuneration Committee convened twice in 2017.
The committee consists of Peder Damgaard (Chairman), General
Manager and former Principal; Torben Nielsen, former Central
Bank Governor; Janne Moltke-Leth, General Manager; and Alex
Slot Hansen, Executive Vice President, Private Banking.
Reference is made to
sydbank.dk/omsydbank/organisation/loenudvalg (in Danish
only).
Nomination CommitteeThe Nomination Committee reports to the Board of Directors
and convenes as a minimum 4 times a year.
The Nomination Committee is tasked with evaluating manage-
ment and must also identify and describe the competences
required in the Bank’s Board of Directors and assess whether
they are present.
Moreover the committee must propose new potential candidates
for the Advisory Boards and the Shareholders’ Committee so that
new members to the Board of Directors may be recruited from
the Shareholders’ Committee to the widest extent possible.
The Nomination Committee convened 5 times in 2017.
The committee consists of Torben Nielsen (Chairman), former
Central Bank Governor; Peder Damgaard, General Manager and
former Principal; Jacob Chr. Nielsen, General Manager; and
Frank Møller Nielsen, Attorney.
Organisation and Corporate Governance

332 0 1 7 A n n u a l R e p o r t / S Y D B A N K
Reference is made to
sydbank.dk/omsydbank/organisation/nomineringsudvalg (in
Danish only).
Policy and targets for the under-represented genderSydbank complies with the recommendation of the Committee
on Corporate Governance that once a year the Board of
Directors discusses activities to ensure diversity.
The aim of the Board of Directors is that women will represent
at least 25% of the shareholder-elected board members in
2019. Following the general meeting in 2017 Sydbank’s Board
of Directors consisted of 8 shareholder-elected board members
including 1 female board member. During the year 1 male board
member resigned from the Bank’s Board of Directors. The
Nomination Committee and the Board of Directors will seek to
ensure that new women board members can be recruited to
meet the defined target.
Reference is made to Sydbank’s CSR Report for 2017 (pp 5 and
28), which is published together with the annual report on
Sydbank’s website, sydbank.com.
Group Executive ManagementSydbank’s Group Executive Management consists of 3 mem-
bers. The Group Executive Management is appointed by the
Board of Directors and consists of Karen Frøsig, CEO, Jan Svarre,
Deputy Group Chief Executive, and Bjarne Larsen, Deputy
Group Chief Executive.
The Group Executive Management constitutes the top day-to-
day management of the Bank in accordance with the guidelines
and instructions issued to the Group Executive Management by
the Board of Directors. The distribution of duties between the
Board of Directors and the Group Executive Management is laid
down in the rules of procedure of the Board of Directors.
The Group Executive Management attends the meetings of the
Shareholders’ Committee and the Board of Directors without
any voting rights.
Further information is available at
sydbank.dk/omsydbank/organisation (in Danish only).
Management’s remunerationThe Bank’s remuneration policy is determined by the Bank’s
Board of Directors and describes Sydbank’s positions on remu-
neration and the use of variable remuneration components. The
Board of Directors is responsible for making any necessary
adjustments of the remuneration policy and for submitting the
revised remuneration policy to the general meeting for adoption.
The remuneration policy must support the Bank’s aim of being
a good place to work and being able to attract and retain com-
petent employees. Furthermore the policy must create value for
the Bank’s shareholders.
The remuneration policy must be consistent with and promote
sound and effective risk management which does not encour-
age excessive risk taking as well as comply with the corporate
governance rules on remuneration policies in listed companies.
Members of the Board of Directors receive a fixed fee. Board
members are not covered by any type of bonus scheme.
The remuneration of the Group Executive Management is
reviewed once a year. The remuneration is determined on the
basis of a wish to attract and retain the right profiles in the
Group Executive Management so that the Bank’s Group
Executive Management has the right composition at all times.
In connection with the annual review of the remuneration of the
Group Executive Management an assessment of the market
level is made. In addition the remuneration of the Group
Executive Management is adjusted according to the adjustment
in the collective agreement concluded by the Danish Employers’
Association for the Financial Sector (FA) and the Financial
Services Union Denmark (Finansforbundet). No bonus schemes
have been agreed as regards the Group Executive
Management.
Within the limits of the remuneration policy the Board of
Directors fixes the total remuneration of the Group Executive
Management, including any severance terms.
The remuneration policy applies to the Sydbank Group.
The remuneration of the Board of Directors and the Group
Executive Management appears from the notes to the annual
report.
Further information is available at
sydbank.dk/omsydbank/undersider/loenpolitik (in Danish only).
34 S Y D B A N K / 2 0 1 7 A n n u a l R e p o r t
Significant internal controls and risk management systemsSydbank’s risk management and internal controls relating to
financial reporting are designed for the purpose of preparing:
• management accounts which make it possible to measure
and follow up on the Group’s performance
• financial statements which give a true and fair view without
material misstatement and which are in accordance with
International Financial Reporting Standards (IFRS) as
adopted by the EU and additional Danish disclosure
requirements for annual reports of listed financial companies.
The Group Executive Management is responsible for maintain-
ing effective internal controls and a risk management system in
connection with financial reporting. The Group Executive
Management has designed and implemented controls consid-
ered necessary and effective to counter the identified risks
relating to financial reporting. The Group’s internal controls and
risk management systems are updated on an ongoing basis and
are designed with a view to identifying and eliminating errors
and omissions in the financial statements.
Risk assessmentThe Board of Directors and the Group Executive Management
regularly assess the risks relating to the Group, including those
affecting financial reporting. A description of the most signifi-
cant identified risks is given in the annual report under
“Accounting estimates and judgements” (note 2).
Procedures have been put into place to ensure that Sydbank at
all times complies with relevant legislation and other regula-
tions in connection with financial reporting. The Audit
Committee is regularly informed of significant changes in legis-
lation.
MonitoringAnalyses and control activities are conducted in connection with
the preparation of the annual report to ensure that financial
reporting is in compliance with IFRS as described under
“Accounting policies” (note 1).
Risk organisationSydbank has a formal risk organisation comprising a number of
risk committees and a Chief Risk Officer reporting directly to the
Bank’s Group Executive Management. The Chief Risk Officer is
responsible for prudent risk management within the Group and
compliance with the requirements of the Danish executive order
on management and control of banks etc. The risk committees
are headed by a member of the Bank’s Group Executive
Management and the Chief Risk Officer is a permanent member.
The risk committees identify, monitor and assess risks within
the individual risk areas and ensure that models and principles
are formulated to calculate risk. The committees ensure that the
Bank’s business units address identified risks.
ComplianceCompliance is an independent department reporting directly to
the Bank’s Group Executive Management. The department also
comprises the functions Anti-Money Laundering and Data
Protection Officer, which are described in further detail in the
following.
The department supervises and assesses whether the Bank’s
business units comply with legislation and internal rules. The
objective is to minimise the Bank’s compliance risks, for exam-
ple the risk of financial losses, the loss of good standing or
administrative sanctions as a result of non-compliance with
rules.
The work is organised so that all the Bank’s activities are
assessed using a risk-based approach. For each control and
assessment carried out by Compliance the conclusion is report-
ed to the relevant business unit managers who are responsible
for correcting any errors or omissions identified, including
adjusting inadequate systems and procedures. Compliance fol-
lows up on the implementation of appropriate measures.
Moreover the department follows up on the controls and
assessments carried out. The time horizon for this work
depends on the risk identified.
In addition Compliance is responsible for the assessment of new
products and services in terms of risk. This assessment is made
in cooperation with the relevant business units in the Bank as
well as the Bank’s risk function. The assessment is taken into
account by the Group Executive Management in its delibera-
tions on how to launch new products.
The Bank has established a Compliance Committee. The chair-
man is the Bank’s AML Executive (member of the Group
Executive Management). The committee also consists of the
relevant group executive vice presidents or their representa-
tives. The committee meets at least once every quarter to dis-
cuss current compliance risks.
Compliance submits quarterly reports of its most significant
activities to Sydbank’s Group Executive Management and the
Board of Directors.
Organisation and Corporate Governance
352 0 1 7 A n n u a l R e p o r t / S Y D B A N K
Anti-money launderingCompliance with anti-money laundering legislation is an impor-
tant factor in terms of successfully managing the task of pre-
venting money laundering and terrorist financing. To strength-
en these efforts and respond to tougher regulation in this area,
Sydbank appointed an AML Executive (member of the Group
Executive Management) and established an AML function with-
in Compliance in 2017. In cooperation with the AML function,
the AML Executive must ensure that Sydbank complies with all
legislation and rules to prevent money laundering and terrorist
financing. The AML function works closely with the relevant
customer-facing areas within the Bank and contributes to
ensuring that all relevant employees receive training in
anti-money laundering rules.
The new Danish Anti-Money Laundering Act took effect in
2017, in which great emphasis is placed on the financial sector
having a risk-based approach to combat money laundering and
terrorist financing. As part of this risk-based approach Sydbank
conducted an analysis of the Bank’s risk of being used for
money laundering or terrorist financing. On the basis of this
analysis the Board of Directors has adopted an anti-money
laundering policy that sets out the overall framework for proce-
dures, routines, job descriptions and controls to minimise the
Bank’s risk of being used for money laundering or terrorist
financing.
The Bank has established an AML Committee. The chairman is
the Bank’s AML Executive (member of the Group Executive
Management). The committee also consists of the relevant
group executive vice presidents or their representatives. The
committee meets at least once every quarter to discuss current
risks in this area.
In its efforts to prevent the Bank from being used for money
laundering or terrorist financing, Sydbank takes appropriate
steps to monitor transactions and files the necessary reports
with the relevant authorities.
Data Protection OfficerThe new General Data Protection Regulation will take effect in
May 2018. The General Data Protection Regulation replaces
data protection legislation in force and imposes stricter require-
ments regarding the manner in which businesses store and pro-
cess personal data.
One of the requirements is that some businesses which store
and process personal data of a certain extent must have a Data
Protection Officer (DPO). In line with Compliance, the tasks of
the DPO are to monitor and assess whether the Bank complies
with the the rules regarding personal data. The DPO must also
report to the Bank’s management.
The work is currently in a project phase where efforts seek to
prepare the Bank for compliance with the requirements of the
General Data Protection Regulation. The DPO will not
effectively assume his position until 25 May 2018. Until then
the DPO acts as an adviser during the project phase and is also
preparing his future role and his future tasks.
Internal AuditTo gain an objective and independent assessment of the ade-
quacy, effectiveness and quality of the Group’s internal controls,
Sydbank has established an internal audit function reporting to
the Bank’s Board of Directors.
Internal Audit performs audits focusing, among other factors,
on the most significant areas of the Bank’s compliance and risk
management. In addition Internal Audit oversees that:
• the Group has good administrative and accounting practices
• there are business procedures and internal controls for all
important areas of activity
• management’s instructions on security and controls are
incorporated into business procedures and are observed
• there are prudent control and security measures within IT.

36 S Y D B A N K / 2 0 1 7 A n n u a l R e p o r t
Corporate Social Responsibility
Banks play a leading role in ensuring financial stability in socie-
ty. Sydbank recognises the importance and relevance of ensur-
ing financial stability and many resources are used to undertake
this task in our day-to-day work.
A significant part of Sydbank’s corporate social responsibility
(CSR) is defined in legislation and takes place in close dialogue
and collaboration with public supervisory authorities.
As a systemically important financial institution (SIFI), Sydbank
is also subject to a number of stringent requirements concern-
ing the Bank’s capital base and resilience.
Consequently financial stability is the overall focus of the Bank’s
CSR efforts and objectives. The other CSR focus areas at
Sydbank are:
• social responsibility for customers and employees
• climate and environment
• human rights
• anti-corruption and crime-fighting
• local engagement.
These focus areas serve as Sydbank’s guidelines when setting
targets and assessing risks in the area of CSR.
Internal CSR organisationIn 2015 Sydbank started work on enhancing and systematising
its CSR efforts, objectives and reporting. This work continued in
2016 and 2017. The objective for 2017 was to expand the
Bank’s reporting and further improve the basis of reporting.
In organisational terms CSR reporting is the responsibility of the
Group Executive Management Secretariat & Communications,
which is a support function at Sydbank.
In 2017 an internal CSR forum, which meets once a year, was
established in connection with expanding the Bank’s CSR
efforts. The purpose of this forum is to align the targets of the
business units’ CSR contributions for the coming year. After
the annual review meeting, central and local entities work on
their own activities with Communications as the facilitator for
reporting.
Sydbank’s approach to CSROur CSR objectives and efforts are limited to the areas that are
especially relevant for us as a bank. Our report focuses on the
areas on which Sydbank has a direct influence. We give an
account of these areas in a structured manner. Reference is made
to Sydbank’s CSR Report for 2017, which is published together
with the annual report on Sydbank’s website, sydbank.com.
The 2017 report takes into account the new requirements for
CSR reporting pursuant to section 99 a of the Danish Financial
Statements Act and section 135 b of the Danish Financial
Business Act. The Bank’s CSR policy is updated on an ongoing
basis and at least once a year.
In practice the CSR area is integrated in Sydbank’s daily opera-
tions and CSR related issues form a natural part of the Bank’s
formal policies and descriptions of procedures. Reference is
made to eg the following documents, all of which are available
on Sydbank’s website, sydbank.com:
• Management Code of Conduct
• Code of Conduct
• Business Model
• Corporate Governance Principles
• Conflicts of Interest Policy
• Policy for measures against money laundering and terrorist
financing.
Sydbank acknowledges and complies with the UN Global
Compact’s 10 principles and has signed the UN Principles for
Responsible Investment (UN PRI) thereby committing the Bank
to incorporate environment, social and corporate governance
(ESG) issues when selecting equities and corporate bonds in
which Sydbank invests.
GroupExecutiveManagement
Group ExecutiveManagement Secretariat
InternalCSR forum
Central and local entities

372 0 1 7 A n n u a l R e p o r t / S Y D B A N K
Out of the UN’s 17 sustainable development goals, or ‘global
goals’ as they are popularly known, Sydbank has identified the
following goals as especially relevant in terms of Sydbank’s CSR
efforts:
4. Quality education
7. Affordable and clean energy
8. Decent work and economic growth
9. Industry, innovation and infrastructure
17. Partnerships for the goals.
Sydbank’s stakeholdersAs a commercial business and bank, Sydbank’s first obligation is
to its shareholders. But we are conscious that Sydbank’s growth
and existence also depend on an ongoing dialogue and interac-
tion with a number of other stakeholders in:
• our own organisation
• the marketplace
• society at large.
At the end of 2017 Sydbank employed a total of 2,273 people.
13% held management positions and the rest were employed
in various specialist functions, advisory functions and support
functions.
The dialogue with authorities and policymakers is especially
important these days given heightened regulation in the sector
as a result of the financial crisis in 2008 and globalisation in
general. Sydbank recognises the need for common regulation
ensuring security, transparency and stability in bank transac-
tions and financial markets in general.
At the same time Sydbank finds it is important that regulation is
not introduced without the knowledge of the industry’s players
but rather in a close dialogue between the authorities, legisla-
tors and the sector. The result is rules and regulations which can
be implemented and handled effectively in practice.
ComplianceThe implementation of new legislation is a significant element
in the day-to-day operations of a SIFI. In 2017 Sydbank devot-
ed special focus to its AML efforts as well as preparations ahead
of the new MiFID II rules for the investment area which came
into force at the turn of the year 2017/2018.
These 2 activities have spurred extensive educational activities.
Among other things Sydbank decided that all employees –
except for a few employees in internal service functions – were
to undergo training in the current AML rules and procedures in
November-December 2017.
Moreover Sydbank initiated the preparations for the EU’s
General Data Protection Regulation, which will take effect in
May 2018. For instance an in-house focus campaign on the
proper handling of confidential information was developed and
implemented. Further training activities in this connection are
expected in 2018.
• Investors• Suppliers
Own organisation
Marketplace
• Employees• Trade organisations
Sydbank’s stakeholders
• Customers - Corporate - Private Banking - Retail
Society• Supervisory authorities• Media and press• Policymakers• Interest organisations

38 S Y D B A N K / 2 0 1 7 A n n u a l R e p o r t
Corporate Social Responsibility
Employees2 employee satisfaction surveys were conducted in 2017. The
surveys were carried out by Rambøll Management Consulting
and showed progress compared with 2016 where the average
employee satisfaction index score was 3.9. In January 2017 the
corresponding index score was 4.1 and in autumn 2017 4.2.
The response rate in the most recent survey was 94%.
The number of reported work-related injuries was 10 – and in
this area Sydbank has a zero target also going forward.
Climate and environmentIn terms of energy the targeted and systematic improvement
efforts yielded further results: heat consumption adjusted for
climate variations declined by 2.5% and electricity consumption
was reduced by 7%. Sydbank has reduced its heat consumption
by 8.5% and its electricity consumption by 18% from 2014 to
2017.
Responsible investmentIn 2017 Sydbank continued its collaboration with the consulting
business GES to monitor the investment market as regards
securities that violate international norms and conventions. 37
companies were on Sydbank’s exclusion list in autumn 2017.
In 2017 GES, on behalf of Sydbank, actively engaged with 33
companies in developed countries about 41 different cases. 5
of these cases were sorted out during 2017.
In emerging markets GES’ engagement in 2017 resulted in 90
visits and 8 conference calls with businesses in Africa, the
Middle East, the Far East and Latin America. These activities are
spread across 60 cases. GES has ongoing engagement cases on
behalf of Sydbank involving more than 125 businesses in
emerging markets.
October2017
4.2January
2017
4.12016
3.9
Employee satisfaction – index score
Sydbank’s electricity consumptionDecrease in 2017:
7%Decrease 2014-17:
18%

392 0 1 7 A n n u a l R e p o r t / S Y D B A N K
SafetyAs a result of the declining use of cash in general, bank robber-
ies are virtually a thing of the past. In 2017 for the second suc-
cessive year there were no attempted robberies at Sydbank’s
branches.
Instead growing resources are allocated to preventing and fight-
ing cyber crime. Each year Sydbank assesses its systems in
relation to the risk areas confidentiality, integrity and accessibili-
ty. In 2017 a commercial impact assessment of a total of 589
systems was carried out, which was 217 more than in 2016.
SponsorshipsSydbank’s approach to sponsorships is influenced by the Bank’s
commitment to local relationships and dialogue. Our primary
focus is on contributing locally and supporting projects that
help create local value and local relationships. Sydbank helps to
support and develop local association activities and sports
activities in particular via its sponsorships, most of which are
given locally via Sydbank’s 10 regions.
On the basis of this philosophy Sydbank sponsored around 200
small local activities, 45 large regional activities and a couple of
large nationwide projects amounting to a total of around DKK
12 million in 2017.

40 S Y D B A N K / 2 0 1 7 A n n u a l R e p o r t

2 0 1 7 A n n u a l R e p o r t / S Y D B A N K 41
Financial StatementsFinancial Statements
Notes
1 Accounting policies........................................................................................ 47
2 Accounting estimates and judgements ................................................55
3 Solvency ............................................................................................................. 57
4 Leverage ratio .................................................................................................. 58
5 Segment reporting ........................................................................................ 58
6 Correlation between the Group’s performance measures and
the income statement according to IFRS.............................................60
7 Interest income ................................................................................................61
8 Interest expense..............................................................................................61
9 Dividends on shares ...................................................................................... 61
10 Fee and commission income ..................................................................... 62
11 Market value adjustments ..........................................................................62
12 Other operating income .............................................................................. 62
13 Staff costs and administrative expenses .......................................... 63
14 Impairment of loans and advances etc.................................................66
15 Profit/(Loss) on holdings in associates and subsidiaries ................67
16 Tax ........................................................................................................................ 68
17 Amounts owed by credit institutions and central banks ............... 69
18 Loans and advances ......................................................................................70
19 Bonds at fair value................................................................................... .......74
20 Shares etc ....................................................................................................... ...74
21 Holdings in associates etc ........................................................................... 74
22 Holdings in subsidiaries ............................................................................... 75
23 Assets related to pooled plans ................................................................. 75
24 Intangible assets ............................................................................................. 76
25 Owner-occupied property ..........................................................................77
26 Other property, plant and equipment ....................................................78
27 Other assets .................................................................................................. ...78
Income Statement ........................................................................................................................................................................................................................................................42
Statement of Comprehensive Income.................................................................................................................................................................................................................42
Balance Sheet. ................................................................................................................................................................................................................................................................43
Statement of Changes in Equity ............................................................................................................................................................................................................................ 44
Cash Flow Statement.................................................................................................................................................................................................................................................46
28 Amounts owed to credit institutions and central banks................78
29 Deposits and other debt ............................................................................ 79
30 Bonds issued at amortised cost............................................................... 79
31 Other liabilities.............................................................................................. ...79
32 Provisions ........................................................................................................... 79
33 Subordinated capital ................................................................................... ..80
34 Own holdings ................................................................................................... 81
35 Contingent liabilities and other obligating agreements ................ 82
36 Fair value hedging of interest rate risks (macro hedge)................ 83
37 Collateral ............................................................................................................ 84
38 Related parties .............................................................................................. ..85
39 Fair value disclosure ......................................................................................87
40 Financial liabilities – contractual maturities ...................................... ..90
41 Activity per country ...................................................................................... 90
42 Financial highlights..................................................................................... ...91
43 Reporting events occurring after the balance sheet date .............93
44 Group holdings and enterprises ...............................................................93
45 Large shareholders ........................................................................................ 93
Definitions – Group Financial Ratios & Performance Measures ..........94
Derivatives ................................................................................................................96
Risk Management ................................................................................................100
Credit risk .........................................................................................................101
Market risk ...................................................................................................... 104
Liquidity risk .................................................................................................. 106
Operational risk .............................................................................................108
IT security........................................................................................................108
Total capital.............................................................................................................109

42 S Y D B A N K / 2 0 1 7 A n n u a l R e p o r t
Income Statement
SSSSydbank Group Sydbank A/S
DKKm Note 2017 2016 2017 2016
Interest income 7 2,174 2,674 2,177 2,677
Interest expense 8 179 281 174 381
Net interest income 1,995 2,393 2,003 2,296
Dividends on shares 9 36 47 36 47
Fee and commission income 10 2,112 1,902 1,983 1,768
Fee and commission expense 10 287 340 233 276
Net interest and fee income 3,856 4,002 3,789 3,835
Market value adjustments 11 727 553 727 553
Other operating income 12 19 31 20 30
Staff costs and administrative expenses 13 2,537 2,487 2,482 2,431
Amortisation, depreciation and impairment of intangible assets and property, plant and equipment 122 115 101 102
Other operating expenses 25 19 25 19
Impairment of loans and advances etc 14 (45) 98 (45) 98
Profit/(Loss) on holdings in associates and subsidiaries 15 (7) 2 (26) 71
Profit before tax 1,956 1,869 1,947 1,839
Tax 16 425 397 416 367
Profit for the year 1,531 1,472 1,531 1,472
Distribution of profit for the yearProfit for the year 1,531 1,472
Total amount to be allocated 1,531 1,472
Proposed dividend 766 736
Proposal for allocation for other purposes 10 10
Transfer to shareholders’ equity 755 726
Total amount allocated 1,531 1,472
EPS Basic (DKK)* 22.4 20.9 22.4 20.9
EPS Diluted (DKK)* 22.4 20.9 22.4 20.9
Proposed dividend per share (DKK) 11.31 10.46 11.31 10.46
* Calculated on the basis of average number of shares outstanding, see page 17.
Statement of Comprehensive IncomeProfit for the year 1,531 1,472 1,531 1,472
Other comprehensive incomeItems that may be reclassified to the income statement:
Translation of foreign entities (20) 1 (20) 1
Hedge of net investment in foreign entities 20 (1) 20 (1)
Property revaluation 15 3 15 3
Other comprehensive income after tax 15 3 15 3Comprehensive income for the year 1,546 1,475 1,546 1,475

2 0 1 7 A n n u a l R e p o r t / S Y D B A N K 43
Balance Sheet
SSSSydbank Group Sydbank A/S
DKKm Note 2017 2016 2017 2016
AssetsCash and balances on demand at central banks 2,115 2,047 2,114 2,047
Amounts owed by credit institutions and central banks 17 12,479 6,981 12,476 6,977
Loans and advances at fair value 18 5,248 6,092 5,248 6,092
Loans and advances at amortised cost 18 64,312 77,191 64,513 77,358
Bonds at fair value 19 25,860 26,331 25,860 26,299
Shares etc 20 2,118 1,838 2,118 1,838
Holdings in associates etc 21 157 162 157 162
Holdings in subsidiaries 22 - - 2,329 2,351
Assets related to pooled plans 23 16,541 13,817 16,541 13,817
Intangible assets 24 281 303 280 300
Owner-occupied property 25 1,075 986 857 816
Other property, plant and equipment 26 71 69 71 69
Current tax assets 29 11 31 13
Deferred tax assets 46 57 12 16
Assets in temporary possession 1 2 1 1
Other assets 27 8,099 10,742 8,095 10,737
Prepayments 62 57 60 56
Total assets 138,494 146,686 140,763 148,949
Shareholders’ equity and liabilitiesAmounts owed to credit institutions and central banks 28 5,960 17,556 6,184 17,800
Deposits and other debt 29 82,690 81,109 84,754 83,138
Deposits in pooled plans 16,541 13,825 16,541 13,825
Bonds issued at amortised cost 30 3,722 3,714 3,722 3,714
Current tax liabilities - 38 1 41
Other liabilities 31 15,363 16,187 15,345 16,176
Deferred income 4 3 4 3
Total liabilities 124,280 132,432 126,551 134,697
Provisions 32 434 373 432 371
Subordinated capital 33 1,854 2,124 1,854 2,124
Shareholders’ equity: Share capital 704 722 704 722
Revaluation reserves 97 82 97 82
Other reserves:
Reserves according to articles of association 425 425 425 425
Reserve for net revaluation according to equity method 2 13 2 13
Retained earnings 9,922 9,769 9,922 9,769
Proposed dividend etc 776 746 776 746
Total shareholders’ equity 11,926 11,757 11,926 11,757
Total shareholders’ equity and liabilities 138,494 146,686 140,763 148,949

44 S Y D B A N K / 2 0 1 7 A n n u a l R e p o r t
Statement of Changes in Equity
SSSSydbank Group
DKKm
Share capital
Revaluation reserves
Reserves acc to
articles of association
Reserve for net
revaluation acc to equity
methodRetained earnings
Proposed dividend
etc TotalShareholders’ equity at 1 Jan 2017 722 82 425 13 9,769 746 11,757
Profit for the period (11) 766 776 1,531
Other comprehensive income
Translation of foreign entities (20) (20)
Hedge of net investment in foreign entities 20 20
Property revaluation 15 0 15
Total other comprehensive income - 15 - - 0 - 15
Comprehensive income for the year - 15 - (11) 766 776 1,546
Transactions with owners
Purchase of own shares (1,785) (1,785)
Sale of own shares 1,555 1,555
Reduction of share capital (18) (394) (412)
Dividend etc paid (746) (746)
Dividend, own shares 11 11
Total transactions with owners (18) - - - (613) (746) (1,377)
Shareholders’ equity at 31 Dec 2017 704 97 425 2 9,922 776 11,926
Shareholders’ equity at 1 Jan 2016 742 79 425 13 9,355 813 11,427
Profit for the period 0 726 746 1,472
Other comprehensive income
Translation of foreign entities 1 1
Hedge of net investment in foreign entities (1) (1)
Property revaluation 3 0 3
Total other comprehensive income - 3 - 0 0 - 3
Comprehensive income for the year - 3 - 0 726 746 1,475
Transactions with owners
Purchase of own shares (1,384) (1,384)
Sale of own shares 1,487 1,487
Reduction of share capital (20) (425) (445)
Dividend etc paid (813) (813)
Dividend, own shares 10 10
Total transactions with owners (20) - - - (312) (813) (1,145)
Shareholders’ equity at 31 Dec 2016 722 82 425 13 9,769 746 11,757

2 0 1 7 A n n u a l R e p o r t / S Y D B A N K 45
SSSSydbank A/S
DKKm
Share capital
Revaluation reserves
Reserves acc to
articles of associa-
tion*
Reserve for net
revaluation acc to equity
methodRetained earnings
Proposed dividend
etc TotalShareholders’ equity at 1 Jan 2017 722 82 425 13 9,769 746 11,757
Profit for the period (11) 766 776 1,531
Other comprehensive income
Translation of foreign entities (20) (20)
Hedge of net investment in foreign entities 20 20
Property revaluation 15 0 15
Total other comprehensive income - 15 - - 0 - 15
Comprehensive income for the year - 15 - (11) 766 776 1,546
Transactions with owners
Purchase of own shares (1,785) (1,785)
Sale of own shares 1,555 1,555
Reduction of share capital (18) (394) (412)
Dividend etc paid (746) (746)
Dividend, own shares 11 11
Total transactions with owners (18) - - - (613) (746) (1,377)
Shareholders’ equity at 31 Dec 2017 704 97 425 2 9,922 776 11,926
Shareholders’ equity at 1 Jan 2016 742 79 425 13 9,355 813 11,427
Profit for the period 0 726 746 1,472
Other comprehensive income
Translation of foreign entities 1 1
Hedge of net investment in foreign entities (1) (1)
Property revaluation 3 0 3
Total other comprehensive income - 3 - 0 0 - 3
Comprehensive income for the year - 3 - 0 726 746 1,475
Transactions with owners
Purchase of own shares (1,384) (1,384)
Sale of own shares 1,487 1,487
Reduction of share capital (20) (425) (445)
Dividend etc paid (813) (813)
Dividend, own shares 10 10
Total transactions with owners (20) 0 0 0 (312) (813) (1,145)
Shareholders’ equity at 31 Dec 2016 722 82 425 13 9,769 746 11,757
* Reserves according to the articles of association equal the undistributable savings bank reserve in accordance with Article 4 of the Articles of Association.
The share capital comprises 70,361,174 shares at a nominal value of DKK 10 or a total of DKK 703.6m. The Bank has only one class of shares as all shares carry the same rights.

46 S Y D B A N K / 2 0 1 7 A n n u a l R e p o r t
Cash Flow Statement
SSSydbank Group
DKKm 2017 2016
Operating activitiesPre-tax profit for the year 1,956 1,869
Taxes paid (431) (245)
Adjustment for non-cash operating items:
Profit/(Loss) on holdings in associates 12 (2)
Amortisation and depreciation of intangible assets and property, plant and equipment 122 115
Impairment of loans and advances/guarantees (45) 98
Other non-cash operating items 74 80
1,688 1,915
Changes in working capital:
Credit institutions and central banks (15,754) (945)
Trading portfolio 191 (71)
Other financial instruments at fair value (234) (533)
Loans and advances 13,768 1,078
Deposits 1,581 1,208
Other assets/liabilities 2,016 1,647
Cash flows from operating activities 3,256 4,299
Investing activitiesPurchase of holdings in associates (6) 0
Sale of holdings in associates 0 1
Purchase and sale of intangible assets 0 0
Purchase of property, plant and equipment (213) (979)
Sale of property, plant and equipment 19 28
Cash flows from investing activities (200) (68)
Financing activitiesPurchase and sale of own holdings (642) (342)
Dividends etc (735) (803)
Raising of subordinated capital 558 -
Redemption of subordinated capital (828) -
Issue of bonds - 3,718
Redemption of bonds - (3,731)
Cash flows from financing activities (1,649) (1,158)
Cash flows for the year 1,407 3,073
Cash and cash equivalents at 1 Jan 7,561 4,488
Cash flows for the year (changes during the year) 1,407 3,073
Cash and cash equivalents at 31 Dec 8,968 7,561
Cash and cash equivalents at 31 DecCash and balances on demand at central banks 2,115 2,047
Fully secured cash and cash equivalent balances on demand withcredit institutions and insurance companies 1,641 1,198
Unencumbered certificates of deposit 5,212 4,316
Cash and cash equivalents at 31 Dec 8,968 7,561

2 0 1 7 A n n u a l R e p o r t / S Y D B A N K 47
Notes
Note 1 Accounting policies
Basis of preparationThe consolidated financial statements of Sydbank are prepared in compliance with International Financial Reporting Standards (IFRS) as adopted by the EU. The financial statements of the parent, Sydbank A/S, are prepared in compliance with the Danish Financial Business Act, including the Danish executive order on financial reporting of credit institutions and brokerage firms etc, which is in compliance with the provisions on recognition and measurement according to IFRS.
Furthermore the annual report is prepared in compliance with additional Danish disclosure requirements for annual reports of listed financial companies.
On 20 February 2018 the Board of Directors and the Group Executive Management reviewed and approved the 2017 Annual Report of Sydbank A/S. The Annual Report will be submitted for adoption by the AGM on 14 March 2018.
New accounting policiesThe following amendments to IFRS have been implemented effective as from 1 January 2017:
• Amendments to IAS 7 in relation to the reconciliation of the opening and closing balances of interest-bearing debt
• Amendments to IAS 12 in relation to deferred tax on holdings
• Amendments to different standards pursuant to “Annual Improvements to IFRSs”.
Sydbank’s implementation of the new or amended standards has not had any effect on recognition and measurement in the consolidated financial statements and consequently it has had no impact on EPS Basic.
Apart from the above the accounting policies applied are consistent with those adopted in the previous year.
Recognition and measurementAssets are recognised in the balance sheet when it is probable that future economic benefits will flow to the Group and the value of the asset can be measured reliably. Liabilities are recognised in the balance sheet when they are probable and can be measured reliably.
On initial recognition assets and liabilities are measured at fair value. Subsequent measurement of assets and liabilities is as described for each item below.
Recognition and measurement take into account gains, losses and risks arising before the presentation of the financial
statements and which confirm or invalidate circumstances existing at the balance sheet date.
Income is recognised in the income statement as earned. Costs incurred to earn the year’s income are recognised in the income statement. Value adjustments of financial assets, financial liabilities and derivatives are recognised in the income statement apart from value adjustments of derivatives used to provide foreign currency hedge of net investments in foreign subsidiaries and associates. The latter value adjustments are recognised in the statement of comprehensive income. Purchase and sale of financial instruments are recognised on the settlement date.
Significant recognition and measurement principles
Consolidated financial statementsThe consolidated financial statements include the parent, Sydbank A/S, as well as subsidiaries in which Sydbank A/S exercises control over financial and operating policies. Group holdings and enterprises (note 44) lists the consolidated entities.
The consolidated financial statements combine the financial statements of the parent and the individual subsidiaries in accordance with the Group’s accounting policies, in which intragroup income, costs, shareholdings, balances and dividends as well as realised and unrealised gains on intragroup transactions have been eliminated.
Entities acquired are included from the acquisition date.
The assets (including identifiable intangible assets), liabilities and contingent liabilities of entities acquired are recognised at the acquisition date at fair value in accordance with the acquisition method.
Where the cost of acquisition exceeds the fair value of the net assets of the entity acquired, the difference is recognised as goodwill. Goodwill is recognised in the functional currency of the entity acquired at the exchange rate on the date of transaction. Costs in connection with acquisition are recognised in the income statement when incurred.
Entities disposed of are included until the transfer date.
Foreign currency translationThe consolidated financial statements are presented in DKK, the functional currency of the parent. Transactions in foreign
48 S Y D B A N K / 2 0 1 7 A n n u a l R e p o r t
Notes
currencies are translated at the exchange rate on the date of transaction. Balances in foreign currencies are translated at the closing rate.
OffsettingThe Group sets off assets and liabilities only when the Group has a legally enforceable right to set off the recognised amounts and intends to settle on a net basis or to realise the asset and settle the liability simultaneously.
Income criteriaIncome and expenses, including interest income and interest expense, are accrued over the periods to which they relate and are recognised in profit or loss at the amounts relevant to the accounting period. Fees and commission concerning loans and advances and amounts owed are recognised in the carrying amounts of loans and advances and amounts owed and are recognised in profit or loss over the life of the loans as part of the effective interest rate. Guarantee commission is recognised as income over the life of the guarantees.Income for implementing a given transaction, including securities fees and payment service fees, is recognised as income when the transaction has been implemented.
Guarantee schemeContributions to the Guarantee Fund and the Resolution Fund, for instance to cover losses related to the winding-up or bankruptcy of banks, are recognised under “Other operating expenses”.
Repo and reverse transactionsSecurities sold under agreements to repurchase the same remain on the balance sheet. Consideration received is recognised as a debt and the difference between selling and buying prices is recognised over the life as interest in the income statement. Gains or losses on securities are recognised in the income statement.
Securities bought under agreements to resell the same are not recognised in the balance sheet and gains or losses on securities are not recognised in the income statement. Consideration paid is recognised as a receivable and the difference between buying and selling prices is recognised over the life as interest in the income statement.
Repo and reverse transactions are recognised and measured at fair value as they are regarded as an integral part of the trading portfolio and form part of ongoing risk management and determination of gains thereon.
Transfer of loansThe Group transfers certain loans secured on real property to a mortgage credit institution under the joint funding provisions of the Danish Financial Business Act. As of the transfer date the loans are no longer recognised in the Group’s balance sheet because the Group has transferred control and a certain share of the risks and benefits associated with the loans to the mortgage credit institution. The Group provides a guarantee for part of the risk associated with the loans for which it receives guarantee commission. Moreover the Group receives fee income from the mortgage credit institution for ongoing servicing of the loans transferred.
Amounts owed and loans and advancesInitial recognition of amounts owed by credit institutions and central banks as well as loans and advances is at fair value plus transaction costs and less origination fees received.
Subsequent measurement of amounts owed by credit institutions etc and loans and advances that are not reverse transactions is at amortised cost less impairment charges.
Amounts owed by credit institutions etc and loans and advances at amortised cost are all assessed to determine whether objective evidence of impairment exists. Amounts owed and loans and advances of a significant size are all assessed individually to determine whether objective evidence of impairment exists.
There is objective evidence of impairment of amounts owed and loans and advances if one or more of the following events have occurred:• Considerable financial difficulties on the part of the debtor.• Breach of contract by the debtor, for instance by way of failure
to fulfil the payment obligations as regards instalments and interest.
• Terms granted to the debtor by the Group which would otherwise not have been considered if the debtor had not been experiencing financial difficulties.
• The likelihood of bankruptcy or other financial restructuring on the part of the debtor.
Impairment charges are determined individually when there is objective evidence of impairment at an individual level.
Individually assessed loans and advances without impairment as well as other loans and advances are subsequently assessed at portfolio level. If there is objective evidence of impairment at portfolio level an impairment test is carried out where the expected future cash flows are estimated on the basis of the historical loss experience adjusted for the effects of prevailing
Note 1 Accounting policies – continued

2 0 1 7 A n n u a l R e p o r t / S Y D B A N K 49
conditions. The impairment charge for the portfolio is calculated via a ratings based approach where loans and advances are grouped according to client ratings at the balance sheet date. Where migration to lower rating categories is registered, impairment charges are made on a net basis.
Impairment charges calculated via the ratings based approach are supplemented by management’s estimates and the effect of events unaccounted for by the approach.
Impairment charges are determined as the difference between amortised cost and the discounted value of expected future cash flows, including the realisable value of any collateral.
Individual impairment charges are determined on the basis of the most likely outcome of the cash flows. Any subsequent increase in the discounted value of expected future cash flows will result in reversal in full or in part of the impairment charge. Determination of the discounted value is based on the original effective interest rate as regards fixed-rate loans and advances and the current effective interest rate as regards floating-rate loans and advances.
Interest is recognised as income on the basis of the impaired value from the time when impairment charges for loans and advances are recognised.
LeasingLeased assets in connection with finance leases in which the Group is the lessor are recognised under loans and advances at the net investment in the leases less amortisation (repayment) which is computed according to the annuity method over the lease term. Income from the leased assets is recognised on the basis of the agreed effective interest rate of the leases and is recognised in profit or loss under “Interest income”. Sales proceeds from leased assets are recognised under “Other operating income”.
Bonds and shares etcBonds and shares etc are recognised and measured at fair value. The fair value option is applied to shares outside the trading portfolio as they form part of a portfolio which is managed and measured at fair value. The fair value is the amount for which a financial asset can be exchanged between knowledgeable, willing parties.
In an active market, fair value is expressed by quoted prices or alternatively by a model value, based on recognised models and observable market data, which corresponds to fair value.
In a less active or inactive market, fair value is a model value based on recognised models and observable market data for similar assets.
A limited number of bonds and shares are measured on the basis of models and available data that only to a limited extent are observable market data.
Determination of fair value of unlisted shares and other holdings is based on available information about trades etc or alternatively on expected cash flows. If a reliable fair value cannot be determined, measurement will be at cost less any impairment charges.
Purchase and sale of securities are recognised on the settlement date.
Holdings in subsidiariesSubsidiaries are entities in which the parent has control. Holdings in subsidiaries are recognised and measured in the financial statements of the parent according to the equity method. The proportionate share of the profit or loss after tax of the entities is recognised under “Profit/(Loss) on holdings in associates and subsidiaries”.
Holdings in associatesAssociates are entities in which the Group has holdings and significant influence but not control. Holdings in associates are recognised and measured according to the equity method. The proportionate share of the profit or loss after tax of the entities is recognised under “Profit/(Loss) on holdings in associates and subsidiaries”.
Derivatives and hedge accounting Derivatives are recognised and measured at fair value. Positive market values are recognised under “Other assets”. Negative market values are recognised under “Other liabilities”.
Market value adjustment of derivatives concluded for the purpose of hedging the interest rate risk of fixed-rate loans and advances generates immediate asymmetry in the financial statements as fixed-rate loans and advances are measured at amortised cost. The macro hedging rules (fair value hedging) of IFRS eliminate this asymmetry. The calculated change in the fair value of the loans and advances effectively hedged is recognised in the balance sheet under “Other assets” or under “Other liabilities” and is recognised in the income statement under “Market value adjustments”.
Note 1 Accounting policies – continued

50 S Y D B A N K / 2 0 1 7 A n n u a l R e p o r t
Notes
Pooled plansAll pooled assets and deposits are recognised in separate balance sheet items. Return on pooled assets and distribution to holders of pooled assets are recognised under “Market value adjustments”. The assets in which holders’ savings are placed are measured at fair value.
The portfolio of shares and bonds issued by the Group has been reduced in equity and bonds issued respectively. Consequently “Deposits in pooled plans” exceed “Assets related to pooled plans”.
Intangible assetsIntangible assets concern the value of customer relationships acquired in connection with acquisitions as well as goodwill.
The value of customer relationships acquired is measured at cost less accumulated amortisation and impairment charges. The value of customer relationships acquired is amortised over the expected useful life of 5-15 years.
Initial recognition of goodwill is at cost in the balance sheet. Subsequent measurement of goodwill is at cost less accumulated impairment charges. Goodwill is not amortised. Goodwill is tested for impairment annually and is written down to its recoverable amount through profit or loss if the carrying amount is higher. The recoverable amount is determined as the present value of the future net cash flows expected to be derived from the activity to which goodwill is related. The determination of cash-generating units follows the management structure and management control. Management assesses the lowest level of cash-generating units to which the carrying amount of goodwill may be allocated.
Impairment charges for goodwill are not reversed.
Owner-occupied propertyOwner-occupied property is property mainly used by the Group to operate its banking business.
Owner-occupied property is recognised on acquisition at cost and subsequently carried at a revalued amount corresponding to the fair value at the date of revaluation less depreciation and impairment charges. Revaluations are made with sufficient regularity to ensure that the carrying amount does not differ materially from that which would be determined using fair value at the balance sheet date.
Any decrease in the carrying amount as a result of the revaluation of owner-occupied property is charged to the
income statement except where the decrease reverses previously recognised increases. Any increase as a result of the revaluation of owner-occupied property is recognised in other comprehensive income and transferred to revaluation reserves under equity except where an increase reverses previously recognised impairment charges as regards the property in question. Owner-occupied property is depreciated on a straight-line basis over the expected useful life of 50 years, taking into account the expected residual value at the expiry of the useful life.
As regards ongoing measurement of land and buildings, the value of the individual property is measured on the basis of the return method.The underlying assumptions, return and rate of return are assessed by external valuers.Depreciation and impairment charges are recognised in the income statement under “Depreciation and impairment of property, plant and equipment”.
Other property, plant and equipmentOther property, plant and equipment is measured at cost less depreciation and impairment charges. Depreciation is provided on a straight-line basis over the expected useful life, typically 3-5 years. Leasehold improvements are depreciated over the term of the lease. Depreciation and impairment charges are recognised in the income statement under “Depreciation and impairment of property, plant and equipment”.
Other assetsThis item includes assets not recognised under other asset items, eg positive market values of spot transactions and derivatives, cash collateral provided in connection with CSA agreements as well as interest receivable.
DividendProposed dividend is recognised as a liability at the date of adoption by the AGM. Proposed dividend for the year is recognised as a separate item in equity until adoption.
Own sharesConsideration paid or received in connection with the Group’s purchase and sale of Sydbank shares is recognised directly in equity.
Other liabilitiesThis item includes negative market values of spot transactions and derivatives, cash collateral received in connection with CSA
Note 1 Accounting policies – continued

2 0 1 7 A n n u a l R e p o r t / S Y D B A N K 51
agreements, negative portfolios in connection with reverse transactions, interest payable as well as provisions for employee benefits.
Negative portfolios in connection with reverse transactions arise when the Group resells assets received as collateral in connection with reverse transactions. The assets received are not recognised in the balance sheet and any resale will therefore result in a negative portfolio.
Wages and salaries, payroll tax, social security contributions as well as paid absences are recognised in the financial year in which the related service has been rendered by the Group’s employees. Costs relating to the Group’s long-term employee benefits are accrued and follow the service rendered by the employees in question. Pension contributions are paid into the employees’ pension plans on a continuing basis and are charged to the income statement.
Employee sharesWhen the Group’s employees are given an option to subscribe for shares at a price below the market price, the bonus element is recognised from the grant date as a cost under staff costs. The set-off is recognised directly in equity as an owner’s transaction. The bonus element is expensed successively during the vesting period as the difference between the fair value and the subscription price of the shares subscribed.
ProvisionsProvisions include provisions for guarantees, provisions for onerous contracts as well as legal actions etc. Initial recognition of financial guarantees is at fair value which is often equal to the guarantee premium received. Subsequent measurement of guarantees is at the higher of the guarantee premium received amortised over the guarantee period and any provision made.
A provision for a guarantee or an onerous contract is recognised if claims for payment under the guarantee or contract are probable and the size of the liability can be measured reliably. Provisions are based on management’s best estimates of the size of the liabilities. Measurement of provisions includes discounting when significant.
Financial liabilitiesDeposits, bonds issued, subordinated capital and amounts owed to credit institutions etc are recognised initially at fair value less transaction costs incurred.
Subsequent measurement of deposits, bonds issued, subordinated capital and amounts owed to credit institutions
etc that are not repo transactions is at amortised cost using the effective interest rate method whereby the difference between net proceeds and nominal value is recognised in the income statement under “Interest expense” over the loan period.
Other liabilities are measured at net realisable value.
Assets in temporary possessionAssets in temporary possession include property, plant and equipment and disposal groups held for sale. Assets are classified as being in temporary possession when their carrying amount will be recovered principally through a sale transaction within 12 months in accordance with a formal plan. Assets or disposal groups in temporary possession are measured at the lower of the carrying amount and fair value less costs to sell. Assets are not depreciated or amortised from the time when they are classified as being in temporary possession.
Impairment losses arising at initial classification as assets being in temporary possession and gains or losses at subsequent measurement at the lower of the carrying amount and fair value less costs to sell are recognised in the income statement under the items they concern.
TaxDanish consolidated entities are subject to compulsory joint taxation. The Group has not opted for international joint taxation. Sydbank A/S has been appointed the management company of the joint taxation entity. Corporation tax on income subject to joint taxation is fully distributed on payment of joint taxation contributions between the Danish consolidated entities. Tax for the year includes tax on taxable income for the year, adjustment of deferred tax as well as adjustment of prior year tax charges. Tax for the year is recognised in the income statement as regards the elements attributable to profit for the year, in other comprehensive income as regards the elements attributable thereto and directly in equity as regards the elements attributable to items recognised directly in equity.
Current tax liabilities and current tax assets are recognised in the balance sheet as calculated tax on taxable income for the year adjusted for tax on prior year taxable income as well as for tax paid on account.
Provisions for deferred tax are based on the balance sheet liability method and include temporary differences between the carrying amounts and the tax base of the balance sheets of each consolidated entity as well as tax loss carryforwards that
Note 1 Accounting policies – continued

52 S Y D B A N K / 2 0 1 7 A n n u a l R e p o r t
Notes
are expected to be used. Deferred tax is measured on the basis of the tax rules and tax rates that, according to the rules in force at the balance sheet date, are applicable at the time the deferred tax is expected to crystallise as current tax.
Changes in deferred tax due to changes in tax rates are recognised in the income statement.
Fair value measurementThe Group uses the concept of fair value in connection with certain disclosure requirements as well as for recognition and measurement of financial instruments. Fair value is defined as the price that would be received to sell an asset or paid to transfer a liability in an orderly transaction between market participants.
Fair value is a market-based measurement, not an entity-specific measurement. The entity uses the assumptions that market participants would use when pricing the asset or liability under current market conditions, including assumptions about risk. As a result the entity’s intention to hold an asset or to settle a liability is not considered when measuring fair value.
Fair value measurement is based on the principal market. If there is no principal market the most advantageous market is used as a basis, ie the market achieving the highest price for the asset or liability less transaction costs.
Fair value measurement is based to the widest extent possible on market values in active markets or alternatively on values derived from observable market data.
In so far as such observations are not available or cannot be used without significant modifications, acknowledged valuation techniques and reasonable estimates are used as the basis of fair values.
Cash flow statementThe cash flow statement presents the cash flows from operating, investing and financing activities as well as cash and cash equivalents at the beginning and end of the year. The cash flow statement is presented using the indirect method based on profit before tax.
The cash flow effect of the acquisition and disposal of entities is reported separately under cash flows from investing activities. The cash flow statement recognises cash flows concerning entities acquired from the acquisition date and cash flows concerning entities disposed of until the transfer date.
Cash flows from operating activities are determined as profit
before tax for the year adjusted for non-cash operating items, taxes paid as well as changes in working capital.
Cash flows from investing activities include purchase and sale of property, plant and equipment, intangible assets as well as holdings in associates.
Cash flows from financing activities include dividends paid as well as changes in equity, subordinated capital and bonds issued.
Cash and cash equivalents comprise cash and balances on demand at central banks, fully secured cash and cash equivalent balances on demand with credit institutions and insurance companies as well as unencumbered certificates of deposit.
Segment reportingThe Group consists of a number of business units and central functions. The business units are segmented according to product and service characteristics and comprise Banking, Asset Management, Sydbank Markets, Treasury and Other. Further details of the business units are provided in note 5. The correlation between the income statement according to IFRS and the Group’s performance measures are shown in note 6.
Segment reporting as regards the business units complies with the Group’s accounting policies as regards recognition and measurement. Inter-segment transactions are settled on an arm’s length basis. Centrally incurred costs are allocated to the business units in accordance with their estimated proportionate share of overall activities.
The following performance measures are used in connection with the Group’s management control, see segment information stated in note 5.
Core incomeCore income comprises income from clients serviced by the Group’s branch network, including interest, commission, investment fund commission, custody account fees and asset management fees.
Trading incomeTrading income only comprises income from clients affiliated with Sydbank Markets as well as income from flows and market-making as regards securities and other financial instruments as well as related position-taking.
Note 1 Accounting policies – continued

2 0 1 7 A n n u a l R e p o r t / S Y D B A N K 53
Core earnings before impairmentCore earnings before impairment charges for loans and advances etc represent core income and trading income less costs relating to these activities.
Impairment of loans and advances etcImpairment of loans and advances etc represent impairment charges for bank loans and advances, provisions for guarantees as well as credit valuation adjustment of derivatives.
Core earningsCore earnings represent core income and trading income less costs and impairment charges for loans and advances etc relating to these activities.
Investment portfolio earningsInvestment portfolio earnings represent the return on the portfolios of shares, bonds, derivatives and holdings managed by Treasury, a department within the business unit Sydbank Markets. Investment portfolio earnings are less funding charges and administrative costs.
Forthcoming standards and interpretationsThe International Accounting Standards Board (IASB) has issued the following new International Financial Reporting Standards (IFRS) and Interpretations (IFRIC) which are not mandatory for the Group in connection with the preparation of the 2017 financial statements. These include IFRS 9, 15, 16 and 17 as well as amendments to IAS 28, 40, IFRS 2, 4 and 9. IFRS 9 and 15 have been adopted by the EU whereas none of the other forthcoming standards and interpretations have been adopted by the EU.
The Group does not plan to implement the new standards and interpretations until they become mandatory. The expected impact of the implementation of IFRS 9 is described below. The other new standards and interpretations are not expected to have any significant impact on the Group’s financial reporting.
IFRS 9 Financial Instruments, which will replace IAS 39, will change the classification and the resulting measurement of financial assets and financial liabilities.
IFRS 9 introduces a new approach for the classification of financial assets based on the entity’s business model and the underlying cash flows of the asset. The implementation of IFRS 9 is not expected to change the classification or measurementof the Group’s financial assets except for the below change in principles for the impairment of exposures (loans and advances and guarantees).
With IFRS 9, coming into force on 1 January 2018, a new impairment model will be implemented according to which impairment charges must be recognised for all exposures on the basis of expected losses. Under the existing rules impairment charges are recognised only when there is objective evidence of impairment.
Under IFRS 9 exposures are divided into 3 groups for calculating impairment and classified into different stages (1, 2 or 3), depending on the risk of credit loss. The staging assessment and the calculation of expected loss will to a large extent be based on the Group’s existing rating models and credit management.
Based on the Danish FSA’s national guidelines concerning impairment charges in accordance with IFRS 9 impairment charges are expected to increase by around DKK 200m based on the portfolio at 31 December 2017.
The projected increase in the Group’s impairment charges will reduce the Group’s shareholders’ equity and will therefore generally have a corresponding negative impact on regulatory capital. To counter the impact on regulatory capital and hence banks’ possibilities of supporting lending, a transitional arrangement has been adopted so that any adverse impact from the new impairment model will be phased over the next 5 years.
At a later date new hedge accounting rules will be introduced. The changes are not expected to have any significant impact on the Group’s financial reporting.
Note 1 Accounting policies – continued

54 S Y D B A N K / 2 0 1 7 A n n u a l R e p o r t
IFRS 15 Revenue from Contracts with Customers, which will replace the current revenue standards (IAS 11 and 18) and interpretations, introduces a new model for the recognition and measurement of revenue concerning sales contracts with customers. The new model is based on a 5-step process to be followed as regards all sales contracts with customers to determine when and how revenue is to be recognised in the income statement. The Group does not believe that the standard will be of material significance to the Group. The standard is mandatory for financial years beginning on or after 1 January 2018.
IFRS 16 Leases will replace IAS 17 and related interpretations. IFRS 16 changes the accounting treatment of the Group’s operating lease assets. The current distinction between finance leases and operating leases will be eliminated as regards lessees. The Group does not expect that the standard will be of material significance to the Group. The standard is mandatory for financial years beginning on or after 1 January 2019.
Note 1 Accounting policies – continued
Notes
2 0 1 7 A n n u a l R e p o r t / S Y D B A N K 55
Management’s estimates and judgements are based on
assumptions considered reasonable by management but which
by their nature are uncertain and unpredictable. These
assumptions may be incomplete or inaccurate and unexpected
future events or circumstances may occur. Consequently it is by
nature difficult to make estimates and judgements and since
they also involve customer relationships and other
counterparties they will be subject to uncertainty. It may be
necessary to change previous estimates as a result of changes
in the basis of pre vious estimates or because of new knowledge
or subsequent events.
The areas where critical estimates and judgements have the
most significant effect on the financial statements are:
• Measurement of loans and advances and guarantees
• Fair value of financial instruments
• Fair value of owner-occupied property.
Measurement of loans advances and guarantees Impairment charges for loans and advances are made to take
into account any impairment after initial recognition.
Impairment charges are recorded as a combination of individual
and collective impairment charges and are subject to a number
of estimates, including which loans and advances or portfolios
of loans and advances are subject to objective evidence of
impairment.
Impairment testing of individual loans and advances involves
estimates of conditions associated with considerable
uncertainty. The assessment involves estimates as regards the
most likely future cash flow which the client is expected to
generate.
Loans and advances for which there is no objective evidence of
impairment or which are not subject to individual impairment
charges form part of a group for which impairment is assessed
at portfolio level.
The essential aspect of impairment testing as regards a group
of loans and advances is to identify events that provide
objective evidence of losses suffered by the group. The
assessment of the present value of cash flows generated by
clients in the group is associated with uncertainty when
historical data are used to mirror the current situation.
Loans and advances with similar credit risk characteristics are
grouped according to the Group’s rating model. Clients are rated
on an ongoing basis and clients whose credit risk characteristics
have changed are assigned to new rating categories on an
ongoing basis. Consequently clients’ migration to lower rating
categories is an indicator of deterioration.
If on the balance sheet date the Group is aware that events
unaccounted for by the models have occurred that either
aggravate or improve the future payment performance,
adjustments are made on the basis of a qualified management
estimate.
To mitigate the risk on individual exposures in the Group,
collateral is accepted mainly by way of charges over physical
assets, securities and rolling stock, of which mortgages on real
property represent the most significant form of collateral. The
valuation of collateral involves significant management
estimates.
Reference is made to the notes on risk management for a more
detailed description of impairment charges for loans and
advances. Loans and advances constitute 50.2% of the Group’s
assets at the end of 2017.
Provisions for guarantees etc issued in connection with client
exposures are made according to the same principles as those
applying to the impairment of loans and advances and involve
the same elements of uncertainty.
Fair value of financial instrumentsThe Group measures a number of financial instruments at fair
value, including all derivatives as well as shares and bonds.
Judgements are made in connection with the determination of
the fair value of financial instruments in the following areas:
• Choice of valuation technique
• Determination of when available quoted prices do not
represent fair value
• Calculation of fair value adjustments to take into account
relevant risk factors such as credit risk, model risk and
liquidity risk
• Assessment of which market parameters must be observed
• Estimate of future cash flows and required rates of return
as regards unlisted shares.
Note 2 Accounting estimates and judgements

56 S Y D B A N K / 2 0 1 7 A n n u a l R e p o r t
Management estimates are based on an assessment in
accordance with the Group’s accounting policies and generally
accepted valuation techniques.
As part of its operations the Group has acquired strategic
holdings. Strategic holdings are measured at fair value on the
basis of available information on trades in the relevant entity’s
holdings or alternatively a valuation model based on recognised
methods and current market data, including a judgement of
projected future earnings and cash flows. Measurement will
also be influenced by co-ownership, trade and shareholders’
agreements etc.
As regards financial instruments where measurement is only to
a limited extent based on observable market data,
measurement is affected by estimates. This is the case as
regards for instance unlisted shares and certain bonds for which
there is no active market. Measurement of illiquid bonds is
affected by the assumption of the relevant credit spread.
Reference is made to “Accounting policies” (note 1) and to “Fair
value disclosure” (note 39) for a more detailed description.
Financial instruments measured on the basis of unobservable
inputs represent DKK 1,822m, equivalent to 1.3% of the
Group’s assets at the end of 2017.
Fair value of owner-occupied propertyThe return method is used to measure owner-occupied
property at fair value.
Future cash flows are based on the Group’s best estimate of the
future income or loss from ordinary activities and required rate
of return as regards each property taking into account factors
such as location and condition. An external assessment
supporting this estimate is obtained. A number of these
assumptions and estimates have a significant impact on
calculations and include parameters such as inflation,
developments in rent, costs and required rates of return.
Changes in these parameters as a result of changed market
conditions affect the expected returns and consequently the
fair value of owner-occupied property.
Reference is made to “Owner-occupied property” (note 25).
Note 2 Accounting estimates and judgements – continued
Notes

2 0 1 7 A n n u a l R e p o r t / S Y D B A N K 57
Note 3 Solvency
The Group uses the following methods and approaches to calculate solvency:
Credit risk outside trading portfolio, retail clients
Credit risk outside trading portfolio, corporate clients
Credit risk outside trading portfolio, financial counterparties
Counterparty risk
Valuation of collateral
Market risk
Operational risk
Credit valuation adjustment
Advanced IRB
Foundation IRB
Standardised Approach
Mark-to-Market Method
Financial Collateral Comprehensive Method
Standardised Approach
Standardised Approach
Standardised Approach
The Group’s portfolio of equity investments primarily comprises strategic sector shares etc and in the Group’s solvency calculation
it is included under other exposures incl credit valuation adjustment.
Various types of collateral are used to mitigate the risk of the Group’s lending portfolio. The most significant types of collateral
comprise charges and guarantees.
Charges include deposit accounts and financial assets in the form of bonds and shares. The Group ensures that the items charged
are separate from clients’ right of disposal and that the charge is of legal validity. Valuation is ensured via the requirements of the
Financial Collateral Comprehensive Method according to the Capital Requirements Regulation and Directive (CRR/CRD IV) which
reduces the value of collateral on the basis of issuer, maturity and liquidity.
The Group has concluded netting agreements with all significant counterparties.
Sydbank Group
DKKm 2017 2016
Common Equity Tier 1 capital ratio 17.3 16.1
Tier 1 capital ratio 17.7 17.4
Capital ratio 20.8 19.2
Total capital
Shareholders’ equity 11,926 11,757
Prudent valuation (59) (65)
Proposed dividend (776) (746)
Intangible assets and capitalised deferred tax assets (271) (299)
Significant investments in financial sector (653) (434)
Common Equity Tier 1 capital 10,167 10,213
Additional Tier 1 capital 279 831
Tier 1 capital 10,446 11,044
Tier 2 capital 1,575 961
Difference between expected losses and accounting impairment charges 219 237
Total capital 12,240 12,242

58 S Y D B A N K / 2 0 1 7 A n n u a l R e p o r t
Note 3 Solvency – continued Sydbank Group
DKKm 2017 2016
Credit risk 38,933 41,683
Market risk 6,239 8,075
Operational risk 8,023 8,025
Other exposures incl credit valuation adjustment 5,694 5,824
Risk exposure amount 58,889 63,607
Pillar 1 capital requirement (8%) 4,711 5,089
Note 4 Leverage ratio Sydbank Group Sydbank A/S
DKKm 2017 2016 2017 2016
Exposure for computation of leverage ratio
Total assets 138,494 146,686 140,763 148,949
Of which pooled assets (16,541) (13,817) (16,541) (13,817)
Correction derivatives etc 5,531 2,801 5,531 2,801
Guarantees etc 13,562 11,385 13,562 11,385
Undrawn credit commitments etc 11,235 11,338 11,283 11,351
Other adjustments (887) (482) (899) (456)
Total 151,394 157,911 153,699 160,213
Tier 1 capital – current (transitional rules) 10,446 11,044 10,470 11,068
Tier 1 capital – fully loaded 10,167 10,213 10,191 10,237
Leverage ratio (%) – current (transitional rules) 6.9 7.0 6.8 6.9
Leverage ratio (%) – fully loaded 6.7 6.5 6.6 6.4
Note 5 Segment reporting
Operating segmentsThe Group’s segment statements are divided into the following business units: Banking, Asset Management, Sydbank Markets,
Treasury and Other.
Banking serves all types of retail and corporate clients.
Asset Management primarily comprises the Bank’s advisory-related income from clients and investment funds.
Sydbank Markets comprises trading income as well as a share of the income from clients with decentral affiliation calculated on
the basis of the market price thereof. The share represents the payment by Banking for Sydbank Markets’ facilities, including
advisory services and administration.
Treasury comprises the Group’s return on positions handled by Treasury, including liquidity allocation.
Other includes non-recurring items, costs to the Group Executive Management etc as well as return on strategic shareholdings
that are not allocated to Banking or Sydbank Markets.
Inter-segment transactions are settled on an arm’s length basis. Centrally incurred costs are allocated to the business units in
accordance with their estimated proportionate share of overall activities.
Surplus liquidity is settled primarily at short-term money market rates whereas other balances are settled on an arm’s length
basis.
Notes

2 0 1 7 A n n u a l R e p o r t / S Y D B A N K 59
Note 5 Segment reporting – continued Sydbank Group
DKKm
BankingAsset
ManagementSydbank Markets Treasury Other Total
Operating segments 2017
Core income 3,805 265 97 - - 4,167
Trading income - - 233 - - 233
Total income 3,805 265 330 - - 4,400
Costs, core earnings 2,399 78 99 - 61 2,637
Impairment of loans and advances etc (51) - - - - (51)
Core earnings 1,457 187 231 0 (61) 1,814
Investment portfolio earnings 7 - - 175 - 182
Profit before non-recurring items 1,464 187 231 175 (61) 1,996
Non-recurring items, net (40) - - - - (40)
Profit before tax 1,424 187 231 175 (61) 1,956
Depreciation and impairment of property, plant and equipment 113 3 5 - 1 122
Full-time staff at 31 Dec 1,906 46 84 4 24 2,064
Operating segments 2016
Core income 3,884 220 94 - - 4,198
Trading income - - 237 - - 237
Total income 3,884 220 331 - - 4,435
Costs, core earnings 2,364 74 90 - 62 2,590
Impairment of loans and advances etc 87 - - - - 87
Core earnings 1,433 146 241 - (62) 1,758
Investment portfolio earnings 2 - - 102 - 104
Profit before non-recurring items 1,435 146 241 102 (62) 1,862
Non-recurring items, net (24) - - - 31 7
Profit before tax 1,411 146 241 102 (31) 1,869
Depreciation and impairment of property, plant and equipment 107 2 5 - 1 115
Full-time staff at 31 Dec 1,883 44 83 4 23 2,037
The Sydbank Group’s internal financial reporting is not made on the basis of products and services. Reference is made to notes 7
and 10 for the distribution of interest income as well as fee and commission income.

60 S Y D B A N K / 2 0 1 7 A n n u a l R e p o r t
Note 5 Segment reporting – continued Sydbank Group
DKKm 2017 2016
Total income Assets Total income Assets
Geographical segments
Denmark 4,196 1,531 4,239 1,462
Abroad 204 53 196 58
Total 4,400 1,584 4,435 1,520
Income from external clients is broken down by organisational affiliation within the Sydbank Group. Assets, comprising only intangible
assets, land and buildings, other property, plant and equipment as well as holdings in associates, are broken down by location.
The geographical breakdown of the Group’s income and assets is disclosed in compliance with IFRS and does not reflect the Group’s
management structure. Management is of the opinion that operating segmentation provides a more informative description of the
Group’s activities.
Note 6 Correlation between the Group’s performance measures and the income statement according to IFRS Sydbank Group
DKKm
Coreincome
Tradingincome
Costs, core
earnings
Impair-ment
of loans and
advances etc
Coreearnings
Invest-ment
portfolioearnings
Non-recurring
items, net
Profitbefore
tax
2017Net interest and fee income 3,804 35 3,839 17 3,856 Market value adjustments 351 198 20 569 158 727Other operating income 19 19 19 Income 4,174 233 - 20 4,427 175 - 4,602
Staff costs and administrative expenses (2,490) (2,490) (7) (40) (2,537) Amortisation and depreciation and impairment of intangible assets and property, plant and equipment
(122)
(122)
(122)
Other operating expenses (25) (25) (25) Impairment of loans and advances etc 31 31 14 45 Profit/(Loss) on holdings in associatesand subsidiaries
(7) (7)
(7)
Profit before tax 4,167 233 (2,637) 51 1,814 182 (40) 1,956
2016Net interest and fee income 4,060 (63) 3,997 5 4,002 Market value adjustments 105 300 7 412 110 31 553 Other operating income 31 31 31 Income 4,196 237 - 7 4,440 115 31 4,586 Staff costs and administrative expenses (2,456) (2,456) (7) (24) (2,487)
Amortisation and depreciation and impairment of intangible assets and property, plant and equipment
(115)
(115)
(115)
Other operating expenses (19) (19) (19) Impairment of loans and advances etc (94) (94) (4) (98) Profit/(Loss) on holdings in associatesand subsidiaries
2 2
2
Profit before tax 4,198 237 (2,590) (87) 1,758 104 7 1,869
Notes

2 0 1 7 A n n u a l R e p o r t / S Y D B A N K 61
Note 7 Interest income Sydbank Group Sydbank A/S
DKKm 2017 2016 2017 2016
Reverse transactions with credit institutions and central banks (10) (9) (10) (9)
Amounts owed by credit institutions and central banks (28) (19) (28) (19)
Reverse loans and advances (30) (24) (30) (24)
Loans and advances and other amounts owed 2,188 2,580 2,192 2,583
Bonds 147 281 146 281
Total derivatives (94) (141) (94) (141)
comprising:
Foreign exchange contracts 60 67 60 67
Interest rate contracts (154) (208) (154) (208)
Other contracts 0 0 0 0
Other interest income 1 6 1 6
Total 2,174 2,674 2,177 2,677
Fair value, designated at initial recognition (40) (33) (40) (33)
Fair value, held for trading 53 140 52 140
Assets recognised at amortised cost 2,161 2,567 2,165 2,570
Total 2,174 2,674 2,177 2,677
The Group’s cash resources are primarily placed in Danish mortgage bonds. The interest rate risk concerning these positions has been reduced via derivatives. As a result the Group’s external income statement is affected in terms of interest income and the market value adjustment of bonds and derivatives. The same applies to the Group’s position-taking as regards bonds as well as shares. The break-down by income statement item does not disclose income independently and consequently these items must be regarded as one as they are in “Segment reporting” (note 5) as well as in the Group’s financial review, which also takes funding of the positions into account.
Note 8 Interest expense
Repo transactions with credit institutions and central banks (11) (35) (11) (35)
Credit institutions and central banks 20 39 20 39
Repo deposits (11) (6) (11) (6)
Deposits and other debt 140 193 135 293
Bonds issued 11 55 11 55
Subordinated capital 28 34 28 34
Other interest expense 2 1 2 1
Total 179 281 174 381
Fair value, designated at initial recognition (22) (41) (22) (41)
Liabilities recognised at amortised cost 201 322 196 422
Total 179 281 174 381
Note 9 Dividends on shares
Fair value, designated at initial recognition 35 43 35 43
Fair value, held for trading 1 4 1 4
Total 36 47 36 47

62 S Y D B A N K / 2 0 1 7 A n n u a l R e p o r t
Note 10 Fee and commission income Sydbank Group Sydbank A/S
DKKm 2017 2016 2017 2016
Securities trading and custody accounts 1,070 1,024 941 890
Payment services 306 307 306 307
Loan fees 142 118 142 118
Guarantee commission 141 115 141 115
Income concerning funded mortgage-like loans 113 - 113 -
Other fees and commission 340 338 340 338
Total fee and commission income 2,112 1,902 1,983 1,768
Total fee and commission expense 287 340 233 276
Net fee and commission income 1,825 1,562 1,750 1,492
Note 11 Market value adjustments
Other loans and advances and amounts owed at fair value 0 1 0 1
Bonds 188 278 188 278
Shares etc 189 161 189 161
Foreign exchange 175 195 175 195
Derivatives 175 (81) 175 (81)
Assets related to pooled plans 582 636 582 636
Deposits in pooled plans (583) (636) (583) (636)
Other assets/liabilities 1 (1) 1 (1)
Total 727 553 727 553
Fair value, held for trading, trading portfolio 586 472 586 472
Fair value, designated at initial recognition, equity investments 141 81 141 81
Total 727 553 727 553
The Group’s cash resources are primarily placed in Danish mortgage bonds. The interest rate risk concerning these positions has been reduced via derivatives. As a result the Group’s external income statement is affected in terms of interest income and the market value adjustment of bonds and derivatives. The same applies to the Group’s position-taking as regards bonds as well as shares. The break-down by income statement item does not disclose income independently and consequently these items must be regarded as one as they are in “Segment reporting” (note 5) as well as in the Group’s financial review, which also takes funding of the positions into account.
Note 12 Other operating income
Rental income – real property 11 14 12 14
Other operating income 8 17 8 16
Total 19 31 20 30
Notes

2 0 1 7 A n n u a l R e p o r t / S Y D B A N K 63
Note 13 Staff costs and administrative expenses Sydbank Group Sydbank A/S
DKKm 2017 2016 2017 2016
Salaries and remuneration
Group Executive Management 16 15 16 15
Board of Directors 6 6 6 6
Shareholders’ Committee 3 3 3 3
Total 25 24 25 24
Staff costs
Wages and salaries 1,240 1,207 1,226 1,192
Pensions 124 121 123 120
Social security contributions 14 15 14 15
Payroll tax 158 152 156 150
Total 1,536 1,495 1,519 1,477
Other administrative expenses
IT 633 626 615 612
Rent etc 114 121 125 127
Marketing and entertainment expenses 71 72 67 59
Other costs 158 149 131 132
Total 976 968 938 930
Total 2,537 2,487 2,482 2,431
Audit fees
Statutory audit 2 1 2 1
Assurance engagements 0 1 0 1
Tax consultancy 0 0 0 0
Fees for other services 0 0 0 0
Total 2 2 2 2
In addition to the statutory audit, services provided by the Bank’s independent auditor have comprised statutory reports, audit
services in connection with bond issues as well as accounting advice.
In addition to fees paid to the independent auditor, operating expenses have been incurred as regards the Group’s Internal Audit.
Staff
Average number of staff (full-time equivalent) 2,104 2,078 2,085 2,058

64 S Y D B A N K / 2 0 1 7 A n n u a l R e p o r t
Note 13 Staff costs and administrative expenses – continued Sydbank Group
DKK thousandDirectors’
remunerationCommittee
fees
2017
Total
2016
Total
Directors’ remuneration
Torben Nielsen (Chairman) 1,002 366 1,368 1,232
Peder Damgaard (Vice-Chairman) 584 236 820 767
Svend Erik Busk (resigned as of 23 March 2017) 83 32 115 441
Alex Slot Hansen 334 54 388 367
John Lesbo (member as of 23 March 2017) 251 98 349 -
Erik Bank Lauridsen (resigned as of 17 March 2016) - - - 100
Janne Moltke-Leth (member as of 17 March 2016) 334 54 388 287
Lars Mikkelgaard-Jensen 334 98 432 409
Frank Møller Nielsen 334 84 418 395
Jacob Chr. Nielsen 334 181 515 471
Jarl Oxlund 334 97 431 409
Bo Normann Rasmussen (resigned as of 19 July 2017) 194 57 251 409
Margrethe Weber 334 - 334 313
Total 4,452 1,357 5,809 5,600
Of which committee fees
Audit Committee (4 members) – of which fee to the chairman DKK 130,000 423 415
Risk Committee (4 members) – of which fee to the chairman DKK 130,000 382 415
Remuneration Committee (4 members) – of which fee to the chairman DKK 54,000 217 213
Nomination Committee (4 members) – of which fee to the chairman DKK 84,000 335 329
Sydbank’s Board of Directors receive fixed remuneration. In addition board committee members receive a fixed committee fee.
Notes

2 0 1 7 A n n u a l R e p o r t / S Y D B A N K 65
Note 13 Staff costs and administrative expenses – continued Sydbank Group
DKKm KarenFrøsig
BjarneLarsen
JanSvarre
Remuneration of the Group Executive Management
2017
Fixed remuneration 6.4 4.9 4.9
Of which fees received in connection with directorships (0.3) - (0.1)
Group costs 6.1 4.9 4.8
2016
Fixed remuneration 6.0 4.7 4.7
Of which fees received in connection with directorships (0.4) - (0.1)
Group costs 5.6 4.7 4.6
The Group Executive Management receives no variable remuneration.
Group Executive Management – severance terms Karen Frøsig, Bjarne Larsen and Jan SvarreThe notice of termination is 6 and 12 months for the Group Executive Management member and the Bank respectively.In respect of dismissal by the Bank, the Group Executive Management member is entitled to receive severance pay equal to 12 months’ salary.
Further details about the Bank’s remuneration policy are available at the Bank’s websitesydbank.dk/omsydbank/organisation/loenpolitik (in Danish only).
Sydbank Group Sydbank A/S
DKKm 2017 2016 2017 2016
Remuneration to material risk takers and control functions
Fixed remuneration 42.3 39.3 40.4 37.4
Variable remuneration 0.3 1.0 0.3 1.0
Total 42.6 40.3 40.7 38.4
Number of full-time staff (average) 31.8 30.6 30.8 29.6
Material risk takers and control functions only receive variable remuneration below the minimum threshold, cf the Danish
executive order on remuneration.

66 S Y D B A N K / 2 0 1 7 A n n u a l R e p o r t
Note 14 Impairment of loans and advances etc Sydbank Group Sydbank A/S
DKKm 2017 2016 2017 2016
Impairment of loans and advances recognised in the income statement
Impairment and provisions (58) (77) (58) (77)
Write-offs 148 342 148 342
Recovered from debt previously written off 135 167 135 167
Impairment of loans and advances etc (45) 98 (45) 98
Impairment and provisions at 31 Dec (allowance account)
Individual impairment and provisions 2,587 2,904 2,587 2,904
Collective impairment and provisions 300 385 300 385
Impairment and provisions at 31 Dec 2,887 3,289 2,887 3,289
Individual impairment of loans and advances and provisions for guarantees
Impairment and provisions at 1 Jan 2,904 3,687 2,904 3,687
Exchange rate adjustment 0 0 0 0
New individual impairment charges 1,061 1,206 1,061 1,206
Reversal of individual impairment charges 866 998 866 998
Other movements 0 0 0 0
Impairment charges previously recorded, now finally written off 512 991 512 991
Impairment and provisions at 31 Dec 2,587 2,904 2,587 2,904
Individual impairment of loans and advances 2,381 2,726 2,381 2,726
Individual provisions for undrawn credit commitments 34 52 34 52
Individual provisions for guarantees 172 126 172 126
Impairment and provisions at 31 Dec 2,587 2,904 2,587 2,904
Collective impairment of loans and advances and provisions for guarantees
Impairment and provisions at 1 Jan 385 495 385 495
Impairment and provisions during the year (85) (110) (85) (110)
Impairment and provisions at 31 Dec 300 385 300 385
Sum of loans and advances and amounts owed subject to collective impairment and provisions 5,490 12,861 5,490 12,861
Collective impairment and provisions 300 385 300 385
Loans and advances and amounts owed after collective impairmentand provisions 5,190 12,476 5,190 12,476
Individual impairment of loans and advances subject to objective evidenceof impairment
Balance before impairment of individually impaired loans and advances 4,391 4,862 4,391 4,862
Impairment of individually impaired loans and advances 2,381 2,726 2,381 2,726
Balance after impairment of individually impaired loans and advances 2,010 2,136 2,010 2,136
Interest recognised concerning individually and collectively impaired loans and advances represents DKK 333m for 2017(2016: DKK 577m).
Notes

2 0 1 7 A n n u a l R e p o r t / S Y D B A N K 67
Note 14 Impairment of loans and advances etc – continued Sydbank Group
DKKm
Allowance accountImpairment of loans/
advances etc
2017 2016 2017 2016
Industry breakdown of the Group’s allowance account and impairment of loans and advances recognised in the income statement
Corporate lending
Agriculture, hunting, forestry and fisheries 467 704 4 231
Manufacturing and extraction of raw materials 229 225 27 20
Energy supply etc 24 10 9 (2)
Building and construction 116 79 38 (1)
Trade 325 316 65 14
Transportation, hotels and restaurants 148 137 10 37
Information and communication 13 15 (1) (1)
Finance and insurance 169 134 22 (18)
Real property 302 342 (53) (40)
Other corporate lending 162 165 14 6
Total corporate lending 1,955 2,127 135 246
Public authorities - - - -
Retail clients 632 777 (95) (38)
Collective impairment charges 300 385 (85) (110)
Total 2,887 3,289 (45) 98
Note 15 Profit/(Loss) on holdings in associates and subsidiaries Sydbank Group Sydbank A/S
DKKm 2017 2016 2017 2016
Profit/(Loss) on holdings in associates etc (7) 2 (7) 2
Profit/(Loss) on holdings in subsidiaries - - (19) 69
Total (7) 2 (26) 71

68 S Y D B A N K / 2 0 1 7 A n n u a l R e p o r t
Note 16 Tax Sydbank Group Sydbank A/S
DKKm 2017 2016 2017 2016
Tax calculated on income for the year 377 329 375 329
Deferred tax 49 64 42 34
Adjustment of prior year tax charges (1) 4 (1) 4
Total 425 397 416 367
Effective tax rate
Current tax rate of Sydbank 22.0 22.0 22.0 22.0
Permanent differences (0.3) (1.0) (0.6) (2.3)
Adjustment of prior year tax charges 0.0 0.3 0.0 0.3
Effective tax rate 21.7 21.3 21.4 20.0
Deferred tax
Deferred tax at 1 Jan 108 44 147 113
Deferred tax for the year recognised in profit for the year 49 64 42 34
Deferred tax at 31 Dec, net 157 108 189 147
Deferred tax assets 46 57 12 16
Deferred tax liabilities 203 165 201 163
Deferred tax at 31 Dec, net 157 108 189 147
Notes

2 0 1 7 A n n u a l R e p o r t / S Y D B A N K 69
Note 16 Tax – continued Sydbank Group
DKKm 2017 2016
1 Jan
Recognisedin profit for
the year 31 Dec 1 Jan
Recognisedin profit for
the year 31 Dec
Deferred tax
Loans and advances at amortised cost 170 31 201 137 33 170
Land and buildings 2 0 2 (1) 3 2
Property, plant and equipment (18) (2) (20) (18) 0 (18)
Intangible assets 4 16 20 (10) 14 4
Other assets 9 (1) 8 13 (4) 9
Provisions (2) 1 (1) (1) (1) (2)
Other liabilities (35) 4 (31) (33) (2) (35)
Capitalised losses, jointly taxed income (22) 0 (22) (43) 21 (22)
Deferred tax at 31 Dec, net 108 49 157 44 64 108
Note 17 Amounts owed by credit institutions and central banks Sydbank Group Sydbank A/S
DKKm 2017 2016 2017 2016
Amounts owed at notice by central banks 5,211 4,316 5,211 4,316
Amounts owed by credit institutions 7,268 2,665 7,265 2,661
Total 12,479 6,981 12,476 6,977
On demand 1,650 940 1,647 936
3 months or less 10,829 6,033 10,829 6,033
Over 3 months not exceeding 1 year 0 8 0 8
Over 1 year not exceeding 5 years 0 0 0 0
Over 5 years 0 0 0 0
Total 12,479 6,981 12,476 6,977
Of which reverse transactions 4,892 1,652 4,892 1,652

70 S Y D B A N K / 2 0 1 7 A n n u a l R e p o r t
Note 18 Loans and advances Sydbank Group Sydbank A/S
DKKm 2017 2016 2017 2016
On demand 13,820 13,926 14,021 14,094
3 months or less 6,501 7,327 6,501 7,327
Over 3 months not exceeding 1 year 23,454 24,489 23,454 24,489
Over 1 year not exceeding 5 years 15,031 15,823 15,031 15,822
Over 5 years 10,754 21,718 10,754 21,718
Total 69,560 83,283 69,761 83,450
Of which reverse transactions (loans and advances at fair value) 5,248 6,092 5,248 6,092
Loans and advances and guarantees by sector and industry (%)Agriculture, hunting, forestry and fisheries 5.5 5.3 5.5 5.3
Manufacturing and extraction of raw materials 10.8 8.5 10.7 8.5
Energy supply etc 3.2 2.9 3.1 2.9
Building and construction 5.1 4.0 5.1 4.0
Trade 14.7 12.9 14.7 12.9
Transportation, hotels and restaurants 4.0 3.7 3.9 3.7
Information and communication 0.6 0.4 0.6 0.4
Finance and insurance 12.9 12.4 12.9 12.4
Real property 6.9 7.0 7.1 7.2
Other industries 4.0 4.2 4.2 4.1
Total corporate lending 67.7 61.3 67.8 61.4
Public authorities 0.4 0.8 0.4 0.8
Retail clients 31.9 37.9 31.8 37.8
Total 100.0 100.0 100.0 100.0
Collateral received and types of collateralLoans and advances at fair value 5,248 6,092 5,248 6,092
Loans and advances at amortised cost 64,312 77,191 64,513 77,358
Guarantees 13,562 11,385 13,562 11,385
Credit exposure for accounting purposes 83,122 94,668 83,323 94,835
Collateral value 44,161 51,016 44,161 51,016
Total unsecured 38,961 43,652 39,162 43,819
Types of collateral Real property* 12,187 20,532 12,187 20,532
Financial collateral 10,803 11,708 10,803 11,708
Leased assets, mortgages etc 5,428 5,096 5,428 5,096
Floating charges, operating equipment etc 6,227 6,366 6,227 6,366
Guarantees 1,188 1,294 1,188 1,294
Other items of collateral 262 233 262 233
Total collateral used 36,095 45,229 36,095 45,229
Particularly secured transactions (mortgage guarantees) 8,066 5,787 8,066 5,787
Total 44,161 51,016 44,161 51,016In the event that the Group uses collateral that is not immediately convertible into liquid holdings, it is the Group’s policy to dispose of such assets as quickly as possible. Real property is handed over to an estate agent. Repossessed leased equipment is sold as quickly as possible. In 2017 repossessed equipment as well as real property taken over in connection with non-performing exposures amounted to DKK 13m (2016: DKK 62m). Leased assets are assessed and depreciated on an ongoing basis. As a result the calculated collateral as regards the Group’s leasing activities will decline during periods of lower leased asset prices.
* Mortgages on real property have fallen by DKK 8,345m from DKK 20,532m in 2016 to DKK 12,187m in 2017. The decrease is primarily attributable to the amended funding agreement.
Notes

2 0 1 7 A n n u a l R e p o r t / S Y D B A N K 71
Sydbank Group
DKKm
Retail Corporate
2017
Total Retail Corporate
2016
Total
Past due amounts not impaired*
0-30 days 47 44 91 43 39 82
31-60 days 5 1 6 2 1 3
61-90 days 1 0 1 0 0 0
Total 53 45 98 45 40 85Rating category1 15 1 16 0 3 3
2 10 6 16 13 3 16
3 9 7 16 11 6 17
4 8 6 14 9 9 18
5 5 12 17 4 5 9
6 1 3 4 2 5 7
7 0 1 1 1 1 2
8 1 0 1 1 0 1
9 3 6 9 1 8 9
NR/STD 1 3 4 3 0 3
Total 53 45 98 45 40 85* Past due amounts concerning loans and advances etc not subject to individual impairment. Loans and advances and amounts owed payable
beyond 90 days are treated as impaired.
As shown above a limited share of past due amounts concerns high credit risk clients.
Note 18 Loans and advances – continued Sydbank Group
DKKmLoans/
advances GuaranteesCollateral
value
2017Unse-cured
Loans/advances Guarantees
Collateral value
2016Unse-cured
Collateral by rating categoryRating category1 8,003 3,841 9,364 2,480 14,206 2,185 12,706 3,685
2 20,037 3,504 13,220 10,321 21,714 2,219 12,759 11,174
3 16,847 2,654 8,631 10,870 19,504 2,114 10,328 11,290
4 9,367 1,079 4,642 5,804 11,139 878 4,805 7,212
5 5,677 809 2,924 3,562 6,028 554 2,807 3,775
6 3,004 365 1,574 1,795 3,434 309 1,581 2,162
7 1,292 88 414 966 1,235 149 489 895
8 380 48 142 286 664 164 345 483
9 4,889 467 2,172 3,184 5,261 332 2,142 3,451
Default 1,355 179 639 895 1,655 180 767 1,068
NR/STD 1,390 528 439 1,479 1,554 2,301 2,287 1,568
Total 72,241 13,562 44,161 41,642 86,394 11,385 51,016 46,763
Individual impairment ofloans and advances 2,381 2,381 2,726 2,726
Collective impairment ofloans and advances 300 300 385 385
Total 69,560 13,562 44,161 38,961 83,283 11,385 51,016 43,652

72 S Y D B A N K / 2 0 1 7 A n n u a l R e p o r t
Note 18 Loans and advances – continued Sydbank Group
DKKm
Loans/advances
Impaired loans/
advances
Past due loans/
advances
2017Loans/
advances neither
impairednor past
dueLoans/
advances
Impaired loans/
advances
Past due loans/
advances
2016Loans/
advances neither
impairednor past
due
Loans and advances not impaired, by rating category
1 8,003 16 7,987 12,026 3 12,023
2 20,037 16 20,021 19,955 16 19,939
3 16,847 16 16,831 17,351 17 17,334
4 9,367 14 9,353 11,139 18 11,121
5 5,677 17 5,660 6,028 9 6,019
6 3,004 4 3,000 3,434 7 3,427
7 1,292 1 1,291 1,235 2 1,233
8 380 1 379 664 1 663
9 4,889 3,468 9 1,412 5,261 3,637 9 1,615
Default 1,355 923 0 432 1,655 1,225 0 430
NR/STD 1,390 4 1,386 1,554 3 1,551
72,241 4,391 98 67,752 80,302 4,862 85 75,355
Impairment charges 2,681 2,381 300 3,111 2,726 385
Total 69,560 2,010 98 67,452 77,191 2,136 85 74,970
Sydbank Group
DKKmGross
investmentsUnearned
interest
2017Net
investmentsGross
investmentsUnearned
interest
2016Net
investments
Lease payment receivables– finance leases
1 year or less 1,647 85 1,562 1,528 99 1,429
Over 1 year not exceeding 5 years 3,859 156 3,703 3,595 158 3,437
Over 5 years 404 10 394 423 11 412
Total 5,910 251 5,659 5,546 268 5,278
Lease payment receivables comprise receivables on leasing of various operating equipment under non-cancellable leases. The leases are fixed-rate and floating-rate leases in foreign and Danish currencies.
Loans and advances at amortised cost include finance lease payment receivables of DKK 5,659m at year-end 2017 (2016: DKK 5,278m).
Impairment charges for uncollectible lease payment receivables represent DKK 0m for 2017 (2016: DKK 0m).
Notes

2 0 1 7 A n n u a l R e p o r t / S Y D B A N K 73
Note 18 Loans and advances – continued Sydbank Group
DKKm Loans/advances before
impairment charges
Individual impairment
charges
2017
Book value
Loans/advances before
impairment charges
Individual impairment
charges
2016
Book value
Non-performing loans and advances
Impaired non-defaulted loans and advances 3,468 1,654 1,814 3,637 1,811 1,826
Impaired defaulted loans and advances 923 727 196 1,225 915 310
Individually impaired loans and advances 4,391 2,381 2,010 4,862 2,726 2,136
Non-impaired defaulted loans and advances 432 432 430 430
Non-impaired loans and advances in arrears> 90 days 2 2 5 5
Total 4,825 2,381 2,444 5,297 2,726 2,571
In the table above loans and advances are defined as non-performing if they meet at least one of the following criteria:- An individual impairment charge has been registered as regards the loan/advance- It is considered unlikely that the debtor will fully meet his payment obligations without realising collateral- The loan/advance has been in arrears for more than 90 days where the amount exceeds DKK 1,000 and at the same time
represents more than 1% of the loan/advance. The loan/advance is only included here if it is not included in one of the other items.
Sydbank Group
DKKm Loans/advances and guarantees
before impairment
charges
Individual impairment
charges
2017
Book value
Loans/advances and guarantees
before impairment
charges
Individual impairment
charges
2016
Book value
Forborne loans and advances and guarantees
Impaired non-defaulted loans and advances and guarantees 107 52 55 187 105 82
Impaired defaulted loans and advances and guarantees 162 132 30 237 181 56
Individually impaired loans and advances and guarantees 269 184 85 424 286 138
Non-impaired non-defaulted loans and advances and guarantees 41 41 130 130
Non-impaired defaulted loans and advances and guarantees 606 606 589 589
Total 916 184 732 1,143 286 857
Due to financial difficulties:
- Interest rates have been reduced 338 107 231 467 133 334
- Interest-only terms have been granted 74 35 39 124 58 66
- The debt cannot be refinanced on usual terms 428 26 402 443 59 384
- Other special terms have been granted 76 16 60 109 36 73
Total 916 184 732 1,143 286 857
Forborne loans and advances and guarantees are defined as loans and advances and guarantees where:- there has been a change in loan terms that would not have been granted if the borrower had not been experiencing financial difficulties- there has been a complete or partial refinancing of a loan contract that would not have been carried out if the borrower had not
been experiencing financial difficulties.
It should be noted that individually impaired loans and advances subject to forbearance measures are also included in non-performing loans and advances.
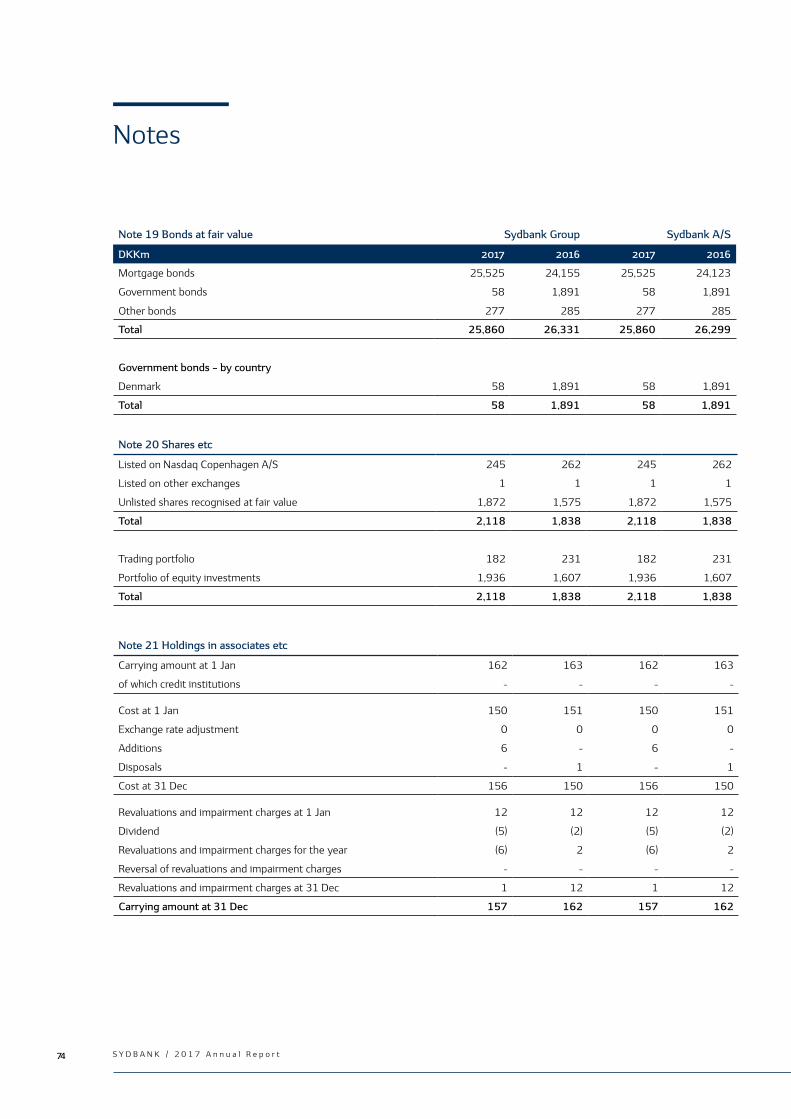
74 S Y D B A N K / 2 0 1 7 A n n u a l R e p o r t
Note 19 Bonds at fair value Sydbank Group Sydbank A/S
DKKm 2017 2016 2017 2016
Mortgage bonds 25,525 24,155 25,525 24,123
Government bonds 58 1,891 58 1,891
Other bonds 277 285 277 285
Total 25,860 26,331 25,860 26,299
Government bonds – by country
Denmark 58 1,891 58 1,891
Total 58 1,891 58 1,891
Note 20 Shares etc
Listed on Nasdaq Copenhagen A/S 245 262 245 262
Listed on other exchanges 1 1 1 1
Unlisted shares recognised at fair value 1,872 1,575 1,872 1,575
Total 2,118 1,838 2,118 1,838
Trading portfolio 182 231 182 231
Portfolio of equity investments 1,936 1,607 1,936 1,607
Total 2,118 1,838 2,118 1,838
Note 21 Holdings in associates etc
Carrying amount at 1 Jan 162 163 162 163
of which credit institutions - - - -
Cost at 1 Jan 150 151 150 151
Exchange rate adjustment 0 0 0 0
Additions 6 - 6 -
Disposals - 1 - 1
Cost at 31 Dec 156 150 156 150
Revaluations and impairment charges at 1 Jan 12 12 12 12
Dividend (5) (2) (5) (2)
Revaluations and impairment charges for the year (6) 2 (6) 2
Reversal of revaluations and impairment charges - - - -
Revaluations and impairment charges at 31 Dec 1 12 1 12
Carrying amount at 31 Dec 157 162 157 162
Notes
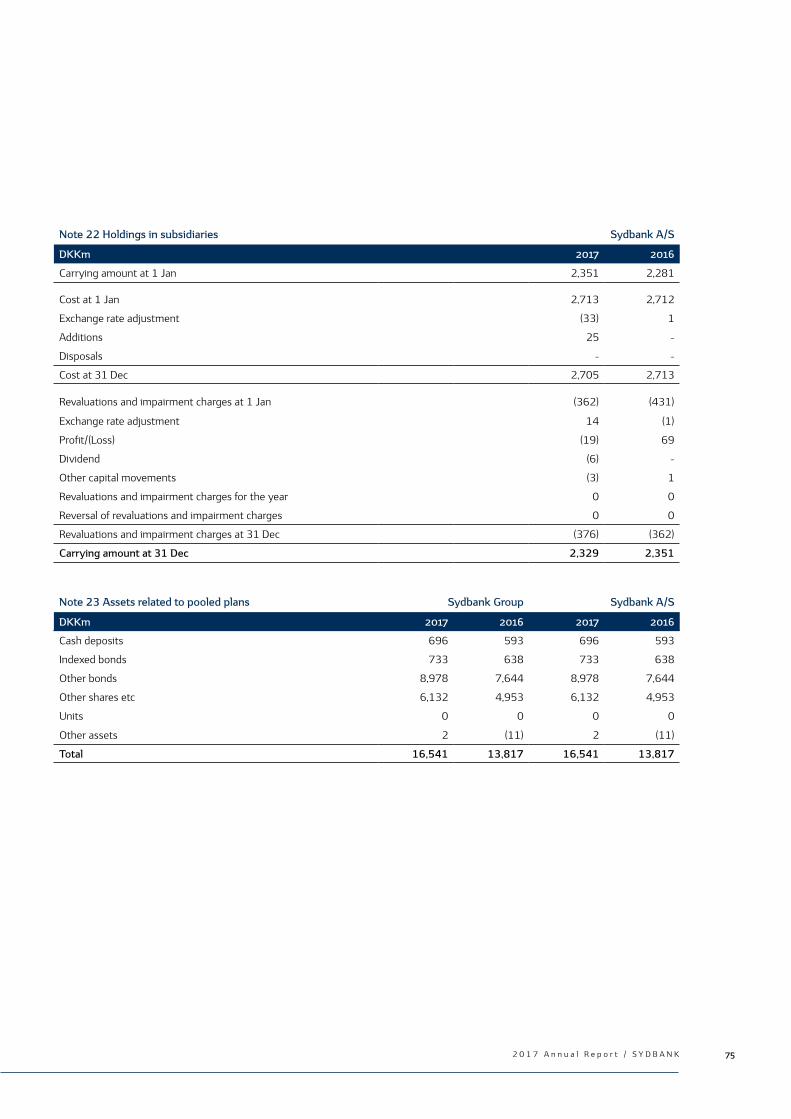
2 0 1 7 A n n u a l R e p o r t / S Y D B A N K 75
Note 23 Assets related to pooled plans Sydbank Group Sydbank A/S
DKKm 2017 2016 2017 2016
Cash deposits 696 593 696 593
Indexed bonds 733 638 733 638
Other bonds 8,978 7,644 8,978 7,644
Other shares etc 6,132 4,953 6,132 4,953
Units 0 0 0 0
Other assets 2 (11) 2 (11)
Total 16,541 13,817 16,541 13,817
Note 22 Holdings in subsidiaries Sydbank A/S
DKKm 2017 2016
Carrying amount at 1 Jan 2,351 2,281
Cost at 1 Jan 2,713 2,712
Exchange rate adjustment (33) 1
Additions 25 -
Disposals - -
Cost at 31 Dec 2,705 2,713
Revaluations and impairment charges at 1 Jan (362) (431)
Exchange rate adjustment 14 (1)
Profit/(Loss) (19) 69
Dividend (6) -
Other capital movements (3) 1
Revaluations and impairment charges for the year 0 0
Reversal of revaluations and impairment charges 0 0
Revaluations and impairment charges at 31 Dec (376) (362)
Carrying amount at 31 Dec 2,329 2,351

76 S Y D B A N K / 2 0 1 7 A n n u a l R e p o r t
Note 24 Intangible assets
Intangible assetsThe Group’s intangible assets comprise the value of customer relationships as well as goodwill acquired in connection with acquisitions. Activities acquired are allocated to the operating segments Banking, Asset Management and Sydbank Markets. Goodwill represents DKK 170m at year-end 2017 (2016: DKK 170m) and primarily concerns Banking. Goodwill is tested for impairment annually. The impairment test carried out in 2017 did not result in impairment of goodwill. The value of customer relationships represents DKK 110m at year-end 2017 (2016: DKK 130m). Customer relationships are amortised on a straight-line basis over the expected useful life of 5-15 years. Impairment testThe Group’s goodwill is tested for impairment annually and where there is any indication of impairment. The impairment test compares the carrying amount and the estimated present value of expected future cash flows. As a consequence of the special capital structure of financial groups, calculation of the present value of future cash flows is based on an equity model/dividend discount model. Future cash flows are determined on the basis of approved strategies and earnings estimates for the budget period. Earnings for the budget period are based on the budget for 2018 as approved by management which involve a steady positive development in the Bank’s core income. Earnings at the end of the budget period are subsequently projected on the basis of expected long-term growth. Annualised growth in the terminal period is assumed to represent 1.5%. Expected future cash flows are discounted at the Group’s risk-adjusted required rates of return which constitute 11.5% before tax and 9.0% after tax at year-end 2017 (2016: 11.5% before tax and 9.0% after tax). The required rate of return and consequently the discount rate are based on current market data and external benchmarks. The impairment test conducted does not indicate any impairment at 31 December 2017. An increase in the Group’s risk-adjusted required rate of return from 11.5% to for instance 15% would not result in a goodwill impairment. Correspondingly a decline in estimated growth in the terminal period of 1 percentage point would not result in impairment. In addition a decrease in earnings of 20% for the terminal period would not result in impairment.
Notes

2 0 1 7 A n n u a l R e p o r t / S Y D B A N K 77
Note 25 Owner-occupied property
Carrying amount at 1 Jan 986 1,012 816 831
Exchange rate adjustment 0 0 0 0
Additions, including improvements 120 23 48 10
Disposals 18 26 18 12
Depreciation for the year 7 7 5 6
Value adjustment recognised directly in equity 15 3 18 3
Value adjustment recognised in the income statement (21) (19) (2) (10)
Carrying amount at 31 Dec 1,075 986 857 816
Required rate of return of return applied to calculate fair value (%) 4.5-11.0 5.0-10.0 4.5-11.0 5.0-10.0
Sensitivity analysis: Other things being equal an increase of 0.5 percentage points in the required rate of return will reduce fair value by DKK 69m (2016: DKK 61m).
Note 24 Intangible assets – continued Sydbank Group Sydbank A/S
DKKm 2017 2016 2017 2016
Carrying amount at 1 Jan 303 324 300 321
Cost at 1 Jan 389 389 384 384
Additions - - - -
Disposals - - - -
Cost at 31 Dec 389 389 384 384
Amortisation and impairment charges at 1 Jan 86 65 84 63
Amortisation and impairment charges for the year 22 21 20 21
Amortisation and impairment charges at 31 Dec 108 86 104 84
Carrying amount at 31 Dec 281 303 280 300
The value of customer relationships is amortised over 5-15 years.

78 S Y D B A N K / 2 0 1 7 A n n u a l R e p o r t
Note 26 Other property, plant and equipment Sydbank Group Sydbank A/S
DKKm 2017 2016 2017 2016
Carrying amount at 1 Jan 69 68 69 68
Cost at 1 Jan 470 435 470 435
Exchange rate adjustment 0 0 0 0
Additions 76 71 76 71
Disposals 27 36 27 36
Cost at 31 Dec 519 470 519 470
Amortisation and impairment charges at 1 Jan 401 367 401 367
Exchange rate adjustment 0 0 0 0
Depreciation for the year 73 68 73 68
Reversal of depreciation and impairment charges 26 34 26 34
Amortisation and impairment charges at 31 Dec 448 401 448 401
Carrying amount at 31 Dec 71 69 71 69
Note 27 Other assets
Positive market value of derivatives etc 5,275 7,289 5,275 7,289
Sundry debtors 432 440 428 434
Interest and commission receivable 159 178 159 178
Cash collateral provided, CSA agreements 2,230 2,834 2,230 2,834
Other assets 3 1 3 2
Total 8,099 10,742 8,095 10,737
Note 28 Amounts owed to credit institutions and central banks
Amounts owed to central banks 47 36 47 36
Amounts owed to credit institutions 5,913 17,520 6,137 17,764
Total 5,960 17,556 6,184 17,800
On demand 1,476 803 1,700 1,046
3 months or less 4,474 10,955 4,474 10,955
Over 3 months not exceeding 1 year 10 374 10 374
Over 1 year not exceeding 5 years 0 17 0 17
Over 5 years 0 5,407 0 5,408
Total 5,960 17,556 6,184 17,800
Of which repo transactions 2,538 8,019 2,538 8,019
Notes

2 0 1 7 A n n u a l R e p o r t / S Y D B A N K 79
Note 29 Deposits and other debt Sydbank Group Sydbank A/S
DKKm 2017 2016 2017 2016
On demand 67,803 65,717 69,867 67,746
At notice 2,518 5,237 2,518 5,237
Time deposits 7,617 4,945 7,617 4,945
Special categories of deposits 4,752 5,210 4,752 5,210
Total 82,690 81,109 84,754 83,138
On demand 68,207 66,157 70,271 68,186
3 months or less 8,436 9,222 8,436 9,222
Over 3 months not exceeding 1 year 2,248 1,185 2,248 1,185
Over 1 year not exceeding 5 years 486 877 486 877
Over 5 years 3,313 3,668 3,313 3,668
Total 82,690 81,109 84,754 83,138
Of which repo transactions 2,460 2,288 2,460 2,288
Note 30 Bonds issued at amortised cost
Over 3 months not exceeding 1 year 3,722 - 3,722 -
Over 1 year not exceeding 5 years - 3,714 - 3,714
Total 3,722 3,714 3,722 3,714
Note 31 Other liabilities
Negative market value of derivatives etc 5,342 7,589 5,342 7,589
Sundry creditors 3,940 4,236 3,927 4,225
Negative portfolio, reverse transactions 5,295 3,355 5,295 3,355
Interest and commission etc 35 34 30 34
Cash collateral received, CSA agreements 751 973 751 973
Total 15,363 16,187 15,345 16,176
Note 32 Provisions
Provisions for pensions and similar obligations 3 3 3 3
Provisions for deferred tax 203 165 201 163
Provisions for guarantees 172 126 172 126
Other provisions 56 79 56 79
Total 434 373 432 371

80 S Y D B A N K / 2 0 1 7 A n n u a l R e p o r t
Note 33 Subordinated capital Sydbank Group Sydbank A/S
Interest rate Note Nominal (m) Maturity 2017DKKm
2016 2017DKKm
2016
2.13 (fixed) 1 Bond loan EUR 100 11 Mar 2027 740 738 740 738
1.52 (floating) 2 Bond loan EUR 75 2 Nov 2029 556 - 556 -
Total Tier 2 capital 1,296 738 1,296 738
Redeemed loans - 828 - 828
1.03 (floating) 3 Bond loan EUR 75 Perpetual 558 558 558 558
Total Additional Tier 1 capital 558 1,386 558 1,386
Total subordinated capital 1,854 2,124 1,854 2,124
1) Optional redemption from 11 March 2022 after which the interest rate will be fixed at 1.72% above 5Y Mid-Swap.2) Optional redemption from 2 November 2024 after which the interest rate will be fixed at 1.85% above 3M EURIBOR.3) The interest rate follows a 10Y Mid-Swap plus a premium of 0.2%.
Over 1 year not exceeding 5 years 740 - 740 -
Over 5 years 1,114 2,124 1,114 2,124
Total 1,854 2,124 1,854 2,124
Costs relating to the raising and redemption of subordinated capital 0 0 0 0
Note 32 Provisions – continued Sydbank Group
DKKm 2017
Provisionsfor pensions and
similar obligations
Provisionsfor deferred
tax
Provisionsfor
guaranteesOther
provisionsTotal
provisions
Carrying amount at 1 Jan 3 165 126 79 373
Additions - 38 140 1 179
Disposals 0 - 94 24 118
Carrying amount at 31 Dec 3 203 172 56 434
Other provisions mainly concern provisions for onerous contracts and legal actions.
Correlation between subordinated capital and financing activities in cash flow statement
DKKm Cash flows Non-cash changes
1 Jan 2017 Raising Redemption Exchange rate Other 31 Dec 2017
Subordinated capital 2,124 558 (830) 4 (2) 1,854
Fair value changes comprise the impact of market value adjustments and transaction costs. Cash flows from raised and redeemed debt are based on the exchange rate on the date of transaction. The note shows changes in the nominal value of subordinated capital. Raising and redemption amounts are based on the exchange rate at the balance sheet date.
Notes
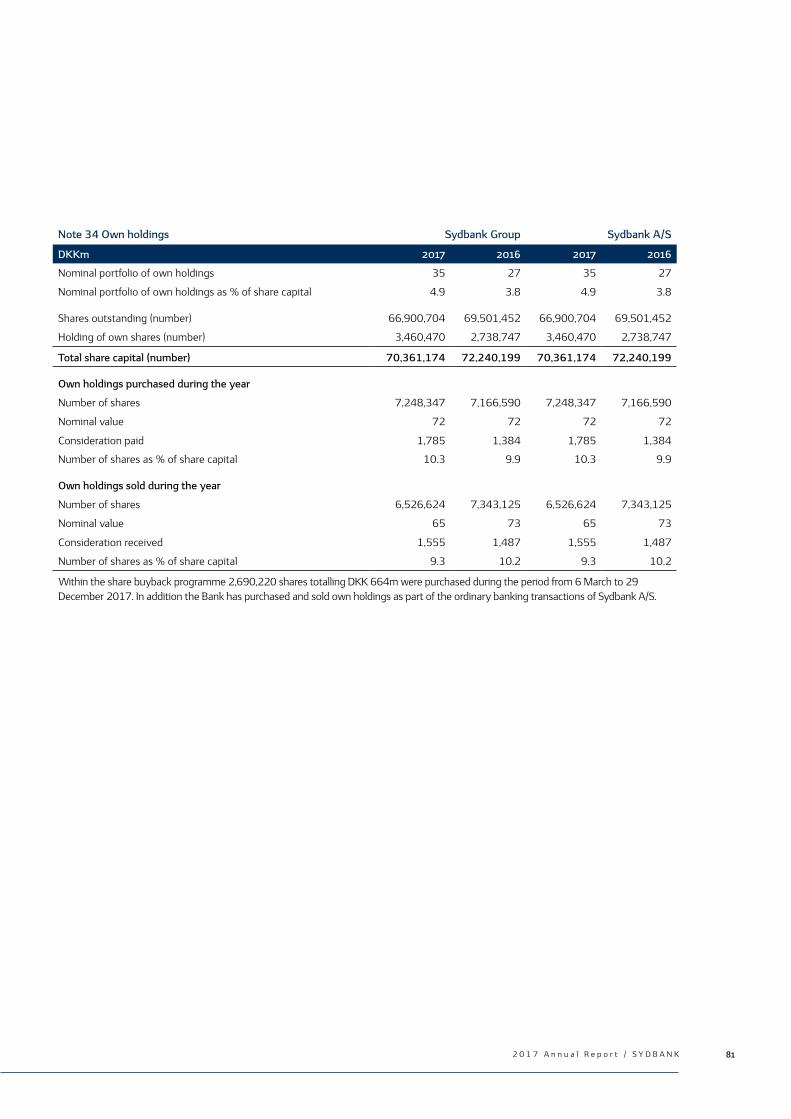
2 0 1 7 A n n u a l R e p o r t / S Y D B A N K 81
Note 34 Own holdings Sydbank Group Sydbank A/S
DKKm 2017 2016 2017 2016
Nominal portfolio of own holdings 35 27 35 27
Nominal portfolio of own holdings as % of share capital 4.9 3.8 4.9 3.8
Shares outstanding (number) 66,900,704 69,501,452 66,900,704 69,501,452
Holding of own shares (number) 3,460,470 2,738,747 3,460,470 2,738,747
Total share capital (number) 70,361,174 72,240,199 70,361,174 72,240,199
Own holdings purchased during the year
Number of shares 7,248,347 7,166,590 7,248,347 7,166,590
Nominal value 72 72 72 72
Consideration paid 1,785 1,384 1,785 1,384
Number of shares as % of share capital 10.3 9.9 10.3 9.9
Own holdings sold during the year
Number of shares 6,526,624 7,343,125 6,526,624 7,343,125
Nominal value 65 73 65 73
Consideration received 1,555 1,487 1,555 1,487
Number of shares as % of share capital 9.3 10.2 9.3 10.2
Within the share buyback programme 2,690,220 shares totalling DKK 664m were purchased during the period from 6 March to 29 December 2017. In addition the Bank has purchased and sold own holdings as part of the ordinary banking transactions of Sydbank A/S.

82 S Y D B A N K / 2 0 1 7 A n n u a l R e p o r t
Note 35 Contingent liabilities and other obligating agreements Sydbank Group Sydbank A/S
DKKm 2017 2016 2017 2016
Contingent liabilities
Financial guarantees 3,793 3,880 3,793 3,880
Mortgage finance guarantees 2,904 2,550 2,904 2,550
Mortgage-like loan guarantees 1,745 - 1,745 -
Registration and remortgaging guarantees 3,417 3,237 3,417 3,237
Other contingent liabilities 1,703 1,718 1,703 1,718
Total 13,562 11,385 13,562 11,385
Other obligating agreements
Irrevocable credit commitments 1,285 895 1,285 895
Other liabilities* 40 30 88 43
Total 1,325 925 1,373 938
* Including intra-group liabilities in relation to rented premises - - 48 13
Totalkredit loans arranged by Sydbank are comprised by an agreed right of set-off against future current commission which
Totalkredit may invoke in the event of losses on the loans arranged.
Sydbank does not expect that this set-off will have a significant impact on Sydbank’s financial position.
As a result of the Bank’s membership of Bankdata, the Bank will be obligated to pay an exit charge in the event of exit.
As a result of the statutory participation in the deposit guarantee scheme, the industry has paid an annual contribution of 2.5‰ of
covered net deposits until the Banking Department’s capital exceeds 1% of total covered net deposits, which was reached at year-
end 2015. The Banking Department will cover the direct losses in connection with the winding-up of distressed financial institutions
under Bank Package III and Bank Package IV which are attributable to covered net deposits. Any losses as a result of the final winding-
up will be covered by the Guarantee Fund via the Winding-up and Restructuring Department as regards which Sydbank is currently
liable for 6.84% of any losses.
As a result of the statutory participation in the resolution financing arrangement (the Resolution Fund), credit institutions will pay an
annual contribution over a 10-year period to reach a target funding level totalling 1% of covered deposits. Credit institutions must
make contributions to the fund according to their relative size and risk in Denmark. Sydbank expects that contributions will total
approximately DKK 200m over a 10-year period.
The Group is party to a number of legal actions. These actions are under continuous review and the necessary provisions made are
based on an assessment of the risk of loss. Pending legal actions are not expected to have any significant impact on the financial
position of the Group.
Notes

2 0 1 7 A n n u a l R e p o r t / S Y D B A N K 83
Note 36 Fair value hedging of interest rate risks (macro hedge)
Sydbank adopts a cash flow model for managing interest rate risk on all positions other than Danish callable mortgage bonds. The model is updated daily with all the Bank’s positions. These are allocated to portfolios according to responsibility and product.
One of these portfolios consists of the Bank’s positions in fixed-rate loans and advances, including leasing, fixed-rate deposits and related hedging transactions. To ensure interest rate risk management of this portfolio, the model generates a synthetic cash flow to describe the Bank’s risk position at selected interest rate points.
The Bank’s basis for concluding hedging transactions – primarily interest rate swaps – is thus a synthetic net cash flow based on the actual cash flow of loans and advances, deposits and previously concluded hedging transactions in the relevant portfolio. The aim is to keep the interest rate risk in this portfolio at a minimum as the Bank wishes to place its interest rate risk in other portfolios containing bonds and other cash equivalent positions.
The Group applies the rules on macro hedge which aim to ensure symmetry between income and expense in the financial statements.Symmetry is achieved by making a hedge adjustment corresponding to the part of the market value adjustment of derivatives which concerns future periods. This hedge adjustment is recorded under “Other assets” and represents DKK 32m as at 31 December 2017 (2016: DKK 38m).
During the year a net loss on hedging transactions of DKK 7m (2016: net gain of DKK 1m) was recorded. The loss eliminates a corresponding net gain on hedged items.
Sydbank Group Sydbank A/S
DKKm 2017 2016 2017 2016
Fixed-rate loans and advances
Carrying amount 2,351 2,232 2,351 2,232
Fixed-rate deposits
Carrying amount 1,316 3,901 1,316 3,901
The following derivatives are used to hedge the above:
Swaps
Principal 3,641 2,615 3,641 2,615
Fair value 49 31 49 31

84 S Y D B A N K / 2 0 1 7 A n n u a l R e p o r t
Note 37 Collateral
At the end of 2017 the Group had deposited as collateral securities at a market value of DKK 4,769m with Danish and foreign exchanges and clearing centres etc in connection with margin calls and securities settlements etc. In addition the Group has provided cash collateral in connection with CSA agreements of DKK 2,230m.
In connection with repo transactions, which involve selling securities to be repurchased at a later date, the securities remain on the balance sheet and consideration received is recognised as a debt. Repo transaction securities are treated as assets provided as collateral for liabilities. Counterparties are entitled to sell the securities or deposit them as collateral for other loans.
In connection with reverse transactions, which involve purchasing securities to be resold at a later date, the Group is entitled to
sell the securities or deposit them as collateral for other loans. The securities are not recognised in the balance sheet and
consideration paid is recognised as a receivable.
Assets received as collateral in connection with reverse transactions may be sold to a third party. In such cases a negative
portfolio may arise as a result of the accounting rules. This is recognised under “Other liabilities”.
Sydbank Group Sydbank A/S
DKKm 2017 2016 2017 2016
Assets sold as part of repo transactions
Bonds at fair value 4,982 10,435 4,982 10,435
Assets purchased as part of reverse transactions
Bonds at fair value 10,082 7,763 10,082 7,763
Notes

2 0 1 7 A n n u a l R e p o r t / S Y D B A N K 85
Sydbank Group Sydbank A/S
DKKm 2017 2016 2017 2016
Amounts owed by and to subsidiaries etc
Amounts owed by credit institutions and central banks - - - -
Loans and advances at amortised cost - - 201 167
Total asset items - - 201 167
Amounts owed to credit institutions - - 224 244
Deposits and other debt - - 2,064 2,030
Total liability items - - 2,288 2,274
Note 38 Related parties
DKKm
Associates Board of
Directors
2017Group
Executive Management Associates
Board of Directors
2016Group
Executive Management
Loans and advances and loan commitments 249 8 - 257 15 -
Deposits and other debt 1 16 5 1 10 6
Guarantees issued - - 2 - - -
Collateral received - 2 - - 2 -
Interest income 2 0 0 0 0 0
Interest expense 0 0 0 0 0 0
Fee and commission income 0 0 0 0 0 0
Other expenses 463 - - 443 - -
Interest rates 2017: Group Executive Management: No loans and advancesBoard of Directors: 0.50-7.65% p.a.** Interest rates concern loans in different currencies.
There are no parties with significant influence over Sydbank A/S (ownership share of at least 20%). The Board of Directors and the Group Executive Management columns comprise the Group’s exposures to and transactions with members of the Board of Directors and the Group Executive Management as well as their dependants. Further information on the remuneration of management appears from note 13.
Other expenses include primarily IT costs to Bankdata.
Transactions with related parties are settled on an arm’s length basis and are subject to the terms and conditions in force. No unusual transactions took place with related parties in 2017.

86 S Y D B A N K / 2 0 1 7 A n n u a l R e p o r t
Note 38 Related parties – continued Sydbank Group
Number
1 Jan 2017
On appointment/
resignation Additions Disposals31 Dec
2017Sydbank A/S shares held by
Board of Directors (personal holdings)
Torben Nielsen (Chairman) 4,000 1,500 5,500
Peder Damgaard (Vice-Chairman) 966 966
Svend Erik Busk 1,500 (1,500) 0
Alex Slot Hansen 57 57
John Lesbo 0 208 208
Lars Mikkelgaard-Jensen 2,000 2,000
Janne Moltke-Leth 51 42 93
Frank Møller Nielsen 1,537 199 1,736
Jacob Chr. Nielsen 77 77
Jarl Oxlund 1,200 1,200
Bo Normann Rasmussen 401 (401) 0
Margrethe Weber 2,106 2,106
Total 13,895 (1,693) 1,741 - 13,943
Board of Directors (own holdings and holdings by dependants)
Torben Nielsen (Chairman) 4,000 1,500 5,500
Peder Damgaard (Vice-Chairman) 1,016 1,016
Svend Erik Busk 1,500 (1,500) 0
Alex Slot Hansen 57 57
John Lesbo 0 208 208
Lars Mikkelgaard-Jensen 2,000 2,000
Janne Moltke-Leth 51 42 93
Frank Møller Nielsen 1,537 199 1,736
Jacob Chr. Nielsen 77 77
Jarl Oxlund 1,200 1,200
Bo Normann Rasmusen 401 (401) 0
Margrethe Weber 2,106 2,106
Total 13,945 (1,693) 1,741 - 13,993
Group Executive Management(own holdings and holdings of dependants)
Karen Frøsig 3,766 3,766
Bjarne Larsen 1,967 1,967
Jan Svarre 2,300 2,300
Total 8,033 - - - 8,033
Total 21,978 (1,693) 1,741 - 22,026
Notes

2 0 1 7 A n n u a l R e p o r t / S Y D B A N K 87
Note 39 Fair value disclosure
Financial instruments are included in the balance sheet either at fair value or at amortised cost. The table below breaks down financial instruments by valuation technique.
Sydbank Group
DKKm
Fair value
2017Amortised
cost Fair value
2016Amortised
cost
Financial assets
Cash and balances on demand at central banks - 2,115 - 2,047
Amounts owed by credit institutions and central banks 4,892 7,587 1,652 5,329
Loans and advances at fair value 5,248 - 6,092 -
Loans and advances at amortised cost - 64,312 - 77,191
Bonds at fair value 25,860 - 26,331 -
Shares etc 2,118 - 1,838 -
Assets related to pooled plans 16,541 - 13,817 -
Other assets 5,352 2,747 7,382 3,360
Total 60,011 76,761 57,112 87,927
Undrawn credit facilities - 43,569 - 44,772
Maximum credit risk,collateral not considered 60,011 120,330 57,112 132,699
Financial liabilities
Amounts owed to credit institutions and central banks 2,538 3,422 8,019 9,537
Deposits and other debt 2,460 80,230 2,288 78,821
Deposits in pooled plans 16,541 - 13,825 -
Bonds issued at amortised cost - 3,722 - 3,714
Other liabilities 10,638 4,725 10,945 5,242
Subordinated capital - 1,854 - 2,124
Total 32,177 93,953 35,077 99,438
Financial instruments recognised at fair valueMeasurement of financial instruments is based on quoted prices from an active market, on generally accepted valuation models with observable market data or on available data that only to a limited extent are observable market data.
Measurement of financial instruments for which prices are quoted in an active market or which is based on generally accepted valuation models with observable market data is not subject to significant estimates.
As regards financial instruments where measurement is based on available data that only to a limited extent are observable market data, measurement is subject to estimates. Such financial instruments appear from the column unobservable inputs below and include primarily unlisted shares, including shares in DLR Kredit A/S.
The fair value of unlisted shares and other holdings is calculated on the basis of available information on trades etc – including to a very significant extent on shareholders’ agreements based on book value. To an insignificant extent fair value is calculated on the basis of expected cash flows.
A 10% change in the calculated market value of financial assets measured on the basis of unobservable inputs will affect profit before tax by DKK 182m.

88 S Y D B A N K / 2 0 1 7 A n n u a l R e p o r t
Note 39 Fair value disclosure – continued Sydbank Group
DKKmQuoted
pricesObservable
inputsUnobservable
inputsTotal
fair value
2017
Financial assets
Amounts owed by credit institutions and central banks - 4,892 - 4,892
Loans and advances at fair value - 5,248 - 5,248
Bonds at fair value - 25,860 - 25,860
Shares etc 246 50 1,822 2,118
Assets related to pooled plans 6,132 10,409 - 16,541
Other assets 30 5,322 - 5,352
Total 6,408 51,781 1,822 60,011
Financial liabilities
Amounts owed to credit institutions and central banks - 2,538 - 2,538
Deposits and other debt - 2,460 - 2,460
Deposits in pooled plans - 16,541 - 16,541
Other liabilities 36 10,602 - 10,638
Total 36 32,141 - 32,177
2016
Financial assets
Amounts owed by credit institutions and central banks - 1,652 - 1,652
Loans and advances at fair value - 6,092 - 6,092
Bonds at fair value - 26,331 - 26,331
Shares etc 263 18 1,557 1,838
Assets related to pooled plans 4,953 8,864 - 13,817
Other assets 30 7,352 - 7,382
Total 5,246 50,309 1,557 57,112
Financial liabilities
Amounts owed to credit institutions and central banks - 8,019 - 8,019
Deposits and other debt - 2,288 - 2,288
Deposits in pooled plans - 13,825 - 13,825
Other liabilities 17 10,928 - 10,945
Total 17 35,060 - 35,077
Notes

2 0 1 7 A n n u a l R e p o r t / S Y D B A N K 89
Note 39 Fair value disclosure – continued Sydbank Group
DKKm 2017 2016
Assets measured on the basis of unobservable inputs
Carrying amount at 1 Jan 1,557 1,493
Additions 160 9
Disposals 33 25
Market value adjustment 138 80
Value at 31 Dec 1,822 1,557
Recognised in profit for the year
Interest income - -
Dividend 28 38
Market value adjustment 138 80
Total 166 118
To take into account changes in credit risk concerning derivatives with positive fair value, an adjustment is made – CVA. CVA is a function of the risk of counterparty default (PD), the expected positive exposure and the loss ratio in the event of default. PD is determined on the basis of the Group’s credit models – default probability in 12 months. PD beyond 12 months is adjusted on the basis of market data of exposures with a similar PD level. At year-end 2017 CVA constitutes DKK 37m compared to DKK 56m at year-end 2016.
Client margins recognised in connection with derivatives are amortised over the life of the transaction. At year-end 2017 client margins presently not recognised as income total DKK 34m compared to DKK 36m at year-end 2016.
Financial instruments recognised at amortised costThe vast majority of the Group’s amounts owed, loans and advances and deposits cannot be transferred without the prior consent of clients and no active market exists for trading in such financial instruments. Consequently fair value disclosures are solely based on circumstances where market conditions have changed after the initial recognition of the instrument, including in particular changes in interest rates. Fair value disclosures on financial instruments recognised at amortised cost are based on the assumptions below:
• As regards financial instruments for which a quoted price exists in the market, such a price is applied. This applies to bonds
issued and subordinated capital. In the absence of a market price, the value is determined on the basis of estimates of the
market’s existing required rate of return.
• As regards loans and advances, impairment charges are presumed to equal the fair value of the credit risk.
• As regards financial instruments with a maturity of less than 6 months, amortised cost is presumed to equal fair value.
• As a rule the interest rate risk of fixed-rate deposits and loans and advances with a maturity exceeding 6 months is hedged by
derivatives, primarily interest rate swaps. The hedge is treated as a fair value hedge for accounting purposes. As a result of
the application of these rules this portfolio, taken as a whole, is recognised at fair value in the balance sheet. The portfolio
comprises loans and advances, deposits and swaps, see note 36.
Based on the above it is the overall assessment that the fair value of loans and advances and deposits corresponds to the carrying
amount at 31 December 2017 in all material respects.
Sydbank Group
DKKm 2017 2016
Carrying amount Fair value
Carrying amount Fair value
Bonds issued at amortised cost 3,722 3,726 3,714 3,714
Subordinated capital 1,854 1,833 2,124 1,867

90 S Y D B A N K / 2 0 1 7 A n n u a l R e p o r t
Note 40 Financial liabilities – contractual maturities Sydbank Group
DKKm
On demand3 months or
less
Over 3 monthsnot exceeding
1 year
Over 1 year not exceed-ing 5 years
Over 5 years
2017
Amounts owed to credit institutions and central banks 1,476 4,474 10 - -
Deposits and other debt 68,207 8,436 2,248 486 3,313
Bonds issued at amortised cost - - 3,722 - -
Subordinated capital - - - 740 1,114
Total 69,683 12,910 5,980 1,226 4,427
Contingent liabilities (guarantees) 8,237 3,724 980 394 227
2016
Amounts owed to credit institutions and central banks 802 10,955 374 17 5,408
Deposits and other debt 66,157 9,222 1,185 877 3,668
Bonds issued at amortised cost - - - 3,714 -
Subordinated capital - - - - 2,124
Total 66,959 20,177 1,559 4,608 11,200
Contingent liabilities (guarantees) 6,558 3,431 713 444 239
Amounts are exclusive of interest.
Note 41 Activity per country Sydbank Group
DKKm
TurnoverNumber ofemployees
Profit/(Loss) before tax Tax
Publicsubsidies received
2017
Denmark, banking and leasing 4,070 1,998 1,908 408 -
Germany, banking 185 66 50 17 -
Switzerland, in liquidation - - (2) 0 -
Total 4,255 2,064 1,956 425 -
2016
Denmark, banking and leasing 4,423 1,968 1,790 374 -
Germany, banking 184 69 80 23 -
Switzerland, in liquidation - - (1) 0 -
Total 4,607 2,037 1,869 397 -
Turnover is defined as interest income, fee and commission income and other operating income.
Notes

2 0 1 7 A n n u a l R e p o r t / S Y D B A N K 91
Note 42 Financial highlights Sydbank Group
2017 2016 2015 2014 2013
Income statement highlights (DKKm)
Net interest and fee income 3,856 4,002 4,170 4,297 4,165
Market value adjustments 727 553 251 391 474
Staff costs and administrative expenses 2,537 2,487 2,455 2,497 2,314
Impairment of loans and advances etc (45) 98 311 692 1,861
Profit/(Loss) on holdings in associates etc (7) 2 5 9 2
Profit for the year 1,531 1,472 1,148 1,052 187
Balance sheet highlights (DKKbn)
Loans and advances 69.6 83.3 84.4 75.3 71.5
Shareholders’ equity 11.9 11.8 11.4 11.3 10.2
Total assets 138.5 146.7 142.7 152.3 147.9
Financial ratios per share (DKK per share of DKK 10)
EPS Basic 22.4 20.9 15.5 14.2 2.5
Book value 178.3 169.2 160.2 154.2 139.7
Dividend 11.31 10.46 11.12 7.08 -
Share price/EPS 11.2 10.5 14.3 13.4 56.7
Share price/book value 1.40 1.30 1.38 1.23 1.03
Other financial ratios and key figures
Capital ratio 20.8 19.2 17.6 16.0 15.7
Tier 1 capital ratio 17.7 17.4 15.9 15.5 15.3
Pre-tax profit as % of average shareholders’ equity 16.5 16.1 13.0 12.3 1.7
Post-tax profit as % of average shareholders’ equity 12.9 12.7 10.1 9.8 1.8
Income/cost ratio (DKK) 1.74 1.69 1.49 1.39 1.04
Interest rate risk 0.8 1.6 2.8 0.0 0.6
Foreign exchange position 1.2 2.2 2.2 1.8 2.1
Foreign exchange risk 0.0 0.0 0.0 0.0 0.0
Loans and advances relative to deposits 0.7 0.8 1.0 0.8 0.9
Loans and advances relative to shareholders’ equity 5.8 6.6 7.4 6.7 7.0
Growth in loans and advances for the year (16.7) 3.9 8.5 2.8 (3.7)
Excess cover relative to statutory liquidity requirements(section 152 of the Danish Financial Business Act) 232.1 186.5 166.8 142.2 179.8
Total large exposures 0.0 0.0 0.0 0.0 25.8
Impairment ratio for the year (0.1) 0.1 0.3 0.7 2.2
Return on assets (%) 1.07 1.02 0.78 0.70 0.12
Financial highlights and financial ratios are specified in the Danish FSA’s executive order on financial reporting of credit institutions etc.

92 S Y D B A N K / 2 0 1 7 A n n u a l R e p o r t
Note 42 Financial highlights – continued Sydbank A/S
2017 2016 2015 2014 2013
Income statement highlights (DKKm)
Net interest and fee income 3,789 3,835 4,116 4,302 4,160
Market value adjustments 727 553 252 391 474
Staff costs and administrative expenses 2,482 2,431 2,413 2,505 2,316
Impairment of loans and advances etc (45) 98 311 692 1,861
Profit/(Loss) on holdings in associates etc (26) 71 (23) 7 (69)
Profit for the year 1,531 1,472 1,148 1,052 187
Balance sheet highlights (DKKbn)
Loans and advances 69.8 83.5 84.6 75.5 69.3
Shareholders’ equity 11.9 11.8 11.4 11.3 10.2
Total assets 140.8 148.9 144.9 152.8 143.8
Financial ratios per share (DKK per share of DKK 10)
EPS Basic 22.4 20.9 15.5 14.2 2.5
Book value 178.3 169.2 160.2 154.2 139.7
Dividend 11.31 10.46 11.12 7.08 -
Share price/EPS 11.2 10.5 14.3 13.4 56.7
Share price/book value 1.40 1.30 1.38 1.23 1.03
Other financial ratios and key figures
Capital ratio 20.1 18.7 17.2 16.0 16.0
Tier 1 capital ratio 17.2 16.8 15.5 15.4 15.8
Pre-tax profit as % of average shareholders’ equity 16.4 15.9 12.8 12.2 1.9
Post-tax profit as % of average shareholders’ equity 12.9 12.7 10.1 9.8 1.8
Income/cost ratio (DKK) 1.76 1.69 1.50 1.39 1.04
Interest rate risk 0.8 1.6 2.8 0.0 0.7
Foreign exchange position 1.2 2.2 2.2 1.8 2.1
Foreign exchange risk 0.0 0.0 0.0 0.0 0.0
Loans and advances relative to deposits 0.7 0.9 0.9 0.9 1.0
Loans and advances relative to shareholders’ equity 5.8 7.1 7.4 6.7 6.8
Growth in loans and advances for the year (16.6) 3.9 8.5 6.5 (6.8)
Excess cover relative to statutory liquidity requirements (section 152 of the Danish Financial Business Act) 226.8 182.0 162.8 141.4 175.2
Total large exposures 0.0 0.0 0.0 0.0 15.3
Impairment ratio for the year (0.1) 0.1 0.3 0.7 2.3
Return on assets (%) 1.06 1.00 0.77 0.71 0.13
Financial highlights and financial ratios are specified in the Danish FSA’s executive order on financial reporting of credit institutions etc.
Notes

2 0 1 7 A n n u a l R e p o r t / S Y D B A N K 93
Note 43 Reporting events occurring after the balance sheet date
No matters of significant impact on the financial position of the Group have occurred after the expiry of the financial year.
Note 44 Group holdings and enterprises Sydbank Group
31 December 2017 ActivityShare capital
(m)Shareholders’
equity (DKKm)Profit/(Loss)
(DKKm)
Ownership share
(%)
Sydbank A/S DKK 704
Consolidated subsidiaries
DiBa A/S, Aabenraa Investment DKK 300 2,032 (4) 100
Ejendomsselskabet af 1. juni 1986 A/S, Aabenraa Real property
DKK 11 11 (14) 100
Syd Fund Management A/S,Aabenraa Administration
DKK 40 48 8 100
Sydbank (Schweiz) AG in Liquidation,St. Gallen, Switzerland* -
CHF 40 226 (2) 100
Holdings in associates
Foreningen Bankdata, Fredericia** IT DKK 510 510 (34) 32
Komplementarselskabet Core Property Management A/S, Copenhagen** Real property DKK 10 29 15 20
Core Property Management P/S, Copenhagen Real property
DKK 10 10 - 20
* With no significant activity at 31 December 2017.** Financial information according to the companies’ most recently published annual reports (2016).
Note 45 Large shareholders
On 21 July 2017 Silchester International Investors LLP, London, announced that the company has reduced its holding of shares in Sydbank A/S to below 5%. Subsequently Sydbank has no large shareholders.

94 S Y D B A N K / 2 0 1 7 A n n u a l R e p o r t
Definitions –Group Financial Ratios & Performance Measures
Financial ratio/performance measure Definition
EPS Basic (DKK) Profit for the year divided by average number of shares outstanding.
EPS Diluted (DKK) Profit for the year divided by average number of shares outstanding, including dilutive effect of share options and restricted shares.
Share price at year-end Closing price of the Sydbank share at year-end.
Book value per share (DKK) Shareholders’ equity at year-end divided by number of shares outstanding at year-end
Common Equity Tier 1 capital ratio Common Equity Tier 1 capital divided by risk exposure amount.
Tier 1 capital ratio Tier 1 capital divided by risk exposure amount.
Capital ratio Total capital divided by risk exposure amount.
Pre-tax profit as % of average shareholders’ equity
Pre-tax profit divided by quarterly average shareholders’ equity calculated as an average of shareholders’ equity of the year’s 4 quarters at year-end.
Post-tax profit as % of average shareholders’ equity
Post-tax profit divided by quarterly average shareholders’ equity calculated as an average of shareholders’ equity of the year’s 4 quarters at year-end.
Return on assets (%) Profit for the year divided by total average assets.
Loans and advances relative to deposits Loans and advances at amortised cost divided by deposits (deposits and other debt and deposits in pooled plans).
Loans and advances relative to shareholders’ equity
Loans and advances at amortised cost divided by shareholders’ equity.
Growth in loans and advances for the year Calculated on the basis of loans and advances at amortised cost.
Accumulated impairment ratio Impairment charges and provisions at year-end (allowance account) divided by loans and advances at amortised cost and guarantees before impairment charges and provisions.
Impairment ratio for the year Impairment charges for loans and advances etc divided by loans and advances at amortised cost and guarantees before impairment charges and provisions.
Number of full-time staff at year-end Number of full-time equivalent staff (part-time staff translated into full-time staff) at year-end.
Reference is made to “Accounting policies” (note 1) for a definition of core income and investment portfolio earnings.

2 0 1 7 A n n u a l R e p o r t / S Y D B A N K 95

96 S Y D B A N K / 2 0 1 7 A n n u a l R e p o r t
Notes – Derivatives
Distribution by maturity
DKKm
3 months or less
Over 3 months not
exceeding1 year
Over 1year not
exceeding5 years Over 5 years Total 2017 Total 2016
Nominal values
Foreign exchange contracts:
Spot, bought 2,303 - - - 2,303 2,843
Spot, sold 3,963 - - - 3,963 1,121
Forwards/futures, bought 18,557 3,046 255 0 21,858 28,008
Forwards/futures, sold 17,157 3,452 289 0 20,897 29,205
Swaps 67 7 146 630 850 1,374
Options, acquired 1,430 835 100 0 2,365 3,851
Options, written 1,207 644 50 0 1,900 3,157
Interest rate contracts:
Spot, bought 4,541 - - - 4,541 4,330
Spot, sold 3,261 - - - 3,261 4,105
Forwards/futures, bought 5,429 2,445 0 0 7,874 2,756
Forwards/futures, sold 6,799 328 210 0 7,337 4,277
Forward Rate Agreements, bought 0 0 0 0 0 400
Forward Rate Agreements, sold 0 0 0 0 0 2,400
Swaps 14,130 23,836 42,145 45,034 125,146 141,515
Options, acquired 1,042 5,422 1,830 558 8,853 10,671
Options, written 372 3,745 6,670 814 11,602 11,333
Equity contracts:
Spot, bought 264 - - - 264 133
Spot, sold 304 - - - 304 165
Forwards/futures, bought 2 0 0 0 2 3
Forwards/futures, sold 2 0 0 0 2 6
Options, acquired 421 1 0 0 422 1
Options, written 421 1 0 0 422 1
Other derivative contracts:
Futures commodities, bought 0 0 0 0 0 0
Futures commodities, sold 0 0 0 0 0 0
Options, acquired 0 0 0 0 0 0
Options, written 0 0 0 0 0 0
Credit Default Swaps 0 0 0 0 0 0

2 0 1 7 A n n u a l R e p o r t / S Y D B A N K 97
Distribution by maturity
DKKm
3 months or less
Over 3 months not
exceeding1 year
Over 1year not
exceeding5 years Over 5 years Total 2017 Total 2016
Net market values
Foreign exchange contracts:
Spot, bought (3) - - - (3) 9
Spot, sold (3) - - - (3) 3
Forwards/futures, bought 145 (18) (6) 0 121 349
Forwards/futures, sold 68 40 8 0 116 (195)
Swaps 2 3 0 30 34 82
Options, acquired 37 22 7 0 66 27
Options, written (24) (6) (1) 0 (31) (28)
Interest rate contracts:
Spot, bought (1) - - - (1) 6
Spot, sold 0 - - - 0 (4)
Forwards/futures, bought (1) 0 0 0 0 15
Forwards/futures, sold 4 0 0 0 4 0
Forward Rate Agreements, bought 0 0 0 0 0 0
Forward Rate Agreements, sold 0 0 0 0 0 1
Swaps (48) 45 (328) (70) (401) (624)
Options, acquired 1 11 212 3 228 328
Options, written 1 (19) (175) (3) (197) (267)
Equity contracts:
Spot, bought 0 - - - 0 (1)
Spot, sold 0 - - - 0 1
Forwards/futures, bought (1) 0 0 0 (1) 0
Forwards/futures, sold 2 0 0 0 2 0
Options, acquired 13 1 1 0 15 2
Options, written (13) (1) (1) 0 (15) (2)
Other derivative contracts:
Futures commodities, bought 0 0 0 0 0 0
Futures commodities, sold 0 0 0 0 0 0
Options, acquired 0 0 0 0 0 0
Options, written 0 0 0 0 0 0
Credit Default Swaps 0 0 0 0 0 0
Total net market values (67) (299)

98 S Y D B A N K / 2 0 1 7 A n n u a l R e p o r t
DKKm Total contracts 2017* Total contracts 2016*
Positive Negative Net Positive Negative Net
Market valuesForeign exchange contracts:
Spot, bought 2 (5) (3) 14 (4) 9
Spot, sold 7 (11) (3) 5 (2) 3
Forwards/futures, bought 254 (133) 121 466 (117) 349
Forwards/futures, sold 199 (83) 116 187 (382) (195)
Swaps 38 (4) 34 112 (30) 82
Options, acquired 66 0 66 27 0 27
Options, written 0 (31) (31) 0 (28) (28)
Interest rate contracts:
Spot, bought 3 (4) (1) 7 (1) 6
Spot, sold 2 (2) 0 1 (5) (4)
Forwards/futures, bought 7 (7) 0 17 (2) 15
Forwards/futures, sold 7 (3) 4 2 (2) 0
Forward Rate Agreements, bought 0 0 0 0 0 0
Forward Rate Agreements, sold 0 0 0 1 0 1
Swaps 4,436 (4,837) (401) 6,106 (6,730) (624)
Options, acquired 229 (1) 228 328 0 328
Options, written 4 (202) (197) 6 (273) (267)
Equity contracts:
Spot, bought 2 (2) 0 3 (5) (1)
Spot, sold 2 (2) 0 4 (3) 1
Forwards/futures, bought 0 (1) (1) 0 0 0
Forwards/futures, sold 2 0 2 0 0 0
Options, acquired 15 0 15 2 0 2
Options, written 0 (15) (15) 0 (2) (2)
Other derivative contracts:
Futures commodities, bought 0 0 0 0 0 0
Futures commodities, sold 0 0 0 0 0 0
Options, acquired 0 0 0 0 0 0
Options, written 0 0 0 0 0 0
Credit Default Swaps 0 0 0 0 0 0
Total market values 5,275 (5,342) (67) 7,289 (7,589) (299)
* All contracts are non-guaranteed.
Notes – Derivatives

2 0 1 7 A n n u a l R e p o r t / S Y D B A N K 99
DKKm Total contracts 2017 Total contracts 2016
Positive Negative Net Positive Negative Net
Average market valuesForeign exchange contracts:
Spot, bought 10 (9) 1 17 (9) 8
Spot, sold 8 (13) (5) 11 (22) (11)
Forwards/futures, bought 311 (185) 126 358 (183) 175
Forwards/futures, sold 258 (247) 10 213 (264) (51)
Swaps 71 (16) 55 122 (34) 88
Options, acquired 58 0 58 23 0 23
Options, written 0 (32) (32) 0 (23) (23)
Interest rate contracts:
Spot, bought 4 (7) (3) 16 (8) 9
Spot, sold 7 (2) 5 8 (14) (6)
Forwards/futures, bought 10 (5) 5 17 (11) 6
Forwards/futures, sold 5 (4) 1 12 (13) 0
Forward Rate Agreements, bought 0 0 0 0 (6) (6)
Forward Rate Agreements, sold 0 0 0 6 0 6
Swaps 5,183 (5,686) (503) 7,070 (7,788) (718)
Options, acquired 267 (1) 267 362 (1) 361
Options, written 4 (236) (232) 8 (291) (284)
Equity contracts:
Spot, bought 5 (5) (1) 7 (5) 2
Spot, sold 5 (4) 1 4 (7) (3)
Forwards/futures, bought 0 0 0 5 (3) 1
Forwards/futures, sold 0 0 0 7 (8) (1)
Options, acquired 5 0 5 1 0 1
Options, written 0 (5) (5) 0 (1) (1)
Other derivative contracts:
Futures commodities, bought 0 0 0 0 0 0
Futures commodities, sold 0 0 0 0 0 0
Options, acquired 0 0 0 0 0 0
Options, written 0 0 0 0 0 0
Credit Default Swaps 0 0 0 5 (5) 0
Total average market values 6,213 (6,458) (245) 8,272 (8,697) (425)
Average market value calculations are based on monthly statements.
DKKm Market values Collateral Exposure by counterparty
Positive Negative Received Provided Amount due Amount owed
2017
ExposureCounterparties with CSA agreements 3,758 5,042 751 2,230 271 76
Counterparties without CSA agreements 1,517 300 - - 1,452 235
Total 5,275 5,342 751 2,230 1,723 311
2016
ExposureCounterparties with CSA agreements 5,426 7,127 973 2,834 819 657
Counterparties without CSA agreements 1,863 462 - - 1,593 192
Total 7,289 7,589 973 2,834 2,412 849
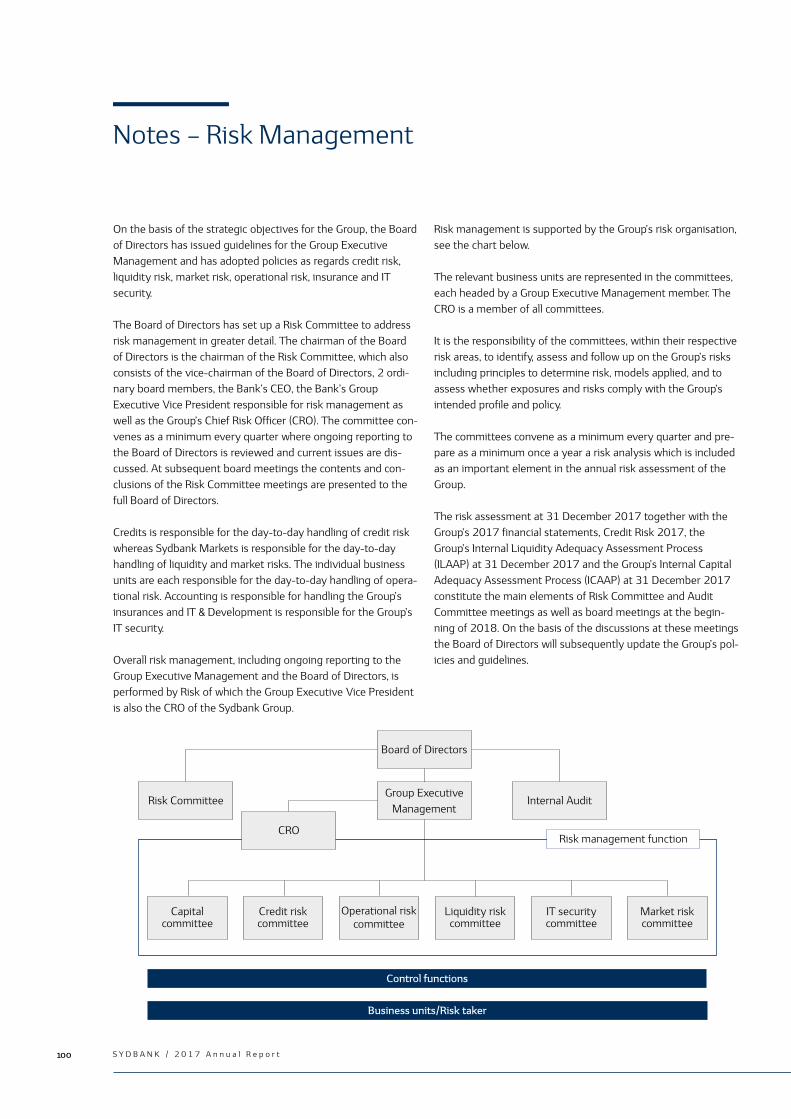
100 S Y D B A N K / 2 0 1 7 A n n u a l R e p o r t
Notes – Risk Management
On the basis of the strategic objectives for the Group, the Board
of Directors has issued guidelines for the Group Executive
Management and has adopted policies as regards credit risk,
liquidity risk, market risk, operational risk, insurance and IT
security.
The Board of Directors has set up a Risk Committee to address
risk management in greater detail. The chairman of the Board
of Directors is the chairman of the Risk Committee, which also
consists of the vice-chairman of the Board of Directors, 2 ordi-
nary board members, the Bank’s CEO, the Bank’s Group
Executive Vice President responsible for risk management as
well as the Group’s Chief Risk Officer (CRO). The committee con-
venes as a minimum every quarter where ongoing reporting to
the Board of Directors is reviewed and current issues are dis-
cussed. At subsequent board meetings the contents and con-
clusions of the Risk Committee meetings are presented to the
full Board of Directors.
Credits is responsible for the day-to-day handling of credit risk
whereas Sydbank Markets is responsible for the day-to-day
handling of liquidity and market risks. The individual business
units are each responsible for the day-to-day handling of opera-
tional risk. Accounting is responsible for handling the Group’s
insurances and IT & Development is responsible for the Group’s
IT security.
Overall risk management, including ongoing reporting to the
Group Executive Management and the Board of Directors, is
performed by Risk of which the Group Executive Vice President
is also the CRO of the Sydbank Group.
Risk management is supported by the Group’s risk organisation,
see the chart below.
The relevant business units are represented in the committees,
each headed by a Group Executive Management member. The
CRO is a member of all committees.
It is the responsibility of the committees, within their respective
risk areas, to identify, assess and follow up on the Group’s risks
including principles to determine risk, models applied, and to
assess whether exposures and risks comply with the Group’s
intended profile and policy.
The committees convene as a minimum every quarter and pre-
pare as a minimum once a year a risk analysis which is included
as an important element in the annual risk assessment of the
Group.
The risk assessment at 31 December 2017 together with the
Group’s 2017 financial statements, Credit Risk 2017, the
Group’s Internal Liquidity Adequacy Assessment Process
(ILAAP) at 31 December 2017 and the Group’s Internal Capital
Adequacy Assessment Process (ICAAP) at 31 December 2017
constitute the main elements of Risk Committee and Audit
Committee meetings as well as board meetings at the begin-
ning of 2018. On the basis of the discussions at these meetings
the Board of Directors will subsequently update the Group’s pol-
icies and guidelines.
Credit risk committee
Capital committee
Board of Directors
Operational risk committee
Liquidity risk committee
IT securitycommittee
Market risk committee
Group Executive
Management
CRO
Internal AuditRisk Committee
Risk management function
Control functions
Business units/Risk taker

2 0 1 7 A n n u a l R e p o r t / S Y D B A N K 101
Credit risk
Credit and client policyThe Group’s overall credit risk is managed according to policies
and limits determined and adopted by the Board of Directors.
The Board of Directors lays down the general framework for
credit granting and the largest exposures are submitted on a
regular basis to the Board of Directors for approval or information.
Employees with a written lending authority may grant approv-
als. Such authority is adjusted to the employee’s client portfolio
and the individual client’s rating. In connection with new clients
employees have limited lending authority.
Retail clientsCredit granting to retail clients is based on the client’s dispos-
able amount, wealth and leverage (defined as total household
debt divided by household personal income) as well as knowl-
edge of the client.
The objective is that the majority of retail client exposures are
approved by the client’s branch and that the remaining client
exposures are approved by specially appointed heads of credit.
Consequently exposures where the client has negative assets
of more than DKK 100,000 are approved by heads of credit.
Major exposures and highly leveraged exposures are approved
centrally by Credits.
Corporate clientsAs a rule corporate clients are serviced by the regional head
office or by special corporate departments. The Group’s largest
and most complex exposures are handled by Corporate Banking
& Finance. The objective is that all small corporate exposures
with satisfactory credit quality are approved at regional level.
Medium-size and major exposures are approved centrally by
Credits, the Group Executive Management or the Board of
Directors.
The Group’s credit-related decisions are based on a systematic
and structured review of the client’s circumstances and industry
affiliation. The review is based on all accessible information,
including industry analyses and financial statements, and also
comprises an assessment of the client’s forward-looking busi-
ness plan and its feasibility.
Credit activitiesCredit activities are conducted partly in the retail and corporate
departments and partly centrally in Credits. As described below,
the Group has developed rating models to assess risks to retail
clients, corporate clients and investment clients.
The Group’s credit activities are an active element in the Group’s
efforts to increase its earnings by:
• maintaining and increasing the portfolio of profitable and
promising retail, corporate and investment clients
• maintaining and increasing clients’ business volume with the
Group through a balanced composition of:
– loans and advances and guarantees
– deposits
– payment services transactions
– trading in securities etc
– financial instruments
• avoiding/reducing risk of loss by implementing action plans
for weak exposures. These action plans involve reducing the
Group’s exposure as well as hedging risks by securing addi-
tional collateral.
Risks in connection with lending must be precalculated on an
informed and well-founded basis.
The Group’s credit exposure is in particular to clients in
Denmark and Northern Germany.
Particular focus is given to weak exposures. The objective is to
ensure that the Group’s action plans for these exposures are
evaluated and adjusted on an ongoing basis to reduce the risk
of loss.
Moreover Credits has a department which is assigned to expo-
sures with a significant risk of loss. These exposures are closely
monitored and Credits is actively involved in preparing solutions
to mitigate the Group’s credit risk.
Risk Follow-upRisk Follow-up is part of the division Risk.
By means of analyses, random sampling and inspections at
branches and departments and centrally, Risk Follow-up moni-
tors the credit quality of credit exposures, registrations, impair-
ment charge calculations as well as the compliance with policies
and business procedures in general.
This process involves research and analyses using information
from the Group’s database on all exposures.
Moreover Risk Follow-up conducts regular credit quality analy-
ses of the Group’s new exposures as well as regular random
sampling of the retail and corporate client portfolios.
Finally Risk Follow-up evaluates on the basis of a credit expert
assessment whether the Group’s rating models rank clients cor-
rectly.

102 S Y D B A N K / 2 0 1 7 A n n u a l R e p o r t
CollateralThe Group aims to mitigate the risk on individual exposures by
way of charges on assets, netting agreements and guarantees.
The most frequent types of charges include mortgages and
charges on financial assets (shares, bonds and units).
The Group receives different kinds of guarantees for exposures.
Many of these are provided by companies or individuals who
have a group relationship with the debtor.
The Group assesses on an ongoing basis the value of collateral
provided. The value is determined as the expected net proceeds
on realisation.
The 2 tables below illustrate the breakdown of collateral by type
and rating category respectively.
Notes – Risk Management
Collateral received and types of collateralDKKm 2017 2016
Loans and advances at fair value 5,248 6,092
Loans and advances at amortised cost 64,312 77,191
Guarantees 13,562 11,385
Credit exposure for accounting purposes 83,122 94,668
Collateral value 44,161 51,016
Total unsecured 38,961 43,652
Types of collateral Real property 12,187 20,532
Financial collateral 10,803 11,708
Leased assets, mortgages etc 5,428 5,096
Floating charges, operating equipment etc 6,227 6,366
Guarantees 1,188 1,294
Other items of collateral 262 233
Total collateral used 36,095 45,229
Particularly secured transactions (mortgage guarantees) 8,066 5,787
Total 44,161 51,016
In the event that the Group uses collateral that is not immedi-
ately convertible into liquid holdings, it is the Group’s policy to
dispose of such assets as quickly as possible. In 2017 repos-
sessed equipment as well as real property taken over in con-
nection with non-performing exposures amounted to DKK 13m
(2016: DKK 62m). Leased assets are assessed and depreciated
on an ongoing basis. As a result the calculated collateral as
regards the Group’s leasing activities will decline during periods
of lower leased asset prices.
Mortgages on real property have fallen by DKK 8,345m from
DKK 20,532m in 2016 to DKK 12,187m in 2017. The
decrease is primarily attributable to the amended funding
agreement.
Financial collateral has decreased by DKK 905m from DKK
11,708m in 2016 to DKK 10,803m in 2017, which is primarily
attributable to the decline in loans and advances at fair value
which have gone down by DKK 844m.
Loans and advances at fair value are repo loans and advances
with financial collateral.

2 0 1 7 A n n u a l R e p o r t / S Y D B A N K 103
Collateral by rating category
DKKm 2017
Rating category Loans/advances Guarantees Unsecured
1 8,003 3,841 9,364 2,480
2 20,037 3,504 13,220 10,321
3 16,847 2,654 8,631 10,870
4 9,367 1,079 4,642 5,804
5 5,677 809 2,924 3,562
6 3,004 365 1,574 1,795
7 1,292 88 414 966
8 380 48 142 286
9 4,889 467 2,172 3,184
Default 1,355 179 639 895
NR/STD 1,390 528 439 1,479
Total 72,241 13,562 44,161 41,642
Individual impairment of loans and advances 2,381 2,381
Collective impairment of loans and advances 300 300
Total 69,560 13,562 44,161 38,961
Collateralvalue
The table below shows the size of loans and advances, guaran-
tees as well as collateral according to rating category. The value
of collateral is assessed relative to loans and advances and
guarantees. Excess collateral is not included in the calculation
of collateral. 53.1% (2016: 53.9%) of the Group’s loans and
advances is covered via collateral.
Financial counterpartiesTrading in securities, currencies and derivatives as well as pay-
ment services etc involve exposure to financial counterparties
in the form of delivery risk or credit risk.
Delivery risk is the risk that the Group does not receive pay-
ments or securities in connection with the settlement of secu-
rities or currency transactions equalling the securities or pay-
ments delivered by the Group.
Management grants delivery risk lines and credit risk lines to
financial counterparties based on the risk profile of the individ-
ual counterparty which is assessed in terms of rating, earnings,
capital position as well as the size of the financial counterparty.
Risks and lines to financial counterparties are monitored con-
tinuously.
The Group participates in an international foreign exchange
settlement system, CLS®, which aims to reduce delivery risk. In
CLS® payment is made on the net position for each currency,
and only 1 amount for each currency is paid or received. In
addition this net exposure is only to 1 counterparty, who is the
Group’s partner in the system.
The Group aims to mitigate credit risk to financial counterpar-
ties in many ways, eg by concluding netting agreements (ISDA
agreements). Moreover the Group has entered into agree-
ments (CSA agreements) with all significant counterparties to
ensure credit risk mitigation of derivatives. Exposures are cal-
culated on a daily basis after which the parties settle collateral.
Consequently exposures are reset in all material respects on a
daily basis. The agreements are managed by Securities &
International Transactions.

104 S Y D B A N K / 2 0 1 7 A n n u a l R e p o r t
Market riskMarket risk is the risk that the market value of the Group’s
assets and liabilities will be affected as a result of changes in
market prices.
Assuming market risk is considered a natural and integral part
of all-round banking. Assuming risk must be on a conscious and
well-documented basis. To the extent possible, risk should be
assumed in products which offer a possibility of eliminating or
mitigating risk at short notice.
Interest rate and foreign exchange risks deriving from deposits
by and loans and advances to the Group’s clients are hedged on
an ongoing basis and are consequently not used for position-
taking.
The Group operates with the following types of market risk:
• Interest rate risk
• Equity risk
• Foreign exchange risk
• Other market risks.
For security and control reasons, the Board of Directors
emphasises that the Group’s market risk is subject to central
decision-making and management. Consequently the Group’s
most significant interest rate, foreign exchange and equity risks
must be assumed by the parent.
The Board of Directors has determined the Group’s risk toler-
ance as follows: medium as regards interest rate risk and low as
regards the other types of market risk.
Market risk is managed by Sydbank Markets according to
policies and limits determined and adopted by the Bank’s Board
of Directors. The Group Executive Management has passed on
the overall limits from the Board of Directors to Sydbank
Markets and Treasury. Sydbank Markets manages trading and
market-making as regards the Group’s clients and financial
counterparties. Treasury manages the Group’s long-term
interest rate positions and hedging, including the Group’s
primary liquidity positions as well as liquidity generation. The
Group’s returns in Sydbank Markets and Treasury appear from
“Segment reporting” (note 5). Apart from interest rate risks,
Treasury does not have any other significant market risks.
Middle Office in Securities & International Transactions as well
as Risk continuously monitor the individual risk areas and pro-
vide management with extensive reporting on a regular basis.
Interest rate riskInterest rate risk comprises the Group’s total risk of loss result-
ing from interest rate changes in financial markets.
The Group uses a cash flow model to determine the interest
rate risk of fixed-rate positions. A duration model is used to cal-
culate the interest rate risk of Danish callable mortgage bonds.
Interest rate risk makes up the bulk of the Group’s overall mar-
ket risk.
In accordance with the Danish FSA’s method of calculation,
interest rate risk is calculated as the change in market values at
a parallel shift in the interest rate level of plus 1 percentage
point in all currencies and at 31 December 2017 it represents
minus DKK 86m or 0.8% of the Group’s Common Equity Tier 1
capital.
Interest rate risk by duration and currency
DKKm 0-1 yr
1-2 yrs
2-3 yrs
> 3 yrs
Total 2017
Total 2016
DKK 36 5 47 (24) 64 292
EUR 1 0 7 (157) (149) (116)
EUR/DKK 37 5 54 (181) (85) 176
Other (3) 1 0 1 (1) 1
Total 2017 34 6 54 (180) (86)
Total 2016 35 21 30 91 177
The bulk of the Group’s interest rate risk is attributable to posi-
tions with a duration exceeding 3 years. The Group has no sig-
nificant interest rate risk apart from EUR/DKK.
The Group’s interest rate risk is negative, ie the Group’s profit
will be favourably affected by an interest rate increase, in this
case particularly in the event of a rise in long-term interest rates
(> 3 years).
The method of calculation of the Danish FSA allows full set-off
between different currencies, maturities and yield curves. The
Group is aware of the risk of these assumptions and monitors
these risks separately on an ongoing basis.
The Group has established an internal interest rate risk scenario
where set-off between currencies is not allowed – apart from
EUR and DKK. Moreover the scenario allocates the interest rate
risk to underlying curves (the government curve, the Danish
mortgage curve and the swap curve) and the scenario risk can-
not be lower than the numerically highest risk of the individual
curves. In addition a premium is included for options. At 31
December 2017 this risk measure constitutes DKK 146m
(2016: DKK 490m).
Notes – Risk Management

2 0 1 7 A n n u a l R e p o r t / S Y D B A N K 105
The scenario is used eg in connection with the calculation of the
Group’s solvency need.
The bulk of the Group’s interest rate risk at 31 December 2017
is attributable to the Group’s positions in Treasury.
Interest rate risk – Sydbank Markets and TreasuryDKKm 2017 2016
Sydbank Markets Treasury Total
Sydbank Markets Treasury
Total
DKK 83 (19) 64 126 166 292
EUR (26) (123) (149) (71) (45) (116)
EUR/DKK 57 (142) (85) 55 121 176
Other (2) 1 (1) (1) 2 1
Total 55 (141) (86) 54 123 177
Equity riskThe Group’s portfolio of shares and holdings in associates repre-
sents DKK 2,275m at 31 December 2017 (2016: DKK
2,000m), including equity investments totalling DKK 1,936m
(2016: DKK 1,607m).
In the event of a 10% change in share prices, profit before tax
will be affected by DKK 228m (2016: DKK 200m), including
equity investments totalling DKK 201m (2016: DKK 177m).
Foreign exchange riskAs in previous years the Group’s foreign exchange risk was
insignificant in 2017 and consequently a 10% change in
foreign exchange rates against DKK at 31 December 2017 will
not affect profit before tax significantly.
Other market risksThe Group does not have any other significant market risks at
31 December 2017.

106 S Y D B A N K / 2 0 1 7 A n n u a l R e p o r t
Liquidity riskLiquidity risk is the risk that the Group either cannot meet its
payment obligations as they mature or is only able to do so via
disproportionately large funding costs.
The Bank’s Board of Directors has adopted a liquidity risk policy
which sets out the framework for the Group’s liquidity manage-
ment, including operational targets for the Group’s risk toler-
ance as well as requirements for the funding structure, liquidity
buffer calculations and stress tests. Moreover the liquidity risk
policy sets out requirements for employee competences, con-
tingency plans and reporting as well as determines the frame-
work for asset encumbrance and allocation of the Group’s
liquidity costs.
Targets and policies:
• Consistently strong and stable deposit base which ensures
stability in the long-term funding of the Group’s lending
activities.
• Prudent funding of long-term loans and advances.
• Maintenance of high ratings.
• Active participation in international money markets as well
as access to international capital markets through the
application of loan programmes. Coupled with a high rating
this ensures that the Group has uninterrupted access to a
diversified and competitive funding basis.
• Maintenance of a liquidity buffer which together with pru-
dent management of the run-off profile of funding ensures
that the Group’s operating activities do not depend on capi-
tal market funding.
In other words the liquidity buffer may counterbalance the
effects of an adverse liquidity situation in the short and
medium term.
The Bank’s Board of Directors determines the Group’s risk toler-
ance as regards liquidity risk. Operational targets for the Group’s
risk tolerance comprise:
• A minimum share of stable funding by way of deposits from
non-financial counterparties and shareholders’ equity
• A funding ratio (stable funding incl senior issues with
maturities in excess of 1 year relative to loans and advances)
• Liquidity Coverage Ratio (LCR)
• 6-month and 12-month stress scenarios (LCR6 and LCR12)
• Liquidity Coverage Ratio euro (LCR EUR).
The LCR, LCR6 and LCR12 are based on a regulatory cautiously
determined liquidity buffer involving specific requirements as
regards Danish mortgage bonds and the share thereof. The
buffer must be sufficient to survive a 30-day stress scenario
(LCR) according to regulatory guidance as well as a 6-month
and a 12-month stress scenario according to the Group’s guid-
ance (LCR6 and LCR12).
The LCR’s 30-day horizon specifies a run-off of the Group’s
exposures, while taking into account counterparties, funding
size, hedging and duration. Consequently the most stable
deposits (small deposits covered by a guarantee scheme) are
favoured relative to large deposits, in particular large deposits
from business enterprises and financial counterparties.
LCR (DKKbn) 2017 2016
Total liquidity buffer 29.4 28.0
Net cash outflows 16.7 16.9
LCR (%) 176 166
The regulatory LCR requirement is 100% and consequently the
Group’s excess cover is significant at 31 December 2017.
Funding ratio (DKKbn) 2017 2016
Shareholders’ equity andsubordinated capital 13.8 13.9
Senior loans with maturities over1 year - 3.7
Stable deposits 72.2 74.0
Total stable funding 86.0 91.6
Loans and advances (excl reverse and mortgage-like loans funded viaexternal counterparties) 64.3 71.9
Funding ratio (%) 134 127
As shown above the Group’s stable funding exceeds the Group’s loans and advances by DKK 21.7bn at 31 December 2017 (2016: DKK 19.7bn).
The maturity profiles of the Group’s debt exposures appear from note 40.
The Board of Directors’ requirements regarding the funding structure are based on the following:
• The Group’s funding must be diversified so as to minimise to
the greatest extent possible reliance on individual sources.
• Compliance with the LCR and the funding ratio target
ensures a prudent funding profile and an adequate level of
stable non-market-based funding and longer-term market-
based funding.
Notes – Risk Management

2 0 1 7 A n n u a l R e p o r t / S Y D B A N K 107
• The LCR and the funding ratio ensure that the higher the
level of stable deposits, the lower the necessary level of
long-term senior funding. In contrast a falling level of stable
deposits will increase the need for long-term senior funding.
• Short-term market funding and funding from financial
counterparties must predominantly be used to fund short-
term placements and investments in securities which can be
realised or which are eligible as collateral with Danmarks
Nationalbank or the repo market.
The Group’s risk policy states that:
• asset encumbrance may only occur as part of ordinary
banking operations and includes securities provided as
collateral with the central bank and in the repo market,
collateral for clearing transactions as well as collateral under
CSA agreements
• asset encumbrance may be by way of deposits with credit
institutions or securities
• moreover asset encumbrance may be by way of funding of
mortgage-like loans via external counterparties.
The asset encumbrance appears from note 37.
The Group issued senior loans of EUR 500m (DKK 3.7bn) in
Q2 2016 with a maturity of 2 years. When the coming requirements as regards senior issues have been determined in accordance with MREL the Group expects to make issues
with longer maturities.
The Group is considering 1 or 2 senior issues in the course of
2018.

108 S Y D B A N K / 2 0 1 7 A n n u a l R e p o r t
Operational riskOperational risk is the risk of direct or indirect loss resulting
from inadequate or failed internal processes, people and sys-
tems or from external events, including legal risk.
The Group collects data on all operational events and classifies
them in 4 main groups:
• Operational events without loss
• Operational events, IT
• Operational events, internal
• Operational events, compensation.
Management receives reporting on the basis of these data.
Furthermore they form the basis for analyses and research for
the purpose of identifying systematics as well as improving on
an ongoing basis internal controls, business procedures and
routines to minimise the number of errors and the risk of loss.
Moreover the system for collecting data on operational events
ensures compliance with the Group’s business procedures for
approval, information, accounting and payment, if any.
The Group reviews all business units annually with the aim of
identifying, describing and analysing the largest individual risks
where the Group may incur significant losses as well as the rele-
vant business procedures and routines for the purpose of mini-
mising such risks.
A risk analysis was conducted in September 2017 as regards
operational risks, which shows that the Group has a number of
scenarios in which the risk of loss exceeds DKK 5m. At the
same time it must be expected that such scenarios – despite
risk mitigation by way of for instance business procedures and
control environment, requirements as regards access and
authorisation as well as insurance cover – will occur within a
foreseeable time horizon.
The Group’s management has reviewed the extent of such loss
scenarios and related risks.
The Group applies the Standardised Approach to calculate the
capital requirement in accordance with Basel III.
IT securityIT supports a large part of the systems and tools used by the
Bank’s clients and advisers. This function is strengthened by the
increased digitization in Sydbank which clients experience by
way of increased self-service and improved online services.
Consequently IT security is a significant aspect of the Bank’s
operational risk.
The Group regularly reviews this area – on a strategic level, on
an operational level and on a system level if the system is busi-
ness-critical. As a result requirements have been specified as
regards confidentiality, accessibility and integrity of the individ-
ual elements of IT security. These requirements are adjusted on
an ongoing basis to new statutory requirements and regula-
tions. Currently there is considerable focus on the additional
requirements that will apply when the General Data Protection
Regulation comes into force in May 2018.
The Board of Directors specifies and formulates requirements as
regards IT risk management in the IT security policy and IT con-
tingency policy and these policies form the basis of the IT secu-
rity efforts. As part of the IT security efforts a risk analysis is
prepared annually in which the objectives regarding the confi-
dentiality, accessibility and integrity of each system are
assessed in terms of probability, maturity of preventive and cor-
rective administrative and technical measures, as well as impli-
cations. As a result of this assessment a risk score is assigned to
each system. The Board of Directors reviews, updates and
approves the 2 policies on the basis of the risk analysis.
In the policies the Board of Directors assesses the current risk
scenario and against this background specifies the require-
ments for eg accessibility and reliability in terms of the differ-
ent elements of IT supply, including systems and data. As a
result of these requirements, a significant part of the Group’s
use of IT has been mirrored to minimise the risk of operational
disruptions.
The IT security policy as well as the IT contingency policy apply
to all aspects of the Bank’s IT use and consequently also where
IT or parts of it has been outsourced. As a result Sydbank’s col-
laboration with Bankdata, including JN Data, which is responsi-
ble for the day-to-day operations, is also comprised by this IT
security process.
Contingency exercises are performed on a regular basis to
ensure that the Bank is able to tackle any events that may arise.
In accordance with current anti-terrorism and anti-money laun-
dering rules the Bank must ensure that proof of identity of its
clients exists. Moreover the Bank performs routine testing of
transactions submitted through the Bank’s systems.
Suspicious transactions are reported.
Notes – Risk Management

2 0 1 7 A n n u a l R e p o r t / S Y D B A N K 109
The Bank is a licensed financial services provider and must
therefore comply with the capital requirements determined by
the EU.
The capital adequacy rules require a minimum capital level of
8.0% of the risk exposure amount plus any additional individual
capital needed. Detailed rules regulate the calculation of capital
as well as the risk exposure amount.
Total capital is made up of Tier 1 capital and Tier 2 capital. Tier
1 capital comprises shareholders’ equity and Additional Tier 1
capital.
The difference between shareholders’ equity and total capital is
shown in note 3.
The Group’s subordinated capital, Additional Tier 1 capital and
Tier 2 capital may, subject to certain conditions, be included in
total capital. The conditions are specified in CRR. The Group’s
subordinated capital is shown in note 33.
The Group has determined capital targets and considers a
Common Equity Tier 1 capital ratio of 14.0% as well as a capital
ratio of 18.0% as being satisfactory for the years ahead.
The international rating agency Moody’s regularly assesses the
Group’s ability to honour its payment obligations. The rating
targets are an essential part of the Group’s capital targets
because good ratings give the Group access to the capital mar-
kets.
In 2017 the Group met regulatory capital requirements as well
as internal capital targets.
Notes – Total capital
110 S Y D B A N K / 2 0 1 7 A n n u a l R e p o r t
Board of Directors
Group Executive Management
Management Statement
We have reviewed and approved the 2017 Annual Report of
Sydbank A/S.
The consolidated financial statements are prepared in accord-
ance with International Financial Reporting Standards as adopt-
ed by the EU, and the parent company financial statements are
prepared in accordance with the Danish Financial Business Act.
Furthermore, the annual report is prepared in compliance with
Danish disclosure requirements for listed financial companies.
In our opinion the consolidated financial statements and the
financial statements give a true and fair view of the Group’s and
the company’s assets, shareholders’ equity and liabilities and
financial position at 31 December 2017 and of the results of
the Group’s and the company’s operations and consolidated
cash flows for the financial year 1 January – 31 December
2017. Moreover it is our opinion that the management’s review
includes a fair review of the developments in the Group’s and
the parent company’s operations and financial position as well
as a description of the most significant risks and elements of
uncertainty which may affect the Group and the parent company.
We propose that the Annual Report be submitted for adoption by the AGM.
Aabenraa, 20 February 2018
Karen FrøsigCEO
Bjarne Larsen Jan Svarre
Torben Nielsen(Chairman)
John Lesbo
Frank Møller Nielsen
Margrethe Weber
Peder Damgaard(Vice-Chairman)
Lars Mikkelgaard-Jensen
Jacob Chr. Nielsen
Alex Slot Hansen
Janne Moltke-Leth
Jarl Oxlund

2 0 1 7 A n n u a l R e p o r t / S Y D B A N K 111

112 S Y D B A N K / 2 0 1 7 A n n u a l R e p o r t
Auditors’ Reports
Internal Audit
To the shareholders of Sydbank A/S
OpinionWe have audited the consolidated financial statements and the
parent company financial statements of Sydbank A/S for the
financial year 1 January – 31 December 2017, which comprise
an income statement, statement of comprehensive income,
balance sheet, statement of changes in equity and notes,
including a summary of significant accounting policies, for the
Group and the Company, as well as a cash flow statement for
the Group. The consolidated financial statements have been
prepared in accordance with International Financial Reporting
Standards as adopted by the EU and additional Danish
disclosure requirements for listed financial institutions and the
parent company financial statements have been prepared in
accordance with the Danish Financial Business Act.
In our opinion, the consolidated financial statements and the
parent company financial statements give a true and fair view
of the Group’s and the Company’s assets, liabilities and financial
position at 31 December 2017 and of the results of the Group’s
and the Company’s operations and the Group’s cash flows for
the financial year 1 January – 31 December 2017 in accordance
with International Financial Reporting Standards as adopted by
the EU and additional Danish disclosure requirements for listed
financial institutions in respect of the consolidated financial
statements and in accordance with the Danish Financial Business
Act in respect of the parent company financial statements.
Basis for opinionWe conducted our audit in accordance with the Danish Financial
Supervisory Authority’s Executive Order on Auditing Financial
Undertakings etc. as well as Financial Groups and in accordance
with International Standards on Auditing (ISAs) and the
additional requirements applicable in Denmark.
We planned and performed our audit to issue an auditor’s
report that includes a reasonable assurance conclusion about
whether the consolidated financial statements and the parent
company financial statements as a whole are free from material
misstatement, whether due to fraud or error. We have
participated in the audit of all material and risky areas.
We believe that the audit evidence we have obtained is
sufficient and appropriate to provide a basis for our opinion.
Statement on the Management’s reviewOur opinion on the consolidated financial statements and the
parent company financial statements does not cover the
Management’s review, and we do not express any assurance
conclusion thereon.
In connection with our audit of the consolidated financial
statements and the parent company financial statements we
have read the Management’s review and, when doing so,
considered whether the Management’s review is materially
inconsistent with the consolidated financial statements or the
parent company financial statements or our knowledge
obtained during the audit, or otherwise appears to be materially
misstated.
Based on the work we have performed, we concluded that the
Management’s review is in accordance with the consolidated
financial statements and the parent company financial
statements and has been prepared in accordance with the
requirements in the Danish Financial Business Act. We did not
identify any material misstatements of the Management’s
review.
Aabenraa, 20 February 2018
Ole KirkbakHead of Internal Audit

2 0 1 7 A n n u a l R e p o r t / S Y D B A N K 113
Independent Auditors’ Report
To the shareholders of Sydbank A/S
Opinion We have audited the consolidated financial statements and the
parent company financial statements of Sydbank A/S for the
financial year 1 January – 31 December 2017, which comprise
income statement, statement of comprehensive income,
balance sheet, statement of changes in equity and notes,
including accounting policies, for the Group and the Parent
Company, and a consolidated cash flow statement. The
consolidated financial statements are prepared in accordance
with International Financial Reporting Standards as adopted by
the EU and additional requirements of listed financial
companies, and the parent company financial statements are
prepared in accordance with the Danish Financial Business Act.
In our opinion, the consolidated financial statements give a true
and fair view of the financial position of the Group at 31
December 2017 and of the results of the Group’s operations
and cash flows for the financial year 1 January – 31 December
2017 in accordance with International Financial Reporting
Standards as adopted by the EU and additional requirements of
listed financial companies.
Further, in our opinion the parent company financial statements
give a true and fair view of the financial position of the Parent
Company at 31 December 2017 and of the results of the
Parent Company’s operations for the financial year 1 January –
31 December 2017 in accordance with the Danish Financial
Business Act.
Our opinion is consistent with our long-form audit report to the
Audit Committee and the Board of Directors.
Basis for opinion We conducted our audit in accordance with International
Standards on Auditing (ISAs) and additional requirements
applicable in Denmark. Our responsibilities under those
standards and requirements are further described in the
“Auditor’s responsibilities for the audit of the consolidated
financial statements and the parent company financial
statements” (hereinafter collectively referred to as “the financial
statements”) section of our report. We believe that the audit
evidence we have obtained is sufficient and appropriate to
provide a basis for our opinion.
IndependenceWe are independent of the Group in accordance with the
International Ethics Standards Board for Accountants’ Code of
Ethics for Professional Accountants (IESBA Code) and additional
requirements applicable in Denmark, and we have fulfilled our
other ethical responsibilities in accordance with these rules and
requirements.
To the best of our knowledge, we have not provided any
prohibited non-audit services as described in article 5(1) of
Regulation (EU) no. 537/2014.
Appointment of auditorWe were initially appointed as auditor of Sydbank A/S on 10
May 1990 for the financial year 1990. We have been
reappointed annually by resolution of the general meeting for a
total consecutive period of 28 years up until and including the
financial year 2017.
Key audit mattersKey audit matters are those matters that, in our professional
judgement, were of most significance in our audit of the
financial statements for the financial year 2017. These matters
were addressed during our audit of the financial statements as
a whole and in forming our opinion thereon. We do not provide
a separate opinion on these matters.
We have fulfilled our responsibilities described in the “Auditor’s
responsibilities for the audit of the financial statements”
section, including in relation to the key audit matters below. Our
audit included the design and performance of procedures to
respond to our assessment of the risks of material
misstatement of the financial statements. The results of our
audit procedures, including the procedures performed to
address the matters below, provide the basis for our audit
opinion on the financial statements.
Measurement of loans and guarantees• Risk: A substantial amount of the company’s assets consist of
loans to customers (46% of the consolidated assets) which
are subject to impairment risks due to the customer’s lack of
ability to pay. In addition, the company offers guarantees and
other financial products that also imply risk of losses.

114 S Y D B A N K / 2 0 1 7 A n n u a l R e p o r t
Independent Auditors’ Report
Auditors’ Reports
Our audit focused on impairment charges of loans and
guarantees since this implies significant amounts and a high
level of judgement applied by Management. This concerns
especially the assessment of impairment events
identification, collateral valuation and the customer’s ability
to pay in case of default on loans.
Large loans are evaluated individually while impairment of
smaller loans for private customers is based on models and
portfolio level considerations. Furthermore the measurement
of collective impairments is subject to judgements made by
Management regarding assumptions and parameters applied.
• Audit approach: Our audit comprises processes for
impairment events identification and monitoring of loans.
We have performed analyses and risk-based test of loans and
by review of the company’s procedures verified, that loan
impairments are recognized in accordance with the
accounting policies.
The review has comprised the largest and most risky loans.
For collective impairments we have evaluated the
assumptions and methodology applied, including the
judgements applied by Management in relation to loans to
agriculture.
Also we have reviewed and tested that the disclosures on
loans, impairment charges and credit risk meet the relevant
accounting rules (note 14 and 18).
Statement on the Management’s reviewManagement is responsible for the Management’s review.
Our opinion on the financial statements does not cover the
Management’s review, and we do not express any form of
assurance conclusion thereon.
In connection with our audit of the financial statements, our
responsibility is to read the Management’s review and, in doing
so, consider whether the Management’s review is materially
inconsistent with the financial statements or our knowledge
obtained during the audit, or otherwise appears to be materially
misstated.
Moreover, it is our responsibility to consider whether the
Management’s review provides the information required under
the Danish Financial Business Act.
Based on the work we have performed, we conclude that the
Management’s review is in accordance with the financial
statements and has been prepared in accordance with the
requirements of the Danish Financial Business Act. We did not
identify any material misstatement of the Management’s
review.
Management’s responsibilities for the financial statementsManagement is responsible for the preparation of consolidated
financial statements that give a true and fair view in accordance
with International Financial Reporting Standards as adopted by
the EU and additional requirements of listed financial
companies and for the preparation of parent company financial
statements that give a true and fair view in accordance with the
Danish Financial Business Act.
Moreover, Management is responsible for such internal control
as Management determines is necessary to enable the
preparation of financial statements that are free from material
misstatement, whether due to fraud or error.
In preparing the financial statements, Management is
responsible for assessing the Group’s and the Parent Company’s
ability to continue as a going concern, disclosing, as applicable,
matters related to going concern and using the going concern
basis of accounting in preparing the financial statements unless
Management either intends to liquidate the Group or the Parent
Company or to cease operations, or has no realistic alternative
but to do so.
Auditor’s responsibilities for the audit of the financial statementsOur objectives are to obtain reasonable assurance as to
whether the financial statements as a whole are free from
material misstatement, whether due to fraud or error, and to
issue an auditor’s report that includes our opinion. Reasonable
assurance is a high level of assurance, but is not a guarantee
that an audit conducted in accordance with ISAs and additional
requirements applicable in Denmark will always detect a
material misstatement when it exists. Misstatements can arise
from fraud or error and are considered material if, individually or
in the aggregate, they could reasonably be expected to
influence the economic decisions of users taken on the basis of
the financial statements.
As part of an audit conducted in accordance with ISAs and
additional requirements applicable in Denmark, we exercise

2 0 1 7 A n n u a l R e p o r t / S Y D B A N K 115
Independent Auditors’ Report
professional judgement and maintain professional scepticism
throughout the audit. We also:
• Identify and assess the risks of material misstatement of the
financial statements, whether due to fraud or error, design
and perform audit procedures responsive to those risks and
obtain audit evidence that is sufficient and appropriate to
provide a basis for our opinion. The risk of not detecting a
material misstatement resulting from fraud is higher than for
one resulting from error, as fraud may involve collusion,
forgery, intentional omissions, misrepresentations or the
override of internal control.
• Obtain an understanding of internal control relevant to the
audit in order to design audit procedures that are appropriate
in the circumstances, but not for the purpose of expressing
an opinion on the effectiveness of the Group’s and the Parent
Company’s internal control.
• Evaluate the appropriateness of accounting policies used and
the reasonableness of accounting estimates and related
disclosures made by Management.
• Conclude on the appropriateness of Management’s use of the
going concern basis of accounting in preparing the financial
statements and, based on the audit evidence obtained,
whether a material uncertainty exists related to events or
conditions that may cast significant doubt on the Group’s and
the Parent Company’s ability to continue as a going concern. If
we conclude that a material uncertainty exists, we are
required to draw attention in our auditor’s report to the
related disclosures in the financial statements or, if such
disclosures are inadequate, to modify our opinion. Our
conclusions are based on the audit evidence obtained up to
the date of our auditor’s report. However, future events or
conditions may cause the Group and the Parent Company to
cease to continue as a going concern.
• Evaluate the overall presentation, structure and contents of
the financial statements, including the note disclosures, and
whether the financial statements represent the underlying
transactions and events in a manner that gives a true and fair
view.
• Obtain sufficient appropriate audit evidence regarding the
financial information of the entities or business activities
within the Group to express an opinion on the consolidated
financial statements. We are responsible for the direction,
supervision and performance of the group audit. We remain
solely responsible for our audit opinion.
We communicate with those charged with governance
regarding, among other matters, the planned scope and timing
of the audit and significant audit findings, including any
significant deficiencies in internal control that we identify during
our audit.
We also provide those charged with governance with a
statement that we have complied with relevant ethical
requirements regarding independence, and to communicate
with them all relationships and other matters that may
reasonably be thought to bear on our independence, and where
applicable, related safeguards.
From the matters communicated with those charged with
governance, we determine those matters that were of most
significance in the audit of the consolidated financial statements
and the parent company financial statements of the current
period and are therefore the key audit matters. We describe
these matters in our auditor’s report unless law or regulation
precludes public disclosure about the matter or when, in
extremely rare circumstances, we determine that a matter
should not be communicated in our report because the adverse
consequences of doing so would reasonably be expected to
outweigh the public interest benefits of such communication.
Aabenraa, 20 February 2018
Ernst & YoungGodkendt Revisionspartnerselskab
CVR no. 30 70 02 28
Lars Rhod SøndergaardState Authorised Public Accountant
MNE no. 28632
Klaus SkovsenState Authorised Public Accountant
MNE no. 30204

116 S Y D B A N K / 2 0 1 7 A n n u a l R e p o r t
Notice Convening the Annual General Meeting
Notice Convening the Annual General Meeting of Sydbank A/S
Agenda according to Article 8 of the Articles of Association:
1. Report of the Board of Directors on the Bank’s activities in
2017.
2. Submission of the audited annual report including the
auditors’ report for adoption.
3. Motion for the allocation of profit or cover of loss according
to the adopted annual report.
4. Election of members to the Shareholders’ Committee.
5. Appointment of auditors.
The Board of Directors proposes the reappointment of Ernst
& Young, Godkendt Revisionspartnerselskab in accordance
with the recommendation of the Audit Committee. The
Audit Committee has in no way been influenced by third
parties or been subjected to any agreement with a third
party which would limit the general meeting’s appointment
of certain auditors or audit firms.
6. Motions submitted by the Board of Directors or shareholders:
The Board of Directors proposes that the Bank’s share
capital be reduced by DKK 26,902,200 to DKK
676,709,540. The capital reduction will be effected as a
payment to shareholders and will be implemented by
cancelling 2,690,220 shares of DKK 10 each, purchased
during the Bank’s share buyback programme in 2017.
Payment will be at a premium of 246.82 corresponding
to the average repurchase price during the share buyback
programme. A resolution will imply the following amend-
ment to Article 2 (1) of the Articles of Association:
“The share capital of the Bank is DKK 676,709,540
divided into shares in denominations of DKK 10. The
share capital is fully paid up.”
7. Any other business.
The agenda, complete proposals and audited annual report
including the auditors’ report will be available for inspection by
the shareholders at sydbank.dk/generalforsamling and sydbank.
com/generalmeeting and at Sydbank’s branches no later than
three weeks before the general meeting.
The Bank’s share capital totals DKK 703,611,740.00.
As regards shareholders’ voting rights, reference is made to
Article 10 of the Bank’s Articles of Association.
Shareholders are entitled to attend and to raise questions at the
general meeting and to vote according to the number of shares
held by a shareholder on the date of registration, which is 7
March 2018.
Admission cards for the general meeting can be ordered at any
of Sydbank’s branches or at sydbank.dk/generalforsamling and
sydbank.com/generalmeeting no later than Thursday 8 March
2018.
If a shareholder wishes to vote by postal vote or to issue an
instrument of proxy to the Board of Directors or others, the
necessary documents are available at the Bank’s websites.
Instruments of proxy must have been received by the Bank no
later than 8 March 2018 and postal votes must have been
received by the Bank no later than 4:00pm, 12 March 2018.
Aabenraa, 13 February 2018
The Board of Directors of Sydbank A/S
Torben H. Nielsen
Chairman
Sydbank’s Annual General Meeting will be held on Wednesday 14 March 2018 at 3:00pm in Sønderjyllandshallen, H.P. Hanssensgade 7, 6200 Aabenraa, Denmark.

2 0 1 7 A n n u a l R e p o r t / S Y D B A N K 117

118 S Y D B A N K / 2 0 1 7 A n n u a l R e p o r t
Board of Directors
ChairmanFormer Central Bank Governor Torben NielsenHaslevBorn: 2 November 1947
Education: Banking, Graduate Diploma in Organisation,
Industrial Sociology, Credits and Finance. Adjunct professor at
CBS
Elected to Board of Directors: 2013
Expiry of current term of office: 2019
Independent: Yes
------------------------------------------
Committee memberships: Chairman of Nomination Committee
and Risk Committee, member of Audit Committee and
Remuneration Committee.
Directorships and other offices: Tryg A/S, Vice-Chairman
Tryg Forsikring A/S, Vice-Chairman
DLR Kredit A/S, Board member
Investeringsforeningen Sparinvest, Chairman
EIK banki p/f, Færøerne, Chairman
Sampension KP Livsforsikring A/S, Board member
Sampension Administrationsselskab A/S, Board member
Museum Sydøstdanmark, Board member
Vordingborg Borg Fond, Board member
Sømandsstiftelsen Bombebøssen, Board member.
Specific competences: Management, macroeconomics,
monetary policy, financial regulation, credit risks and general
banking sector conditions.
Attendance record in 2017: 12/12
Number of Sydbank shares at year-end 2017: 5,500
Movement for the year in number of shares: +1,500
Vice-ChairmanGeneral Manager, former Principal Peder DamgaardKruså Born: 13 December 1956 Education: MSc (Agriculture)
Elected to Board of Directors: 2006
Expiry of current term of office: 2020
Independent: Yes
------------------------------------------
Committee memberships: Chairman of Remuneration
Committee, member of Risk Committee and Nomination
Committee.
Directorships and other offices: BoligSyd, Executive Board
BHJ Fonden, Chairman
Grænseforeningen, Board member
A/S Plantningsselskabet Sønderjylland, Board member
Sydbank Sønderjyllands Fond, Board member
Sydbank Fonden, Board member.
Specific competences: Management, accounting, economics,
mortgage credit and agriculture.
Attendance record in 2017: 12/12
Number of Sydbank shares at year-end 2017: 966
Movement for the year in number of shares: -

2 0 1 7 A n n u a l R e p o r t / S Y D B A N K 119
Managing Director, Board Chairman Lars Mikkelgaard-JensenRungsted KystBorn: 5 August 1954
Education: MSc (Economics)
Elected to Board of Directors: 2015
Expiry of current term of office: 2018
Independent: Yes
------------------------------------------
Committee memberships: Member of Audit Committee.
Directorships and other offices: IBM Danmark ApS, Managing Director, Chairman
M.J. Grønbech & Sønner Holding A/S, Board member
Industripension Holding A/S, Board member
Industriens Pensionsforsikring A/S, Board member.
Specific competences: IT/Digital, robotics, management,
strategy and business development and macroeconomics.
Attendance record in 2017: 12/12
Number of Sydbank shares at year-end 2017: 2,000
Movement for the year in number of shares: -
State Authorised Public AccountantJohn LesboEsbjergBorn: 15 January 1954
Education: State Authorised Public Accountant
Elected to Board of Directors: 2017
Expiry of current term of office: 2020
Independent: No
------------------------------------------
Committee memberships: Chairman of Audit Committee.
Directorships and other offices: Business Region Esbjerg, Chairman
Good Food Group A/S, Board member
Strandbygaard Grafisk A/S, Board member
Emballagegruppen A/S, Board member.
Specific competences: Management, accounting, auditing, risk
management and stratgy.
Attendance record in 2017: 10/10
Number of Sydbank shares at year-end 2017: 208
Movement for the year in number of shares: -

120 S Y D B A N K / 2 0 1 7 A n n u a l R e p o r t
Board of Directors
Danish High Court AttorneyFrank Møller NielsenNæstvedBorn: 23 October 1956
Education: LLM
Elected to Board of Directors: 2015
Expiry of current term of office: 2018
Independent: No
------------------------------------------
Committee memberships: Member of Nomination Committee.
Directorships and other offices: ROPOX Holding A/S, Chairman
ROPOX A/S, Chairman
H. Nielsen & Søn A/S, Chairman.
Specific competences: Strategy, compliance/law, management
and banking.
Attendance record in 2017: 12/12
Number of Sydbank shares at year-end 2017: 1,736
Movement for the year in number of shares: +199
General ManagerJanne Moltke-LethCopenhagenBorn: 4 August 1966
Education: Graduate Diploma in Business Administration, MSc
(International Business Administration and Modern Languages)
Elected to Board of Directors: 2016
Expiry of current term of office: 2019
Independent: Yes
------------------------------------------
Committee memberships: Member of Remuneration
Committee.
Directorships and other offices: Kolpin Hotels ApS, Board member.
Specific competences: Management, strategy, business
development, innovation, change management and optimisation.
Attendance record in 2017: 11/12
Number of Sydbank shares at year-end 2017: 93
Movement for the year in number of shares: +42

2 0 1 7 A n n u a l R e p o r t / S Y D B A N K 121
General ManagerJacob Chr. NielsenHaderslevBorn: 7 June 1973
Education: Graduate Diploma in Business Administration, MBA
Elected to Board of Directors: 2014
Expiry of current term of office: 2020
Independent: Yes
------------------------------------------
Committee memberships: Member of Nomination Committee
and Audit Committee.
Directorships and other offices: E 3-Gruppen A/S, Chairman
E 3 Spedition-Transport A/S, Chairman
Proflex Kemi A/S, Chairman.
Specific competences: Management, accounting, insurance,
industry, finance and auditing.
Attendance record in 2017: 12/12
Number of Sydbank shares at year-end 2017: 77
Movement for the year in number of shares: -

122 S Y D B A N K / 2 0 1 7 A n n u a l R e p o r t
Board of Directors
Executive Vice President, Private BankingAlex Slot HansenVejleBorn: 26 February 1978
Education: Banking, Graduate Diploma in Business
Administration
Elected to Board of Directors: 2014
Expiry of current term of office: 2018
Independent: No
Elected by the employees------------------------------------------
Committee memberships: Member of Remuneration
Committee.
Directorships and other offices: –
Specific competences: Management, economics, investment
and accounting.
Attendance record in 2017: 12/12
Number of Sydbank shares at year-end 2017: 57
Movement for the year in number of shares: -
Chairman of Sydbank KredsJarl OxlundKoldingBorn: 29 April 1967
Education: Banking, Graduate Diploma in Business
Administration, MSc (Organisational Psychology)
Elected to Board of Directors: 2014
Expiry of current term of office: 2018
Independent: No
Elected by the employees------------------------------------------
Committee memberships: Member of Risk Committee.
Directorships and other offices: Financial Services Union Denmark, member of executive council.
Specific competences: Accounting, bank products, credit risks
and organisation.
Attendance record in 2017: 12/12
Number of Sydbank shares at year-end 2017: 1,200
Movement for the year in number of shares: -

2 0 1 7 A n n u a l R e p o r t / S Y D B A N K 123
Bank ClerkMargrethe WeberAabenraaBorn: 8 July 1956
Education: Banking, Holder of Business Diploma
Elected to Board of Directors: 1993
Expiry of current term of office: 2018
Independent: No
Elected by the employees------------------------------------------
Committee memberships: –
Directorships and other offices: –
Specific competences: Bank products and credit risks.
Attendance record in 2017: 12/12
Number of Sydbank shares at year-end 2017: 2,106
Movement for the year in number of shares: -

124 S Y D B A N K / 2 0 1 7 A n n u a l R e p o r t
Group Executive Management
CEOKaren FrøsigBrammingBorn: 23 September 1958 Group Executive Management member since: 2008
CEO since: 2010
------------------------------------------
Directorships: Ejendomsselskabet af 1. juni 1986 A/S, Chairman
DiBa A/S, Chairman
Foreningen Bankdata, Chairman
National Banks in Denmark, Vice-Chairman
PRAS A/S, Board member
Finance Denmark, Board member
DLR Kredit A/S, Board member
Totalkredit A/S, Board member
BI Holding A/S, Board member
Musikhuset Esbjerg, Fond, Board member
FR I af 16. september 2015 A/S, Board member
Sydbank Sønderjyllands Fond, Board member
Sydbank Fonden, Board member
Komitéen for god Selskabsledelse, member.
Number of Sydbank shares at year-end 2017: 3,766
Movement for the year in number of shares: -
Deputy Group Chief ExecutiveJan SvarreFredericiaBorn: 6 January 1963
Group Executive Management member since: 2013
------------------------------------------
Directorships: Ejendomsselskabet af 1. juni 1986 A/S, Board member
DiBa A/S, Board member
BOKIS A/S, Board member
Letpension A/S, Board member
e-nettet A/S, Vice-Chairman.
Number of Sydbank shares at year-end 2017: 2,300
Movement for the year in number of shares: -

2 0 1 7 A n n u a l R e p o r t / S Y D B A N K 125
Deputy Group Chief ExecutiveBjarne LarsenVamdrupBorn: 5 November 1963 Group Executive Management member since: 2013
------------------------------------------
Directorships: Ejendomsselskabet af 1. juni 1986 A/S, Board member
DiBa A/S, Vice-Chairman.
Number of Sydbank shares at year-end 2017: 1,967
Movement for the year in number of shares: -

126 S Y D B A N K / 2 0 1 7 A n n u a l R e p o r t
Organisation
Group Executive Management
Karen FrøsigJan Svarre
Bjarne Larsen
AuditOle Kirkbak
ComplianceLone Frederiksen
RiskBjørn S. Clausen
Legal Department Walter Borge Nielsen
Group Executive Management Secretariat
& CommunicationsBjørn Schwarz
Corporate ClientsMorten Barsballe Nielsen
Kolding RegionDennis Vibjerg
Aabenraa RegionLaurids Kudsk
Sydbank in GermanyKim Møller Nielsen
Human ResourcesElse Guldager
Asset ManagementMichael Andersen
Accounting & IRJørn Adam Møller
Central functions
Line functions
Corporate Banking & Finance
Steen S. Hansen
IT & DevelopmentJacob Flohr Kristiansen
Securities & International TransactionsNiels Skylvad
Sydbank MarketsLars Bolding
CreditsPer Klitt Jensen
Sales & MarketingNicolai Fl. Frederiksen
Copenhagen RegionSøren Gadeberg
Odense RegionClaus Braad Hansen
Næstved RegionJesper Lund Wimmer
Herning RegionClaus Brændstrup
Aarhus RegionTorben R. Rasmussen
Vejle RegionTina K. Lyngsø
Esbjerg RegionFrank Bondorph
Sydbank AgricultureArne Jørgensen
Retail Clients &Private BankingSteen Sandager
Customer Service DirectTorben Bruun Jørgensen


Tel +45 74 37 37 37
sydbank.com
Sydbank A/S
Peberlyk 4
6200 Aabenraa
Denmark CVR No DK 12626509


