66
2017 ANNUAL RESULTS March 8 th , 2018 Shanghai International airport, China

2017 ANNUAL RESULTS
March 8th, 2018
Shanghai International airport, China

BUSINESS OVERVIEW FY 2017
Jean-François Decaux
Chairman of the Executive Board and Co-CEO

In million Euros, except %. Adjusted figures (1) except when IFRS. 2017 2016
► Revenue 3,471.9 3,392.8 +2.3%
► Operating margin 653.5 646.5 +1.1%
► EBIT before impairment charge (2) 358.1 351.4 +1.9%
► Net income Group share before impairment charge, IFRS (3) 204.3 223.5 -8.6%
► Net income Group share, IFRS 193.7 224.7 -13.8%
► Net cash flow from operating activities 432.6 506.0 -14.5%
► Free cash flow 142.9 263.7 -45.8%
► Net debt as of end of period, IFRS 384.4 418.6
2017 ANNUAL RESULTS
(1) Adjusted figures include our prorata share in companies under joint control accounted for using the equity method under IFRS 11.(2) The impact of the impairment charge on EBIT in 2017 corresponds to a -€9.4m impairment on intangible assets and PP&E and a -€2.9m net provisions for onerous contracts. The impact of the impairment charge on EBIT in 2016 corresponds to a +€0.5m
reversal on impairment on intangible assets and PP&E and a +€1.2m reversal on provisions for onerous contracts.(3) The impact of the impairment charge on Net income Group share in 2017 corresponds to an impairment charge on intangible assets and PP&E and a net provision for onerous contracts (net of tax and net of the impact on minority interests) for -€10.6m. The
impact of the impairment charge on Net income Group share in 2016 corresponds to a reversal on impairment on intangible assets and PP&E and a reversal on provisions for onerous contracts (net of tax and net of the impact on minority interests) for +€1.2m.
Please refer to the Appendices section for financial definitions.
3

+4.4% +4.5%
-4.2%
+3.2%+3.4%
+1.8%
+0.4%
+2.3%
2017 ADJUSTED REVENUE GROWTH BY SEGMENT
(1) Organic growth = excluding acquisitions / divestitures and the impact of foreign exchange.
Organic growth (%) (1)Reported growth (%)
4
Street
FurnitureTransport Billboard Group
Street
FurnitureTransport Billboard Group

+5.8%
+3.3%
-2.5%
+2.1%+1.4%
+11.6%
+3.2%
2017 ADJUSTED REVENUE GROWTH BY REGION
(1) Organic growth = excluding acquisitions / divestitures and the impact of foreign exchange.(2) Excluding France and the United Kingdom.
FranceUnited
Kingdom
Rest of the
World
North
AmericaGroup
Organic growth (%) (1)
5
Europe (2) Asia-Pacific

45.4%
40.3%
14.3%
26.8%
23.6%17.7%
13.0%
10.4%
8.5%
2017 ADJUSTED REVENUE BREAKDOWN
United
Kingdom
Rest of
the World
North
America
France
(1) Excluding France and the United Kingdom. 6
Europe (1)
Asia-Pacific
Street
Furniture
Transport
Billboard

DIVERSIFIED ADVERTISER PORTFOLIOWITH GROWING INTERNET
▪ Top 10 clients represent only 11.3% of Group revenue
Digital free standing street furniture, Berlin, Germany 7
# Category2017
revenue %
YoY %
change
1 Retail 16.1% +0.7%
2 Entertainment, Leisure & Film 11.5% -0.2%
3 Personal Care & Luxury Goods 10.2% -0.1%
4 Finance 9.8% +0.6%
5 Food & Beverage 7.5% -0.7%
6 Telecom & Technology 6.4% +0.2%
7 Automotive 5.9% -0.3%
8 Services 5.7% -0.1%
9 Travel 5.6% 0.0%
10 Internet 5.5% +0.9%

134
534638
764859
952
1,185 1,236 1,275
8%
23%
26%
29%
32%34%
37% 36%37%
2004 2010 2011 2012 2013 2014 2015 2016 2017
Revenue from Faster-growth markets Faster-growth markets' revenue as a % of Total revenue
STRONG EXPOSURE TO FASTER-GROWTH MARKETS
In million €. Adjusted figures.
"Faster-growth markets” include Central & Eastern Europe (excl. Austria), Baltic countries, Russia, Turkey, Ukraine, Latin America, Asia (China incl. Hong Kong and Macau, Mongolia, Thailand, South Korea,
Singapore, India), Africa, Middle East and Central Asia. 8

10.8%
84.8%
4.4%
38.4%
53.9%
7.7%
6.8%
8.9%
10.5%
12.9%
16.6%
2013 2014 2015 2016 2017
DOOH DRIVES GROWTH
9
Adjusted figures
Group digital revenue as a % of total Group revenue
+33% CAGR
Breakdown by segment
2013 2017
Billboard
Transport
Street
FurnitureBillboard
Transport
Street
Furniture

1.5%
3.3%
4.9%
8.5%
14.0%
2013 2014 2015 2016 2017
VERY STRONG GROWTH OFDIGITAL STREET FURNITURE
10
Adjusted figures
Street Furniture digital revenue as a % of total Street Furniture revenue
+88% CAGR
Digital bus shelter on Oxford Street, London, UK

15.3%
17.9% 17.5%
19.7%
22.2%
2013 2014 2015 2016 2017
TRANSPORT BECOMES MORE AND MORE DIGITAL
11
Adjusted figures
Transport digital revenue as a % of total Transport revenue
+19% CAGR
Mock-up from Guangzhou Baiyun International airport (Terminal 2), China

2.0%3.3%
6.5%7.5%
8.9%
2013 2014 2015 2016 2017
DIGITAL BILLBOARD: LESS IS MORE
12
Adjusted figures
Billboard digital revenue as a % of total Billboard revenue
+46% CAGR
Digital billboard, Chicago, United States

4 COUNTRIES GENERATE 70% OF DIGITAL REVENUE
13Digital bus shelters, New York, United States
52%
40%
14%
10%
Digital penetration (% of country revenue)

Digital bus shelter in The City of London, United Kingdom
LONDON:WORLD’S LARGEST DIGITAL BUS SHELTER NETWORK
14
▪ 720 digital 84" screens delivering prime audiences in all London Boroughs including now The City of London where advertising on bus shelters was not permitted

+12.0%
+2.7%
+0.9%
-1.0%
JCDecauxUSA
Lamar OUTFRONT CCO(e)
Reported growth in local currency (in %)
Digital bus shelter, New York, United States
PRIME DIGITAL OOH ASSETS DRIVE JCDECAUX’SSTRONG ADVERTISING OUTPERFORMANCE IN THE US
15Source: Companies news releases, JCDecaux estimates(e): Estimates

Synchronised digital screens in a bus shelter, Chicago, United States
CHICAGO: FIRST US CITY TO APPROVE FULL MOTION CONTENT ON DIGITAL STREET FURNITURE
16
▪ Chicago Street Furniture becomes digital with 150 86" screens with full motion content in prime CBD locations

245
240
85
Incremental gross ad spend
Share of total incremental ad spend in Germany in 2017
5.8%6.0%
6.6%6.7%
7.1%
2013 2014 2015 2016 2017
OOH share (as a % Germany ad spend)
(e)
OOH GAINS SHARE IN GERMANY
17Source: ZAW (Zentralverband der Deutschen Werbewirtschaft)
*Including Mobile, excluding Search
43% OOH
Online*
TV

2018
Nice
Île-de-France:- Defacto
- Neuilly-sur-Seine
- Levallois-Perret
- CD 92
Calais
Le Havre
Rouen
Saint-Lô
Quimper
Nantes
Angers
Bayonne / Anglet
Montpellier
Marseille
Bourges
VichyLimoges
Sainte
Maxime
Cannes
Lens
Reims
Mulhouse
Toulouse
FréjusAntibes
Existing digital Street Furniture
Digital Street Furniture to be installed in 2018
FRANCE:DIGITAL STREET FURNITURE ROLL-OUT ACCELERATES
18
DECEMBER 2017:
220 screens
DECEMBER 2018:
≈ 570 screens

Chengdu
Airport: 37mio PAX
Chongqing
Airport: 28mio PAX
Metro: 4 lines (2.6mio PAX)
Shenyang
Airport: 17mio PAX
Beijing
Airport: 54mio PAX
Metro: 11 lines (11m PAX) Tianjin
Metro: 1 line (0.7mio PAX)
Shanghai
Airport: 112mio PAX
Metro: 13 lines (12mio PAX)
Suzhou
Metro: 2 lines (0.6mio PAX)
Guangzhou
Airport (Terminal 2): 45mio PAXMetro: 6 lines (3.2mio PAX)
Macau
Airport: 7.2mio PAXHong Kong
Airport: 73mio PAX
Metro: 8 lines (4.9mio PAX)
Nanjing
Metro: 3 lines (1.6mio PAX)
Passenger traffic data for airports are annual data.
Passenger traffic data for metros are daily data.
#1 with 370mio PAX annually in JCDecaux airports
#1 with 37mio PAX daily in JCDecaux metros
CHINA: JCDECAUX’S LARGEST MARKET
19
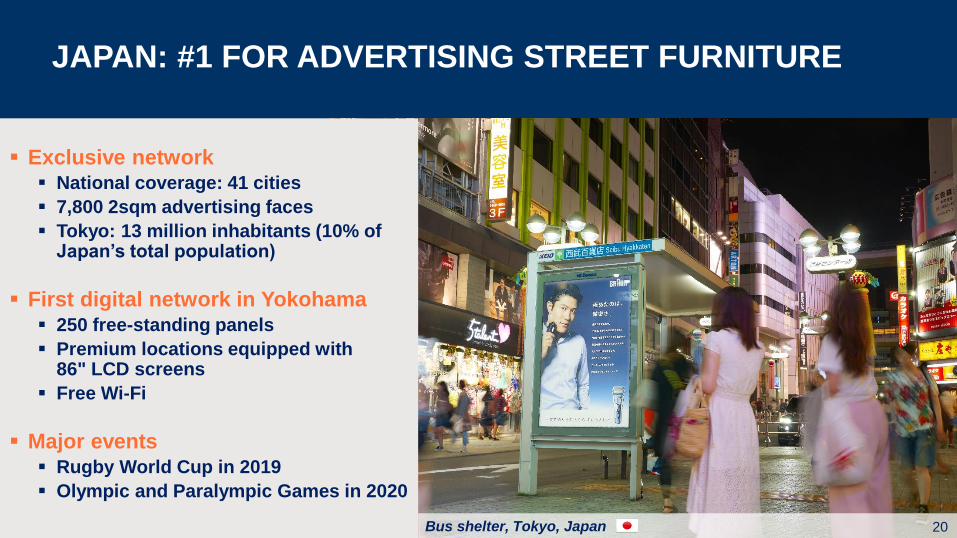
Bus shelter, Tokyo, Japan
JAPAN: #1 FOR ADVERTISING STREET FURNITURE
20
▪ Exclusive network▪ National coverage: 41 cities
▪ 7,800 2sqm advertising faces
▪ Tokyo: 13 million inhabitants (10% of Japan’s total population)
▪ First digital network in Yokohama▪ 250 free-standing panels
▪ Premium locations equipped with 86" LCD screens
▪ Free Wi-Fi
▪ Major events▪ Rugby World Cup in 2019
▪ Olympic and Paralympic Games in 2020

Mock-up of digital street furniture on Orchard Road, Singapore
#1 IN OUTDOOR ADVERTISING IN SINGAPORE
21
▪ 7-year advertising contract with LTA▪ 1,459 bus shelters island wide
▪ 800 advertising panels including 86"digital screens mainly on Orchard road
▪ Singapore: 5.6 millions inhabitants
▪ Orchard Road, the prime shopping area of Singapore
▪ Consolidation of our leadership▪ Extension of the success of our Changi
Airport media offer to Downtown Singapore
▪ Operations in shopping malls and cinemas

AUSTRALIA:WORLD’S 7TH LARGEST ADVERTISING MARKET
Digital Yarra trams shelters, Melbourne, Australia 22
▪ Digital roll-out of 2,500 screens will begin in Q2 with Yarra trams (Melbourne) and Telstra(in the 5 largest cities covering 64% of Australian population)
▪ JCDecaux’s OOH market share will double

Free standing street furniture on Paseo de la Reforma, Mexico City, Mexico
#1 IN OUTDOOR ADVERTISING IN LATIN AMERICA
23
MERGER WITH CMI IN MEXICO
▪ JCDecaux will own 60% of the joint-venture
▪ 2nd largest advertising marketin Latin America (1)
▪ National network with high-quality locations in large metropolitan areas such as Mexico City, Monterrey and Guadalajara
▪ Accelerating consolidation
(1) Source: ZenithOptimedia Market Research Report

BRAZIL: STRONG ORGANIC GROWTH
24
▪ São Paulo area▪ 21% of Brazilian population
(43m inhabitants)
▪ 32% of Brazil’s GDP
▪ São Paulo-Guarulhos airport▪ 10 years
▪ From 36mio PAX to 41mio PAX in 2018
▪ 3 airports in Brazil including 2 in the Top 5 (Brasilia, São Paulo)
▪ São Paulo metro▪ 10 years
▪ 3 main metro lines
▪ 3.6mio PAX daily
▪ 52 stations out of 61
Street Furniture
Airport
Metro
Billboard
Manaus Fortaleza
Brasilia
Salvador
Rio de JaneiroSão Paulo
Natal
Belém
São Luis
Curitiba
Belo Horizonte
Porto Alegre

RECENT CONTRACT WINS & RENEWALS
Contract renewals / extensionsNew contracts
25
STREET FURNITUREGermany Mannheim street furniture
Germany Berlin street furniture
Belgium Liege street furniture
Finland Helsinki bus and trams shelters
France Lyon street furniture
France Nice bus shelters
Australia Digital payphones with Telstra
The Netherlands The Hague CIPs
TRANSPORTHong Kong Hong Kong trams
Belgium Brussels International airport
France Toulouse-Blagnac airport
France Toulon Hyères airport
Spain Bilbao metro
STREET FURNITUREJapan Tokyo bus shelters
France Nantes Métropole street furniture
The Netherlands Rotterdam bus and trams shelters
Ecuador Guayaquil street furniture
United Arab Emirates Dubai street furniture
Sweden Free-standing panels and e-bikes in Stockholm
Australia Yarra trams shelters in Melbourne
Mexico Metrobus Line 7 in Mexico City
Myanmar Yangon street furniture
Singapore Singapore street furniture
TRANSPORTThe Netherlands Rotterdam trams, buses and metro
Panama Panama Tocumen International airport
China Guangzhou Baiyun International airport (Terminal 2)
Brazil São Paulo metro
Brazil São Paulo-Guarulhos International airport
Bahrain Bahrain International airport
Colombia Bogota El Dorado International airport
Australia Yarra trams in Melbourne
Luxembourg Network rail of Luxembourg
Includes digital
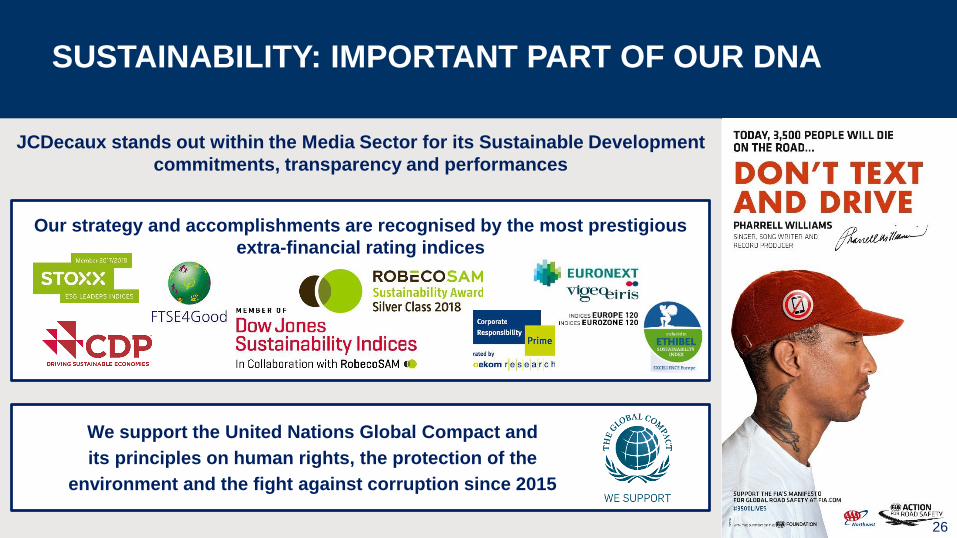
JCDecaux stands out within the Media Sector for its Sustainable Development
commitments, transparency and performances
SUSTAINABILITY: IMPORTANT PART OF OUR DNA
26
Our strategy and accomplishments are recognised by the most prestigious
extra-financial rating indices
We support the United Nations Global Compact and
its principles on human rights, the protection of the
environment and the fight against corruption since 2015

FINANCIAL HIGHLIGHTS
David Bourg
Chief Financial & Administrative Officer

▪ Under IFRS 11, applicable from January 1st, 2014, companies under joint control previouslyconsolidated using the proportionate method are accounted for using the equity method.
▪ However, operating data of the companies under joint control will continue to be proportionatelyintegrated in the operating management Group reports on which operating management relies in theirdecision making.
▪ Indeed, operating management considers this information to measure the operating performance and toinform their decision making. Consequently, the operating data presented in this document is“adjusted” to reflect the contribution of companies under joint control.
▪ As regards the Profit & Loss, it concerns all aggregates down to the EBIT. As regards the cash flowstatement, it concerns all aggregates down to the free cash flow.
▪ We systematically present the reconciliations between the IFRS data and the adjusted data, incompliance with the AMF’s instructions. Reconciliations are provided in the Appendices section.
IMPLEMENTATION OF IFRS 11
28

In million Euros, except %. Adjusted figures (1) except when IFRS. 2017 2016
► Revenue 3,471.9 3,392.8 +2.3%
► Operating margin 653.5 646.5 +1.1%
► EBIT before impairment charge (2) 358.1 351.4 +1.9%
► Net income Group share before impairment charge, IFRS (3) 204.3 223.5 -8.6%
► Net income Group share, IFRS 193.7 224.7 -13.8%
► Net cash flow from operating activities 432.6 506.0 -14.5%
► Free cash flow 142.9 263.7 -45.8%
► Net debt as of end of period, IFRS 384.4 418.6
2017 ANNUAL RESULTS
(1) Adjusted figures include our prorata share in companies under joint control accounted for using the equity method under IFRS 11.(2) The impact of the impairment charge on EBIT in 2017 corresponds to a -€9.4m impairment on intangible assets and PP&E and a -€2.9m net provisions for onerous contracts. The impact of the impairment charge on EBIT in 2016 corresponds to a +€0.5m
reversal on impairment on intangible assets and PP&E and a +€1.2m reversal on provisions for onerous contracts.(3) The impact of the impairment charge on Net income Group share in 2017 corresponds to an impairment charge on intangible assets and PP&E and a net provision for onerous contracts (net of tax and net of the impact on minority interests) for -€10.6m. The
impact of the impairment charge on Net income Group share in 2016 corresponds to a reversal on impairment on intangible assets and PP&E and a reversal on provisions for onerous contracts (net of tax and net of the impact on minority interests) for +€1.2m.
Please refer to the Appendices section for financial definitions.
29

-1.0%
+1.5%
+0.4%
+4.9%
+6.5%
+5.8%
+3.2%
+2.3%
Q1 Q2 H1 2017 Q3 Q4 H2 2017 FY 2017 FY 2017Reported
Revenue organic growth (%) (1)
STRONG REVENUE GROWTH IN H2
(1) Organic growth = excluding acquisitions / divestitures and the impact of foreign exchange. 30
Organic growth

ANALYSIS OF OPERATING MARGIN
31
In million Euros, except %. Adjusted figures. 2017 2016
► Revenue 3,471.9 3,392.8 +2.3%
• Rent & fees (1,503.2) (1,477.6) +1.7%
• Other net operational expenses (1,315.2) (1,268.7) +3.7%
► Operating margin 653.5 646.5 +1.1%
Please refer to the Appendices section for financial definitions.
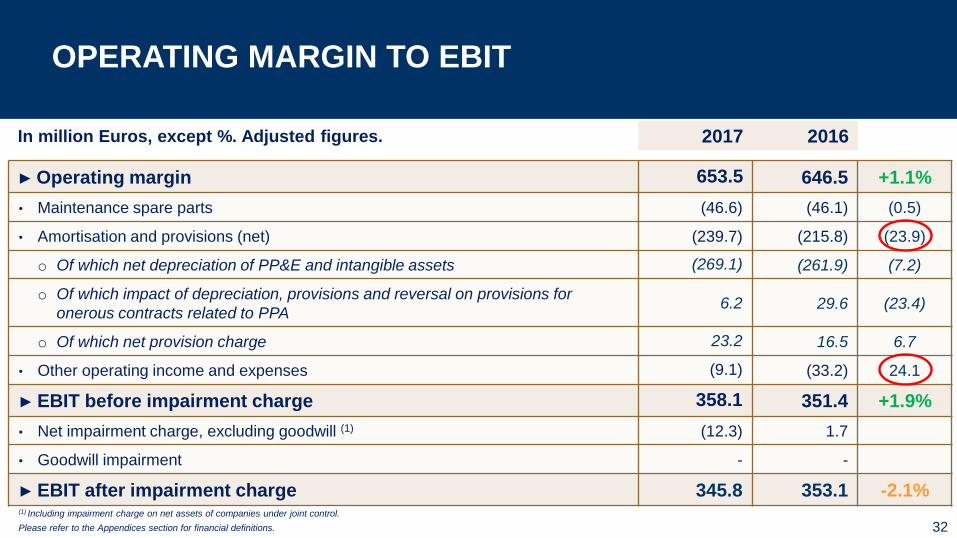
OPERATING MARGIN TO EBIT
In million Euros, except %. Adjusted figures. 2017 2016
► Operating margin 653.5 646.5 +1.1%
• Maintenance spare parts (46.6) (46.1) (0.5)
• Amortisation and provisions (net) (239.7) (215.8) (23.9)
o Of which net depreciation of PP&E and intangible assets (269.1) (261.9) (7.2)
o Of which impact of depreciation, provisions and reversal on provisions for
onerous contracts related to PPA6.2 29.6 (23.4)
o Of which net provision charge 23.2 16.5 6.7
• Other operating income and expenses (9.1) (33.2) 24.1
► EBIT before impairment charge 358.1 351.4 +1.9%
• Net impairment charge, excluding goodwill (1) (12.3) 1.7
• Goodwill impairment - -
► EBIT after impairment charge 345.8 353.1 -2.1%
32
(1) Including impairment charge on net assets of companies under joint control.
Please refer to the Appendices section for financial definitions.

26.7%
12.7% 11.2%
18.8%13.8%
8.5%4.3%
10.3%
MARGINS BY SEGMENT
EBIT (1)
(% of revenue)
Adjusted figures
Operating margin
(% of revenue)
Adjusted figures
33
-70bp
+10bp
-50bp
-30bp
-130bp
+110bp
-100bp
-10bp
(1) Before impairment charge
Street
FurnitureTransport Billboard Group
Street
FurnitureTransport Billboard Group

EBIT TO NET INCOME
In million Euros, except % 2017 2016
► Adjusted EBIT after impairment charge 345.8 353.1 -2.1%
• Restatement of EBIT from companies under joint control (110.2) (100.8)
► EBIT after impairment charge, IFRS 235.6 252.3 -6.6%
• Financial income / (loss) (1) (33.1) (28.9)
• Tax (98.7) (73.6)
• Equity affiliates 100.3 95.2
• Minority interests (1) (10.4) (20.3)
► Net income Group share, IFRS 193.7 224.7 -13.8%
• Net impact of impairment charge 10.6 (1.2)
► Net income Group share before impairment charge, IFRS 204.3 223.5 -8.6%(1) Excluding discounting and revaluation of debt on commitments to purchase minority interests (-€2.1m in 2017 and +€10.1m in 2016).
Please refer to the Appendices section for financial definitions.
34

CASH FLOW STATEMENT
35
In million Euros 2017 2016
► Adjusted funds from operations net of maintenance costs 436.9 458.1 (21.2)
• Adjusted change in working capital requirement (4.3) 47.9 (52.2)
► Adjusted net cash flow from operating activities 432.6 506.0 (73.4)
• Adjusted capital expenditure (289.7) (242.3) (47.4)
► Adjusted free cash flow 142.9 263.7 (120.8)
• Restatement from companies under joint control 16.5 (34.2)
► Free cash flow, IFRS 159.4 229.5
• Dividends (131.7) (133.1)
• Equity increase (net) 1.1 0.5
• Financial investments (net) (1) (15.8) (93.4)
• Others (2) 21.2 (21.6)
► Change in Net debt (Balance Sheet), IFRS (34.2) 18.1
► Net debt as of end of period, IFRS 384.4 418.6
(1) Excluding net cash of acquired and sold
companies.
(2) Non cash variations (mainly due to
consolidation scope variations, translation
differences on net debt, the impact of IAS 39
and finance lease and reclassifications) and
including net cash of acquired and sold
companies.
Please refer to the Appendices section for
financial definitions.

2 23 25 29 2545 42 30
53
11139 50 53 55
5489
8466
67
9393 86
142 101
98 128
171
9.4%
6.6% 6.8%6.4%
8.3%
7.1%7.2%
7.1%
8.3%
0
50
100
150
200
250
300
350
2009 2010 2011 2012 2013 2014 2015 2016 2017
General investments Renewal capex Growth capex Capex as a % of revenue
200 242229155 168179 168 222 290
In million €. Adjusted figures
BREAKDOWN OF CAPEX
36

2017 FINANCIAL HIGHLIGHTS
# Another year of record revenue driven by digital and a stronger than expected H2
# Street Furniture margin progressing but Group margins impacted by Transport
and Billboard
# Net income Groupe share before impairment charge decreasing, mainly due
to the mechanical impact related to the US Federal tax reform on our tax charges
# Higher capex as expected mainly due to new contracts in China and Brazil
# Strong financial flexibility
# Dividend per share for 2017 proposed at €0.56
37

GROWTH STRATEGY AND OUTLOOK
Jean-Charles Decaux
Co-CEO
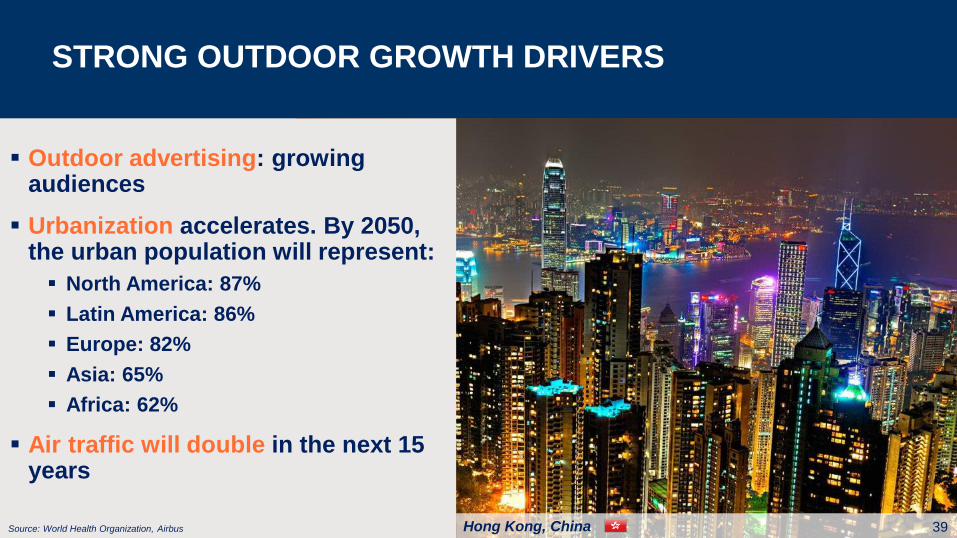
▪ Outdoor advertising: growing audiences
▪ Urbanization accelerates. By 2050, the urban population will represent:
▪ North America: 87%
▪ Latin America: 86%
▪ Europe: 82%
▪ Asia: 65%
▪ Africa: 62%
▪ Air traffic will double in the next 15 years
Hong Kong, China
STRONG OUTDOOR GROWTH DRIVERS
39Source: World Health Organization, Airbus

6%15%5%
11%
6%
13%21%
33%
62%
28%
Population GDP
Small cities (<150k)
Cities 150k-2m
Cities 2m-5m
Cities 5m-10m
Megacities (>10m)
17%
39%
GLOBAL WEALTH IS CONCENTRATED IN CITIES
40Source: Central banks, McKinsey
▪ 15% of global GDP comes from mega cities (>10m people)
▪ 39% of global GDP comes from cities with more than 2m people

STARTING WITH A UNIQUE PRESENCE IN EUROPE
▪ A strong Street Furniture footprint in 36 out of the 50 largest European cities
# City JCDecaux
1 London ✓
2 Berlin ✓
3 Madrid ✓
4 Rome
5 Vienna ✓
6 Paris ✓
7 Brussels ✓
8 Bucharest
9 Hamburg ✓
10 Warsaw
11 Budapest ✓
12 Barcelona ✓
13 Munich ✓ 41
# City JCDecaux
14 Milan ✓
15 Prague ✓
16 Sofia ✓
17 Birmingham ✓
18 Cologne ✓
19 Amsterdam ✓
20 Naples ✓
21 Stockholm ✓
22 Turin ✓
23 Marseille ✓
24 Rotterdam ✓
25 Valencia ✓
26 Krakow
# City JCDecaux
27 Frankfurt
28 Lodz
29 Sevilla ✓
30 Zagreb
31 Palermo
32 Zaragoza ✓
33 Athens
34 Riga ✓
35 Wroclaw
36 Helsinki ✓
37 Stuttgart ✓
38 Copenhagen ✓
39 Dusseldorf ✓
# City JCDecaux
40 Glasgow
41 Dortmund ✓
42 Genova ✓
43 Essen
44 Liverpool
45 Malaga ✓
46 Bristol
47 Leipzig ✓
48 Bremen ✓
49 Gothenburg ✓
50 Dublin ✓

0
100
200
300
400
500
600
JCDecaux's operations
Top 15 cities worldwide by GDP in 2030 (in GBP billion)
AND NOW COVERING 12 OF THE 15 MOST CONTRIBUTING CITIES TO GLOBAL GDP IN 2030
42Source: Oxford Economics
▪ Urbanisation accelerates: 60% of global GDP will come from 600 cities in 2030

GLOBAL TRIPLE PLAY OFFER
43
Paris
London
Shanghai
Sydney
Mexico
Tokyo
New York
Dubai
Beijing
São Paulo
Los Angeles
Moscow
Hong Kong
Singapore
New Delhi
Street Furniture
Billboard
Transport Johannesburg

354 363 374 384
180 191 202 213 10 11
12 14
2017 2018 2019 2020
Mature markets Faster-growth markets Rising markets
Global ad spend - 2017 - 2020
+12.5%
+5.6%
+2.8%
+3.9%
544565
588611
In $bnCAGR
Dubai International airport, UAE
FASTER-GROWTH MARKETS FUEL GLOBAL AD SPEND
44
Thirty Rising Media markets: Algeria, Angola, Bangladesh, Bolivia, Cambodia, Cameroon, Côte d’Ivoire, Cyprus, Dominican Republic,
Ethiopia, Gabon, Ghana, Guatemala, Iran, Jamaica, Kenya, Mongolia, Morocco, Mozambique, Myanmar, Namibia, Paraguay, Senegal,
Sri Lanka, Tanzania, Togo, Trinidad and Tobago, Tunisia, Uganda and Zambia.
In red, JCDecaux’s presence
Source: ZenithOptimedia December 2017 Advertising Expenditure Forecasts, JCDecaux estimates

▪ Air traffic double every 15 years
▪ From 1.2bn passengers in 2016 to 2.4bn passengers in 2031
▪ +5.8% CAGR in Emerging markets
▪ +3.2% CAGR in Mature markets
▪ Leading to a global +4.4% CAGR
▪ JCDecaux covers the largest worldwide audience in airports, with 28% of total passengers traffic
▪ Operating 218 airports in 38 countries
▪ 60% air traffic coverage among the Top 15 airports worldwide
Shanghai International airport, China
UNIQUE GLOBAL AIRPORT PLATFORM
45Source: ICAO, Airbus GMF

13.5%
11.5%
10.2%
2.9%2.0%
0.7% 0.7%
-0.6%
-3.6%-4.3%
Ad spend growth by medium 2017-2020 (CAGR)
DOOH:SECOND FASTEST GROWING MEDIUM
46Source: ZenithOptimedia December 2017, JCDecaux estimates

55%53%
51%48%
39%
32% 32%30%
% of positive receptivity for Gen Z and Gen Y▪ 55% of Gen Z and Gen Y audiences feel positive
with an OOH ad
▪ Gen Z relies on visuals and would not skip OOH
▪ Gen Z likes online but dislikes online ads▪ Only 32% feel positive about online advertising
▪ 75% don’t like mobile ads
▪ 70% skip online ads
▪ 52% use ad blockers
▪ “Ads outdoors are well designed and attractive. It’s a relaxing moment to see these ads while waiting for [a] bus or someone” – Testimony from a respondent
MILLENNIALS LIKE OOH
47Source: Kantar Millward Brown, Accenture

AUTOMATED DATA-LED AUDIENCE SALES PLATFORM
48
Connects to external
platform ecosystemsDynamic content
and
ad-serving platform
Supply side data
management platform
enables campaign and
audience optimisation
Automated trading
platform
SmartAPI

DUBAI: DRIVE-TO-STORE AND DATA-DRIVEN OFFER
JCDecaux screens, Dubai International airport, UAE 49
Dubai Duty Free screens, Dubai International airport, UAE
▪ A partnership with Dubai Duty Free to introduce a new Drive-to-Store, data-driven advertising offer at Dubai International airport
▪ Objectives of this partnership▪ To develop “Drive-to-store” media
solutions combining both digital media offers and JCDecaux SMART concept
▪ Sales strategy▪ Dubai Duty Free will share sales data
with JCDecaux to optimise the SMART sales strategy

Changi International airport, Singapore
SINGAPORE:ROI BOOSTED BY INNOVATIVE DIGITAL CAMPAIGN
50
▪ Changi International airport▪ “Most Innovative Contribution to a Campaign
by a Media Owner” by the 2017 Singapore Media Awards
▪ Campaign with Martell (Pernod Ricard)*
▪ Targeted and dynamic campaign▪ 91% unique click-through rate from WeChat
Shake
▪ 67% redemption rate
▪ Double-digit growth compared to same month last year
* Campaign conducted under the applicable legislation in Singapore.
Excessive drinking is dangerous for the health; alcoholic beverages should be consumed with moderation.

Creative DOOH corridor, Chongqing airport, China
CREATIVITY AWARDED IN ASIA
51
THE MOODIES 2018
▪ Best airport advertising campaign with Martell (Singapore Changi airport)
▪ Most Impactful Individual Advertising Execution (Chongqing airport)
▪ Best Use of Paid Social with Lancôme Travel Retail Asia Pacific (Hong Kong airport)
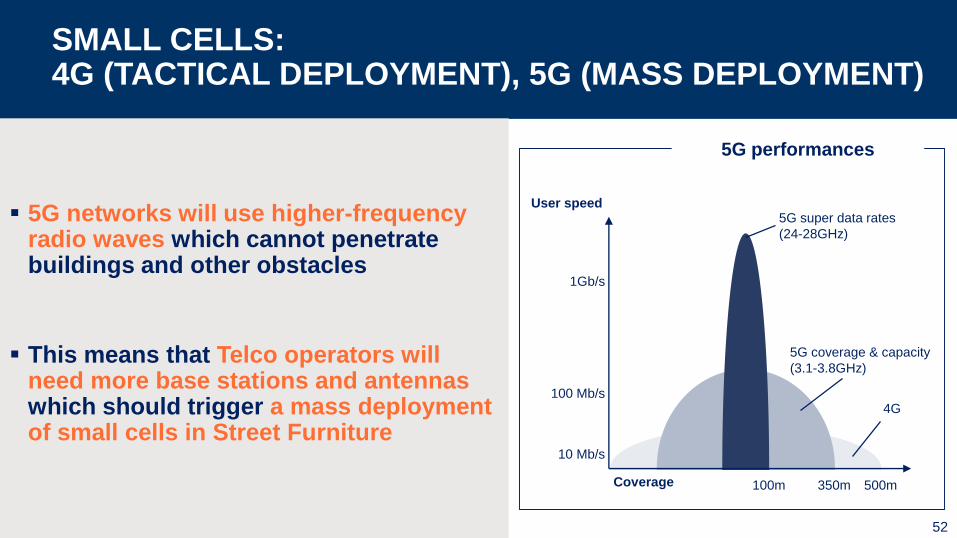
SMALL CELLS:4G (TACTICAL DEPLOYMENT), 5G (MASS DEPLOYMENT)
52
▪ 5G networks will use higher-frequency radio waves which cannot penetrate buildings and other obstacles
▪ This means that Telco operators will need more base stations and antennas which should trigger a mass deployment of small cells in Street Furniture
5G performances
Coverage
User speed
500m350m100m
1Gb/s
100 Mb/s
10 Mb/s
5G super data rates
(24-28GHz)
5G coverage & capacity
(3.1-3.8GHz)
4G

MAIN TENDERS EXPECTED IN 2018-2019
Street FurnitureEurope
Berlin bus shelters, Leipzig
Paris CIPs
Lisbon
Utrecht
Barcelona
Rome
North America
West Hollywood
San Francisco
Asia-Pacific
Sydney
ASEAN (Southeast Asia)
India
Japan
Rest of the World
St. Petersburg
Belo Horizonte bus shelters and clocks
Campinas
Transport BillboardEurope
Budapest metro
Network Rail
AENA airports
Asia-Pacific
Metros in Chinese cities
Terminals in Chinese airports
India
Rest of the World
Santiago de Chile metro
Abu Dhabi airport
South African airports
On-going tenders
53
Rest of the World
St. Petersburg
Kazan

0.6x1.4x
3.6x5.0x
7.1x
10.8x
STRONGEST BALANCE SHEET IN THE INDUSTRY
JCDecaux Ströer Lamar OUTFRONT Media CCO / iHeartMedia (2)
Net debt / EBITDA, IFRS (1) 0.6x 1.4x 3.6x 5.0x 7.1x / 10.8x
Gross debt $1.7bn $650m $2.6bn $2.3bn $5.1bn / $20.4bn
Maturity date 2018-2023 2022 2019-2026 2022-2025 2020-2022 / 2018-2027
Credit Rating (S&P) BBB NA BB- BB- B- / CCC+
Credit Rating (Moody’s) Baa2 NA Ba3 Ba3 NA / Caa2
Source: Company news releases.
Currency conversions are based on an exchange rate $/€ of 0.8338 (closing rate) as of December 31st, 2017 for JCDecaux and Ströer.
Ströer figures are based on preliminary 2017 results and JCDecaux estimates.(1) For consistency purposes, maintenance spare parts have been reclassified in the Operating margin for JCDecaux.(2) CCO and iHeartMedia are 2016 numbers as their 2017 numbers are not released yet. 54

335
1,2601,541
738
1,521
3,587
1,302
1,588
802
481 306 292 263 263 260 243 208 156
Sources: Company news releases. Currency conversions are based on an annual average exchange rate $/€ of 0.8852, CHF/€ of 0.8995, HKD/€ of 0.1136, AUD/€ of 0.6788 and RUB/€ of 0.0152.(1) Does not include revenue from APG|SGA and Metrobus, companies integrated through the equity method in JCDecaux’s financial statements. (2) JCDecaux’s estimate of 2017 revenue. (3) Ströer’s revenue are split into
Ströer Digital ($802m) and Ströer Germany and International ($738m).
iHEARTMEDIA’S PENDING DEBT RESTRUCTURINGWILL TRIGGER MORE CONSOLIDATION
3,922 (1)
North America operations
International operations
excluding North America
2017 Out-of-Home revenue ($m)
55
2,562
1,540
Intersection (2)JCDecaux CCO(2) Focus
Media(2) Lamar Ströer(3) OUTFRONT
MediaAPG|SGA
Russ
OutdoorAsiaray (2)Metrobus
Clear
Media(2)
Exterion
Media(2)
30% 33%
Eq
uity
me
tho
dAPN
OutdooroOh!media

▪ 2017 financial performance▪ Another year of record revenue driven by digital and a stronger than expected H2
▪ Street Furniture margin progressing but Group margins impacted by Transport and Billboard
▪ Net income Groupe share before impairment charge decreasing, mainly due to the mechanical impact related to the US Federal tax reform on our tax charges
▪ Higher capex as expected mainly due to new contracts in China and Brazil
▪ Solid financial flexibility
▪ Dividend per share for 2017 proposed at €0.56
▪ Investments for future growth▪ Pursue the Street Furniture’s digitisation in premium locations
▪ On-going organic growth
▪ Further consolidation opportunities
▪ Automated trading platform deployment
▪ A worldwide leadership position▪ Well-diversified geographical exposure to benefit from mature and faster-growth markets
▪ Acceleration of digital transformation in our 3 business segments
▪ On-going focus on innovation
CONCLUSION
56

Q1 2018 OUTLOOK
57
“As far as Q1 2018 is concerned,
we expect our adjusted organic revenue growth to be up around +2%,
which is significantly affected by the decision of the “Conseil d’État”
to cancel the Paris “City Information Panels” interim contract,
as well as the opening of Guangzhou Baiyun airport (Terminal 2)
which is now due in Q2 2018.”

APPENDICES

2017 2016
In million Euros Adjusted
Impact of
companies
under joint
control
IFRS Adjusted
Impact of
companies
under joint
control
IFRS
► Revenue 3,471.9 (432.1) 3,039.8 3,392.8 (418.3) 2,974.5
• Net operating costs (2,818.4) 303.4 (2,515.0) (2,746.3) 299.9 (2,446.4)
► Operating margin 653.5 (128.7) 524.8 646.5 (118.4) 528.1
• Maintenance spare parts (46.6) 1.3 (45.3) (46.1) 1.0 (45.1)
• Amortisation and provisions (net) (239.7) 17.0 (222.7) (215.8) 16.6 (199.2)
• Other operating income / expenses (9.1) 0.2 (8.9) (33.2) 0.0 (33.2)
► EBIT before impairment charge 358.1 (110.2) 247.9 351.4 (100.8) 250.6
• Net impairment charge (1) (12.3) - (12.3) 1.7 - 1.7
► EBIT after impairment charge 345.8 (110.2) 235.6 353.1 (100.8) 252.3
RECONCILIATION BETWEEN ADJUSTED FIGURES AND IFRS FIGURES – PROFIT & LOSS
59
(1) Including impairment charge on net assets of companies under joint control.

2017 2016
In million Euros Adjusted
Impact of
companies
under joint
control
IFRS Adjusted
Impact of
companies
under joint
control
IFRS
► Funds from operations net of maintenance costs 436.9 (25.4) 411.5 458.1 (19.0) 439.1
• Change in working capital requirement (4.3) 27.0 22.7 47.9 (29.9) 18.0
► Net cash flow from operating activities 432.6 1.6 434.2 506.0 (48.9) 457.1
• Capital expenditure (289.7) 14.9 (274.8) (242.3) 14.7 (227.6)
► Free cash flow 142.9 16.5 159.4 263.7 (34.2) 229.5
RECONCILIATION BETWEEN ADJUSTED FIGURES AND IFRS FIGURES – CASH FLOW STATEMENT
60

In million Euros Q1 Q2 Q3 Q4 FY
► 2016 adjusted revenue (a) 748.5 868.8 792.7 982.8 3,392.8
► 2017 IFRS revenue (b) 670.2 770.6 712.1 886.9 3,039.8
• IFRS 11 impacts (c) 87.4 113.2 99.9 131.6 432.1
► 2017 adjusted revenue (d) = (b) + (c) 757.6 883.8 812.0 1,018.5 3,471.9
• Currency impacts (e) (4.1) 1.0 21.5 30.6 49.0
► 2017 adjusted revenue at 2016 exchange rates (f) = (d) + (e) 753.5 884.8 833.5 1,049.1 3,520.9
• Change in scope (g) (12.4) (2.9) (1.9) (2.5) (19.7)
► 2017 adjusted organic revenue (h) = (f) + (g) 741.1 881.9 831.6 1,046.6 3,501.2
► Organic growth (i) = (h) / (a) -1.0% +1.5% +4.9% +6.5% +3.2%
RECONCILIATION OF ORGANIC GROWTH (1/2)
61

In million EurosImpact of currency
in 2017
• GBP 25.3
• USD 6.0
• RMB 16.2
• HKD 5.0
• Other (3.5)
► Total 49.0
RECONCILIATION OF ORGANIC GROWTH (2/2)
62
Average exchange rate 2017 2016
• GBP 1.1407 1.2203
• USD 0.8852 0.9034
• RMB 0.1311 0.1360
• HKD 0.1136 0.1164

FINANCIAL DEFINITIONS
Organic growthThe Group’s organic growth corresponds to the adjusted revenue growth excluding foreign exchange impact and perimeter effect.
The reference fiscal year remains unchanged regarding the reported figures, and the organic growth is calculated by converting the
revenue of the current fiscal year at the average exchange rates of the previous year and taking into account the perimeter variations
prorata temporis, but including revenue variations from the gains of new contracts and the losses of contracts previously held in our
portfolio
Operating marginRevenue less Direct Operating Expenses (excluding Maintenance spare parts) less SG&A expenses
EBIT (Earnings Before Interests and Taxes)Operating Margin less Depreciation, amortisation and provisions (net) less Impairment of goodwill less Maintenance spare parts less
Other operating income and expenses
Free cash flowNet cash flow from operating activities less capital investments (property, plant and equipment and intangible assets) net of disposals
Net debtDebt net of managed cash less bank overdrafts, excluding the non-cash IAS 32 impact (debt on commitments to purchase non-
controlling interests), including the non-cash IAS 39 impact on both debt and hedging financial derivatives63

FORWARD LOOKING STATEMENTS
This presentation may contain some forward-looking statements. These statements are
not undertakings as to the future performance of the Company. Although the Company
considers that such statements are based on reasonable expectations and assumptions
on the date of publication of this presentation, they are by their nature subject to risks
and uncertainties which could cause actual performance to differ from those indicated or
implied in such statements.
These risks and uncertainties include without limitation the risk factors that are described
in the Registration Document registered in France with the French Autorité des Marchés
Financiers.
Investors and holders of shares of the Company may obtain copy of such Registration
Document by contacting the French Autorité des Marchés Financiers on its website
www.amf-france.org or directly on the Company website www.jcdecaux.com.
The Company does not have the obligation and undertakes no obligation to update or
revise any of the forward-looking statements.64


