November 2017 2017 Annual Review of Salary and Benefits for International Staff, National Staff, and Administrative Staff Distribution of this document is restricted until it has been approved by the Board of Directors. Following such approval, ADB will disclose the document to the public in accordance with ADB's Public Communications Policy 2011.
Transcript
November 2017
2017 Annual Review of Salary and Benefits for International Staff, National Staff, and Administrative Staff
Distribution of this document is restricted until it has been approved by the Board of Directors. Following such approval, ADB will disclose the document to the public in accordance with ADB's Public Communications Policy 2011.
ABBREVIATIONS
ADB – Asian Development Bank
IFI – international financial institution
NSAS – national staff and administrative staff
US – United States
WBG – World Bank Group
WPBF – work program and budget framework
WTW – Willis Towers Watson
NOTE
In this report, "$" refers to United States dollars, unless otherwise stated.
GLOSSARY
comparatio – The ratio of actual salaries (total payroll) to the salary range midpoints for the same number and mix of staff. A 100% comparatio indicates that pay is aligned with ADB’s midpoints and thus with the chosen market references (75th percentile).
salary dilution – Expresses the effect that leads to a lower comparatio at the end of
the year than at the time of the review. This results from changes in the staff mix (new hires, departures, promotions). Salary dilution within the year occurs because staff members who depart, generally have a higher salary than new hires or promoted staff.
market positioning
–
The positioning of an organization’s compensation policy within the market. ADB’s compensation policy is to pay at the 75th percentile of the market comparators.
market reference point
–
The market value in annual remuneration of the grade level that serves as the reference point for constructing the salary scale and for adjusting the salary scale and pay every year.
midpoint –
At ADB, the midpoint of the salary scale for each grade level is aligned with the market reference point (75th percentile of the market comparators).
average salary increase
–
The recommended average percentage increase to be applied to staff pay at the time of the review (January 1).
overall increase in salary budget
–
The projected growth in the amount of salaries and other salary-related personnel actions such as promotions and confirmation of appointments.
salary scale or range
–
Each grade level has a salary scale or range, which is defined in terms of a minimum, a midpoint, and a maximum within which the
salaries of staff at that grade level are administered. The minimum and maximum are equidistant to the midpoint.
salary structure
–
The full set of salary scales or ranges.
salary structure adjustment
– The average percentage increase needed to bring the salary structure in line with the market at each review.
payroll –
The sum of actual staff salaries (or staff pay) paid over a defined period (usually a month or a year) for the total number of staff of a grade level, a category of employees (administrative staff, national staff, international staff) or a whole office.
Vice-President Deborah Stokes, Administration and Corporate Management
Director General Toshio Oya, Budget, Personnel and Management Systems Department (BPMSD)
Team leader Matthew Drage, Director, Compensation, Benefits and Pension Division
(BPCB) Team member Deepali Talim, Principal Compensation and Benefits Specialist, BPCB
CONTENTS Page
EXECUTIVE SUMMARY I. INTRODUCTION 1
II. ADB COMPENSATION POLICY AND PRINCIPLES 1
III. COMPENSATION METHODOLOGY 2
A. Salary Structures as a Framework and Comparatios 3
B. Salary Increase Methodology 4
C. Salary Structure Adjustments 5
D. Merit Increase Component and Salary Dilution 5
E. Total Average Salary Increase 6
F. Application of the Salary Increase Methodology to the Three Staff Categories 6
IV. FACTORS DRIVING THE NEED FOR COMPETITIVE PAY 8
A. The Business Context 8
B. Challenges for Recruitment and Retention 9
C. Other Measures to Enhance Recruitment and Retention 9
V. OTHER DEVELOPMENTS 10
VI. RECOMMENDATION 10
VII. BUDGETARY IMPACT 11
APPENDIXES
1. Supplementary Data for Information 13
2. Proposed Salary Structures for 2018 43
EXECUTIVE SUMMARY
This paper presents to the Asian Development Bank (ADB) Board of Directors the results of the 2017 annual review of compensation and benefits for international staff, national staff and administrative staff (NSAS) at headquarters, the 30 field offices, and four extended missions. This paper seeks the Board’s approval for (i) the proposed 2018 salary structures and (ii) the corresponding average salary increases for all staff categories.
ADB’s compensation policy, as outlined in Administrative Order 3.01, is market-driven. Its methodology was approved by the Board in the last five-yearly comprehensive compensation and benefits review in 2015.The annual compensation and benefits review is an important step in assessing the competitiveness of ADB’s compensation and benefits policies, as well as their effectiveness in supporting talent acquisition, staff mobility, and retention.
With the scaling up of operations in the coming years, the recruitment and retention of skilled and talented individuals is more important than ever.
Based on the results of the 2017 compensation and benefits review, ADB Management proposes the Board consider the following:
(i) For international staff, provide a 2.2% adjustment to the salary structure and an average salary increase of 3.9% for 2018. This increase is the sum of the 2.2% adjustment to the salary structure and an additional merit increase component of 1.7%. The total budget impact of the international staff salary increase for 2018 is 2.2% (Table 2).
(ii) For NSAS at headquarters, provide a 4.2% adjustment to the salary structure and an average salary increase of 6.7% for 2018 in Philippine peso. This increase is the sum of the 4.2% adjustment to the salary structure and an additional merit increase component of 2.5%. The total budget impact of the salary increase of NSAS at headquarters for 2018 is 4.2% (Table 2).
(iii) For NSAS in the field offices, provide a 6.5% adjustment to the salary structures and an average salary increase of 8.0% for 2018 in US dollar equivalent. This increase is the sum of the 6.5% adjustment to the salary structures and an additional merit increase component of 1.5%. The total budget impact of salary increases of NSAS in field offices for 2018 is 6.5% (Table 2).
If approved by the Board of Directors, the proposed salary structures for all staff categories would become effective on 1 January 2018.
I. INTRODUCTION 1. A skilled and motivated workforce is critical for ADB to achieve its operational objectives. With the combination of Asian Development Fund lending operations and ordinary capital resources which took effect on 1 January 2017, the scaling-up of operations means that developing and retaining a skilled and effective workforce is more important than ever. 2. ADB’s business is growing and expanding in areas such as private sector development, health and education, climate change mitigation and adaptation, infrastructure, railways and urban transport and support for advanced technologies. This will require new specialized skill sets, international experience, and proficiency—all of which are in great demand internationally. ADB plans to recruit 75 new positions (45 international staff, 25 national staff, and 5 administrative staff) in 2018 and an additional 105 new positions during 2019-2020. The competitiveness of ADB’s compensation will help recruit high-caliber and experienced professionals as well as the retention of existing staff. 3. The 2017 annual review of compensation therefore focuses on assessing and ensuring the competitiveness of ADB’s compensation. The salary proposals outlined in this paper are designed to (i) maintain the value of the compensation and benefits package needed to support ADB’s objectives and (ii) allow ADB to remain an active player in the labor markets where it is recruiting. Currently, more than 48.0% of ADB’s international staff recruits are from the private sector and 31.0% are from other international financial institutions (IFI). Based on the suggestion by the Board during discussions for the 2016 review, market benchmarks for Hong Kong, China; Japan; and Singapore have been procured as a check for comparability.
4. This paper describes ADB’s approach to compensation and benefits; explains the factors driving the need for competitive pay, and proposes of salary budgets and new salary structures.
II. ADB COMPENSATION POLICY AND PRINCIPLES 5. An organization’s approach to compensation must be guided by clear principles and governed by well-accepted policies to achieve operational goals and create and maintain staff trust and commitment. 6. With the increased need for new talent and the retention of high performing staff, ADB aims to provide a remuneration package that is competitive to enable it to continue attracting and retaining the best talent, consistent with our development mission and in line with international trends. In support of this overarching goal, ADB established the following key principles outlined in Administrative Order 3.01 (Salary Administration) in its compensation system:
(i) Salaries are designed to attract and retain highly qualified and competent staff members and to motivate them to achieve the highest standards of performance.
(ii) Salaries are maintained at levels competitive with those prevailing in comparator organizations and with due regard to the duty station concerned.
(iii) ADB systematically evaluates the relative weight of each position in the salary structure, determines the equitable remuneration for similar responsibilities internally and externally, and rewards staff members according to performance, salary relativity and other relevant factors.
(iv) Salaries are administered in a manner that is both equitable and transparent to all staff.
.
2
III. COMPENSATION METHODOLOGY
7. ADB’s compensation methodology is reviewed every 5 years. The last review was conducted in 2015 and the next comprehensive compensation and benefits review is scheduled for 2020. ADB follows a principle of market-driven compensation for all staff. Salaries are positioned at the 75th percentile of the defined market for each category of staff. The difference between international staff and NSAS lies in the market reference used for salary comparisons, as follows:
(i) For international staff – the market is international. The World Bank Group (WBG) salary structure serves as the proxy for this global market, as agreed by the Board in the 2010 salary paper and reaffirmed in the 2015 comprehensive review of compensation and benefits. The WBG uses a market composition with a representation of two-thirds private sector and one-third public sector, which broadly reflects where ADB recruits from. More than 48.0% of ADB’s recruits are from the private sector and 31.0% from other IFIs. This allows ADB to remain market competitive.
(ii) For NSAS in headquarters – the market is local. Salaries are compared with those of 20 companies and international organizations in Manila.
(iii) For NSAS in field offices – the market is local. WBG data is used with data from other reputable sources such as the survey providers Birches Group and Willis Towers Watson (a mix of public and private sector organizations).
3
8. Figure 1 below describes how the 75th percentile target is derived from the comparators and how this is used to develop each salary range.
Figure 1: Illustration of ADB’s Compensation Methodology
MRP = market reference point. Note: This market position of 75th percentile is used to develop the market reference point (midpoint of each salary range).
9. Under the market-driven compensation system, salary adjustments from one year to the next are linked to the market movement of salaries, rather than directly linked to the cost of living or consumer price index movements. These indices may be reflected in the market movement of salaries in the global or local markets, which are primarily influenced by labor market conditions (e.g., supply versus demand for specific skills, economic growth, other global economic factors, and domestic fiscal conditions).
10. ADB’s compensation policy is designed to:
(i) remain market competitive by reflecting labor market changes to attract and retain top talent,
(ii) maintain a rules-based compensation system whereby salary increases are determined through a transparent formula-driven methodology;
(iii) remain fiscally prudent in recognition of budgetary requirements and in response to external market economic conditions, and
(iv) award differentiated salary increases based on performance. A. Salary Structures as a Framework and Comparatios 11. ADB creates salary ranges to reflect market pay levels and uses them to help inform decisions, such as the starting salaries for new hires, salary increases during the annual salary review process, and assessing the market competitiveness of its pay. A salary structure comprises salary ranges corresponding to each grade relevant to the staff categories and reflects
4
ADB’s desired market positioning. ADB has a salary structure for IS expressed in US dollars, a salary structure for NSAS in headquarters expressed in Philippine pesos, and a salary structure for NSAS in each field office expressed in local currencies or US dollars, based on the currency of the salary structure denomination in that location. 12. Comparatio is a measure of market competitiveness and is expressed for an individual (or across the organization as a whole) as a ratio of actual salary to the relevant salary range midpoint. A 100% comparatio indicates that the actual salary is fully aligned with ADB’s midpoint and thus with the chosen market references. Historically, ADB’s comparatio has been below 100%. Table 1 and Table A1.1 in Appendix 1 give the historical comparatio movement for international staff, while Figure 2 explains the concept of comparatios.
Figure 2: Illustration of the Comparatio Concept
CR = comparatio, IS = international staff. Note: A 100% comparatio indicates that pay is aligned with ADB’s midpoints and thus with the chosen market reference point (75th percentile).
B. Salary Increase Methodology
13. Competitive positioning of salaries is important to preserve ADB’s ability to attract new staff as well as to motivate and retain committed staff of the caliber required to conduct its operations and to meet clients’ needs. Every year an assessment of the salary structure framework is made and two components of salary increases are considered. These components are described in paras. 14 and 15, and together are crucial for ensuring staff salaries stay competitive within the market and that ADB rewards individual staff for performance while ensuring pay progression through the salary range.
5
C. Salary Structure Adjustments 14. As the market levels of pay move over time, the salary structure framework needs to be adjusted to remain reflective of the market. Benchmarking studies are conducted each year using established survey providers to assess the market movement of pay. Based on the outcomes of this analysis, salary structure adjustments need to be applied to bring the salary structure in line with the market at each review. Salary structure adjustment refers to the average percentage increase applied to the current salary structure midpoints to align with the market. Where the review supports a revision of the salary structure, appropriate recommendations and a corresponding budget request are made to move salaries in line with the movement of the salary structure framework. D. Merit Increase Component and Salary Dilution
15. Employees typically should progress through their salary range over time as they become more proficient and valuable to the organization. The speed at which employees move through their salary range is mainly based on their performance. To provide for salary progression, an additional increase, referred to as a merit increase, is required. 16. For 2018, this additional increase will be funded by estimated salary dilution during the year. If salary dilution is equal to the additional merit increase amount, the budgetary impact is neutral. Salary dilution occurs within the year as staff members who leave the organization generally have higher salaries at each grade than the newly promoted staff or new hires who replace them. This is so as the exiting staff will have progressed through their salary range over time. Salary dilution also results from growth in the number of staff positions. Salary dilution has an impact on the comparatio and the competitiveness of an organization in relation to the market, while creating savings during the year. Figure 3 below explains how salary dilution works.
6
Figure 3: Illustration of Salary Dilution
IS = international staff, MAX = maximum, MIN = minimum. Note: Average salary at each grade goes down during the year as staff who separate generally have a higher average salary than new hires or newly promoted staff. As this happens, the average comparatio goes down and the salary dilution savings go up.
E. Total Average Salary Increase 17. The total average salary increase is the sum of the salary structure adjustments and the merit increase component. It aims to (i) enhance ADB’s market competitiveness by maintaining and improving the comparatio, (ii) reward good performance, and (iii) provide for salary progression within the range to ensure individual staff compensation stays market competitive. 18. The total average salary increase is funded by a combination of a budget request and savings. Historically, a budget request has been made relating to the salary structure adjustments, whereas the merit increase component has been funded wholly or partially through savings, particularly salary dilution. For ADB to reach a 100% comparatio, the merit increase component may need to be greater than savings from salary dilution, requiring a budget request greater than the salary structure adjustment. In the 2010 comprehensive review, the Board approved the strategy to reach a comparatio target of 100% by 2015 for international staff. This target has not been achieved because of financial constraints in the budgets approved. F. Application of the Salary Increase Methodology to the Three Staff Categories 19. For international staff, the methodology continues to refer to the WBG salary structure midpoints as a proxy for the market reference. The WBG midpoints provide a valid proxy for the 75th percentile (as described in para. 7). The WBG average structure adjustment of 2.2% is considered representative of the movement of international staff salaries. 20. The proposed international staff salary structure adjustment is 2.2% and the proposed average salary increase is 3.9%. Table A2.1 in Appendix 2 details the proposed salary structure.
7
Salary dilution for 2018 is estimated at 1.7%. It is proposed that merit increase of 1.7% be funded by salary dilution. The estimated salary dilution of 1.7% for 2018 is lower than the salary dilution for 2017 (estimated at 2.3% at the start of the year), which was primarily driven by the Early Separation Program, but is higher than the average of 0.9%–1.0% until 2016. The reasons are (i) the increase in the number of staff positions and (ii) the impact of the ongoing recruitment reforms. Table 1 and Table A1.1 in Appendix 1 show the progression of international staff comparatio from 2013 to 2017. With the estimated salary dilution through 2018 of 1.7%, the comparatio at the end of 2018 will be maintained at broadly a similar level to the projections for the end of 2017,
(between 93.7% and 94.7%).
Table 1: Historical Comparatio Information for All International Staff, 2013–2018
as of 1 January
as of 31 December
Year
Confirmed Staff (No.)
Overall Actual Comparatio (%)
Overall Actual Comparatio
(%)
2013 943 93.2 92.3
2014 959 93.3 92.3
2015 963 93.9 92.8
2016 979 94.9 94.1
2017 963 96.0 93.7 – 94.7 a
2018 960 96.5 b a Estimated comparatio by 31 December 2017. A range is provided as the final comparatio will be dependent on a
number of factors, including the number of recruitments. b Estimated comparatio on 1 January 2018.
21. Table A1.5 in Appendix 1 shows the proposed salary structure adjustment, the proposed average salary increase, and the resulting comparatio before and after the salary increase. 22. For the 2017 review, market benchmarks for Hong Kong, China; Japan; and Singapore were procured to check for comparability. The analysis shows that for roles like those at ADB, the average salary movement is 4.0% for Hong Kong, China; 2.3% for Japan; and 4.0% for Singapore. This shows that the proposed average salary increase of 3.9% based on market movement indicated by the WBG data is also currently reflective of these Asian financial hubs. The World Bank total average salary increase effective 1 July 2017 was 4.9%.
23. For NSAS at headquarters, Willis Towers Watson conducted a customized survey on ADB’s behalf in August 2017 as per the Board approved methodology. The group of comparators was increased from 15 in the 2016 review to 20. These 20 comparators (listed in Appendix 1) broadly represent one-thirds public and two-thirds private companies in the Philippines and the sample includes 20% large organizations (more than 2,000 staff), 60% medium-sized organizations (500-2,000 staff) and 20% small organizations (less than 500 staff). 24. In 2017, the Philippine economy has grown at a rate of 6.4%1 with inflation at 3.3%2. The 20 comparators are projected to award an average pay increase of 6.4% for all staff categories in 2018.
1 Data from Willis Towers Watson 2017 salary survey report. 2 International Monetary Fund’s World Economic Outlook Database, April 2017.
8
25. Based on the survey results, the proposed average salary structure adjustment for NSAS at headquarters salary structure is 4.2% (in peso terms). Table A2.2 in Appendix 2 details the proposed salary structure. The salary structure for NSAS in headquarters is expressed in gross salary.
26. In the 2015 comprehensive compensation and benefits review, the comparatio target was set at 97% for NSAS at headquarters. This target has not been met, and the projected comparatio at the end of 2017 is 93.9%. Also, for the same reasons as international staff, the proposed merit increase is funded by savings from salary dilution. The proposed average salary increase of 6.7% (in peso terms) maintains the comparatio at the same level as last year (96.5%).
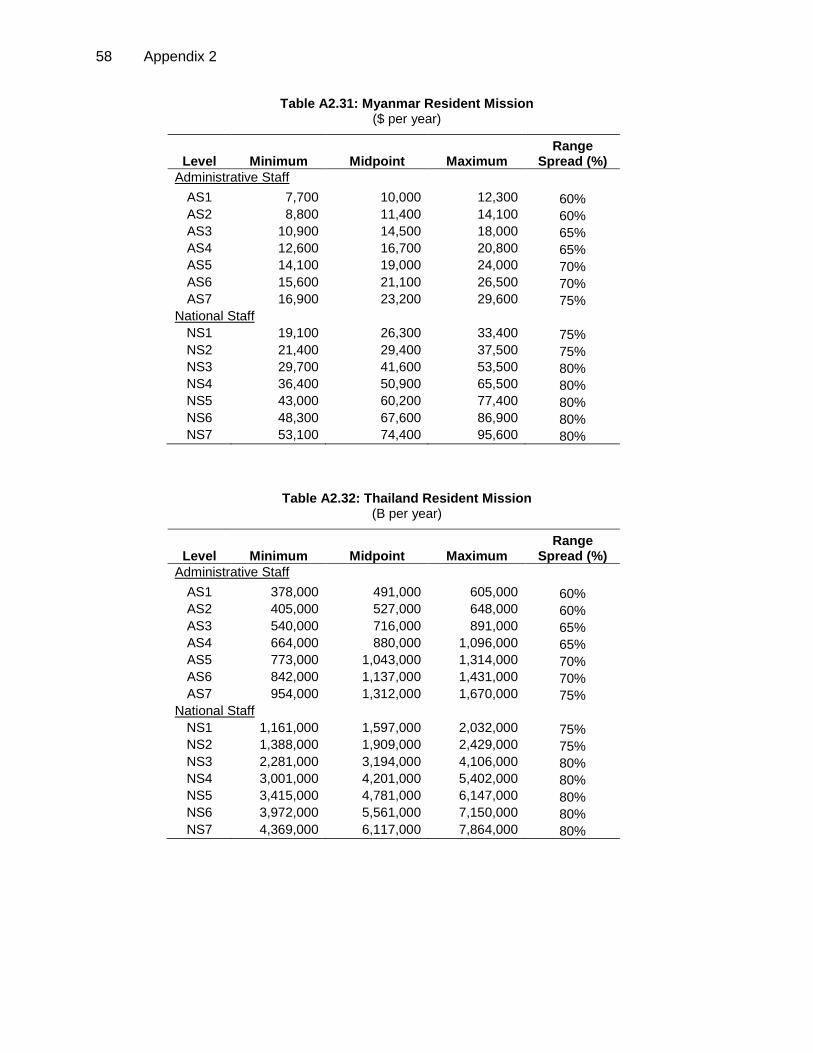
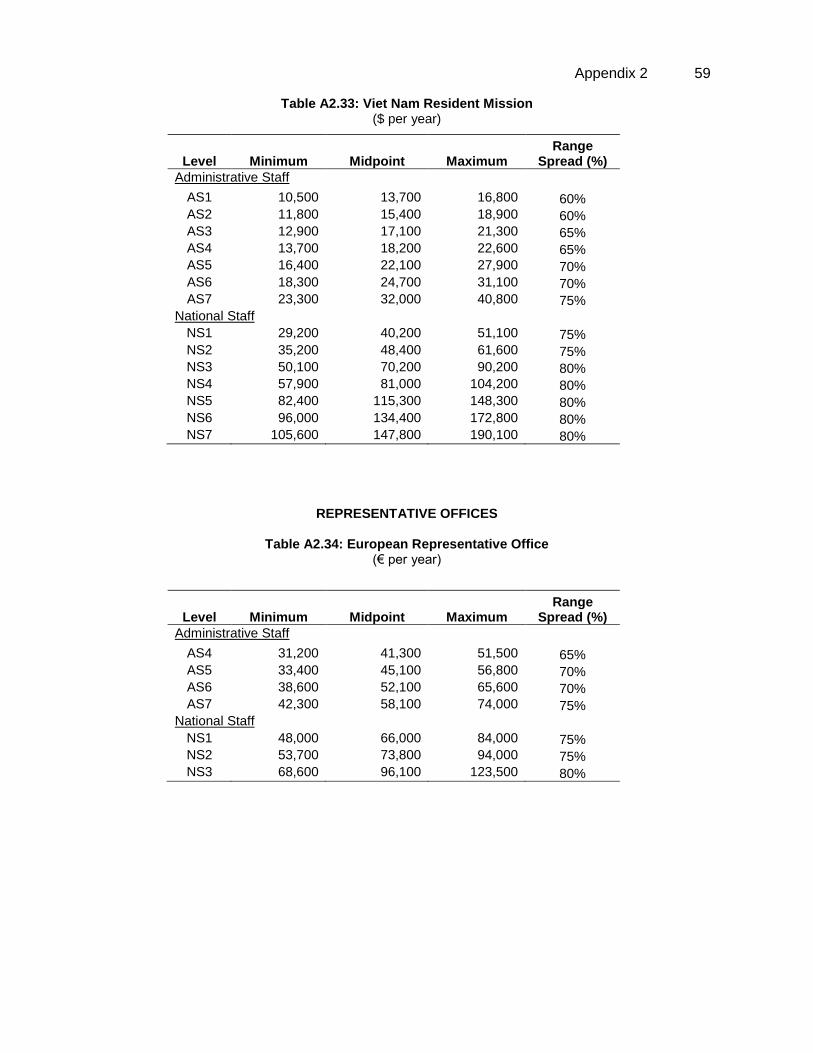
27. Table A1.3 in Appendix 1 shows the salary structure adjustment, average salary increase, and inflation rate at headquarters from 2013 to 2017. 28. Table A1.5 in Appendix 1 shows the proposed salary structure adjustment, the proposed average salary increase, and the resulting comparatio before and after the salary increase. 29. For NSAS in field offices, ADB’s salary structure midpoints are adjusted by reflecting the overall market movement in each of the duty station locations. The sources of data used for determining the market movements include the WBG structure increases, and market data supplied by established survey companies Birches Group, and Willis Towers Watson. 30. Based on the survey data analysis, the proposed salary structure adjustments result in an average structure adjustment of 6.5% in US dollar terms for 2018 (Table A1.6, Appendix 1). The various currencies are converted to US dollars based on the 5 October 2017 Bloomberg exchange rates. The resulting salary structures effective 1 January 2018 for FOs are shown in Table A2.3-Table A2.36 in Appendix 2. The salary structures for NSAS in all FOs are based on net salaries (net of income tax) except for Japan and the US where the salary structures are expressed in gross salaries, like the Philippines.
31. Tables A1.4 and A1.5 in Appendix 1 show the (i) average annual salary structure adjustment, average annual salary increase, and inflation rate for each FO from 2016 to 2018, and (ii) proposed average salary increase, salary structure adjustment, and the comparatio targets for each field office. 32. The proposed average salary increase of 8.0% (in US dollar terms) will maintain the comparatio at broadly the same level at 96.5% as of January 2018 (96.9% in January 2017).
IV. FACTORS DRIVING THE NEED FOR COMPETITIVE PAY
A. The Business Context
33. ADB’s ability to attract talent and experts from a wide range of global sources and retaining existing high-caliber staff is fundamental for meeting the WPBF 2017-2019 commitments. ADB needs to hire experts with cutting-edge knowledge and/or in specialized fields, such as private sector development, health and education, climate change mitigation and adaptation, infrastructure, railways and urban transport and high-end technical assistance. This will require specialized skill sets, international experience and proficiency that are in great demand in the markets and sectors where ADB competes for talent.
9
34. ADB plans to recruit 75 new positions, 45 international staff, 25 national staff, and 5 administrative staff in 2018; an additional 105 new positions will be recruited during 2019-20. The competition for high caliber and experienced professionals is fierce in markets where ADB sources talent (e.g., consulting firms, banks, financial institutions, international corporations, academia and non-government organizations). B. Challenges for Recruitment and Retention 35. For internationally recruited positions, relocation can pose challenges to recruitment. A competitive package therefore becomes critical in attracting new hires and for retaining staff. 36. One of the considerations cited when an individual decides to leave ADB is around personal and family reasons. For example, there are indications that spouse employment is one of these reasons. ADB is currently trialing a strengthened approach to collecting information to assist in understanding more fully the different reasons why staff leave the ADB.
37. There are selected areas of skills where recruitment has additional challenging factors such as:
(i) Private Sector Operations Department. The scaling up of private sector projects has necessitated recruiting experienced professionals with private sector financial skills from private sector companies, or IFIs with a comparable focus (e.g., IFC, EBRD). More aggressive outreach is being specifically conducted for hiring, along with a better use of the flexibilities within the salary ranges.
(ii) Office of Information Systems and Technology. The external labor market for information technology remains highly competitive, for all staff categories.
(iii) Risk management. This area continues to be competitive as the focus on managing financial and other risk remains a priority across the financial services sector.
38. Finally, as more of the ADB’s developing member countries are joining the ranks of middle income countries their development needs are transforming from finance only to finance++ (finance plus knowledge and co-financing). Country offices are also requiring more experienced staff to be posted. ADB needs to respond to these changing requirements. C. Other Measures to Enhance Recruitment and Retention
39. Improving ADBs branding: ADB will continue to improve ADB’s branding as an attractive employer. ADB has undertaken targeted outreach and broader use of social media. These actions are supported by customized videos targeted at specific audience groups (e.g., private sector, women, experts). 40. Spouse employment: ADB's policy permits spouses to be employed at ADB. Support is provided on a pilot basis to help spouses of international staff navigate the local employment market. 41. Better performance management Reforms have been developed to strengthen performance management practices and put in place a more effective framework to enhance the productivity and motivation of staff to deliver better results. The enhancements will be implemented in 2018. The proposed reform provides managers greater discretion to adjust salary increases (within a budget envelope) allowing managers to reward performance in a differentiated manner.
10
42. New mobility framework: Enhancing mobility is crucial for ADB. It will support the optimal use of human resources in the spirit of One ADB and give more opportunities to staff for career development. It will also facilitate mobility, including the appropriate placement of returning staff from resident missions to headquarters. The mobility framework establishes a two-pronged approach to building broad-based talent in the long term and bridging skill gaps that are more immediate and short term. It consists of an annual rotation exercise and the use of short-term assignments.
V. OTHER DEVELOPMENTS 43. Overseas duty station allowances. During 2017, ADB initiated and completed a review of these allowances as a follow-up to recommendations and actions proposed in the 2015 comprehensive review by Willis Towers Watson. The two main drivers of this review include (i) simplification, and (ii) ensuring funds are focused on rewarding staff taking up postings in hardship locations. The main changes include the following:
(i) One quality of living allowance to replace the following allowances: (a) hardship location allowance, (b) additional locality allowance, (c) hardship premium, and (d) assignment premium.
(ii) Cost of Living Allowance (COLA) capped at 80%, (iii) Rental ceilings for developed countries, based on 3-bedroom apartments (rather
than 4-bedroom houses). 44. The overall budgetary impact is an approximate increase of 0.94% based on current assignees.
45. Equal pay study. Improving gender balance within ADB is a key priority. ADB will need persistent action and outreach to hire, retain, and promote qualified women. The aim is to move from the current rate just below 35% of women international staff to the target of 40% by the end of 2022. ADB plans to contract an international firm to determine whether there are any unexplained gender based pay gaps. 46. Education assistance benefits: school country limits. In 2015, the Board endorsed changes to education assistance that included utilization of WBG country ceilings tables to determine ADB’s school country limits. In the 2016 Board paper, a change in the methodology was proposed as it was anticipated that the WBG tables would no longer be available since they are derived from proprietary data. ADB had proposed to purchase schooling costs data necessary to inform the calculation and to use an in-house methodology similar to the WBG, to index ADB’s education assistance school country limits annually. However, ADB was able to obtain the WBG country ceilings tables used to determine ADB’s school country limits for the education assistance for school year 2017/2018 and therefore, it has been unnecessary for ADB to utilize separate data as proposed in the 2016 salary paper. A full review of this benefit will be conducted during the Comprehensive review of salary & benefits in 2020.
VI. RECOMMENDATION 47. The President recommends that the Board approve (i), (ii), and (iii) below effective 1 January 2018:
11
(i) the salary structure for international staff (Appendix 2, Table A2.1): an average salary increase of 3.9%, which includes a salary structure adjustment component of 2.2% and an additional merit increase component of 1.7%;
(ii) the salary structure for NSAS at headquarters (Appendix 2, Table A2.2): an average salary increase of 6.7% (in Philippine pesos), which includes a salary structure adjustment component of 4.2% and an additional merit increase component of 2.5%; and
(iii) the salary structures for NSAS in field offices (Appendix 2, Tables A2.3–A2.36): an average salary increase of 8.0% (US dollar equivalent), which includes a salary structure adjustment component of 6.5% and an additional merit increase component of 1.5%.
48. The budgeted cost of the proposals in paragraph 47 has been included in the 2018 budget being considered by the Board on 15 December 2017.
VII. BUDGETARY IMPACT 49. The proposed salary increase for 2018 due to salary structure adjustments is estimated at $4.0 million, which includes $3.9 million for IS, -$1.5 million for NSAS at HQ, and $1.6 million for NSAS in FOs. Table 2 shows the total estimated cost of the 2017 and 2018 increase in the salary budget by staff category.
Table 2: Budget Impact of Salary Structure Adjustments ($ million)
FO = field office, HQ = headquarters, IS = international staff, NSAS = national staff and administrative staff.
a The assumptions used for Philippine peso in ADB’s budget is based on the Bloomberg full-year forecasted median
rate. The assumptions used in 2017 budget was Php47.50 to $1 and Philippine Peso is forecasted to be Php51.10
to $1 in 2018. This forecasted Peso movement versus the US dollars is expected to result in a salary envelope
decrease when reported in US$. However, the structure adjustment of 4.2% for NSAS at headquarters represents
an increase equivalent to Php96.6 million. b Calculated as 23.4% of salary increase (23% for the Staff Retirement Plan and the balance of 0.4% for insurance
benefits) in 2017 and 25.4% of salary increase (25% for the Staff Retirement Plan and the balance of 0.4% for
insurance benefits) in 2018.
12
50. The $4.0 million salary increase represents 0.6% of the estimated proposed 2018 budget and the $1.0 million for salary-related benefit costs represents 0.1% of the 2018 budget. Salaries and benefits are expected to represent about 62.4% of the proposed 2018 internal administrative expenses budget. Table 3 shows the total salary increase in 2018 due to the salary structure adjustments.
Table 3: Salary Increase and Salary Budget
FO = field office, HQ = headquarters, IS = international staff, NSAS = national staff and administrative staff. US = United States.
Staff category
2017 Total Salary
(million)
2018 Structure
Adjustment
Salary Increase for 2018 (million)
IS (In $) 175.1 2.2% 3.9
NSAS HQ a) In Phil Peso b) In US$
2,300 48.4
4.2%
(3.1%)
96.6 (1.5)
NSAS FO (In $) 25.2 6.5% 1.6
Total (In $) 248.7 4.0
Appendix 1 13
SUPPLEMENTARY DATA FOR INFORMATION Source: Asian Development Bank, unless otherwise stated.
I. COMPENSATION TRENDS
A. Historical Comparatio, 2013- 2018
Table A1.1: International Staff
a Estimated comparatio by 31 December 2017. A range is provided as the final comparatio will be dependent on a number of factors, including the number of recruitments. b Estimated comparatio on 1 January 2018
B. Historical Average Annual Salary Increases, 2013–2018
Table A1.2: International Staff
Year
Structure Adjustment
(%)
Average Salary Increase
(%)
Philippines Inflation Ratea, b
(%)
Philippines Exchange Rate
(PhP/$)
2013 1.9 3.2 2.9 44.38
2014 2.0 3.1 4.2 44.73
2015 2.3 4.0 1.4 46.94
2016 2.4 4.7 2.0 46.00
2017 2.5 4.8 3.4 47.50c
2018 2.2 3.9 3.3 51.10d a Data from the International Monetary Fund’s World Economic Outlook Database, April 2017. b Inflation is not a determinant of ADB salaries. ADB’s salaries are market-based. c Based on the 2017 midyear budget assumption. d Bloomberg full year forecasted median exchange rate as of 5 October 2017.
Table A1.3: National Staff and Administrative Staff at Headquarters
Year
Structure Adjustmenta
(%)
Average Salary Increasea
(%)
Philippines Inflation Rateb,c
(%)
Philippines GDP
growth rate d (%)
2013 2.9 5.0 2.9
2014 4.0 7.6 4.2 6.7
2015 4.5 7.6 1.4 5.9
2016 4.0 7.0 2.0 6.9
2017 5.6 7.4 3.4 6.4
2018 4.2 6.7 3.3 5.8
a In Philippine peso. b Data from the International Monetary Fund’s World Economic Outlook, April 2017. c Inflation is not a determinant of ADB salaries. ADB’s salaries are market-based. d EIU Asia Country Briefing March-April 2017, The Economist.
Notes:
While the Structure Adjustments have been higher than the inflation rate in the Philippines, these should be more relevant with the GDP growth reflective of a growing economy and a buoyant labor market in the country.
Appendix 1 15
Table A1.4: National Staff and Administrative Staff in Field Offices, 2016-2018
Lao PDR = Lao People’s Democratic Republic, PNG = Papua New Guinea PRC = People’s Republic of China. Note: AZRM salary structure under review for dollarization, no impact on budget if converted to $.
Average
Annual
Structure
Adjustment
(%)
Average
Annual Salary
Increase
(%)
Average
Annual
Structure
Adjustment
(%)
Average
Annual Salary
Increase
(%)
Average
Annual
Structure
Adjustment
(%)
Average
Annual
Salary
Increase
(%)
Salary
Currency
Central West Asia
Afghanistan 5.2 6.0 6.3 8.1 3.6 5.4 $
Kazakhstan 0.0 6.1 0.0 4.2 0.0 4.5 $
Kyrgyz Republic 6.5 6.6 6.8 6.8 3.8 3.8 $
Tajikistan 2.2 2.3 4.3 5.3 1.7 2.0 $
Turkmenistan 5.4 5.5 2.7 2.0 6.2 6.0 $
Uzbekistan 1.9 2.0 9.6 8.1 13.3 13.0 $
Armenia 0.0 2.1 4.2 5.3 1.4 2.0 AMD
Azerbaijan 10.0 11.4 8.8 9.4 53.0 30.6 AZN
Georgia 6.6 6.7 5.4 6.7 3.7 3.6 GEL
Pakistan 0.0 2.1 17.6 17.6 8.6 11.5 PRs
East Asia
Mongolia 9.5 9.6 6.8 6.8 3.5 3.2 $
PRC 7.8 8.0 8.2 10.9 4.4 7.2 CNY
Pacific
Timor-Leste 0.0 2.0 4.8 4.8 2.8 2.9 $
Australia 2.6 2.7 6.9 5.6 5.2 5.2 A$
Fiji 0.6 2.0 8.1 6.7 12.9 12.3 F$
PNG 5.0 5.1 9.1 9.6 4.3 4.1 K
Extended Missions
Samoa 0.0 1.5 2.0 0.0 2.0 ST
Solomon Islands 0.0 8.2 13.2 0.0 7.5 SI$
Tonga 0.0 7.8 2.0 0.7 2.0 PT
Vanuatu 0.0 9.8 2.0 6.2 6.2 Vt
South Asia
Bangladesh 15.1 17.6 5.8 9.4 4.6 8.1 Tk
Bhutan 13.6 13.7 19.3 6.0 39.9 32.9 Nu
India 3.3 4.9 7.2 10.0 10.4 12.6 Rs
Nepal 7.8 10.0 10.6 12.7 14.5 16.2 NRs
Sri Lanka 9.7 12.6 6.8 8.9 4.7 6.4 SLRs
Southeast Asia
Cambodia 7.5 7.6 8.9 7.8 4.4 4.3 $
Lao PDR 8.8 8.9 7.0 7.8 14.1 13.4 $
Myanmar 10.1 10.2 7.8 2.0 10.4 6.5 $
Viet Nam 8.1 8.2 4.4 6.2 2.8 6.2 $
Indonesia 3.7 4.5 7.3 8.4 5.3 6.2 Rp
Thailand 2.5 2.6 4.8 5.4 3.8 4.8 B
Representative Offices
US 3.1 7.6 2.8 3.8 4.2 4.1 $
Germany 0.0 2.0 2.9 2.0 0.5 2.0 €
Japan 0.0 2.0 3.4 2.0 0.0 2.0 ¥
Total/Average (in USD) 6.0 7.0 7.4 8.8 6.5 8.0
Regional
Department/Field
Office Location
2016 2017 2018
16 Appendix 1
C. Proposed 2018 Average Salary Increase and Estimated Comparatio
Table A1.5: IS, NSAS HQ, and NSAS FOs
Staff Category
Confirmed Staff (No.)
Structure Adjustment
(%)
Merit Increase
(%)
Proposed Average Salary
Increase (%)
Estimated Comparatio
by 31 December
2017
(%)
Estimated Comparatio
after Average Salary
Increase (%)
IS a 960 2.2 1.7 3.9 93.7 – 94.7 b 96.5
HQ NSAS c 1,325 4.2 2.5 6.7 93.9 96.5
FO NSAS a 568 6.5 1.5 8.0 94.7 96.5
AS=administrative staff, FO=field office, HQ=headquarters, IS=international staff, NS=national staff. a In US Dollar terms. b Estimated comparatio by 31 December 2017. A range is provided as the final comparatio will be dependent on
a number of factors, including the number of recruitments. c In Philippine Peso terms.
Notes:
The structure adjustments are representative of the market movements, the merit increases reward for performance and provide for pay progression within the salary ranges, and the proposed average salary increases help improve the comparatio for the different staff categories. Comparatios should be assessed by comparing the same date in corresponding years (due to the impact of salary dilution). When comparing 1 January 2017 versus 1 January 2018 the movements for the three staff categories are: IS 96.0% to 96.5% HQ NSAS 96.5 %to 96.5% FO NSAS 96.9% to 96.5%
Appendix 1 17
Table A1.6: National Staff and Administrative Staff Per Field Office, 2018
Lao PDR = Lao People’s Democratic Republic, PNG = Papua New Guinea, PRC = People’s Republic of China. a Based on the Bloomberg’s full year forecasted median exchange rate as of 5 October 2017. b Comparatio values for field office with one staff only are not shown for purposes of confidentiality. Note: AZRM salary structure under review for dollarization, no impact on budget if converted to $.
Regional
Department/Field
Office Location
Confirmed
Staff
(No.)
Structure
Adjustment
(%)
Proposed
Average
Salary
Increase
(%)
Estimated
Comparatio
by 31
December
2017
(%)
Estimated
Comparatio
after Salary
Increase
(%)Salary
Currency
Exchange
Rate a
Afghanistan 19 3.6 5.4 94.4 96.0 $ 1.00
Kazakhstan 9 0.0 4.5 90.9 95.0 $ 1.00
Kyrgyz Republic 11 3.8 3.8 96.8 96.8 $ 1.00
Tajikistan 14 1.7 2.0 96.6 97.0 $ 1.00
Turkmenistan 4 6.2 6.0 100.2 100.0 $ 1.00
Uzbekistan 15 13.3 13.0 97.0 97.0 $ 1.00
Armenia 6 1.4 2.0 100.0 100.6 AMD 478.00
Azerbaijan 7 53.0 30.6 96.3 96.3 AZN 1.69
Georgia 6 3.7 3.6 97.6 97.6 GEL 2.48
Pakistan 34 8.6 11.5 91.9 95.0 PRs 105.39
East Asia
Mongolia 17 3.5 3.2 96.0 96.0 $ 1.00
PRC 56 4.4 7.2 92.5 95.0 CNY 6.73
Pacific
Timor-Leste 5 2.8 2.9 99.3 99.3 $ 1.00
Australia 8 5.2 5.2 97.9 97.9 A$ 1.27
Fiji 18 12.9 12.3 99.3 99.3 F$ 2.04
PNG 11 4.3 4.1 100.2 100.0 K 3.19
Extended Missions b
Samoa 1 0.0 2.0 120.8 123.2 ST 2.49
Solomon Islands 1 0.0 7.5 88.3 95.0 SI$ 7.77
Tonga 1 0.7 2.0 121.8 123.3 PT 2.15
Vanuatu 1 6.2 6.2 98.0 98.0 Vt 107.00
South Asia
Bangladesh 43 4.6 8.1 91.9 95.0 Tk 80.82
Bhutan 1 39.9 32.9 105.3 100.0 Nu 65.13
India 61 10.4 12.6 93.0 96.0 Rs 64.00
Nepal 42 14.5 16.2 94.2 96.0 NRs 104.24
Sri Lanka 29 4.7 6.4 94.5 96.0 SLRs 153.00
Southeast Asia
Cambodia 28 4.4 4.3 97.7 97.7 $ 1.00
Lao PDR 19 14.1 13.4 97.8 97.8 $ 1.00
Myanmar 9 10.4 6.5 103.6 100.0 $ 1.00
Viet Nam 46 2.8 6.2 91.9 95.0 $ 1.00
Indonesia 29 5.3 6.2 95.1 96.0 Rp 13,442.00
Thailand 10 3.8 4.8 95.0 96.0 B 33.30
Representative Offices
US 3 4.2 4.1 99.8 99.8 $ 1.00
Germany b 1 0.5 2.0 119.2 120.9 € 0.85
Japan 3 0.0 2.0 119.2 121.6 ¥ 112.00
Total/Average
(in USD)568 6.5 8.0 94.7 96.5
Central West Asia
18 Appendix 1
II. STAFF RECRUITMENT INFORMATION Source: Asian Development Bank, unless otherwise stated.
Data for 2017 is as of 31 October 2017.
A. International Staff
Figure A1.1: IS - Recruitment Experience
Notes: No. of Offers – the number of written offers made to candidates following the completion of the recruitment process.
Acceptance rate % - the number of recruited candidates expressed as a percentage of the total number of offers. Source: ADB HR Management Information System.
Women 24 20 38 26 54 a Includes all candidates who accepted offers made during the year. Source: ADB HR Management Information System.
20 Appendix 1
Figure A1.2: IS - Sources of External Recruitment
Notes: In addition to hires recruited from outside ADB, the number of ADB National Staff hired into IS positions is shown. Internal hires (IS staff hired into a different IS role) are not included. Source: ADB HR Management Information System.
0
20
40
60
80
100
120
2013 2014 2015 2016 2017(to 31 Oct)
NU
mb
er
of
Staf
f
Private Sector Government Agency International Organization
Academe ADB's National Staff
Appendix 1 21
Figure A1.3: IS - Rejection of Job Offers
Notes: No. of Offers - the number of written offers made to candidates following the completion of the recruitment process. No. of Rejections: the number of candidates who, following a written job offer, declined the offer. Rejection Rates: the number of rejected offers expressed as a proportion of all job offers made. Source: ADB HR Management Information System.
B. National Staff and Administrative Staff (Headquarters)
Figure A1.5: NSAS HQ - Recruitment Experience
Notes: No. of Offers – the number of written offers made to candidates following the completion of the recruitment process. Acceptance rate % - the number of recruited candidates expressed as a percentage of the total number of offers.
Total 52 95 107 57 68 a Includes all candidates who accepted offers made during the year. Source: ADB HR Management Information System.
Appendix 1 25
Figure A1.6: NSAS HQ - Sources of External Recruitment
Notes: Internal hires (NSAS hired into a different NSAS role) are not included. Source: ADB HR Management Information System.
0
20
40
60
80
100
120
2013 2014 2015 2016 2017(to 31 Oct)
Nu
mb
er
of
Staf
f
Private Sector Government Agencies International Organization Academe
26 Appendix 1
Figure A1.7: NSAS HQ - Rejection of Job Offers
Notes: No. of Offers - the number of written offers made to candidates following the completion of the recruitment process. No. of Rejections: the number of candidates who, following a written job offer, declined the offer. Rejection Rates: the number of rejected offers expressed as a proportion of all job offers made. Source: ADB HR Management Information System.
Figure A1.8: NSAS HQ - Reasons for Rejections of Job Offers
Source: ADB HR Management Information System.
0
2
4
6
8
10
12
14
All Staff Women All Staff Women All Staff Women All Staff Women All Staff Women
2013 2014 2015 2016 2017(to 31 Oct)
Nu
mb
er
of
Staf
f
Salary/Benefits-related Personal/ Family reasons and spouse employment Job-related
28 Appendix 1
C. National Staff and Administrative Staff (Field Offices)
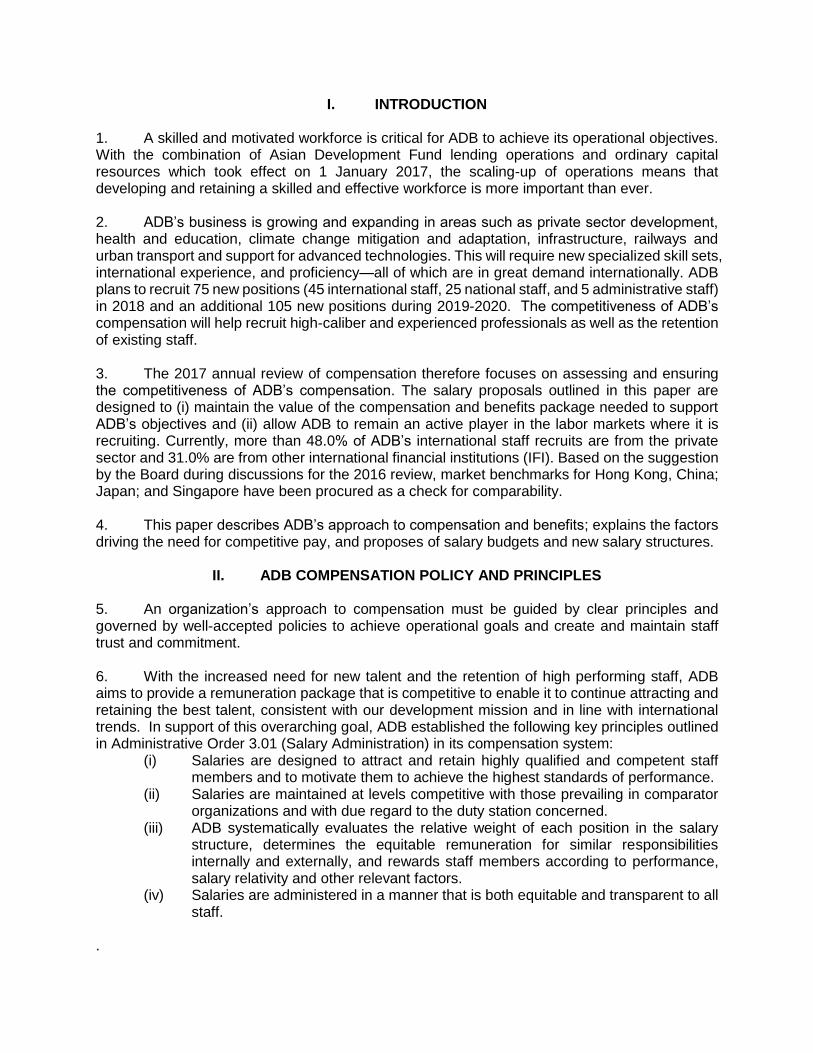
Figure A1.9: NSAS FO - Recruitment Experience
Notes: No. of Offers – the number of written offers made to candidates following the completion of the recruitment process. Acceptance rate % - the number of recruited candidates expressed as a percentage of the total number of offers. Source: ADB HR Management Information System.
Total 37 40 45 58 46 a Includes all candidates who accepted offers made during the year.
Source: ADB HR Management Information System.
30 Appendix 1
Figure A1.10: NSAS FO - Sources of Recruitment
Notes: Internal hires (NSAS staff hired into a different NSAS role) are not included. Source: ADB HR Management Information System.
0
10
20
30
40
50
60
2013 2014 2015 2016 2017(to 31 Oct)
Nu
mb
er
of
Staf
f
Private Sector Government Agencies International Organization Academe
Appendix 1 31
Figure A1.11: NSAS FO - Rejection of Job Offers
Notes: No. of Offers - the number of written offers made to candidates following the completion of the recruitment process. No. of Rejections: the number of candidates who, following a written job offer, declined the offer. Rejection Rates: the number of rejected offers expressed as a proportion of all job offers made. Source: ADB HR Management Information System.
III. STAFF RETENTION INFORMATION Source: Asian Development Bank, unless otherwise stated.
Data for 2017 is as of 31 October 2017.
A. International Staff
Table A1.10: IS - Termination Rates
Notes: Voluntary resignation rate – the number of staff who left the organization voluntarily over the previous 12 months expressed as a proportion of the total number of staff at the start of that period (1January) Other termination rate – the number of staff who left the organization for other reasons over the previous 12 months expressed as a proportion of the total number of staff at the start of that period (1January). Other reasons include: - Retirement (e.g., normal, early, incapacity) - Expiration of fixed-term contract - Interest of good administration - Performance reasons (e.g., non-confirmation of appointment, misconduct, unsatisfactory service) - Change in appointment category - Other reasons (e.g., death, abandonment of office) Source: ADB HR Management Information System.
Voluntary Resignations Other Terminations Total Terminations
Count Rates (%) Count Rates (%)
34 Appendix 1
A1.13a: IS - Reasons for Terminations
Figure A1.13b: IS - Reasons for Terminations (Women)
0
10
20
30
40
50
60
70
80
90
100
2013 2014 2015 2016 2017(to 31 Oct)
Nu
mb
er
of
Staf
f
Change in AppointmentCategory
Other Reasons
Interest of GoodAdministrationPerformance Reasons
Fixed-term expiration
Retirement
Voluntary Resignation
0
5
10
15
20
25
30
35
2013 2014 2015 2016 2017(to 31 Oct)
Nu
mb
er
of
Staf
f
Change inAppointmentCategoryOther Reasons
Interest of GoodAdministration
Performance Reasons
Fixed-term expiration
Retirement
Voluntary Resignation
Appendix 1 35
B. National Staff and Administrative Staff (Headquarters)
Table A1.11: NSAS HQ - Termination Rates
Notes: Voluntary resignation rate – the number of staff who left the organization voluntarily over the previous 12 months expressed as a proportion of the total number of staff at the start of that period (1 January) Other termination rate – the number of staff who left the organization for other reasons over the previous 12 months expressed as a proportion of the total number of staff at the start of that period (1January). Other reasons include: - Retirement (e.g., normal, early, incapacity) - Expiration of fixed-term contract - Interest of good administration - Performance reasons (e.g., non-confirmation of appointment, misconduct) - Change in appointment category - Other reasons (e.g., death, ill health). Source: ADB HR Management Information System.
Voluntary Resignations Other Terminations Total Terminations
Count Rates Count
36 Appendix 1
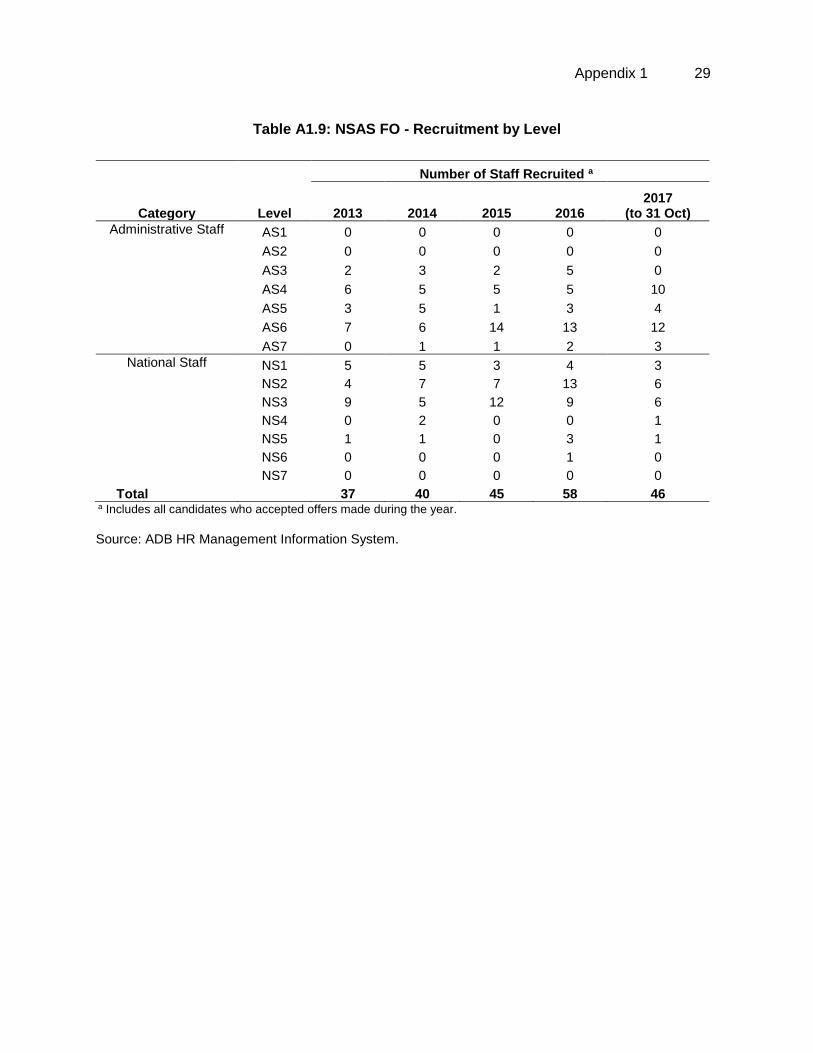
Figure A1.14a: NSAS HQ - Reasons for Terminations
Figure A1.14b: NSAS HQ - Reasons for Terminations (Women)
0
20
40
60
80
100
120
140
160
2013 2014 2015 2016 2017(to 31 Oct)
Nu
mb
er
of
Staf
f
Change in AppointmentCategory(NSAS to IS)Other Reasons
Interest of GoodAdministration
Performance Reasons
Fixed-term expiration
Retirement
Voluntary Resignation
0
20
40
60
80
100
120
2013 2014 2015 2016 2017(to 31 Oct)
Nu
mb
er
of
Staf
f
Change in AppointmentCategory(NSAS to IS)Other Reasons
Interest of GoodAdministration
Performance Reasons
Fixed-term expiration
Retirement
Voluntary Resignation
Appendix 1 37
C. National Staff and Administrative Staff (Field Offices)
Table A1.12: NSAS FO - Termination Rates
Notes: Voluntary resignation rate – the number of staff who left the organization voluntarily over the previous 12 months expressed as a proportion of the total number of staff at the start of that period (1 January). Other termination rate – the number of staff who left the organization for other reasons over the previous 12 months expressed as a proportion of the total number of staff at the start of that period (1 January). Other reasons include: - Retirement (e.g., normal, early, incapacity) - Expiration of fixed-term contract - Interest of good administration - Performance reasons (e.g., non-confirmation of appointment, misconduct) - Change in appointment category - Other reasons (e.g., death) Source: ADB HR Management Information System.
Voluntary Resignations Other Terminations Total Terminations
Count Rates (%) Count Rates (%) Count Rates (%)
38 Appendix 1
Figure A1.15a: Reasons for NSAS FO - Terminations
Figure A1.15b: NSAS FO - Reasons for Terminations (Women)
0
5
10
15
20
25
30
35
40
45
2013 2014 2015 2016 2017…
Nu
mb
er
of
Staf
f
Change in AppointmentCategory(NSAS to IS)Other Reasons
Interest of GoodAdministration
Performance Reasons
Fixed-term Expiration
Retirement
Voluntary Resignation
0
5
10
15
20
25
2013 2014 2015 2016 2017…
Nu
mb
er
of
Staf
f
Change in AppointmentCategory(NSAS to IS)Other Reasons
Interest of GoodAdministration
Performance Reasons
Fixed-term Expiration
Retirement
Voluntary Resignation
Appendix 1 39
IV. ADB’S COMPENSATION SYSTEM 1. The ADB follows a market-driven compensation system for all staff. Salaries are positioned at the 75th percentile of the defined relevant market for each category of staff. The difference for international staff and national and administrative staff lies in the market reference used for salary comparisons. The WBG3 salary structures serve as the proxy for the global market for international staff; for local markets for field office NSAS4, WBG data is used along with data from other sources such as the Birches Group, Willis Towers Watson, Hay Group as available; for headquarters NSAS, salaries are compared with those offered by 20 companies and international organizations in Manila. Under the market-driven compensation system, salary adjustments from 1 year to the next are not directly linked to the cost-of-living or consumer price index movements. These indices may be reflected in the market movement of salaries in the global or local market settings, which are primarily influenced by labor market conditions (e.g., supply versus demand for specific skills, economic growth and other global economic factors, and domestic fiscal conditions).
2. The key principles of ADB’s compensation system outlined in Administrative Order 3.01 (Salary Administration) are as follows:
(i) Salaries are designed to attract and retain highly qualified and competent staff members and to motivate them to achieve the highest standards of performance.
(ii) Salaries are maintained at levels competitive with those prevailing in comparator organizations and with due regard to the duty station concerned.
(iii) ADB systematically evaluates the relative weight of each position in the salary structure, determines the equitable remuneration for similar responsibilities internally and externally, and rewards staff members according to performance, salary relativity and other relevant factors.
(iv) Salaries are administered in a manner that is both equitable and transparent to all staff.
3. In addition, ADB’s compensation policy is designed to:
(i) remain market competitive by reflecting labor market changes to attract and retain top talent;
(ii) maintain a rules-based compensation system whereby salary increases are determined through a transparent formula-driven methodology;
(iii) remain fiscally prudent in recognition of budgetary requirements and in response to external market economic conditions; and
(iv) award differentiated salary increases according to performance. A. International Staff 4. Based on the results of the 2010 international staff comprehensive review, the Board approved the current compensation system in 2010 and reaffirmed it in 2015 to guide the formulation of the salary structure adjustments and salary increase proposals until the next comprehensive review in 2020.
3 The World Bank Group includes the International Bank for Reconstruction and Development, the International
Finance Corporation, and many other organizations. 4 Except for the Japan Representative Office, market data for this office is based on the Willis Towers Watson market
compensation data for Tokyo, which is designed to be locally competitive in accordance with ADB’s compensation policy. The WBG’s salary structure for Japan is based on its Washington salary structure since the WBG considers its Tokyo office as a satellite office of its headquarters.
40 Appendix 1
5. The main features of the current compensation system as reflected in Administrative Order 3.01 are as follows:
(i) The salary structure, comprising an appropriate number of salary ranges, embodies the correspondence between the hierarchy of relative job values and the progression of salary rates in the different salary levels;
(ii) The compensation system is market driven and ADB reviews the salary structure annually in relation to the relevant employment market. Where the review supports a revision of the salary structure, appropriate recommendations are made for approval of changes in the salary structure;
(iii) A major review of ADB’s compensation methodology is undertaken every five years. In the years between broad-based market studies, the World Bank Group (WBG) will be the principal comparator and its Washington, DC headquarters professional staff salary survey will serve as a proxy for salary movements in the market.5 The WBG’s salary structure midpoints will be the basis for setting ADB’s job level midpoints;
(iv) Based on job equivalency, midpoints of ADB international staff levels IS1, IS3, IS5, IS7, and IS9 are anchored to the midpoints of World Bank levels E, F, G, H, and I, respectively. Midpoints for the intervening ADB levels IS2, IS4, IS6, and IS8 are interpolated to establish the new pay-line. The midpoint for ADB international staff level IS10 is positioned about midway between levels I and J of the World Bank;
(v) Full parity with the market (i.e., a 100% comparatio) was targeted for international staff levels by 2015 but has not been achieved (at the end of 2017 the estimated comparatio will be 93.7% to 94.7%);
(vi) The average salary increase rate will be set at a level higher than the average structure adjustment to enable salaries of staff to progress within the range;
(vii) Salary increases will be applied to the range midpoint, as they have been since 2009.
B. National Staff and Administrative Staff 6. The Board approved main features of the NSAS compensation system until the next major review in 2020 are:
(i) The market-based approach is retained; (ii) At headquarters, ADB will develop its salary structure based on a customized
salary survey of comparators in Manila; for field offices, ADB will combine remuneration data and surveys purchased from the Birches Group and other reputable data sources, when available, with the WBG salary scale midpoints to improve market analysis for the field offices annual compensation reviews.
(iii) The market positioning for NSAS in headquarters and in field offices will be anchored at the 75th percentile of total cash (including base pay, incentive pay, and allowances plus the value of in-kind benefits not provided by ADB) in each of its duty station locations;
(iv) The average salary increase proposal will continue to be determined based on achieving a desired level of parity with the market pay-line (the target comparatio assigned depending on circumstances that may be peculiar to headquarters or a particular field office, such high turnover, or new office);
5 Broad-based market studies will be conducted every 4–5 years; the next one will be in 2020.
Appendix 1 41
(v) Salary increases will be applied to the range midpoint, as they have been since 2009.
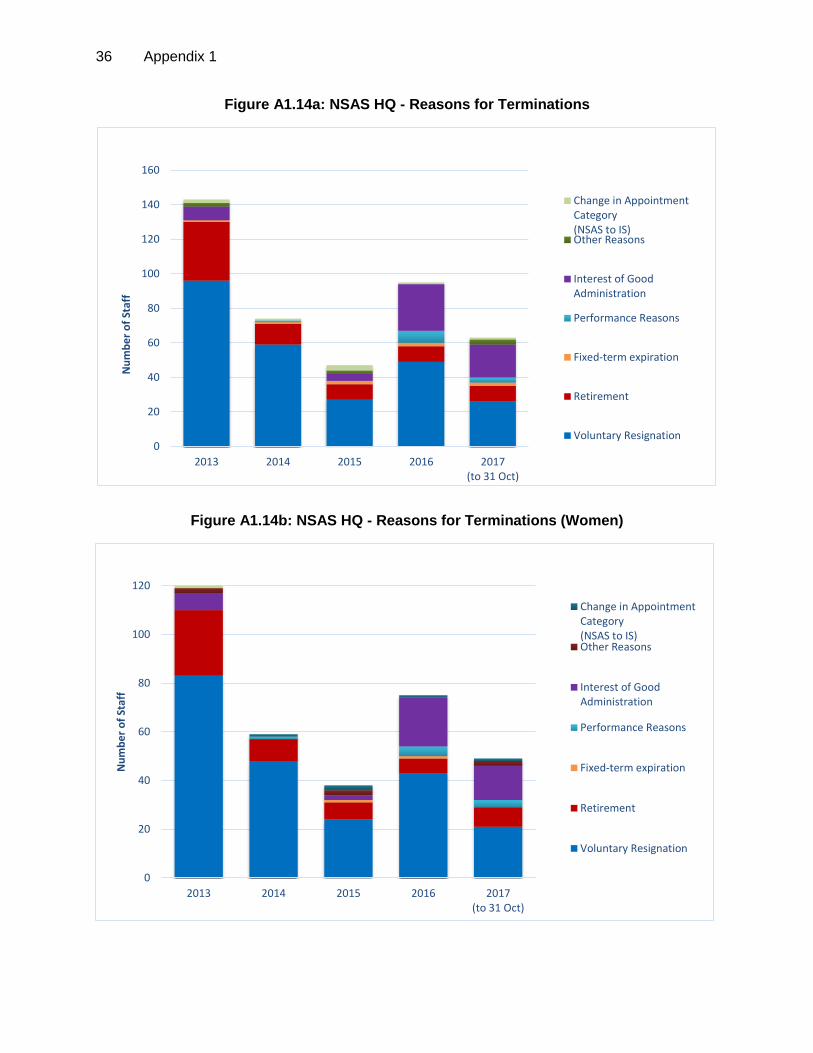
C. Implementation 7. The average salary increase and an assumed distribution of performance ratings determine the salary increase matrix for each staff category in each location. The salary increase given to an individual staff member is based only on the performance rating and delivered as a percentage of the midpoint of the respective grade level. An individual staff member does not receive an automatic increase equal to the salary structure adjustment or a minimum cost-of-living increase. A staff member rated unsatisfactory receives no salary increase, and her/his individual salary can be lower than the minimum salary for her/his grade level. 8. Salary increase matrixes will be developed for each staff category and location, linked to staff performance ratings under the 2017 performance review. There are four ratings: exceptional, satisfactory with special recommendation, satisfactory, or unsatisfactory. Staff rated exceptional or satisfactory with special recommendation will receive increases above the average salary increase. Staff members who are rated unsatisfactory will receive no salary increase. The allocation of the salary increase budget using the salary increase matrix will ensure that adequate funding is available to maintain a performance rating distribution of up to 10% of staff rated exceptional and up to 25% of staff rated satisfactory with special recommendation, with the remaining 65% for staff rated satisfactory.
42 Appendix 1
D. Comparator Information by Staff Category
Table A1.13: List of Comparators For Salary Review
1. International Staff
World Bank Group
2. National Staff and Administrative Staff (Headquarters)
No. Company Name Line of Business
Headquarters Total No. of Staff
1 ABS-CBN Media Philippines >2,000
2 Accenture, Inc. Services United States >1,000
3 Ayala Corporation Holding Company Philippines <500