1 2017 Connecticut Deer Program Summary Bureau of Natural Resources – Wildlife Division Department of Energy and Environmental Protection 79 Elm Street, Hartford, CT 06106-5127 860-424-3011 www.ct.gov/deep/wildlife Department of Energy and Environmental Protection Robert F. Klee, Commissioner Susan Whalen, Deputy Commissioner Bureau of Natural Resources William Hyatt, Bureau Chief Wildlife Division Rick Jacobson, Director Prepared by Andrew M. LaBonte, Deer Program Biologist Howard J. Kilpatrick, Deer/Turkey Program Biologist Photo by Danny Marino The Connecticut Department of Energy and Environmental Protection is an Affirmative Action/Equal Opportunity Employer that is committed to complying with the requirements of the Americans with Disabilities Act. Please contact us at 860-418-5910 or [email protected] if you: have a disability and need a communication aid or service; have limited proficiency in English and may need information in another language; or if you wish to file an ADA or Title VI discrimination complaint. This publication is 75 percent funded by Federal Aid in Wildlife Restoration, the Pittman-Robertson (P-R) Program, which provides funding through an excise tax on the sale of sporting firearms, ammunition and archery equipment. The Connecticut DEEP Wildlife Division matches the remaining 25 percent of the funding. 8/2018
Transcript
1
2017 Connecticut Deer Program Summary
Bureau of Natural Resources – Wildlife Division
Department of Energy and Environmental Protection 79 Elm Street, Hartford, CT 06106-5127
860-424-3011 www.ct.gov/deep/wildlife
Department of Energy and Environmental Protection Robert F. Klee, Commissioner
Susan Whalen, Deputy Commissioner Bureau of Natural Resources
William Hyatt, Bureau Chief Wildlife Division
Rick Jacobson, Director
Prepared by Andrew M. LaBonte, Deer Program Biologist
Howard J. Kilpatrick, Deer/Turkey Program Biologist
Photo by Danny Marino
The Connecticut Department of Energy and Environmental Protection is an Affirmative Action/Equal Opportunity Employer that is committed to complying with the requirements of the Americans with Disabilities Act. Please contact us at 860-418-5910 or [email protected] if you: have a disability and need a communication aid or service; have limited proficiency in English and may need information in another language; or if you wish to file an ADA or Title VI discrimination complaint.
This publication is 75 percent funded by Federal Aid in Wildlife Restoration, the Pittman-Robertson (P-R) Program, which provides funding through an excise tax on the sale of sporting firearms, ammunition and archery equipment. The Connecticut DEEP Wildlife Division matches the remaining 25 percent of the funding.
8/2018
2
Table of Contents Introduction .................................................................................................................................................................... 4
Connecticut Deer Management Zones ........................................................................................................................... 8
Insight into Deer Hunter Success Rates by Zone ......................................................................................................... 10
Fall Acorn Crop ........................................................................................................................................................... 12
Private Land Deer Harvest ........................................................................................................................................... 13
Harvest Effort, Observations, and Fawn Recruitment ................................................................................................. 14
Deer Harvest Sex Ratios .............................................................................................................................................. 15
Antler Points and Yearling Fraction ............................................................................................................................ 15
Deer Hunter Expenditures, Effort, Venison Calculations, and Opinions .................................................................... 17
Subscription Rates for State Land Lottery Permits ...................................................................................................... 18
Appendix 1. Total reported deer harvest and roadkills by town, 2017 ........................................................................ 23
Appendix 2. Archery harvest on state areas, 2017 ....................................................................................................... 27
Appendix 3. Sex ratios (male:female) of deer harvested during Connecticut's regulated hunting seasons, 2015-2017 ...................................................................................................................................................... 30
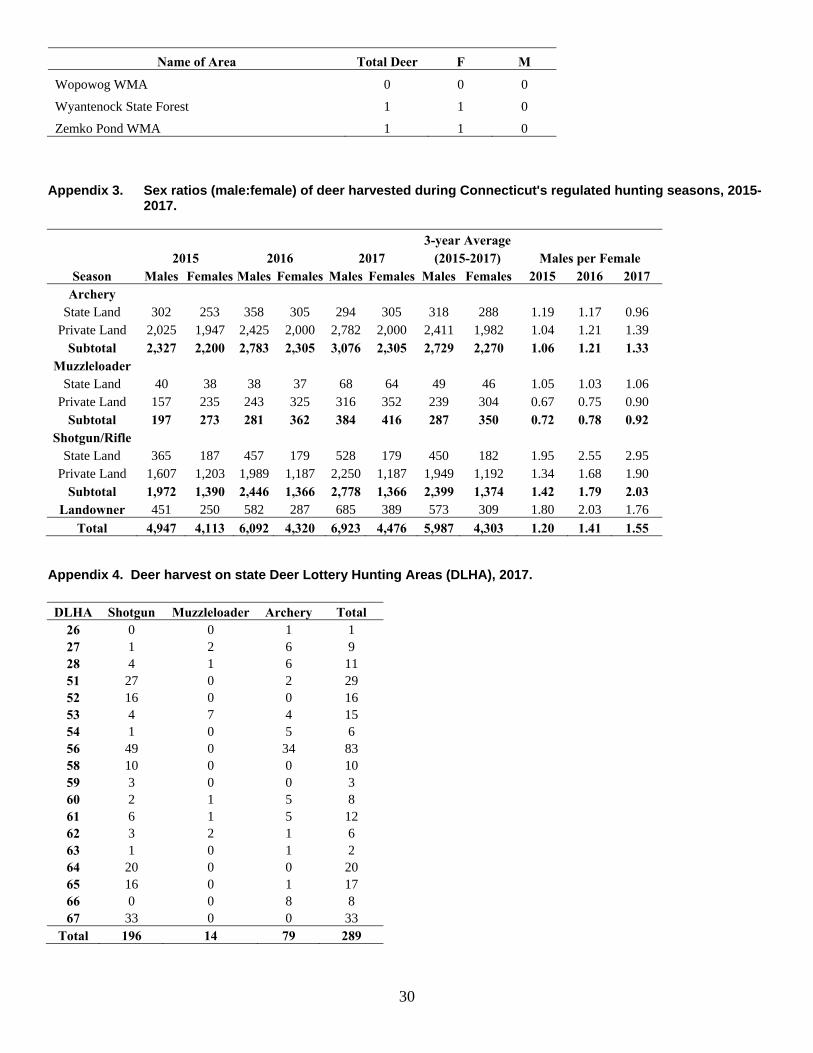
Appendix 4. Deer harvest on state Deer Lottery Hunting Areas (DLHA), 2017 ......................................................... 30
Appendix 6. Frequency of deer roadkills in each of Connecticut's Deer Management Zones, a 5-year comparison, 2013-2017 ................................................................................................................................................ 31
Appendix 7. Deer removed using crop damage permits in Connecticut's Deer Management Zones, 2005-2017 ....... 32
3
List of Tables
Table 1. Deer harvested during Connecticut's regulated hunting seasons, 2016-2017.
Table 2. Deer hunting permits issued in Connecticut for all regulated hunting seasons, 2015-2017.
Table 3. Deer hunter success rates (%) in Connecticut, 2016-2017.
Table 4. Zonal hunter numbers, harvest, and success rates for private land during the 2017 shotgun/rifle hunting season.
Table 5. Zonal comparisons in private land shotgun/rifle harvest, hunter distributions, and success rates, 2015-2017.
Table 6. Zonal comparisons of archery season success rates, 2017.
Table 7. Private land deer harvest for all seasons (excluding landowner) in each of Connecticut's Deer Management Zones, 2007-2017.
Table 8. Hunter observations and harvest ratios reported during the first month of the archery season in Connecticut, 2014-2017.
Table 9. Observation rates (deer seen/hour; D/hr), number of fawns per doe (F:D), and number of deer harvested per hour (H/hr) collected at the time harvest was summarized for the first month of the archery season by Deer Management Zone (DMZ) in Connecticut, 2015-2017.
Table 10. Sex ratios (male:female) and antlered to antlerless ratios of deer harvested in 2017.
Table 11. Sex ratios (male:female) of deer harvested during Connecticut's regulated hunting seasons, 2015-2017.
Table 12. Instant award deer lottery selection results by Deer Hunting Lottery Area, 2017.
List of Figures Figure 1. Total deer permit issuance and total deer harvest in Connecticut, 1975-2017.
Figure 3. Perception of zonal deer population trends (average rank) by Connecticut's deer hunters, 2015-2017.
Figure 4. Private land shotgun/rifle deer harvest in Deer Management Zones 4A and 4B, 1996-2017.
Figure 5. Perception of acorn crops (average rank) by Connecticut's deer hunters, 2014-2017.
Figure 6. Relationship between private land shotgun/rifle hunter success rates and fall acorn productivity, 1993-2017.
Figure 7. Number of antler points on bucks collected by the telecheck/online reporting system during the shotgun/rifle hunting season in Connecticut, 2014-2017.
Figure 8. Comparisons of trends in roadkills and the antlered and antlerless deer harvests during the archery deer season in Deer Management Zone 11, 1995-2017.
Figure 9. Changes in the sex ratios of harvested deer from Deer Management Zone 11 after implementing various management strategies during the archery season, 1994-2017.
Figure 10. Moose sightings reported on deer hunter surveys, 1996-2017.
Figure 11. Crop damage deer removals by month, 2017.
4
Introduction This booklet is the 36th in a series, since the passage of the White-tailed Deer Management Act of 1974, reporting on the status of the white-tailed deer resource in Connecticut. It summarizes white-tailed deer information for 2017, including changes in deer management regulations and reporting requirements, harvest statistics, research activities, and population dynamics of Connecticut's deer population. Connecticut's Deer Management Program goals are: 1) to maintain the population at levels compatible with available habitat and land uses, and 2) to allow for a sustained yield of deer for use by Connecticut hunters. The program has focused on stabilizing or reducing deer population growth for the best long-term interest of the deer resource, native plant and animal communities, and the public. Regulated deer hunting has proven to be an ecologically sound, socially beneficial, and fiscally responsible method of managing deer populations. Deer Program efforts have focused on increasing harvest of antlerless deer, coordinating controlled hunts for overabundant deer herds, assisting communities and large landowners with deer management issues, and research and management of urban deer populations. Pursuant to the goal of reducing overabundant deer populations, aggressive management strategies have been implemented in areas with high deer densities. Strategies include the issuance of free replacement antlerless tags (1995), changes in state law to allow hunting over bait (2003), extending the archery season to include the month of January (2003), implementation of sharp-shooting programs (2003), development of an earn-a-buck program (EAB) (2005), increased bag limits in specific deer management zones (2009), allowing the use of crossbows during January (2010), allowing the use of crossbows statewide (2013), and allowing the harvesting of deer on Sundays during the archery season (2015). In 1995, the replacement antlerless tag program was initiated, allowing hunters in deer management zones (DMZs) 11 and 12 to harvest additional antlerless deer, with the goal of increasing the doe harvest. In 2003, hunting over bait was permitted in DMZs 11 and 12 during all seasons on private land. The use of bait in areas where hunter access to private land is limited increases hunter opportunity and success. Starting in 2005, hunters could earn a free either-sex tag for harvesting a buck after harvesting 3 antlerless deer during the same season (EAB). In 2009, hunters were issued 1 additional antlerless tag in DMZ 7 and an additional 2 antlerless tags in DMZ 11 and DMZ 12 with their shotgun/rifle and muzzleloader permits. In 2010, hunters were allowed to use crossbows in January in DMZs 11 and 12. In 2013, use of crossbows was expanded to allow use during the entire archery season on state and private land in all DMZs. In October 2015, archery hunters were allowed to hunt on Sundays on private land in DMZs where deer were considered overpopulated, which included all DMZs except 2, 3, and 4A. In developed areas where firearms hunting is not feasible, DEEP encourages the use of bowhunting as a management tool. Communities experiencing deer overpopulation problems may choose to initiate controlled hunts or, under special conditions, may be eligible to implement sharp-shooting programs. In recent years, town governments have been taking a more active role in initiating local deer management programs. In 2004, representatives of 10 towns in Fairfield County formed a Regional Deer Management Working Group called the Fairfield County Municipal Deer Management Alliance (www.deeralliance.com). Currently, 18 of 23 Fairfield County towns have joined the Alliance. The Alliance assists towns in establishing deer committees, shares knowledge and experience about managing urban deer with other towns, provides input on urban deer problems so as to influence wildlife policy decision makers, increases public awareness, and provides input for developing long-term solutions to control deer overabundance in southwestern Connecticut. A project evaluating accuracy of various population estimation techniques began in 2017 and is expected to be completed in 2019. In early September 2017, a concerned hunter called in stating he had found several dead deer along a small body of water adjacent to the Connecticut River in Portland. The deer were in various stages of decay along the banks of the water or floating in the water. Several additional deer were found less than a mile from that location at another small body of water. Additional reports of sick deer continued to come in through October. Several fresh carcasses were submitted for testing with 3 deer testing positive for Epizootic Hemorrhagic Disease (EHD). EHD is one of the most important infectious diseases affecting white-tailed deer and spreads by a bite from an infected midge. However, EHD does not infect humans and people are not at risk by handling infected deer, eating venison from infected deer, or being bitten by infected midges. Additional information about EHD can be found on the DEEP website at http://www.ct.gov/deep/cwp/view.asp?a=4918&q=597280. The Connecticut Department of Energy and Environmental Protection Wildlife Division (DEEP) Division expects to be collecting deer heads to test for chronic wasting disease (CWD) and blood samples for EHD (from towns along the Connecticut River) during the 2018 hunting season. Anyone interested in donating deer heads or blood samples from harvested deer should contact William Embacher ([email protected]) or Andrew LaBonte ([email protected]) at 860-418-5989 or 860-418-5921 for more information.
Hunter Notes In 2017, the DEEP collected 360 CWD samples from throughout the state, all of which tested negative. Since the beginning of collection efforts in 2003, over 6,000 samples have been collected, all of which have tested negative for CWD.
5
In 2015, the Connecticut General Assembly approved Public Act 15-204, An Act Authorizing Bow and Arrow Hunting on Certain Private Property on Sundays. This new law authorized DEEP to allow Sunday bowhunting on private properties during the archery season in areas of the state with an overpopulation of deer (includes all DMZs except 2, 3, and 4A). The law also requires that all such hunting must take place at least 40 yards away from blazed hiking trails. As with all deer or turkey hunting on private lands, hunters must have written permission from the landowner. Sunday hunting went into effect on October 1, 2015. Check the DEEP website (www.ct.gov/deep/hunting) for additional information. Information on dates and locations of hunter education courses can be obtained by calling the DEEP Wildlife Division at 860-424-3011, or on the DEEP website (www.ct.gov/deep/hunting). Licenses and permits to fish, hunt, and trap in Connecticut can be purchased on-line by going to Connecticut's Online Sportsmen Licensing System at www.ct.gov/deep/sportsmenlicensing. Regulations remain in place prohibiting hunters from transporting into Connecticut any deer or elk carcasses or part thereof from any state where chronic wasting disease (CWD) has been documented, unless de-boned. Specific wording of the regulation (https://eregulations.ct.gov/eRegsPortal/Browse/RCSA?id={1ED8C39C-FD16-40F5-B052-B02CE60CE7C0}&content=deer) and an updated list of states where CWD has been documented can be found on the DEEP website at www.ct.gov/deep/hunting.
Regulated Deer Harvest Regulated hunting is an effective and cost-efficient method for maintaining deer populations at acceptable densities. With the implementation of a new system for reporting harvested deer in 2009, caution should be exercised when comparing harvest data collected before 2009 to harvest data collected thereafter. During the 2017 hunting season, 12,080 deer were legally harvested and reported (Table 1; Figure 1). This represents a 13.3% increase from the 2016 harvest. Harvest by crossbow hunters comprised 41%, 54%, and 63% of the January harvest in 2016, 2017, and 2018. In 2017, 1,873 deer were harvested during the first 4 days of the shotgun/rifle season, a 6% increase from 2016 (1,772). Using the telephone and online reporting systems, the reported shotgun/rifle harvest was 4,281 deer in 2017, an 11% increase from 2016 (3,857). In 2017, the landowner harvest was 1,079, a 23.3% increase from 2016 (875). Typically, unlike the 3-week shotgun/rifle season, the landowner season runs from November to December and is less affected by periods of inclement weather and snowfall. The increase in harvest is likely due to a slight decline in acorn abundance from 2016 and slightly cooler temperatures. The antlerless and EAB tag harvest was higher in 2017 (403) than in 2016 (379). Deer harvested under the replacement antlerless and EAB programs (403) contributed to 15.8% of the total deer harvest on private land in DMZs 11 and 12. Archery and shotgun/rifle seasons accounted for 49.0% and 35.4% of all deer taken in 2017, which is the fourth consecutive year the archery harvest has exceeded the shotgun/rifle harvest. Landowners and muzzleloader hunters accounted for 8.9% and 6.7% of all deer taken in 2017. Harvest varied considerably by season and town (Appendix 1). The overall increase in the 2017 deer harvest was likely attributed to a low harvest during the 2016 season, previous mild winters with increased survival and productivity, and a slightly lower abundance of acorns than during the previous year. A Junior Deer Hunter Training Day was established in 2003 for youth hunters. This training period was increased to two days in 2009, and then expanded to a full week in 2014. Youth hunters continue to take advantage of these special training days. The recent 3-year average harvest for Junior Deer Hunter Training Days is 59 deer (Table 1).
Permit Allocation To reduce Connecticut's deer population growth rate, the Wildlife Division provides opportunities for hunters to purchase multiple deer permits. Permit issuance increased consistently from 1975 to 1992, and remained relatively stable from 1992-2009 (Figure 1). Since the implementation of the online license system and an increase in fees, permit issuance declined 9% (2009-2011) from the previous 3-year average of 61,859 (2006-2008). Deer permit issuance in 2014 declined nearly 1,000 permits from 2013, and declined another 2,327 permits in 2015 (Table 2). Permit issuance in 2016 was similar to permit issuance levels in 1989, while issuance in 2017 was even lower (Figure 1). Issuance for private land muzzleloader permits had the greatest one-year decline (12.5%), followed by state land A shotgun (5.7%). Alternatively, archery permit issuance increased to a record high of 17,029 in 2017. Overall, shotgun/rifle hunters purchased the largest percentage of permits (37.6%), followed by archery hunters (36.6%), muzzleloader hunters (18.0%), and landowners (7.9%). Seventy percent of firearms deer permits were issued for use on private land and the remaining 30% were issued for state-managed lands. During the eighth year of authorizing the use of revolvers for deer hunting, 853 hunters took advantage of this opportunity, a 5.7% increase in issuance from 2016 (807).
6
Table 1. Deer harvested during Connecticut's regulated hunting seasons, 2016-2017.
3-year % Change Average % of % Change 3-year
Season Harvest Harvest Harvest Total from 2016 Average 2016 2017 (2015-2017) 2017 to 2017 to 2017 Archery
State Land 663 551 619 4.6% -16.9% -10.9%
Private Land 4,425 5,075 4,272 42.0% 14.7% 18.8%
Replacement AntlerlessA, B 174 171 188 1.4% -1.7% -9.2%
Either-sex TagA, B 93 116 91 1.0% 24.7% 27.0%
JanuaryE 198 284 205 2.4% 43.4% 38.8%
Replacement AntlerlessA,
B 13 21 15 0.2% 61.5% 43.2%
Either-sex TagA, B 0 3 0 0.0% 0.0% 800.0%
CrossbowB 107 179 110 1.5% 67.3% 62.2%
Subtotal 5,286 5,910 5,095 48.9% 11.8% 16.0%
Muzzleloader
State Land 75 137 86 1.1% 82.7% 59.9%
Private Land 569 673 543 5.6% 18.3% 23.9%
Replacement AntlerlessA, C 6 15 9 0.1% 150.0% 73.1%
Either-sex TagA, C 5 9 5 0.1% 80.0% 80.0%
Subtotal 644 810 629 6.7% 25.8% 28.8%
Shotgun/Rifle
State Land A 573 623 550 5.2% 8.7% 13.3%
State Land B 84 129 70 1.1% 53.6% 85.2%
Private Land 3,200 3,529 3,159 29.2% 10.3% 11.7%
Replacement AntlerlessA, D 30 13 23 0.1% -56.7% -43.5%
Either-sex TagA, D 58 55 52 0.5% -5.2% 5.8%
RevolverD 7 7 5 0.1% 0.0% 40.0%
MuzzleloaderD 16 24 23 0.2% 50.0% 5.9%
Subtotal 3,857 4,281 3,778 35.4% 11.0% 13.3%
Youth Hunting DaysD 65 32 59 0.3% -50.8% -45.8%
Landowner 875 1,079 888 8.9% 23.3% 21.5%
Total 10,662 12,080 10,390 100.0% 13.3% 16.3% A Replacement antlerless and either-sex tags were available in zones 11 and 12 only. B Included as part of private land archery total. C Included as part of private land muzzleloader total. D Included as part of private land shotgun/rifle total. E Refers to the January following harvest year listed.
7
Figure 1. Total deer permit issuance and total deer harvest in Connecticut, 1975-2017.
Table 2. Deer hunting permits issued in Connecticut for all regulated hunting seasons, 2015-2017.
Permits Permits Permits
3-Year Average Permits
% of Total
% Change 2016 to
% Change 3-year Avg.
Season 2015 2016 2017 2014-2016 2017 2017 to 2017 Archery 16,975 16,864 17,029 16,814 36.6% 1.0% 1.3% Muzzleloader State Land 3,139 2,864 2,892 3,114 6.2% 1.0% -7.1% Private Land 6,447 6,262 5,478 6,774 11.8% -12.5% -19.1% Subtotal 9,586 9,126 8,370 9,888 18.0% -8.3% -15.4% Shotgun/Rifle State Land A* 4,755 4,534 4,277 4,786 9.2% -5.7% -10.6% State Land B* 1,615 1,615 1,583 1,670 3.4% -2.0% -5.2% Private Land 13,760 12,052 11,629 13,378 25.0% -3.5% -13.1% Subtotal 20,130 18,201 17,489 19,834 37.6% -3.9% -11.8% RevolverA 820 807 853 800 1.8% 5.7% 6.6% Landowner 3,818 3,767 3,676 3,898 7.9% -2.4% -5.7%
Total 50,509 47,958 46,564 50,434 100.0% -2.9% -7.7% * Includes controlled hunt permits. A Not included in total permits.
Hunter Success Hunter success rate was estimated by dividing total deer harvest by total permit issuance and multiplying by 100 (Table 3). Success rates may fluctuate annually, depending on weather conditions, timing of rain and snow storms, fall acorn crops, and deer herd size. Bowhunter success rates fluctuated between 24.3% and 27.6% from 2004 to 2008. Bowhunter success exceeded 35% from 2010 through 2014 (35.2% in 2010; 38.0% in 2011; 37.7% in 2012; 38.3% in 2013; and 35.7% in 2014), but declined during the 2015 (26.9%) and 2016 (31.3%) hunting seasons. This year, archery success nearly reached 35% (34.7%). Success rates in 2017 increased for all hunting seasons compared to 2016 and the 3-year average. In 2017, archery hunters had the highest annual success rate (34.7%), followed by private land shotgun/rifle hunters (30.3%) and landowners (29.4%). Success rate for the combined muzzleloader seasons was 9.7%. Lower success rates are expected because the muzzleloader season occurs after the shotgun/rifle deer hunting seasons.
8
Table 3. Deer hunter success rates (%) in Connecticut, 2016-2017.
3-year Avg. Difference Differencefrom 3-year
Avg. Success Rate from Season 2016 2017 (2014-2016) 2016 Archery
Combined1 31.3% 34.7% 31.3% 3.4% 3.4% Muzzleloader State Land 2.6% 4.7% 2.8% 2.1% 2.0% Private Land 9.1% 12.3% 8.2% 3.2% 4.1% Combined 7.1% 9.7% 6.5% 2.6% 3.2% Shotgun/Rifle State Land A 12.6% 14.6% 11.5% 1.97% 3.1% State Land B 5.2% 8.1% 4.2% 2.95% 3.9% Private Land 26.6% 30.3% 24.5% 3.75% 5.8% Combined 21.2% 24.5% 19.5% 3.28% 4.9% Landowner 23.2% 29.4% 22.8% 6.15% 6.6%
Average2 22.2% 26.1% 21.1% 3.85% 5.0% 1 Data available only for state and private land combined. 2 Average is based on total number of deer harvested/total number of permits issued.
Archery Statistics Excluding the landowner season, just over half (54%) of the deer taken during the hunting seasons were harvested by bowhunters. For the past 7 years (2011-2017), record bow harvests have been recorded (5,211; 5,413; 6,046; 5,433; 4,566; 5,286; 5,910 respectively). For the fifth consecutive year, the bow harvest (5,910) exceeded the shotgun/rifle harvest (3,529). Sixty-five percent (3,856 total – 3,386 private, 470 state) of the total archery harvest was taken during the early archery season (September 15 to November 14); 18% (1,074 total – 1,023 private, 51 state) was taken during the 3-week shotgun/rifle season (open in all zones on private land and state land bowhunting-only areas); 12% (696 – 666 private, 30 state) was taken during the muzzleloader season (December 6 to December 31); and 5% (284) was taken during the January season open in DMZs 11 and 12 on private land only (January 1-31, 2018). A total of 630 deer were taken on state areas (Appendix 2). During the 2017 archery season, hunters were allowed to hunt on Sundays on private land. The Sunday harvest comprised 11% of the entire archery harvest and 14% during the January season. Comparing the percent of archery deer harvested on weekends from 2014 (29%; Saturday only) to 2015 (37%; Saturday and Sunday), 2016 (35%; Saturday and Sunday), and 2017 (37%; Saturday and Sunday), there has been about a 6% to 8% increase in harvest on weekends during the regular season and about a 1% to 3% increase during the January season (2014, 35%; 2015, 38%; 2016, 36%; 2017, 38%) when archery hunting was opened up on Sundays in select zones (all DMZs except 2, 3, and 4A). To obtain additional information beneficial to zonal deer management, archery hunters were asked how many hours they hunted and how many fawns, does, and bucks they observed on the day they harvested their deer. According to information reported by hunters in response to the questions, the average number of deer observed per hour (Sept.-Dec.) in 2017 was 1.6, which was higher than 2016 (1.1), 2015 (0.89), and 2014 (1.1). Number of fawns per doe in 2017 (0.92) was higher than in 2016 (0.48) and 2015 (0.73), while number of bucks per doe in 2017 (0.30) was lower than 2016 (0.48), but higher than 2015 (0.22).
Connecticut Deer Management Zones To better manage the statewide deer population, data from hunter surveys, regulated deer harvests, and total deer mortality have been recorded and evaluated by Deer Management Zones (DMZs; Figure 2). Current population status and long-term trends are analyzed for each Deer Management Zone. This approach facilitates the assessment and management of regional deer populations.
Hunter Perceptions of Population Trends In 2017, 13,389 deer hunters were sent an email and asked to complete an online hunter survey. A total of 3,861 hunters responded for a 28% response rate. Similar to hunter surveys from previous years, the survey included the question, "How would you describe the status of the deer population from last year to this year?" Hunter perceptions of deer population trends were ranked on a scale of 0 (decreasing population) to 6 (increasing population). Thirty-five percent of the hunters who responded to the survey believed that the population was declining, 49% believed it was stable, and 16% believed it was increasing. DMZs 4A and 4B had the highest average rank (3.0 and 3.1) (Figure 3). In general, hunters perceived that deer populations are relatively stable or have been decreasing slightly in most zones over the past 3 years. Based on the survey, observations and distribution of predators were higher in 2017 than 2016. Hunters reported 2,251 bear sightings in 100 towns in 2017 at a rate of one bear sighting per 27 days spent afield (1,848 bear sightings in 126 towns in 2016, at a rate of one bear sighting per 32 days spent afield). Hunters reported 3,249 bobcat sightings in 151 towns in 2017 at a rate of one bobcat sighting per 18.7 days spent afield (2,690 bobcat sightings in 161 towns in 2016, at a rate of one bobcat sighting per 22 days spent afield). Hunters reported 11,025 coyote sightings in 159 towns in 2017 at a rate of one coyote per 5.5 days spent afield (9,670 coyote sightings in 169 towns in 2016 at a rate of one coyote per 6.1 days spent afield). Figure 3. Perception of zonal deer population trends (average rank) by Connecticut's deer hunters, 2015-2017.
10
Zonal Deer Management Because deer populations vary across the state, Deer Management Zones were established. Management strategies in each zone may vary depending on population status. In DMZ 4, a 4-year decreasing trend beginning in 1996 prompted harvest restrictions on female deer in this zone in 1999. During shotgun/rifle and muzzleloader seasons, the antlerless-only tag on 2-tag permits was not valid in DMZ 4. This restriction resulted in a decrease in the number of does harvested, allowing the population to stabilize. In 2002, deer populations appeared to be stable in the southern portion, but not in the northern portion of DMZ 4. In 2003, DMZ 4 was split into two zones (4A and 4B), allowing each zone to maintain different management objectives. In DMZ 4A (northern portion), the restriction on the use of antlerless tags was retained, while the use of antlerless tags was again allowed in DMZ 4B (southern portion) (Figure 4). In DMZ 2, persistently low densities prompted harvest restrictions on female deer in 2016. During shotgun/rifle and muzzleloader seasons, the antlerless-only tag on 2-tag permits was not valid. Free replacement antlerless tags and either-sex tags (bonus buck tags) were available in DMZs 11 and 12 during the private land archery, shotgun/rifle, and muzzleloader seasons in 2017. Replacement tags were available in these zones because these regions of the state were experiencing more human-deer conflicts and, therefore, had different management objectives than other regions. These programs have resulted in a substantial increase in the harvest of antlerless deer. Figure 4. Private land shotgun/rifle deer harvest in Deer Management Zones 4A and 4B, 1996-2017.
Insight into Deer Hunter Success Rates by Zone Shotgun/Rifle Season Success Annual deer harvest is one of many variables monitored by the Wildlife Division to assess changes in Connecticut's deer population over time for each DMZ. However, without information on hunter distribution and effort by zones, the potential usefulness of these data is limited. To gain insight into hunter distribution and success rates by zone, deer hunters were asked on the hunter survey, "In what zone do you do most of your shotgun/rifle hunting?" The percent of hunters in each DMZ was multiplied by total number of deer permits issued in 2017 to estimate total number of hunters by zone. Total number of hunters and total private land shotgun/rifle deer harvest for each zone were used to estimate deer hunter success rates for each zone (Table 4). In general, higher hunter success rates suggest higher deer density. Of the 13 management zones, most firearms hunting (42%) occurred in four zones (2, 5, 9 and 12). Highest private land deer harvests were reported for DMZs 5, 9, 10 and 12. Zone 4B had the highest deer harvest per square mile (1.9) and DMZ 4B had the greatest density of hunters (5.1 per square mile). Hunter success rate was highest in zone 5 (42%), while success in zones 2 and 4A were the lowest (17% and 19%). The 3-year trend in hunter success rates by zone has increased over the past 3 years (Table 5). Although hunter success has been variable due to the abundance of acorns, four DMZs (3, 4B, 5, and 10) have continued to produce relatively high hunter success rates over the past 3 years (Table 5).
11
Archery Season Success Based on the number of deer harvested and reported by bowhunters, 1 of 3 (35%) hunters harvested 2 or more deer during the regular archery season. Bowhunter success rates were highest in zones 4B, 5, 10, 11, and 12 (Table 6). In zone 4A, the restriction on the use of antlerless tags during the firearms seasons allowed for the population to increase between 1999 and 2003. In 2003, the zone was split into 4A and 4B, and the antlerless restriction was rescinded in 4B, likely increasing the population and resulting in increased success rates thereafter. In zones 11 and 12, firearms hunting is more limited and the archery season framework is liberal (use of bait, unlimited tags, longer seasons) (Table 6). The archery deer harvest in zone 11 was nearly 2 times higher than all other zones. Table 4. Zonal hunter numbers, harvest, and success rates for private land during the 2017 shotgun/rifle hunting
season.
Zone % of Estimated Hunted Hunters # of Private Deer %
Private LandA Answered Land Shotgun/ Area Harvest/ Hunters/ Success Zone Shotgun/Rifle QuestionA Rifle Hunters Harvest (sq. miles) Sq. Mile Sq. Mile Rate
Total 1,706 100.0% 11,629 3,529 3,785 0.9 3.1 30% A Based on hunter survey question asking hunters which zone they primarily shotgun/rifle hunt in. Table 5. Zonal comparisons in private land shotgun/rifle harvest, hunter distributions, and success rates, 2015-
Total 2,445 100.0% 17,029 5,648 33.2 A Based on hunter survey question asking hunters which zone they primarily archery hunt in.
Fall Acorn Crop Acorns are a preferred food for white-tailed deer during fall and winter. Acorn availability influences deer movement patterns and herd health. To interpret changes in harvest rates, herd health, and herd productivity, the Deer Program has been collecting data since 1993 from hunter surveys on abundance of the fall acorn crop. Hunter perceptions of the fall acorn crop were ranked on a scale from 0 (scarce) to 6 (abundant acorns). In 2017, 40.7% of the hunters who responded to the survey ranked the fall acorn crop as scarce, 59.3% as moderate, and 15.2% as abundant. DMZs 1, 2, 6, and 7 had the highest average rank (3.01-3.39), while DMZs 5, 8, 9, and 10 had the lowest average ranks (1.92-2.08) (Figure 5). On a scale of 0-6, the average rank statewide was 2.62. A large gypsy moth outbreak caused substantial oak damage that could have long-term implications on acorn production for areas of eastern Connecticut (DMZs 5, 9, and 10). The past 24 years of data on acorn abundance and deer harvest rates suggest that a correlation exists between hunter success and acorn abundance (Figure 6). In 1993, when acorns were abundant, hunter success was one of the lowest recorded, and in 2004, when acorns were scarce, the hunter success rate was the highest. During years with low acorn productivity, deer travel more to access other food sources, such as green fields, increasing their vulnerability to hunters. In 2013 and 2014, the acorn-success pattern was inconsistent and may have been influenced by warm weather during the hunting season. During the 2015 and 2016 seasons, the abundance of acorns and warm weather resulted in lower hunter success rates. On average, the acorn crop statewide has been moderate most years, scarce about every 5 to 6 years, and abundant every 4 years.
13
Figure 5. Perception of acorn crops (average rank) by Connecticut's deer hunters, 2014-2017.
Figure 6. Relationship between private land shotgun/rifle hunter success rates and fall acorn productivity, 1993-2017.
Private Land Deer Harvest The 2017 private land deer harvest was highest for DMZs 5, 11, and 12 (Table 7). Zonal harvest levels have fluctuated in most zones over the past 11 years and likely reflect differences in weather conditions, snow cover, acorn abundance, and deer densities (Table 7). Highest total deer harvest over the last 11 years has been reported in DMZ 11, likely a result of deer abundance, availability of replacement deer tags, use of bait, and increased access to land for hunting. Total private land deer harvest increased 13.9% from 2016 to 2017.
14
Table 7. Private land deer harvest for all seasons (excluding landowner) in each of Connecticut's Deer Management Zones, 2007-2017.
Harvest Effort, Observations, and Fawn Recruitment Hunter observations provide good trend indices into zonal population changes. Observation rates were measured based on number of deer observed per hour of hunting. Fawn recruitment (number of fawns added to fall population) also is an important variable used to understand changes in population growth and deer herd dynamics. Fawn recruitment was measured as number of fawns observed per doe. The most representative samples of fawn to doe ratios are those collected at the start of the hunting season, when fawns are easily identifiable and hunter harvest would have the least impact on observations. Another means of assessing zonal population changes is looking at the number of deer harvested per hour hunted. Observation rates of bucks, does, and fawns were different from previous years, as was the percent of each class harvested (Table 8). Fawns were harvested at a lower rate than they were observed, compared to bucks which were harvested at a greater rate than they were observed (Table 8). Number of deer observed per hour, number of fawns observed per doe, and number of deer harvested per hour varied across years and by zone (Table 9). Warm temperatures could have led to a reduction in deer observed per hour in 2017, but did not impact harvest per hour. The change in observations in 2017 was more likely caused by a technical issue with the harvest reporting system. Table 8. Hunter observations and harvest ratios reported during the first month of the archery season in
A Caution should be used when evaluating 2015 and 2017 results and comparisons, as technical issues with the harvest reporting system may have eliminated some observational data.
15
Table 9. Observation rates (deer seen/hour; D/hr), number of fawns per doe (F:D), and number of deer harvested per hour (H/hr) collected at the time harvest was summarized for the first month of the archery season by Deer Management Zone (DMZ) in Connecticut, 2015-2017.
Deer Harvested and Observed/Hour
Reported on Day of Harvest
DMZ First Month of Archery (Sept. 15-Oct. 15)
2015 2016 2017 ∆3 ∆3 ∆3 n D/hr1, 4 F:D4 H/hr2 n D/hr1 F:D H/hr2 n D/hr1, 4 F:D4 H/hr2 D/hr1 F:D4 H/hr
12 89 1.97 0.70 0.34 216 2.39 0.52 0.35 262 0.71 1.17 0.38 -1.68 0.65 0.03 1 Deer observed per hour hunted based on successful hunters. 2 Deer harvested per hour hunted based on successful hunters. 3 Change from 2016 to 2017. 4 Caution should be used when evaluating 2015 and 2017 results and comparisons, as technical issues with the harvest reporting system may have eliminated some observational data.
Deer Harvest Sex Ratios Removal of female deer is the most efficient means of stabilizing deer population growth. To facilitate stabilization, the Wildlife Division developed permits that encourage the harvest of female deer. All 2-tag permits come with 1 antlerless-only and 1 either-sex deer tag. In 2009, this was increased to 1 either-sex and 2 antlerless deer for hunters in DMZ 7 and 1 either-sex and 3 antlerless deer for hunters in DMZs 11 and 12. Although button bucks are included in the antlerless harvest, this system promotes the removal of female deer (Table 10). In zone 4A, the antlerless-only tag was NOT valid, reducing the bag limit to 1 deer per hunter during the private land firearms season. Overall, deer harvest sex ratios have been similar over the past 3 years (Table 11). Based on observations reported online at the time of harvest, a bias (proportion observed vs. proportion harvested) towards harvest of bucks occurs as the season progresses (Table 8). Selectivity of passing on fawns remains similar (Table 8). In 2017, 49% (5,703) of the total regulated deer harvest (excluding crop damage harvest) was comprised of antlerless deer. A significant proportion of the harvest included adult females, which contributes to population control efforts (Appendix 3). Table 10. Sex ratios (male:female) and antlered to antlerless ratios of deer harvested in 2017.
Muzzleloader Shotgun/Rifle Archery Landowner Crop Damage Total
Antler Points and Yearling Fraction Deer age, nutritional status, and genetics affect the number of antler points on bucks. The yearling fraction of the antlered buck harvest is a common measure of hunting pressure. Intensively hunted herds have yearling fractions of about 70%, while lightly hunted herds have fractions of about 30%. Few yearlings (less than 6%) have 7 or more points and few adults (less than 12%) have less than 5 points, based on the known aged samples in Connecticut. Using antlered bucks with less than 5 points (yearling) and those with 7 or more points (adults) is one way of estimating the yearling fraction of the antlered buck harvest. The statewide yearling/male fraction based on antler points during the shotgun/rifle season was 40% in 2012, 44% in 2013, 45% in 2014, 42% in 2015, 36% in 2016, and 39% in 2017. Of all antlered bucks harvested, 8-pointers were the most frequent point category (Figure 7). The number of points on antlered bucks has remained relatively consistent over the past 4 years (Figure 7).
Replacement Tags The replacement tag system was developed to increase the harvest of female deer. This system is currently in place in DMZs 11 and 12. Since 1998, when archery hunters first had access to replacement tags in DMZ 11, the buck harvest remained relatively stable, while the antlerless harvest in that zone increased nearly 5 times (from 200 to almost 1,000 deer annually and now has declined slightly to about 800). The buck harvest has increased in recent years with the addition of earn-a-buck in 2005. The number of roadkills in DMZ 11 has shown a steady decline since 1998 (Figure 8). The ratio of female deer harvested in DMZ 11 increased from 0.9 females per male (1994-1997) to 1.3 females per male (2001-2009), and is now averaging around 1:1 (Figure 9). Figure 7. Number of antler points on bucks collected by the telecheck/online reporting system during the
shotgun/rifle hunting season in Connecticut, 2014-2017.
17
Figure 8. Comparison of trends in roadkills and the antlered and antlerless deer harvests during the archery deer season in Deer Management Zone 11, 1995-2017.
Figure 9. Changes in the sex ratios of harvested deer from Deer Management Zone 11 after implementing
various management strategies during the archery season, 1994-2017.
Deer Hunter Expenditures, Effort, Venison Calculations, and Opinions Deer hunting-related expenditures contribute significantly to Connecticut's economy. Deer permit sales generated $1,601,187 in 2013, $1,704,083 in 2014, $1,687,962 in 2015, $1,447,074 in 2016, and $1,430,519 in 2017 to the Connecticut General Fund. In addition, data collected from the annual deer hunter surveys indicated that Connecticut deer hunters spent an estimated $6,801,501 on deer hunting-related goods and services in 2017, up from the $5,045,031 spent in 2016.
18
In 2017, deer hunters spent a cumulative total of 381,824 days afield. Private and state land shotgun/rifle hunters used the greatest percentage of available hunting days during those seasons (31% and 26% respectively). Although bowhunters used a smaller percentage of available hunting days (24%), the archery season is much longer than the firearms season. Connecticut deer hunters collectively spent less time (32 days per deer taken) but more money ($563 per deer taken) in 2017 compared to 2016 (37 days at $473 per deer taken). In 2017, hunters harvested an estimated 604,000 pounds (average 50 lbs. of meat/hunter; 269 tons total) of venison at an estimated value of $4,077,000 ($6.75/lb.). Hunters were asked how satisfied they were with their Connecticut deer hunting experience in 2017. Excluding hunters who had no opinion (about 9%), about a third of hunters were very satisfied with their hunting experience (31%), a third were moderately satisfied (36%), and the remainder were slightly satisfied (17%) or not at all satisfied (16%), similar to 2016.
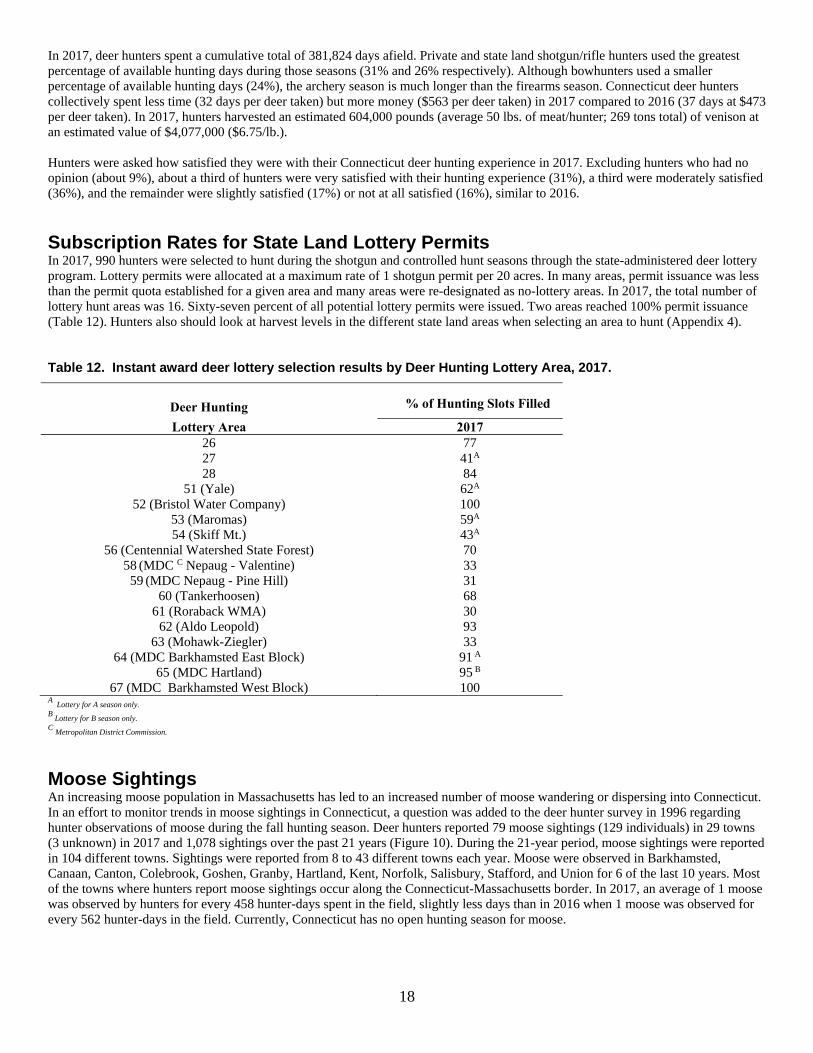
Subscription Rates for State Land Lottery Permits In 2017, 990 hunters were selected to hunt during the shotgun and controlled hunt seasons through the state-administered deer lottery program. Lottery permits were allocated at a maximum rate of 1 shotgun permit per 20 acres. In many areas, permit issuance was less than the permit quota established for a given area and many areas were re-designated as no-lottery areas. In 2017, the total number of lottery hunt areas was 16. Sixty-seven percent of all potential lottery permits were issued. Two areas reached 100% permit issuance (Table 12). Hunters also should look at harvest levels in the different state land areas when selecting an area to hunt (Appendix 4). Table 12. Instant award deer lottery selection results by Deer Hunting Lottery Area, 2017.
1BDeer Hunting
% of Hunting Slots Filled
Lottery Area 2017 26 77 27 41A 28 84
51 (Yale) 62A 52 (Bristol Water Company) 100
53 (Maromas) 59A 54 (Skiff Mt.) 43A
56 (Centennial Watershed State Forest) 70 58 (MDC C Nepaug - Valentine) 33 59 (MDC Nepaug - Pine Hill) 31
60 (Tankerhoosen) 68 61 (Roraback WMA) 30
62 (Aldo Leopold) 93 63 (Mohawk-Ziegler) 33
64 (MDC Barkhamsted East Block) 91 A 65 (MDC Hartland) 95 B
67 (MDC Barkhamsted West Block) 100 A
Lottery for A season only. B
Lottery for B season only. C
Metropolitan District Commission.
Moose Sightings An increasing moose population in Massachusetts has led to an increased number of moose wandering or dispersing into Connecticut. In an effort to monitor trends in moose sightings in Connecticut, a question was added to the deer hunter survey in 1996 regarding hunter observations of moose during the fall hunting season. Deer hunters reported 79 moose sightings (129 individuals) in 29 towns (3 unknown) in 2017 and 1,078 sightings over the past 21 years (Figure 10). During the 21-year period, moose sightings were reported in 104 different towns. Sightings were reported from 8 to 43 different towns each year. Moose were observed in Barkhamsted, Canaan, Canton, Colebrook, Goshen, Granby, Hartland, Kent, Norfolk, Salisbury, Stafford, and Union for 6 of the last 10 years. Most of the towns where hunters report moose sightings occur along the Connecticut-Massachusetts border. In 2017, an average of 1 moose was observed by hunters for every 458 hunter-days spent in the field, slightly less days than in 2016 when 1 moose was observed for every 562 hunter-days in the field. Currently, Connecticut has no open hunting season for moose.
19
Figure 10. Moose sightings reported on deer hunter surveys, 1996-2017.
Controlled Deer Hunts Yale Forest (Area 51): Yale Forest is a 7,700-acre forest located in Eastford and Ashford. The forest is owned and managed by Yale University for research, education, and forest products. Controlled hunts have been implemented on the property since 1984 in an effort to reduce deer impacts on forest regeneration. During the 2017 controlled hunt, 27 deer were harvested. Bristol Water Company (BWC; Area 52): In 1994, BWC contacted the Wildlife Division and expressed interest in opening 4,500 acres for deer management. In 1995, the Wildlife Division conducted a winter aerial deer survey on BWC lands. After survey results were summarized, BWC requested to participate in the controlled hunt program for the 1996, 1997, and 1998 deer seasons to reduce the local deer population. After 3 years of successfully implementing a deer management program on BWC land, BWC asked to continue participating in the program. During the 2017 controlled hunt, 16 deer were harvested. Maromas Cooperative Management Area (Area 53): Since 1996, Maromas, a 1,400-acre parcel in Middletown owned by Northeast Utilities (now known as Eversource), has been open to archery, shotgun, and muzzleloader hunting to maintain deer densities at levels compatible with available habitat. During the 2017 controlled hunt, 17 deer were harvested. Skiff Mountain (Area 54): Skiff Mountain is a 710-acre property in Sharon owned by Northeast Utilities (now known as Eversource). It is open to archery, shotgun, and muzzleloader hunting. During the 2017 controlled hunt, 8 deer were harvested. Centennial Watershed State Forest (formerly known as Bridgeport Hydraulic Company) (Area 56): The Hemlock Tract has been open to hunting since 1996. In 2005, an additional 1,765 acres were opened to hunting (3,474 total acres). During the 2017 controlled hunt, 86 deer were harvested. MDC Nepaug Reservoir (Area 58 and 59): In 2007, MDC (Metropolitan District Commission) contacted the Wildlife Division and expressed concern about the impacts of deer on forest regeneration at their Valentine (Area 58, 1,075 acres) and Pine Hill (Area 59, 325 acres) forest blocks. A browse survey indicated that over 95% of forest regeneration was browsed by deer. In 2008, MDC worked
20
with the Wildlife Division to develop a deer management plan for the two forest blocks. In 2009, both Valentine and Pine Hill were opened to hunting for the early archery and shotgun/rifle seasons. During the 2017 controlled hunt, 10 deer were harvested. Bluff Point Coastal Reserve: Controlled hunts and DEEP deer removals at Bluff Point Coastal Reserve in Groton have been implemented over the past 22 years to reduce and maintain the deer population at about 25 animals. Since the program started in 1996, over 500 deer have been removed from Bluff Point, resulting in improved deer herd health and ecosystem stability. In December 2017, the deer population was estimated to be 44 deer. In February 2018, 18 deer were removed by DEEP personnel. After the March 2018 removal, the population was estimated at 26 deer.
Crop Damage Permits Deer damage is an important economic concern to some commercial agricultural operations. The Wildlife Division's crop damage program regulates the removal of deer on agricultural properties which meet specific criteria and are experiencing deer damage to specific plant commodities. The Division also encourages agriculturists to take advantage of the regulated deer hunting season to aid in the removal of problem deer and to use other methods, such as fencing, to reduce deer damage. In 2015, the crop damage application and deer registration process were streamlined. Crop damage applications can now be obtained from the Department’s website (www.ct.gov/deep/wildlife) and filled out electronically. Crop damage shooters are no longer required to mail in paper tags upon removing a deer, but are now required to report their removal online or by telephone. During the 2017 calendar year, 558 deer were taken with crop damage permits (Appendix 3). From 1993-2016, annual deer removal with crop damage permits has fluctuated between 462 and 946 deer. Deer removals in DMZs 3 and 10 accounted for 30% of deer removed with crop damage permits in 2017. Crop damage removals increased steadily from May to October, with 53% of the annual removals occurring in September and October (Figure 11). Crop damage permits are not valid in November and December.
Non-hunting Deer Mortality Non-hunting deer mortality, particularly roadkills, represents a significant percentage of annual deer losses in Connecticut. Roadkill data provide important information relative to cultural carrying capacity, population modeling, and, to a lesser extent, deer density and herd sex ratios. In an urban-suburban state like Connecticut, measures of land-use conflicts, such as roadkills, are an important source of data for the formulation of management policies and recommendations. In 2017, 1,294 non-hunting deer mortalities were reported (Appendix 4). Of those, 687 were killed in deer-vehicle collisions. This equates to an average of 1.9 deer being killed per day on Connecticut roads and highways. Deer-vehicle collisions accounted for 94% of all reported non-hunting mortality (excluding crop damage; 560) in 2017. Based on a 2-year study (2000-2001), for every 1 deer killed by a vehicle and reported to the Wildlife Division, 5 additional deer are killed by vehicles and not reported. Based on this correction factor, it is estimated that the actual number of roadkills in 2017 was 4,122. Nearly 16% (109) of all roadkilled deer reported in Connecticut in 2017 occurred in DMZ 11 (Fairfield County, Figure 2), the rate of which has been declining over the past few years (Appendix 5). The number of roadkills in DMZ 11 has shown a steady decline since the implementation of the replacement tag program, extension of the archery season, and legalization of baiting (Figure 8). Non-hunting mortality comprised 9.7% of the total reported deer mortality in Connecticut, including crop damage harvest (Appendix 4). Figure 11. Crop damage deer removals by month, 2017.
21
Conclusion Over the past several decades, deer population size, human land-use practices, and public attitudes toward wildlife have changed considerably. Today, hunters may legally take up to 14 deer (including the January archery season on private land in DMZs 11 and 12) per year if they participate in all hunting seasons, and unlimited deer may be taken in 2 of the 13 Deer Management Zones. Historically, deer permit issuance increased consistently from 11,710 in 1975 to 61,333 in 1992. Since 1992, permit issuance has remained relatively stable, fluctuating between 60,316 and 64,032. In 2008, permit issuance increased to its highest point in history. The cause for this increase is unknown, but may have been attributed to the poor economy, or the green movement where harvesting one’s own food may be a desirable means of obtaining quality protein. In 2009, permit issuance declined slightly, likely due to the switch to online license sales. Since 2010, permit issuance has continued to decline annually due to changes in the lottery system and the ability to purchase permits at any time rather than in advance of the hunting season. Permit issuance in recent years is now at the same level as it was in 1988. Over the last 10 years, harvest in most Deer Management Zones has remained relatively stable. However, with increased opportunities and incentives to harvest deer in urban Deer Management Zones 11 and 12, the harvest had more than doubled, but is now beginning to decline, while roadkills have been exhibiting a steady downward trend in those zones. Increased harvest opportunities appear to have stabilized deer populations in many areas of the state. The Wildlife Division continues to conduct research and evaluate the effectiveness of methods to control deer populations, particularly in urban-suburban landscapes. The Division initiated several long-term urban deer studies in residential communities in past years. Reports summarizing findings from these studies are available to communities interested in managing deer in more developed areas of the state, such as Fairfield County. Copies of these reports can be obtained from the DEEP website at www.ct.gov/deep/wildlife, by contacting the Wildlife Division’s Deer Program via email at [email protected] or calling the Wildlife Division’s Franklin office at 860-418-5921. The Wildlife Division will continue to provide technical assistance on deer control options to interested communities. Future management efforts will continue to focus on deer population stabilization. In areas with overabundant deer populations, landowners will be encouraged to use hunting, where possible, as a management tool. A booklet on Managing Urban Deer in Connecticut is available from Wildlife Division offices or online (www.ct.gov/deep/lib/deep/wildlife/pdf_files/game/urbandeer07.pdf) to assist communities in developing effective deer management programs. Another publication, An Evaluation of Deer Management Options, was made available in 2009 by the Northeast Deer Technical Committee and can be found on the DEEP website as well (www.ct.gov/deep/lib/deep/wildlife/pdf_files/game/deeroptions.pdf). As a way of thanking hunters for their support, the DEEP has been holding a special Hunting and Fishing Day in September for several years now. As a means of exposing a wider range of participants to hunting and fishing, the name was changed to Discover Outdoor Connecticut in 2018. Following is a poster announcing the 2018 event being held at the Franklin Wildlife Management Area in North Franklin, CT. For information about the event, visit www.ct.gov/deep/DiscoverOutdoorCT.
22
23
Appendix 1. Total reported deer harvest and roadkills by town, 2017.
Town Archery Shotgun/Rifle Landowner Muzzleloader Cropkill Roadkill Other Total Andover 38 28 11 3 0 0 0 80
Ansonia 10 7 0 0 0 2 0 19
Ashford 50 97 34 16 2 2 0 201
Avon 8 15 0 3 2 1 1 30
Barkhamsted 12 62 4 4 0 9 0 91
Beacon Falls 7 21 1 3 0 0 0 32
Berlin 44 24 9 4 3 0 1 85
Bethany 34 21 2 5 5 0 0 67
Bethel 62 7 0 3 0 0 0 72
Bethlehem 16 14 2 2 1 2 0 37
Bloomfield 23 14 0 2 0 2 1 42
Bolton 18 17 3 4 0 0 0 42
Bozrah 15 29 23 4 2 0 0 73
Branford 28 3 1 0 2 1 0 35
Bridgeport 0 1 0 0 0 0 0 1
Bridgewater 21 28 6 6 2 0 0 63
Bristol 9 8 1 0 0 11 2 31
Brookfield 46 4 0 3 0 4 0 57
Brooklyn 31 44 12 6 2 2 0 97
Burlington 14 24 1 4 0 0 0 43
Canaan 23 35 7 5 2 5 0 77
Canterbury 27 57 33 11 5 0 0 133
Canton 36 15 5 4 1 8 0 69
Chaplin 16 28 11 11 2 3 0 71
Cheshire 77 16 1 4 25 4 0 127
Chester 15 23 3 2 5 0 0 48
Clinton 36 7 0 2 1 0 0 46
Colchester 49 56 22 9 5 0 0 141
Colebrook 6 9 1 3 0 3 0 22
Columbia 32 33 12 5 8 1 0 91
Cornwall 20 36 12 3 0 6 0 77
Coventry 83 95 9 11 9 5 1 213
Cromwell 5 4 0 1 0 3 0 13
Danbury 81 10 1 2 0 6 0 100
Darien 26 0 2 0 0 10 4 42
Deep River 18 11 4 2 7 0 2 44
Derby 6 3 0 0 0 1 0 10
Durham 38 30 2 4 0 1 0 75
East Granby 5 8 1 1 0 0 0 15
East Haddam 106 80 28 8 5 0 0 227
East Hampton 28 44 12 13 0 0 0 97
East Hartford 8 2 1 1 9 0 0 21
East Haven 24 0 1 1 0 0 0 26
East Lyme 53 37 3 4 1 0 0 98
East Windsor 23 34 6 7 6 0 0 76
Eastford 14 66 9 11 0 1 0 101
Easton 91 36 3 0 7 17 1 155
Ellington 29 10 18 3 1 0 0 61
24
Town Archery Shotgun/Rifle Landowner Muzzleloader Cropkill Roadkill Other Total Enfield 38 23 2 2 1 10 0 76
Essex 5 5 1 0 0 0 0 11
Fairfield 84 8 0 1 0 3 0 96
Farmington 8 20 0 0 13 17 2 60
Franklin 22 39 11 7 8 1 0 88
Glastonbury 38 41 4 10 35 34 2 164
Goshen 19 20 8 5 0 8 0 60
Granby 14 16 8 3 0 1 0 42
Greenwich 91 3 0 0 0 0 0 94
Griswold 40 69 22 7 40 7 0 185
Groton 49 4 3 3 3 2 0 64
Guilford 102 26 5 6 9 7 1 156
Haddam 56 54 26 9 1 2 0 148
Hamden 33 18 1 4 22 0 0 78
Hampton 24 40 20 8 4 1 1 98
Hartford 0 1 1 0 0 1 1 4
Hartland 8 36 4 4 0 4 0 56
Harwinton 28 30 8 5 12 6 0 89
Hebron 55 44 14 7 0 0 0 120
Kent 24 51 3 5 5 6 0 94
Killingly 35 49 17 7 6 17 0 131
Killingworth 41 41 12 8 0 0 1 103
Lebanon 59 93 44 18 9 0 0 223
Ledyard 44 34 9 8 1 15 0 111
Lisbon 18 22 18 5 0 1 0 64
Litchfield 37 49 13 3 3 12 0 117
Lyme 48 42 11 9 5 0 0 115
Madison 59 20 0 2 0 11 0 92
Manchester 18 11 1 3 2 3 1 39
Mansfield 62 62 14 10 6 13 0 167
Marlborough 27 41 13 8 0 2 0 91
Meriden 22 5 0 0 0 12 0 39
Middlebury 11 9 4 4 0 12 0 40
Middlefield 31 30 1 5 10 1 0 78
Middletown 62 34 10 16 0 7 1 130
Milford 44 6 1 1 1 2 5 60
Monroe 56 8 0 2 0 0 0 66
Montville 52 38 13 13 1 1 0 118
Morris 20 18 4 4 2 1 0 49
Naugatuck 35 7 3 1 0 1 0 47
New Britain 3 0 0 0 0 1 0 4
New Canaan 68 1 0 0 0 4 4 77
New Fairfield 41 15 0 6 0 1 1 64
New Hartford 37 27 8 4 5 4 1 86
New Haven 6 1 0 0 0 2 0 9
New London 4 0 0 0 0 1 1 6
New Milford 65 58 14 11 1 0 0 149
Newington 5 0 0 0 1 0 0 6
Newtown 160 53 4 14 30 33 0 294
25
Town Archery Shotgun/Rifle Landowner Muzzleloader Cropkill Roadkill Other Total Norfolk 6 20 11 3 0 1 0 41
North Branford 47 12 1 4 2 0 0 66
North Canaan 8 15 3 1 0 0 0 27 North Haven 33 5 0 1 0 0 0 39
North Stonington 54 76 10 9 0 0 0 149
Norwalk 25 1 0 0 0 25 0 51
Norwich 20 28 5 3 0 0 6 62
Old Lyme 82 30 3 3 0 0 0 118
Old Saybrook 13 8 0 0 0 6 0 27
Orange 46 3 0 5 0 3 3 60
Oxford 30 24 9 6 7 8 0 84
Plainfield 47 55 19 7 5 5 0 138
Plainville 3 2 0 4 0 0 0 9
Plymouth 17 14 6 2 0 1 2 42
Pomfret 30 63 14 19 5 5 0 136
Portland 14 32 1 3 3 13 1 67
Preston 33 36 14 5 15 0 0 103
Prospect 23 10 0 3 0 6 0 42
Putnam 21 21 5 3 4 7 0 61
Redding 114 37 1 9 2 0 0 163
Ridgefield 138 23 0 22 0 14 2 199
Rocky Hill 4 7 0 2 5 6 0 24
Roxbury 12 20 1 12 5 1 0 51
Salem 36 45 15 9 1 0 0 106
Salisbury 80 67 9 16 9 6 0 187
Scotland 25 45 17 9 0 6 0 102
Seymour 47 6 1 2 0 5 2 63
Sharon 38 75 6 8 15 4 1 147
Shelton 78 4 1 1 12 2 1 99
Sherman 41 15 3 4 4 3 0 70
Simsbury 23 5 0 1 1 1 0 31
Somers 32 18 2 8 0 5 0 65
South Windsor 26 13 5 3 0 0 0 47
Southbury 61 22 2 5 9 14 1 114
Southington 39 14 0 7 1 8 0 69
Sprague 15 25 6 9 4 0 0 59
Stafford 57 60 24 17 0 2 0 160
Stamford 55 3 0 0 0 0 0 58
Sterling 36 30 15 7 0 3 0 91
Stonington 34 45 8 9 0 4 0 100
Stratford 22 4 0 0 0 0 0 26
Suffield 35 42 6 4 14 0 0 101
Thomaston 14 10 5 2 1 3 0 35
Thompson 82 73 31 11 7 6 0 210
Tolland 59 25 15 6 2 4 0 111
Torrington 19 23 7 4 0 11 0 64
Trumbull 47 1 0 0 0 2 1 51
Union 28 26 6 5 0 1 0 66
Vernon 20 8 2 2 0 2 0 34
26
Town Archery Shotgun/Rifle Landowner Muzzleloader Cropkill Roadkill Other Total Voluntown 35 54 12 11 14 1 0 127
Wallingford 46 21 2 7 11 5 2 94
Warren 12 20 6 4 4 2 0 48
Washington 30 35 14 6 27 13 0 125
Waterbury 11 1 0 2 0 2 0 16
Waterford 92 27 8 5 0 15 1 148
Watertown 17 22 6 1 1 0 0 47
West Haven 1 0 0 0 0 0 0 1
West Hartford 20 1 0 0 3 0 0 24
Westbrook 17 11 3 4 0 1 0 36
Weston 37 25 0 0 0 2 0 64
Westport 10 1 0 0 0 0 0 11
Wethersfield 1 5 0 6 5 3 0 20
Willington 37 27 19 2 0 5 0 90
Wilton 105 24 0 6 0 8 0 143
Winchester 13 14 7 12 0 2 0 48
Windham 37 45 6 6 3 1 0 98
Windsor 16 8 2 1 2 9 0 38
Windsor Locks 0 1 0 0 0 3 0 4
Wolcott 9 3 0 2 0 3 0 17
Woodbridge 46 6 0 5 0 16 2 75
Woodbury 19 23 4 7 1 19 0 73
Woodstock 61 86 29 0 0 7 0 183
Total 5,910 4,281 1,079 810 560 687 60 13,387
27
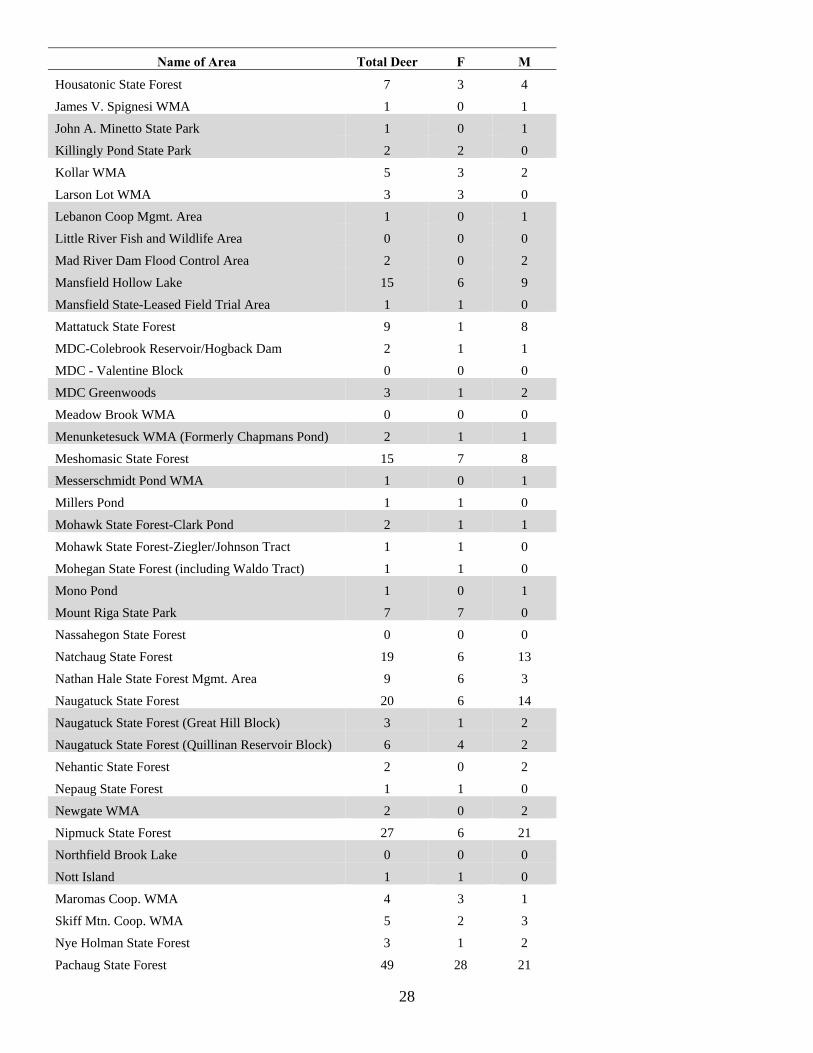
Appendix 2. Archery harvest on state areas (archery only areas), 2017.
Name of Area Total Deer F M
Aldo Leopold WMA 1 1 0
Algonquin State Forest 2 1 1
American Legion State Forest 1 1 0
Assekonk Swamp WMA 1 1 0
Babcock Pond WMA 1 0 1
Barber Pond WMA 6 4 1
Barn Island WMA 1 1 0
Bartlett Brook WMA 1 0 1
Bear Hill WMA 1 0 1
Beaver Brook State Park 3 2 1
Bennett's Pond State Park 5 0 5
Bigelow Hollow State Park 4 2 2
Bishops Swamp WMA 5 2 3
Black Pond WMA 0 0 0
Black Rock Lake 0 0 0
Bloomfield Flood Control Area (Site 1) 3 2 1
Camp Columbia 6 3 3
Cedar Swamp WMA 3 3 0
Centennial Watershed SF 34 17 17
Centennial Watershed SF (Canaan Block) 1 1 0
Centennial Watershed State Forest (BHC) 2 0 2
CL&P (borders Newgate WMA) 1 0 1
Cockaponset State Forest 40 18 22
Collis P. Huntington State Park 11 6 5
Cromwell Meadows WMA 0 0 0
Durham Meadows WMA 1 1 0
East Swamp 4 1 3
East Twin Lakes Water Access Area 3 3 0
Eight Mile River WMA 0 0 0
Ellithorpe Flood Control Area 0 0 0
Enders State Forest 4 2 2
Franklin Swamp WMA 2 1 1
George C. Waldo State Park 0 0 0
Goshen WMA 2 2 0
Great Swamp Flood Control Area 2 2 0
Hancock Brook Lake 0 0 0
Harkness/Verkades 8 5 3
Higganum Meadows WMA 6 2 4
Higganum Reservoir 1 0 1
Housatonic River WMA 3 2 1
28
Name of Area Total Deer F M
Housatonic State Forest 7 3 4
James V. Spignesi WMA 1 0 1
John A. Minetto State Park 1 0 1
Killingly Pond State Park 2 2 0
Kollar WMA 5 3 2
Larson Lot WMA 3 3 0
Lebanon Coop Mgmt. Area 1 0 1
Little River Fish and Wildlife Area 0 0 0
Mad River Dam Flood Control Area 2 0 2
Mansfield Hollow Lake 15 6 9
Mansfield State-Leased Field Trial Area 1 1 0
Mattatuck State Forest 9 1 8
MDC-Colebrook Reservoir/Hogback Dam 2 1 1
MDC - Valentine Block 0 0 0
MDC Greenwoods 3 1 2
Meadow Brook WMA 0 0 0
Menunketesuck WMA (Formerly Chapmans Pond) 2 1 1
Meshomasic State Forest 15 7 8
Messerschmidt Pond WMA 1 0 1
Millers Pond 1 1 0
Mohawk State Forest-Clark Pond 2 1 1
Mohawk State Forest-Ziegler/Johnson Tract 1 1 0
Mohegan State Forest (including Waldo Tract) 1 1 0
Mono Pond 1 0 1
Mount Riga State Park 7 7 0
Nassahegon State Forest 0 0 0
Natchaug State Forest 19 6 13
Nathan Hale State Forest Mgmt. Area 9 6 3
Naugatuck State Forest 20 6 14
Naugatuck State Forest (Great Hill Block) 3 1 2
Naugatuck State Forest (Quillinan Reservoir Block) 6 4 2
Nehantic State Forest 2 0 2
Nepaug State Forest 1 1 0
Newgate WMA 2 0 2
Nipmuck State Forest 27 6 21
Northfield Brook Lake 0 0 0
Nott Island 1 1 0
Maromas Coop. WMA 4 3 1
Skiff Mtn. Coop. WMA 5 2 3
Nye Holman State Forest 3 1 2
Pachaug State Forest 49 28 21
29
Name of Area Total Deer F M
Paugnut State Forest 3 0 3
Paugussett State Forest 5 1 4
Peoples State Forest 3 2 1
Pease Brook WMA 0 0 0
Pomeroy State Park 4 1 3
Pootatuck State Forest 1 1 0
Quaddick State Forest 7 2 5
Quinebaug River WMA 2 1 1
Quinebaug River WMA (Aspinook Pond) 0 0 0
Quinnipiac River Marsh 2 2 0
Quinnipiac River State Park 12 5 7
Red Cedar Lake 2 2 0
Robbins Swamp WMA 4 2 2
Roraback WMA 5 3 2
Rose Hill WMA 3 2 1
Ross Marsh WMA 4 3 1
Ross Pond State Park 1 0 1
Salmon River Cove & Haddam Neck 0 0 0
Salmon River State Forest 10 6 4
Scantic River State Park 3 2 1
Selden Island State Park 0 0 0
Sessions Woods WMA 0 0 0
Shenipsit State Forest 13 5 8
Silvio O. Conte NWR 0 0 0
Simsbury WMA 8 3 5
Stones Ranch Military Reservation 0 0 0
Suckerbrook Flood Control 1 0 1
Sugarbrook Field Trial Area 0 0 0
Suffield WMA 0 0 0
Sunnybrook State Park 1 0 1
Talbot WMA 2 1 1
Tankerhoosen WMA 5 1 4
Thomaston Dam 3 2 1
Topsmead State Forest 1 1 0
Trout Brook Valley State Park 1 1 0
Tunxis State Forest 5 1 4
Wangunk Meadows 1 0 1
West Thompson Dam 11 6 5
Whiting River Flood Control Area 1 1 0
Wood Creek Flood Control Area 1 1 0
Wooster Mountain State Park 1 0 1
30
Name of Area Total Deer F M
Wopowog WMA 0 0 0
Wyantenock State Forest 1 1 0
Zemko Pond WMA 1 1 0 Appendix 3. Sex ratios (male:female) of deer harvested during Connecticut's regulated hunting seasons, 2015-
2017.
3-year Average 2015 2016 2017 (2015-2017) Males per Female
* Crop damage harvest is included under non-hunting mortality. Appendix 6. Frequency of deer roadkills in each of Connecticut's Deer Management Zones, a 5-year
comparison, 2013-2017.
0BRoadkills/Sq. Mile
Five-year Habitat
Zone 2013 2014 2015 2016 2017 Total Zonal % (sq. miles) 2015 2016 2017