UNCLASSIFIED UNCLASSIFIED 2017 Crime Statistics Report Authorising Officer: Commissioner Of The Bermuda Police Service Author: Analysis Unit Date: 23-Apr-2018 File Location: I:\Intelligence Briefings\INTELLIGENCE ANALYSTS\2017\Yearly Statistics\FINAL VERSION\2017 Crime Statistics Report Security Classification: This document is marked as UNCLASSIFIED. Further dissemination is allowed internally and externally of the BPS, without further authorisation.
Transcript
UNCLASSIFIED
UNCLASSIFIED
2017 Crime Statistics Report
Authorising Officer: Commissioner Of The Bermuda Police Service Author: Analysis Unit Date: 23-Apr-2018 File Location: I:\Intelligence Briefings\INTELLIGENCE ANALYSTS\2017\Yearly Statistics\FINAL VERSION\2017 Crime Statistics Report Security Classification: This document is marked as UNCLASSIFIED. Further dissemination is allowed internally and externally of the BPS, without further authorisation.
UNCLASSIFIED
UNCLASSIFIED 1
INDEX 1. INTRODUCTION Page 2
1.5 EXECUTIVE SUMMARY Page 3 2. ALL CRIME Page 4 3. CRIMES AGAINST THE PERSON Page 5 4. FIREARM INCIDENTS Page 6 5. CRIMES AGAINST THE COMMUNITY Page 9 6. CRIMES AGAINST PROPERTY Page 10 7. ROAD TRAFFIC COLLISIONS Page 11 8. TRAFFIC ENFORCEMENT ACTIVITY Page 12 9. CALLS FOR SERVICE Page 13 10. ARRESTS - ALL OFFENCES Page 14 11. STOP AND SEARCH Page 18 12. PROCEEDS OF CRIME ACT (POCA) SEIZURES Page 19
Appendix A: Crime Statistics In Bermuda, By Quarter (2013 - 2017)
Appendix B: Traffic Enforcement Activity In Bermuda, By Quarter (2013 - 2017) Appendix C: Traffic Collisions Statistics In Bermuda, By Quarter (2013 - 2017) Appendix D: All Crime In Bermuda, By Quarter (Q1 2000 - Q4 2017) Appendix E: All Crime In Bermuda, By Year (2000 - 2017) Appendix F: Firearm Fatalities, Injuries and All Homicides In Bermuda,
By Year (2000 - 2017)
UNCLASSIFIED
UNCLASSIFIED 2
1. INTRODUCTION 1.1 SECURITY CLASSIFICATION This document is marked as UNCLASSIFIED as there are no sensitive details contained in it and it is expressly written to be circulated both internally and externally. 1.2 DATA INTEGRITY The statistics, tables and graphs contained in this document are based on substantiated principal offences that occurred during the period covered (not recorded during the period covered), and which have been actively investigated. While every effort is made to ensure that the information contained in this report is accurate, the BPS makes no warranty, representation or guarantee as to the content, sequence, accuracy, timeliness or completeness of any data or information provided. The reader should not rely on the data provided for comparison purposes over time, or for any reason. The BPS shall assume no liability for any errors, omissions, or inaccuracies in the information provided. The BPS will not be responsible for the use of, or the results obtained from the use of this report. The BPS assumes no liability for any decisions made or actions taken or not taken by the user in reliance of this report. Any use of the document for commercial purposes is prohibited. 1.3 EXPLANATION OF GRAPHS The graphs used in this report include standard deviation, which has been used as a means of objectively measuring how much the data has varied over time and is useful in identifying extreme highs and lows of crime. Standard deviation has been used so that where the data is above the red line (2 standard deviation above the mean average), it is considered exceptionally high. Where the data is below the blue line (2 standard deviation below the mean average), it is considered exceptionally low. In both cases, it can be referred to as statistically significant (high or low) and is an indication of whether the figures are exceptionally high or exceptionally low. 1.4 AIM The aim of this report is to produce accurate, timely, objective information that: Enables informed decisions to be made on the types of crime that threaten the safety
of the community. Is used to proactively manage risks to the island and ensure effective policing,
redeploying and directing resources at a strategic and tactical level, as required. Facilitates effective and open communication with our stakeholders, developing the
means to inform them of the plans, efforts and progress being made by the BPS. Provides meaningful information as one of the means of reassuring communities in
Bermuda. 1.5 SCHEDULE OF REPORTING Prior to 2016, crime statistics reports were produced every quarter and also included drug seizure information. Since 2016, Crime Statistics are produced once per year. A separate report detailing drug seizures and drug enforcement is also produced once per year.
UNCLASSIFIED
UNCLASSIFIED 3
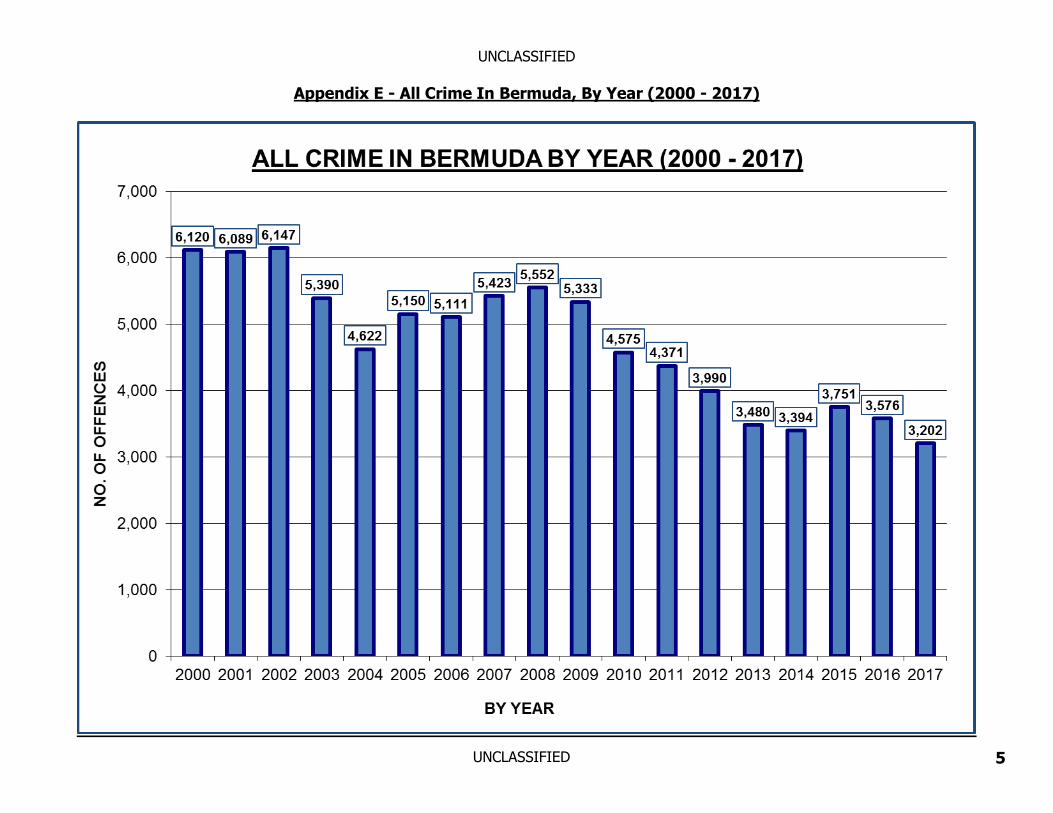
1.5 Executive Summary There were 3,202 offences recorded in Bermuda in 2017, a decrease of -374 or 10% when compared to the 3,576 offences recorded in 2016. The 3,202 offences recorded in 2017 is the lowest offence figure by year since comparable records in 2000. To give context, 6,120 offences were recorded in 2000. This is shown in Appendix A, D and E. Comparing 2017 to 2016, recorded offences decreased in Crimes Against The Person from 740 to 645 and in Crimes Against Property from 2,428 to 2,144 offences. Crimes Against The Community offences increased from 408 in 2016 to 413 in 2017. In 2017, 5 murders were recorded (Jahni OUTERBRIDGE, Raymond BUTTERFIELD, Jahcari FRANCIS, Jahkoby SMITH and Morlan STEEDE), with 3 killed by firearms and 2 killed by knives. In 2017, 6 persons were recorded as being shot and injured. A summary of the 3 key crime headings and 19 crime categories for 2017 in comparison to 2016 and the 5 year trend, is shown below in Figure 1: Figure 1: Summary Of All Crime (2017)
CRIME CATEGORY 2017 vs 2016 5 Year Trend CRIMES AGAINST THE PERSON
Murder Manslaughter Serious Assaults Other Assaults Sexual Assault Robbery Offences Against Children Indecency CRIMES AGAINST THE PERSON (Trend)
CRIMES AGAINST THE COMMUNITY Firearm Offences Other Weapon Offences Disorder Offences Anti-Social Behaviour Animal Offences CRIMES AGAINST THE COMMUNITY (Trend)
CRIMES AGAINST PROPERTY Burglary (Residential) Burglary (Non Residential) Criminal Damage Motor Vehicle Theft Theft of Property Fraud and Deception CRIMES AGAINST PROPERTY (Trend) GRAND TOTAL (ALL CRIME Trend)
Remains level Decreasing Increasing LEGEND:
UNCLASSIFIED
UNCLASSIFIED 4
2. ALL CRIME
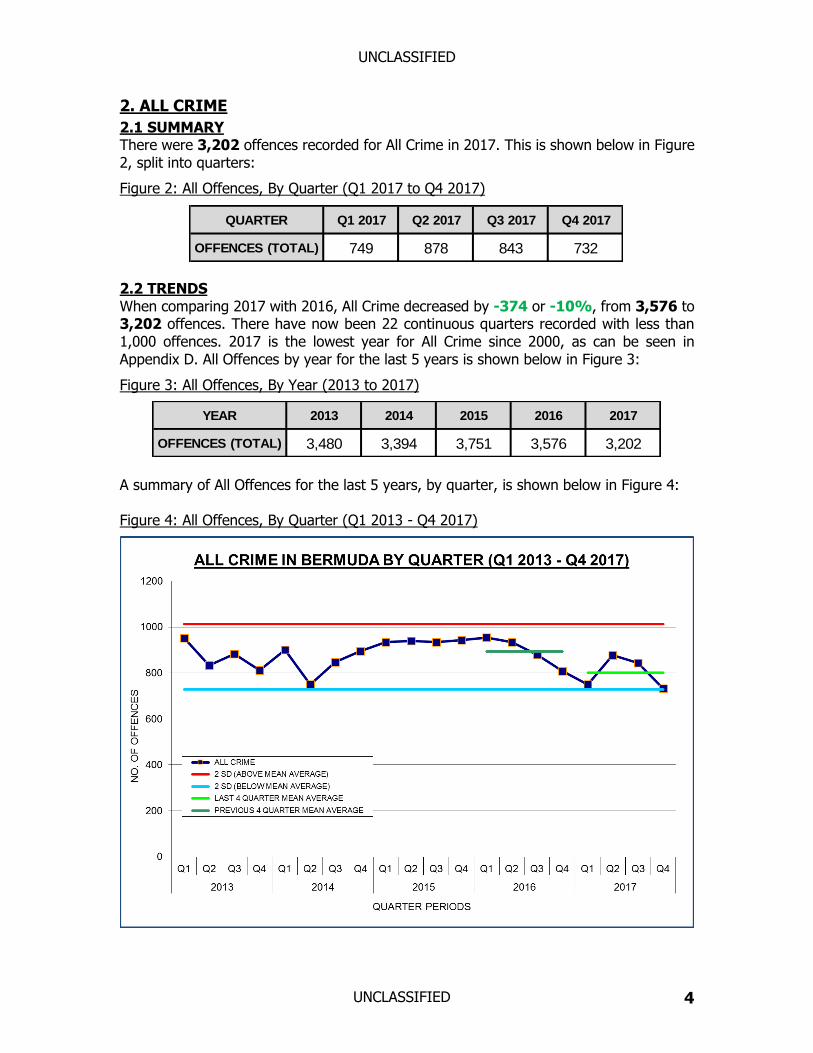
2.1 SUMMARY There were 3,202 offences recorded for All Crime in 2017. This is shown below in Figure 2, split into quarters:
Figure 2: All Offences, By Quarter (Q1 2017 to Q4 2017)
2.2 TRENDS When comparing 2017 with 2016, All Crime decreased by -374 or -10%, from 3,576 to 3,202 offences. There have now been 22 continuous quarters recorded with less than 1,000 offences. 2017 is the lowest year for All Crime since 2000, as can be seen in Appendix D. All Offences by year for the last 5 years is shown below in Figure 3:
Figure 3: All Offences, By Year (2013 to 2017)
A summary of All Offences for the last 5 years, by quarter, is shown below in Figure 4: Figure 4: All Offences, By Quarter (Q1 2013 - Q4 2017)
QUARTER Q1 2017 Q2 2017 Q3 2017 Q4 2017
OFFENCES (TOTAL) 749 878 843 732
YEAR 2013 2014 2015 2016 2017
OFFENCES (TOTAL) 3,480 3,394 3,751 3,576 3,202
UNCLASSIFIED
UNCLASSIFIED 5
3. CRIMES AGAINST THE PERSON
3.1 SUMMARY There were 645 offences recorded for Crimes Against The Person in 2017. This is shown below in Figure 5, split into quarters:
Figure 5: Crimes Against The Person (CATP), By Quarter (Q1 2017 to Q4 2017)
3.2. TRENDS When 2017 is compared to 2016, Crimes Against The Person decreased from 740 to 645 offences. Year on year decreases were recorded in Other Assaults (515 458) and Robbery (81 50). The only category that increased was Sexual Assault (40 43). Crimes Against The Person by year for the last 5 years is shown below in Figure 6:
Figure 6: All Crime, By Year (2013 to 2017)
A summary of Crimes Against The Person for the last 5 years, by quarter, is shown below in Figure 7: Figure 7: Crimes Against The Person, By Quarter (Q1 2013 - Q4 2017)
QUARTER Q1 2017 Q2 2017 Q3 2017 Q4 2017
C.A.T.P. OFFENCES 143 195 167 140
YEAR 2013 2014 2015 2016 2017
C.A.T.P. OFFENCES 615 536 709 740 645
UNCLASSIFIED
UNCLASSIFIED 6
4. FIREARM INCIDENTS Firearm Offences are included within Crimes Against The Community (Section 5); however Firearm Incidents1 may not necessarily be recorded as offences, as there may or may not be a victim and/or a suspect. 4.1 SUMMARY There were 47 Firearm Incidents recorded in 2017. This is shown below in Figure 8, split into quarters:
Figure 8: Firearm Incidents, By Quarter (Q1 2017 to Q4 2017)
4.2 FIREARM INCIDENT TRENDS Of the 47 Firearm Incidents recorded in 2017, 15 were Confirmed Firearm Incidents, 9 were Recoveries of Firearms and/or Ammunition and 23 were Unconfirmed Firearm Incidents. This can be seen below in Figure 9, showing Firearm Incidents by year for the last 5 years:
Figure 9: Firearm Incidents, By Year (2013 to 2017)
1 To enable accurate recording, analysis and reporting of firearm incidents, the BPS classifies firearm incidents into 2 categories which are split into Confirmed or Recovery Of A Firearm and Or
Ammunition. A Confirmed incident is where a person has been shot (fatally or wounded), a person has been shot at and corroboration is provided by forensic recovery of ballistic material, CCTV
footage showing a firearm, reliable witness testimony or a person is charged with a firearms offence connected to the incident, a firearm is used in the commission of a criminal act and corroboration
has been obtained, or a report of a firearm discharged and forensic material (bullet casings) have been recovered. A Recovery Of A Firearm and Or Ammunition is where a firearm, ammunition
or imitation firearm is recovered by police.
Q1 Q2 Q3 Q4
Confirmed Firearms Incident 5 5 2 3
Unconfirmed Firearms Incident 8 8 5 2
Recovery of a Firearm and or Ammunition 2 2 5 0
TOTAL 15 15 12 5
2017
2013 2014 2015 2016 2017
Confirmed Firearms Incident 22 27 12 31 15
Unconfirmed Firearms Incident 41 36 19 36 23
Recovery of a Firearm and or Ammunition 17 10 21 15 9
TOTAL 80 73 52 82 47
UNCLASSIFIED
UNCLASSIFIED 7
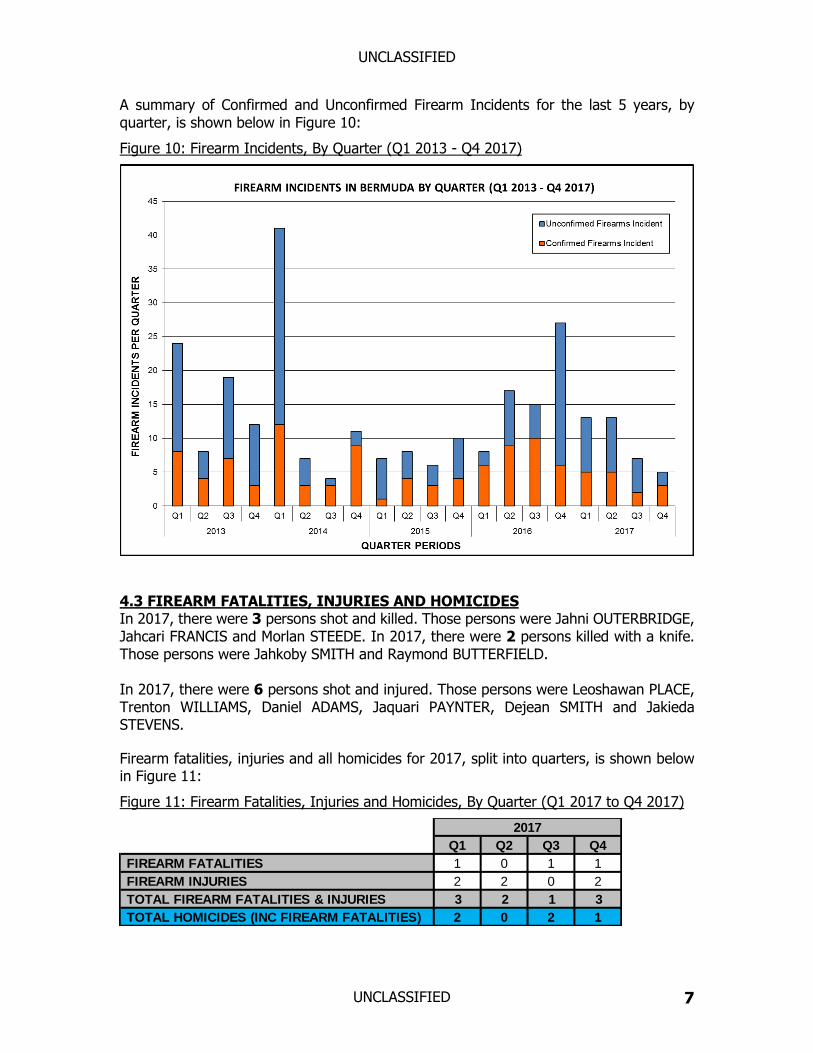
A summary of Confirmed and Unconfirmed Firearm Incidents for the last 5 years, by quarter, is shown below in Figure 10:
4.3 FIREARM FATALITIES, INJURIES AND HOMICIDES In 2017, there were 3 persons shot and killed. Those persons were Jahni OUTERBRIDGE, Jahcari FRANCIS and Morlan STEEDE. In 2017, there were 2 persons killed with a knife. Those persons were Jahkoby SMITH and Raymond BUTTERFIELD. In 2017, there were 6 persons shot and injured. Those persons were Leoshawan PLACE, Trenton WILLIAMS, Daniel ADAMS, Jaquari PAYNTER, Dejean SMITH and Jakieda STEVENS.
Firearm fatalities, injuries and all homicides for 2017, split into quarters, is shown below in Figure 11:
Figure 11: Firearm Fatalities, Injuries and Homicides, By Quarter (Q1 2017 to Q4 2017)
Q1 Q2 Q3 Q4
FIREARM FATALITIES 1 0 1 1
FIREARM INJURIES 2 2 0 2
TOTAL FIREARM FATALITIES & INJURIES 3 2 1 3
TOTAL HOMICIDES (INC FIREARM FATALITIES) 2 0 2 1
2017
UNCLASSIFIED
UNCLASSIFIED 8
4.4 FIREARM FATALITIES, INJURIES AND HOMICIDE TRENDS There were a total of 9 firearm fatalities and injuries in 2017. Figure 12 below, shows the last 5 years of firearm fatalities, injuries and all homicides by year: Figure 12: Fatalities, Injuries and Total Homicides By Year (2013 to 2017)
The same figures in Figure 12 are represented by quarter in Figure 13, to provide more insight into the last 5 years of firearm violence and homicides. A summary of firearm fatalities, injuries and all homicides for the last 5 years, by quarter, is shown below in Figure 13: Figure 13: Firearm Fatalities, Injuries And All Homicides (Q1 2013 - Q4 2017)
Of note, firearm fatalities, injuries and all homicides by year (2000 - 2017) is included in Appendix F.
2013 2014 2015 2016 2017
FIREARM FATALITIES 3 2 1 5 3
FIREARM INJURIES 5 8 5 9 6
TOTAL FIREARM FATALITIES & INJURIES 8 10 6 14 9
TOTAL HOMICIDES (INC FIREARM FATALITIES) 5 4 4 7 5
UNCLASSIFIED
UNCLASSIFIED 9
5. CRIMES AGAINST THE COMMUNITY
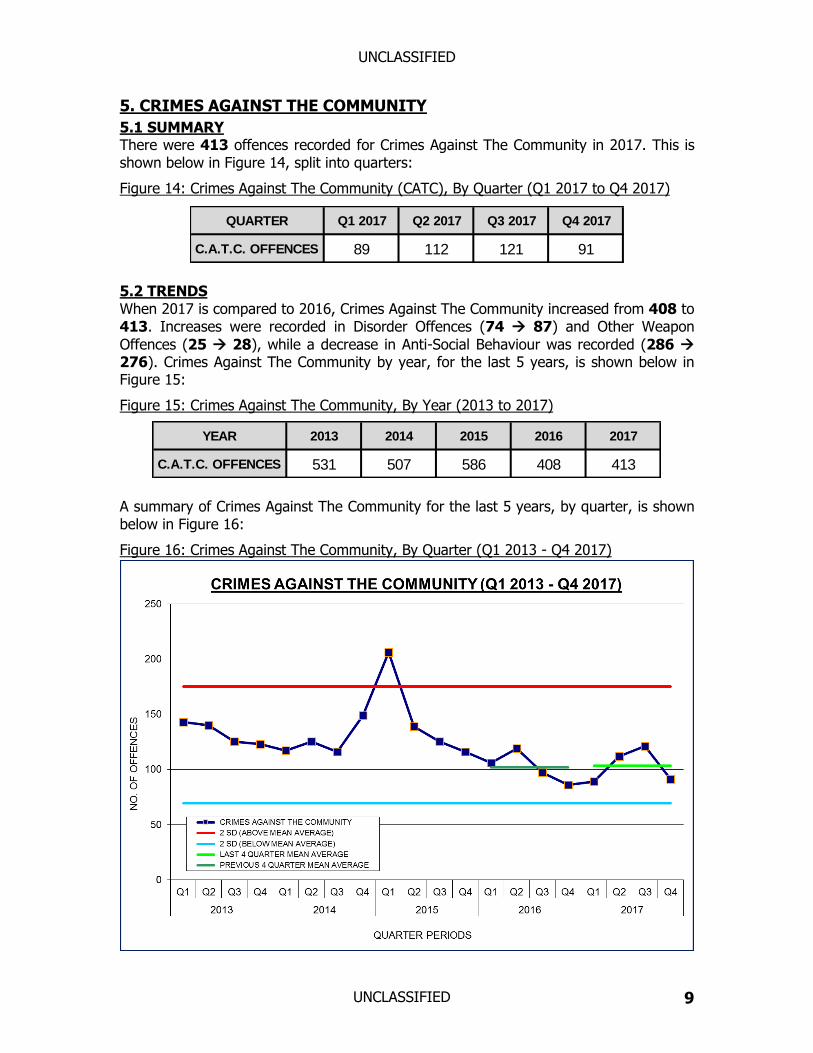
5.1 SUMMARY There were 413 offences recorded for Crimes Against The Community in 2017. This is shown below in Figure 14, split into quarters:
Figure 14: Crimes Against The Community (CATC), By Quarter (Q1 2017 to Q4 2017)
5.2 TRENDS When 2017 is compared to 2016, Crimes Against The Community increased from 408 to 413. Increases were recorded in Disorder Offences (74 87) and Other Weapon
Offences (25 28), while a decrease in Anti-Social Behaviour was recorded (286 276). Crimes Against The Community by year, for the last 5 years, is shown below in Figure 15:
Figure 15: Crimes Against The Community, By Year (2013 to 2017)
A summary of Crimes Against The Community for the last 5 years, by quarter, is shown below in Figure 16:
Figure 16: Crimes Against The Community, By Quarter (Q1 2013 - Q4 2017)
QUARTER Q1 2017 Q2 2017 Q3 2017 Q4 2017
C.A.T.C. OFFENCES 89 112 121 91
YEAR 2013 2014 2015 2016 2017
C.A.T.C. OFFENCES 531 507 586 408 413
UNCLASSIFIED
UNCLASSIFIED 10
6. CRIMES AGAINST PROPERTY
6.1. SUMMARY There were 2,144 offences recorded for Crimes Against Property in 2017. This is shown below in Figure 17, split into quarters:
Figure 17: Crimes Against Property (CAP), By Quarter (Q1 2017 to Q4 2017)
6.2 TRENDS When 2017 is compared to 2016, Crimes Against Property has decreased from 2,428 to 2,144. Crimes Against Property accounts for 2/3rds of All Crime and so decreases in Burglary Residential (551 435) and Motor Vehicle Theft (770 546) had a direct impact on the trend for All Crime. Crimes Against Property, by year for the last 5 years, is shown below in Figure 18:
Figure 18: Crimes Against Property, By Year (2013 to 2017)
A summary of Crimes Against Property for the last 5 years, by quarter, is shown below in Figure 19:
Figure 19: Crimes Against Property, By Quarter (Q1 2013 - Q4 2017)
QUARTER Q1 2017 Q2 2017 Q3 2017 Q4 2017
C.A.P. OFFENCES 517 571 555 501
YEAR 2013 2014 2015 2016 2017
C.A.P. OFFENCES 2,334 2,351 2,456 2,428 2,144
UNCLASSIFIED
UNCLASSIFIED 11
7. ROAD TRAFFIC COLLISIONS
7.1 SUMMARY There were 1,244 Road Traffic Collisions (RTCs) recorded in 2017. This is shown below in Figure 20, split into quarters:
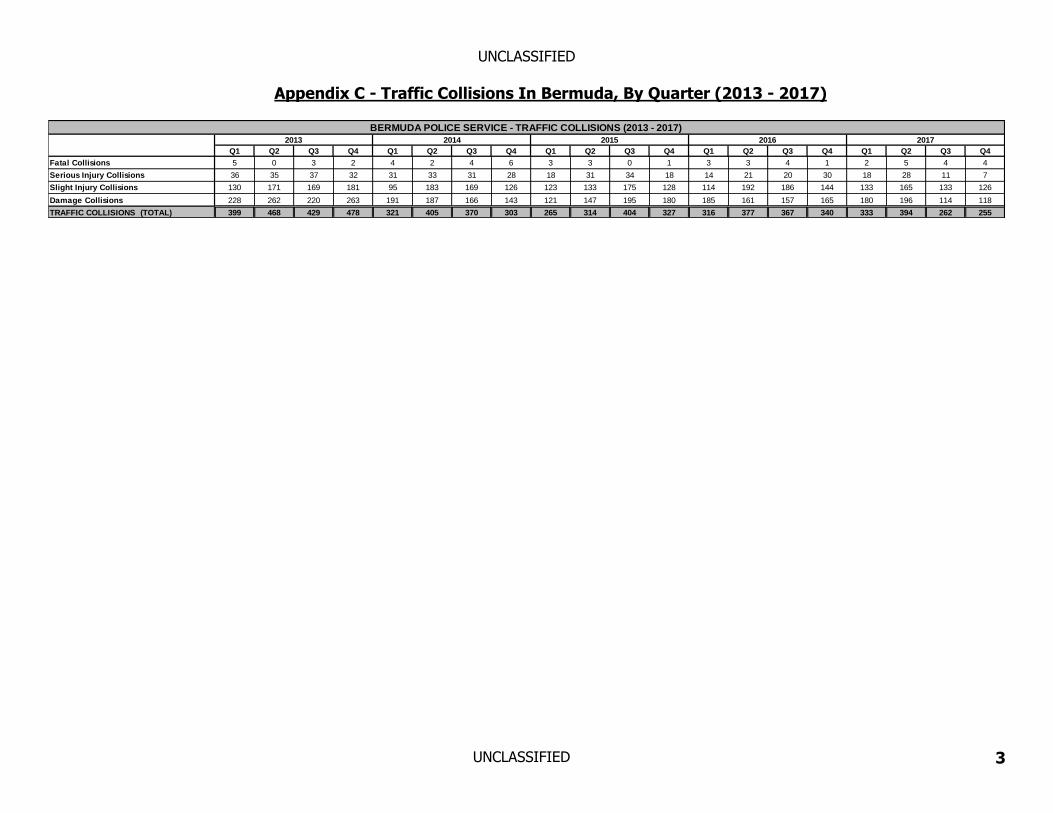
7.2 TRENDS RTCs have decreased from 1,400 in 2016 to 1,244 in 2017, in line with the long term trend. This can be seen in Appendix C. The average RTCs per quarter for the 5 year period 2013 - 2017 was 356, compared to 534 for the period 2008 - 2012. On average on Bermuda’s roads; 1 person dies every 24 days, 1 person is severely injured every 6 days and 1 person is slightly injured every 16 hours. In addition, there is 1 damage only collision that the police were notified of every 14 hours. RTCs by year for the last 5 years, are shown below in Figure 21:
Figure 21: Traffic Collisions, By Year (2013 - 2017)
A summary of RTCs for the last 5 years, by quarter, is shown below in Figure 22:
8.1 SUMMARY There were 10,717 Traffic Tickets issued in 2017. Traffic Tickets are split into 2 categories of Moving Violation Tickets (MVT) and Motorist Advice Notices (MAN). Traffic Tickets issued in 2017 are shown below in Figure 23, split into quarters:
Figure 23: Traffic Tickets, By Quarter (Q1 2017 to Q4 2017)
8.2 TRENDS Traffic Tickets remained consistent at 1,000 per month during 2015 and 2016, however a -10% decrease in MVTs and -32% decrease in MANs occurred in 2017. This can be seen in Appendix B. Traffic Tickets by year, from 2015 to 2017, is shown below in Figure 24:
Figure 24: Traffic Tickets, By Year (2015 to 2017)
A summary of Traffic Tickets from 2015 to 2017, by quarter, is shown in Figure 25:
2 Traffic Enforcement Activity recording has been amended in this report to reflect Traffic Tickets issued by officers (and Reserve Officers), split into 2 categories of (1) MVTs (Moving Violation Tickets), that result in a fine or a court appearance or (2) MANs (Motorist Advice Notices), where the motorist has been warned about their driving and a record is kept of this warning. Parking Tickets issued by a Police Officer and or a Reserve Officer (note tickets from Traffic Wardens are not included), and Marine Tickets, which are similar to MVTs except they are used for Marine related offences, are included in the total for MVTs. Traffic Tickets reflect the strategic priority of the BPS in road safety and are a reflection of officer activity. MVT, MAN, Parking and Marine records are only available from Q1 2015.
QUARTER Q1 2017 Q2 2017 Q3 2017 Q4 2017
MVT 2,183 2,207 2,014 1,809
MAN 673 710 521 600
TOTAL 2,856 2,917 2,535 2,409
YEAR 2015 2016 2017
MVT 9,234 8,748 8,213
MAN 3,454 3,692 2,504
TOTAL 12,688 12,440 10,717
UNCLASSIFIED
UNCLASSIFIED 13
9. CALLS FOR SERVICE3
9.1 SUMMARY There were 22,263 Calls For Service in 2017. This is shown below in Figure 26, split into quarters:
Figure 26: Calls For Service, By Quarters (Q1 2017 to Q4 2017)
9.2 TRENDS When 2017 is compared to 2016, Calls For Service decreased from 22,591 to 22,263. Calls For Service averaged 5,651 per quarter between 2013 and 2017, with the average Calls For Service per quarter in 2017 at 5,566. Calls For Service, by year for the last 5 years, is shown below in Figure 27:
Figure 27: Calls For Service, By Year (2013 to 2017)
A summary of Calls For Service for the last 5 years, by quarter, is shown below in Figure 28:
Figure 28: Calls For Service, By Quarters (Q1 2013 - Q4 2017)
3 Calls For Service refers to all Police activity recorded through the Police 911 call handling process.
QUARTER Q1 2017 Q2 2017 Q3 2017 Q4 2017
CALLS FOR
SERVICE5,199 5,943 5,909 5,212
YEAR 2013 2014 2015 2016 2017
CALLS FOR
SERVICE27,216 21,029 19,925 22,591 22,263
UNCLASSIFIED
UNCLASSIFIED 14
10. ARRESTS - ALL OFFENCES4
10.1 SUMMARY There were 2,442 arrests recorded in 2017. This is shown below in Figure 29, split into quarters: Figure 29: Arrests, By Quarter (Q1 2017 to Q4 2017)
10.2 TRENDS The 2,442 arrests in 2017 represents the lowest yearly total since available comparative records in 2008. The 2017 total is less than half of the highest year (2010 with 5,082 arrests). Arrests by year, for the last 5 years, is shown below in Figure 30:
Figure 30: Arrests, By Year (2013 to 2017)
A summary of arrests for the last 5 years, by quarter, is shown below in Figure 31:
Figure 31: Arrests, By Quarter (Q1 2013 - Q4 2017)
4 Arrests refer to those persons arrested and brought into police custody.
QUARTER Q1 2017 Q2 2017 Q3 2017 Q4 2017
ARRESTS 512 641 699 590
YEAR 2013 2014 2015 2016 2017
ARRESTS 2,710 2,456 2,651 2,526 2,442
UNCLASSIFIED
UNCLASSIFIED 15
10.3 GENDER In 2017, there were 2,016 males and 426 females arrested. A breakdown of persons arrested by their gender in 2017, split into quarters, can be seen below in Figure 32: Figure 32: Arrests By Gender, By Quarter (2017)
10.4 AGE The largest age group of persons arrested in 2017 were between the ages of 26 - 35 years, followed closely by the 18 - 25 year group. Together, these 2 age groups accounted for 54% of all arrests. A breakdown of persons arrested by their age group in 2017, split into quarters, can be seen below in Figure 33:
Figure 33: Arrests By Age Group, By Quarter (2017)
10.5 ETHNICITY The largest ethnic group of persons arrested in 2017 were black. A breakdown of persons arrested by their ethnicity in 2017, split into quarters, can be seen below in Figure 34:
Figure 34: Arrests By Ethnicity, By Quarter (2017)
Gender Q1 Q2 Q3 Q4 Total
Male 426 528 590 472 2,016
Female 86 113 109 118 426
Total 512 641 699 590 2,442
2017 - Arrests By Gender
Age Group Q1 Q2 Q3 Q4 Total
Under 18 Years 28 24 38 23 113
18 - 25 Years 128 160 219 154 661
26 - 35 Years 137 171 187 173 668
36 - 45 Years 87 109 102 108 406
46 - 55 Years 82 95 83 82 342
Over 55 Years 50 82 70 50 252
Total 512 641 699 590 2,442
2017 - Arrests By Age
Ethnicity Q1 Q2 Q3 Q4 Total
Black 447 546 609 495 2,097
White 43 66 60 51 220
Black & Other 6 5 1 10 22
White & Other 2 3 5 11 21
Black & White 7 2 4 3 16
Asian 1 3 3 2 9
Other 6 16 17 18 57
Total 512 641 699 590 2,442
2017 - Arrests By Ethnicity
UNCLASSIFIED
UNCLASSIFIED 16
10.6 NATIONALITY The 2,442 arrests in 2017 involved 45 different nationalities. A breakdown of persons arrested by their nationality in 2017, split into quarters, can be seen below in Figure 355:
Figure 35: Arrests By Nationality, By Quarter (2017)
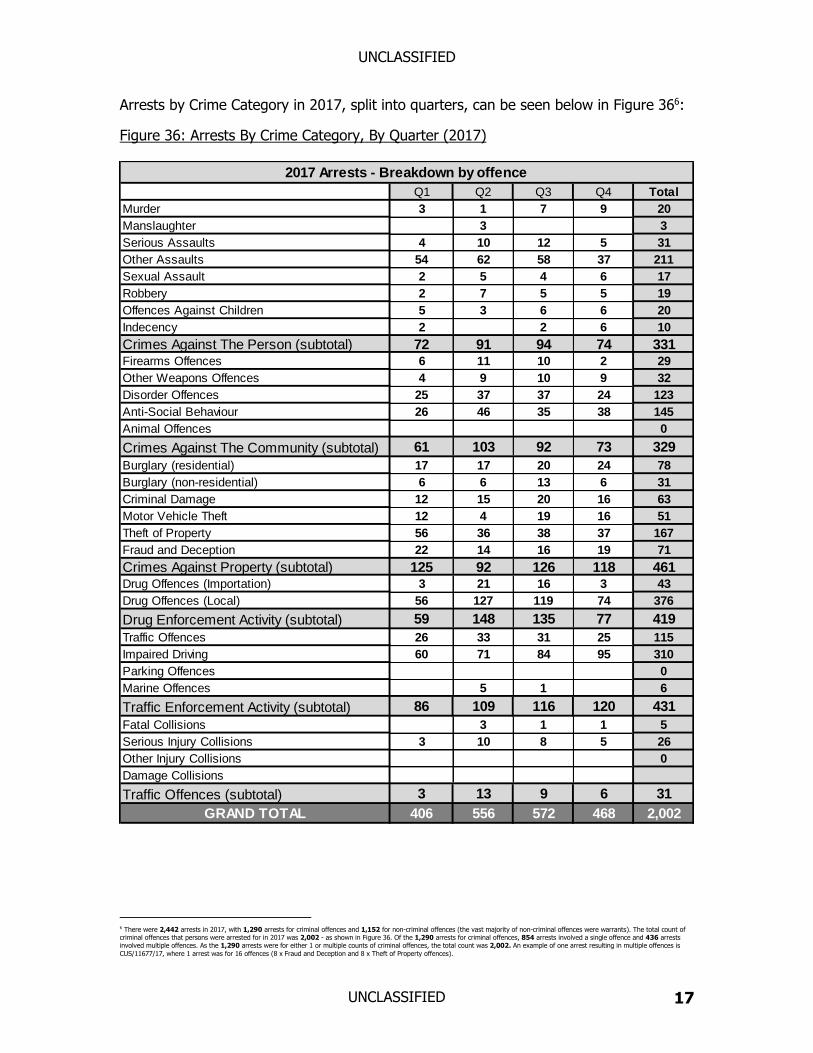
10.7 TYPE OF ARREST In 2017, there were 331 arrests for Crimes Against The Person, 329 arrests for Crimes Against The Community and 461 arrests for Crimes Against Property. There were 419 arrests for Drug Enforcement. There were 431 arrests for Traffic Enforcement, including 310 for Impaired Driving. An additional 5 arrests were made for fatal collisions and 26 arrests for serious injury collisions.
5 Note: Those nationalities with 2 or more arrests have been included in Figure 35, while nationalities with only 1 arrest are represented in the OTHER category.
Nationality Q1 Q2 Q3 Q4 Total
Bermudian (British) 470 585 622 536 2,213
American 10 18 32 8 68
Jamaican 8 12 8 8 36
Portuguese 4 5 7 9 25
British 4 4 9 6 23
Filipino 3 2 3 4 12
Canadian 2 1 2 4 9
Dominican 1 3 4
Irish 2 2 4
Brazilian 2 2 4
French 1 1 2
Bulgarian 2 2
Romanian 2 2
Trinidadian 2 2
Kenyan 2 2
Polish 1 1 2
Indian 1 1 2
Czech 1 1 2
Kittian and Nevisian 1 1 2
OTHER 3 8 7 8 26
Total 512 641 699 590 2,442
2017 - Arrests By Nationality
UNCLASSIFIED
UNCLASSIFIED 17
Arrests by Crime Category in 2017, split into quarters, can be seen below in Figure 366:
Figure 36: Arrests By Crime Category, By Quarter (2017)
6 There were 2,442 arrests in 2017, with 1,290 arrests for criminal offences and 1,152 for non-criminal offences (the vast majority of non-criminal offences were warrants). The total count of criminal offences that persons were arrested for in 2017 was 2,002 - as shown in Figure 36. Of the 1,290 arrests for criminal offences, 854 arrests involved a single offence and 436 arrests involved multiple offences. As the 1,290 arrests were for either 1 or multiple counts of criminal offences, the total count was 2,002. An example of one arrest resulting in multiple offences is CUS/11677/17, where 1 arrest was for 16 offences (8 x Fraud and Deception and 8 x Theft of Property offences).
Q1 Q2 Q3 Q4 Total
Murder 3 1 7 9 20
Manslaughter 3 3
Serious Assaults 4 10 12 5 31
Other Assaults 54 62 58 37 211
Sexual Assault 2 5 4 6 17
Robbery 2 7 5 5 19
Offences Against Children 5 3 6 6 20
Indecency 2 2 6 10
Crimes Against The Person (subtotal) 72 91 94 74 331Firearms Offences 6 11 10 2 29
Other Weapons Offences 4 9 10 9 32
Disorder Offences 25 37 37 24 123
Anti-Social Behaviour 26 46 35 38 145
Animal Offences 0
Crimes Against The Community (subtotal) 61 103 92 73 329
11. STOP AND SEARCH7 11.1 SUMMARY There were 1,593 stop and searches recorded in 2017. This is shown below in Figure 37, split into quarters:
Figure 37: Stop and Search, By Quarter (Q1 2017 to Q4 2017)
11.2 TRENDS The use of stop and searches has fluctuated since their introduction in 2008, with over 6,000 recorded per quarter at their peak in 2011. As is evident from Figure 38 and Figure 39 (both below), the 2017 quarterly average is 400 stop and searches. Stop and search totals by year, for the last 5 years, is shown below in Figure 38:
Figure 38: Stop and Search, By Year (2013 to 2017)
Stop and Searches for the last 5 years, by quarter, is shown below in Figure 39:
Figure 39: Stop and Search, By Quarter (Q1 2013 - Q4 2017)
QUARTER Q1 2017 Q2 2017 Q3 2017 Q4 2017
S&S 134 385 615 459
YEAR 2013 2014 2015 2016 2017
S&S 3,133 1,208 885 1,123 1,593
NB. The Lower Standard Deviation is shown as 0 instead of a minus figure.
7 Stop and Search are conducted in a proportionate and accountable manner and only when Police Officers have occasion to exercise lawful powers. They are carried out with courtesy, consideration and respect for the individual being stopped. While the figures are not performance indicators, they are a reflection of the frequency of engagement between proactive Police Officers and Prolific Priority Offenders. They provide an indication of police activity, particularly regarding the number of highly visible patrols in the community.
UNCLASSIFIED
UNCLASSIFIED 19
12. PROCEEDS OF CRIME ACT (POCA) SEIZURES
12.1 SUMMARY POCA seizures totalled $581,895 in 2017. This is shown below in Figure 40:
Figure 40: POCA Seizures, By Quarter (Q1 2017 to Q4 2017)
POCA Seizures totals by year, for the last 5 years, is shown below in Figure 41:
Figure 41: POCA Seizures, By Year (2013 to 2017)
POCA seizures for the last 5 years, by quarter, is shown below in Figure 42: