29
2017 Denver Gold Forum Victor Gobitz - CEO September, 2017
2017 Denver Gold ForumVictor Gobitz - CEO
September, 2017
Cautionary Statement
2
This presentation contains certain information that may constitute forward-looking information under applicable U.S.securities legislation, including but not limited to information about costs applicable to sales, general andadministrative expenses; production volumes; current expectations on the timing, extent and success of exploration;development and metallurgical sampling activities, the timing and success of mining operations and the optimizationof mine plans. This forward-looking information entails various risks and uncertainties that are based on currentexpectations, and actual results may differ materially from those contained within said information. Theseuncertainties and risks include, but are not limited to, the strength of the global economy, the price of commodities;operational, funding and liquidity risks; the degree to which mineral resource estimates are reflective of actualmineral resources; the degree to which factors which would make a mineral deposit commercially viable are present,and other risks and hazards associated with mining operations. Risks and uncertainties about the Company’s businessare more fully discussed in the BVN’s form 20-F filed with the Securities and Exchange Commission in the U.S. andavailable at www.sec.gov . Readers are urged to read these materials. Buenaventura assumes no obligation to updateany forward-looking information or to update the reasons why actual results could differ from such information unlessrequired by law.
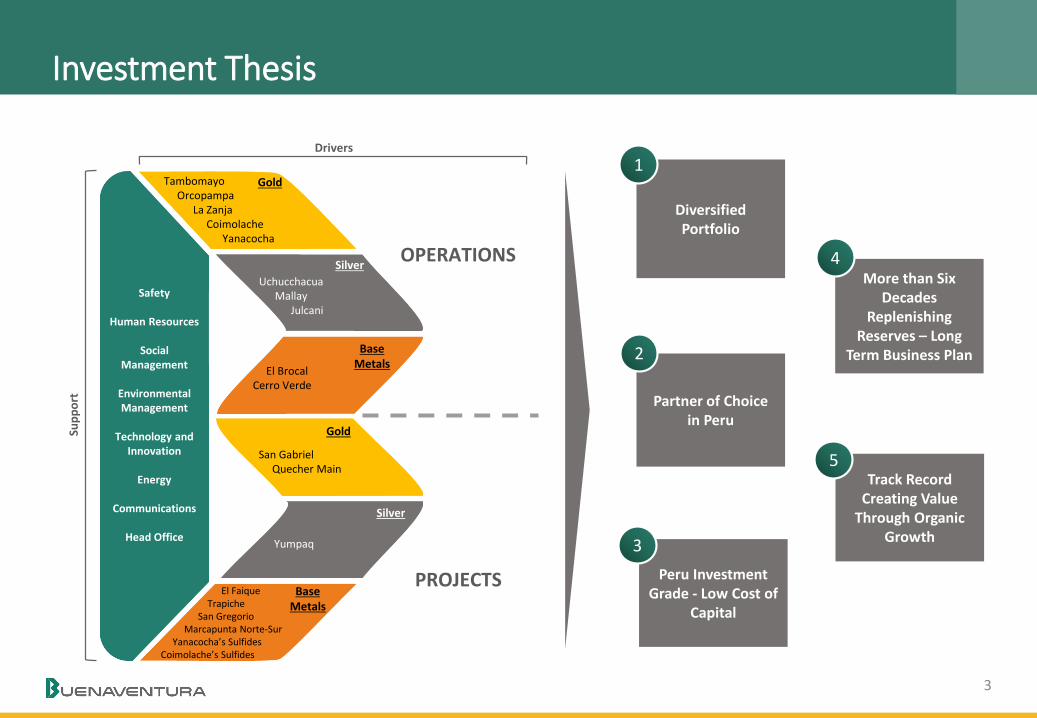
Investment ThesisSu
pp
ort
OPERATIONS
PROJECTS
Drivers
Safety
Human Resources
Social Management
Environmental Management
Technology and Innovation
Energy
Communications
Head Office
TambomayoOrcopampa
La ZanjaCoimolache
Yanacocha
Gold
Base Metals
Silver
Gold
Silver
Base Metals
UchucchacuaMallay
Julcani
San GabrielQuecher Main
Yumpaq
El Faique Trapiche
San GregorioMarcapunta Norte-Sur
Yanacocha’s SulfidesCoimolache’s Sulfides
El BrocalCerro Verde
Diversified Portfolio
More than Six Decades
Replenishing Reserves – Long
Term Business Plan
Partner of Choice in Peru
Track Record Creating Value
Through Organic Growth
1
4
2
5
3
Peru Investment Grade - Low Cost of
Capital
3
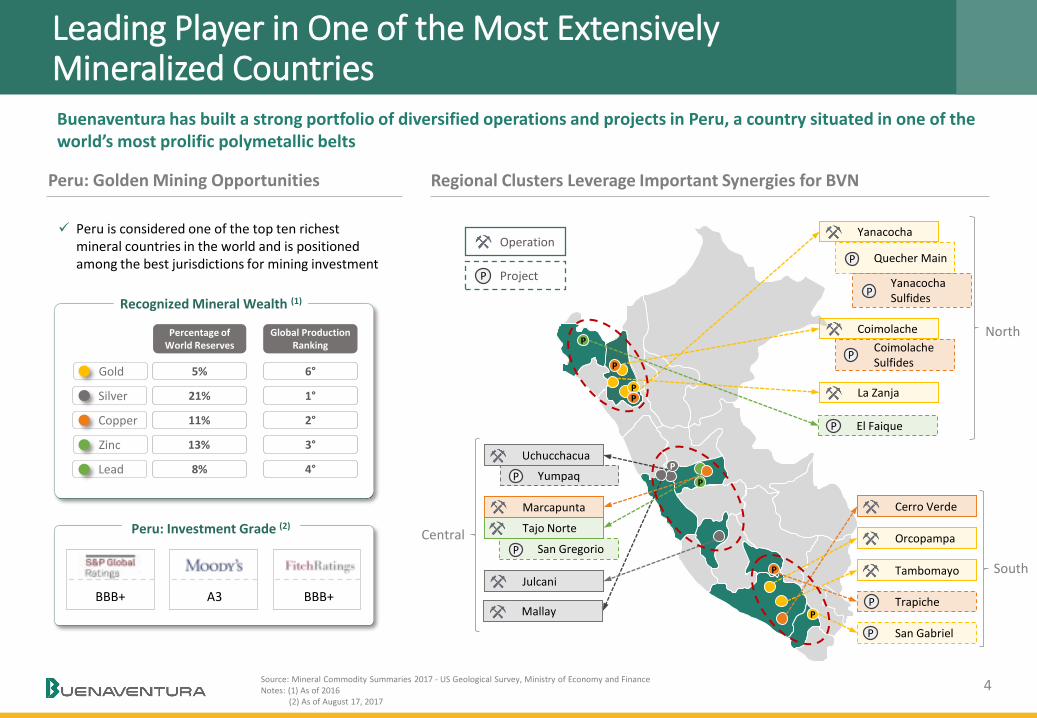
Leading Player in One of the Most Extensively Mineralized Countries
Regional Clusters Leverage Important Synergies for BVNPeru: Golden Mining Opportunities
Source: Mineral Commodity Summaries 2017 - US Geological Survey, Ministry of Economy and FinanceNotes: (1) As of 2016
(2) As of August 17, 2017
Peru is considered one of the top ten richest mineral countries in the world and is positioned among the best jurisdictions for mining investment
Recognized Mineral Wealth (1)
Percentage of World Reserves
Global ProductionRanking
5% 6°
21% 1°
11% 2°
13% 3°
Gold
8% 4°
Silver
Copper
Zinc
Lead
Peru: Investment Grade (2)
BBB+ A3 BBB+
CoimolacheSulfidesP
La Zanja
Yanacocha
P
Quecher Main
PYumpaq
Mallay
Uchucchacua
Julcani
P
Orcopampa
Tambomayo
San Gabriel
Cerro Verde
P
El Faique
P
Trapiche
San Gregorio
Tajo Norte
P
Marcapunta
P
YanacochaSulfides
4
Buenaventura has built a strong portfolio of diversified operations and projects in Peru, a country situated in one of the world’s most prolific polymetallic belts
Coimolache North
Central
South
P
P
P
P
P
P
P
P
ProjectP
Operation
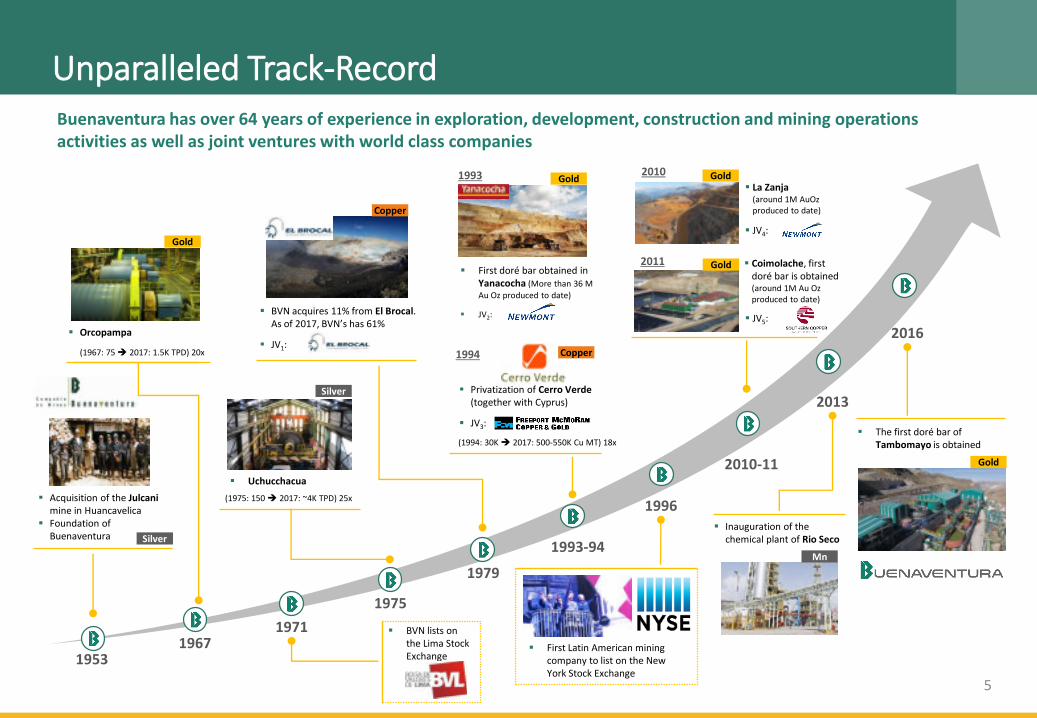
Orcopampa
(1967: 75 2017: 1.5K TPD) 20x
Unparalleled Track-RecordBuenaventura has over 64 years of experience in exploration, development, construction and mining operations activities as well as joint ventures with world class companies
Acquisition of the Julcanimine in Huancavelica
Foundation of Buenaventura
19671971
Uchucchacua
First doré bar obtained in Yanacocha (More than 36 M
Au Oz produced to date)
JV2:
1993-94
Privatization of Cerro Verde(together with Cyprus)
JV3:
1996
La Zanja(around 1M AuOzproduced to date)
JV4:
Coimolache, first doré bar is obtained (around 1M Au Oz produced to date)
2010-11
2013
Inauguration of the chemical plant of Rio Seco
The first doré bar of Tambomayo is obtained
2016
5
Gold
Gold Gold
Silver
(1975: 150 2017: ~4K TPD) 25x
Mn
Gold
JV5:
Gold
Copper
1975
BVN acquires 11% from El Brocal. As of 2017, BVN’s has 61%
JV1:
Silver
Copper
First Latin American mining company to list on the New York Stock Exchange
BVN lists on the Lima Stock Exchange
1979
1953
(1994: 30K 2017: 500-550K Cu MT) 18x
1994
1993 2010
2011
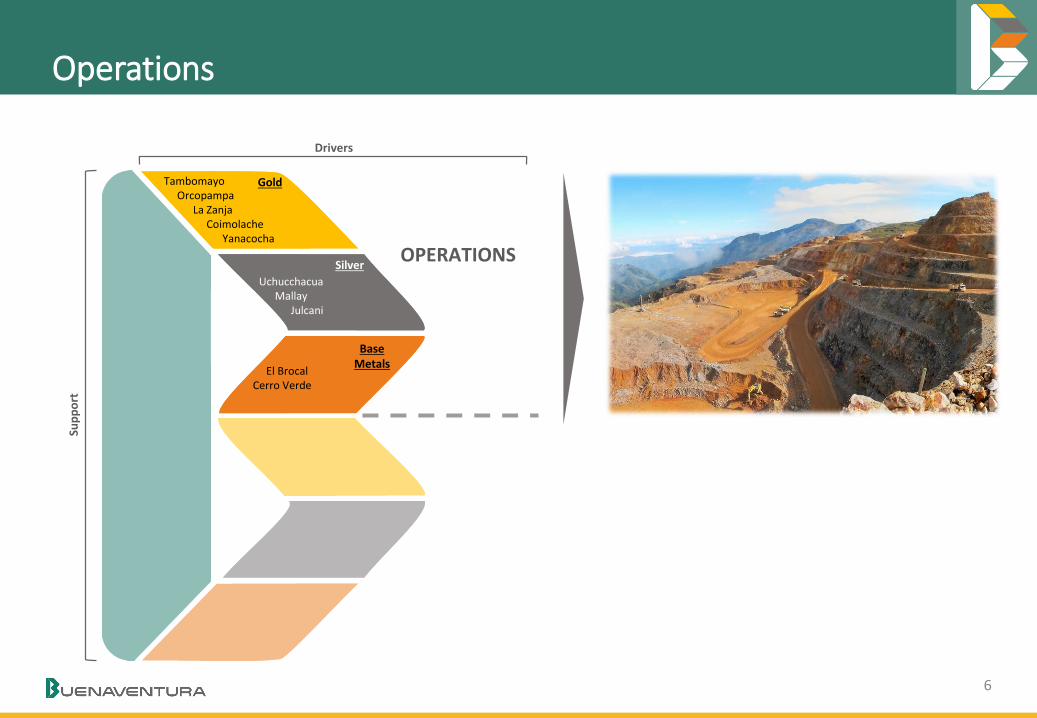
OperationsSu
pp
ort
OPERATIONS
Drivers
TambomayoOrcopampa
La ZanjaCoimolache
Yanacocha
Gold
Base Metals
Silver
UchucchacuaMallay
Julcani
El BrocalCerro Verde
6
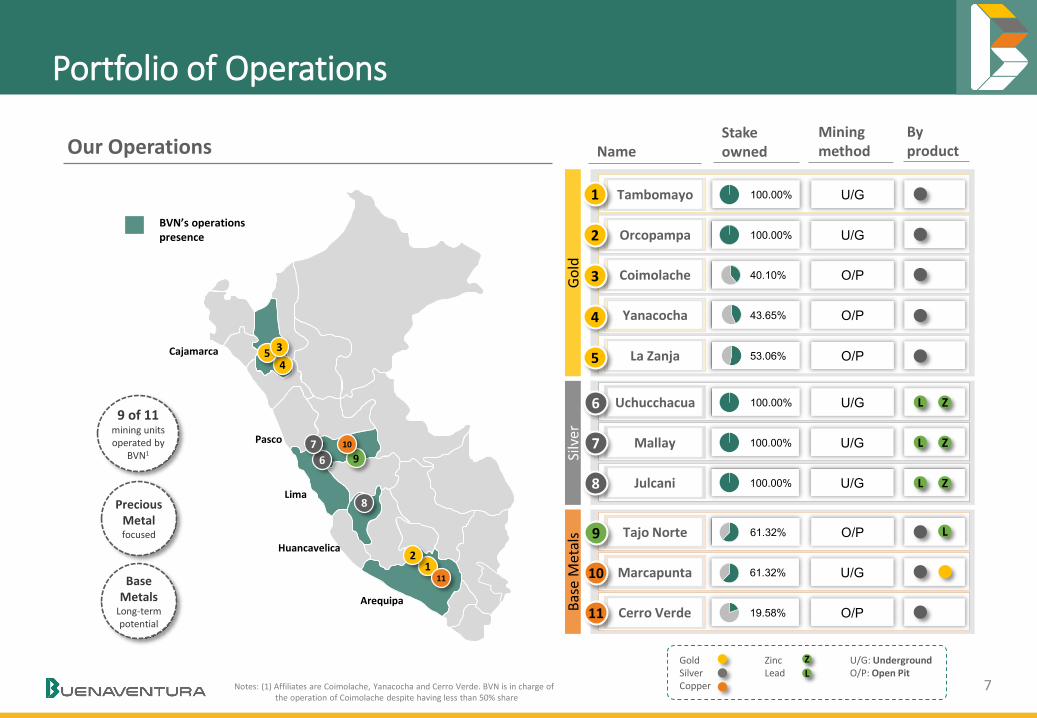
Portfolio of Operations
Go
ldB
ase
Met
als
Silv
er
Tambomayo 100.00% U/G
Orcopampa 100.00% U/G
Coimolache 40.10% O/P
Yanacocha 43.65% O/P
La Zanja 53.06% O/P
Uchucchacua 100.00% U/G
Mallay 100.00% U/G
Julcani 100.00% U/G
Tajo Norte 61.32% O/P
Marcapunta 61.32% U/G
Cerro Verde 19.58% O/P
1
2
3
4
5
6
7
8
9
10
11
Our OperationsMining method
Stake owned Name
By product
9 of 11mining units operated by
BVN1
Precious Metal focused
Base Metals
Long-term potential
111
2
8
6
79
10
45
3
Arequipa
Lima
Huancavelica
Pasco
Cajamarca
Notes: (1) Affiliates are Coimolache, Yanacocha and Cerro Verde. BVN is in charge of the operation of Coimolache despite having less than 50% share
7
L
L
L
GoldSilverCopper
ZincLead
U/G: UndergroundO/P: Open Pit
Z
L
Z
Z
Z
L
BVN’s operationspresence
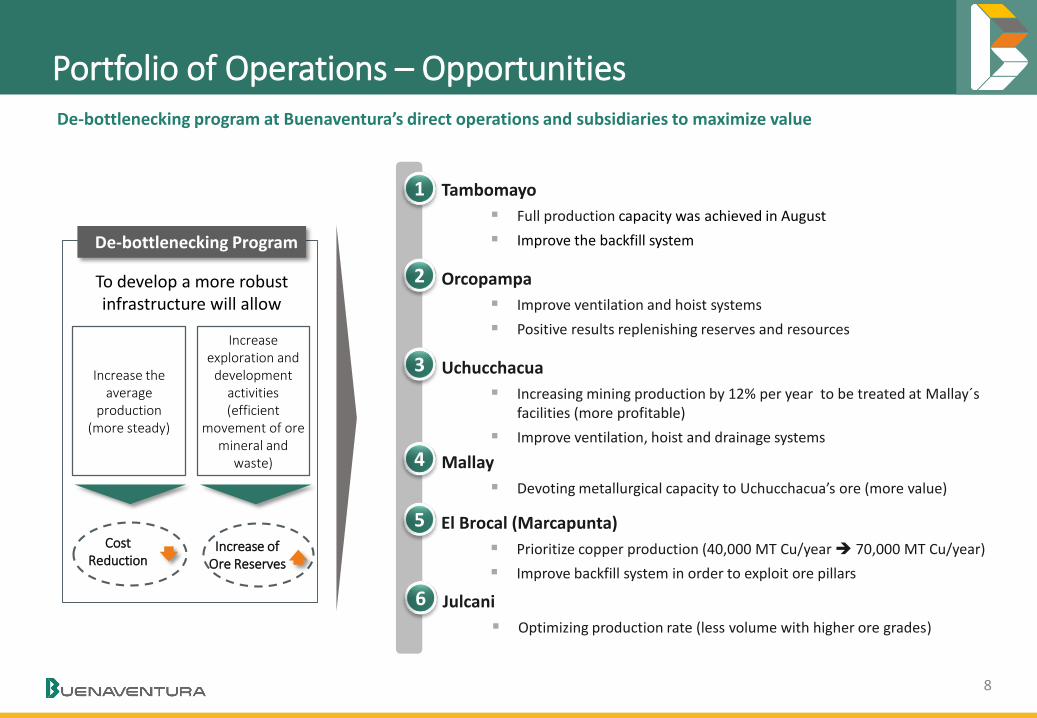
Portfolio of Operations – Opportunities De-bottlenecking program at Buenaventura’s direct operations and subsidiaries to maximize value
1 Tambomayo
Full production capacity was achieved in August
Improve the backfill system
2 Orcopampa
Improve ventilation and hoist systems
Positive results replenishing reserves and resources
3 Uchucchacua
Increasing mining production by 12% per year to be treated at Mallay´sfacilities (more profitable)
Improve ventilation, hoist and drainage systems
4 Mallay
Devoting metallurgical capacity to Uchucchacua’s ore (more value)
6 Julcani
Optimizing production rate (less volume with higher ore grades)
5 El Brocal (Marcapunta)
Prioritize copper production (40,000 MT Cu/year 70,000 MT Cu/year)
Improve backfill system in order to exploit ore pillars
8
CostReduction
De-bottlenecking Program
Increase the average
production(more steady)
Increase exploration and
development activities(efficient
movement of ore mineral and
waste)
To develop a more robustinfrastructure will allow
Increase of Ore Reserves
9
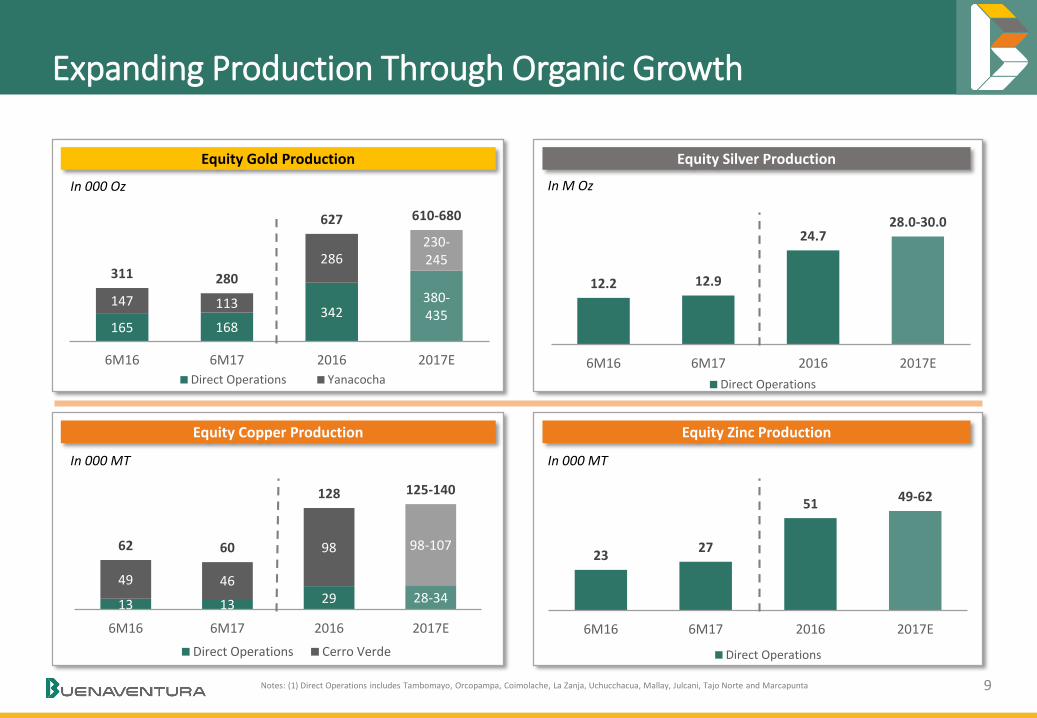
Expanding Production Through Organic Growth
Equity Gold Production Equity Silver Production
Equity Copper Production Equity Zinc Production
In 000 Oz In M Oz
In 000 MT In 000 MT
165 168342
380-435
147 113
286230-245
311 280
627 610-680
6M16 6M17 2016 2017E
Direct Operations Yanacocha
12.2 12.9
24.728.0-30.0
6M16 6M17 2016 2017E
Direct Operations
13 13 29 28-3449 46
98 98-10762 60
128 125-140
6M16 6M17 2016 2017E
Direct Operations Cerro Verde
2327
51 49-62
6M16 6M17 2016 2017E
Direct Operations
Notes: (1) Direct Operations includes Tambomayo, Orcopampa, Coimolache, La Zanja, Uchucchacua, Mallay, Julcani, Tajo Norte and Marcapunta

Operations Highlights:Tambomayo
Operation Overview
The newest BVN´s gold mine. Successful ramp-up and full capacity achieved in August 2017
2017 Au guidance: 60k – 90k
Full year production guidance will be:o Au: 120k – 150ko Ag: 3 M – 4 M
Lower cost expected after fine tuning operation
Full plant capacity of 1,500 MTD achieved in August 2017
2017 Exploration Programo Drift/Tunnels: 2,089mo Diamond drilling: 16,362m
General Information
Notes: (1) As of December 31, 2016(2) Resources includes measured and indicated
12
60-90
120-150
6M17 2017E FY Guidance
Production
CAS
Costs
Gold(K Au Oz)
(US$/Au Oz)
Key Points Location
• Plant capacity: 1,500 MTD
• Products: - Doré bars- Ag/Pb concentrate- Ag/Zn concentrate
• Location: Arequipa
• 4,800 MASL
Highlights Improvement Program
10
(U/G – 100%)
328597
238
141566738
(3.8 yr) (4.9 yr)
2015 2016
Reserves Resources (LOM)
(K Au Oz)
Reserves, Resources and LOM(1) (2)
Operating Results
Costs:
o Optimization of mining productivity: up to 10% savings in mining contract costs
o Improve the backfill to get a more efficient mining cycle
Production:
o Fine tuning processing plant in order to improve recovery rate
o Increase mine development
723 680-720
300-400
6M17 2017E FY Guidance

Operations Highlights:TambomayoImprove of the backfill system to reduce mining cycle-time and increase productivity
11
(U/G – 100%)
Backfill Circuit
Plan VIew Fill Raise
Mine entrance(pilot)
Fill Raise
Sub Level
Nv 4748
Nv 4797
Nv 4650
Nv 4698
Nv 4846
RP_100
BP-978 E
BP-500 E
BP-200 E
Concrete Plant
Cross SectionPlan View
Backfill (waste rock + concrete)
Truck transportation More expensive Slower activity
TODAY
Backfill (tailing + cement)
Pipeline transportation Less expensiveo Lower filteringo Lower consumption of
cyanide Faster activity
AFTER IMPROVEMENTS

Operations Highlights:Orcopampa
Operation Overview
Extending LOM through exploration (Pucará area)
Operating Results
Increase of the annual production guidance:
o 180k – 190k 190k – 200k
Expected cost improvement in 2H17 due to higher ore grades and lower cost coming from Pucara and Pucarina areas
2017 Exploration Program:o Drift/Tunnels: 6,445mo Diamond drilling: 35,661m
General Information
Notes: (1) As of December 31, 2016(2) Resources includes measured and indicated
92 89
191190-200
6M16 6M17 2016 2017E
695774
704680-720
6M16 6M17 2016 2017E
Production
CAS
Costs
Gold(K Au Oz)
(US$/Au Oz)
Location
308 361
136154
444515
(2.2 yr) (2.5 yr)
2015 2016
Reserves Resources (LOM)
(K Au Oz)
Reserves, Resources and LOM(1) (2)
Highlights Improvement Program
Cost reduction:
o Optimization of mining contracts: up to 10% savings in mining contract costs
o Expansion of the mine shaft (civil works started on Mar-17) - Hoist system improvement
o Expansion of the ventilation system
Key Points
• Plant capacity: 1,500 TPD
• Product: Doré bars
• Production initiated in 1967: more than 4.8M Au Oz and more than 73.8M Ag Oz were produced to date
12
• Location: Arequipa
• 3,800 MASL
(U/G – 100%)
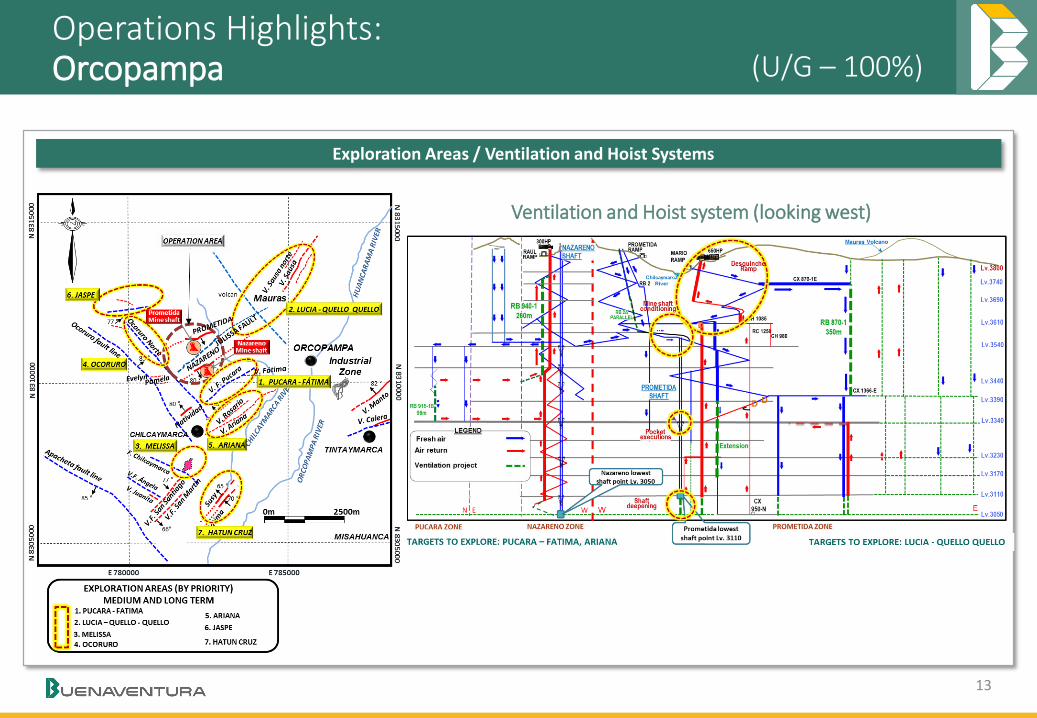
Operations Highlights:Orcopampa
13
(U/G – 100%)
Exploration Areas / Ventilation and Hoist Systems
Ventilation and Hoist system (looking west)
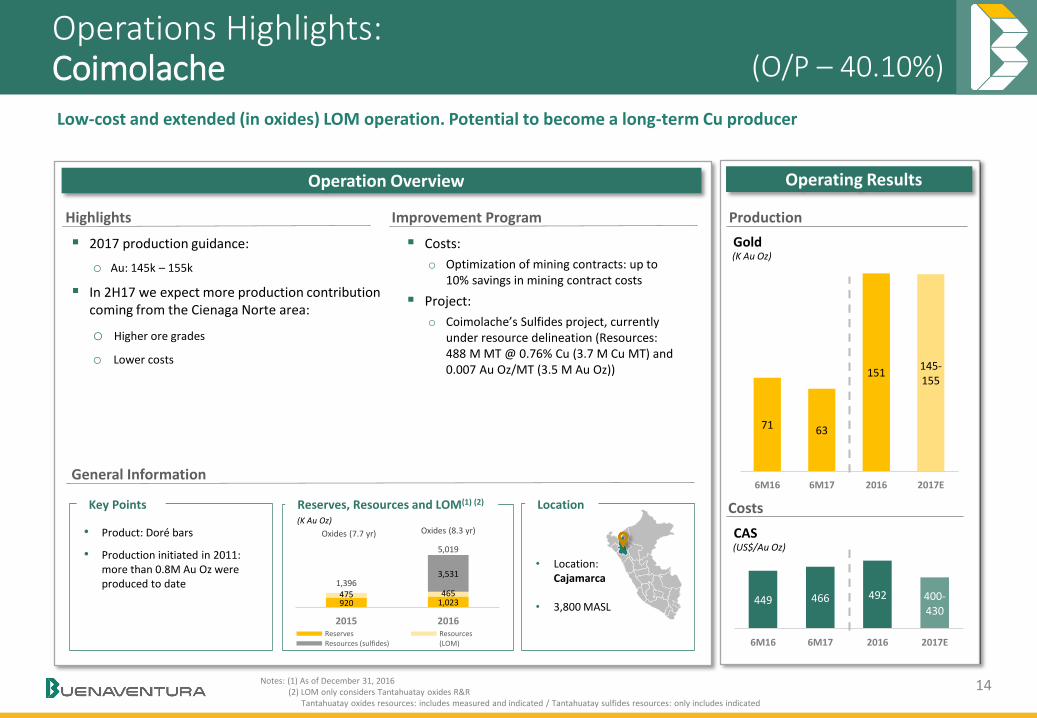
Operations Highlights:Coimolache
Operation Overview
Low-cost and extended (in oxides) LOM operation. Potential to become a long-term Cu producer
2017 production guidance:
o Au: 145k – 155k
In 2H17 we expect more production contribution coming from the Cienaga Norte area:
o Higher ore grades
o Lower costs
General Information
Notes: (1) As of December 31, 2016(2) LOM only considers Tantahuatay oxides R&R
Tantahuatay oxides resources: includes measured and indicated / Tantahuatay sulfides resources: only includes indicated
Key Points Location
• Product: Doré bars
• Production initiated in 2011: more than 0.8M Au Oz were produced to date
• Location: Cajamarca
• 3,800 MASL
Highlights Improvement Program
Operating Results
71 63
151145-155
6M16 6M17 2016 2017E
449 466 492 400-430
6M16 6M17 2016 2017E
Production
CAS
Costs
Gold
14
(O/P – 40.10%)
920 1,023475 465
3,5311,396
5,019
Oxides (7.7 yr) Oxides (8.3 yr)
2015 2016Reserves ResourcesResources (sulfides) (LOM)
(K Au Oz)
Reserves, Resources and LOM(1) (2)
Costs:
o Optimization of mining contracts: up to 10% savings in mining contract costs
Project:
o Coimolache’s Sulfides project, currently under resource delineation (Resources: 488 M MT @ 0.76% Cu (3.7 M Cu MT) and 0.007 Au Oz/MT (3.5 M Au Oz))
(K Au Oz)
(US$/Au Oz)

Operations Highlights:Yanacocha
Operation Overview
Important mining districtQuecher Main to extend LOM until 2025 and optionality to become a long-term Cu producer (Yanacocha sulfides)
2017 production guidance:o Au: 530k – 560k
o Annual Guidance maintained despite heavy rains at the beginning of the year
Quecher Main will bridge the operation to Yanacocha Sulfides
General Information
Notes: (1) As of December 31, 2016
Key Points Location(M Au Oz)
Reserves(1) and Resources(1) (2)
• Product: Doré bars
• Production initiated in 1993: more than 36.7M Au Oz were produced to date
• Location: Cajamarca
• 3,800 MASL
Highlights
Projects
Quecher Main:o Good results. Project decision is expected by
2H17
o Estimated annual production of 200k Au Oz
o Production between 2020 and 2025.
o CAPEX: $275 - $325 million / Positive FCF project
Yanacocha Sulfides (O/P):o Project added 2 M Au Oz to resources
o Studies will take 2.5 – 3 more years
o More drilling and mining exploration expected at Chaquicocha (U/G)
Operating Results
336258
655530-560
6M16 6M17 2016 2017E
760960
841845-895
6M16 6M17 2016 2017E
Production
CAS
Costs
Gold
17.5 17.5
5.4 9.2
5.1
22.8
4.4
26.6
Reserves Resources Reserves Resources
2015 2016
Conga Yanacocha
15
(O/P – 43.65%)
(K Au Oz)
(US$/Au Oz)
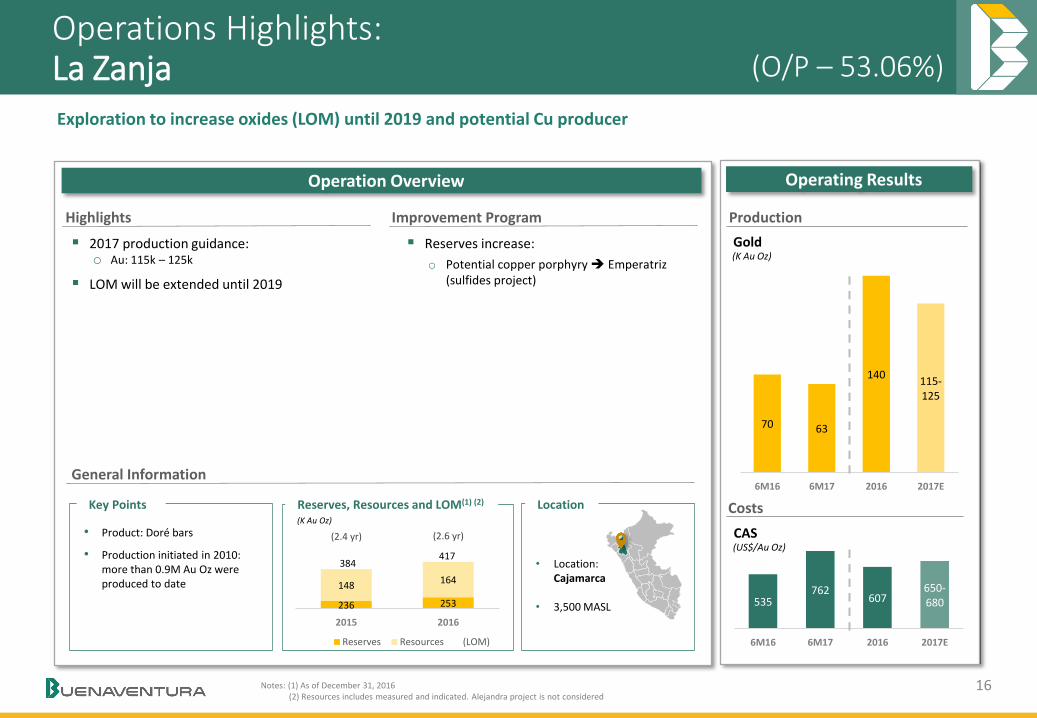
Operations Highlights:La Zanja
Operation Overview
Exploration to increase oxides (LOM) until 2019 and potential Cu producer
2017 production guidance:o Au: 115k – 125k
LOM will be extended until 2019
General Information
Notes: (1) As of December 31, 2016(2) Resources includes measured and indicated. Alejandra project is not considered
Key Points Location
• Product: Doré bars
• Production initiated in 2010: more than 0.9M Au Oz were produced to date
• Location: Cajamarca
• 3,500 MASL
Highlights Improvement Program
Reserves increase:
o Potential copper porphyry Emperatriz(sulfides project)
Operating Results
70 63
140115-125
6M16 6M17 2016 2017E
535762
607650-680
6M16 6M17 2016 2017E
Production
CAS
Costs
Gold(K Au Oz)
(US$/Au Oz)
16
(O/P – 53.06%)
236 253
148164
384417
(2.4 yr) (2.6 yr)
2015 2016
Reserves Resources (LOM)
(K Au Oz)
Reserves, Resources and LOM(1) (2)
Operations Highlights:Uchucchacua
Operation Overview
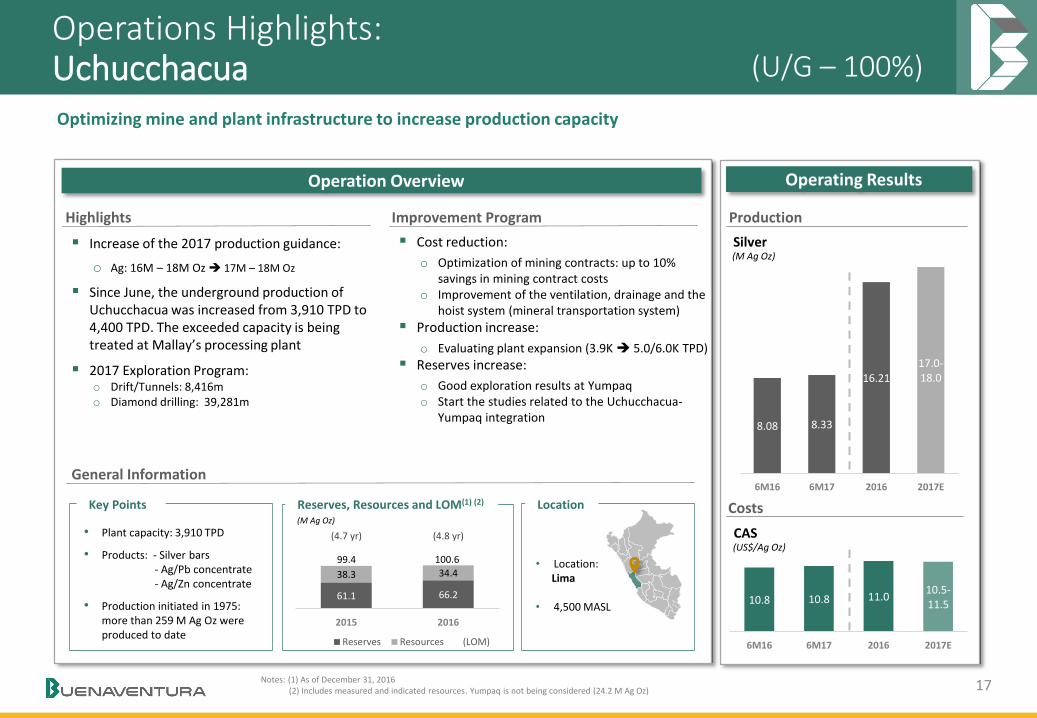
Optimizing mine and plant infrastructure to increase production capacity
Increase of the 2017 production guidance:
o Ag: 16M – 18M Oz 17M – 18M Oz
Since June, the underground production of Uchucchacua was increased from 3,910 TPD to 4,400 TPD. The exceeded capacity is being treated at Mallay’s processing plant
2017 Exploration Program:o Drift/Tunnels: 8,416mo Diamond drilling: 39,281m
General Information
Key Points Location
• Plant capacity: 3,910 TPD
• Products: - Silver bars- Ag/Pb concentrate- Ag/Zn concentrate
• Production initiated in 1975: more than 259 M Ag Oz were produced to date
• Location: Lima
• 4,500 MASL
Highlights Improvement Program
Operating Results
8.08 8.33
16.2117.0-18.0
6M16 6M17 2016 2017E
Production
CAS
Costs
Silver
17Notes: (1) As of December 31, 2016(2) Includes measured and indicated resources. Yumpaq is not being considered (24.2 M Ag Oz)
10.8 10.8 11.010.5-11.5
6M16 6M17 2016 2017E
(U/G – 100%)
61.1 66.2
38.3 34.4
99.4 100.6
(4.7 yr) (4.8 yr)
2015 2016
Reserves Resources (LOM)
(M Ag Oz)
Reserves, Resources and LOM(1) (2)
Cost reduction:
o Optimization of mining contracts: up to 10% savings in mining contract costs
o Improvement of the ventilation, drainage and the hoist system (mineral transportation system)
Production increase:
o Evaluating plant expansion (3.9K 5.0/6.0K TPD)
Reserves increase:
o Good exploration results at Yumpaqo Start the studies related to the Uchucchacua-
Yumpaq integration
(M Ag Oz)
(US$/Ag Oz)
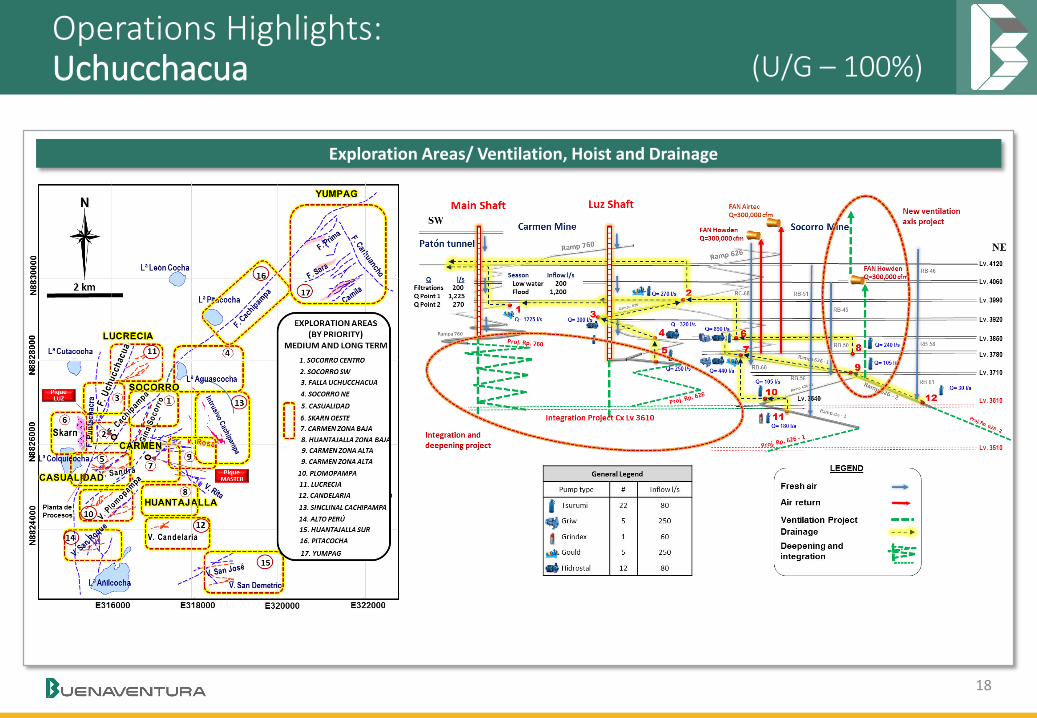
Operations Highlights:Uchucchacua
18
(U/G – 100%)
Exploration Areas/ Ventilation, Hoist and Drainage
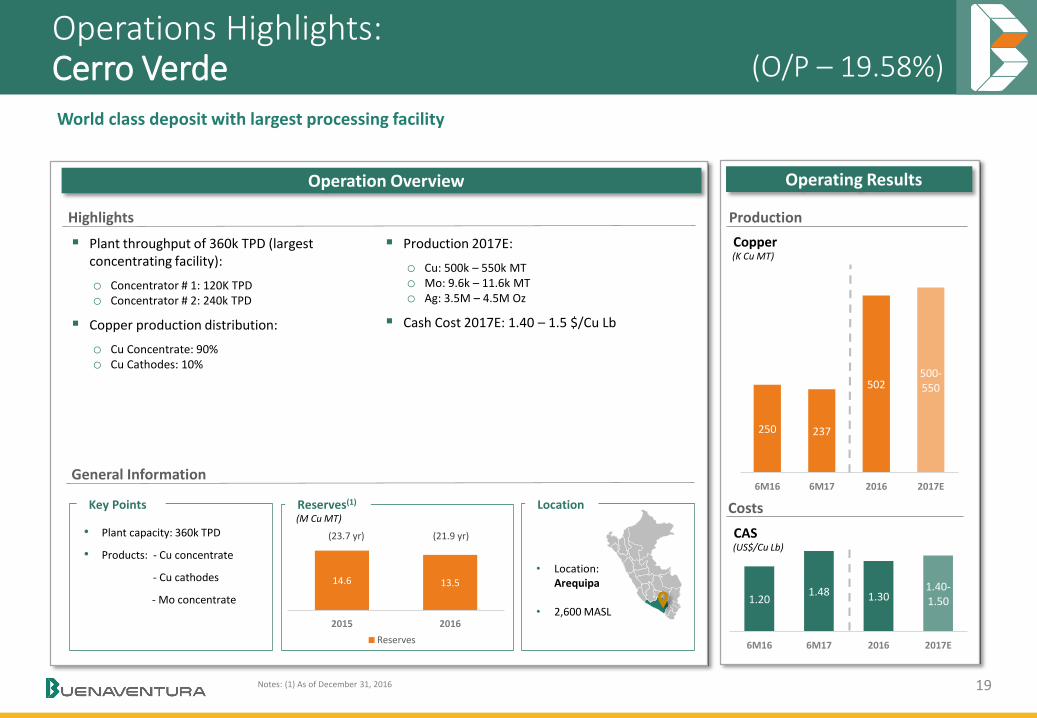
Operations Highlights:Cerro Verde
Operation Overview
World class deposit with largest processing facility
Plant throughput of 360k TPD (largest concentrating facility):
o Concentrator # 1: 120K TPDo Concentrator # 2: 240k TPD
Copper production distribution:
o Cu Concentrate: 90%o Cu Cathodes: 10%
General Information
Key Points Location(M Cu MT)Reserves(1)
• Plant capacity: 360k TPD
• Products: - Cu concentrate
- Cu cathodes
- Mo concentrate
Operating Results
Production
CAS
Costs
(US$/Cu Lb)
19
1.201.48 1.30
1.40-1.50
6M16 6M17 2016 2017E
14.6 13.5
2015 2016
Reserves
250 237
502500-550
6M16 6M17 2016 2017E
Copper(K Cu MT)
• Location: Arequipa
• 2,600 MASL
Notes: (1) As of December 31, 2016
Highlights
(O/P – 19.58%)
Production 2017E:
o Cu: 500k – 550k MTo Mo: 9.6k – 11.6k MTo Ag: 3.5M – 4.5M Oz
Cash Cost 2017E: 1.40 – 1.5 $/Cu Lb
(23.7 yr) (21.9 yr)
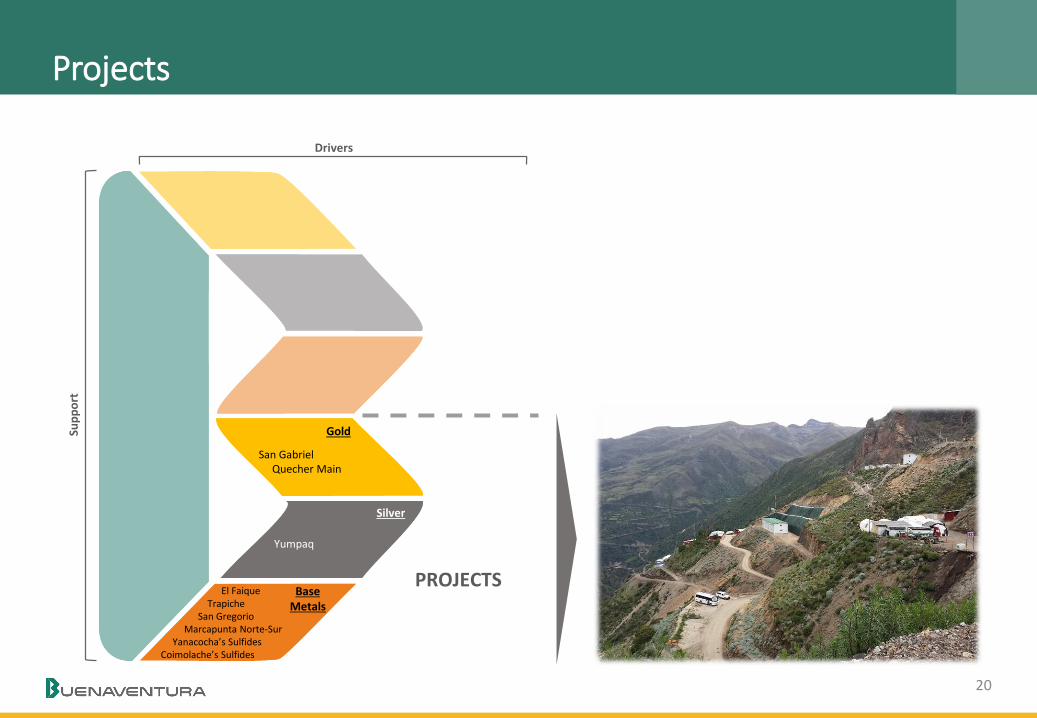
ProjectsSu
pp
ort
PROJECTS
Drivers
Gold
Silver
Base Metals
San GabrielQuecher Main
Yumpaq
El Faique Trapiche
San GregorioMarcapunta Norte-Sur
Yanacocha’s SulfidesCoimolache’s Sulfides
20
21
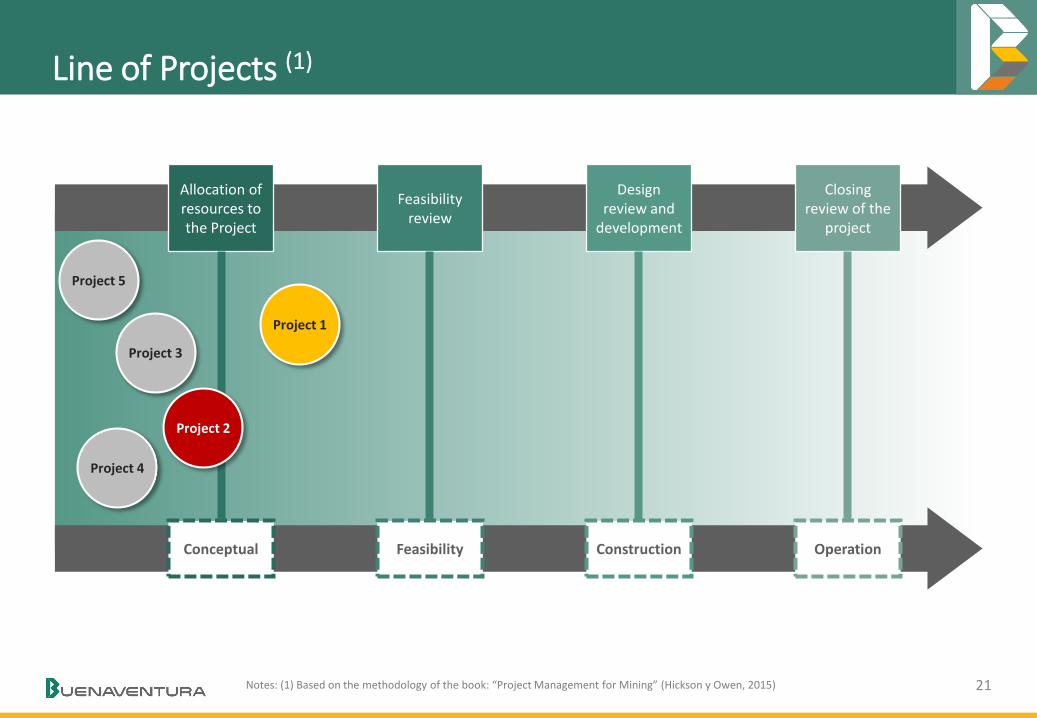
Line of Projects (1)
Allocation of resources to the Project
Feasibilityreview
Designreview and
development
Closingreview of the
project
Conceptual Feasibility Construction Operation
Project 5
Project 1
Project 3
Project 4
Project 2
Notes: (1) Based on the methodology of the book: “Project Management for Mining” (Hickson y Owen, 2015)

22
Project 1 (Example)
0123456789
10(1) Geology
(2) Mine
(3) Plant
(4) Deposit
(5) Energy
(6) Water
(7) Infrastructure
(8) Lands
(9) Permits
(10) Security
(11) People
(12) Communities
Level
Current: Identify gap with pre-feasibility study
Plan: Complete missing studies (EPCM – Phase I) to
achieve pre-feasibility level Presentation to committee and approvalDevelop feasibility study under new set limits
(ECPM – Phase II)
Conceptual Feasibility Construction Operation
Project Status (1) (2)
Nota: (1) Based on the methodology of the book: “Project Management for Mining” (Hickson y Owen, 2015)(2) Levels 9 and 10 can only be achieved when all 12 dimensions are at the same level of development

23
Portfolio of Projects – Pipeline for Growth
Legend
Gold projects
Silver projects
Base Metal projects
Operated byNewmont
To implement a disciplined processand increase value through our
portfolio of mining projects
Disciplined process
Focus on implementing best practices in terms of project management
Buenaventura’s Project Strategy
5 – 10+years
1 – 5 years
In preparation to Ramp-up Marcapunta
(expansion)
San Gregorio(Zn/Pb/Ag)
YanacochaSulphides(Cu/Au)
El Faique(Zn/Pb/Cu)
CoimolacheSulphides(Cu/Au)
Rio Seco(Cu/As)
Trapiche(Cu)
San Gabriel
QuecherMain
Increase Value
Focus on optimize capital allocation
Yumpaq(Phase I)
Rio Seco Expansion
(Mn)
24
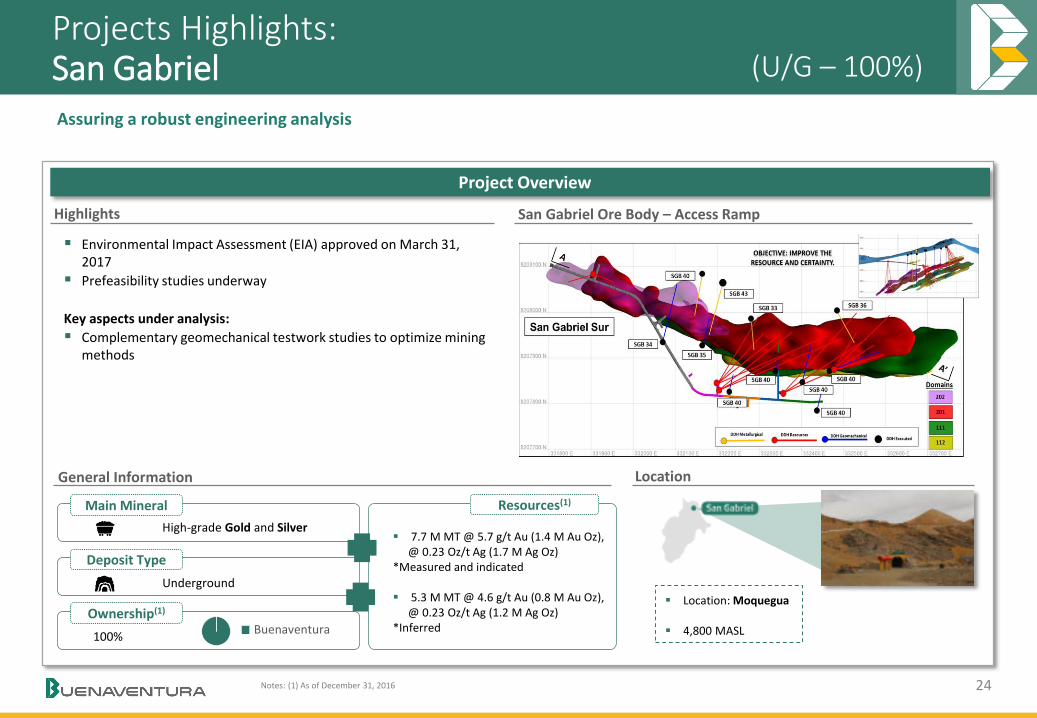
Projects Highlights:San Gabriel
Project Overview
Assuring a robust engineering analysis
Highlights San Gabriel Ore Body – Access Ramp
Environmental Impact Assessment (EIA) approved on March 31, 2017
Prefeasibility studies underway
Key aspects under analysis:
Complementary geomechanical testwork studies to optimize mining methods
General Information
Location: Moquegua
4,800 MASL
Notes: (1) As of December 31, 2016
100%
Ownership(1)
Deposit Type
High-grade Gold and Silver
Main Mineral Resources(1)
Buenaventura
Underground
Location
7.7 M MT @ 5.7 g/t Au (1.4 M Au Oz), @ 0.23 Oz/t Ag (1.7 M Ag Oz)
*Measured and indicated
5.3 M MT @ 4.6 g/t Au (0.8 M Au Oz), @ 0.23 Oz/t Ag (1.2 M Ag Oz)
*Inferred
(U/G – 100%)

184111
327 289
2Q16 2Q17 6M16 6M17
EBITDA Including Affiliates
In US$ millions
-40%
-12%
DirectOperatingUnits (3)
(58%)
OtherOperations (2)
(42%)
445-505
320-350645
765-855
2016 2017E
25
2Q17 Financial Highlights
285 257
513 535
1,069
1,200-1,400
2Q16 2Q17 6M16 6M17 2016 2017E
Total Revenues
In US$ millions
-10%+4%
10857
170137
333
400-450
2Q16 2Q17 6M16 6M17 2016 2017E
Consolidated EBITDA
In US$ millions
-48%
-19%
55
-6
107 65
-324
190-210
2Q16 2Q17 6M16 6M17 2016 2017E
Net Income
In US$ millions
-40%
Notes: (1) 2016 net Income includes a Yanacocha’s impairment of US$ 388.2 M(2) Includes Yanacocha and Cerro Verde(3) Operating units includes all BVN’s direct operations (Tambomayo, Orcopampa, La Zanja, Uchucchacua,
Mallay, Julcani, Tajo Norte and Marcapunta) and Coimolache
(1)
~+22%~+28%
~+26%

2Q17 Financial Highlights
Net Debt / EBITDA (1) Debt Profile (2) (3)
5.3x
4.0x
2.5x
2.0x
1.7x 1.7x1.9x
4Q15 1Q16 2Q16 3Q16 4Q16 1Q17 2Q17
25%
15%
60%
< 1 year < 1 & 2 years> <2 & 5 years>
Total Debt:US$ 714 M
Notes: (1) EBITDA from Direct Operations. As of June, 2017, the cash amount is US$156.7 M(2) Consolidated debt includes: 100% BVN, 100% La Zanja, 100% El Brocal, 100% Huanza(3) Huanza’s debt is non recourse to BVN
Debt Rating
BBB-Ba2
26
Buenaventura has maintained an adequate debt structure through recent years, which allowed to achieve a solid financial performance and low cost of funding levels
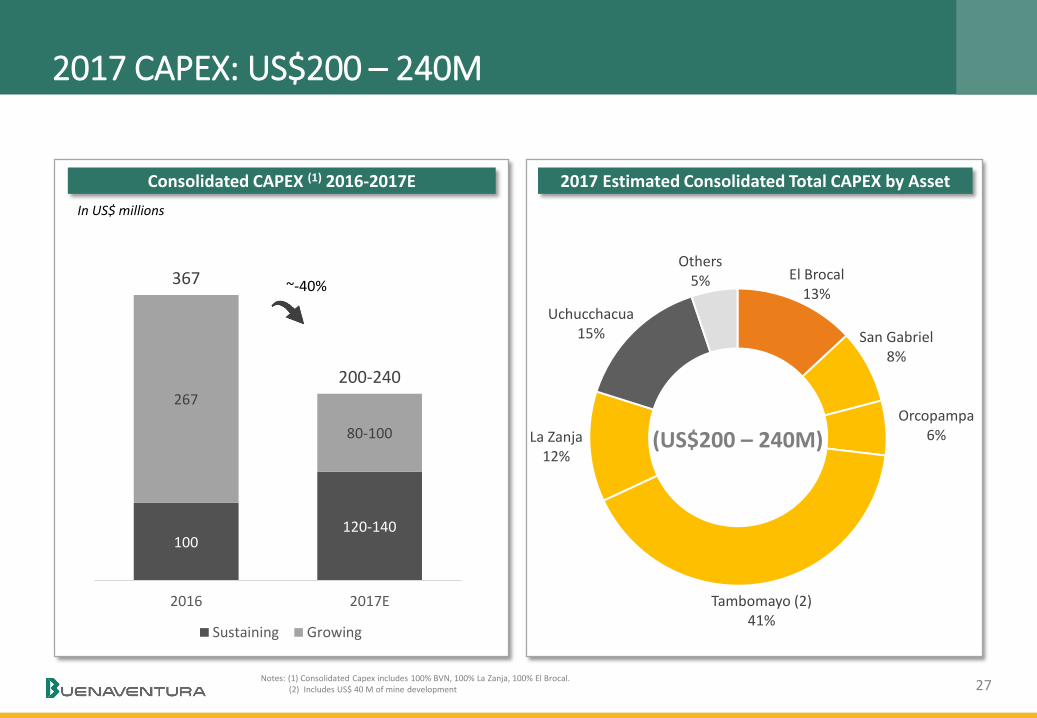
2017 CAPEX: US$200 – 240M
Consolidated CAPEX (1) 2016-2017E 2017 Estimated Consolidated Total CAPEX by Asset
Notes: (1) Consolidated Capex includes 100% BVN, 100% La Zanja, 100% El Brocal.(2) Includes US$ 40 M of mine development
El Brocal13%
San Gabriel8%
Orcopampa6%
Tambomayo (2)41%
La Zanja12%
Uchucchacua15%
Others5%
(US$200 – 240M)
27
In US$ millions
100120-140
267
80-100
367
200-240
2016 2017E
Sustaining Growing
~-40%

Closing Remarks
Implementing de-bottlenecking program in our operations to increase its profitability
Commited to generating value for our stake holders (personnel, shareholders, rural neighbors, our country)
BVN 100% based in Peru, one of the richest mineral countries in the world
Establishing best practices for Project management
Long tradition of ore reserves replenishing
I.
II.
III.
IV.
V.
28
Sup
po
rt
OPERATIONS
PROJECTS
Drivers
Safety
Human Resources
Social Management
Environmental Management
Technology and Innovation
Energy
Communications
Head Office
TambomayoOrcopampa
La ZanjaCoimolache
Yanacocha
Gold
Base Metals
Silver
Gold
Silver
Base Metals
UchucchacuaMallay
Julcani
San GabrielQuecher Main
Yumpaq
El Faique Trapiche
San GregorioMarcapunta Norte-Sur
Yanacocha’s SulfidesCoimolache’s Sulfides
El BrocalCerro Verde
www.buenaventura.com
Investor Relations Contact:Rodrigo Echecopar, (511) 419-2591 – [email protected]
2017 Denver Gold Forum


