As you will see, the 2017 DIRT Report has a new look and feel. CGA’s Data Reporting & Evaluation Committee has worked closely with a new consultant, Green Analytics, to use new data analysis methods and bring a fresh perspective and to this very important damage prevention tool.
For the fourth year in a row, the number of events submitted into DIRT increased, with more than 411,000 records submitted for 2017. This is an increase of approximately 5 percent over 2016. After consolidating multiple reports on the same event and filtering out near-misses, total damage reports for 2017 were 316,422.
One of the committee’s goals with the new report is to provide additional details on the data and the analytical methods employed, particularly for the annual estimate of total U.S. damages. A detailed appendix is included with specific information on the new methodology and approach for 2017. The new approach estimates an increase in total U.S. damages from 2015-2017 with a levelling-off of damages per one call transmissions and damages per dollars of construction spending during the same time frame. So, although we are seeing an annual increase in damages in recent years, the overall rate of damages has remained stable when taking construction activity into consideration.
We have made significant improvements to the DIRT online interactive dashboard, which now includes enhanced data visualizations and powerful sorting and filtering capabilities. The new dashboard features allow users to analyze damages in a variety of ways, including by facility types in individual states, and the ability to quickly create customized charts for these types of data.
One of the primary objectives in CGA’s 2018 strategic plan is to “develop information and analysis designed to enhance our members’ ability to implement effective damage prevention processes and programs.” With this in mind, I encourage our stakeholders to use the report and online dashboard to identify opportunities for improvement. This may include the identification of audiences for targeted outreach, development of new or revised Best Practices, identification of new technology solutions or strengthening legislation in your state.
There is no question the data included in the DIRT Report plays an important role in helping us reduce damages to underground infrastructure. Please take this opportunity to review your damage and near-miss data collection practices for improvement opportunities. If you’re not collecting key DIRT fields such as root cause, type of excavator, equipment and work performed, I would ask that you consider educating your personnel and/or change your internal processes start collecting this data. Improved data quality will enhance our annual DIRT analysis and will improve stakeholders’ ability to assess their own success and identify opportunities.
I want to thank everyone who works diligently to make the DIRT Report a key tool in helping stakeholders determine how to best protect underground utilities, the people who dig near them and their communities.
Be safe,
Sarah K. Magruder Lyle President & CEO Common Ground Alliance
2017 DIRT REPORT
COMMON GROUND ALLIANCE 2
TABLE OF CONTENTS Table of Contents ___________________________________________________________________ 2
2 See the 2015 Annual DIRT report for a description of the method used to match and weight multiple reports of the same event. Also see the May 2016 and July 2016 Monthly Updates (http://commongroundalliance.com/media-reports/cga-monthly-updates).
What Is New for 2017? • A new approach to data characterized as “unknown” increases transparency and informs
readers of the significance of unknown data and the implications for drawing conclusions about
larger data trends. Specifically, unknown data is included in datasets where it constitutes a
significant portion of the total. This approach also clearly demonstrates areas in the data
collection process where efforts to reduce unknown data are most needed.
• To allow for year-over-year comparisons with a high degree of confidence in trends in the data,
a subset of data from stakeholders that have consistently submitted over time was extracted
from the larger dataset and used to demonstrate trends from 2015 to 2017. Focusing on this
subset ensures that changes from one year to the next reflect actual changes in damages rather
than potentially being due to an increase, decrease, or different combination of entities
reporting through DIRT.
• A section titled “Understanding the Data” educates readers on where uncertainties lie in the
DIRT dataset and how such uncertainties have been addressed in the DIRT report.
• A consistent approach was used in the organization of the sections presenting the DIRT data,
including an overview of the dataset under consideration (i.e., root cause, reporting
stakeholder, excavator type, facility damaged), followed by cross-tabulations demonstrating
how the data fields intersect and relate to each other (e.g., root cause by reporting stakeholder,
facilities damaged by root cause). This is followed by presentations of the data over time (2015
to 2017).
• A calendar heat map shows the timing of damages with analysis contrasting combinations of
root cause, type of excavator, and equipment by weekdays and weekends.
2017 DIRT Highlights
Most reported damages (52%) are the result of Insufficient Excavation Practices. Approximately a
quarter of the damages (24%) resulted from Notification Not Made to the One Call Center, and
approximately 17% are due to locating issues.
The leading type of excavator involved in damages is Contractor at about 61%. Occupants and
Farmers make up about 5%. For reports where a root cause is provided, 78% involving Occupants
with hand tools are due to No Notification to the One Call Center. For Contractors with backhoes,
it’s about 21% due to No Notification to the One Call Center, with Excavating Practices making up
about 43%.
A refined approach to estimating the total annual damages in the U.S. results in an estimate of
439,000. This approach was applied retroactively to 2015 and 2016, resulting in revised estimates
of 378,000 and 416,000, respectively.
2017 DIRT REPORT
COMMON GROUND ALLIANCE 6
• A section on Call Before You Dig (CBYD) Awareness relates damages by occupants with CBYD
and 811 services awareness and use. Trend lines are included for the 2017 and 2018 awareness
surveys demonstrating U.S. regions where use and awareness of such services are lagging.
• A conclusion section summarizes key trends and articulates recommendations for
improvements to DIRT for future consideration.
• A detailed technical appendix (Appendix A) describes a refined approach used to establish
substantially reporting states and the statistical analysis undertaken to build the predictive
model to estimate total damages for the U.S. for 2015 to 2017. Results of the statistical analysis
are presented along with comparisons of damages for substantially reporting states with the
larger DIRT dataset. In general, the comparisons demonstrate that the substantially reporting
states dataset is a strong representation of the larger DIRT database.
2017 ONLINE DIRT DASHBOARD A redesigned interactive dashboard available allows users to interact with the complete DIRT
dataset, run queries, and extract trends of interest to users. Key features of the interactive DIRT
analysis tool include the following:
• State summaries and interactive visualizations
• Easy comparisons between states
• Temporal damage trends over the year
• Interactive maps
• Root causes and associated excavation information (type of excavator, work, and
equipment)
Online Dashboard URL:
commongroundalliance.com/dirt-dashboard
2017 DIRT REPORT
COMMON GROUND ALLIANCE 7
UNDERSTANDING THE DATA The DIRT database has grown and improved since data collection began in 2004. The DIRT data is a rich
source of industry intelligence on damage and near-miss events from excavation activities related to
buried facilities. Despite this, uncertainties remain that limit the ability to draw firm conclusions on the
trends in damage events over time and across jurisdictions. There are four reasons for this:
1. Reporting to DIRT is voluntary in many jurisdictions.3
2. In some cases, details pertaining to damage events are unknown or not collected, which
translates into unknown data in the DIRT database.
3. Reported data is not a complete census of damage to all buried facility operators.
4. There is limited knowledge of the population of companies or entities performing excavation
work that might cause damages.
These considerations result in the following issues that must be kept in mind while interpreting the data:
1. Some jurisdictions contain more comprehensive data than others. Thus, the damages reported
via DIRT are not necessarily a reflection of the actual total damages that take place in a given
jurisdiction in a particular year.
2. Changes over time may be due to variations in the number and combination of entities
reporting damages, or from actual increases or decreases in the number of damages.
To allow stakeholders to draw firm conclusions about the trends in damage events, two subsets of data
were extracted from the DIRT database: damages for substantially reporting states and damages for
consistently reporting stakeholders. The reporting states dataset contains reported damages from states
at the high end of the spectrum for reporting events via DIRT. This dataset is used to predict total
damages for the U.S. in a given year, the results of which are presented in the Estimating Total Damages
section of this report. The consistently reporting stakeholders dataset is described in detail next.
Consistently Reporting Stakeholders The consistently reporting stakeholders dataset focuses on entities that have consistently reported
events via DIRT over time. Because use of DIRT is voluntary, it is difficult to interpret trends in damages
over time because changes may be caused by an increase or decrease in actual damages, or by more or
fewer stakeholders employing the database in any given year. Feedback from DIRT users and
stakeholders has indicated that year-over-year comparisons at the level of aggregation presented in
Table 1 should therefore be undertaken with caution.
3 Although some state's laws and/or rules require reporting all or some specific facility type events to DIRT, compliance may not be 100%.
2017 DIRT REPORT
COMMON GROUND ALLIANCE 8
To allow for year-over-year comparisons with a higher degree of confidence that changes reflect
differences in actual damages rather than shifts in reporting, it is useful to examine annual damages
reported for the subset of stakeholders that have employed DIRT on a consistent basis. Consistently
reporting stakeholders are comprised of those companies that reported into DIRT during 2015, 2016,
and 2017. Table 2 presents total reported damages over time along with those from the consistently
reporting stakeholders.
Table 2—Reported damages and total damages for consistently reporting stakeholders in Canada and the U.S., over time
2015 2016 2017
Reported Damages 278,861 317,869 316,442
Reported Damages for Consistently Reporting
Stakeholders 275,885 307,336 295,141
Reported Damages Attributed to Consistently
Reporting Stakeholders 99% 97% 93%
As shown in Table 2, consistently reporting stakeholders account for the clear majority, albeit a
decreasing amount, of reported damages. Subsequent sections employ the consistently reporting
stakeholders dataset to demonstrate temporal trends in the DIRT data. Given the high percentage of
total reported damages captured by the consistently reporting stakeholders, readers can be confident
that the trends over time are a solid representation of changes in actual damages.
A Note About Unknown Data Consideration was also given to the proportion of any given dataset that was characterized by unknown
data entries. In cases where the unknown data was deemed to have an insignificant impact on the
overall trend in the data (i.e., the unknown data does not skew overall data trends), it is excluded from
the data presented in the report. However, in cases where the unknown data does have a significant
impact on the overall trend in the data, it was left in the dataset and is presented in this report along
with known data. This is a different approach than used in past years, when all unknown data was
excluded from the DIRT report. Including the unknown data where it plays a significant role in the data
trend serves two important purposes:
1. It improves transparency about what is known and what is unknown and can highlight the areas
where improved reporting will enhance overall understanding of the damages.
2. Suppressing unknown data where it accounts for a significant proportion of reported damages
can lead to misinterpretation of overall trends in damages. Allowing unknown data to remain
allows the reader to be more cautious when interpreting such variables.
To establish whether to include or exclude unknown data, each dataset was graphed so as to distinguish
between the known and unknown data. An example of this is shown in Figure 1, which demonstrates
the breakdown of root causes. The figure differentiates between all data (known plus unknown, in blue)
and only data with known root causes (green). When the unknown data is filtered out the contribution
2017 DIRT REPORT
COMMON GROUND ALLIANCE 9
of the known causes to the total shifts only slightly. With the unknown data excluded, Failure to Use
Hand Tools, Failure to Maintain Clearance, and Facility Marking or Locating Not Sufficient increase by a
mere 1–2%. No Notification Made to the One Call Center and Other Excavation Practices Not Sufficient
increase as well by just 3–4%.
Figure 1- Root cause of reported damages in Canada and the U.S., 2017
2017 DIRT REPORT
COMMON GROUND ALLIANCE 10
Root cause is an example where the unknown data has a relatively insignificant impact on the overall
trend in the data. This was also the case for facilities damaged, where most reported damages involved
telecommunications with or without the unknown data included. Thus, for root cause and facilities
damaged, this report presents only the known data. For the excavator type dataset, unknown data was
relatively significant (48%), and so for this dataset it is included in the trends presented in this report.
Data Quality Index
The data quality index (DQI) is a measure of the completeness of DIRT reports. Starting with a
theoretical score of 100 (i.e., information is provided for all fields within DIRT), points are subtracted
when unknown, other, or data not collected are used. This allows stakeholders to identify
opportunities to improve reporting in the future. Figure 2 demonstrates the trend in the DQI for
2016 and 2017 across reporting stakeholders. The lowest DQI scores are associated with Excavators
(DQI of 49) and One Call Center (DQI of 43). All other DQI scores exceed 50. Note that the average
DQI for 2017 is down from 2016 by 5 points (from 68 to 63).
207,587
52,233
22,280 16,702
6,281 4,096 3,442 1,353 545 154 60 13 9 4 1 0
10
20
30
40
50
60
70
80
90
100
-
50,000
100,000
150,000
200,000
250,000
Dat
a Q
ual
ity
Ind
ex (
DQ
I)
Rep
ort
ed D
amag
es
Reporting Stakeholder
Reported Damages DQI 2017 DQI 2016 DQI 2016 Average DQI 2017 Average
Figure 2-Data Quality Index by Reporting Stakeholder
2017 DIRT REPORT
COMMON GROUND ALLIANCE 11
ESTIMATING TOTAL DAMAGES Each year, the damage reports entered into DIRT are used to estimate the total number of damages for
the U.S. As noted previously, damages are reported to DIRT on a voluntary basis and thus do not
necessarily reflect the total number of damages that take place in a given year. A new approach
(described in detail in Appendix A) was employed to generate an improved estimate of total damages
occurring in the U.S. in 2017. As a result, the 2017 estimate was not directly comparable with the
estimates in previous DIRT reports. The new approach was therefore retroactively applied to the 2015
and 2016 datasets.
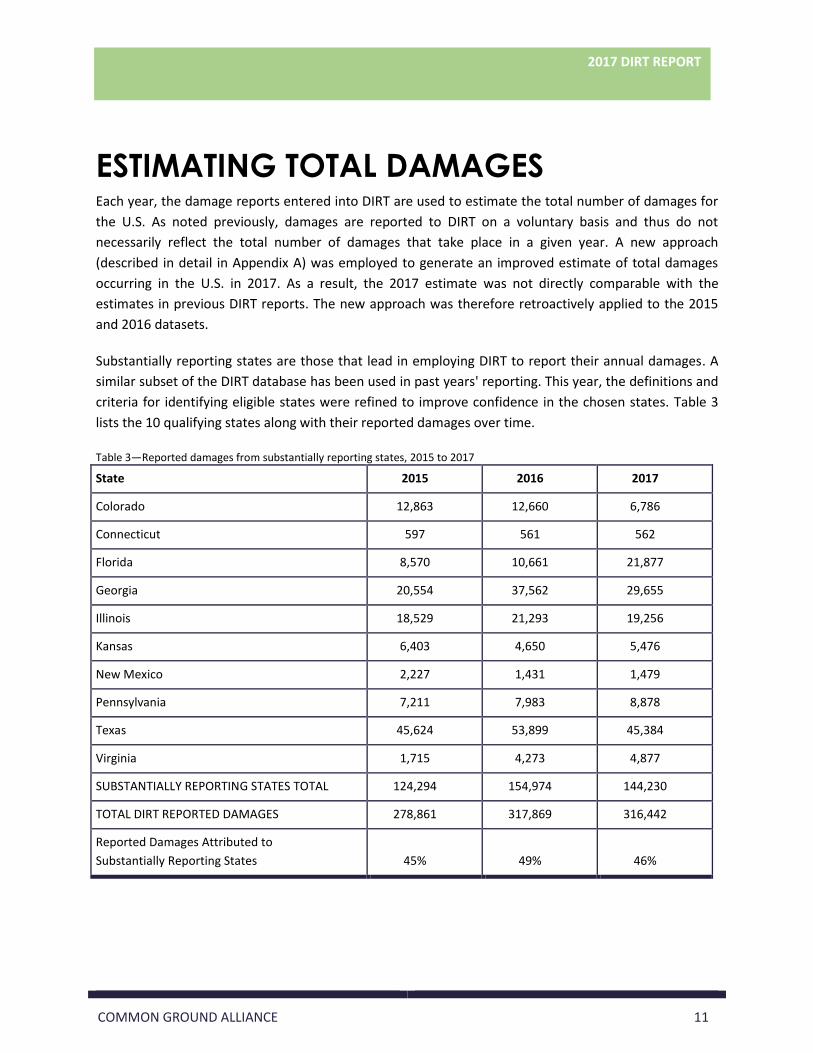
Substantially reporting states are those that lead in employing DIRT to report their annual damages. A
similar subset of the DIRT database has been used in past years' reporting. This year, the definitions and
criteria for identifying eligible states were refined to improve confidence in the chosen states. Table 3
lists the 10 qualifying states along with their reported damages over time.
Table 3—Reported damages from substantially reporting states, 2015 to 2017
State 2015 2016 2017
Colorado 12,863 12,660 6,786
Connecticut 597 561 562
Florida 8,570 10,661 21,877
Georgia 20,554 37,562 29,655
Illinois 18,529 21,293 19,256
Kansas 6,403 4,650 5,476
New Mexico 2,227 1,431 1,479
Pennsylvania 7,211 7,983 8,878
Texas 45,624 53,899 45,384
Virginia 1,715 4,273 4,877
SUBSTANTIALLY REPORTING STATES TOTAL 124,294 154,974 144,230
TOTAL DIRT REPORTED DAMAGES 278,861 317,869 316,442
Reported Damages Attributed to
Substantially Reporting States 45% 49% 46%
2017 DIRT REPORT
COMMON GROUND ALLIANCE 12
Table 4 presents the estimates from the previous approach (2015 and 2016) and the new approach
(2015, 2016, and 2017). With the new approach, the estimated damages for 2017 are 439,000, which
lies within an estimated range of approximately 320,000 to 715,000.
Table 4—Key performance indicators for total estimated damages in the U.S., over time
2015 2016 2017
Total Estimated Damages (U.S.)
Previous Approach
317,000 379,000 Not Applicable
Total Estimated Damages Updated
Approach
378,000 416,000 439,000
Total Estimated Transmissions 199.9 M 221.9 M 234.9 M
Total Estimated Damages per 1,000
Transmissions Updated Approach
1.89 1.88 1.87
Damages per million dollars of
construction spending
0.354 0.351 0.359
The new approach leads to mid-point estimates for 2015 and 2016 that are higher than those published in the DIRT reports for those years. Please note however that while the revised retroactive mid-point
estimates are higher than the original estimates, they do fall with the range of those estimates.4
A similar approach was used to estimate the total number of one call transmissions. Using data from the
one call centers that did submit the information to the CGA’s One Call Systems International database
(or provided it separately), estimates for the missing one call centers were calculated and added. The
net result of these revised estimates is that the ratio of Damages per 1,000 Transmissions is declining
slightly each year.
The increased estimates of U.S. damages for 2015 and 2016 are the result of two key factors:
1. A more sophisticated modeling approach that is better suited to the type of data contained in
the DIRT database.
2. A refined approach to defining substantially reporting states.
The primary objective of estimating total damages for the U.S. is to demonstrate trends over time. For
this reason, it was important to apply the new approach to previous years. While the new approach
provides an improved estimate, it is important to note that the updated approach is probably still
4 See Exhibit 1 of the 2016 DIRT Report.
2017 DIRT REPORT
COMMON GROUND ALLIANCE 13
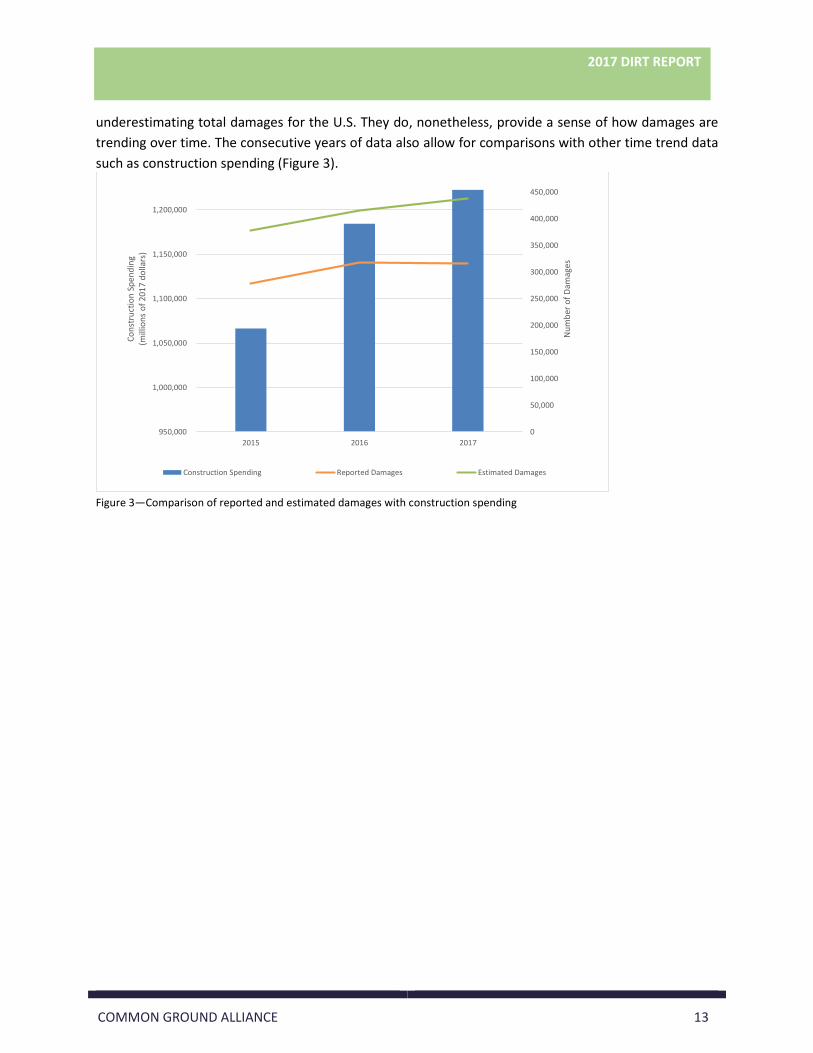
underestimating total damages for the U.S. They do, nonetheless, provide a sense of how damages are
trending over time. The consecutive years of data also allow for comparisons with other time trend data
such as construction spending (Figure 3).
0
50,000
100,000
150,000
200,000
250,000
300,000
350,000
400,000
450,000
500,000
950,000
1,000,000
1,050,000
1,100,000
1,150,000
1,200,000
1,250,000
2015 2016 2017
Nu
mb
er o
f D
amag
es
Co
nst
ruct
ion
Sp
end
ing
(mill
ion
s o
f 20
17 d
olla
rs)
Construction Spending Reported Damages Estimated Damages
Figure 3—Comparison of reported and estimated damages with construction spending
2017 DIRT REPORT
COMMON GROUND ALLIANCE 14
DATE AND LOCATION OF DAMAGES The clear majority of reported damages in 2017 occurred during the work week (Monday to Friday).
Across all states, 279,760 reported damages occurred during the work week and 26,038 occurred on
weekends. The same trend was observed for Canada, with 9,789 reported damages occurring during the
work week and 854 on weekends. Figure 4 illustrates the distribution of reported damages by month
and day for 2017. The majority of damages occur in the months of June, July, August, and September. In
2017, 50% of the reported damages occurred during these four months. The highest number of
damages were reported for the month of August with 11%. For types of excavators excluding from
Occupants, more than 90% of damages occur on weekdays. For Occupants, it’s approximately 73%
weekdays and 27% weekends. Hand Tools are the type of equipment for 13% of damages occurring on
weekdays but 24% on weekends. For Backhoes, it’s 32% of damages on weekdays and 26% on
weekends.
Figure 4—Heat calendar of total damages in Canada and the U.S. by month and date, 2017
2017 DIRT REPORT
COMMON GROUND ALLIANCE 15
Figure 5 displays ranges of damages by location as reported via DIRT. Because participation in DIRT is
voluntary and varies by state, the damage ranges indicated may not provide a complete picture of
damages and damage prevention efforts. Specifically, higher damages may indicate a higher level of
voluntary reporting rather than a higher level of actual damages. As a result, Figure 5 should be
interpreted as an indication of which states and provinces are providing damage reports and not an
assessment of which are experiencing the most damages.
Figure 5—Map of reported damages, 2017
2017 DIRT REPORT
COMMON GROUND ALLIANCE 16
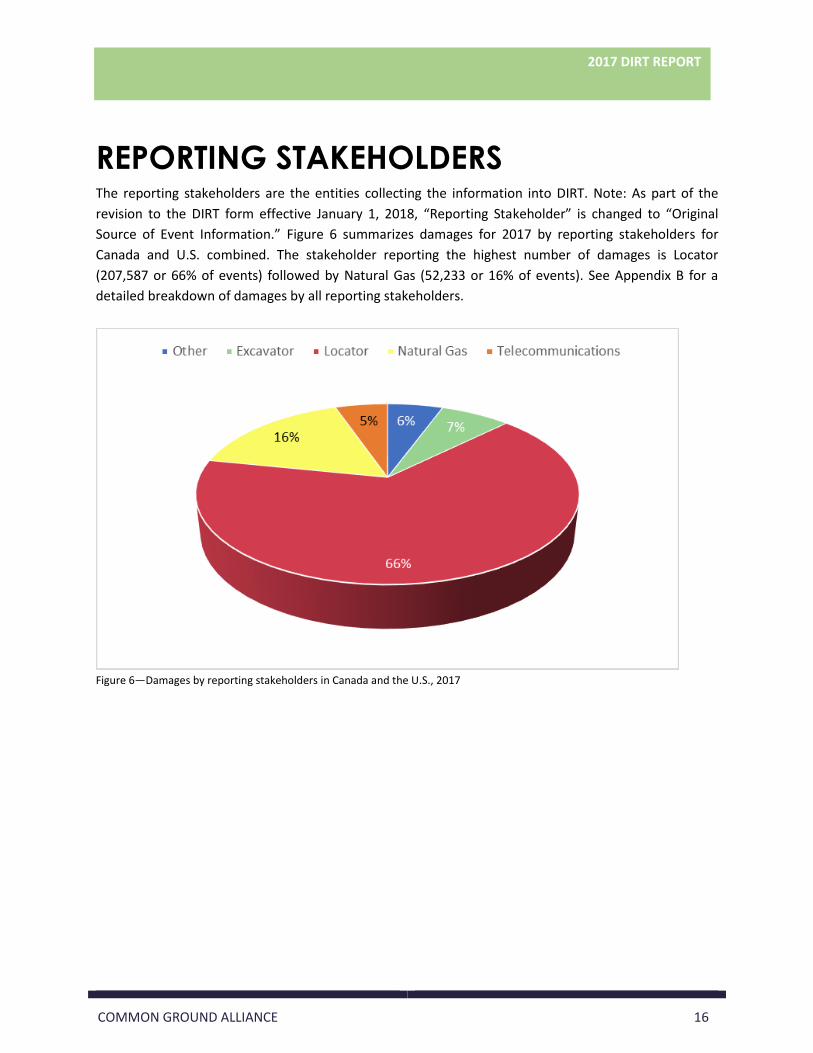
REPORTING STAKEHOLDERS The reporting stakeholders are the entities collecting the information into DIRT. Note: As part of the
revision to the DIRT form effective January 1, 2018, “Reporting Stakeholder” is changed to “Original
Source of Event Information.” Figure 6 summarizes damages for 2017 by reporting stakeholders for
Canada and U.S. combined. The stakeholder reporting the highest number of damages is Locator
(207,587 or 66% of events) followed by Natural Gas (52,233 or 16% of events). See Appendix B for a
detailed breakdown of damages by all reporting stakeholders.
Figure 6—Damages by reporting stakeholders in Canada and the U.S., 2017
2017 DIRT REPORT
COMMON GROUND ALLIANCE 17
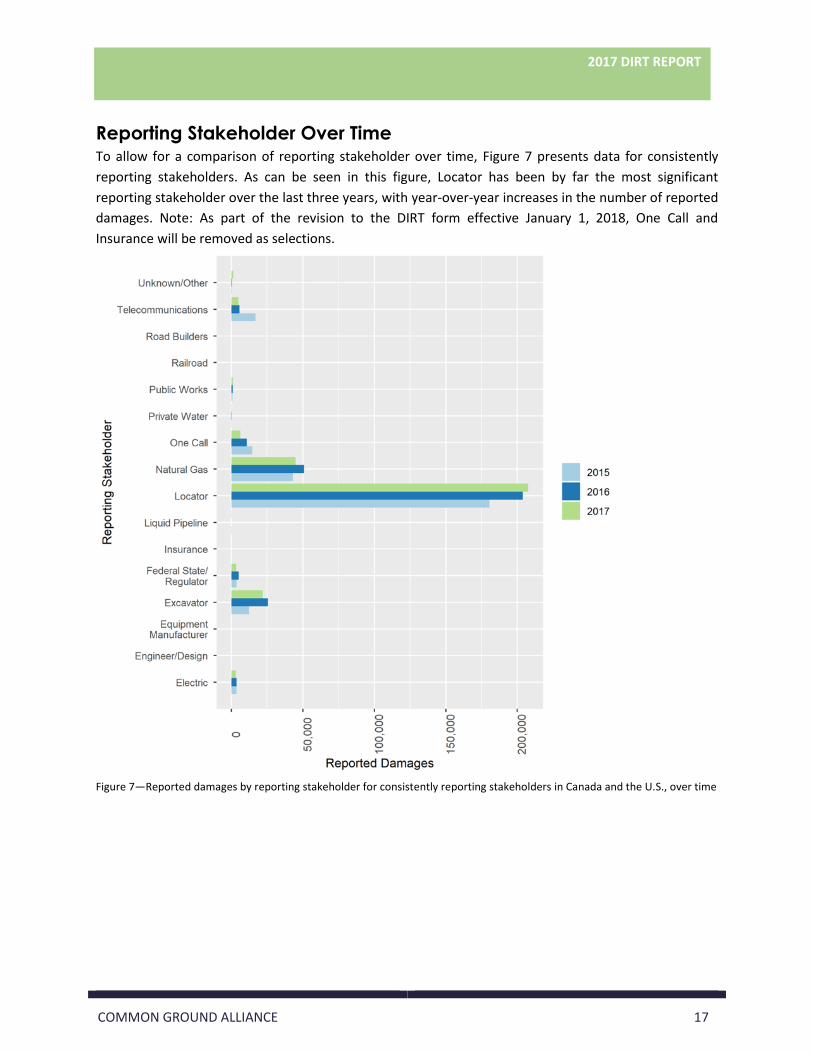
Reporting Stakeholder Over Time To allow for a comparison of reporting stakeholder over time, Figure 7 presents data for consistently
reporting stakeholders. As can be seen in this figure, Locator has been by far the most significant
reporting stakeholder over the last three years, with year-over-year increases in the number of reported
damages. Note: As part of the revision to the DIRT form effective January 1, 2018, One Call and
Insurance will be removed as selections.
Figure 7—Reported damages by reporting stakeholder for consistently reporting stakeholders in Canada and the U.S., over time
2017 DIRT REPORT
COMMON GROUND ALLIANCE 18
ROOT CAUSE This section of the report presents data trends for root cause. Because the unknown data related to root
cause is relatively small (see Understanding the Data, A Note About Unknown Data), the data and trends
in this section are centered around the known data.
Figure 8 demonstrates the breakdown of root cause for damage events. The most commonly listed root
cause in 2017 was Other Insufficient Excavation Practices5 (32%). This was followed by No Notification
Made to the One Call Center (24%).
Figure 8—Reported damages by root cause, known data, in Canada and the U.S., 2017
5 This root cause is intended to be a last resort after considering the other more specific excavation-practice choices, such as Failure to Maintain Clearance, Failure to Pothole, or Marks Faded or Not Maintained.
2017 DIRT REPORT
COMMON GROUND ALLIANCE 19
Root Cause by Group To provide a higher-level overview of the root causes, the Data Committee groups root causes into
major groups as per Table 5, demonstrating that the leading root cause group is Excavation Practices
Not Sufficient. This group accounts for 142,980 damages. See Appendix C for grouping definitions.
Table 5—Reported damages by root cause group, known data, in Canada and the U.S., 2017
Root Cause Group Total Damages
Excavation Practices Not Sufficient 142,980
Notification Not Made 64,189
Notification Practices Not Sufficient 5,645
Locating Practices Not Sufficient 46,056
Miscellaneous 14,758
Total Damages6 273,628
The significant contribution of Excavation Practices Not Sufficient to total damages is also demonstrated
in Figure 9. Over half of the plot is attributed to this root cause group.
Figure 9—Reported damages by root cause group, known data, in Canada and the U.S., 2017
6 Total reported damages (after consolidating multiple records of the same event) were 316,442, of which 42,814 had an unknown for root cause, leaving 273,628 with known root causes.
2017 DIRT REPORT
COMMON GROUND ALLIANCE 20
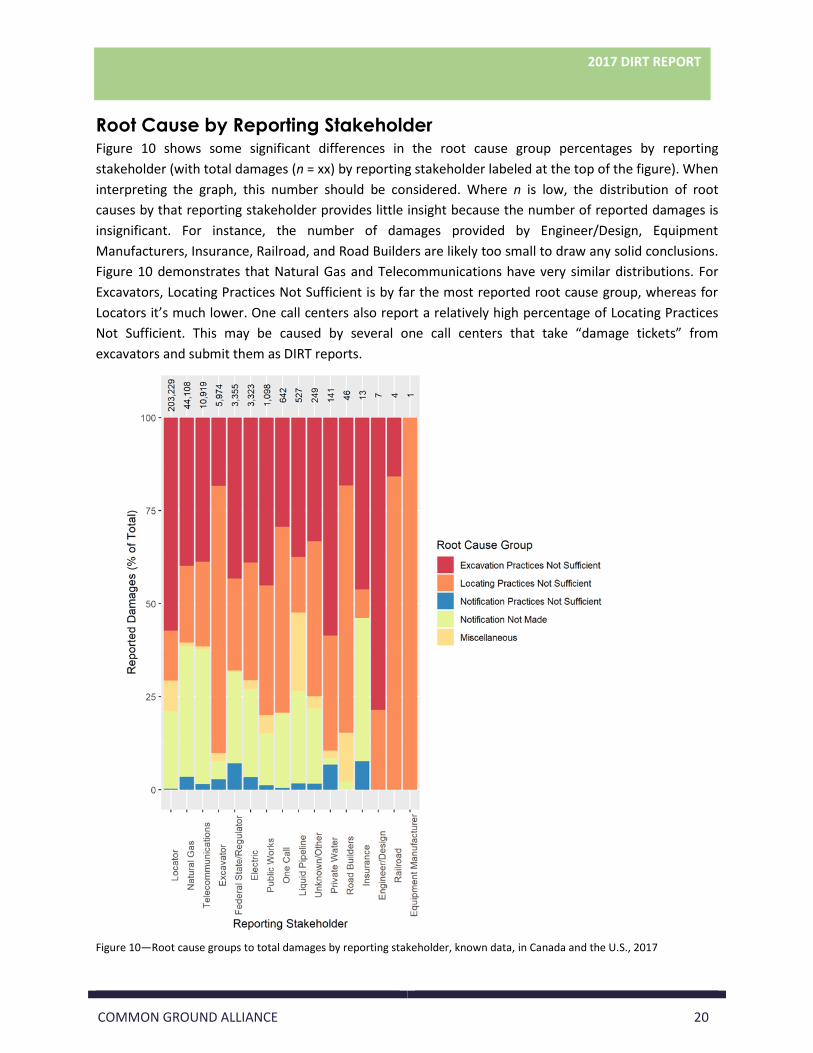
Root Cause by Reporting Stakeholder Figure 10 shows some significant differences in the root cause group percentages by reporting
stakeholder (with total damages (n = xx) by reporting stakeholder labeled at the top of the figure). When
interpreting the graph, this number should be considered. Where n is low, the distribution of root
causes by that reporting stakeholder provides little insight because the number of reported damages is
insignificant. For instance, the number of damages provided by Engineer/Design, Equipment
Manufacturers, Insurance, Railroad, and Road Builders are likely too small to draw any solid conclusions.
Figure 10 demonstrates that Natural Gas and Telecommunications have very similar distributions. For
Excavators, Locating Practices Not Sufficient is by far the most reported root cause group, whereas for
Locators it’s much lower. One call centers also report a relatively high percentage of Locating Practices
Not Sufficient. This may be caused by several one call centers that take “damage tickets” from
excavators and submit them as DIRT reports.
Figure 10—Root cause groups to total damages by reporting stakeholder, known data, in Canada and the U.S., 2017
2017 DIRT REPORT
COMMON GROUND ALLIANCE 21
Root Cause Over Time To allow for a comparison over time, Figure 11 presents root cause groups for consistently reporting
stakeholders. Here, both known and unknown data are presented. The most frequently cited root cause
groups in the last three years are Notification Not Made and Excavation Practices Not Sufficient.
Although Excavation Practices Not Sufficient declined as a root cause between 2016 and 2017,
Notification Not Made increased. It is encouraging that Unknown/Other continues to trend downward.
Figure 11—Root cause by group for consistently reporting stakeholders, in Canada and the U.S., over time
2017 DIRT REPORT
COMMON GROUND ALLIANCE 22
The Notification Practices Not Sufficient group covers events where an 811 notice was made (or
attempted) but something went wrong, such as a wrong description of the work site that led to no
marks at the actual work site, or an excavator did not provide sufficient advance notice in accordance
with the local rules or began work before the marks were completed. These typically account for around
1% of the total damages. As part of the revision to the DIRT form effective January 1, 2018, the root
causes are revamped to more easily capture such scenarios.
Because the total must always add to 100%, a decrease in one group will be offset by an increase in
another. It appears that the distribution of root cause groups for 2017 is similar to that of 2015 and prior
years, and 2016 may have been an anomaly, especially regarding Notification Not Made.
EXCAVATOR TYPE This section describes the type of excavator, type of work performed, and type of equipment involved in
damages. Figure 12 presents damage information by excavator type clearly demonstrating the
significant involvement of Contractors (32%). The high number of unknowns is also obvious at 54%. This
is an indication of the strength of the data for excavator type, which, when compared to root cause
data, appears to be relatively more uncertain.
Figure12—Total damages by excavator type, all reported data, in Canada and the U.S., 2017
Because of the significant contribution of unknown data to the excavator dataset, in the sections below,
unknown excavator type data is included in the presentation of the data unless otherwise noted.
2017 DIRT REPORT
COMMON GROUND ALLIANCE 24
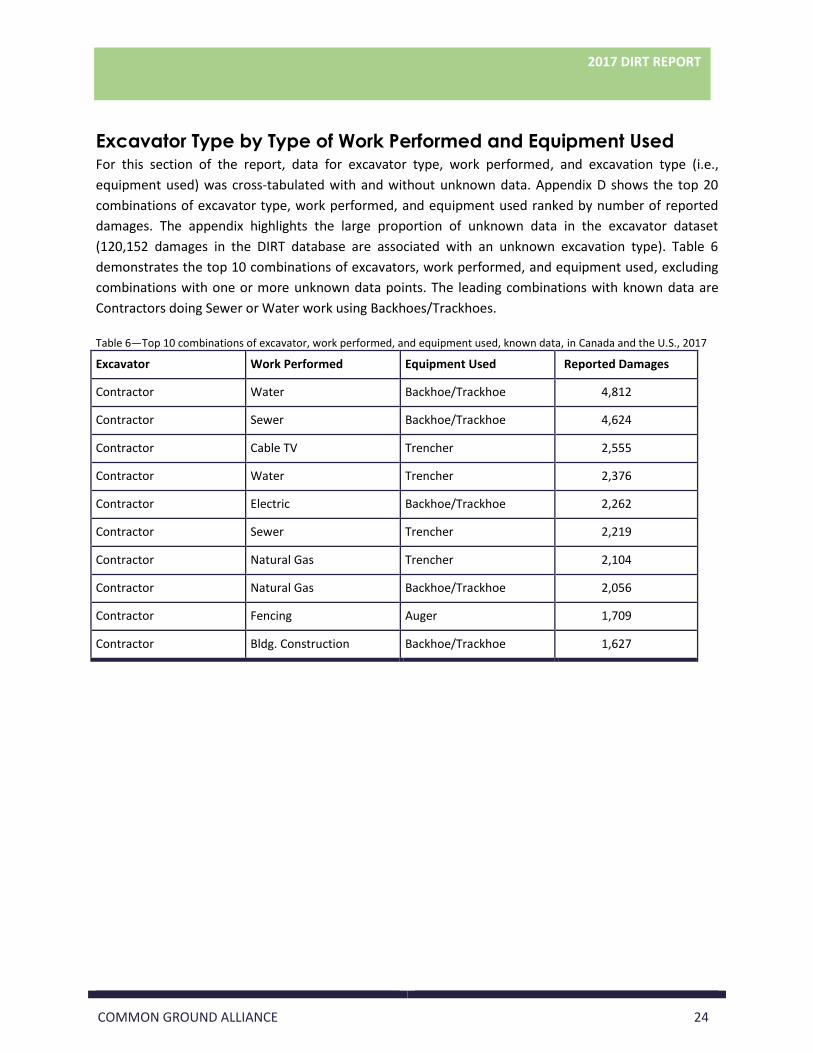
Excavator Type by Type of Work Performed and Equipment Used For this section of the report, data for excavator type, work performed, and excavation type (i.e.,
equipment used) was cross-tabulated with and without unknown data. Appendix D shows the top 20
combinations of excavator type, work performed, and equipment used ranked by number of reported
damages. The appendix highlights the large proportion of unknown data in the excavator dataset
(120,152 damages in the DIRT database are associated with an unknown excavation type). Table 6
demonstrates the top 10 combinations of excavators, work performed, and equipment used, excluding
combinations with one or more unknown data points. The leading combinations with known data are
Contractors doing Sewer or Water work using Backhoes/Trackhoes.
Table 6—Top 10 combinations of excavator, work performed, and equipment used, known data, in Canada and the U.S., 2017
Excavator Work Performed Equipment Used Reported Damages
Contractor Water Backhoe/Trackhoe 4,812
Contractor Sewer Backhoe/Trackhoe 4,624
Contractor Cable TV Trencher 2,555
Contractor Water Trencher 2,376
Contractor Electric Backhoe/Trackhoe 2,262
Contractor Sewer Trencher 2,219
Contractor Natural Gas Trencher 2,104
Contractor Natural Gas Backhoe/Trackhoe 2,056
Contractor Fencing Auger 1,709
Contractor Bldg. Construction Backhoe/Trackhoe 1,627
2017 DIRT REPORT
COMMON GROUND ALLIANCE 25
Figure 13 demonstrates the relationship between excavator and work performed groups graphically. See
Appendix C for grouping definitions. The significant number of damages attributable to Contractors
across a range of work performed is evident as is the significant number of damages associated with
unknown excavators.
Agriculture
Telecom
Construction/Demolition
Street/Roadway
Energy
Fencing
Landscaping
Sewer/Water
-
2,000
4,000
6,000
8,000
10,000
12,000
14,000
16,000
18,000
20,000
Wo
rk P
erf
orm
ed
Da
ma
ge
s
Excavator
Agriculture Telecom Construction/Demolition Street/Roadway Energy Fencing Landscaping Sewer/Water
Figure 13—Reported damages by excavator and work performed in Canada and the U.S., 2017
2017 DIRT REPORT
COMMON GROUND ALLIANCE 26
The relationship between type of equipment used by excavators can also be examined graphically
(Figure 14). A similar trend can be seen here, with a significant number of damages attributable to
Contractors across a range of equipment types.
Backhoe/Trencher
Handtools
Drilling
Other
-
5,000
10,000
15,000
20,000
25,000
30,000
35,000
40,000
45,000
Eq
uip
me
nt
Use
d
Dam
ges
Excavator
Backhoe/Trencher Handtools Drilling Other
Figure 14—Reported damages by excavator and equipment used in Canada and the U.S., 2017
2017 DIRT REPORT
COMMON GROUND ALLIANCE 27
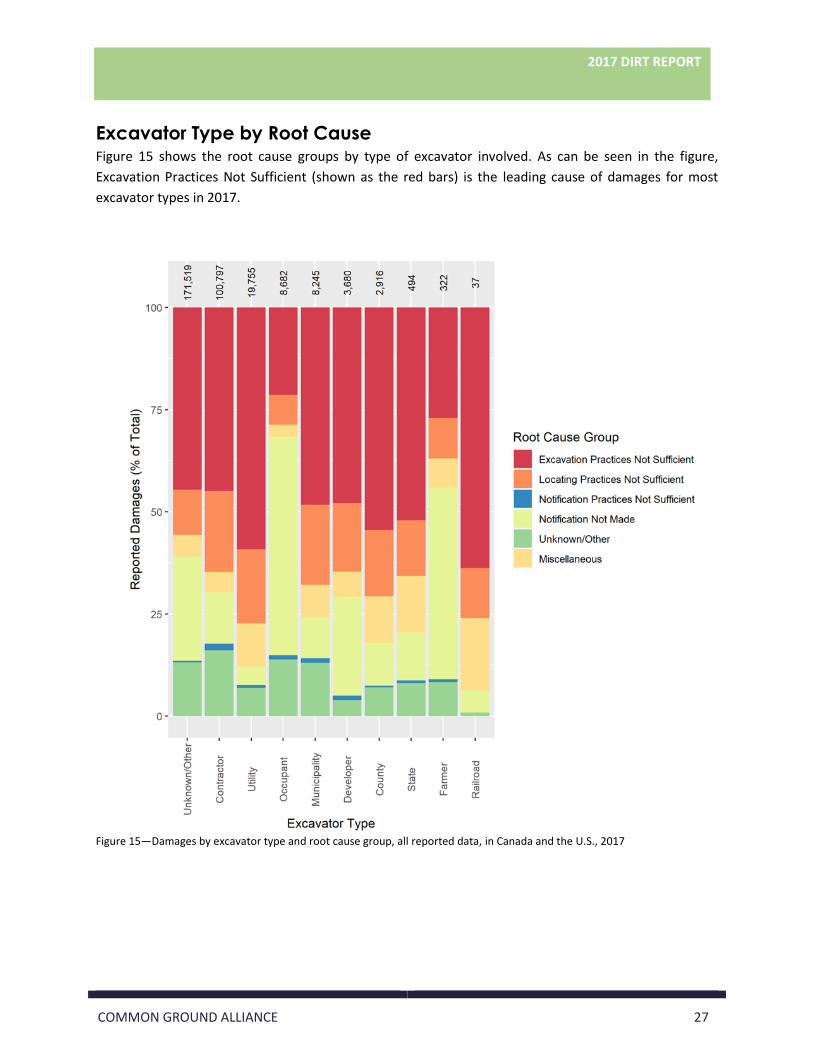
Excavator Type by Root Cause Figure 15 shows the root cause groups by type of excavator involved. As can be seen in the figure,
Excavation Practices Not Sufficient (shown as the red bars) is the leading cause of damages for most
excavator types in 2017.
Figure 15—Damages by excavator type and root cause group, all reported data, in Canada and the U.S., 2017
2017 DIRT REPORT
COMMON GROUND ALLIANCE 28
Excavator Type Over Time Figure 16 shows the trend in damages by excavator type over time, focusing on consistently reporting
stakeholders. Between 2015 and 2017, Contractor and Unknown/Other have remained the main
excavator types with the contribution of the unknown data increasing from 2016 to 2017 and Contractor
declining over the same period.
Figure 16—Damages by excavator type for consistently reporting entities in Canada and the U.S., 2015 to 2017
2017 DIRT REPORT
COMMON GROUND ALLIANCE 29
FACILITIES AFFECTED AND DAMAGED Figure 17 shows reported damages by facility damaged for known data (unknown data is excluded due
to the relatively low contribution—about 5% of all reported damages). In 2017, the most commonly
damaged facility was Telecommunications (49%). This was followed by Natural Gas (28%) and Cable
Television (11%).
Figure 17 - Reported damages by facility damaged, known data, in Canada and the U.S., 2017
2017 DIRT REPORT
COMMON GROUND ALLIANCE 30
The type of affected facilities includes Distribution, Service Drop, Transmission, and Gathering. Figure 18
demonstrates the relationship between facilities affected and facilities damaged. The majority of reports
involve Telecommunications and Natural Gas Service/Drops and Distribution.
Distribution
Gathering
Service/Drop
Transmission
-
10,000
20,000
30,000
40,000
50,000
60,000
Faci
lity
Aff
ecte
d
Dam
ages
Facility Damaged
Figure 18 - Reported damages by facility damaged and facility affected, known data, in Canada and the U.S., 2017
Facilities Damaged by Reporting Stakeholder The type of facility damaged varies by reporting stakeholder. Excavators report 91% (10 of 11) of
damages to Steam, 50% of damages to Sewers, 30% of damages to Water, and 10% of damages to
Electric Facilities. Locators report 81% of damages to Telecommunications and Cable Television, 69% of
damages to Electric Facilities, 50% of damages to Water, and 33% of damages to Natural Gas Facilities.
Liquid Pipeline and Natural Gas reporting stakeholders do the most self-reporting of their own damaged
facilities. Liquid Pipeline stakeholders entered 74% of the damages to Liquid Pipelines, while Natural Gas
stakeholders reported 59% of the damages to Natural Gas Facilities.
2017 DIRT REPORT
COMMON GROUND ALLIANCE 31
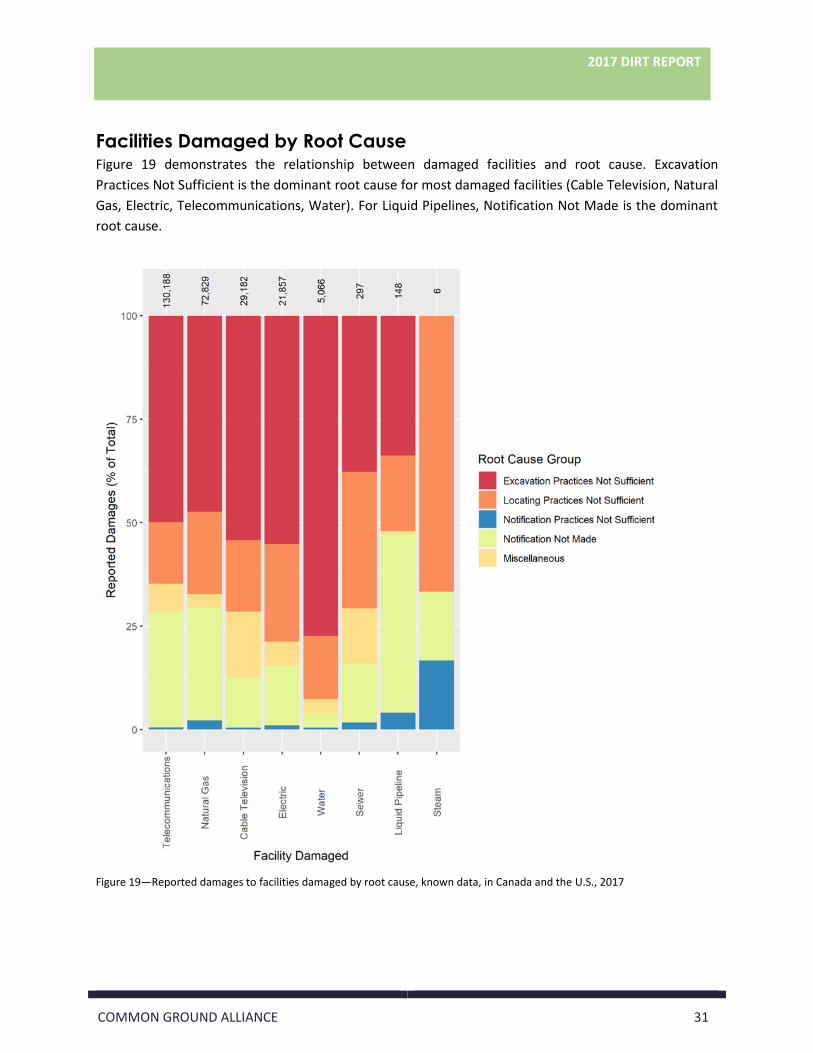
Facilities Damaged by Root Cause Figure 19 demonstrates the relationship between damaged facilities and root cause. Excavation
Practices Not Sufficient is the dominant root cause for most damaged facilities (Cable Television, Natural
Gas, Electric, Telecommunications, Water). For Liquid Pipelines, Notification Not Made is the dominant
root cause.
Figure 19—Reported damages to facilities damaged by root cause, known data, in Canada and the U.S., 2017
2017 DIRT REPORT
COMMON GROUND ALLIANCE 32
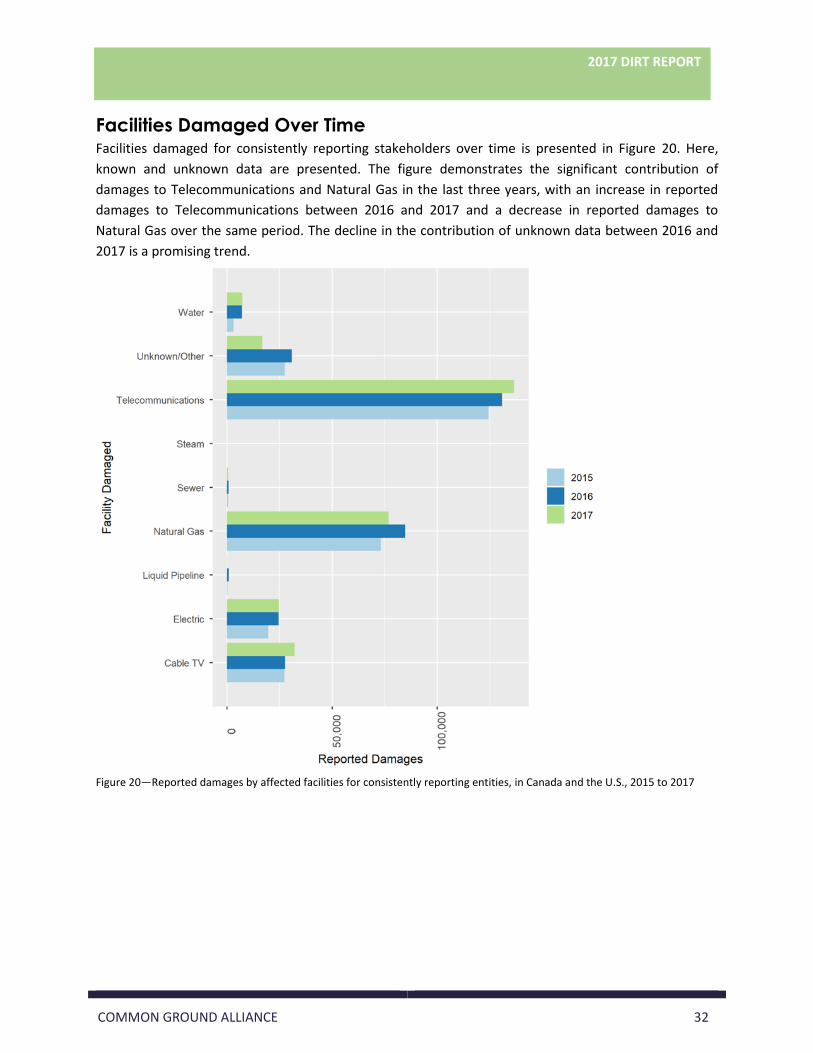
Facilities Damaged Over Time Facilities damaged for consistently reporting stakeholders over time is presented in Figure 20. Here,
known and unknown data are presented. The figure demonstrates the significant contribution of
damages to Telecommunications and Natural Gas in the last three years, with an increase in reported
damages to Telecommunications between 2016 and 2017 and a decrease in reported damages to
Natural Gas over the same period. The decline in the contribution of unknown data between 2016 and
2017 is a promising trend.
Figure 20—Reported damages by affected facilities for consistently reporting entities, in Canada and the U.S., 2015 to 2017
2017 DIRT REPORT
COMMON GROUND ALLIANCE 33
CALL BEFORE YOU DIG AWARENESS Each year a national survey is conducted to test the use and awareness of call before you dig (CBYD),
including 811, services. The survey focuses on census regions within the U.S. as shown in Figure 21.
Figure 21—Census regions used in the annual call before you dig survey
This section of the 2017 DIRT report considers the trends in CBYD use and awareness from the 2017 and
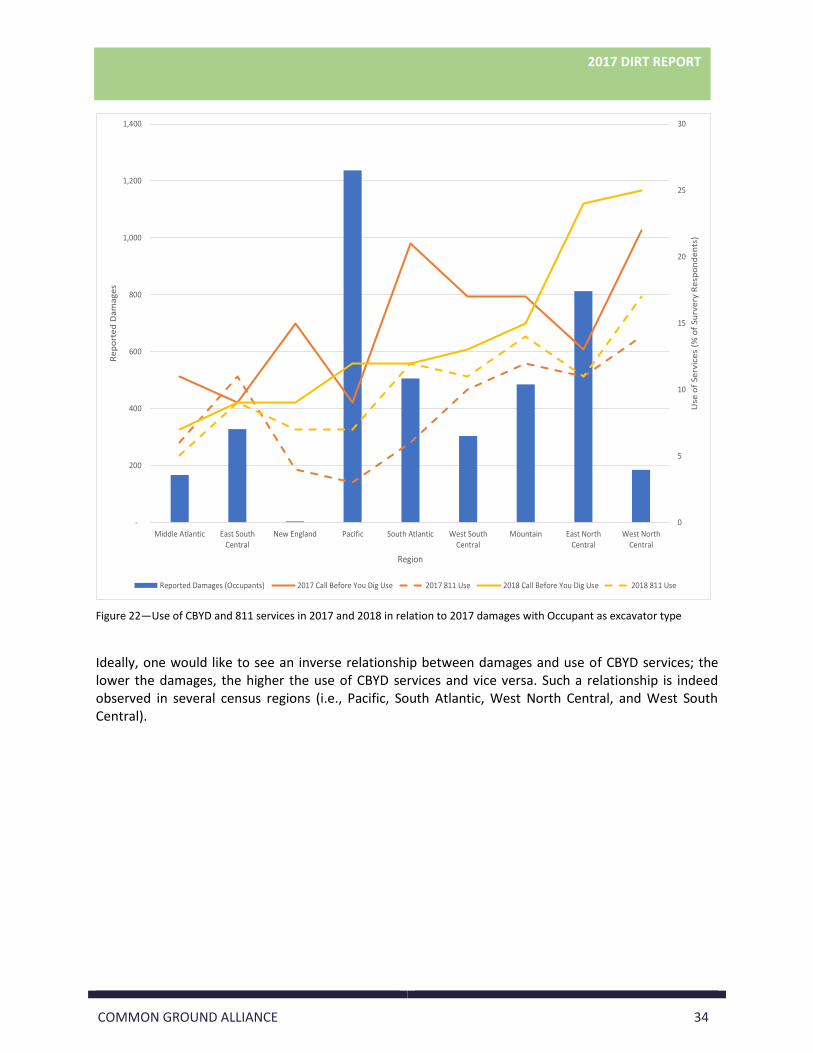
2018 surveys in relation to reported damages on a regional basis. Figure 22 presents survey results,
along with the trend in reported damages for residential stakeholders (excavator type labeled
Occupants in the DIRT database). This is the most relevant stakeholder group in relation to the survey,
which is focused on the general population and is thus unlikely to capture a high proportion of damage
prevention industry stakeholders.
2017 DIRT REPORT
COMMON GROUND ALLIANCE 34
0
5
10
15
20
25
30
-
200
400
600
800
1,000
1,200
1,400
Middle Atlantic East SouthCentral
New England Pacific South Atlantic West SouthCentral
Mountain East NorthCentral
West NorthCentral
Use
of
Serv
ice
s (%
of
Surv
ery
Re
spo
nd
en
ts)
Re
po
rte
d D
am
ag
es
Region
Reported Damages (Occupants) 2017 Call Before You Dig Use 2017 811 Use 2018 Call Before You Dig Use 2018 811 Use
Figure 22—Use of CBYD and 811 services in 2017 and 2018 in relation to 2017 damages with Occupant as excavator type
Ideally, one would like to see an inverse relationship between damages and use of CBYD services; the lower the damages, the higher the use of CBYD services and vice versa. Such a relationship is indeed observed in several census regions (i.e., Pacific, South Atlantic, West North Central, and West South Central).
2017 DIRT REPORT
COMMON GROUND ALLIANCE 35
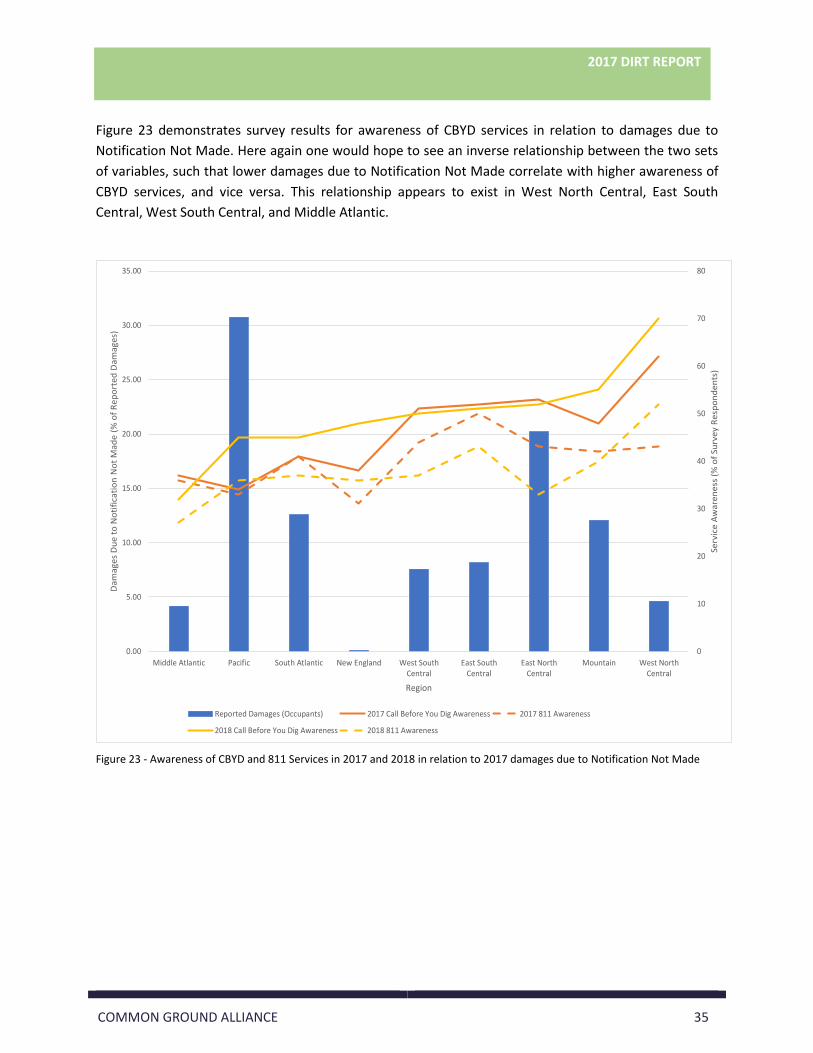
Figure 23 demonstrates survey results for awareness of CBYD services in relation to damages due to
Notification Not Made. Here again one would hope to see an inverse relationship between the two sets
of variables, such that lower damages due to Notification Not Made correlate with higher awareness of
CBYD services, and vice versa. This relationship appears to exist in West North Central, East South
Central, West South Central, and Middle Atlantic.
0
10
20
30
40
50
60
70
80
0.00
5.00
10.00
15.00
20.00
25.00
30.00
35.00
Middle Atlantic Pacific South Atlantic New England West SouthCentral
East SouthCentral
East NorthCentral
Mountain West NorthCentral
Serv
ice
Aw
are
ne
ss (
% o
f Su
rve
y R
esp
on
de
nts
)
Dam
age
s D
ue
to
No
tifi
cati
on
No
t M
ade
(%
of
Re
po
rte
d D
amag
es)
Region
Reported Damages (Occupants) 2017 Call Before You Dig Awareness 2017 811 Awareness
2018 Call Before You Dig Awareness 2018 811 Awareness
Figure 23 - Awareness of CBYD and 811 Services in 2017 and 2018 in relation to 2017 damages due to Notification Not Made
2017 DIRT REPORT
COMMON GROUND ALLIANCE 36
CONCLUSION This report summarizes the damage data submitted via DIRT in 2017. Damage data is presented over
time and geographically. Cross tabulations of the data demonstrate the relationships between key
variables (e.g., root cause of reported damages by reporting stakeholder). The DIRT database is a highly
useful source of data and information pertaining to damage events in Canada and the U.S. The details
contained within the database are critical for guiding education, awareness, and damage prevention
initiatives.
To ensure that maximum value is derived from each event entered into DIRT, efforts should be directed
toward minimizing the amount of “unknown” data entries. This is particularly a concern for excavator
type where the proportion of the unknown data is significant. Investing in training and awareness
around DIRT and how to use it may reduce the amount of unknown data, allowing for more informed
conclusions to be drawn on data trends and characteristics in the future.
To inform conclusions on the extent to which stakeholders are employing DIRT, it would be useful to
have a reliable estimate of the size of the potential user base that exists in Canada and the U.S. Knowing
the total potential user base could have a significant impact on understanding and interpreting the
trends and characteristics of the DIRT data.
Because submissions to DIRT are largely undertaken on a voluntary basis, it is difficult to interpret trends
in reported damages over time. Changes from one year to the next may be due to a change in actual
damages or due to a change in the number and combination of stakeholders employing DIRT. To allow
for comparisons in damages over time with a high degree of confidence, this year’s report presents time
trends for consistently reporting stakeholders—stakeholders that have been employing the database on
a consistent basis over the last three years. The damages reported by the consistently reporting
stakeholders represent a significant portion of the total damages reported through DIRT. This means
that the trends in damages over time from the consistently reporting stakeholders are a solid
representation of the trend in total damages. This also implies that a high proportion of stakeholders
that were reporting in 2015 are still reporting in 2017. Furthermore, the difference between the two
datasets (total reported damages versus damages reported by consistently reporting stakeholders), is
minimal but has increased since 2015. The increase could be attributed to either a decline in damages
from the consistently reporting stakeholders, or a growing number of other stakeholders reporting
through DIRT.
In 2018, a refined approach was employed to identify the subset of states deemed to be substantially
reporting damage events. The new resulted in 10 states qualifying as substantially reporting. These
states were used to estimate the total number of damage events taking place in the U.S. for 2015, 2016,
and 2017.
2017 DIRT REPORT
COMMON GROUND ALLIANCE 37
APPENDIX A: ESTIMATE OF TOTAL U.S.
DAMAGES Green Analytics, in consultation with the Data Reporting and Evaluation Committee, developed a model
to estimate the total number of facility damages in the U.S. and to provide insight into the relationships
between key variables. The modeling process used is summarized in this section.
Damages reported to DIRT are voluntary and for many states, under-reported. As a result, the total
reported damages in the DIRT database do not reflect the actual number of damages that occur in the
U.S. By relying on states that are substantially reporting actual damages, statistical methods can be used
to estimate damages for the states with less adequate reporting. In this way, an estimate can be made
of the total number of damages in the U.S. To start, a subset of states where damages are deemed to
have been substantially reported was established. This subset was then used to develop a predictive
model as outlined in the following sections.
Substantially Reporting States The first step in the process was to establish a consistent method to identify a substantially reporting
state. While actual damages are unknown for all states, for the purpose of guiding this assessment, a
target of reporting at least 70% of actual damages was defined.
To establish whether a state meets this threshold, a certainty scoring process was employed. Damages
were divided into seven groups according to the facility damaged: cable tv, electric, liquid pipeline,
natural gas, sewer, telecommunications, and water. For each facility damage group, states were ranked
on a scale and assigned points as follows: 'Likely or definitely substantially reporting' = 1 point, 'Maybe
substantially reporting' = 0.5 points, 'Definitely not substantially reporting' = 0 points. Weightings were
determined largely through expert opinion and by considering the following variables:
• Percentage reported via Virtual Private DIRT applications
• The existence of damage reporting legislation
• The combination of reporting stakeholders
Points for each state were then summed across damage facility groups. The total possible score for a
given state was seven points. The initial scoring was then verified through a series of one-on-one
discussions with subject matter experts in the individual states. Through those discussions, several state
scores were adjusted and refined. Ten states, listed below, scored more than four of the seven points.
For the purpose of producing a predictive model, two cut-offs for what qualifies as a substantially
reporting state were explored:
• 4 out of 7 points, capturing the top 10 states
• 4.5 out of 7 points, capturing the top 5 states
2017 DIRT REPORT
COMMON GROUND ALLIANCE 38
Table A1 - Substantially reporting states and their score
State Score
Georgia 6.5
Pennsylvania 5.5
New Mexico 5.0
Illinois 4.5
Kansas 4.5
Colorado 4.0
Florida 4.0
Texas 4.0
Virginia 4.0
Connecticut 4.0
While this new process has yielded some excellent new insight into which states are “substantially
reporting,” it is possible that even those states chosen may not have achieved the benchmark goal of
70% reporting. However, the process does establish a continuum of states, from low to high, of DIRT
reporting that reflects damages occurring in those states. Through the process, there was a general
consensus that sewer and water damages are under-reported everywhere, and natural gas and
telecommunications are fairly well represented.
Statistical Method The predictive model was built using data associated with the two cut-off levels (4 of 7 points and 4.5 of
7 points). Predictive models were developed independently for the 2015, 2016, and 2017 years. The
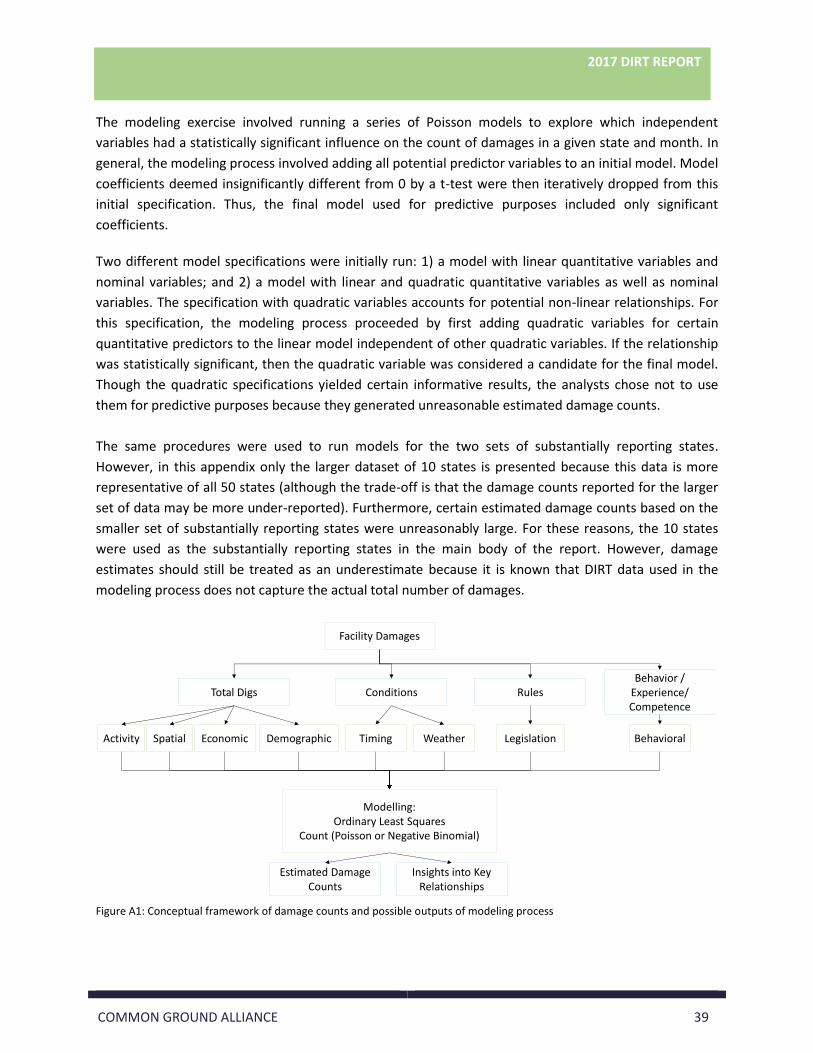
conceptual framework assumes that damages are broadly influenced by the total number of
excavations, conditions at the work site, rules governing excavation in the state, and
behavior/experience/competence (Figure A1). Data for the first three categories were available;
however, no data was available for behavioral/experience/competence factors.
A Poisson regression model, with standard errors adjusted for the panel data structure, was used to
develop the predictive model. The Poisson regression is a generalized linear model that is typically used
to understand and model count data, such as the number of damage events in a state that is contained
within the DIRT database. This model yields estimates of the percentage change in damages given a
range of independent (or explanatory) variables.
2017 DIRT REPORT
COMMON GROUND ALLIANCE 39
The modeling exercise involved running a series of Poisson models to explore which independent
variables had a statistically significant influence on the count of damages in a given state and month. In
general, the modeling process involved adding all potential predictor variables to an initial model. Model
coefficients deemed insignificantly different from 0 by a t-test were then iteratively dropped from this
initial specification. Thus, the final model used for predictive purposes included only significant
coefficients.
Two different model specifications were initially run: 1) a model with linear quantitative variables and
nominal variables; and 2) a model with linear and quadratic quantitative variables as well as nominal
variables. The specification with quadratic variables accounts for potential non-linear relationships. For
this specification, the modeling process proceeded by first adding quadratic variables for certain
quantitative predictors to the linear model independent of other quadratic variables. If the relationship
was statistically significant, then the quadratic variable was considered a candidate for the final model.
Though the quadratic specifications yielded certain informative results, the analysts chose not to use
them for predictive purposes because they generated unreasonable estimated damage counts.
The same procedures were used to run models for the two sets of substantially reporting states.
However, in this appendix only the larger dataset of 10 states is presented because this data is more
representative of all 50 states (although the trade-off is that the damage counts reported for the larger
set of data may be more under-reported). Furthermore, certain estimated damage counts based on the
smaller set of substantially reporting states were unreasonably large. For these reasons, the 10 states
were used as the substantially reporting states in the main body of the report. However, damage
estimates should still be treated as an underestimate because it is known that DIRT data used in the
modeling process does not capture the actual total number of damages.
Figure A1: Conceptual framework of damage counts and possible outputs of modeling process
2017 DIRT REPORT
COMMON GROUND ALLIANCE 40
Data The dependent variable in the model is the weighted damage count, rounded to the nearest integer.
The dependent variable in the model is structured such that each observation represents the number of
facility damages in a particular state s and month t. The potential independent variables representing
each data category in Figure A1 are summarized in Table A2. The analysts made efforts to match the
resolution of each independent variable to that of the dependent variable. However not all data was
available on a monthly basis. For the final set of independent variables, the analysts attempted to focus
on variables representing activity rather than value (e.g., number of building permits rather than the
value of permits, or employment in an industry instead of its gross domestic product).
Table A2 - Variables considered (Type categories correspond to those in conceptual model)
Type Variable
Activity
▪ Total construction spending in state by month ▪ Construction employment in state by month (total and per capita) ▪ Outgoing transmissions from one call center(s) in state in the yeara ▪ Total residential unit construction in state by month ▪ Gross domestic product for construction by state and month (per capita and total) ▪ Gross domestic product for utilities by state and month (per capita and total)
Weatherb ▪ Mean precipitation in state by month ▪ Mean temperature in state by month
Time
▪ Rough indicators of season (Winter: Jan, Feb, Mar; Spring: Apr, May, Jun; Summer: Jul, Aug, Sep; Fall: Oct, Nov, Dec) ▪ Aggregate of rough indicators of season corresponding to spring and summer versus fall and winter (cannot enter model at same time as other season indicator variables)
Population ▪ Total population in state (2017) ▪ Population change from 2016 to 2017 ▪ Population density in state (2017)
Legislation ▪ Tolerance zone in inches ▪ Hand dig, vacuum, or soft excavation within tolerance zone (hand dig clause)
Spatial ▪ Area of state in kilometersc
Economic
▪ Unemployment rate in state by month ▪ Total employment in state by month ▪ Gross domestic product for all industries by state and month
a Transmissions were not reported for certain states. In these cases, a model was developed to impute the missing
observations. Transmissions for certain other states were only partially reported. To be conservative, the analysts
did not impute these observations. b Weather data were available from the NOAA National Climatic Data Center for all states except Hawaii. For
Hawaii, the analysts estimated mean monthly temperature and precipitation using data from the state’s weather
stations. c The area variable was causing unrealistic estimated damage counts for the state of Alaska in certain models, so
this variable was dropped from the analysis.
2017 DIRT REPORT
COMMON GROUND ALLIANCE 41
Before running the models, variance inflation factors (VIFs) were calculated and used to check for high
correlation between independent variables, a situation known as multi-collinearity that affects the
interpretation of coefficients and can impact predictions based on the model. The VIFs indicated that
multi-collinearity is a problem when all independent variables are included (Table A3). Variables with
the highest VIF scores were iteratively dropped.
Table A3: Checking for multicollinearity variance inflation factorsa
Variable 2017 2016 2015
Initial Reduced Initial Reduced Initial Reduced
Population 17,239 15,517 21,189
Employment 14,521 16,245 25,784
Construction employment 641 936 1,995
Population change 71 232 5 385
Construction employment per capita 62 2 74 85.72 5
The analysts used a rule of thumb of a VIF score of 10 as a cut-off value for when to stop dropping variables. Although there were still some issues after removing the most collinear variables, multicollinearity was much less of an issue. Note that different sets of data have different issues with collinearity, so the same set of variables was not used for each year.
Results
Table A4: Regression results for the final count models of facility damages
***, **, * the coefficient is significantly different from 0 at the 99%, 95%, and 90% levels of significance,
respectively a Coefficient with the corresponding robust standard errors in brackets
2017 DIRT REPORT
COMMON GROUND ALLIANCE 43
Table A4 presents the best models for the top 10 substantially reporting states for the 2015, 2016, and
2017 data. Model fit, as indicated by the pseudo R2 measure, was best for 2016, followed closely by
2015 and then more distantly 2017. For 2017, the models suggest that damages increase with increases
in outgoing transmissions and the mean monthly temperature for the state—there are fewer damages
in spring and summer relative to fall and winter. For 2016, the models indicate that damages increase
with outgoing transmissions and the mean monthly temperature for the state (similar to 2017).
However, for 2016, the results suggest that damages decrease with population declines (from 2015 to
2016), are lower for spring and summer relative to fall and winter, and are lower for states with a hand
dig clause. In terms of 2015, the model suggests that damages increase with the total amount of money
spent on construction, outgoing transmissions, and mean monthly temperature in the state. Conversely,
damages in 2016 are lower in states with higher population density and higher per capita employment
in construction and in states with a hand dig clause. These results are largely expected. For instance, it is
sensible that damages increase with outgoing transmissions because transmissions reflect dig activity; or
that damages decrease during the spring and summer months because excavating conditions are likely
better in this period relative to fall and winter. While this may seem counter to the calendar heat map,
note that the calendar is highlighting that more damages happen in the summer, which is largely
because there is more activity in the summer. The regression model, in contrast, is examining the
relationship between variables holding all other variables constant. In other words, holding activity
constant, there are fewer damages during the spring and summer. The negative coefficients observed
for population change and construction employment per capita in the 2016 and 2015 models,
respectively, are not expected.
Using these regression results, all other state total damages can be estimated by applying the value of
each variable from each state and then aggregating to estimate total U.S. damages (Table A5). This
process assumes that reported damages in the defined substantially reporting states approximate total
actual damages in those states and that the estimated relationships in Table A4 hold for the states not
included in these models. Though there is variation from year to year, the estimated damages are not
terribly different from 2015 to 2017.
Table A5: Estimated damage counts for the united states (top 10 states), rounded to the nearest 1,000
Year Estimated Total U.S. Damages
2017 439,000
2016 416,000
2015 378,000
2017 DIRT REPORT
COMMON GROUND ALLIANCE 44
To examine the strength of the relationship between the data for the substantially reporting states and
the broader DIRT database, the substantially reporting state dataset was compared with the broader
database for a number of key variables. Results of that examination are presented below for reporting
stakeholders, root cause, excavator type, and facilities damaged. In general, the examination revealed
that the substantially reporting state dataset is a strong representation of the larger DIRT database.
Reporting Stakeholder for Substantially Reporting States Table A6 illustrates the percentage of reported damages for all states in relation to those for the
substantially reporting states. The data exhibits a high degree of alignment between all states and the
substantially reporting states. In both cases, Locator, Natural Gas, and Excavator are the dominant
reporting stakeholders.
Table A6 – Reported damages for all states in relation to the substantially reporting states, 2017
Reporting Stakeholder Percentage of Reported
Damages—All States
Percentage of Reported
Damages—Substantially
Reporting States
One Call 3.18 0.00
Electric 0.52 0.38
Engineer/Design 0.00 0.00
Excavator 10.87 12.32
Insurance 0.00 0.00
Liquid Pipeline 0.15 0.20
Locator 64.67 66.08
Equipment Manufacturer 0.00 0.00
Natural Gas 14.27 13.63
Private Water 0.02 0.01
Public Works 0.30 0.30
Railroad 0.00 0.00
Federal State/Regulator 2.07 2.98
Road Builders 0.02 0.02
Telecommunications 3.47 4.00
Unknown/Other 0.47 0.07
2017 DIRT REPORT
COMMON GROUND ALLIANCE 45
Root Cause for Substantially Reporting States Root cause data for the substantially reporting states is presented in Table A7 along with root cause
data for all states. As was the case with the reporting stakeholder data, the root cause data for the
substantially reporting states is a strong representation of the dataset for all states. The percentage of
damages attributed to any given root cause for all states is comparable to that for the substantially
reporting states.
Table A7 – Root cause for all states in relation to the substantially reporting states, 2017
Root Cause Group Percentage of Reported
Damages—All states
Percentage of Reported
Damages—Substantially
Reporting States
Excavation Practices Not Sufficient 52.3 53.7
Notification Not Made 24.5 22.8
Notification Practices Not Sufficient 0.99 0.99
Locating Practices Not Sufficient 16.8 16.7
Miscellaneous 5.39 5.8
Excavator Type for Substantially Reporting States Table A8 presents excavator type data for all states in relation to the same data for the substantially reporting states. Here again, the distribution of damages across excavator types for the substantially reporting states is consistent with that for all states.
Table A8 – Excavator type for all states in relation to the substantially reporting states, 2017
Excavator Types Percentage of Reported
Damages—All states
Percentage of Reported
Damages—Substantially
Reporting States
Contractor 31.85 28.12
County 0.92 0.78
Developer 1.16 1.15
Farmer 0.10 0.06
Municipality 2.61 2.42
Occupant 2.74 1.93
Railroad 0.01 0.02
State 0.16 0.11
Unknown/Other 54.20 58.93
Utility 6.24 6.48
2017 DIRT REPORT
COMMON GROUND ALLIANCE 46
Facilities Damaged for Substantially Reporting States Table A9 considers facilities damaged for substantially reporting states in relation to that for all states,
demonstrating once again the strong alignment between the two datasets. In both cases, the majority of
damages occur to Telecommunications and Natural Gas.
Table A9—Facilities damaged for all states in relation to the substantially reporting states, 2017
Facilities Damaged Percentage of Reported
Damages—All states
Percentage of Reported
Damages—Substantially
Reporting States
Cable Television 10.45 10.20
Electric 8.12 7.73
Liquid Pipeline 0.05 0.05
Natural Gas 26.58 20.68
Sewer 0.24 0.36
Steam 0.00 0.00
Telecommunications 46.64 50.67
Unknown/Other 5.38 7.20
Water 2.54 3.10
2017 DIRT REPORT
COMMON GROUND ALLIANCE 47
APPENDIX B:
DAMAGES BY REPORTING STAKEHOLDER Table B1—Reported damages by reporting stakeholder, complete dataset, 2017
Reporting Stakeholder Reported Damages
Reported
Damages
Percentage of Total
One Call 6,281 1.98
Electric 4,096 1.29
Engineer/Design 9 0.00
Excavator 22,280 7.04
Insurance 13 0.00
Liquid Pipeline 545 0.17
Locator 207,587 65.60
Equipment Manufacturer 1 0.00
Natural Gas 52,233 16.51
Private Water 154 0.05
Public Works 1,353 0.43
Railroad 4 0.00
Federal State/Regulator 3,442 1.09
Road Builders 60 0.02
Telecommunications 16,702 5.28
Unknown/Other 1,684 0.53
Total Damages 316,444
2017 DIRT REPORT
COMMON GROUND ALLIANCE 48
APPENDIX C: GROUPINGS USED IN REPORT Table C1—Root cause groupings used in this report
Group Root Cause
Excavation practices not sufficient
Marks faded or not maintained
Failure to maintain clearance
Failure to use hand tools where required
Excavator dug prior to verifying marks by test hole (pothole)
Excavator failed to protect/shore support facilities
Improper backfilling practices
Other excavation practices not sufficient
Locating Practices Not Sufficient
Facility was not located or marked
Facility marking or location not sufficient
Incorrect facility records/maps
Facility could not be found/located
Unknown
Data not collected
Other
Miscellaneous
One call center error
Deteriorated facility
Abandoned facility
Previous damage
Notification Practices Not
Sufficient
Wrong information provided
Notification to one call center made but not sufficient
Notification Not made No notification made to one call center/811
2017 DIRT REPORT
COMMON GROUND ALLIANCE 49
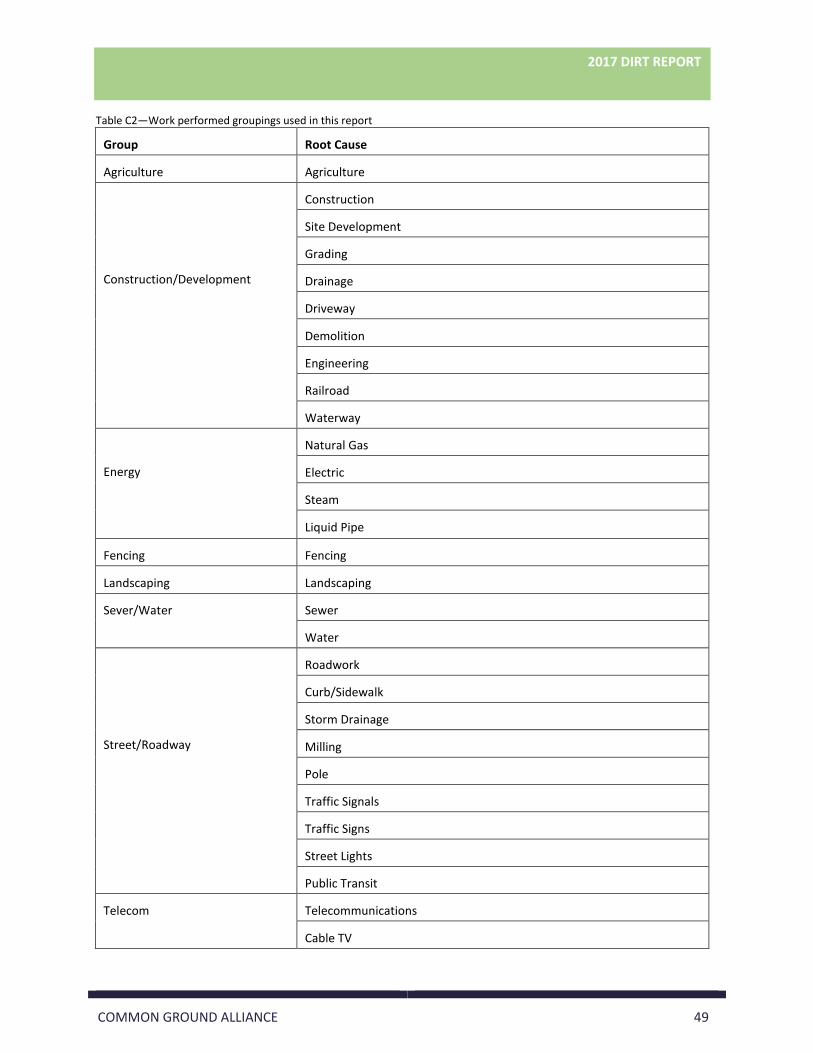
Table C2—Work performed groupings used in this report
Group Root Cause
Agriculture Agriculture
Construction/Development
Construction
Site Development
Grading
Drainage
Driveway
Demolition
Engineering
Railroad
Waterway
Energy
Natural Gas
Electric
Steam
Liquid Pipe
Fencing Fencing
Landscaping Landscaping
Sever/Water Sewer
Water
Street/Roadway
Roadwork
Curb/Sidewalk
Storm Drainage
Milling
Pole
Traffic Signals
Traffic Signs
Street Lights
Public Transit
Telecom Telecommunications
Cable TV
2017 DIRT REPORT
COMMON GROUND ALLIANCE 50
APPENDIX D: EXCAVATION INFORMATION Table D1—Top 20 combinations of excavator, work performed, and equipment used, including unknown data, in Canada and
the U.S., 2017
Excavator Work Performed Equipment Used Unique Damages