2017 Ethics & Compliance Hotline & Incident Management Benchmark Report Benchmark Your Program Against the World’s Largest Ethics & Compliance Hotline and Incident Management Database—and Enhance Your Program Effectiveness
Transcript
2017 Ethics & Compliance Hotline & Incident Management Benchmark ReportBenchmark Your Program Against the World’s Largest Ethics & Compliance Hotline and Incident Management Database—and Enhance Your Program Effectiveness
REPORT PREPARED BY:
Carrie Penman
Chief Compliance Officer and SVP, Advisory Services, NAVEX Global
Edwin O’Mara
Operations Manager, Advisory Services, NAVEX Global
CONTENTSINTRODUCTION 1
HOW WE CALCULATE OUR BENCHMARKS 2
STATISTICAL SNAPSHOT OF THE NAVEX GLOBAL DATABASE 3
EXECUTIVE SUMMARY 5
KEY FINDINGS 7
1) Report Volume per 100 Employees 8
2) Report Allegation Categories 12
3) Anonymous vs. Named Reporters 16
4) Reporter Follow-Up Rate to Anonymous Reports 17
5) Substantiated Reports 18
6) Case Closure Time 21
7) Reporting Intake Method and Substantiation 23
8) Reports of Retaliation 25
9) Geographical Data 27
10) Data Based on Organizational Employee Count 29
CONCLUSION 34
ABOUT NAVEX GLOBAL 36
ABOUT THE AUTHORS 37
1 NAVEX Global | The Ethics and Compliance Experts
INTRODUCTIONGood analysis and benchmarking of hotline data helps organizations answer crucial questions about their ethics and compliance program, including:
△ Does our culture support employees who raise concerns?
△ Are our communications with employees reaching the intended audiences and having the desired effect?
△ Are our investigations thorough and effective?
△ Do we need more training?
△ Do we need to review or update our policies?
△ Do employees know about our reporting channels?
Comparing internal data year over year to help answer these questions is important. But getting a broader perspective on how your performance matches up to industry norms is critical.
To help, each year NAVEX Global takes anonymized data collected through our hotline and incident management systems and creates this report. Because we have the world’s largest and most comprehensive database of reports and recorded outcomes, ethics and compliance
professionals can trust our benchmarks to help guide decision making and better understand how their programs stack up against broader benchmarks.
For each benchmark provided in this report, you will find:
△ A description of the benchmark
△ Instructions on how to calculate the benchmark
△ The 2016 combined data for all industries in the NAVEX Global database
△ Key findings and recommendations
This annual report is an excellent starting point for organizations committed to benchmarking and improving program effectiveness. To leverage more advanced benchmarks, NAVEX Global offers custom benchmarking options as part of our Integrity Diagnostics™ report services. You can work with us to get apples-to-apples benchmarking based on industry, size or other facets of your organization. Learn more about this service on our website.
NAVEX Global’s comprehensive suite of ethics and compliance software, content and services helps organizations protect their people, reputation and bottom line. Trusted by 95 of the FORTUNE 100 and more than 12,500 clients, our solutions are informed by the largest ethics and compliance community in the world.
2 NAVEX Global | The Ethics and Compliance Experts
HOW WE CALCULATE OUR BENCHMARKSFor statistical accuracy, our analysis includes only those organizations that received 10 or more reports in 2016. The resulting database includes 2,382 clients that received a total of 927,338 individual reports. These reports represent 99 percent of our total report database in 2016.
To remove the impact of outliers that might skew the overall reporting data, we carefully calculated benchmarks for each organization and then identified the median (midpoint) across the total population. This reporting methodology allows us to create a clearer picture of what is happening in our clients’ organizations, as well as to provide you with benchmarking data that is not skewed by organizational size.
That said, there are no “right” metrics in hotline benchmarking data. Where appropriate in this report, we include what we consider to be a healthy range of results to provide context for your own data. Falling within the “normal” range indicates an organization is on par with medians for the organizations within our database. Falling outside the normal range, in either direction, is a good prompt to take a closer look at whether or not there is an issue that needs more attention at your organization.
5,132 clients used our hotline/incident management systems
2,382 clients received 10 or more reports in 2016 representing
WORLD’S LARGEST DATABASE OF REPORTSSTARTS WITH 12,500 NAVEX GLOBAL CLIENTS
38.5 million employees
Methodology: By the Numbers
web hotline open door email
Our report reflects all intake methods:
Over the last five years, we have analyzed 3.6 million reports
Our data covers 26 industries and an additional 45 sub-industries
generating nearly 1 million reports in 2016
Health Care
Industrial ManufacturingFinance & Insurance
Education
Retail
Energy & Utilities
Business Support Services
Not for ProfitConsumer
Manufacturing Food Services
Arts & Entertainment
Commercial Transportation Construction
Professional, Scientific &
Technical Services
Pharmaceuticals
Government
Mining
Automotive Transportation
Computer Services, Hardware & SoftwareMedia
Our Database Includes Reports From All Around the World
Sample of Included Industries
Most Statistically Accurate Approach
We calculate ranges to help identify extreme data points as potential areas of concern
We use Medians or Midpoints rather than averages to reduce the impact of outliers
Medians and ranges provide context for your individual benchmarks
5 NAVEX Global | The Ethics and Compliance Experts
This year’s analysis of our data from nearly 2,382 hotline and incident management clients revealed key data points that compliance professionals can use to benchmark and assess their program’s performance, and move toward predictive risk mitigation. Of note in the 2016 data:
△ There was another increase in overall Reporting Rate per 100 Employees in 2016. Over the last seven years, we have seen a significant rise in the reporting rate—a 56 percent increase since 2010. The reporting rate rose in 2016 to a median of 1.4 reports per 100 employees after two years at 1.3 reports per 100 employees. The consistent and steady increase over the last seven years indicates that this higher level is the new norm and that organizations need to be prepared to investigate and manage the higher level of total reports.
△ Case Closure Time improved but still remains over 40 days. Prior to this year, the median company’s Case Closure Time had been continuously increasing, climbing from 32 days in 2011 to 46 days in 2015. Case Closure Time in 2016 decreased by four days over the prior year to 42 days. This represents a nine percent decrease in case closure time over last year. This is significant given that the overall median Reporting Rate increased again this year. This could mean that organizations are applying additional resources to address the volume of reports they are now consistently receiving.
△ The Substantiation Rate of reports received via “All Other Methods” (including emails and open door) was significantly higher than reports received via hotline and web. Reports received via “All Other Methods” were substantiated at a significantly higher rate than those received via both the hotline and web. And while over one-third of the hotline and web reports are substantiated, and therefore are critical reports, this finding highlights the importance of also documenting reports received from all sources to better understand the full spectrum of issues that may be occurring in the organization.
△ The rate of Reports of Retaliation is still less than one percent of all reports. Since 2011 we have seen the rate of Reports of Retaliation increase from 0.52 percent to 0.93 percent of the reports in our database. However, it is important to note this is still less than one percent of all reports organizations received internally. When compared to the number of reports of retaliation that are going to outside agencies, organizations are still not getting the opportunity to address a claim of potential retaliation before it is reported externally.
△ Substantiation Rates for Reports of Retaliation remained steady at 26 percent, which is still well below the overall Substantiation Rates for all reports at 40 percent. Over the previous two reports, we highlighted that substantiation
EXECUTIVE SUMMARY
6 NAVEX Global | The Ethics and Compliance Experts
rates for reports of retaliation rose from 12 percent to 27 percent in 2014 and then stayed at a higher level with 26 percent substantiated in 2015. We were not sure if this was accurate or an anomaly. Based on this year’s finding of a 26 percent substantiation rate, we are more confident that these findings are accurate and that this higher level of substantiation rate is more likely a new norm.
△ New geographic data by continent was calculated with some interesting findings.
• Not surprisingly, the highest volume of reports by far originated from North America (82%), Asia was second, South America was third and Europe was fourth. Africa, followed by Australia, had the lowest volume.
• The highest substantiation rate came from reports originating in Europe.
• The highest percent of anonymous reports originated from Europe.
△ The Median Report Volume by organizational size ranges from 0.9 to 1.6 but not in a way we would have expected. Organizations with less than 1000 employees have a median reporting rate of 1.0 reports per 100 employees, indicating that small companies do get reports. And, smaller organizations have higher Rates of Anonymous Reporting but also higher overall Substantiation Rates, indicating that reporting systems are valuable and necessary for organizations of all sizes.
As ethics and compliance programs continue to mature, these data points should be part of an organization’s scorecard to demonstrate return on investment (ROI). In addition, we hope this data will assist the organization in moving toward the goal of taking proactive, rather than reactive, actions and helping strengthen their organization’s culture of ethics and respect.
NEW THIS YEAR △ Substantiation rate by intake method
△ Data from our European servers included into a single, comprehensive global report
An Increase in Reporting RateReport Volume per 100 Employees is a volume metric that enables organizations of all sizes to compare their total number of unique contacts from all reporting channels including web forms, hotline, open door, mobile, email, mail and more.
How to Calculate: Take the total number of unique contacts (incident reports, allegations and specific policy inquiry questions) from all reporting channels received during the period, divide that number by the number of employees in your organization and multiply the result by 100.
1. Report Volume per 100 Employees
How Does Your Report Volume Compare to Others?
0 1 2 3 4 5 6 7 8 9 10 11 12
2016
2015
2014
2013
2012
2011 6.00.2 0.9
4.90.4 1.2
4.00.5 1.2
8.30.3 1.3
10.30.3 1.3
10.00.3 1.4
Range (reports per 100 employees) Median (reports per 100 employees)
Findings: Over the last seven years, we have seen a significant rise in the reporting rate—a 56 percent increase since 2010. The reporting rate rose in 2016 to a median of 1.4 reports per 100 employees after two years at 1.3 reports per 100 employees. The consistent and steady increase over the last seven years indicates that this higher level is the new norm and that organizations need to be prepared to investigate and manage the higher level of total reports.
This elevated level of reporting may be attributed to a number of possible trends:
△ Increased use of incident management tools to capture all reports—not just phone and web-based reports.
△ Employee confidence that reporting will make a difference in their organizations.
△ Maturing ethics and compliance programs mean more employees recognize the need to report issues, and know how to do so.
△ More media attention—and therefore employee awareness —of workplace rights, whistleblower protections, lawsuits and awards.
In 2016, the central 80 percent range of reports per 100 employees narrowed slightly over the previous year, with 10.0 reports at the high end, compared to 10.3 in 2015, continuing to indicate that organizations capture more reports by documenting from multiple intake methods. (See next section for more data on this.)
Impact of Using a Unified Incident Management System on Total Volume of ReportsOrganizations that Capture Hotline and Web Reports Only are Missing Critical Data
Over the last several years, we have looked to determine whether the higher levels of Report Volume per 100 Employees were influenced by organizations that use their incident management systems in a more robust way to enter and track reports they receive from all reporting channels (including open door, email, mail and more)—not just reports from their hotline or web intake channels.
How to Calculate: There are two distinct groups in this calculation. The first group is clients who have an incident management system connected to their web and/or hotline reporting channels only. The second group represents clients who have their incident management system connected to all their reporting channels—web, hotline, and all other channels (could include open door reports, manager submissions, letters and direct emails).
Calculate your metric by determining which group you fall into, then use the same Report Volume per 100 Employees calculation as described previously.
Organizations That Track only Reports from Web and Hotline
Organizations That Track Reports from All Sources
0 1 2 3 4 5 6 7 8 9 10 11 12
20160.3 1.2 6.9
Range (reports per 100 employees) Median (reports per 100 employees)
0 1 2 3 4 5 6 7 8 9 10 11 12 13 14 15
2016 0.4 1.9 14.6
Range (reports per 100 employees) Median (reports per 100 employees)
Findings: Organizations that documented reports from all channels in their incident management system captured 58 percent more reports than organizations that documented reports made through web and hotline channels only.
The implications are significant. If you are only collecting reports through your hotline and basic web forms, you are missing a significant percentage of the reports already being made in your organization but not being documented. This means you are missing the opportunity to spot trends and proactively address issues occurring in your organization.
We continue to encourage organizations to collect reports from all intake methods in a centralized incident management system. Doing so significantly increases the visibility into reported issues and risks. It also provides a more disciplined, systematic method for tracking, investigating, analyzing and resolving these issues. Finally, as additional functional groups, such as Human Resources and Security, begin to capture reports raised directly to their teams in a separate tier of the same incident management system, reports can be run at a higher level that will begin to provide a more holistic view of issues raised across the whole organization. With more data captured, issues that appear to be a “one-off” for one department can become part of a trend when combined with reports from multiple departments.
Percentages Remain ConsistentThe kinds of reports an organization receives are an indicator of program effectiveness. Categorizing reports and tracking the number of reports in each category can help reveal program gaps—and successes. We’ve organized our report data into five primary allegation categories. This gives us a way to compare (at a high level) the types of reports that different organizations and industries receive. The categories are:
2. Business Integrity (i.e. bribery, falsification of documents, fraud, COI, vendor/customer issues, HIPAA)
3. HR, Diversity and Workplace Respect (i.e. discrimination, harassment, retaliation, compensation, general HR, and cases marked as “other”)
4. Environment, Health and Safety (i.e. EPA compliance, assault, safety, OSHA, substance abuse)
5. Misuse, Misappropriation of Corporate Assets (i.e. employee theft, time clock abuse)
How to Calculate: First, ensure that each report is placed into one of the five report allegation categories. Then, divide the number of reports in each of the five categories by the total number of reports created during the reporting period.
Findings: Despite significant increases in Report Volumes per 100 Employees and the changing intake methods over the last five years, the percentage breakdowns in report categorizations have remained roughly the same. As is always the case, the majority of all reports received fall into the HR, Diversity and Workplace Respect category and this percentage continues to fluctuate within the 69 percent to 73 percent range. In 2016, the
percentage of these reports was 72 percent. For additional insights into the breakdown of HR related reports, we calculated the reports related specifically to Discrimination and Harassment—these reports were 11 percent of all HR related reports.
Industries with the Highest Median Reporting Rate per Allegation CategoryWe reviewed the data to determine which industries received the highest rate of reporting in each allegation category.
Findings: The health care industry once again received the highest number of Business Integrity-related reports—this is likely due to the inclusion of HIPAA-related reports in this category. The retail industry had the highest level of HR, Diversity and Workplace Respect reports this year, exceeding the overall median rate by eight percentage points.
Reporter Allegations vs. InquiriesThis metric helps organizations answer the question: Are employees using ethics and compliance reporting channels to report allegations or ask questions?
Findings: The ratio of allegations vs. inquiries in the databases has generally been split around 80 percent allegations and 20 percent inquiries over the last few years. This year, 83 percent of the cases were allegations up from 78 percent in 2015. This indicates an opportunity for companies
to encourage their employees to see their hotline also as a resource for seeking information, rather than just a channel for reporting. In addition, tracking both inquiries and allegations received directly (i.e. in-person or direct email) in the incident management system will provide a better understanding of the types of questions the organization is routinely receiving which will enable better decision-making on additional training and communications needs.
Anonymous Reporting Continues to DecreaseAnonymous Report metrics show the percentage of all reports submitted by individuals who chose to withhold their identity.
How to Calculate: Divide the number of reports submitted by a reporter who withheld their identity by the total number of contacts received.
Findings: In the last eight years, we have seen a slow but steady decrease in the rate of Anonymous Reports from the 2009 peak rate of 65 percent. A lower rate of anonymous reporting is an indicator of trust in the system and the people who manage it. After two consecutive years below 60 percent, we will be watching this rate next year to see if it continues to decrease or if this is just statistical fluctuation around the 60 percent mark. A few potential reasons for this downward trend are:
△ More organizations are tracking reports from all sources and using manager report forms as well as documenting “open door” reports in the system. In these cases, the name of the reporter is more likely to be known and could influence the rate of Anonymous Reports.
△ With the increase in external whistleblower payments (and the publicity surrounding these payments), reporters may be including their name more frequently in the event they ultimately believe they need to report the issue to a government agency or to ensure they are protected from retaliation.
△ The Anonymous Report rate may have increased during the economic recession period because employees were more fearful for their jobs. With a more stable economy, employees may be feeling more secure.
△ Reporters may be feeling more protected from retaliation with all of the recent legislation and focus on whistleblower protections, therefore more willing to disclose their identity.
No Change in Follow-Up RateEffective hotline/helpline programs encourage anonymous reporters to check back in (anonymously) on the status of their report. If more information is needed to investigate a claim, ethics and compliance officers must be able to reach out, through the anonymized reporting interface, to ask questions or get clarification. The Reporter Follow-up Rate to Anonymous Reports metric indicates the percentage of reports that were submitted anonymously and that were subsequently followed-up on by the reporter.
How to Calculate: Divide the number of anonymous reports with one or more follow-up case visits by the total number of anonymous reports. (Note that we do not include multiple follow-ups to the same report. We only calculate based on the first follow-up to an anonymous report.)
Findings: The Reporter Follow-Up Rate to Anonymous Reports remains generally flat at around 30 percent—a disappointing result. We believe that if more anonymous reporters would follow-up and respond to posted questions relating to the investigation, the rate of Substantiated Anonymous Reports would increase.
We continue to encourage organizations to educate employees on all of the steps required for successful anonymous reporting—including the critical responsibility to check back on their report and provide the reasons why checking back is important. If employees have been well trained on this process, a lack of follow-up could be a red-flag indicator about the culture.
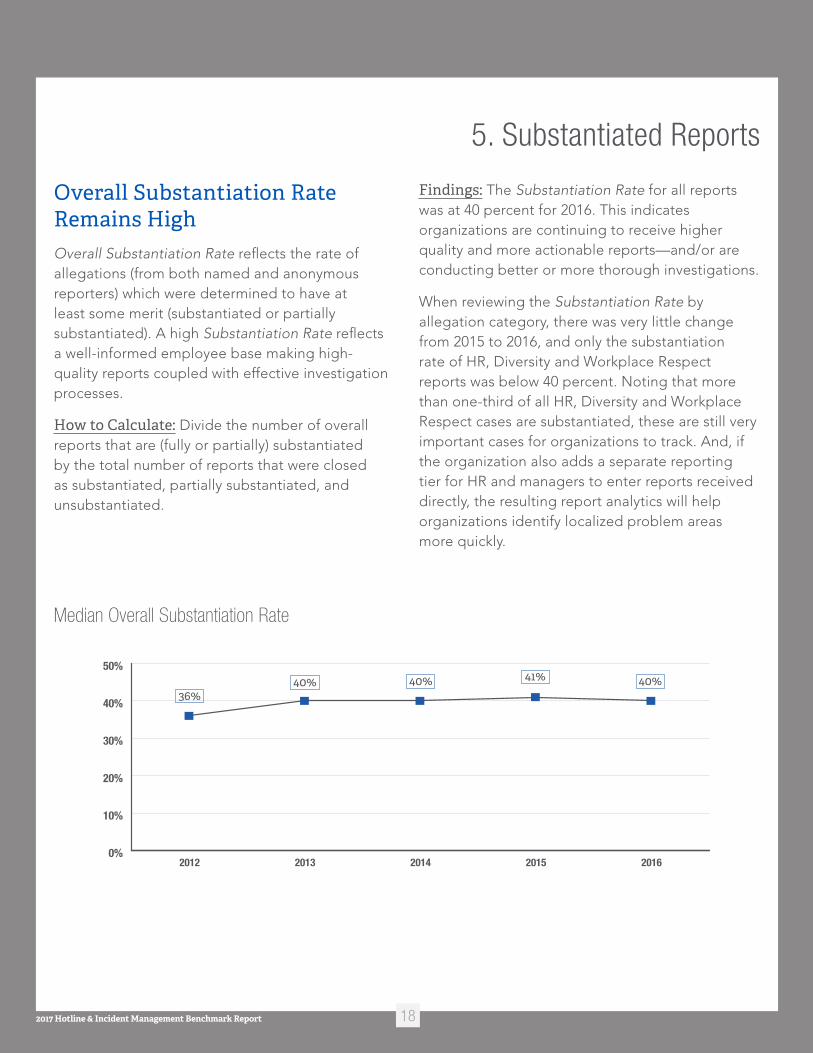
Overall Substantiation Rate Remains HighOverall Substantiation Rate reflects the rate of allegations (from both named and anonymous reporters) which were determined to have at least some merit (substantiated or partially substantiated). A high Substantiation Rate reflects a well-informed employee base making high-quality reports coupled with effective investigation processes.
How to Calculate: Divide the number of overall reports that are (fully or partially) substantiated by the total number of reports that were closed as substantiated, partially substantiated, and unsubstantiated.
Findings: The Substantiation Rate for all reports was at 40 percent for 2016. This indicates organizations are continuing to receive higher quality and more actionable reports—and/or are conducting better or more thorough investigations.
When reviewing the Substantiation Rate by allegation category, there was very little change from 2015 to 2016, and only the substantiation rate of HR, Diversity and Workplace Respect reports was below 40 percent. Noting that more than one-third of all HR, Diversity and Workplace Respect cases are substantiated, these are still very important cases for organizations to track. And, if the organization also adds a separate reporting tier for HR and managers to enter reports received directly, the resulting report analytics will help organizations identify localized problem areas more quickly.
Substantiated Anonymous vs. Named ReportsA bias can exist among senior leaders and board members against the acceptance or validity of anonymous reports. However, research has shown that names are withheld typically out of fear of retaliation or a desire to not be involved—not because the issue reported is deliberately false or frivolous. As noted in the section on Reporter Follow-up Rate to Anonymous Reports, the fact that investigators may be unable to get the information they need to follow up on anonymous reports may also explain some of the gap between substantiation rates for “named” and “anonymous” reports.
How to Calculate Substantiated Anonymous Reports: Divide the number of anonymous reports that are (fully or partially) substantiated by the total number of reports that were closed as substantiated, partially substantiated and unsubstantiated.
How to Calculate Substantiated Named Reports: Divide the number of reports from named reporters that are (fully or partially) substantiated by the total number of reports that were closed as substantiated, partially substantiated and unsubstantiated.
Findings: Over one-third of the anonymous reports continue to be substantiated indicating that these are valuable reports for organizations. As discussed earlier in this report, continued focus on increasing follow-ups to anonymous reports could increase the Substantiation Rate of Anonymous Reports, because investigators would have a higher probability of obtaining responses to posted questions. As we will show later in this report, this is particularly important for those anonymous reporters who have filed their report via a web submission or via some other method.
From a substantiation perspective, it is encouraging to see that the rate of anonymous reports has been decreasing. This will allow for more reports with a higher potential rate of substantiation. Named reports allow investigators to gather information directly from the reporter, which can help to improve the effectiveness of an investigation.
Comparison of Substantiation Rates between Anonymous and Named Reporters
0%
10%
20%
30%
40%
50%
2016201520142013201220112010
Anonymous Substantiation Rate Named Substantiation Rate
Improvement in 2016Case Closure Time is the number of calendar (not business) days it takes an organization to complete an investigation and close a case. To earn employees’ trust and ensure that they know their concerns are important and are being seriously considered, it is vital that organizations complete investigations in a timely fashion. If months go by without a case being resolved, reporters will conclude that the company is not listening and not taking action which could be detrimental to an organization on a number of levels.
How to Calculate: First calculate the number of days between the date a case is received and the date it is marked closed. Calculate for each case closed during the reporting period. (Calculating the rate based on case open date will skew the data toward shorter closure times, making the result less accurate). Then, calculate the case closure time by dividing the sum of all case closure times by the number of cases closed in the reporting period.
6. Case Closure Time
32
0 10 20 30 40 50
2016
2015
2014
2013
2012
2011
34
36
39
46
42
Days
Findings: Prior to this year, the median company’s Case Closure Time had been continuously increasing, climbing from 32 days in 2011 to 46 days in 2015. Case Closure Time in 2016 decreased by four days over the prior year to 42 days. This represents a nine percent decrease in case closure time over last year. This is significant given that the overall median reporting rate increased again this year. This could mean that organizations are applying additional resources to address the volume of reports they are now consistently receiving.
The metric is also important given that, under certain agency whistleblower provisions, an organization will have limited time to complete an internal investigation. Organizations that significantly or consistently exceed an average 30 day Case Closure Time are encouraged to review their case handling and investigation procedures and to review with senior leadership any gaps in available resources that need to be addressed. A breakdown of Case Closure Times by Report Category is provided.
Findings: Case Closure Time by report category shows that there has been a slight decrease in case closure time for four of the five categories. Of specific concern, however, is that allegations of Accounting, Auditing and Financial Reporting are still taking a median of 54 days to close—meaning that half of these cases are taking even longer. At 54 days, organizations are approaching the halfway point to the 120-day opportunity for an employee to also report directly to the SEC.
On a positive note, there was a significant (six day) decrease in closure time for HR, Diversity and Workplace Respect cases to 41 days. This is an important change but there is still further opportunity to improve—having a workplace issue fester for over 40 days can be damaging to morale and operating success.
Small Changes in the Overall Mix But “All Other Methods” has the Highest Rate of SubstantiationMonitoring the mix of reporting methods employees choose to use can provide insight into how aware employees are of their different reporting options and their comfort level with the available options.
Several factors impact intake method. First, multiple reporting channels should be made available to employees. Second, those channels need to be easily accessible to employees. And finally, employees need to be aware of all the channels available to them so that when they have a reporting need, they know where to go, what to do, and have one or more options available to them that they are comfortable using.
How to Calculate: Group all non-hotline and non-web report forms (like ethics office open door, email, postal mail, fax and manager submissions) as “All Other Methods,” and then tally up the number of reports received by each method and divide by the total number of reports. The resulting percentages represent how employees are choosing to report.
Findings: Results for 2016 showed little change from 2015 in the overall mix of intake methods with hotline (phone) submissions remaining steady, web reporting increasing by two percentage points and a decrease of two percentage points for “All Other Methods.” The top three methods in the “All Other Methods” were email, open door and report forms. One notable trend is the steady increase in web submissions over the last four years. This shift in reporting method is not surprising as the workforce continues to include more “millennials” who may be more likely to use a web-based tool.
Reporting Intake Method and Substantiation Continued
Report Intake Method Comparison*
Substantiation Rates by Report Intake MethodFor the first time this year, we calculated substantiation rates for each intake method.
How to Calculate: Identify and group each report by the intake method. Divide the number of overall, named and anonymous reports that are (fully or partially) substantiated by the total number of reports that were closed as substantiated, partially substantiated, and unsubstantiated. Repeat this calculation for each intake method.
Findings: As shown below, reports received via “All Other Methods” were substantiated at a significantly higher rate than those reports received via both the hotline and web. And while over one-third of the hotline and web reports are substantiated and therefore are critical reports, this data highlights the importance of also documenting reports received from all sources to better understand the full spectrum of issues that may be occurring in the organization.
Hotline Web Submission Other
0% 10% 20% 30% 40% 50%
Anonymous Reporter Substantiation by Intake Method
Named Reporter Substantiation by Intake Method
Overall Substantiation by Intake Method
35%
34%
46%
35%
37%
48%
35%
32%
39%
*Benchmark for this section includes only companies that track all intake methods in NAVEX Global’s EthicsPoint Incident Management systems.
Still Very Few Internal Reports of RetaliationDiscussion of retaliation issues by the ethics and compliance community, as well as by government agencies, continues at an intense level. And, while reports of potential retaliation filed with the Equal Employment Opportunity Commission (EEOC) and other government agencies indicate that retaliation
claims continue to rise, our data shows employees are still not using the hotline to report these concerns internally.
How to Calculate: Take the total number of reports made, and divide that by the total number of reports made with retaliation as the primary allegation.
Findings: Since 2011 we have seen the rate of Reports of Retaliation increase from 0.52 percent to 0.93 percent of the reports in our database. However, it is important to note this is still less than one percent of all reports organizations received internally. When compared to the number of reports of retaliation that are going to outside agencies, organizations are still not getting the opportunity to address a claim of potential retaliation.
Over the last two reports, we highlighted that substantiation rates for reports of retaliation rose from 12 percent to 27 percent in 2014 and then stayed at a higher level with 26 percent substantiated in 2015. We were not sure if this was accurate or an anomaly. Based on this year’s finding of a 26 percent substantiation rate, we are more confident that these findings are accurate and that this higher level of substantiation rate is more likely a new norm.
While the substantiation rate for retaliation claims is not yet close to the overall case substantiation rate of 40 percent, this improvement is encouraging. It indicates more employees are seeing their claims being taken seriously and may now be more likely to report internally than externally.
Retaliation continues to be a hot-button issue for regulatory agencies. First, the SEC Office of the Whistleblower (OWB) highlighted in its 2016 Annual Report to Congress on the Dodd-Frank Whistleblower Program, that “strong enforcement of the anti-retaliation protections is a critical
component of the SEC’s whistleblower program.” And, “protecting whistleblowers’ rights to report possible securities law violations to the Commission, and protecting whistleblowers from retaliation, was a focus for OWB in FY 2016 and will continue to be a priority in the coming fiscal year.”
Second, in January 2017, OSHA issued Recommended Practices for Anti-Retaliation Programs intended to assist employers in creating workplaces that are free of retaliation, including retaliation against employees who engage in activity protected under the 22 whistleblower laws that the Occupational Safety and Health Administration (OSHA) enforces. The guidance includes recommendations to implement retaliation response and monitoring systems and anti-retaliation training.
And finally, in August 2016, the U.S. Equal Employment Opportunity Commission (EEOC) issued its final Enforcement Guidance on Retaliation and Related Issues to replace its 1998 Compliance Manual section on retaliation. This is important given that data released by the EEOC showed that retaliation again was the most frequently filed charge of discrimination making up 45 percent of all private sector charges filed.
During the years that we have been publishing our reports, we have been asked to provide more data based on geographic region. This year we completed a deeper dive into this topic. While we are not able to calculate regional information for every metric we track, we were able to calculate several metrics that have provided some very interesting insights. The three data points included a breakdown of:
△ Report origination by geography
△ Anonymous reports by geography
△ Substantiation rates by geography—both named and anonymous
How to Calculate: First, identify the country location for each report, then categorize that country by continent. To determine the report dispersion, divide the total number of reports from each continent, by the total number of reports received. This calculation can be repeated for the anonymity and substantiation rates.
Findings: While it was not surprising to find that the highest percentage of reports by far originated from North America (82 percent), it was interesting to note that Asia was second, South America was third, and Europe was fourth. Africa, followed by Australia, had the lowest as shown in the chart below.
Much has been written and debated in Europe about the need for, and value of, whistleblower hotlines, and cultural concerns continue to be expressed about anonymous reporting. This context makes the data we found in these next two charts most interesting. While noting that the overall percentage of reports originating from Europe is low, the highest percent of Anonymous Reports originated from Europe and not North America. Further, the highest Substantiation Rate overall—and for anonymous reports separately—was for reports that originated in Europe.
Also for the first time this year, we analyzed our databases by organizational size—employee count. This data can help organizations further refine their specific benchmarking within their organizations. As we continue to analyze these demographic breakouts in coming years, we will be better able to track trends and provide more in depth findings within employee ranges. For 2016, the data points below are designed to provide some additional context for organizations.
How to Calculate: For each metric below, we grouped organizations by their employee count, and then calculated each metric in its standard fashion.
Findings: For context, the chart below shows the dispersion of total reports by employee count.
The charts on the following pages show each of our key metrics by employee count.
Report Volume: First, we were surprised to find that organizations in the 50,000-99,999 range had the lowest rate of reporting—and it was far lower than the organizations in the employee count ranges on either side of them. Second, it is interesting to note that reporting rates in smaller
organizations do fall within the expected range of one to two percent of all employees reporting. Common belief has been that smaller organizations receive fewer reports because they are better able to directly respond to employee concerns. This finding shows that a reporting system is an important tool for organizations of all sizes.
Data Based on Organizational Employee Count Continued
Report Volume per 100 Employees by Employee Count
This is further proven in the next section which details the findings related to Anonymous Reports and Substantiated Reports.
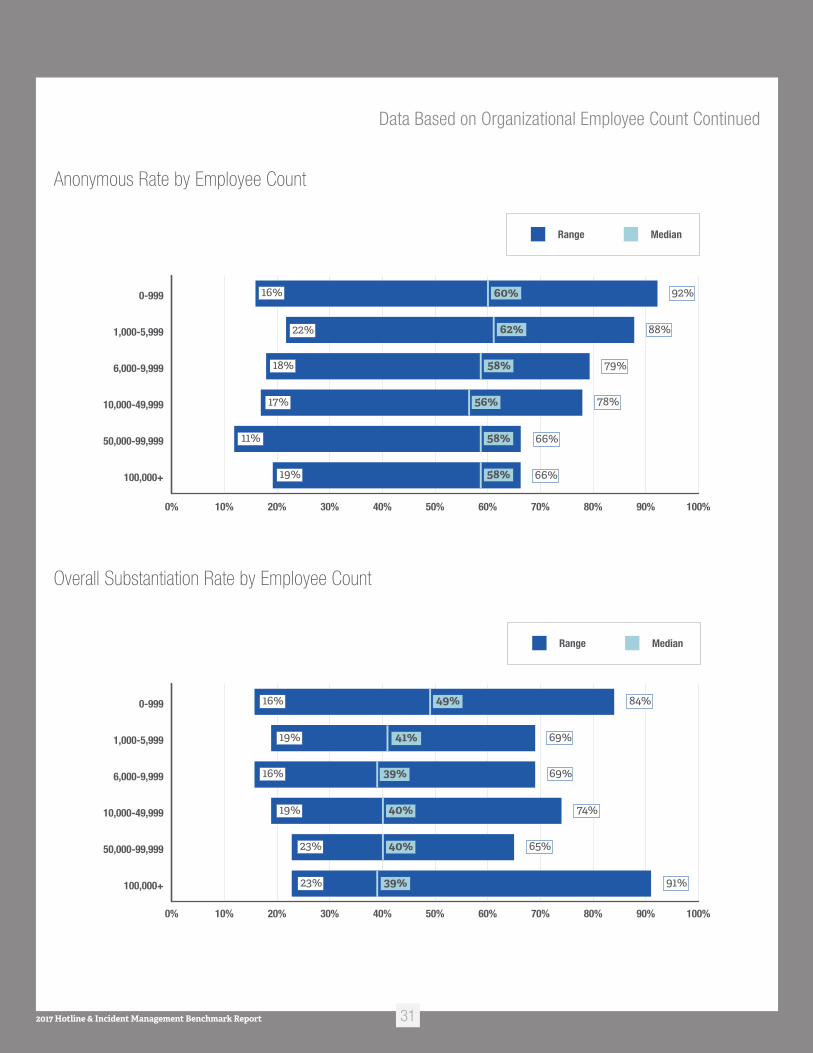
Anonymous Reports and Substantiated Reports: In reviewing the data specific to Anonymous Reports and Substantiated Reports, the most interesting takeaway was that smaller organizations have higher rates of anonymous reporting but
also higher overall substantiation rates. This could be attributed to the fact that many employees in a small company know each other and would therefore prefer to remain anonymous to protect relationships or potentially avoid retaliation. When employees in smaller organizations do report, these reports are more likely to be substantiated.
0 2 4 6 8 10 12 14 16 18 20
100,000+
50,000-99,999
10,000-49,999
6,000-9,999
1,000-5,999
0-999140.3 1.0
7.20.5 1.5
0.2 1.2 9.4
0.4 1.6 10.5
0.2 0.9 6.6
0.3 1.3 13.7
Range (reports per 100 employees) Median (reports per 100 employees)
Data Based on Organizational Employee Count Continued
Case Closure Time: In this metric, we were not surprised to find that smaller organizations have the best case closure time record, most likely because they are managing fewer total reports.
0 20 40 60 80 100 120 140 160 180 200
100,000+
50,000-99,999
10,000-49,999
6,000-9,999
1,000-5,999
0-999 145
162
118
115
106
150
34
39
39
43
42
39
9
11
13
14
13
18
Range Median
Case Closure Time in Days by Employee Count
34 NAVEX Global | The Ethics and Compliance Experts
CONCLUSIONEthics and compliance officers have many opportunities to leverage the data in their hotline and incident management systems to improve their compliance programs—and their organizational culture of ethics and respect. This year’s benchmarks point to several opportunities to increase program effectiveness:
△ Increase focus on anti-retaliation efforts. Several government agencies issued new guidance on protections from retaliation in 2016. At the same time, the low number of retaliation-related reports captured in our data gives us cause to believe that employees are more likely to report retaliation issues externally than internally. It is time to really focus internal attention on this important topic with training and awareness—and consider making this a regular part of board reports.
△ Continue work on getting case closure times back within best practice ranges. While we have seen some improvement this year in case closure time, a festering workplace issue can drag down morale, productivity and organizational culture. It can also lead to allegations being reported outside the organization to regulatory agencies directly. Best practice case closure time is an average of 30 days. Look carefully at the factors that could be causing delays in closing cases and address them.
△ Get a more complete picture of your risks by documenting all reports in one centralized incident management system. Noting that reports received from sources beyond the hotline and web reporting systems have a high substantiation rate, documenting reports from all reporting channels in an incident management system is more important than ever. Documenting all cases creates a more accurate, comprehensive and holistic view of your ethics and compliance cases—and the cultural health of your organization. It also increases the rigor with which you can track, investigate, analyze and resolve those reports.
△ Make the business case for matching your report volume with appropriate resources. Report volumes are up, and staying up. If your organization hasn’t caught up to the “new normal” in reporting volume, use the data we’ve provided to help make the business case with your board and executive leadership for adding resources and tools.
35 NAVEX Global | The Ethics and Compliance Experts
△ Encourage employees to see your hotline as a resource for information, not just a channel for reporting. This year, the percentage of contacts that were inquiries decreased. Increased awareness of the ability to use the hotline as a helpline can give employees permission to call when they need advice or assistance, not just to report an issue. Seeing the hotline as a resource can help increase the likelihood that your employees will feel comfortable asking for help—and take preventative action to avoid misconduct.
△ Take advantage of the new data this year relating to geography and organizational size. We hope the findings relating to geographic locations, and particularly those reports originating in Europe, provide some valuable insights and lead to good discussions in global organizations. And, smaller organizations can confirm that reporting systems with multiple avenues available are an important part of an effective program.
Hotline data that is carefully tracked, reviewed, benchmarked and presented with sufficient context often provides the early warning signs needed to detect, prevent and resolve problems. We at NAVEX Global hope that this report is helpful to your organization and we welcome any feedback on these findings.
36 NAVEX Global | The Ethics and Compliance Experts
NAVEX Global’s comprehensive suite of ethics and compliance
software, content and services helps organizations protect their people,
reputation and bottom line. Trusted by 95 of the FORTUNE 100 and
more than 12,500 clients, our solutions are informed by the largest ethics
and compliance community in the world. For more information,
37 NAVEX Global | The Ethics and Compliance Experts
Carrie Penman Chief Compliance Officer and SVP, Advisory Services, NAVEX Global
Carrie Penman is the Chief Compliance Officer and Senior Vice President, Advisory Services for NAVEX Global. Carrie has been with NAVEX Global’s Advisory Services team since 2003 after serving four years as deputy director of the Ethics and Compliance Officer Association (ECOA). Carrie was one of the earliest ethics officers in America. She is a scientist who developed and directed the first corporate-wide global ethics program at Westinghouse Electric Corporation. Since joining NAVEX Global’s Advisory Services team, she has conducted numerous program and culture assessment projects for its clients and regularly works with and trains company Boards of Directors and executive teams. She also serves as a corporate monitor and independent consultant for companies with government agreements. Carrie is the author of numerous compliance related articles and commentary and is regularly quoted as a compliance expert in press and publications. In the last two years, Carrie has been featured in the Wall Street Journal and on the cover of Compliance Week magazine.
ABOUT THE AUTHORS
Edwin O’Mara Operations Manager, Advisory Services, NAVEX Global
Eddy O’Mara is the Operations Manager of NAVEX Global’s Advisory Services team. He leads the development of our Integrity Diagnostics and Metrics product offering, as well as making key statistical and analytical contributions to our annual ethics and compliance Hotline Benchmark Report, Client Culture Surveys and Assessments. Eddy graduated from Bentley University with both a B.A. in Ethics and Corporate Social Responsibility and a B.S. in Business Management. He has been with NAVEX Global’s Advisory Services team since 2012.