48
2017 First Quarter Report for the three months ended March 31, 2017
2017 First Quarter Reportfor the three months ended March 31, 2017


Franco-Nevada Corporation 3The Gold Investment that WORKS
NEWS RELEASEToronto, May 9, 2017(in U.S. dollars unless otherwise noted)
Franco-Nevada Reports Strong Q1 Results
Dividend Increased for 10th Consecutive Year
“Franco-Nevada’s diversified portfolio and business model continues to deliver with record Gold Equivalent Ounces and revenue being realized in the first quarter” commented David Harquail, CEO. “Recent acquisitions are performing well and we continue to benefit from increased activity on many of our properties. It is a testament to both the portfolio and our business model that Franco-Nevada has again declared a dividend increase. This marks Franco-Nevada’s 10th consecutive year of dividend increases since it went public in late 2007. Franco-Nevada remains debt free with increasing cash balances and we continue to see investment opportunities across various commodities.”
Q1/2017 Financial Highlights • 131,578GoldEquivalentOunces(1) (GEOs) sold - a new record and a 23.4% increase year-over-year• $172.7millioninrevenue-anewrecordanda30.8%increaseyear-over-year• $128.5millionofAdjustedEBITDA(2)or$0.72pershare• $45.6millionofnetincomeor$0.26pershare• $44.8millionofAdjustedNetIncome(3)or$0.25pershare• $283.0millionincashandcashequivalentsatquarter-endandnodebt
Revenue and GEOs by Asset Categories
Q1/2017 Q1/2016
GEOs Revenue GEOs Revenue # (in millions) # (in millions)
Precious Metals Gold 100,540 $ 122.9 76,753 $ 91.5 Silver 19,746 24.4 22,627 26.8 PGM 8,224 10.7 5,196 7.6 Precious Metals - Total 128,510 $ 158.0 104.576 $ 125.9 Other Minerals 3,068 3.8 2,045 2.5 Oil & Gas – 10.9 – 3.6 131,578 $ 172.7 106,621 $ 132.0
ForQ1/2017,revenuewassourced91.5%frompreciousmetals(71.2%gold,14.1%silverand6.2%PGM)and81.0%fromtheAmericas(13.9%U.S.,16.9%Canadaand50.2%LatinAmerica).Operatingcostsandexpensesincreased year-over-year in-line with the increase in the number of GEOs sold during the quarter. Oil & gas revenue increased three-foldyear-over-year,reflectinghigherpricesandlowercapitalexpensesyear-over-yearontheCompany’sCanadianassets,aswellastheadditionoftheSTACKportfolioofroyaltiesinQ4/2016.Cashprovidedbyoperatingactivitieswas$119.8million,adecreaseof3.5%comparedtoQ1/2016,asincreasedgrossprofitswereoffsetbychanges in non-cash working capital.
Press ReleasePress Release

2017 First Quarter Report FNV TSX NYSE4
Corporate Updates• Dividend Increase: Franco-Nevadaispleasedtodeclareaquarterlydividendof$0.23pershare.Thedividendis
a4.5%increasefromtheprevious$0.22persharequarterlydividendandmarksthetenthconsecutiveannualdividend increase for Franco-Nevada shareholders.
• 2017Warrants:Atthebeginningoftheyear,Franco-Nevadahad6,510,280commonsharepurchasewarrantsoutstanding.ThewarrantshaveanexercisepriceofC$75.00perwarrantandexpireonJune16,2017.Subsequent toMarch31,2017,Franco-NevadareceivedproceedsofC$157.6millionfromtheexerciseof2,100,718commonsharepurchasewarrants.AtMay9,2017,thereremains4,407,675warrantsoutstanding.
• CreditFacilities:OnMarch22,2017,Franco-Nevadaextendedthetermofitsexisting$1billioncreditfacilityfromNovember 12, 2020 to March 22, 2022. In addition, on March 20, 2017, Franco-Nevada’s subsidiary, Franco-Nevada (Barbados)Corporation,enteredintoanunsecuredrevolvingcreditfacilitywhichprovidesfortheavailabilityof upto$100.0millioninborrowings.
• MidlandOil&GasRoyalties: On March 13, 2017, Franco-Nevada agreed to purchase a portfolio of oil & gas royalties intheMidlandshaleplayofthePermianBasinofTexasfor$110.0million.OnMarch14,2017,Franco-Nevadaadvanced$11.0millioninanescrowaccounttobeappliedtowardsthepurchasepriceuponclosing.Closing isexpectedinQ2/2017withrevenueretroactivetoJan1,2017.
Q1/2017 Portfolio Updates• PreciousMetals-U.S.:GEOsfromU.S.preciousmetalsassetsincreasedby37.9%year-over-yearwithincreasesat
SouthArturoandStillwatermorethanoffsettingthedecreasefromGoldstrike.19,529GEOswerereceivedfromtheU.S.preciousmetalassets.
• SouthArturo(4-9% royalty)-Thisproject,operatedbyBarrickandPremierGold,representedanincreaseof 4,309 GEOs year-over-year. The partners are looking at a second open pit (Dee) on the property and are advancing permitting for the El Nino underground opportunity below the current pit.
• Goldstrike(2-4% royalty & 2.4-6% NPI)-BarrickisintegratingtheCortezandGoldstrikeminesinanefforttoreduceall-in sustaining costs which would benefit the profit royalties.
• Stillwater(5% royalty)-SibanyeGoldsuccessfullycloseditsacquisitionofStillwaterMining.TheStillwaterprojectcontributedanadditional2,004GEOscomparedtoQ1/2016.StillwaterisplanninglowriskorganicgrowthwiththeBlitzproject,whichitexpectstoaddbetween270,000and330,000PGMouncesofincrementalproduction per annum by 2021.
• Rosemont(1.5% royalty)-HudbayreleasedresultsofafeasibilitystudyfortheRosemontprojectwhichoutlined a19yearminelifewithannualcopperproductionoverthefirst10yearsof127,000tonnes.Hudbayexpectsthe RecordofDecisiontobesignedinJune2017.Franco-Nevada’s1.5%royaltycoversallcommodities.
• PreciousMetals-Canada:GEOsfromCanadianpreciousmetalsassetsincreasedbyapproximately3.3%to 12,652GEOscomparedwithQ1/2016.
• Hemlo(3% royalty & 50% NPI)-BarrickfiledaTechnicalReportforHemlooutliningthelifeofmineplanandproviding additional detail of the increased reserves previously announced.
• Macassa(various royalties) - Reserves of gold ounces at the Macassa mine increased by 37% from the last estimate at December 31, 2014 which includes two years of depletion. The reserve grade also increased by 7%.
• Detour(2% royalty) - Detour Gold provided an updated mine plan in response to near-term permitting constraints. The updated plan assumes a longer mine life and increased life of mine gold production compared to the previous mine plan.
• Brucejack(1.2% royalty)-PretiumResourcesreportsthatithasstockpiled187,000tonnesoforeandhasstartedintroducing ore to the crusher.
• TimminsWest(2.25% royalty)-TahoeResourcesexpectstoprovideamaidenreserveestimatefortheGap144zonein Q3/2017.
Franco-Nevada Corporation 5The Gold Investment that WORKS
• PreciousMetals-LatinAmerica:GEOsfromLatinAmericanpreciousmetalsassetsrepresentedthelargestyear-over-yearincrease.70,429preciousmetalGEOswereearnedfromLatinAmerica,anincreaseof20.4%year-over-year duetohigherdeliveriesfromAntapaccay,GuadalupeandCandelaria.
• Antapaccay(gold and silver stream) -Antapaccaydelivered15,019GEOsinQ1/2017,anincreaseof68%year-over-yearduetoonlytwomonthsofdeliveriesinQ1/2016,whenthestreamtransactionwasclosed.
• Antamina(22.5% silver stream)-13,130GEOsfromAntaminaweresoldduringthequarter,adecreasecompared to17,781GEOsinQ1/2016.Theyear-over-yeardecreasewasexpected,as2016wasanexceptionallystrongyear ofsilverproductionforAntamina.
• Candelaria(gold and silver stream)-Candelariaearned22,483GEOs,comparedto18,626GEOsinQ1/2016, asexpectedaccordingtoitsmineplan.TheLosDiquestailingsfacilityconstructionisprogressingonscheduleand conceptual studies to increase production from five underground deposits to optimize life-of-mine plan are advancing.
• Guadalupe(50% gold stream)-TheGuadalupeagreement,whichbecameeffectiveinQ3/2016,delivered 19,300GEOsinQ1/2017,comparedto12,501underthePalmarejoagreementinQ1/2016,duetohigherproduction year-over-yearandareductionofinventorythathadbuiltupfromthepriorquarter.UndertheGuadalupeagreement,Franco-Nevadapaysanongoingcostof$800pergoldouncereceivedversustheinflationadjusted costof$400pergoldounceunderthepriorPalmarejoagreement.
• CerroMoro(2% royalty)-YamanaGoldreportsthattheprojectisontrackformechanicalcompletionbyyear-endwithstartupofproductionexpectedearlynextyear.
• CobrePanama(gold and silver stream)-Duringthequarter,Franco-Nevadacontributed$50.2millionofitsshareofconstructioncapitalfortheCobrePanamaprojectwithatotalof$512.4millionofits$1billioncommitmentcontributedasoftheendofQ1/2017.FirstQuantumreportedthattheprojectisover50%completeasoftheend ofQ1/2017andthattheprojectremainsscheduledforphasedcommissioningduring2018,withcontinuedramp-upover2019.Franco-Nevadaexpectstocontributebetween$200-$220milliontotheprojectin2017.
• PreciousMetals-RestofWorld:25,900GEOsfromRestofWorldpreciousmetalsassetsweresoldduringthequarter,
anincreaseof31.8%year-over-year.ThisreflectedthefirstfullquarterofdeliveriesfromKarma,aswellasthesale ofounceswhichhadbeenreceivedinQ4/2016.
• Subika(2% royalty)-NewmontformallyannouncedplanstodevelopanewundergroundmineandexpandplantcapacityatitsAhafooperationinGhana.Together,thetwoprojectsareforecasttoaddincrementalgoldproductionbetween 200,000 to 300,000 ounces per year during the first five years of production. The proposed underground mine is estimated to be mostly covered by Franco-Nevada’s 2% royalty.
• Tasiast(2% royalty)-KinrossreportstheTasiastPhase1expansionremainsonscheduleforfullproductioninQ2/2018.KinrossexpectstoprovideafeasibilityforapossiblePhase2expansioninQ3/2017.Thisisexpectedto addanadditional18,000tonnesperdayforatotalcombinedthroughputcapacityof30,000tonnesperday.
• Karma(fixed gold deliveries and stream)-5,000GEOsweresoldinthequarterofwhich1,250werereceivedinQ4/2016.
• Sabodala (fixed gold deliveries and stream)-7,500GEOsweresoldinthequarter,ofwhich1,875werereceivedinQ4/2016.TerangaGoldwonthePDACawardforEnvironmental&SocialResponsibilityforitsworkaroundtheSabodalamine.
• Edikan(1.5% royalty)-PerseusMiningreleasedanupdatedmineplaninFebruaryenvisioninga6.5yearminelife.• AgiDagi(2% royalty)-AlamosGoldhastabledapositivefeasibilityreportfortheprojectprojectingannual
productionof177,600ouncesofgoldover5years.ApositivePEAwasalsocompletedfortheneighbouringCamyurtprojectonwhichFranco-Nevadaalsoholdsaroyalty.
• Oil&Gas:Revenuefromoil&gasassetsincreasedto$10.9millioninQ1/2017comparedto$3.6millioninQ1/2016, reflectinghigherpricesandlowercapitalexpensesyear-over-yearontheCompany’sCanadianassets,aswellasthe additionoftheSTACKportfolioofroyaltiesinQ4/2016. ThecontributionfromthenewU.S.royaltyassetsisexpected to become more significant after 2017.
2017 First Quarter Report FNV TSX NYSE6
Dividend IncreaseFranco-NevadaispleasedtoannouncethatitsBoardofDirectorshasdeclaredaquarterlydividendof$0.23pershare.Thedividendisa4.5%increasefromtheprevious$0.22persharequarterlydividendandmarksthe10thconsecutiveannualdividendincreaseforFranco-Nevadashareholders.CanadianinvestorsinFranco-Nevada’sIPOinDecember2007arenowreceivinganeffective8.3%yieldontheircostbase.ThedividendwillbepaidonJune29,2017toshareholdersofrecordonJune15,2017(the“RecordDate”).TheCanadiandollarequivalentistobedeterminedbasedonthedailyaverageratepostedbytheBankofCanadaontheRecordDate.UnderCanadiantaxlegislation,Canadianresidentindividualswhoreceive“eligibledividends”areentitledtoanenhancedgross-upanddividendtaxcreditonsuch dividends.
TheCompanyhasaDividendReinvestmentPlan(“DRIP”).ParticipationintheDRIPisoptional.TheCompanywillissueadditionalcommonsharesthroughtreasuryata3%discounttotheAverageMarketPrice,asdefinedintheDRIP.However, the Company may, from time to time, in its discretion, change or eliminate the discount applicable to treasury acquisitions or direct that such common shares be purchased in market acquisitions at the prevailing market price, anyofwhichwouldbepubliclyannounced.TheDRIPandenrollmentformsareavailableontheCompany’swebsite atwww.franco-nevada.com.RegisteredshareholdersmayalsoenrollintheDRIPonlinethroughtheplanagent’s self-servicewebportalatwww.investorcentre.com/franco-nevada.Beneficialshareholdersshouldcontacttheir financial intermediary to arrange enrollment.
Thispressreleaseisnotanoffertosellorasolicitationofanofferofsecurities.Aregistrationstatementrelatingto theDRIPhasbeenfiledwiththeU.S.SecuritiesandExchangeCommissionandmaybeobtainedundertheCompany’sprofileontheU.S.SecuritiesandExchangeCommission’swebsiteatwww.sec.gov.
Shareholder Information ThecompleteCondensedConsolidatedInterimFinancialStatementsandManagement’sDiscussionandAnalysiscan befoundtodayonFrancoNevada’swebsiteatwww.franco-nevada.com,onSEDARatwww.sedar.comandonEDGARat www.sec.gov.
Managementwillhostaconferencecalltomorrow,Wednesday,May10,2017at8:30a.m.EasternTimetoreview Franco Nevada’s Q1/2017 results.
Interestedinvestorsareinvitedtoparticipateasfollows:
• ViaConferenceCall:Toll-Free:(888)231-8191;International:(647)427-7450• ConferenceCallReplayuntilMay17th:Toll-Free(855)859-2056;Toronto(416)849-0833;Passcode8958319• Webcast:Aliveaudiowebcastwillbeaccessibleatwww.franco-nevada.com
Corporate SummaryFranco-Nevada Corporation is the leading gold-focused royalty and stream company with the largest and most diversified portfolio of cash-flow producing assets. Its business model provides investors with gold price and explorationoptionalitywhilelimitingexposuretomanyoftherisksofoperatingcompanies.Franco-Nevadaisdebtfreeandusesitsfreecashflowtoexpanditsportfolioandpaydividends.IttradesunderthesymbolFNVonboth theTorontoandNewYorkstockexchanges.Franco-Nevadaisthegoldinvestmentthatworks.
For more information, please go to our website at www.franco-nevada.com or contact: StefanAxell SandipRanaDirector,CorporateAffairs ChiefFinancialOfficer416306-6328 [email protected]
Franco-Nevada Corporation 7The Gold Investment that WORKS
Non-IFRS Measures: AdjustedNetIncomeandAdjustedEBITDAareintendedtoprovideadditionalinformationonlyanddo nothaveanystandardizedmeaningprescribedunderIFRSandshouldnotbeconsideredinisolationorasasubstituteformeasuresofperformancepreparedinaccordancewithIFRS.ThesemeasuresarenotnecessarilyindicativeofoperatingprofitorcashflowfromoperationsasdeterminedunderIFRS.Othercompaniesmaycalculatethesemeasuresdifferently.Forareconciliationofthesemeasures tovariousIFRSmeasures,pleaseseebelowortheCompany’scurrentMD&AdisclosurefoundontheCompany’swebsite,onSEDARand onEDGAR.Comparativeinformationhasbeenrecalculatedtoconformtocurrentpresentation.
(1) GEOs includeourgold,silver,platinum,palladiumandothermineralassets.GEOsareestimatedonagrossbasisforNSRroyaltiesand,inthecaseofstreamounces,beforethepaymentoftheperouncecontractualpricepaidbytheCompany.ForNPIroyalties,GEOsarecalculatedtakingintoaccounttheNPIeconomics.Platinum,palladium,silverandothermineralsareconvertedtoGEOsbydividingassociatedrevenue,whichincludessettlementadjustments,bytherelevantgoldprice.ThegoldpriceusedinthecomputationofGEOsearnedfromaparticularasset varies depending on the royalty or stream agreement, which may make reference to the market price realized by the operator, or the average for the month, quarter, or year in which the mineral was produced or sold. For Q1/2017, the average commodity prices were as follows:$1,219gold(Q1/2016-$1,181),$17.42silver(Q1/2016-$14.83),$981platinum(Q1/2016-$914)and$767palladium(Q1/2016-$524).
(2) AdjustedEBITDAandAdjustedEBITDApersharearenon-IFRSfinancialmeasures,whichexcludethefollowingfromnetincomeandEPS:incometaxexpense/recovery;financeexpenses;financeincome;depletionanddepreciation;non-cashcostsofsales;impairmentchargesrelatedtoroyalty,streamandworkinginterestsandinvestments;gains/lossesonsaleofroyaltyinterests;gains/lossesoninvestments; andforeignexchangegains/lossesandotherincome/expenses.
(3) AdjustedNetIncomeandAdjustedNetIncomepersharearenon-IFRSfinancialmeasures,whichexcludethefollowingfromnetincomeandearningspershare(“EPS”):foreignexchangegains/lossesandotherincome/expenses;impairmentchargesrelatedtoroyalty,streamandworkinginterestsandinvestments;gains/lossesonsaleofroyaltyinterests;gains/lossesoninvestments;unusualnon-recurringitems;and theimpactofincometaxesontheseitems.
ReconciliationstoIFRSmeasures For the three months ended March 31, (expressed in millions, except per share amounts) 2017 2016
Net Income $ 45.6 $ 30.0 Income tax expense 10.4 8.1 Finance expenses 0.8 1.3 Finance income (0.9 ) (1.1 ) Depletion and depreciation 71.5 65.5 Non-cash costs of sales 1.8 1.8 Gain on investments – (1.5 ) Foreign exchange (gains)/losses and other (income)/expenses (0.7 ) 0.3
Adjusted EBITDA $ 128.5 $ 104.4 Basic weighted average shares outstanding 178.5 166.7
Adjusted EBITDA per share $ 0.72 $ 0.63
For the three months ended March 31, (expressed in millions, except per share amounts) 2017 2016
Net Income $ 45.6 $ 30.0 Foreign exchange (gains)/losses and other (income)/expenses (0.7 ) 0.2 Gain on investments – (1.5 ) Tax effect of adjustments (0.1 ) (0.7 )
Adjusted Net Income $ 44.8 $ 28.0 Basic weighted average shares outstanding 178.5 166.7
Adjusted Net Income per share $ 0.25 $ 0.17
Forward-Looking Information: Pleasereferto“CautionaryStatementonForward-LookingInformation”onpage33ofthisQuarterlyReport.
2017 First Quarter Report FNV TSX NYSE8
ThisManagement’sDiscussionandAnalysis(“MD&A”)offinancialpositionandresultsofoperationsofFranco-NevadaCorporation(“Franco-Nevada”,the“Company”,“we”or“our”)hasbeenpreparedbaseduponinformationavailabletoFranco-NevadaasatMay9,2017andshouldbereadinconjunctionwithFranco-Nevada’sunauditedcondensedconsolidatedinterimfinancialstatementsandrelatednotesasatandforthethreemonthsendedMarch31,2017and2016.TheunauditedcondensedconsolidatedinterimfinancialstatementsandMD&AarepresentedinU.S.dollarsandhavebeenpreparedinaccordancewithInternationalFinancialReportingStandards(“IFRS”)asissuedbytheInternationalAccountingStandardsBoard(“IASB”)applicabletothepreparationofinterimfinancialstatementsinaccordancewithIAS34InterimFinancialReporting.
ReadersarecautionedthattheMD&Acontainsforward-lookingstatementsandthatactualeventsmayvaryfrommanagement’sexpectations.Readersareencouragedtoreadthe“CautionaryStatementonForward-LookingInformation”attheendofthisMD&AandtoconsultFranco-Nevada’sauditedconsolidatedfinancialstatementsfortheyearsendedDecember31,2016and2015andthecorrespondingnotestothefinancialstatementswhichareavailableonourwebsiteatwww.franco-nevada.com,onSEDARatwww.sedar.comandinourmostrecentForm40-FfiledwiththeSecuritiesandExchangeCommissiononEDGARatwww.sec.gov.
AdditionalinformationrelatedtoFranco-Nevada,includingourAnnualInformationForm,isavailableonSEDARatwww.sedar.com,andourForm40-FisavailableonEDGARatwww.sec.gov.ThesedocumentscontaindescriptionsofcertainofFranco-Nevada’sproducingandadvancedroyaltyandstreamassets,aswellasadescriptionofriskfactorsaffectingtheCompany.Foradditionalinformation,ourwebsitecanbefoundatwww.franco-nevada.com.
Table of Contents9 BusinessOverviewandStrategy
10 Highlights
12 Guidance
13 MarketOverview
14 SelectedFinancialInformation
15 RevenuebyAsset
16 OverviewofFinancialPerformance-Q1/2017ToQ1/2016
23 SummaryofQuarterlyInformation
24 BalanceSheetReview
25 LiquidityandCapitalResources
28 CriticalAccountingEstimates
29 OutstandingShareData
29 InternalControlOverFinancialReportingandDisclosureControlsandProcedures
30 Non-IFRSFinancialMeasures
33 CautionaryStatementonForward-LookingInformation
Abbreviations used in this reportThefollowingabbreviationsmaybeusedthroughoutthisMD&A:
Abbreviated DefinitionsPeriods under review“Q1/2017” The three-month period ended March 31, 2017“Q4/2016” The three-month period ended December 31, 2016“Q3/2016” The three-month period ended September 30, 2016“Q2/2016” The three-month period ended June 30, 2016“Q1/2016” The three-month period ended March 31, 2016
Places and currencies“U.S.” United States“$” or “USD” United States dollars“C$” or “CAD” Canadian dollars
Interest types“NSR” Net smelter return royalty“GR” Gross royalty“ORR” Overriding royalty“GORR” Gross overriding royalty“FH” Freehold or lessor royalty“NPI” Net profits interest“NRI” Net royalty interest“WI” Working interest
Measurement“GEO” Gold equivalent ounces“oz” Ounce“oz Au” Ounce of gold“oz Ag” Ounce of silver“oz Pt” Ounce of platinum“oz Pd” Ounce of palladium“LBMA” London Bullion Market Association“bbl” Barrel“boe” Barrels of oil equivalent“WTI” West Texas Intermediate oil
Management’s Discussion and Analysis
Franco-Nevada Corporation 9The Gold Investment that WORKS
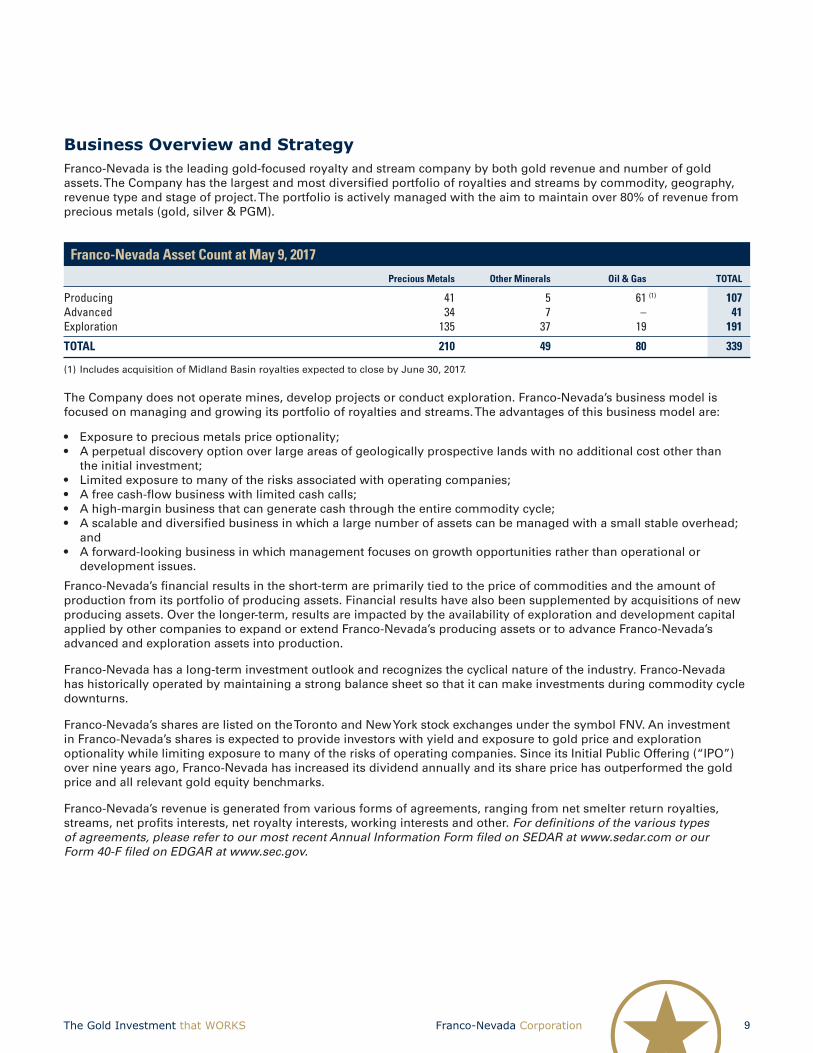
Business Overview and StrategyFranco-Nevada is the leading gold-focused royalty and stream company by both gold revenue and number of gold assets. The Company has the largest and most diversified portfolio of royalties and streams by commodity, geography, revenuetypeandstageofproject.Theportfolioisactivelymanagedwiththeaimtomaintainover80%ofrevenuefrompreciousmetals(gold,silver&PGM).
Franco-Nevada Asset Count at May 9, 2017
Precious Metals Other Minerals Oil & Gas TOTAL
Producing 41 5 61 (1) 107Advanced 34 7 – 41Exploration 135 37 19 191
TOTAL 210 49 80 339
(1) IncludesacquisitionofMidlandBasinroyaltiesexpectedtoclosebyJune30,2017.
TheCompanydoesnotoperatemines,developprojectsorconductexploration.Franco-Nevada’sbusinessmodelisfocusedonmanagingandgrowingitsportfolioofroyaltiesandstreams.Theadvantagesofthisbusinessmodelare:
• Exposuretopreciousmetalspriceoptionality;• Aperpetualdiscoveryoptionoverlargeareasofgeologicallyprospectivelandswithnoadditionalcostotherthan
theinitialinvestment;• Limitedexposuretomanyoftherisksassociatedwithoperatingcompanies;• Afreecash-flowbusinesswithlimitedcashcalls;• Ahigh-marginbusinessthatcangeneratecashthroughtheentirecommoditycycle;• Ascalableanddiversifiedbusinessinwhichalargenumberofassetscanbemanagedwithasmallstableoverhead;
and• Aforward-lookingbusinessinwhichmanagementfocusesongrowthopportunitiesratherthanoperationalor
development issues. Franco-Nevada’s financial results in the short-term are primarily tied to the price of commodities and the amount of production from its portfolio of producing assets. Financial results have also been supplemented by acquisitions of new producingassets.Overthelonger-term,resultsareimpactedbytheavailabilityofexplorationanddevelopmentcapitalappliedbyothercompaniestoexpandorextendFranco-Nevada’sproducingassetsortoadvanceFranco-Nevada’sadvancedandexplorationassetsintoproduction.
Franco-Nevada has a long-term investment outlook and recognizes the cyclical nature of the industry. Franco-Nevada has historically operated by maintaining a strong balance sheet so that it can make investments during commodity cycle downturns.
Franco-Nevada’ssharesarelistedontheTorontoandNewYorkstockexchangesunderthesymbolFNV.AninvestmentinFranco-Nevada’ssharesisexpectedtoprovideinvestorswithyieldandexposuretogoldpriceandexplorationoptionalitywhilelimitingexposuretomanyoftherisksofoperatingcompanies.SinceitsInitialPublicOffering(“IPO”)over nine years ago, Franco-Nevada has increased its dividend annually and its share price has outperformed the gold price and all relevant gold equity benchmarks.
Franco-Nevada’s revenue is generated from various forms of agreements, ranging from net smelter return royalties, streams, net profits interests, net royalty interests, working interests and other. Fordefinitionsofthevarioustypesofagreements,pleaserefertoourmostrecentAnnualInformationFormfiledonSEDARatwww.sedar.comorourForm40-FfiledonEDGARatwww.sec.gov.

2017 First Quarter Report FNV TSX NYSE10
HighlightsFinancialUpdate-Q1/2017
• 131,578GEOs(1)recognizedinrevenueinQ1/2017,anincreaseof23.4%from106,621GEOsinQ1/2016;• $172.7millioninrevenue,anincreaseof30.8%fromrevenueof$132.0millioninQ1/2016;• $128.5million,or$0.72pershare,ofAdjustedEBITDA(2), (3)inQ1/2017,anincreaseof23.1%from$104.4millionor
$0.63pershare,inQ1/2016;• 74.4%inMargin(2), (3),comparedto79.1%inQ1/2016;• $45.6million,or$0.26pershare,innetincomeforQ1/2017,anincreaseof52.0%comparedto$30.0million,or
$0.18pershare,inQ1/2016;• $44.8million,or$0.25pershare,inAdjustedNetIncome(2), (3)inQ1/2017,anincreaseof60.0%comparedto
$28.0million,or$0.17pershare,inQ1/2016;• $119.8millioninnetcashprovidedbyoperatingactivities(3) in Q1/2017, a decrease of 3.4% compared to
$124.0millioninQ1/2016;and• $1.6billioninavailablecapitalatMarch31,2017,comprisingof$356.2millionofworkingcapital,$117.3millionin
marketableequitysecurities,and$1.1billionavailableundertheCompany’screditfacilities.Ofthis,$99.0million willbeusedtofundtheremainderoftheCompany’sacquisitionofoil&gasroyaltyinterestsintheMidlandBasinwhichisexpectedtoclosebyJune30,2017.Further,subsequenttoMarch31,2017,Franco-Nevadareceived proceedsofC$157.6millionfromtheexerciseof2,100,718commonsharepurchasewarrantsatanexerciseprice ofC$75.00perwarrant.Asofthedateofthisreport,thereremained4,407,675warrantsoutstanding.
(1) GEOs include our gold, silver, platinum, palladium and other mineral assets, and do not include Oil & Gas assets. GEOs are estimated on a grossbasisforNSRroyaltiesand,inthecaseofstreamounces,beforethepaymentoftheperouncecontractualpricepaidbytheCompany.ForNPIroyalties,GEOsarecalculatedtakingintoaccounttheNPIeconomics.Silver,platinum,palladiumandothermineralsareconvertedtoGEOsbydividingassociatedrevenue,whichincludessettlementadjustments,bytherelevantgoldprice.Thegoldpriceusedinthecomputation of GEOs earned from a particular asset varies depending on the royalty or stream agreement, which may make reference to the market price realized by the operator, or the average for the month, quarter, or year in which the mineral was produced or sold. For illustrative purposes,pleaserefertoaveragecommoditypricetablesonpage16ofthisQuarterlyReportforindicativepriceswhichmaybeusedinthecalculation of GEOs.
(2)AdjustedNetIncome,AdjustedEBITDAandMarginarenon-IFRSfinancialmeasureswithnostandardizedmeaningunderIFRS.Forfurtherinformationandadetailedreconciliation,pleaseseethe“Non-IFRSFinancialMeasures”sectionofthisMD&A.
(3) InQ3/2016,theCompanyadoptedaretrospectivechangeinaccountingpolicywithrespecttoitsclassificationofproceedsfromsalesofgoldbullioninitsstatementofcashflowsandstatementofincomeandcomprehensiveincome.Forfurtherinformation,refertoNote16ofthecondensedconsolidatedfinancialstatementsforthethreemonthsendedMarch31,2017.TheCompany’snon-IFRSmeasures,asdefinedin the“Non-IFRSFinancialMeasures”sectionofthisMD&A,werealsoadjustedaccordinglytoreflectgains/lossesonsalesofsuchgoldbullionasanoperatingactivitythatispartoftheCompany’sunderlyingoperatingbusiness.Comparativeinformationhasbeenadjustedtoconformto current presentation.
Franco-Nevada‘s Relative Share Price Performance
FNV IPO:Dec 2007
450%
400%
350%
300%
250%
200%
150%
100%
50%
0%
-50%
-100%2008 2009 2010 2011 2012 2013 2014 2016 20172014
FNV(TSX)
Gold Price
S&P/TSX GlobalGold Index
Note: FNV (TSX) and S&P/TSX Global Gold Index converted to USD.
Franco-Nevada continuesto outperform bothequities and gold itself(Chart to May 8, 2017)

Franco-Nevada Corporation 11The Gold Investment that WORKS
CorporateDevelopment
AcquisitionofU.S.Oil&GasRoyalties-MidlandBasin
OnMarch13,2017,Franco-Nevada,throughawholly-ownedU.S.subsidiary,agreedtopurchaseapackageofroyaltyrightsintheMidlandBasinofWestTexasforapriceof$110.0million.TheMidlandBasinformstheeasternportionofthebroaderPermianBasinandrepresentsoneofthemostactiveandprofitableoilplaysinNorthAmerica.Theroyaltiesconsistofapproximately97%mineraltitlerights,alongwithsomeGORRs,whichapplytoapproximately908acres(netafterroyalties)that,withpooling,providesexposuretoanestimatedgrossacreageof675,000acres(asignificantportionoftheoverallMidlandBasin)atanestimatedaverageroyaltyrateof0.14%.Theroyaltiesaresubjecttoadiverseoperatorbase,whichisanchoredbyPioneerNaturalResources.Royaltyrevenueisexpectedtogrowinfutureyearsashorizontaldrillingactivityintheareacontinuestorampup.Thetransactionisexpectedtocloseinthesecondquarterof2017.
FundingofCobrePanama
TheCompanyfundedanadditional$50.2milliontowardstheCobrePanamapreciousmetalsstreaminQ1/2017.AsatMarch31,2017,theCompanyhasfundedacumulativetotalof$512.4millionofits$1billionmaximumcommitment.FirstQuantumMineralsLtd.(“FirstQuantum”)expectstotalcapitalexpendituresof$1,060millionin2017.AccordingtoFirstQuantum,capitalexpenditureforthefirstquarterof2017was$243million,andtheprojectwasjustover50%complete.
Financing
OnMarch22,2017,theCompanyextendedthematurityofitsexisting$1billioncreditfacility,fromNovember12,2020to March 22, 2022.
OnMarch20,2017,Franco-Nevada’ssubsidiary,Franco-Nevada(Barbados)Corporation(“FNBC”),enteredintoanunsecuredrevolvingcreditfacility(the“FNBCCreditFacility”).TheFNBCCreditFacilityprovidesfortheavailabilityoveraone-yearperiodofupto$100.0millioninborrowings.Referto“LiquidityandCapitalResources”fordetails.
Dividend Increase
Franco-Nevadaispleasedtodeclareaquarterlydividendof$0.23pershare.Thedividendisa4.5%increasefromtheprevious$0.22persharequarterlydividendandmarksthetenthconsecutiveannualdividendincreaseforFranco-Nevadashareholders.

2017 First Quarter Report FNV TSX NYSE12
GuidanceThefollowingcontainsforward-lookingstatements.Referenceshouldbemadetothe“CautionaryStatementonForward-LookingInformation”sectionattheendofthisMD&A.Foradescriptionofmaterialfactorsthatcouldcauseouractualresultstodiffermateriallyfromtheforward-lookingstatementsbelow,pleaseseetheCautionaryStatementandthe“RiskFactors”sectionofourmostrecentAnnualInformationFormfiledwiththeCanadiansecuritiesregulatoryauthoritiesonwww.sedar.comandourmostrecentForm40-FfiledwiththeSecuritiesandExchangeCommissiononEDGARatwww.sec.gov.2017guidanceisbasedonassumptionsincludingtheforecastedstateofoperationsfromourassets based on the public statements and other disclosures by the third-party owners and operators of the underlying properties(subjecttoourassessmentthereof).
WithastrongperformanceinQ1/2017,Franco-Nevadaison-tracktomeetitspreviouslyannouncedguidance.
Q1/2017 Actual 2017 Guidance 2016 Actual
Mineral assets - GEO production(1), (2) 131,578 GEOs 470,000 - 500,000 GEOs 464,383 GEOsOil & Gas assets - Revenue(3) $10.9 million $35.0 million - $45.0 million $30.1 million
(1)Ofthe470,000to500,000GEOs,Franco-Nevadaexpectstoreceive335,000to345,000GEOsunderitsvariousstreamagreements.ForthethreemonthsendedMarch31,2017,theCompanyhasearned94,225GEOsfromitsstreamagreements.
(2) InforecastingGEOsfor2017,gold,silver,platinumandpalladiummetalshavebeenconvertedtoGEOsusingcommoditypricesof$1,200/ozAu,$17.50/ozAg,$950/ozPtand$750/ozPd.
(3) InforecastingrevenuefromOil&Gasassetsfor2017,theWTIoilpriceisassumedtoaverage$50perbarrelwitha$3.50perbarrelpricedifferentialbetweentheEdmontonLightandrealizedpricesforCanadianoil.
Weexpecttofundapproximately$200.0millionto$220.0milliontowardstheCobrePanamapreciousmetalsstreamin2017.InQ1/2017,theCompanyfunded$50.2million,foracumulativetotalof$512.4millionofits$1billionmaximumcommitment.
Inaddition,theCompanyestimateddepletionanddepreciationexpensetobe$265.0millionto$295.0millionfor2017.ForthethreemonthsendedMarch31,2017,depletionanddepreciationexpensetotaled$71.5million.
Franco-Nevadastrivestogenerate80%ofrevenuefrompreciousmetalsoveralong-termhorizonwhichincludesgold,silverandPGMs.Intheshort-term,wemaydivergefromthelong-termtargetbasedonopportunitiesavailable.With91.5%ofrevenueearnedfrompreciousmetalsinQ1/2017,theCompanyhastheflexibilitytoconsiderdiversificationopportunitiesoutsideofthepreciousmetalsspaceandincreaseitsexposuretoothercommodities.
Quarterly Revenue and Gold Equivalent Ounces by CommodityQuarterly Gold Equivalent Ounces and Revenue by Commodity
Quarterly GEO Production Quarterly Revenue(expressedinmillions)
Gold Silver PGM Other Minerals Oil & Gas
140,000
120,000
100,000
80,000
60,000
40,000
40,000
0
Gold
Equ
ival
ent O
unce
s
Q4/2016 Q1/2017Q2/2016 Q3/2016Q1/2016
106,312
OtherMinerals123,065 121,910
112,787PGM
Silver
Gold
131,578$200
$180
$160
$140
$120
$100
$80
$60
$40
$20
0
Reve
nue
Q3/2016 Q4/2016 Q1/2017Q1/2016 Q2/2016
$150.9
$172.0
$155.3 Oil & Gas
Gold
Silver
OtherPGM
$172.7
$132.0
Franco-Nevada Corporation 13The Gold Investment that WORKS
Market OverviewThe prices of precious metals are the largest factors in determining profitability and cash-flow from operations for Franco-Nevada.Historically,thepriceofgoldhasbeensubjecttovolatilepricemovementsandisaffectedbynumerousmacroeconomicandindustryfactorsthatarebeyondtheCompany’scontrol.Majorinfluencesonthegoldpriceincludemacroeconomicfactorssuchasthelevelofinterestrates,inflationexpectations,currencyexchangeratefluctuationsincludingtherelativestrengthoftheU.S.dollar,andthesupplyofanddemandforgold.
The gold price performed well in the first quarter of 2017, somewhat reversing most of the losses it had incurred in the lastquarterof2016.Aswaswidelyanticipated,inMarch2017,theU.S.FederalReserveincreaseditsbenchmarkinterestrate for a second time in three months. There continues to be significant uncertainty as several elections take place in Europe,includinganunexpectedelectionintheU.K.,andthecurrentU.S.administrationcontinuestoimplementitsvariouseconomicinitiativesincludingpotentialtaxcutsandrenegotiationsoftradeagreements.
Overall,thegoldpriceendedQ1/2017at$1,245/oz,approximately8.6%higherthanattheendofQ4/2016.DuringQ1/2017,goldpricestradedbetween$1,151/ozand$1,284/ozwithanaveragepriceof$1,219/oz.Thisrepresentsanincreaseof3.2%comparedtotheQ1/2016averagegoldpriceof$1,181/oz,whileremainingrelativelyconsistentwiththeaveragepriceof$1,218/ozforQ4/2016.
ThepriceofsilverendedQ1/2017at$18.06/oz,11.2%higherthanattheendofQ4/2016.Silverpricesaveraged$17.42/ozinQ1/2017,comparedto$14.83/ozinQ1/2016,anincreaseof17.5%.Asforplatinumandpalladium,thepriceperounceattheendofQ1/2017was$940/ozand$798/oz,respectively,increasesof4.7%and19.1%,respectively,whencomparedtopricesattheendofQ4/2016.Averagepricesforthequarterwere$981/ozand$767/oz,forplatinumandpalladiumrespectively,comparedto$914/ozand$524/oz,forQ1/2016,increasesof7.3%and46.4%year-over-year,respectively.
Commodity price volatility also impacts the number of GEOs contributed by non-gold mineral assets when converting silver,platinum,palladiumandothermineralstoGEOs.Silver,platinum,palladiumandothermineralsareconvertedtoGEOsbydividingassociatedrevenue,whichincludessettlementadjustments,bytherelevantgoldprice.Thegoldpriceused in the computation of GEOs earned from a particular asset varies depending on the royalty or stream agreement, which may make reference to the market price realized by the operator, or the average for the month, quarter, or year in which the mineral was produced or sold.
Despite the volatile commodity prices, the Company continued to deliver strong results and significant increases in GEOscomparedtoQ1/2016,reflectingtheperformanceofourmineralassets.OneofthestrengthsoftheFranco-Nevadabusiness model is that our business is not impacted when producer costs increase as long as the producer continues to operate. Royalty and stream payments/deliveries are based on production levels of the underlying operations with noadjustmentsfortheoperator’soperatingcosts,withtheexceptionofNPIandNRIroyalties,whicharebasedontheprofitoftheunderlyingminingoperation.Profit-basedroyaltiesaccountedforapproximately5.2%oftotalrevenuesinQ1/2017.

2017 First Quarter Report FNV TSX NYSE14
Selected Financial Information
For the three months (in millions, except Average Gold Price, ended March 31, GEOs, Margin and per share amounts) 2017 2016
Statistical Measures Average Gold Price $ 1,219 $ 1,181 GEOs sold(1) 131,578 106,621
Statement of Income and Other Comprehensive Income Revenue $ 172.7 $ 132.0 Depletion and depreciation 71.5 65.5 Cost of sales 39.9 24.4 Operating income(2) 55.2 37.0 Net income 45.6 30.0 Basic earnings per share $ 0.26 $ 0.18 Diluted earnings per share $ 0.25 $ 0.18
Dividends declared per share $ 0.22 $ 0.21 Dividends declared (including DRIP) $ 39.4 $ 38.5 Weighted average shares outstanding 178.5 166.8
Non-IFRS Measures Adjusted EBITDA(2), (3) $ 128.5 $ 104.4 Adjusted EBITDA(2), (3) per share $ 0.72 $ 0.63 Margin(2), (3) 74.4% 79.1% Adjusted Net Income(2), (3) $ 44.8 $ 28.0 Adjusted Net Income(2), (3) per share $ 0.25 $ 0.17
Statement of Cash Flows Net cash provided by operating activities(2) $ 119.8 $ 124.0 Net cash used in investing activities(2) $ (61.9 ) $ (506.9 ) Net cash (used in) provided by financing activities $ (31.0 ) $ 405.4
As at As at March 31, December 31, 2017 2016
Statement of Financial Position Cash and cash equivalents $ 283.0 $ 253.0 Total assets 4,247.8 4,221.6 Deferred income tax liabilities 41.0 37.5 Total shareholders’ equity 4,174.9 4,146.5 Working capital 356.2 323.6 (1) Refer to Note 1 at the bottom of page 10 of this Quarterly Report for the methodology for calculating GEOs, and, for illustrative purposes, to the average commodity
price table on page 16 of this Quarterly Report for indicative prices which may be used in the calculations of GEOs.(2) In Q3/2016, the Company adopted a retrospective change in accounting policy with respect to its classification of proceeds from sales of gold bullion in its statement
of cash flows and statement of income and comprehensive income. For further information, refer to Note 16 of the condensed consolidated financial statements for the three months ended March 31, 2017. The Company’s non-IFRS measures, as defined in the “Non-IFRS Financial Measures” section of this MD&A, were also adjusted accordingly to reflect gains/losses on sales of such gold bullion as an operating activity that is part of the Company’s underlying business. Comparative information has been adjusted to conform to current presentation.
(3) Adjusted EBITDA, Margin and Adjusted Net Income are non-IFRS financial measures with no standardized meaning under IFRS. For further information and a detailed reconciliation, please see the “Non-IFRS Financial Measures” section of this MD&A.

Franco-Nevada Corporation 15The Gold Investment that WORKS
Revenue by AssetOurportfolioiswell-diversifiedwithGEOsandrevenuebeingearnedfrom46mineralassetsand60oil&gasinterestsinvariousjurisdictions(notincludingtheacquisitionofMidlandBasinroyalties,whichisexpectedtoclosebyJune30,2017).The following table details revenue earned from our various royalty, stream and working interests for the three months endedMarch31,2017and2016:
For the three months (expressed in millions) ended March 31, Property Interest 2017 2016
PRECIOUS METALSUnited StatesGoldstrike NSR 2-4%, NPI 2.4-6% $ 3.6 $ 5.8Stillwater NSR 5% 5.7 3.2Gold Quarry NSR 7.29% 2.3 2.9Marigold NSR 1.75-5%, GR 0.5-4% 2.7 1.6Fire Creek/Midas Fixed to 2018 / NSR 2.5% 2.4 2.4Bald Mountain NSR/GR 0.875-5% 1.1 0.3South Arturo GR 4-9% 5.3 0.1Other 0.6 0.5
Canada Sudbury Stream 50% $ 6.5 $ 5.8Detour Lake NSR 2% 3.2 3.0Golden Highway NSR 2-15% 2.1 2.2Musselwhite NPI 5% 0.9 1.0Hemlo NSR 3%, NPI 50% 1.0 1.8Kirkland Lake(1) NSR 1.5-5.5%, NPI 20% 1.1 1.2Timmins West NSR 2.25% 0.9 0.8Canadian Malartic GR 1.5% 0.4 0.2Other – –
Latin America Antapaccay Stream (indexed) $ 18.5 $ 11.2Antamina Stream 22.5% 16.3 21.0Candelaria Stream 68% 27.6 22.0Guadalupe-Palmarejo(2) Stream 50% 23.7 14.8Other 0.6 0.8
Rest of World MWS Stream 25% $ 8.6 $ 7.1Sabodala Stream 6%, Fixed to 2019 9.1 6.7Subika NSR 2% 2.0 1.0Tasiast NSR 2% 1.7 1.5Karma Stream 4.875%, Fixed to 75koz 6.0 1.5Duketon NSR 2% 1.5 1.7Edikan NSR 1.5% 0.9 0.9Other 1.7 3.0
$ 158.0 $ 126.0
Other Minerals $ 3.8 $ 2.4
Oil & Gas Weyburn NRI 11.71%, ORR 0.44%, WI 2.56% $ 8.3 $ 2.3Midale ORR 1.14%, WI 1.59% 0.4 0.3Edson ORR 15% 0.6 0.3STACK Effective Royalty Rate 1.61% 0.6 –Other 1.0 0.7
$ 10.9 $ 3.6
Revenue $ 172.7 $ 132.0
(1) In October 2016, the overlying NSR on the Kirkland Lake Gold properties was reduced from 2.5% to 1.5% pursuant to Kirkland Lake’s buy-back of 1% of the NSR.(2) In July 2016, Coeur met its obligation to deliver 400,000 ounces under the Palmarejo agreement. Deliveries under the new Guadalupe agreement commenced in Q3/2016.
2017 First Quarter Report FNV TSX NYSE16
Overview of Financial Performance - Q1/2017 To Q1/2016The prices of precious metals, oil and gas and the actual production from mineral and oil & gas assets are the largest factors in determining profitability and cash flow from operations for Franco-Nevada. The following table summarizes averagecommoditypricesandaverageexchangeratesduringtheperiodspresented.
QOQ YOY Quarterly average prices and rates Q1/2017 Q4/2016 Q1/2016 (Q1/17-Q4/16) (Q1/17-Q1/16)
Gold(1) ($/oz) $ 1,219 $ 1,218 $ 1,181 0.1% 3.2%Silver(2) ($/oz) 17.42 17.18 14.83 1.4% 17.5%Platinum(3) ($/oz) 981 944 914 3.9% 7.3%Palladium(3) ($/oz) 767 684 524 12.1% 46.4%
Edmonton Light (C$/bbl) 64.82 60.70 41.17 6.8% 57.4%Quality Differential (C$/bbl) (7.59 ) (5.83 ) (8.86 ) 30.2% (14.3%)Realized oil price (C$/bbl) 57.23 54.87 32.31 4.3% 77.1%
CAD/USD exchange rate(4) 0.7555 0.7496 0.7282 0.8% 3.7%
(1) Based on LBMA Gold Price PM Fix.(2) Based on LBMA Silver Price.(3) Based on London PM Fix.(4) Based on Bank of Canada noon rates.
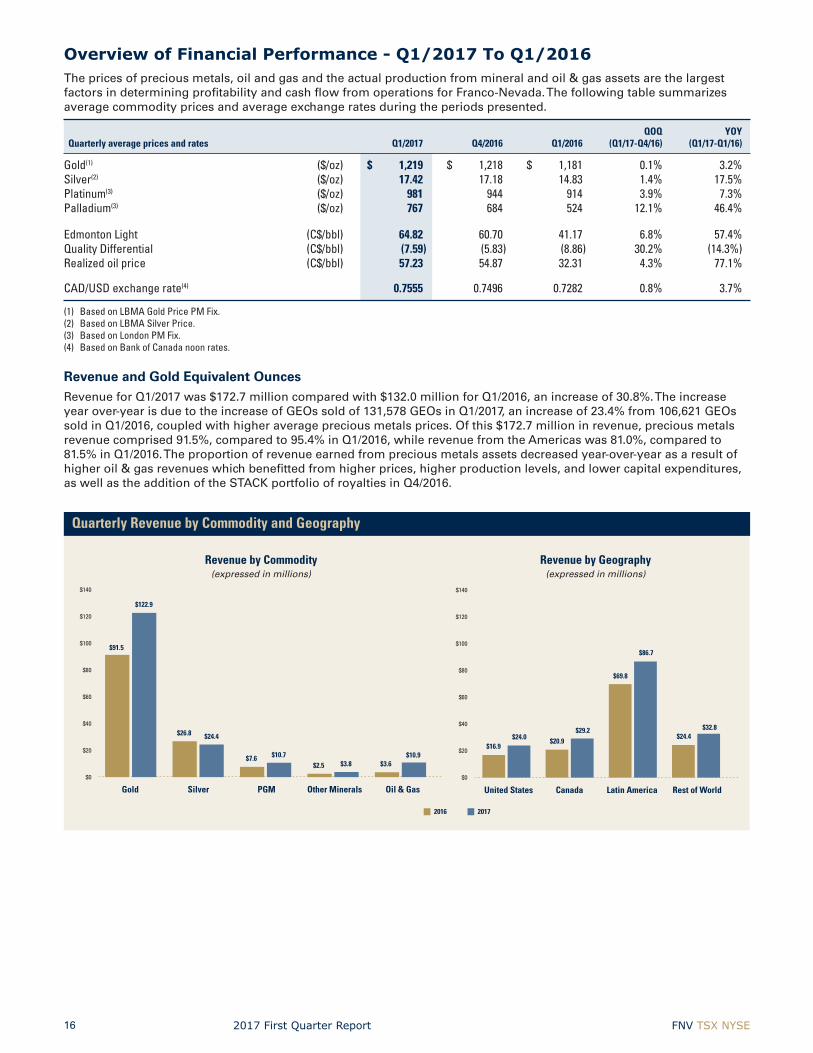
RevenueandGoldEquivalentOuncesRevenueforQ1/2017was$172.7millioncomparedwith$132.0millionforQ1/2016,anincreaseof30.8%.Theincreaseyearover-yearisduetotheincreaseofGEOssoldof131,578GEOsinQ1/2017,anincreaseof23.4%from106,621GEOssoldinQ1/2016,coupledwithhigheraveragepreciousmetalsprices.Ofthis$172.7millioninrevenue,preciousmetalsrevenuecomprised91.5%,comparedto95.4%inQ1/2016,whilerevenuefromtheAmericaswas81.0%,comparedto81.5%inQ1/2016.Theproportionofrevenueearnedfrompreciousmetalsassetsdecreasedyear-over-yearasaresultofhigheroil&gasrevenueswhichbenefittedfromhigherprices,higherproductionlevels,andlowercapitalexpenditures,aswellastheadditionoftheSTACKportfolioofroyaltiesinQ4/2016.
Revenue by Commodity(expressedinmillions)
Revenue by Geography(expressedinmillions)
Gold Silver PGM Other Minerals Oil & Gas
$140
$120
$100
$80
$60
$40
$20
$0
$26.8 $24.4
$91.5
$122.9
$7.6 $10.7$2.5 $3.8 $3.6
$10.9
2016 2017
United States Canada Latin America Rest of World
$140
$120
$100
$80
$60
$40
$20
$0
$16.9$24.0 $20.9
$29.2
$69.8
$86.7
$24.4$32.8
Quarterly Revenue by Commodity and Geography

Franco-Nevada Corporation 17The Gold Investment that WORKS
The following table outlines GEOs and revenue attributable to Franco-Nevada for the three months ended March 31, 2017 and2016bycommodity,geographicallocationandtypeofinterest:
Gold Equivalent Ounces(1) Revenue (in millions) For the three months ended March 31, 2017 2016 Variance 2017 2016 Variance
Commodity Precious Metals Gold 100,540 76,753 23,787 $ 122.9 $ 91.5 $ 31.4 Silver 19,746 22,627 (2,881 ) 24.4 26.8 (2.4 ) PGM 8,224 5,196 3,028 10.7 7.6 3.1
Precious Metals - Total 128,510 104,576 23,934 158.0 125.9 32.1Other Minerals 3,068 2,045 1,023 3.8 2.5 1.3Oil & Gas – – – 10.9 3.6 7.3
131,578 106,621 24,957 $ 172.7 $ 132.0 $ 40.7
GeographyUnited States 19,634 14,275 5,359 $ 24.0 $ 16.9 $ 7.1Canada 14,601 13,284 1,317 29.2 20.9 8.3Latin America 70,429 58,510 11,919 86.7 69.8 16.9Rest of World 26,914 20,552 6,362 32.8 24.4 8.4
131,578 106,621 24,957 $ 172.7 $ 132.0 $ 40.7
TypeRevenue-based 25,914 23,145 2,769 $ 34.1 $ 28.7 $ 5.4Streams 94,225 75,294 18,931 116.3 91.4 24.9Profit-based 2,809 4,666 (1,857 ) 8.9 6.3 2.6Other 8,630 3,516 5,114 13.4 5.6 7.8
131,578 106,621 24,957 $ 172.7 $ 132.0 $ 40.7
(1) Refer to Note 1 at the bottom of page 10 of this Quarterly Report for the methodology for calculating GEOs, and, for illustrative purposes, to the average commodity price table on page 16 of this Quarterly Report for indicative prices which may be used in the calculations of GEOs.
GEOsandrevenuefrompreciousmetalswereearnedfromthefollowinggeographicallocations:
Gold Equivalent Ounces(1) Revenue (in millions) For the three months ended March 31, 2017 2016 Variance 2017 2016 Variance
Geography for Precious Metals Precious Metals United States 19,529 14,165 5,364 $ 23.7 $ 16.8 $ 6.9 Canada 12,652 12,252 400 16.1 16.0 0.1 Latin America 70,429 58,510 11,919 86.7 69.8 16.9 Rest of World 25,900 19,649 6,251 31.5 23.3 8.2
Precious Metals - Total 128,510 104,576 23,934 $ 158.0 $ 125.9 $ 32.1Other Minerals 3,068 2,045 1,023 3.8 2.5 1.3Oil & Gas – – – 10.9 3.6 7.3
131,578 106,621 24,957 $ 172.7 $ 132.0 $ 40.7
(1) Refer to Note 1 at the bottom of page 10 of this Quarterly Report for the methodology for calculating GEOs, and, for illustrative purposes, to the average commodity price table on page 16 of this Quarterly Report for indicative prices which may be used in the calculations of GEOs.

2017 First Quarter Report FNV TSX NYSE18
PreciousMetals
Revenuefrompreciousmetalsassetswas$158.0millioninQ1/2017comparedto$125.9millioninQ1/2016,reflecting128,510GEOsfrompreciousmetalsassets,anincreaseof22.9%from104,576GEOsinQ1/2016.ThelargestcomponentoftheseincreaseswascontributedbyourLatinAmericanassetswhichrealizedanincreaseof20.4%inGEOs,and24.2%in revenue compared to the prior year.
GEOsandrevenueincreasesforthequarterareattributabletothefollowingassets:
• Guadalupe-TheGuadalupestream,whichbecameeffectiveinQ3/2016,delivered19,300GEOsinQ1/2017, comparedto12,501GEOsunderthePalmarejoagreementinQ1/2016,duetohigherproductionyear-over-year and a reduction of inventory that had built up from the prior quarter.
• Antapaccay-TheCompanysold15,019GEOsfromitsAntapaccayagreementinQ1/2017,comparedto8,918GEOsinQ1/2016,ayear-over-yearincreaseof68.4%duetoonlytwomonthsofdeliveriestakingplaceinQ1/2016,uponclosingofthestreamacquisitioninlateFebruary2016.
• SouthArturo-TheSouthArturominegeneratedpaymentsof4,392GEOs,comparedto83GEOsinQ1/2016. TheSouthArturominepoureditsfirstgoldpourinAugust2016.
• Karma-TheCompanysold5,000GEOsinQ1/2017inrelationtoitsKarmastream,ofwhich1,250werereceived inQ4/2016.Thiscomparesto1,250GEOsreceivedandsoldinQ1/2016.DeliveriesfromKarmaarefixedinthe initialyearsofthestreamatarateof1,250ouncespermonth.
• Candelaria-TheCompanysold22,483GEOsfromitsCandelariastream,comparedto18,626inQ1/2016. TheincreaseinGEOssoldispartlyduetothesaleof2,032GEOswhichhadbeendeliveredinQ4/2016.
• Stillwater-Stillwatergeneratedpaymentsof4,646GEOs,comparedto2,642GEOsinQ1/2016,asaresultofhigherplatinum and palladium production in the quarter.
TheabovesignificantincreasesinGEOswerepartiallyoffsetbydecreasesinGEOdeliveriescomparedtoQ1/2016fromthefollowingassets:
• Antamina-SalesfromtheAntaminastreamdecreasedby4,651GEOsyear-over-year,as2016wasanexceptionallystrongyearofsilverproductionforAntamina.
• Goldstrike-PaymentsfromboththeNSRandNPIroyaltieswerelowerinQ1/2017comparedtoQ1/2016,resulting in1,845fewerGEOs.
DuringQ1/2017,1,385,922ouncesofsilverweresoldfromourCandelaria,Antapaccay,AntaminaandCerroSanPedrointerestswhichwereconvertedto19,746GEOs.
GEO Reconciliation - Q1/2016 to Q1/2017
GEO Reconciliation – Q1/2016 to Q1/2017
GEOs - Q1/2016
PGM A
ssets
Gold NPIs
Silver A
ssets
Gold Assets
Other Minera
ls
GEOs - Q1/2017
131,578
2,881 1,857
1,023 3,028
25,644
106,621

Franco-Nevada Corporation 19The Gold Investment that WORKS
OtherMinerals
OtherMineralsgenerated3,068GEOsand$3.8millioninrevenue,comparedto2,045GEOsand$2.5millioninrevenueinQ1/2016.
Oil&Gas
Oil&Gasassetsgeneratedrevenueof$10.9millionforthequarter(94%oiland6%gas),athree-foldincreasecomparedto$3.6millionfortheQ1/2016(93%oiland7%gas).Productionforthequarterwas5.5%higherthaninQ1/2016;coupledwith higher oil prices and lower capital costs from the operators.
RevenuefromtheWeyburnUnitforthequarterincreasedto$8.3million(Q1/2016-$2.3million)with$5.5millionearnedfromtheNRI(Q1/2016-$0.8million),$2.3millionearnedfromtheworkinginterest(Q1/2016-$1.2million)and$0.5millionearnedfromtheoverridingroyalties(Q1/2016-$0.3million).RevenuefromtheWeyburnNRIwashigherduetothehigheraveragerealizedprices,coupledwithlowercostsandhigherproductionlevels.Althoughoperatingexpenseswere10%higherthaninQ1/2016,capitalexpenseswere45%lowerinQ1/2017comparedtoQ1/2016.TheactualrealizedpricefromtheNRIwas70%higherinQ1/2017,atC$57.82/boecomparedtoC$33.97/boeforQ1/2016.
Oil&Gasrevenuealsoincluded$0.6millionfromtheSTACKacquisitionwhichtookplaceinQ4/2016.
OperatingCostsandExpenses
Thefollowingtableprovidesalistofoperatingcostsandexpensesincurredintheperiodspresented: For the three months ended March 31, (expressed in millions) 2017 2016 Variance
Costs of sales $ 39.9 $ 24.4 $ 15.5Depletion and depreciation 71.5 65.5 6.0Corporate administration 5.3 5.4 (0.1 )Business development 0.8 0.3 0.5(Gain) loss on sale of gold bullion – (0.6 ) 0.6
$ 117.5 $ 95.0 $ 22.5
CostsofSales
Thefollowingtableprovidesabreakdownofcostofsalesincurredintheperiodspresented: For the three months ended March 31, (expressed in millions) 2017 2016 Variance
Cost of stream sales $ 36.4 $ 21.7 $ 14.7Cost of prepaid ounces 1.8 1.8 –Mineral production taxes 0.6 0.3 0.3Oil & Gas operating costs 1.1 0.6 0.5
$ 39.9 $ 24.4 $ 15.5
Thevarianceof$15.5millionisin-linewiththeincreaseinstreamouncessoldof94,225GEOsinQ1/2017comparedto75,294GEOsinQ1/2016.CostofstreamsalesinQ1/2017alsoreflectsthehigherperouncecostundertheGuadalupeagreementof$800perounceofgoldreceived,comparedtotheinflation-adjustedcostof$400perounceofgoldunderthepriorPalmarejoagreement.Theongoingstreamcostsperounceareeitherafixedamountperouncedelivered(typicallyadjustedforinflationeachyear)oranamountbasedasapercentageofspotpriceofgoldorsilver.

2017 First Quarter Report FNV TSX NYSE20
DepletionandDepreciation
Depletionanddepreciationtotaled$71.5millionforthequartercomparedto$65.5millioninQ1/2016.Themajorityoftheincreaseof$6.0millionisduetohigherroyaltypaymentsandstreamdeliveriesfromAntapaccay,SouthArturo,KarmaandCandelaria,partlyoffsetbylowerdeliveriesfromAntamina.DepletionexpensealsobenefittedfromalowerdepletionrateontheGuadalupestream,whichbecameeffectiveinQ3/2016,comparedtothedepletionrateonthePalmarejoagreement.
Costs of Sales Reconciliation - Q1/2016 to Q1/2017(expressedinmillions)
Costs of Sales Reconciliation – Q1/2016 to Q1/2017
COS - Q1/2016
COS - Q1/2017
Other, net
Guadalupe
Candelaria
Karma
O&G
Antapaccay
$39.9
$0.7 $0.9 $1.0 $1.3 $1.4
$10.2
$24.4
Depletion and Depreciation Reconciliation - Q1/2016 to Q1/2017(expressedinmillions)
Depletion and Depreciation Reconciliation – Q1/2016 to Q1/2017
Depletion -
Q1/2016
Guadalupe
Antamina
Palmare
jo
Karma
Oil & G
as
South Artu
ro
Antapaccay
Other, net
Candelaria
Depletion -
Q1/2017
$71.5
$4.0$4.6
$2.1$3.0
$3.0$65.5
$0.3 $0.4 $1.4
$4.4

Franco-Nevada Corporation 21The Gold Investment that WORKS
CorporateAdministration
Thefollowingtableprovidesabreakdownofcorporateadministrationexpensesincurredfortheperiodspresented: For the three months ended March 31, (expressed in millions) 2017 2016 Variance
Salaries and benefits $ 1.1 $ 1.1 $ –Professional fees 0.3 0.5 (0.2 )Office costs 0.2 0.4 (0.2 )Board of Directors cost 0.7 1.1 (0.4 )Share-based compensation 1.6 1.3 0.3Other 1.4 1.0 0.4
$ 5.3 $ 5.4 $ (0.1 )
Corporateadministrationexpenses,representing3.1%ofrevenueforQ1/2017,remainedrelativelyconsistentwithexpensesincurredinQ1/2016.BoardofDirectorsfees’varyaccordingtothemark-to-marketofthevalueofdeferredshareunitsthataregrantedtothedirectorsoftheCompany.AlthoughtheCompany’ssharepriceincreasedbothduringQ1/2017andQ1/2016,theincreasewasmoresignificantinQ1/2016,resultinginahighermark-to-marketofthedeferredshareunitliabilityinQ1/2016comparedtoQ1/2017.
BusinessDevelopmentExpenses
Businessdevelopmentexpensestotaled$0.8millioncomparedtoa$0.3millioninQ1/2016.Timingandamountofthesecosts typically vary depending upon the level of business development related activity, and the timing of completing transactions.Businessdevelopmentexpensesrelatedtocompletedtransactionsarecapitalizedtotherelevantmineralinterest asset following the closing of transactions.
GainorLossonSaleofGoldBullion
TheCompanydidnotrecognizeagainorlossonthesaleofgoldbullioninQ1/2017,comparedtoagainof$0.6millioninQ1/2016.GoldbullionisphysicalouncesofgoldwhichtheCompanyreceivesassettlementfromcertainofitsroyaltyinterests, and is presented as other current assets on the statement of financial position.
ForeignExchangeandOtherIncome/Expenses
Thefollowingtableprovidesalistofforeignexchangeandotherincome/expensesincurredfortheperiodspresented: For the three months ended March 31, (expressed in millions) 2017 2016 Variance
Foreign exchange gain (loss) $ 0.5 $ (0.2 ) $ 0.7Other income 0.2 – 0.2
$ 0.7 $ (0.2 ) $ 0.9 Foreignexchangelossesandotherincome/expenseswerecomprisedofaforeignexchangegainof$0.5million,comparedtoalossof$0.2millioninQ1/2016,reflectingastrengtheningoftheU.S.dollarrelativetotheCanadiandollar.UnderIFRS,allforeignexchangegainsorlossesrelatedtomonetaryassetsandliabilitiesheldinacurrencyotherthanthe functional currency are recorded in net income as opposed to other comprehensive income. The parent company’s functional currency is the Canadian dollar, while the functional currency of certain of the Company’s subsidiaries is the U.S.dollar.
Other income also includes dividend income on certain of the Company’s equity investments.
2017 First Quarter Report FNV TSX NYSE22
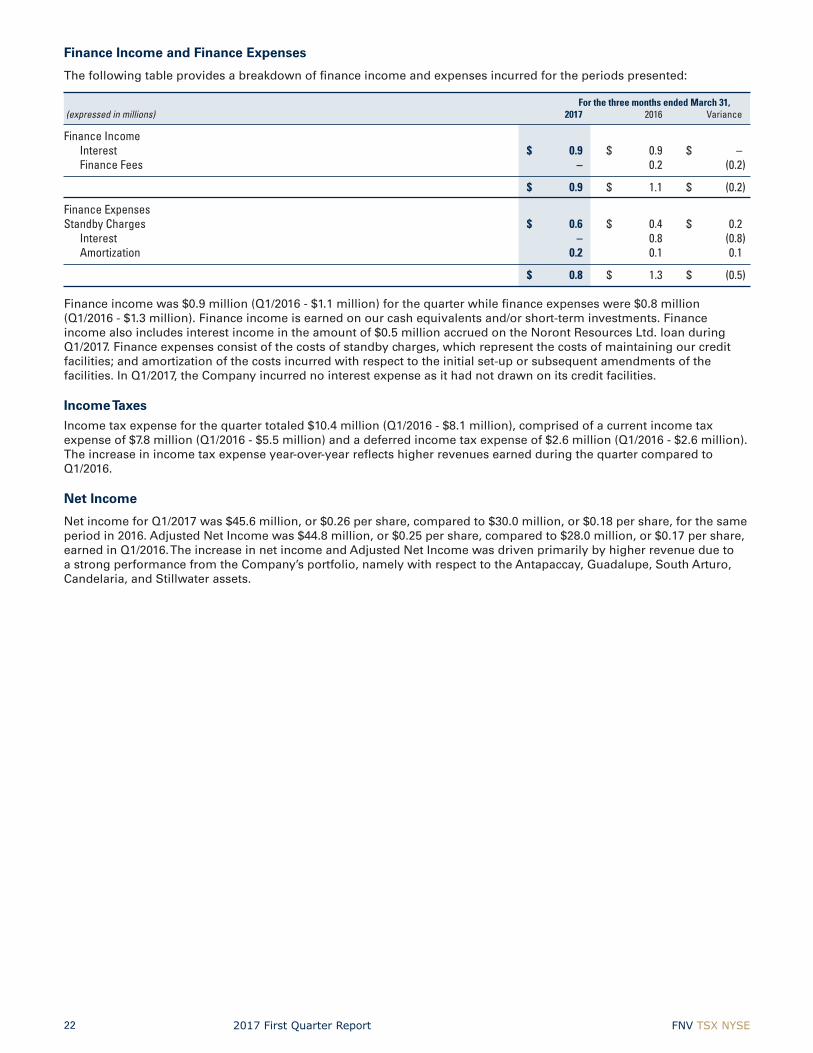
FinanceIncomeandFinanceExpenses
Thefollowingtableprovidesabreakdownoffinanceincomeandexpensesincurredfortheperiodspresented: For the three months ended March 31, (expressed in millions) 2017 2016 Variance
Finance Income Interest $ 0.9 $ 0.9 $ – Finance Fees – 0.2 (0.2 )
$ 0.9 $ 1.1 $ (0.2 )
Finance Expenses Standby Charges $ 0.6 $ 0.4 $ 0.2 Interest – 0.8 (0.8 ) Amortization 0.2 0.1 0.1
$ 0.8 $ 1.3 $ (0.5 )
Financeincomewas$0.9million(Q1/2016-$1.1million)forthequarterwhilefinanceexpenseswere$0.8million(Q1/2016-$1.3million).Financeincomeisearnedonourcashequivalentsand/orshort-terminvestments.Financeincomealsoincludesinterestincomeintheamountof$0.5millionaccruedontheNorontResourcesLtd.loanduringQ1/2017.Financeexpensesconsistofthecostsofstandbycharges,whichrepresentthecostsofmaintainingourcreditfacilities;andamortizationofthecostsincurredwithrespecttotheinitialset-uporsubsequentamendmentsofthefacilities.InQ1/2017,theCompanyincurrednointerestexpenseasithadnotdrawnonitscreditfacilities.
IncomeTaxesIncometaxexpenseforthequartertotaled$10.4million(Q1/2016-$8.1million),comprisedofacurrentincometaxexpenseof$7.8million(Q1/2016-$5.5million)andadeferredincometaxexpenseof$2.6million(Q1/2016-$2.6million).Theincreaseinincometaxexpenseyear-over-yearreflectshigherrevenuesearnedduringthequartercomparedtoQ1/2016.
NetIncome
NetincomeforQ1/2017was$45.6million,or$0.26pershare,comparedto$30.0million,or$0.18pershare,forthesameperiodin2016.AdjustedNetIncomewas$44.8million,or$0.25pershare,comparedto$28.0million,or$0.17pershare,earnedinQ1/2016.TheincreaseinnetincomeandAdjustedNetIncomewasdrivenprimarilybyhigherrevenueduetoastrongperformancefromtheCompany’sportfolio,namelywithrespecttotheAntapaccay,Guadalupe,SouthArturo,Candelaria,andStillwaterassets.

Franco-Nevada Corporation 23The Gold Investment that WORKS
Summary of Quarterly InformationSelectedquarterlyfinancialandstatisticalinformationforthemostrecenteightquarters(1)issetoutbelow:
(in millions, except Margin, GEOs, Q1 Q4 Q3 Q2 Q1 Q4 Q3 Q2 and per share amounts) 2017 2016 2016 2016 2016 2015 2015 2015
Revenue $ 172.7 $ 155.3 $ 172.0 $ 150.9 $ 132.0 $ 121.3 $ 103.7 $ 109.4 Costs and expenses(2), (3) 117.5 154.9 104.5 100.5 95.0 157.6 77.6 78.6 Operating income (loss)(3) 55.2 0.4 67.5 50.4 37.0 (36.3 ) 26.1 30.8 Other income (expenses)(3) 0.8 8.5 (0.2 ) 3.2 1.1 – (2.4 ) 2.1 Income tax expense (recovery) 10.4 13.4 12.9 11.3 8.1 (4.9 ) 8.5 11.3 Net income (loss) 45.6 (4.5 ) 54.4 42.3 30.0 (31.4 ) 15.2 21.6
Basic earnings (loss) per share $ 0.26 $ (0.03 ) $ 0.31 $ 0.24 $ 0.18 $ (0.20 ) $ 0.10 $ 0.14 Diluted earnings (loss) per share $ 0.25 $ (0.03 ) $ 0.30 $ 0.24 $ 0.18 $ (0.20 ) $ 0.10 $ 0.14
Net cash provided by operating activities(3) $ 119.8 $ 121.9 $ 121.6 $ 103.5 $ 124.0 $ 84.9 $ 73.0 $ 72.8 Net cash used in investing activities(3) (61.9 ) (113.3 ) (41.5 ) (28.1 ) (506.9 ) (987.7 ) (44.6 ) (38.5 )Net cash provided by (used in) financing activities (31.0 ) (30.5 ) (29.4 ) (23.8 ) 405.4 445.2 (23.2 ) (24.3 )
Average Gold Price(4) $ 1,219 $ 1,218 $ 1,335 $ 1,259 $ 1,181 $ 1,104 $ 1,124 $ 1,193 GEOs sold(5) 131,578 121,910 123,065 112,787 106,621 106,312 85,637 83,040
Adjusted EBITDA(3), (6) $ 128.5 $ 122.2 $ 142.2 $ 120.3 $ 104.4 $ 94.2 $ 77.5 $ 82.1 Adjusted EBITDA(3), (6) per share $ 0.72 $ 0.69 $ 0.80 $ 0.68 $ 0.63 $ 0.60 $ 0.49 $ 0.52 Margin(3), (6) 74.4% 78.7% 82.7% 79.7% 79.1% 77.7% 74.7% 75.1%Adjusted Net Income(3), (6) $ 44.8 $ 42.9 $ 53.5 $ 40.0 $ 28.0 $ 23.7 $ 19.4 $ 22.9 Adjusted Net Income(3), (6)
per share $ 0.25 $ 0.24 $ 0.30 $ 0.22 $ 0.17 $ 0.15 $ 0.12 $ 0.15
(1) Sum of the quarters may not add up to yearly total due to rounding.(2) Includes impairment charges on royalty, stream and working interests.(3) In Q3/2016, the Company adopted a retrospective change in accounting policy with respect to its classification of proceeds from sales of gold bullion in its statement
of cash flows and statement of income and comprehensive income. For further information, refer to Note 16 of the condensed consolidated financial statements for the three months ended March 31, 2017. The Company’s non IFRS measures, as defined in the “Non-IFRS Financial Measures” section of this MD&A, were also adjusted accordingly to reflect gains/losses on sales of such gold bullion as an operating activity that is part of the Company’s underlying operating business. Comparative information presented above has been adjusted to conform to current presentation.
(4) Based on LBMA Gold Price PM Fix.(5) GEOs include our gold, silver, platinum, palladium and other mineral assets, and do not include Oil & Gas assets. GEOs are estimated on a gross basis for NSR
royalties and, in the case of stream ounces, before the payment of the per ounce contractual price paid by the Company. For NPI royalties, GEOs are calculated taking into account the NPI economics. Silver, platinum, palladium and other minerals are converted to GEOs by dividing associated revenue, which includes settlement adjustments, by the relevant gold price. The gold price used in the computation of GEOs earned from a particular asset varies depending on the royalty or stream agreement, which may make reference to the market price realized by the operator, or the average for the month, quarter, or year in which the mineral was produced or sold. For illustrative purposes, please refer to average commodity price tables on page 16 of this Quarterly Report for indicative prices which may be used in the calculation of GEOs.
(6) Adjusted EBITDA, Margin and Adjusted Net Income are non-IFRS measures with no standardized meaning under IFRS. For further information and a detailed reconciliation, please refer to the “Non-IFRS Financial Measures” section of this MD&A.

2017 First Quarter Report FNV TSX NYSE24
Balance Sheet Review
Summary Balance Sheet and Key Financial Metrics At At March 31, December 31, (expressed in millions, except debt to equity ratio) 2017 2016
Cash and cash equivalents $ 283.0 $ 253.0
Current assets 388.1 361.2Non-current assets 3,859.7 3,860.4
Total assets $ 4,247.8 $ 4,221.6
Current liabilities 31.9 37.6Non-current liabilities 41.0 37.5
Total liabilities $ 72.9 $ 75.1
Total shareholders’ equity $ 4,174.9 $ 4,146.5
Debt $ – $ –Total common shares outstanding 178.6 156.9
Key Financial Ratios Working Capital $ 356.2 $ 323.6 Debt to equity – –
Assets
Totalassetswere$4,247.8millionatMarch31,2017comparedto$4,221.6millionatDecember31,2016.Ourassetbaseis primarily comprised of non-current assets such as our royalty, stream and working interests, and current assets of cash and cash equivalents. This reflects our business strategy of growing a diversified portfolio and ensuring cash is available forfutureacquisitionsanddividends.Theincreaseof$26.9millionincurrentassetsasatMarch31,2017comparedtoDecember31,2016isduetonetcashgeneratedbyoperatingactivities,partlyoffsetbytheCompany’scontributionof$50.2milliontowardstheCobrePanamaproject,aswellasthedepositof$11.0millionintoanescrowaccountfortheMidlandBasinportfolioofroyaltieswhichtheCompanyagreedtoacquireinQ1/2017.Theincreaseinnon-currentassetsfromthesecapitalexpenditureswaspartlyoffsetbythedepletionofroyalty,streamandworkinginterests.
Liabilities
TotalliabilitiesatMarch31,2017were$72.9millionincludingcurrentanddeferredincometaxliabilities,adecreaseof$2.2millioncomparedtoDecember31,2016,reflectingadecreaseintradepayablesandcurrentincometaxliabilities.
AsatMarch31,2017,neitherthecorporateentitynorFNBChaddrawnontheirrespectivecreditfacility.
Shareholders’Equity
Shareholders’equityincreasedby$28.4millionasatMarch31,2017comparedtoDecember31,2016,reflectingnetincomeof$45.6millionforthethreemonthsendedMarch31,2017,partlyoffsetbydeclareddividendsof$39.4million,ofwhich$9.3millionweresettledthroughtheissuanceofcommonsharespursuanttotheCompany’sDRIP.

Franco-Nevada Corporation 25The Gold Investment that WORKS
Liquidity and Capital ResourcesCashflowgeneratedforthethreemonthsendedMarch31,2017and2016wasasfollows: For the three months ended March 31, (expressed in millions) 2017 2016
Cash provided by operating activities(1) $ 119.8 $ 124.0Cash used in investing activities(1) (61.9 ) (506.9 )Cash provided by (used in) financing activities (31.0 ) 405.4Effect of exchange rate changes on cash and cash equivalents 3.1 4.6
Change in cash and cash equivalents $ 30.0 $ 27.1
(1) In Q3/2016, the Company adopted a retrospective change in accounting policy with respect to its classification of proceeds from sales of gold bullion in its statement of cash flows. Comparative information, including information presented in the “Quarterly Financial Information” section of this MD&A, has been adjusted to conform to current presentation. For further information, refer to Note 16 of the condensed consolidated financial statements for the three months ended March 31, 2017.
OperatingCashFlow
Cashgeneratedbyoperatingactivitieswas$119.8millionand$124.0millionforQ1/2017andQ1/2016,respectively.AlthoughtheCompanybenefittedfromhighergrossprofitsduetotheincreaseinGEOsearnedinthequarter,this cash inflow was more than offset by changes in non-cash working capital.
InQ3/2016,theCompanyadoptedaretrospectivechangeinaccountingpolicywithrespecttoitsclassificationofproceedsfromsalesofgoldbullioninitsstatementofcashflows.Pursuanttocertainofitsroyaltyagreements,theCompany receives gold bullion as settlement for amounts which it is due. In prior periods, management had classified proceeds from the sale of such gold bullion as an investing activity based on its intention with respect to the holding periodofthegoldbullion.Asthemagnitudeandfrequencyoftradingincreasedovertime,managementdeterminedtheacquisitionandsubsequentsaleofthegoldbulliontobeanoperatingactivity.Asaresult,theCompanyhasreclassified the cash proceeds from the sale of such gold bullion, and any related gain or loss arising during the holding period, to be a component of operating income and operating cash flows. Comparative information, including informationpresentedinthe“QuarterlyFinancialInformation”sectionofthisMD&A,hasbeenadjustedtoconformtocurrentpresentation.Forfurtherinformation,refertoNote16ofthecondensedconsolidatedfinancialstatementsfor the three months ended March 31, 2017.
InvestingActivities
Cashusedininvestingactivitieswas$61.9millionforQ1/2017comparedto$506.9millioninQ1/2016.InvestingactivitiesinQ1/2017includedthefundingoftheCobrePanamastreamof$50.2million,aswellastheinitialdepositof$11.0millionintoanescrowaccountforthepurchaseoftheMidlandBasinportfolioofroyaltiestheCompanyagreedtoacquireinQ1/2017.AtMarch31,2017,theCompanyhasfundedacumulativetotalof$512.4millionofitstotal$1.0billionmaximumcommitmenttotheconstructionofCobrePanama.
FinancingActivities
Netcashusedinfinancingactivitieswas$31.0millionforQ1/2017reflectingpaymentsofcashdividendsinthequarter.Thiscomparestonetcashprovidedbyfinancingactivitiesof$405.4millionforQ1/2016,whichincludedtheproceedsfromtheshareissuanceinFebruary2016,partlyoffsetbytherepaymentofamountstheCompanyhaddrawnonitscreditfacilityof$460.0million.

2017 First Quarter Report FNV TSX NYSE26
CapitalResources
AsatMarch31,2017,ourcashandcashequivalentstotaled$283.0million(December31,2016-$253.0million).Inaddition,weheldinvestmentsatMarch31,2017withacombinedvalueof$150.6million(December31,2016-$147.4million),ofwhich$117.3millionwasheldinpublicly-tradedequityinstruments(December31,2016-$114.6million).
Further,anamountof$1.0billion,oritsCanadiandollarequivalent,isavailableunderourunsecuredcreditfacility(the“CreditFacility”).AdvancesundertheCreditFacilitybearinterestdependinguponthecurrencyoftheadvanceandtheCompany’sleverageratio.AtMarch31,2017,U.S.andCanadiandollaradvanceswouldbearinterestatarateof4.20%and2.90%,respectively,withamaturityofMarch22,2022.FundscanalsobedrawnusingLIBOR30-dayratesplus 1.20% per annum.
Inaddition,onMarch20,2017,theCompany’ssubsidiary,Franco-Nevada(Barbados)Corporation,enteredintoanunsecuredrevolvingcreditfacility(the“FNBCCreditFacility”).TheFNBCCreditFacilityprovidesfortheavailabilityoveraone-yearperiodofupto$100.0millioninborrowings.TheFNBCCreditFacilityhasamaturitydateofMarch20,2018.The Company has the option of requesting, during a period of time before each anniversary date, up to two additional one-yearextensionsofthematurity.
AdvancesundertheFNBCCreditFacilitycanbedrawnasbaserateadvanceswithinterestpayablemonthlyattheCIBCbaserate,plus0.35%perannum.AtMarch31,2017,advanceswouldbearinterestatarateof4.35%.FundscanalsobedrawnasLIBORloansforperiodsof1,2,3or6monthswithinterestpayableatarateofLIBORplus1.35%perannum.TheFNBCCreditFacilityissubjecttoastandbyfeeof0.27%perannum.
AsatMay9,2017,thefullamountof$1.1billionisavailableasneitherthecorporateentitynorFNBChaddrawnontheirrespective credit facility.
SubsequenttoMarch31,2017,2,100,718commonsharepurchasewarrantswithanexercisepriceofC$75.00perwarrantandanexpirydateofJune16,2017wereexercised,resultinginproceedsofC$157.6milliontotheCompany.AsatMay8,2017,thereremained4,407,675warrantsoutstanding.Shouldtheentiretyofthesewarrantsbeexercisedpriortotheirexpiry,theCompanywouldreceiveproceedsofC$330.6million.TheCompany’ssharepriceontheTorontoStockExchangeclosedatC$87.12onMarch31,2017,andatC$91.82onMay8,2017.
Management’sobjectiveswhenmanagingcapitalareto:
(a) ensure the preservation and availability of capital not being used for long-term investments by investing in lowriskinvestmentswithhighliquidity;and (b) ensure that adequate levels of capital are maintained to meet the Company’s operating requirements and other current liabilities.
AsatMarch31,2017,themajorityoffundswereheldincashdepositswithseveralfinancialinstitutions.Franco-Nevadainvestsitsexcessfundsintermdeposits.Certaininvestmentswithtermstomaturityuponacquisitionofthreemonths,or 92 days or less, were classified as term deposits.
OurperformanceisimpactedbyforeigncurrencyfluctuationsoftheCanadiandollarandAustraliandollarrelativetotheU.S.dollar.ThelargestexposureiswithrespecttotheCanadian/U.S.dollarexchangerateasweholdasignificantamountofourassetsinCanadaandreportourresultsinU.S.dollars.TheeffectofvolatilityinthesecurrenciesagainsttheU.S.dollarimpactsourcorporateadministration,businessdevelopmentexpensesanddepletiononmineralandoil&gasinterestsincurredinourCanadianandAustralianentitiesduetotheirrespectivefunctionalcurrencies.DuringQ1/2017,theCanadiandollartradedinarangeof$0.7405to$0.7690,closingthequarterat$0.7506,andtheAustraliandollartradedbetween$0.7207and$0.7723,closingthequarterat$0.7645.
Ournear-termcashrequirementsincludefundingoftheacquisitionoftheU.S.oil&gasroyaltiesintheMidlandBasin,commitmentsundertheCobrePanamastreamagreement,corporateadministrationcosts,certaincostsofoperations,paymentofdividendsandincometaxesdirectlyrelatedtotherecognitionofroyaltyandstreamrevenues.Asaroyalty/streamcompany,therearelimitedrequirementsforcapitalexpendituresotherthanfortheacquisitionofadditionalroyalties/streamsandworkinginterests’capitalcommitments.Suchacquisitionsareentirelydiscretionaryandwillbeconsummated through the use of cash, as available, or through the issuance of common shares or other equity or debt securitiesoruseofourcreditfacility.Webelievethatourcurrentcashresources,ouravailablecreditfacilityandfuturecash flows will be sufficient to cover the cost of our commitments under the various stream agreements, administrative expenses,costsofoperationsanddividendpaymentsfortheforeseeablefuture.
Franco-Nevada Corporation 27The Gold Investment that WORKS
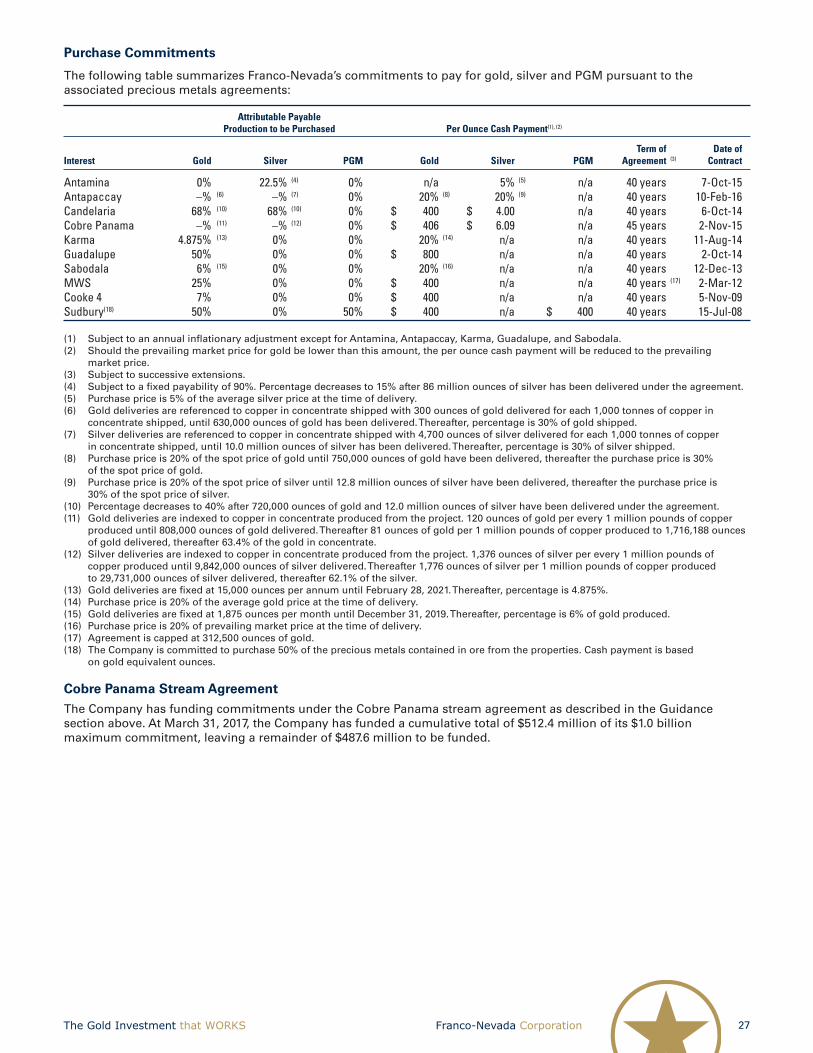
PurchaseCommitments
ThefollowingtablesummarizesFranco-Nevada’scommitmentstopayforgold,silverandPGMpursuanttotheassociatedpreciousmetalsagreements: Attributable Payable Production to be Purchased Per Ounce Cash Payment(1), (2)
Term of Date ofInterest Gold Silver PGM Gold Silver PGM Agreement (3) Contract
Antamina 0% 22.5% (4) 0% n/a 5% (5) n/a 40 years 7-Oct-15Antapaccay –% (6) –% (7) 0% 20% (8) 20% (9) n/a 40 years 10-Feb-16Candelaria 68% (10) 68% (10) 0% $ 400 $ 4.00 n/a 40 years 6-Oct-14Cobre Panama –% (11) –% (12) 0% $ 406 $ 6.09 n/a 45 years 2-Nov-15Karma 4.875% (13) 0% 0% 20% (14) n/a n/a 40 years 11-Aug-14Guadalupe 50% 0% 0% $ 800 n/a n/a 40 years 2-Oct-14Sabodala 6% (15) 0% 0% 20% (16) n/a n/a 40 years 12-Dec-13MWS 25% 0% 0% $ 400 n/a n/a 40 years (17) 2-Mar-12Cooke 4 7% 0% 0% $ 400 n/a n/a 40 years 5-Nov-09Sudbury(18) 50% 0% 50% $ 400 n/a $ 400 40 years 15-Jul-08
(1) SubjecttoanannualinflationaryadjustmentexceptforAntamina,Antapaccay,Karma,Guadalupe,andSabodala.(2) Shouldtheprevailingmarketpriceforgoldbelowerthanthisamount,theperouncecashpaymentwillbereducedtotheprevailing
market price.(3) Subjecttosuccessiveextensions.(4) Subjecttoafixedpayabilityof90%.Percentagedecreasesto15%after86millionouncesofsilverhasbeendeliveredundertheagreement.(5) Purchasepriceis5%oftheaveragesilverpriceatthetimeofdelivery.(6) Golddeliveriesarereferencedtocopperinconcentrateshippedwith300ouncesofgolddeliveredforeach1,000tonnesofcopperin
concentrateshipped,until630,000ouncesofgoldhasbeendelivered.Thereafter,percentageis30%ofgoldshipped.(7) Silverdeliveriesarereferencedtocopperinconcentrateshippedwith4,700ouncesofsilverdeliveredforeach1,000tonnesofcopper
in concentrate shipped, until 10.0 million ounces of silver has been delivered. Thereafter, percentage is 30% of silver shipped.(8) Purchasepriceis20%ofthespotpriceofgolduntil750,000ouncesofgoldhavebeendelivered,thereafterthepurchasepriceis30%
of the spot price of gold.(9) Purchasepriceis20%ofthespotpriceofsilveruntil12.8millionouncesofsilverhavebeendelivered,thereafterthepurchasepriceis
30% of the spot price of silver.(10) Percentagedecreasesto40%after720,000ouncesofgoldand12.0millionouncesofsilverhavebeendeliveredundertheagreement.(11) Golddeliveriesareindexedtocopperinconcentrateproducedfromtheproject.120ouncesofgoldperevery1millionpoundsofcopper
produceduntil808,000ouncesofgolddelivered.Thereafter81ouncesofgoldper1millionpoundsofcopperproducedto1,716,188ounces ofgolddelivered,thereafter63.4%ofthegoldinconcentrate.
(12) Silverdeliveriesareindexedtocopperinconcentrateproducedfromtheproject.1,376ouncesofsilverperevery1millionpoundsof copperproduceduntil9,842,000ouncesofsilverdelivered.Thereafter1,776ouncesofsilverper1millionpoundsofcopperproduced to29,731,000ouncesofsilverdelivered,thereafter62.1%ofthesilver.
(13) Golddeliveriesarefixedat15,000ouncesperannumuntilFebruary28,2021.Thereafter,percentageis4.875%.(14) Purchasepriceis20%oftheaveragegoldpriceatthetimeofdelivery.(15) Golddeliveriesarefixedat1,875ouncespermonthuntilDecember31,2019.Thereafter,percentageis6%ofgoldproduced.(16) Purchasepriceis20%ofprevailingmarketpriceatthetimeofdelivery.(17) Agreementiscappedat312,500ouncesofgold.(18) TheCompanyiscommittedtopurchase50%ofthepreciousmetalscontainedinorefromtheproperties.Cashpaymentisbased
on gold equivalent ounces.
CobrePanamaStreamAgreementTheCompanyhasfundingcommitmentsundertheCobrePanamastreamagreementasdescribedintheGuidancesectionabove.AtMarch31,2017,theCompanyhasfundedacumulativetotalof$512.4millionofits$1.0billionmaximumcommitment,leavingaremainderof$487.6milliontobefunded.

2017 First Quarter Report FNV TSX NYSE28
Critical Accounting EstimatesThepreparationofconsolidatedfinancialstatementsinaccordancewithIFRSrequirestheCompanytomakejudgments,estimates and assumptions that affect the reported amounts of assets and liabilities and disclosures of contingent assets andliabilitiesatthedateoftheconsolidatedfinancialstatementsandthereportedamountsofrevenuesandexpensesduring the reporting period. Estimates and assumptions are continuously evaluated and are based on management’s bestknowledgeoftherelevantfactsandcircumstances,havingregardtopreviousexperience.However,actualoutcomes may differ from the amounts included in the consolidated financial statements.
Our significant accounting policies and estimates are disclosed in notes 2 and 3 of our most recent annual consolidated financial statements.
NewandamendedstandardsadoptedbytheCompany
ThefollowingstandardwaseffectiveandimplementedasofJanuary1,2017.
IAS12IncomeTaxes
IAS12Incometaxesprovidesguidanceontherecognitionofdeferredtaxassets.InJanuary2016,theIASBissuedamendmentstoclarifytherequirementsforrecognizingdeferredtaxassetsonunrealizedlosses.Theamendmentsclarifytheaccountingfordeferredtaxwhereanassetismeasuredatfairvalueandthatfairvalueisbelowtheasset’staxbase.Theyalsoclarifycertainotheraspectsofaccountingfordeferredtaxassets.TheamendmentsareeffectiveforannualperiodsbeginningonorafterJanuary1,2017.TheCompanyhasadoptedtheamendmentstoIAS12initsfinancialstatementsfortheannualperiodbeginningonJanuary1,2017.Theadoptionoftheamendmentsdidnothave a material impact on the consolidated financial statements.
NewAccountingStandardsIssuedButNotYetEffective
IFRS9FinancialInstruments
OnJuly24,2014,theIASBpublishedthefinalversionIFRS9FinancialInstrumentswhichbringstogethertheclassification,measurement,impairmentandhedgeaccountingphasesoftheIASB’sprojecttoreplaceIAS39FinancialInstruments:RecognitionandMeasurement.IFRS9includesalossimpairmentmodel,amendstheclassificationandmeasurement model for financial assets by adding a new fair value through comprehensive income category for certain debt instruments and provides additional guidance on how to apply the business model and contractual cash flow characteristicstest.ThisfinalversionofIFRS9supersedesallpreviousversionsofIFRS9andiseffectiveforperiodsbeginningonorafterJanuary1,2018.TheCompanyiscurrentlyassessingtheimpactofIFRS9ontheconsolidatedfinancialstatements.TheCompanyexpectstoreportmoredetailedinformation,includingestimatedquantitativefinancial impacts, if material, in its consolidated financial statements as the effective date approaches.
IFRS15RevenuefromContractswithCustomers
InMay2014,theIASBissuedIFRS15RevenuefromContractswithCustomers.Thenewstandardprovidesacomprehensive framework for recognition, measurement and disclosure of revenue from contracts with customers, excludingcontractswithinthescopeofthestandardsonleases,insurancecontractsandfinancialinstruments.IFRS15becomeseffectiveforannualperiodsbeginningonorafterJanuary1,2018andistobeappliedretrospectivelywithearlyadoptionpermitted.TheCompanyisintheprocessofassessingtheimpactofIFRS15ontheconsolidatedfinancialstatements.TheCompanyexpectstoreportmoredetailedinformation,includingestimatedquantitativefinancialimpacts, if material, in its consolidated financial statements as the effective date approaches.

Franco-Nevada Corporation 29The Gold Investment that WORKS
Outstanding Share DataFranco-Nevadaisauthorizedtoissueanunlimitednumberofcommonandpreferredshares.Adetaileddescriptionoftherights,privileges,restrictionsandconditionsattachedtoeachclassofauthorizedsharesisincludedinourAnnualInformationFormfortheyearendedDecember31,2016,acopyofwhichcanbefoundonSEDARatwww.sedar.com andinour40-F,acopyofwhichcanbefoundonEDGARatwww.sec.gov.
AsofMay8,2017,thenumberofcommonsharesoutstandingorissuablepursuanttootheroutstandingsecuritiesis asfollows: Common Shares Number
Outstanding 180,726,678Issuable upon exercise of Franco-Nevada warrants(1) 4,407,675Issuable upon exercise of Franco-Nevada options(2) 1,304,328Issuable upon exercise of special warrant(3) 2,000,000Issuable upon vesting of Franco-Nevada RSUs 138,614
Diluted common shares 188,577,295
(1) The warrants have an exercise price of C$75.00 per share and an expiry date of June 16, 2017.(2) There were 1,304,328 stock options under our share compensation plan outstanding to directors, officers, employees and others with exercise prices ranging from
C$15.20 to C$75.45 per share.(3) In connection with the transaction with Taseko Mines Limited, one special warrant was granted to Taseko which will be exchangeable into 2,000,000 purchase share
warrants once Taseko’s New Prosperity project gets fully permitted and financed. Each purchase share warrant will entitle Taseko to purchase one Franco-Nevada common share at a price of C$75.00 per share before June 16, 2017. New Prosperity’s most recent permit application was denied in 2014.
Franco-Nevada has not issued any preferred shares.
Internal Control Over Financial Reporting and Disclosure Controls andProceduresOurChiefExecutiveOfficerandChiefFinancialOfficerareresponsibleforestablishingandmaintainingFranco-Nevada’sinternal control over financial reporting and other financial disclosure and our disclosure controls and procedures.
Internal control over financial reporting is a process designed to provide reasonable assurance regarding the reliabilityoffinancialreportingandthepreparationoffinancialstatementsforexternalpurposesinaccordancewithIFRS.Franco-Nevada’sinternalcontroloverfinancialreportingincludesthosepoliciesandproceduresthat(i)pertaintothe maintenance of records that, in reasonable detail, accurately and fairly reflect the transactions and dispositions of the assetsofFranco-Nevada;(ii)aredesignedtoprovidereasonableassurancethattransactionsarerecordedasnecessarytopermitpreparationoffinancialstatementsinaccordancewithIFRS,andthatreceiptsandexpendituresofFranco-NevadaarebeingmadeonlyinaccordancewithauthorizationsofmanagementanddirectorsofFranco-Nevada;and(iii) are designed to provide reasonable assurance regarding prevention or timely detection of unauthorized acquisition, use or disposition of Franco-Nevada’s assets that could have a material effect on Franco-Nevada’s financial statements. Internal control over other financial disclosure is a process designed to ensure that other financial information included inthisMD&A,fairlyrepresentsinallmaterialrespectsthefinancialcondition,resultsofoperationsandcashflowsofFranco-NevadafortheperiodspresentedinthisMD&A.
Franco-Nevada’s disclosure controls and procedures are designed to provide reasonable assurance that material information relating to Franco-Nevada, including its consolidated subsidiaries, is made known to management by others within those entities, particularly during the period in which this report is prepared and that information required to be disclosed by Franco-Nevada in its annual filings, interim filings or other reports filed or submitted by it under securities legislation is recorded, processed, summarized and reported within the time periods specified in securities legislation.
Due to its inherent limitations, internal control over financial reporting and other financial disclosure may not prevent or detectallmisstatements.Also,projectionsofanyevaluationofeffectivenesstofutureperiodsaresubjecttotheriskthatcontrols may become inadequate because of changes in conditions, or that the degree of compliance with the policies or procedures may change.
For the three months ended March 31, 2017, there has been no change in Franco-Nevada’s internal control over financial reporting that has materially affected, or is reasonably likely to materially affect, Franco-Nevada’s internal control over financial reporting.
2017 First Quarter Report FNV TSX NYSE30
Non-IFRS Financial MeasuresAdjustedEBITDAandAdjustedEBITDApershare
AdjustedEBITDAandAdjustedEBITDApersharearenon-IFRSfinancialmeasures,whichexcludethefollowingfromnetincomeandearningspershare(“EPS”):
• Incometaxexpense/recovery; • Financeexpenses; • Financeincome; • Depletionanddepreciation; • Non-cashcostsofsales; • Impairmentchargesrelatedtoroyalty,streamandworkinginterests; • Impairmentofinvestments; • Gains/lossesonsaleofroyalty,streamandworkinginterests; • Gains/lossesoninvestments; • Foreignexchangegains/lossesandotherincome/expenses;and • Unusualnon-recurringitems.
ManagementusesAdjustedEBITDAandAdjustedEBITDApersharetoevaluatetheunderlyingoperatingperformanceof the Company as a whole for the reporting periods presented, to assist with the planning and forecasting of future operating results, and to supplement information in its financial statements. The Company also uses Margin, which is definedasAdjustedEBITDAdividedbyrevenue,initsannualincentivecompensationprocesstoevaluatemanagement’sperformance in increasing revenue and containing costs. Management believes that in addition to measures prepared inaccordancewithIFRSsuchasNetIncomeandEarningsperShare,ourinvestorsandanalystsuseAdjustedEBITDAandAdjustedEBITDApersharetoevaluatetheresultsoftheunderlyingbusinessoftheCompany,particularlysincetheexcludeditemsaretypicallynotincludedinourguidance,withtheexceptionofdepletionanddepreciationexpense.WhiletheadjustmentstonetincomeandEPSinthesemeasuresincludeitemsthatarebothrecurringandnon-recurring,managementbelievesthatAdjustedEBITDAandAdjustedEBITDApershareareusefulmeasuresoftheCompany’sperformancebecausetheyadjustforitemswhichmaynotrelatetoorhaveadisproportionateeffectontheperiodin which they are recognized, impact the comparability of our core operating results from period to period, are not always reflective of the underlying operating performance of our business and/or are not necessarily indicative of future operatingresults.AdjustedEBITDAandAdjustedEBITDApershareareonlyintendedtoprovideadditionalinformationto investors and analysts, and should not be considered in isolation or as a substitute for measures of performance preparedinaccordancewithIFRS.TheydonothaveanystandardizedmeaningunderIFRS,andmaynotbecomparableto similar measures presented by other issuers.

Franco-Nevada Corporation 31The Gold Investment that WORKS
ReconciliationofNetIncometoAdjustedEBITDA: For the three months ended March 31, (expressed in millions, except per share amounts) 2017 2016
Net Income $ 45.6 $ 30.0 Income tax expense 10.4 8.1 Finance expenses 0.8 1.3 Finance income (0.9 ) (1.1 ) Depletion and depreciation 71.5 65.5 Non-cash costs of sales 1.8 1.8 (Gain) on investments – (1.5 ) Foreign exchange (gains)/losses and other (income)/expenses (0.7 ) 0.3
Adjusted EBITDA $ 128.5 $ 104.4Basic weighted average shares outstanding 178.5 166.8
Basic EPS $ 0.26 $ 0.18 Income tax expense 0.06 0.05 Finance expenses – 0.01 Finance income (0.01 ) (0.01 ) Depletion and depreciation 0.40 0.39 Non-cash costs of sales 0.01 0.02 (Gain) on investments – (0.01 ) Foreign exchange (gains)/losses and other (income)/expenses – –
Adjusted EBITDA per share $ 0.72 $ 0.63
Margin
Marginisanon-IFRSfinancialmeasurewhichisdefinedbytheCompanyasAdjustedEBITDAdividedbyrevenue.The Company uses Margin in its annual incentive compensation process to evaluate management’s performance in increasing revenue and containing costs. Margin is intended to provide additional information, does not have any standardizeddefinitionunderIFRSandshouldnotbeconsideredinisolationorasasubstituteforameasureofperformanceinaccordancewithIFRS.
ReconciliationofNetIncometoMargin: For the three months ended March 31, (expressed in millions, except Margin) 2017 2016
Net Income $ 45.6 $ 30.0 Income tax expense 10.4 8.1 Finance expenses 0.8 1.3 Finance income (0.9 ) (1.1 ) Depletion and depreciation 71.5 65.5 Non-cash costs of sales 1.8 1.8 (Gain) on investments – (1.5 ) Foreign exchange (gains)/losses and other (income)/expenses (0.7 ) 0.3
Adjusted EBITDA $ 128.5 $ 104.4Revenue 172.7 132.0Margin 74.4% 79.1%
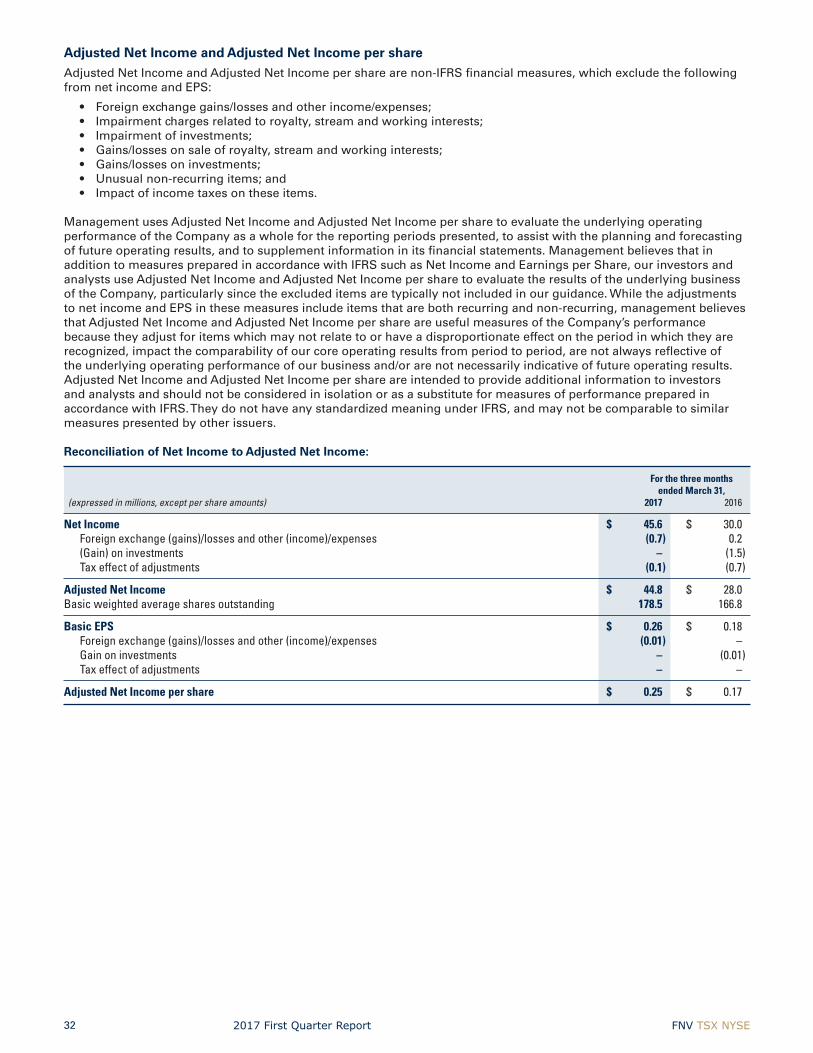
2017 First Quarter Report FNV TSX NYSE32
AdjustedNetIncomeandAdjustedNetIncomepershareAdjustedNetIncomeandAdjustedNetIncomepersharearenon-IFRSfinancialmeasures,whichexcludethefollowingfromnetincomeandEPS:
• Foreignexchangegains/lossesandotherincome/expenses; • Impairmentchargesrelatedtoroyalty,streamandworkinginterests; • Impairmentofinvestments; • Gains/lossesonsaleofroyalty,streamandworkinginterests; • Gains/lossesoninvestments; • Unusualnon-recurringitems;and • Impactofincometaxesontheseitems.
ManagementusesAdjustedNetIncomeandAdjustedNetIncomepersharetoevaluatetheunderlyingoperatingperformance of the Company as a whole for the reporting periods presented, to assist with the planning and forecasting of future operating results, and to supplement information in its financial statements. Management believes that in additiontomeasurespreparedinaccordancewithIFRSsuchasNetIncomeandEarningsperShare,ourinvestorsandanalystsuseAdjustedNetIncomeandAdjustedNetIncomepersharetoevaluatetheresultsoftheunderlyingbusinessoftheCompany,particularlysincetheexcludeditemsaretypicallynotincludedinourguidance.WhiletheadjustmentstonetincomeandEPSinthesemeasuresincludeitemsthatarebothrecurringandnon-recurring,managementbelievesthatAdjustedNetIncomeandAdjustedNetIncomepershareareusefulmeasuresoftheCompany’sperformancebecausetheyadjustforitemswhichmaynotrelatetoorhaveadisproportionateeffectontheperiodinwhichtheyarerecognized, impact the comparability of our core operating results from period to period, are not always reflective of the underlying operating performance of our business and/or are not necessarily indicative of future operating results. AdjustedNetIncomeandAdjustedNetIncomepershareareintendedtoprovideadditionalinformationtoinvestorsand analysts and should not be considered in isolation or as a substitute for measures of performance prepared in accordancewithIFRS.TheydonothaveanystandardizedmeaningunderIFRS,andmaynotbecomparabletosimilarmeasures presented by other issuers.
ReconciliationofNetIncometoAdjustedNetIncome: For the three months ended March 31, (expressed in millions, except per share amounts) 2017 2016
Net Income $ 45.6 $ 30.0 Foreign exchange (gains)/losses and other (income)/expenses (0.7 ) 0.2 (Gain) on investments – (1.5 ) Tax effect of adjustments (0.1 ) (0.7 )
Adjusted Net Income $ 44.8 $ 28.0Basic weighted average shares outstanding 178.5 166.8
Basic EPS $ 0.26 $ 0.18 Foreign exchange (gains)/losses and other (income)/expenses (0.01 ) – Gain on investments – (0.01 ) Tax effect of adjustments – –
Adjusted Net Income per share $ 0.25 $ 0.17

Franco-Nevada Corporation 33The Gold Investment that WORKS
Cautionary Statement on Forward-Looking InformationThisMD&Acontains“forward-lookinginformation”and“forward-lookingstatements”withinthemeaningofapplicableCanadiansecuritieslawsandtheUnitedStatesPrivateSecuritiesLitigationReformActof1995,respectively,whichmay include, but are not limited to, statements with respect to future events or future performance, management’s expectationsregardingFranco-Nevada’sgrowth,resultsofoperations,estimatedfuturerevenues,carryingvalueofassets, future dividends and requirements for additional capital, mineral reserve and mineral resource estimates, productionestimates,productioncostsandrevenue,futuredemandforandpricesofcommodities,expectedminingsequences, business prospects and opportunities. In addition, statements (including data in tables) relating to reserves and resources and gold equivalent ounces are forward-looking statements, as they involve implied assessment, based on certain estimates and assumptions, and no assurance can be given that the estimates and assumptions are accurate andthatsuchreservesandresourcesandGEOswillberealized.Suchforward-lookingstatementsreflectmanagement’scurrent beliefs and are based on information currently available to management. Often, but not always, forward-looking statementscanbeidentifiedbytheuseofwordssuchas“plans”,“expects”,“isexpected”,“budgets”,“scheduled”,“estimates”,“forecasts”,“predicts”,“projects”,“intends”,“targets”,“aims”,“anticipates”or“believes”orvariations(including negative variations) of such words and phrases or may be identified by statements to the effect that certain actions “may”, “could”, “should”, “would”, “might” or “will” be taken, occur or be achieved. Forward-looking statements involve known and unknown risks, uncertainties and other factors, which may cause the actual results, performance or achievements of Franco-Nevada to be materially different from any future results, performance or achievements expressedorimpliedbytheforward-lookingstatements.Anumberoffactorscouldcauseactualeventsorresultstodiffermateriallyfromanyforward-lookingstatements,including,withoutlimitation:fluctuationsinthepricesoftheprimary commodities that drive royalty and stream revenue (gold, platinum group metals, copper, nickel, uranium,silver,iron-oreandoil&gas);fluctuationsinthevalueoftheCanadian,AustraliandollarandMexicanPesoandanyothercurrencyinwhichrevenueisgenerated,relativetotheU.S.dollar;changesinnationalandlocalgovernmentlegislation,includingpermittingandlicensingregimesandtaxationpoliciesandtheenforcementthereof;regulatory,political or economic developments in any of the countries where properties in which Franco-Nevada holds a royalty, streamorotherinterestarelocatedorthroughwhichtheyareheld;risksrelatedtotheoperatorsofthepropertiesinwhich Franco-Nevada holds a royalty, stream or other interest, including changes in the ownership and control of such operators;influenceofmacroeconomicdevelopments;businessopportunitiesthatbecomeavailableto,orarepursuedbyFranco-Nevada;reducedaccesstodebtandequitycapital;litigation;title,permitorlicensedisputesrelatedtointerestsonanyofthepropertiesinwhichFranco-Nevadaholdsaroyalty,streamorotherinterest;whetherornottheCompanyisdeterminedtohave“passiveforeigninvestmentcompany”(“PFIC”)statusasdefinedinSection1297oftheUnitedStatesInternalRevenueCodeof1986,asamended;potentialchangesinCanadiantaxtreatmentofoffshorestreams;excessivecostescalationaswellasdevelopment,permitting,infrastructure,operatingortechnicaldifficultiesonanyofthepropertiesinwhichFranco-Nevadaholdsaroyalty,streamorotherinterest;actualmineralcontentmaydifferfromthereservesandresourcescontainedintechnicalreports;rateandtimingofproductiondifferencesfromresourceestimates,othertechnicalreportsandmineplans;risksandhazardsassociatedwiththebusinessofdevelopment and mining on any of the properties in which Franco-Nevada holds a royalty, stream or other interest, including,butnotlimitedtounusualorunexpectedgeologicalandmetallurgicalconditions,slopefailuresorcave-ins,floodingandothernaturaldisasters,terrorism,civilunrestoranoutbreakofcontagiousdisease;andtheintegrationofacquiredassets.Theforward-lookingstatementscontainedinthisMD&Aarebaseduponassumptionsmanagementbelievestobereasonable,including,withoutlimitation:theongoingoperationofthepropertiesinwhichFranco-Nevadaholds a royalty, stream or other interest by the owners or operators of such properties in a manner consistent with pastpractice;theaccuracyofpublicstatementsanddisclosuresmadebytheownersoroperatorsofsuchunderlyingproperties;nomaterialadversechangeinthemarketpriceofthecommoditiesthatunderlietheassetportfolio;theCompany’songoingincomeandassetsrelatingtodeterminationofitsPFICstatus;nomaterialchangestoexistingtaxtreatment;noadversedevelopmentinrespectofanysignificantpropertyinwhichFranco-Nevadaholdsaroyalty,streamorotherinterest;theaccuracyofpubliclydisclosedexpectationsforthedevelopmentofunderlyingpropertiesthatarenotyetinproduction;integrationofacquiredassets;andtheabsenceofanyotherfactorsthatcouldcauseactions, events or results to differ from those anticipated, estimated or intended. However, there can be no assurance that forward-looking statements will prove to be accurate, as actual results and future events could differ materiallyfrom those anticipated in such statements. Investors are cautioned that forward-looking statements are not guaranteesof future performance. Franco-Nevada cannot assure investors that actual results will be consistent with theseforward-lookingstatements.Accordingly,investorsshouldnotplaceunduerelianceonforward-lookingstatementsdue to the inherent uncertainty therein. For additional information with respect to risks, uncertainties and assumptions, pleaserefertoFranco-Nevada’smostrecentAnnualInformationFormfiledwiththeCanadiansecuritiesregulatoryauthoritiesonwww.sedar.comandFranco-Nevada’smostrecentAnnualReportfiledonForm40-FfiledwiththeSEConwww.sec.gov.Theforward-lookingstatementshereinaremadeasofthedateofthisMD&AonlyandFranco-Nevadadoes not assume any obligation to update or revise them to reflect new information, estimates or opinions, futureeventsorresultsorotherwise,exceptasrequiredbyapplicablelaw.

2017 First Quarter Report FNV TSX NYSE34
At March 31, December 31, 2017 2016
ASSETS Cash and cash equivalents (Note 4) $ 283.0 $ 253.0Receivables 69.1 71.1Prepaid expenses and other (Note 6) 36.0 37.1
Current assets 388.1 361.2
Royalty, stream and working interests, net (Note 3) 3,665.4 3,668.3Investments (Note 5) 150.6 147.4Deferred income tax assets 21.9 21.3Other assets (Note 7) 21.8 23.4
Total assets $ 4,247.8 $ 4,221.6
LIABILITIES Accounts payable and accrued liabilities $ 16.8 $ 21.0Current income tax liabilities 15.1 16.6
Current liabilities 31.9 37.6 Deferred income tax liabilities 41.0 37.5
Total liabilities 72.9 75.1
SHAREHOLDERS’ EQUITY (Note 14) Common shares 4,675.6 4,666.2Contributed surplus 43.2 41.6Deficit (330.6 ) (336.8 )Accumulated other comprehensive loss (213.3 ) (224.5 )
Total shareholders’ equity 4,174.9 4,146.5
Total liabilities and shareholders’ equity $ 4,247.8 $ 4,221.6
Subsequent events (Note 17) The accompanying notes are an integral part of these condensed consolidated financial statements.
Franco-NevadaCorporation
Condensed Consolidated Statement of Financial Position(unaudited,inmillionsofU.S.dollars)
Financial Statements
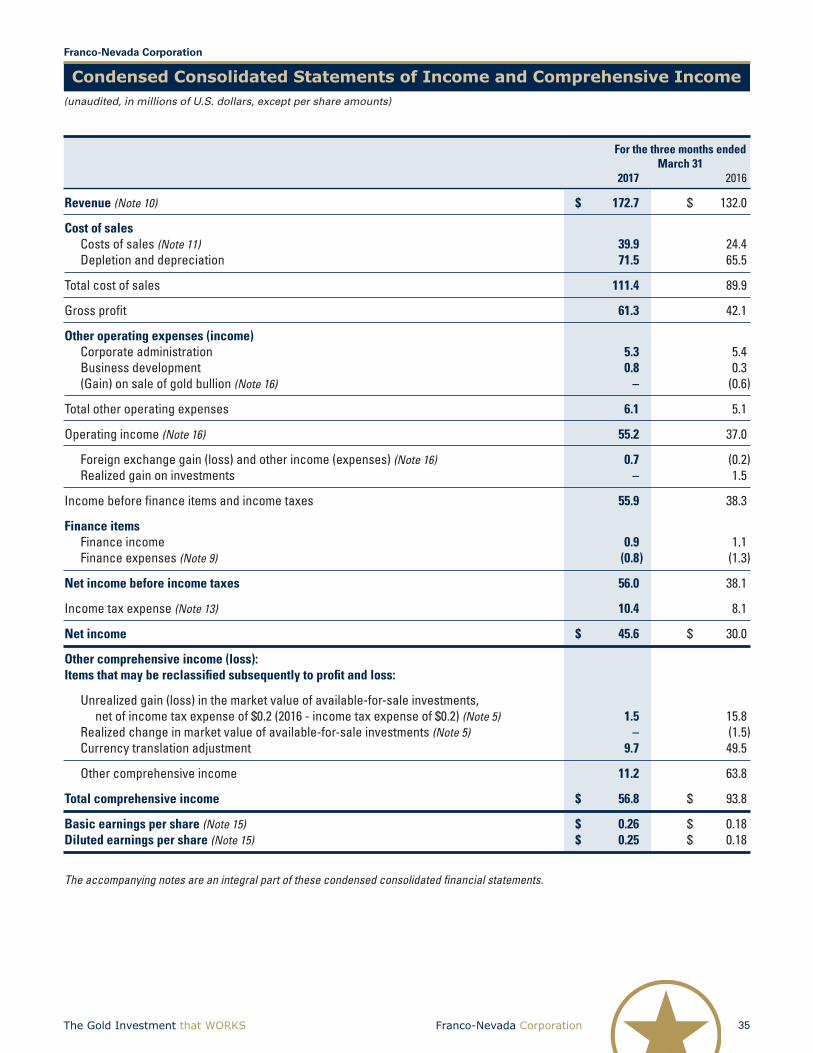
Franco-Nevada Corporation 35The Gold Investment that WORKS
Franco-NevadaCorporation
Condensed Consolidated Statements of Income and Comprehensive Income (unaudited,inmillionsofU.S.dollars,exceptpershareamounts)
For the three months ended March 31 2017 2016 Revenue (Note 10) $ 172.7 $ 132.0
Cost of sales Costs of sales (Note 11) 39.9 24.4 Depletion and depreciation 71.5 65.5
Total cost of sales 111.4 89.9
Gross profit 61.3 42.1
Other operating expenses (income) Corporate administration 5.3 5.4 Business development 0.8 0.3 (Gain) on sale of gold bullion (Note 16) – (0.6 )
Total other operating expenses 6.1 5.1
Operating income (Note 16) 55.2 37.0
Foreign exchange gain (loss) and other income (expenses) (Note 16) 0.7 (0.2 ) Realized gain on investments – 1.5
Income before finance items and income taxes 55.9 38.3
Finance items Finance income 0.9 1.1 Finance expenses (Note 9) (0.8 ) (1.3 )
Net income before income taxes 56.0 38.1
Income tax expense (Note 13) 10.4 8.1
Net income $ 45.6 $ 30.0
Other comprehensive income (loss):Items that may be reclassified subsequently to profit and loss:
Unrealized gain (loss) in the market value of available-for-sale investments, net of income tax expense of $0.2 (2016 - income tax expense of $0.2) (Note 5) 1.5 15.8 Realized change in market value of available-for-sale investments (Note 5) – (1.5 ) Currency translation adjustment 9.7 49.5
Other comprehensive income 11.2 63.8
Total comprehensive income $ 56.8 $ 93.8
Basic earnings per share (Note 15) $ 0.26 $ 0.18Diluted earnings per share (Note 15) $ 0.25 $ 0.18
The accompanying notes are an integral part of these condensed consolidated financial statements.
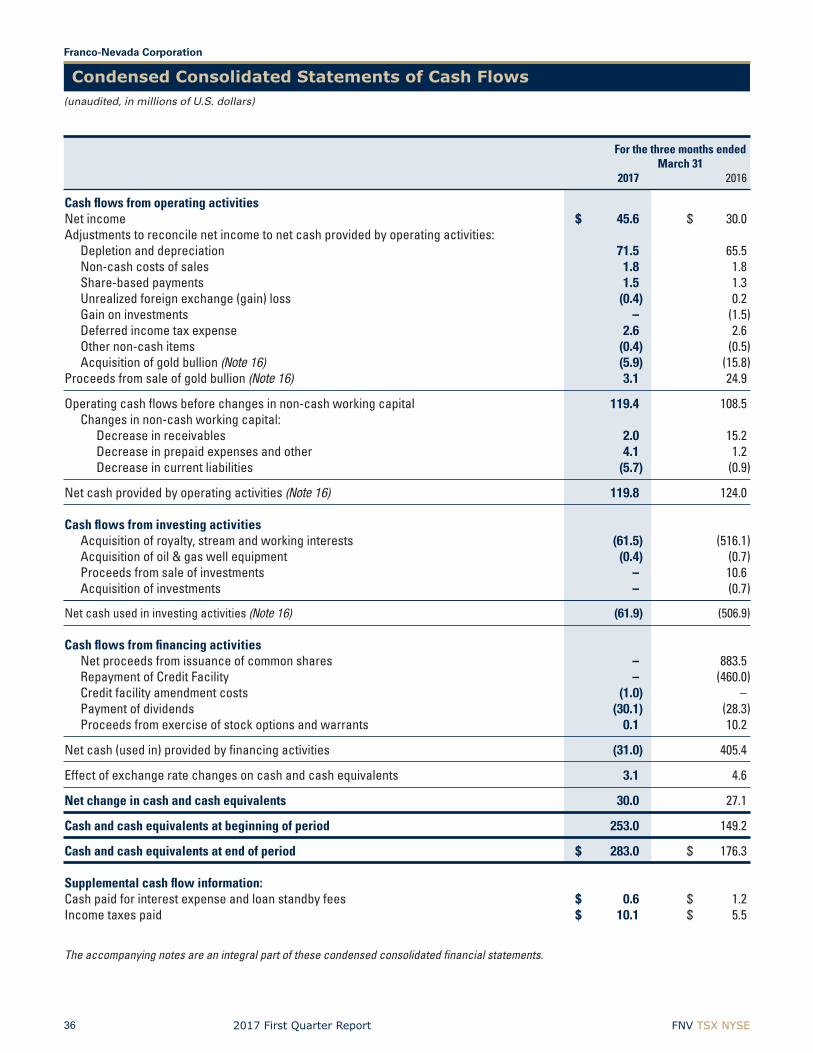
2017 First Quarter Report FNV TSX NYSE36
For the three months ended March 31 2017 2016
Cash flows from operating activities Net income $ 45.6 $ 30.0Adjustments to reconcile net income to net cash provided by operating activities: Depletion and depreciation 71.5 65.5 Non-cash costs of sales 1.8 1.8 Share-based payments 1.5 1.3 Unrealized foreign exchange (gain) loss (0.4 ) 0.2 Gain on investments – (1.5 ) Deferred income tax expense 2.6 2.6 Other non-cash items (0.4 ) (0.5 ) Acquisition of gold bullion (Note 16) (5.9 ) (15.8 )Proceeds from sale of gold bullion (Note 16) 3.1 24.9
Operating cash flows before changes in non-cash working capital 119.4 108.5 Changes in non-cash working capital: Decrease in receivables 2.0 15.2 Decrease in prepaid expenses and other 4.1 1.2 Decrease in current liabilities (5.7 ) (0.9 )
Net cash provided by operating activities (Note 16) 119.8 124.0 Cash flows from investing activities Acquisition of royalty, stream and working interests (61.5 ) (516.1 ) Acquisition of oil & gas well equipment (0.4 ) (0.7 ) Proceeds from sale of investments – 10.6 Acquisition of investments – (0.7 )
Net cash used in investing activities (Note 16) (61.9 ) (506.9 ) Cash flows from financing activities Net proceeds from issuance of common shares – 883.5 Repayment of Credit Facility – (460.0 ) Credit facility amendment costs (1.0 ) – Payment of dividends (30.1 ) (28.3 ) Proceeds from exercise of stock options and warrants 0.1 10.2
Net cash (used in) provided by financing activities (31.0 ) 405.4
Effect of exchange rate changes on cash and cash equivalents 3.1 4.6
Net change in cash and cash equivalents 30.0 27.1
Cash and cash equivalents at beginning of period 253.0 149.2
Cash and cash equivalents at end of period $ 283.0 $ 176.3 Supplemental cash flow information: Cash paid for interest expense and loan standby fees $ 0.6 $ 1.2Income taxes paid $ 10.1 $ 5.5
The accompanying notes are an integral part of these condensed consolidated financial statements.
Franco-NevadaCorporation
Condensed Consolidated Statements of Cash Flows(unaudited,inmillionsofU.S.dollars)

Franco-Nevada Corporation 37The Gold Investment that WORKS
Accumulated other Share capital Contributed comprehensive Total (Note 14) Surplus income (loss) Deficit Equity
Balance at January 1, 2017 $ 4,666.2 $ 41.6 $ (224.5 ) $ (336.8 ) $ 4,146.5 Net income – – – 45.6 45.6 Other comprehensive income – – 11.2 – 11.2
Total comprehensive income – – – – 56.8 Exercise of warrants 0.1 – – – 0.1 Share-based payments – 1.6 – – 1.6 Dividend reinvestment plan 9.3 – – – 9.3 Dividends declared – – – (39.4 ) (39.4 )
Balance at March 31, 2017 $ 4,675.6 $ 43.2 $ (213.3 ) $ (330.6 ) $ 4,174.9 Balance at January 1, 2016 $ 3,709.0 $ 44.3 $ (288.1 ) $ (302.2 ) $ 3,163.0 Net income – – – 30.0 30.0 Other comprehensive income – – 63.8 – 63.8
Total comprehensive income – – – – 93.8 Equity offering 894.0 – – – 894.0 Exercise of stock options 13.5 (3.3 ) – – 10.2 Share-based payments – 1.5 – – 1.5 Dividend reinvestment plan 10.2 – – – 10.2 Dividends declared – – – (38.5 ) (38.5 )
Balance at March 31, 2016 $ 4,626.7 $ 42.5 $ (224.3 ) $ (310.7 ) $ 4,134.2
The accompanying notes are an integral part of these condensed consolidated financial statements.
Franco-NevadaCorporation
Condensed Consolidated Statements of Changes in Shareholders’ Equity(unaudited,inmillionsofU.S.dollars)

2017 First Quarter Report FNV TSX NYSE38
Franco-NevadaCorporation
Notes to the Condensed Consolidated Financial StatementsForthethreemonthsendedMarch31,2017and2016(unaudited,expressedinmillionsofU.S.dollarsexceptshareandpershareamounts)
Note 1 - Corporate InformationFranco-NevadaCorporation(“Franco-Nevada”orthe“Company”)isincorporatedundertheCanadaBusinessCorporationsAct.TheCompanyisagold-focusedroyaltyandstreamcompanywithadditionalinterestsinsilver,platinumgroupmetals,oil&gasandotherresourceassets.ThemajorityofrevenuesaregeneratedfromadiversifiedportfolioofpropertiesintheUnitedStates,Canada,Mexico,Peru,Chile,AustraliaandAfrica.AtMarch31,2017,theportfolioincludesapproximately338assets(notincludingtheMidlandBasinportfolioofroyalties,asdiscussedinNote3(a))coveringpropertiesatvariousstagesfromproductiontoearlystageexploration.
TheCompany’ssharesarelistedontheTorontoStockExchangeandtheNewYorkStockExchangeandtheCompanyisdomiciledinCanada.TheCompany’sheadandregisteredofficeislocatedat199BayStreet,Suite2000,Toronto,Ontario,Canada.
Note 2 - Significant accounting policies(a) Basisofpresentation
These unaudited condensed consolidated interim financial statements have been prepared in accordance with InternationalFinancialReportingStandards(“IFRS”)asissuedbytheInternationalAccountingStandardsBoard(“IASB”)applicabletothepreparationofcondensedinterimfinancialstatements,includingIAS34InterimFinancialReporting.ThesecondensedconsolidatedinterimfinancialstatementsshouldbereadinconjunctionwiththeCompany’sannualconsolidatedfinancialstatementsfortheyearendedDecember31,2016andwerepreparedusingthe same accounting policies, method of computation and presentation as were applied in the annual consolidated financialstatementsfortheyearendedDecember31,2016.TheseconsolidatedfinancialstatementswereauthorizedforissuancebytheBoardofDirectorsonMay9,2017.
Thefinancialinformationincludedhereinreflectsalladjustments,consistingonlyofnormalrecurringadjustmentswhich, in the opinion of management, are necessary for a fair presentation of the results for the interim periods presented. The results of operations for the three months ended March 31, 2017 are not necessarily indicative of theresultstobeexpectedforthefullyear.Seasonalityisnotconsideredtohaveasignificantimpactoverthecondensedconsolidatedinterimfinancialstatements.Taxesonincomeintheinterimperiodhavebeenaccrued usingthetaxratesthatwouldbeapplicabletoexpectedtotalannualincome.
(b) NewandamendedstandardsadoptedbytheCompany
ThefollowingstandardwaseffectiveandimplementedasofJanuary1,2017.
IAS12IncomeTaxes
IAS12Incometaxesprovidesguidanceontherecognitionofdeferredtaxassets.InJanuary2016theIASBissuedamendmentstoclarifytherequirementsforrecognizingdeferredtaxassetsonunrealizedlosses.Theamendmentsclarifytheaccountingfordeferredtaxwhereanassetismeasuredatfairvalueandthatfairvalueisbelowtheasset’staxbase.Theyalsoclarifycertainotheraspectsofaccountingfordeferredtaxassets.TheamendmentsareeffectiveforannualperiodsbeginningonorafterJanuary1,2017.TheCompanyhasadoptedtheamendmentstoIAS12initsfinancialstatementsfortheannualperiodbeginningonJanuary1,2017.Theadoptionoftheamendmentsdidnothavea material impact on the consolidated financial statements.
(c) Newaccountingstandardsissuedbutnotyeteffective
IFRS9FinancialInstruments
OnJuly24,2014,theIASBpublishedthefinalversionIFRS9FinancialInstrumentswhichbringstogethertheclassification,measurement,impairmentandhedgeaccountingphasesoftheIASB’sprojecttoreplaceIAS39FinancialInstruments:RecognitionandMeasurement.IFRS9includesalossimpairmentmodel,amendstheclassificationandmeasurement model for financial assets by adding a new fair value through comprehensive income category for certain debt instruments and provides additional guidance on how to apply the business model and contractual cash flow characteristicstest.ThisfinalversionofIFRS9supersedesallpreviousversionsofIFRS9andiseffectiveforperiodsbeginningonorafterJanuary1,2018.TheCompanyiscurrentlyassessingtheimpactofIFRS9ontheconsolidatedfinancialstatements.TheCompanyexpectstoreportmoredetailedinformation,includingestimatedquantitativefinancial impacts, if material, in its consolidated financial statements as the effective date approaches.

Franco-Nevada Corporation 39The Gold Investment that WORKS
IFRS15RevenuefromContractswithCustomers
InMay2014,theIASBissuedIFRS15RevenuefromContractswithCustomers.Thenewstandardprovidesacomprehensive framework for recognition, measurement and disclosure of revenue from contracts with customers, excludingcontractswithinthescopeofthestandardsonleases,insurancecontractsandfinancialinstruments.IFRS15becomeseffectiveforannualperiodsbeginningonorafterJanuary1,2018andistobeappliedretrospectivelywithearlyadoptionpermitted.TheCompanyisintheprocessofassessingtheimpactofIFRS15ontheconsolidatedfinancialstatements.TheCompanyexpectstoreportmoredetailedinformation,includingestimatedquantitativefinancialimpacts, if material, in its consolidated financial statements as the effective date approaches.
Note 3 - Acquisitions and other transactions(a) U.S.Oil&GasRoyaltiesAcquisition-MidlandBasin
OnMarch13,2017,theCompanyagreedtopurchaseaportfolioofroyaltiesintheMidlandBasinofWestTexas,for apriceof$110.0million.TheMidlandBasinformstheeasternhalfofthebroaderPermianBasin.Theroyaltiesincludemineraltitlewhichprovideaperpetualinterestinroyaltylands.Thetransactionisexpectedtocloseinthesecond quarter of 2017.
AtMarch31,2017,theCompanyhasadvanced$11.0milliontoanescrowaccount,whichwillbeappliedagainstthepurchase price upon closing. The deposit is included in royalty, streams and working interests on the statement of financial position as at March 31, 2017.
The acquisition will be accounted for as an asset acquisition upon closing.
(b) CobrePanamaUpdate
TheCompanyhasapreciousmetalsstreamagreementforFirstQuantumMineralsLtd.’s(“FirstQuantum”)CobrePanamaproject(“CobrePanama”).Theproject,whichislocatedinPanama,isintheconstructionphase.Underthetermsoftheagreement,Franco-Nevadawillprovideadepositofupto$1.0billionagainstfuturedeliveriesofgoldandsilverfromCobrePanama.Thedepositisfundedonapro-ratabasisof1:3withFirstQuantum’s80%shareof thecapitalcostsinexcessof$1.0billion.
InthethreemonthsendedMarch31,2017,theCompanyfunded$50.2milliontowardsthestream,foracumulativetotalof$512.4millionofits$1.0billioncommitment.CapitalizedcostsfortheCobrePanamaprojectof$517.9millionare included in royalty, stream and working interests on the statement of financial position as at March 31, 2017.
Note 4 - Cash and Cash EquivalentsAsatMarch31,2017,cashandcashequivalentswereprimarilyheldininterest-bearingdeposits.
At At March 31, December 31, 2017 2016
Cash deposits $ 220.4 $ 182.4Term deposits 62.6 70.6
$ 283.0 $ 253.0
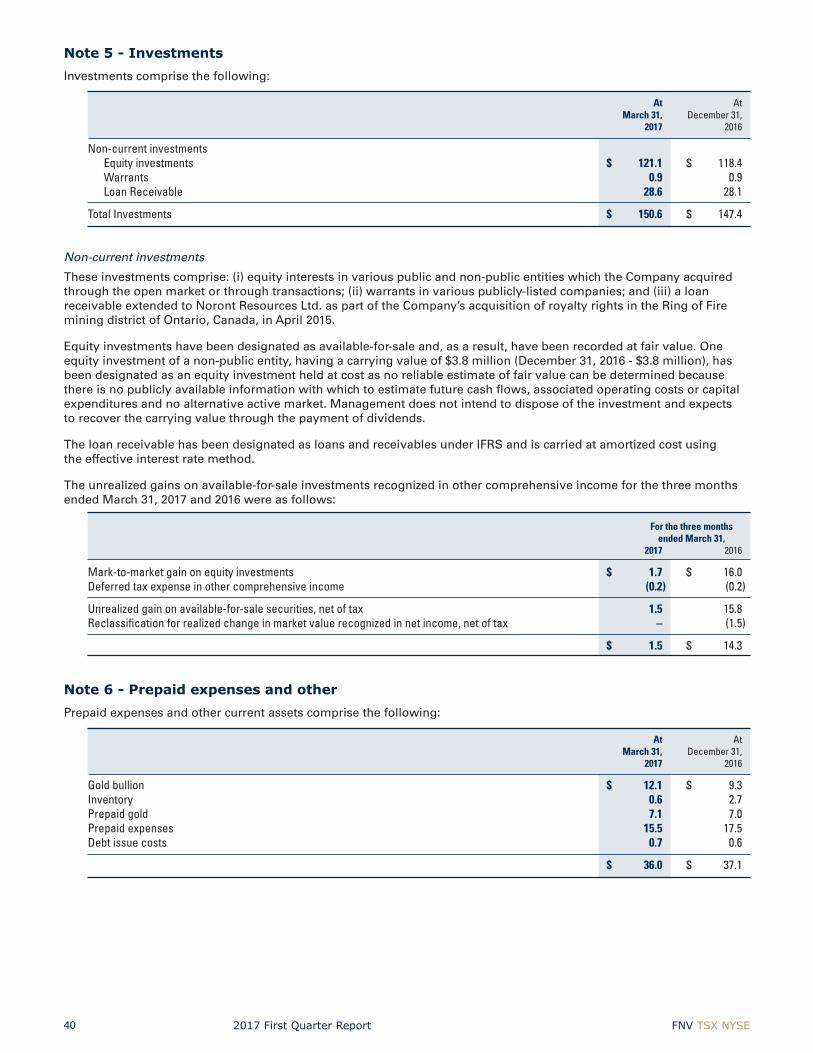
2017 First Quarter Report FNV TSX NYSE40
Note 5 - InvestmentsInvestmentscomprisethefollowing:
At At March 31, December 31, 2017 2016
Non-current investments Equity investments $ 121.1 $ 118.4 Warrants 0.9 0.9 Loan Receivable 28.6 28.1
Total Investments $ 150.6 $ 147.4
Non-currentinvestments
Theseinvestmentscomprise:(i)equityinterestsinvariouspublicandnon-publicentitieswhichtheCompanyacquiredthroughtheopenmarketorthroughtransactions;(ii)warrantsinvariouspublicly-listedcompanies;and(iii)aloanreceivableextendedtoNorontResourcesLtd.aspartoftheCompany’sacquisitionofroyaltyrightsintheRingofFireminingdistrictofOntario,Canada,inApril2015.
Equity investments have been designated as available-for-sale and, as a result, have been recorded at fair value. One equityinvestmentofanon-publicentity,havingacarryingvalueof$3.8million(December31,2016-$3.8million),hasbeen designated as an equity investment held at cost as no reliable estimate of fair value can be determined because there is no publicly available information with which to estimate future cash flows, associated operating costs or capital expendituresandnoalternativeactivemarket.Managementdoesnotintendtodisposeoftheinvestmentandexpectsto recover the carrying value through the payment of dividends.
TheloanreceivablehasbeendesignatedasloansandreceivablesunderIFRSandiscarriedatamortizedcostusingthe effective interest rate method.
The unrealized gains on available-for-sale investments recognized in other comprehensive income for the three months endedMarch31,2017and2016wereasfollows: For the three months ended March 31, 2017 2016
Mark-to-market gain on equity investments $ 1.7 $ 16.0Deferred tax expense in other comprehensive income (0.2 ) (0.2 )
Unrealized gain on available-for-sale securities, net of tax 1.5 15.8Reclassification for realized change in market value recognized in net income, net of tax – (1.5 )
$ 1.5 $ 14.3
Note 6 - Prepaid expenses and otherPrepaidexpensesandothercurrentassetscomprisethefollowing:
At At March 31, December 31, 2017 2016
Gold bullion $ 12.1 $ 9.3Inventory 0.6 2.7Prepaid gold 7.1 7.0Prepaid expenses 15.5 17.5Debt issue costs 0.7 0.6
$ 36.0 $ 37.1

Franco-Nevada Corporation 41The Gold Investment that WORKS
Note 7 - Other assetsOtherassetscomprisethefollowing:
At At March 31, December 31, 2017 2016
Prepaid gold $ 5.3 $ 7.1Oil & gas well equipment, net 13.6 14.0Furniture and fixtures, net 0.6 0.7Debt issue costs 2.3 1.6
$ 21.8 $ 23.4
Note 8 - Fair value measurementsFair value is a market-based measurement, not an entity-specific measurement. For some assets and liabilities, observable market transactions or market information might be available. For other assets and liabilities, observable markettransactionsandmarketinformationmightnotbeavailable.However,theobjectiveofafairvaluemeasurementin both cases is the same - to estimate the price at which an orderly transaction to sell the asset or to transfer the liability wouldtakeplacebetweenmarketparticipantsatthemeasurementdateundercurrentmarketconditions(i.e.anexitpriceat the measurement date from the perspective of a market participant that holds the asset or owes the liability).
The fair value hierarchy establishes three levels to classify the inputs to valuation techniques used to measure fair value.
• Level1inputsarequotedprices(unadjusted)inactivemarketsforidenticalassetsorliabilities. • Level2inputsarequotedpricesinmarketsthatarenotactive,quotedpricesforsimilarassetsorliabilitiesin
activemarkets,inputsotherthanquotedpricesobservablefortheassetorliability(forexample,interestrateand yield curves observable at commonly quoted intervals, forward pricing curves used to value currency and commodity contracts and volatility measurements used to value option contracts), or inputs that are derived principally from or corroborated by observable market data or other means.
• Level3inputsareunobservable(supportedbylittleornomarketactivity).
ThefairvaluehierarchygivesthehighestprioritytoLevel1inputsandthelowestprioritytoLevel3inputs.
There were no transfers between the levels of the fair value hierarchy during the three months ended March 31, 2017.
AssetsandLiabilitiesMeasuredatFairValueonaRecurringBasis:
Quoted Prices in Significant Other Significant Active Markets for Observable Unobservable Aggregate Identical Assets Inputs Inputs Fair Value As at March 31, 2017 (Level 1) (Level 2) (Level 3)
Cash and cash equivalents $ 283.0 $ – $ – $ 283.0Receivables from provisional gold equivalent sales – 6.8 – 6.8Available-for-sale equity investments 117.3 – – 117.3Warrants – 0.9 – 0.9
$ 400.3 $ 7.7 $ – $ 408.0
Quoted Prices in Significant Other Significant Active Markets for Observable Unobservable Aggregate Identical Assets Inputs Inputs Fair Value As at December 31, 2016 (Level 1) (Level 2) (Level 3)
Cash and cash equivalents $ 253.0 $ – $ – $ 253.0Receivables from provisional gold equivalent sales – 9.8 – 9.8Available-for-sale equity investments 114.6 – – 114.6Warrants – 0.9 – 0.9
$ 367.6 $ 10.7 $ – $ 378.3

2017 First Quarter Report FNV TSX NYSE42
AssetsMeasuredatFairValueonaNon-RecurringBasis:
Quoted Prices in Significant Other Significant Active Markets for Observable Unobservable Aggregate Identical Assets Inputs Inputs Fair Value As at December 31, 2016 (Level 1) (Level 2) (Level 3)
Royalty, stream and working interests $ – $ – $ 2.1 $ 2.1
$ – $ – $ 2.1 $ 2.1
FairValuesofFinancialAssetsandLiabilities
The fair values of the Company’s remaining financial assets and liabilities, which include receivables, loan receivables, accountspayableandaccruedliabilities,approximatetheircarryingvaluesduetotheirshort-termnatureandhistoricallynegligible credit losses and/or fair value of collateral.
The Company has not offset financial assets with financial liabilities.
Thevaluationtechniquesthatareusedtomeasurefairvalueareasfollows:
(a) Cashandcashequivalents
Thefairvaluesofcashandcashequivalents,includinginterestbearingdeposits,areclassifiedwithinLevel1of the fair value hierarchy because they are valued using quoted market prices in active markets.
(b) Receivables
The fair values of receivables arising from gold and platinum group metal sales contracts that contain provisional pricingmechanismsaredeterminedusingtheappropriatequotedforwardpricesfromtheexchangethatistheprincipalactivemarketfortheparticularmetal.Assuch,thesereceivablesareclassifiedwithinLevel2ofthefairvalue hierarchy.
(c) Investments
The fair values of publicly-traded investments, including available-for-sale equity investments, are determined based on a market approach reflecting the closing prices of each particular security at the statement of financial positiondate.Theclosingpricesarequotedmarketpricesobtainedfromtheexchangethatistheprincipalactivemarketfortheparticularsecurity,andthereforeareclassifiedwithinLevel1ofthefairvaluehierarchy.
ThefairvaluesofwarrantsareestimatedusingtheBlack-Scholespricingmodelwhichrequirestheuseofinputs thatareobservableinthemarket.Assuch,theseinvestmentsareclassifiedwithinLevel2ofthefairvaluehierarchy.
(d) Royalty,stream,andworkinginterests
The fair values of royalty, stream, and working interests are determined primarily using a market approach using unobservablediscountedfuturecash-flows.Asaresult,thefairvaluesareclassifiedwithinLevel3ofthefairvaluehierarchy.
Note 9 - Revolving term credit facility(a) CreditFacility-$1.0billion
TheCompanyhasafiveyear$1.0billionunsecuredrevolvingtermcreditfacility(the“CreditFacility”).OnMarch22,2017,theCompanyamendeditsCreditFacilitybyextendingthetermfromNovember12,2020toMarch22,2022.
AdvancesundertheCreditFacilitycanbedrawnasfollows:
U.S.dollars
• BaserateadvanceswithinterestpayablemonthlyattheCanadianImperialBankofCommerce(“CIBC”)baserate,plusbetween0.20%and1.20%perannumdependingupontheCompany’sleverageratio;or
• LIBORloansforperiodsof1,2,3or6monthswithinterestpayableatarateofLIBOR,plusbetween1.20%and2.20% per annum, depending on the Company’s leverage ratio.
Canadian dollars
• PrimerateadvanceswithinterestpayablemonthlyattheCIBCprimerate,plusbetween0.20%and1.20%perannum,dependingontheCompany’sleverageratio;or
• Bankers’acceptancesforaperiodof30to180dayswithastampingfeecalculatedonthefaceamountbetween1.20% and 2.20%, depending on the Company’s leverage ratio.

Franco-Nevada Corporation 43The Gold Investment that WORKS
Allloansarereadilyconvertibleintoloansofothertypes,describedabove,oncustomarytermsanduponprovisionofappropriatenotice.BorrowingsundertheCreditFacilityareguaranteedbycertainoftheCompany’ssubsidiariesand are unsecured.
TheCreditFacilityissubjecttoastandbyfeeof0.24%to0.44%perannum,dependingontheCompany’sleverageratio, even if no amounts are outstanding under the Credit Facility.
AsatMarch31,2017,therewasnobalance(December31,2016-$nil)outstandingundertheCreditFacility.
AsatMarch31,2017,abalanceof$3.0millionrelatedtodebtissuecostsisremainingtobeamortizedovertheremainingtermoftheCreditFacility(December31,2016-$2.2million).TheunamortizeddebtissuecostsassociatedwiththeCreditFacilityareincludedinprepaidexpensesandothercurrentassets,andothernon-currentassets.ForthethreemonthsendedMarch31,2017,theCompanyrecognizeddebtissuancecostamortizationexpenseof$0.1million(Q1/2016-$0.1million),and$0.4million(Q1/2016-$0.4million)ofstandbyandadministrativefeesin the consolidated statement of income and comprehensive income.
(b) FNBCCreditFacility-$100.0million
OnMarch20,2017,theCompany’ssubsidiary,Franco-Nevada(Barbados)Corporation,enteredintoanunsecuredrevolvingtermcreditfacility(the“FNBCCreditFacility”).TheFNBCCreditFacilityprovidesfortheavailabilityoveraone-yearperiodofupto$100.0millioninborrowings.TheFNBCCreditFacilityhasamaturitydateofMarch20,2018.TheCompanyhastheoptionofrequesting,duringaperiodoftimebeforeeachanniversarydate,uptotwoadditionalone-yearextensionsofthematurity.Theserequestsaresubjecttoapprovalfromthelenders.
AdvancesundertheFNBCCreditFacilitycanbedrawnasfollows:
• BaserateadvanceswithinterestpayablemonthlyattheCIBCbaserate,plus0.35%perannum;or • LIBORloansforperiodsof1,2,3or6monthswithinterestpayableatarateofLIBORplus1.35%perannum.
Allloansarereadilyconvertibleintoloansofothertypesoncustomarytermsanduponprovisionofappropriatenotice.
TheFNBCCreditFacilityissubjecttoastandbyfeeof0.27%perannum,evenifnoamountsareoutstanding.
AsatMarch31,2017,therewasnobalanceoutstandingundertheFNBCCreditFacility.
AsatMarch31,2017,$0.1millionrelatedtodebtissuecostswerecapitalizedandwillbeamortisedovertheremainingtermoftheFNBCCreditFacility.
Note 10 - RevenueRevenueiscomprisedofthefollowing: For the three months ended March 31, 2017 2016
Mineral royalties $ 43.1 $ 34.6Mineral streams 116.3 91.4Sale of prepaid gold 2.4 2.4Oil & gas interests 10.9 3.6
$ 172.7 $ 132.0
Note 11 - Costs of salesCostsofsalesarecomprisedofthefollowing: For the three months ended March 31, 2017 2016
Per ounce stream purchase cost $ 36.4 $ 21.7Cost of prepaid ounces 1.8 1.8Oil & gas operating costs 1.1 0.6Mineral production taxes 0.6 0.3
$ 39.9 $ 24.4

2017 First Quarter Report FNV TSX NYSE44
Note 12 - Related party disclosuresKeymanagementpersonnelarethosepersonshavingauthorityandresponsibilityforplanning,directingandcontrollingtheactivitiesoftheCompany.KeymanagementpersonnelincludetheBoardofDirectorsandtheexecutivemanagementteam.CompensationforkeymanagementpersonneloftheCompanywasasfollows: For the three months ended March 31, 2017 2016
Short-term benefits(1) $ 0.8 $ 0.7Share-based payments(2) 1.8 1.7
$ 2.6 $ 2.4
(1) Includes salary, benefits and short-term accrued incentives/other bonuses earned in the period. (2) Represents the expense of stock options, restricted share units earned and mark-to-market charges on deferred share units during the year.
Note 13 - Income taxesIncometaxexpenseforthethreemonthsendedMarch31,2017and2016wasasfollows: For the three months ended March 31, 2017 2016
Current income tax expense $ 7.8 $ 5.5Deferred income tax expense 2.6 2.6
$ 10.4 $ 8.1
Note 14 - Shareholders’ equity(a) Commonshares
TheCompany’sauthorizedcapitalstockincludesanunlimitednumberofcommonshares(issued-178,625,960common shares as at March 31, 2017) having no par value and preferred shares issuable in series (issued - nil).
DuringthethreemonthsendedMarch31,2017,nocommonshares(Q1/2016-312,025)wereissuedfortheexerciseofstockoptions,forproceedsof$nil(Q1/2016-$10.2million),and1,887commonshares(Q1/2016-17)wereissuedupontheexerciseofwarrants,forproceedsof$0.1million(Q1/2016-$nil).Inaddition,141,934commonshares(Q1/2016-166,075)wereissuedpursuanttothetermsoftheCompany’sDividendReinvestmentPlan(“DRIP”) for the three months ended March 31, 2017.
(b) Dividends
TheCompanydeclareddividendsintheamountof$39.4million(Q1/2016-$38.5million),or$0.22pershare (Q1/2016-$0.21pershare),inthethreemonthsendedMarch31,2017.TheCompanypaidcashdividendsintheamount$30.1million(Q1/2016-$28.3million)andissuedcommonsharespursuanttoitsDRIPvaluedat $9.3million(Q1/2016-$10.2million),inthethreemonthsendedMarch31,2017.
(c) Stock-basedpayments
DuringthethreemonthsendedMarch31,2017,anexpenseof$1.5million(Q1/2016-$1.3million)relatedtostock options and restricted share units has been included in the consolidated statement of income and other comprehensiveincomeand$0.1millionwascapitalizedtoroyalty,streamandworkinginterests(Q1/2016-$nil).
Note 15 - Earnings per share (“EPS”)
For the three months ended March 31, 2017
Earnings Shares Per Share (Numerator) (Denominator) Amount
Basic EPS $ 45.6 178.5 $ 0.26Effect of dilutive securities – 1.3 (0.01 )
Diluted EPS $ 45.6 179.8 $ 0.25

Franco-Nevada Corporation 45The Gold Investment that WORKS
For the three months ended March 31, 2016
Earnings Shares Per Share (Numerator) (Denominator) Amount
Basic EPS $ 30.0 166.8 $ 0.18Effect of dilutive securities – 0.6 –
Diluted EPS $ 30.0 167.4 $ 0.18
ForthethreemonthsendedMarch31,2017,263,568stockoptions(Q1/2016-nil)wereexcludedfromthecomputationofdilutedEPSduetobeinganti-dilutive.Restrictedshareunitstotaling84,094(Q1/2016-61,856)wereexcludedfromthecomputationofdilutedEPSforthethreemonthsendedMarch31,2017duetotheperformancecriteriaforthevestingoftheRSUsnotbeingmeasurableasatMarch31,2017.
Note 16 - Changes to comparative presentationThe condensed consolidated interim statement of cash flows and statement of income and comprehensive income forthethreemonthsendedMarch31,2016reflecttheretrospectiveapplicationofavoluntarychangeinaccountingpolicyadoptedin2016,asdetailedintheCompany’saccountingpoliciesdescribedintheannualconsolidatedfinancialstatementsfortheyearendedDecember31,2016.Thechangeclassifiesproceedsfromthesaleofgoldbullionasan operating activity, rather than an investing activity, on the condensed consolidated statement of cash flow.For consistency, any gains or losses that arise on the sale of gold bullion are also classified within operating incomein the condensed consolidated statement of income and comprehensive income.
(a) Impactonstatementofincomeandcomprehensiveincome
The following table outlines the effects of this accounting policy change on the condensed consolidated statementofincomeandcomprehensiveincome: For the three months ended March 31, 2016
Previously CurrentFinancial statement line item Reported Reclassification Presentation
Operating income $ 36.4 0.6 $ 37.0Foreign exchange gain (loss) and other income (expense)(1) 0.4 (0.6 ) (0.2 )
(1) Excludes gain on sale of investments of $1.5 million, presented separately.
(b) Impactonstatementofcashflows
The following table outlines the effects of this accounting policy change on the condensed consolidated statementofcashflows:
For the three months ended March 31, 2016
Previously CurrentFinancial statement line item Reported Reclassification Presentation
Net cash provided by operating activities $ 99.1 24.9 $ 124.0Net cash used in investing activities (482.0 ) (24.9 ) (506.9 )
Note 17 - Subsequent eventsExerciseofsharepurchasewarrants
SubsequenttoMarch31,2017,2,100,718warrantstopurchasecommonsharesoftheCompanyatanexercisepriceofC$75.00wereexercised,resultingincashproceedsofC$157.6milliontotheCompany.Asofthedateofthisreport,thereremained4,407,675warrantsoutstanding.ThewarrantshaveanexercisepriceofC$75.00perwarrantandexpireonJune16,2017.
2017 First Quarter Report FNV TSX NYSE46
Corporate Information
ExecutiveManagement
DavidHarquailPresident&CEO
SandipRanaChief Financial Officer
PaulBrinkSeniorVicePresident,BusinessDevelopment
LloydHongChiefLegalOfficer&CorporateSecretary
Directors
PierreLassondeChair
DavidHarquailPresident&CEO
TomAlbanese
DerekEvans
GrahamFarquharson
Dr.CatharineFarrow
LouisGignac
RandallOliphant
Hon.DavidR.Peterson
InvestorInformation
StefanAxellDirector,CorporateAffairs
Tel:(416)306-6328 TollFree:(877)401-3833
HeadOffice199BayStreet,Suite2000,P.O.Box285CommerceCourtPostalStationToronto,CanadaM5L1G9
Tel:(416)306-6300
BarbadosOfficeGroundFloor,BalmoralHall,BalmoralGap,Hastings,ChristChurch,Barbados,BB14034
Tel:(246)434-8200
U.S.Office1745SheaCenterDrive,Suite400HighlandsRanch,Colorado,USA80129
Tel:(720)344-4986
AustraliaOffice44KingsParkRoad,Suite41WestPerth,WA6005,Australia
Tel:61-8-6263-4425
AuditorsPricewaterhouseCoopersLLPToronto, Canada
Listings
TorontoStockExchange NewYorkStockExchange -Commonshares:FNV
ShareCapitalAsatMay9,2017
Commonsharesoutstanding 180,726,678Reservedfor: 2017Warrants: 6,407,675 Options&other: 1,442,942 Fullydiluted: 188,577,295
TransferAgentComputershareInvestorServicesInc.100UniversityAvenue,8thFloorToronto,CanadaM5J2Y1
TollFree:(800)564-6253 Tel:(514)982-7555


TSX/NYSE FNV
www.franco-nevada.com


