61
2017 FURBEARER PROGRAM ANNUAL REPORT MISSOURI DEPARTMENT OF CONSERVATION RESOURCE SCIENCE DIVISION LAURA CONLEE, RESOURCE SCIENTIST SUZANNE JOHNSTON, RESOURCE ASSISANT
| Date post: | 07-May-2018 |
| Category: |
Documents |
| Upload: | duongkhuong |
| View: | 215 times |
| Download: | 0 times |

2017 FURBEARER PROGRAM ANNUAL REPORT
MISSOURI DEPARTMENT OF CONSERVATION
RESOURCE SCIENCE DIVISION
LAURA CONLEE, RESOURCE SCIENTIST
SUZANNE JOHNSTON, RESOURCE ASSISANT

P a g e | 1
Contents
TABLE OF CONTENTS .............................................................................................................................. 1
ANNUAL HIGHLIGHTS ............................................................................................................................. 1
INTRODUCTION ......................................................................................................................................... 1
SECTION I
FUR HARVEST COMPARISONS ............................................................................................................... 1
MISSOURI FUR AUCTION PRICES .......................................................................................................... 1
RACCOON HARVEST AND POPULATION TRENDS ............................................................................ 1
COYOTE HARVEST AND POPULATION TRENDS ............................................................................... 1
FOX HARVEST AND POPULATION TRENDS........................................................................................ 1
BOBCAT HARVEST AND POPULATION TRENDS ............................................................................... 1
RIVER OTTER HARVEST .......................................................................................................................... 1
MUSKRAT AND BEAVER HARVEST AND POPULATION TRENDS ................................................. 1
AMERICAN BADGER STATUS IN MISSOURI ....................................................................................... 1
RARE FURBEARERS OF MISSOURI ........................................................................................................ 1
MOUNTAIN LION RESPONSE TEAM ANNUAL UPDATES ................................................................. 1
STATE FURBEARER RECORDS ............................................................................................................... 1
CABLE RESTRAINTS IN MISSOURI ........................................................................................................ 1
SECTION II
FURBEARER SIGN STATION SURVEY .................................................................................................. 1
ARCHER’S INDEX OF FURBEARER POPULATIONS ........................................................................... 1
MONITORING AND DEMOGRAPHIC ASSESSMENT OF RIVER OTTERS AND BOBCATS IN
MISSOURI .................................................................................................................................................... 1
BLACK BEAR DISTRIBUTION AND STATUS ....................................................................................... 1
DETERMINING ORIGIN, SEX, GENOTYPE, AND MOVEMENTS OF MOUNTAIN LIONS IN
MISSOURI .................................................................................................................................................... 1
TABLE OF CONTENTS

P a g e | 2
❖ Record low fur prices were documented at the annual auction in Montgomery City, MO
for the third year in a row. Price declines however, seem to be leveling off compared to
trends from previous years.
❖ Opossums were especially healthy this year with two separate individuals harvesting
record breaking Virginia opossums. The previous record of 14 lbs. 12 oz. was shattered
by 1 lb. 6.6 oz.; the new record tipped the scale at 16 lbs. 2.6. oz.
❖ The Mountain Lion Response Team (MLRT) confirmed DNA from a female mountain
lion in Shannon County. This is the first definitive confirmation of a female mountain
lion being present in Missouri since 1994. To date, reproduction has not been detected in
Missouri.
❖ All reports, on the order of hundreds each year, of mountain lions are submitted to and
recorded by the MLRT. A total of 3,025 reports have been submitted since 1994; the
3,000th report was received and recorded in May of 2017. Of the more than 3,000 reports,
283 of these have been formally investigated resulting in 69 confirmations.
❖ In addition to research efforts, MDC records black bear sightings and have received
nearly 2,500 sighting reports since 1992 with the 2,000th report recorded in Summer
2016.
ANNUAL HIGHLIGHTS

P a g e | 3
Missouri’s wild fur market has been monitored annually since 1940, with some information dating back as
far as 1934. Over time, tremendous fluctuations in the harvest of Missouri’s primary furbearing animals have
been observed as both market and social trends changed. Missouri Department of Conservation (MDC)
monitors the fur market within the state using mandatory fur dealer transaction records, mandatory pelt
registration of bobcats (since 1980) and river otters (since 1996), and information gathered at fur auctions. The
information in this report is based on the harvest by both trappers and hunters.
The number of Fur Dealer Permits issued by MDC peaked at 1,192 during the 1945-46 trapping and hunting
season. In 2017, MDC issued 44 Resident Fur Dealer Permits, the same as was issued in 2016, and 6 Non-
Resident Fur Dealer Permits, double the number issued in 2016.
Permits to harvest furbearers by trapping methods were first required in Missouri in 1953. The number of
Resident Trapping Permits issued peaked during 1980-81 at 13,248 and reached an all-time low in 2000 at
2,050 permits issued. During the 2016-17 trapping season, MDC issued 6,986 Resident and 355 Non-
Resident Trapping Permits.
Total pelts harvested reached 834,935 in 1940-41 (over 70% were opossum and skunk pelts), and reached the
second highest peak in 1979 at 634,338 when average raccoon pelt values were estimated at $27.50. The
economic value of harvested fur also peaked in 1979-80 at over $9 million. Pelt values declined dramatically
during the late 1980s and through the mid-1990s. As a result, the number of participants also fell to all-time
lows. The global fur market for the coming season is looking more promising than in recent years with
increased interest in wild fur from China. Although Russia is still largely absent from the global fur market,
the increase in Russian currency strength suggests a renewed interest for the coming season (North American
Fur Auctions, 2017). Some have suggested the 2015-16 season was the bottom of the current decline and fur
markets should begin to climb in the near future (Fur Harvesters Auction Inc.).
In addition to harvest information, wildlife population trends are monitored using observations collected by
MDC staff (Sign Station Survey) and bow hunters (Archer’s Index). Sign station surveys are conducted each
September by MDC staff in 25 counties. Archer’s Index is based on annual wildlife observation reports
submitted by cooperating bow hunters. A more detailed account of this year’s Sign Station Survey and
Archer’s Index can be found in Section II of this report.
Also contained in Section II are updates and progress summaries for various furbearer-related research
projects, monitoring efforts, and items of interest. Section II is for informational purposes and these should be
considered preliminary reports. For more information on any of these reports please contact Laura Conlee at
INTRODUCTION

P a g e | 4
SECTION I:
Missouri Furbearer Status 2016-2017
Individuals interested in buying or selling fur in Missouri (i.e., fur dealers) must obtain a commercial permit
from MDC. Permit requirements include maintaining and submitting records of all fur transactions (e.g.,
buying, selling, retaining inventory, etc.). Data collected from fur dealers provide MDC an estimate of
furbearer harvest. Additionally, bobcat and river otter harvest numbers are gathered from mandatory pelt
registration, including tagging as required by CITES for export outside the United States.
Pelt prices have steadily declined the last four seasons, resulting in reduced harvest for most species. MDC
issued a total of 7,341 trapping permits for the 2016-17 trapping season, a decrease in number issued from
the previous season (Table 1). Fur buyers continue to house high inventories of all species and pelt prices
continue to be low; therefore, the 2017-18 season will likely be similar to the last 2-3 years unless the global
fur market changes.
Table 1. Furbearer harvest and pelt prices in Missouri over the last three harvest seasons.
Species
2016-17 2015-16 2014-15
Pelts sold1 or
registered*
Pelt Prices
from MTA
Auctions2
Pelts sold or
registered*
Pelt Prices
from MTA
Auctions
Pelts sold or
registered*
Pelt Prices
from MTA
Auctions
Raccoon 32,106 $2.77 34,758 $5.84 85,497 $7.75
Opossum 1,176 $1.74 2,455 $0.64 4,874 $1.80
Muskrat 10,205 $3.60 6,057 $2.37 13,227 $5.58
Coyote 6,586 $12.52 4,419 $12.18 5,264 $18.14
Beaver 3,522 $6.90 1,933 $10.94 4,228 $11.11
Mink 356 (m) $10.71
263 (m) $10.81
475 (m) $11.18
(f) $5.00 (f) $9.75 (f) $4.06
Red Fox 587 $22.75 643 $16.34 1,093 $24.81
Gray Fox 293 $12.33 308 $15.72 593 $18.47
Striped Skunk 354 $5.50 227 - 263 $3.83
Badger 1 $18.00 14 - 37 $32.67
Bobcat* 2,104 $34.99 2,207 $34.74 3,229 $60.08
River Otter* 1,403 $30.79 1,356 $25.53 2,173 $34.97
Trapping
permits issued 7,341 7,992 10,197
1 Number of pelts sold is based on reports received from 42 Furbuyer Permittees. 2 Pelt prices are averaged from all fur sold, including green, finished, and damaged furs.
* Bobcat and River Otter harvest numbers are based on CITES registration.
- No information available.
FUR HARVEST
COMPARISONS

P a g e | 5
The Missouri Trappers Association (MTA) hosts
fur auctions each year in the state of Missouri,
providing opportunity to buy or sell harvested pelts.
In the 2016-17 season, MTA hosted just one auction
in February. Pelt prices are averaged from all fur
sold, including green, finished, and damaged furs.
Overall average pelt prices decreased by nearly 17%
from last year (Table 2). Raccoons, beaver, and
gray fox exhibited the greatest decrease in average
pelt price from last year with 52%, 37%, and 20%
decreases, respectively. River otter average pelt
price increased by 20% and bobcats remained steady
from last year. Declines in pelt prices are not a recent occurrence, but have been on a steady drop since
price peaks in 2012. Most pelt prices this year were well below the five-year average (Table 3).
Table 2. Furbearer pelt prices in Missouri from the annual Missouri Trappers
Association Fur Auction 18 February 2017, Montgomery City, Missouri.
Species
2016-2017
Summary Change from
2015-2016
Change
from Peak
in 2012-
2013 Total
Sold 18-Feb
Raccoon 1,286 $2.77 -52.6% -86.7%
Virginia Opossum 25 $1.74 171.9% 39.2%
Muskrat 1,515 $3.60 51.9% -69.5%
Coyote 279 $12.52 2.8% -43.8%
Beaver 157 $6.90 -36.9% -68.2%
Mink 24 $9.52 -9.2% -60.4%
Red Fox 44 $22.75 39.2% -41.9%
Gray Fox 21 $12.33 -20.3% -63.9%
Striped Skunk 4 $5.50 - 69.2%
Badger 1 $18.00 - *4636.8%
Bobcat 86 $34.99 0.7% -69.7%
Otter 86 $30.79 20.6% -64.0%
* Change in Badger pelt price is artificially inflated because average pelt price in 2012-2013
was $0.38 and very few pelts were sold.
- No information available
MISSOURI FUR AUCTION
PRICES

P a g e | 6
Table 3. Comparison of average Missouri Trappers Association Fur Auction prices
over the last five trapping seasons with a five-year average.
Species Average Price Per Season 5-year
average 2016-17 2015-16 2014-15 2013-14 2012-13
Raccoon $2.77 $5.84 $7.75 $13.04 $20.79 $10.04
Virginia
Opossum $1.74 $0.64 $1.80 $1.63 $1.25 $1.41
Muskrat $3.60 $2.37 $5.58 $9.94 $11.79 $6.66
Coyote $12.52 $12.18 $18.14 $18.12 $22.26 $16.64
Beaver $6.90 $10.94 $11.11 $14.86 $21.72 $13.11
Mink $9.52 $10.47 $11.18 $14.81 $24.05 $14.01
Red Fox $22.75 $16.34 $24.81 $36.24 $39.13 $27.85
Gray Fox $12.33 $15.72 $18.47 $24.01 $34.72 $21.09
Striped
Skunk $5.50 - $3.83 $2.50 $3.25 $3.77
Badger $18.00 - $32.67 $17.50 $0.38 $17.14
Bobcat $34.99 $34.74 $60.08 $120.13 $115.50 $73.09
Otter $30.79 $25.53 $34.97 $60.57 $85.53 $47.48
- No information available

P a g e | 7
Raccoon harvest in 2016-17 totaled 32,106 and
included individuals harvested by both trapping and
hunting methods (Figure 1). This year’s harvest was
down 7.63% from last year, which is a less dramatic
decline than was observed the previous two years.
Harvest is down 62.45% from two years ago, following
the trend of pelt price. The 2016-17 season resulted in
the lowest raccoon harvest since 1942 and the longest
duration of decline in harvest numbers over the last 25
years. Average raccoon pelt prices also continued to
decline since the last price peak in the 2012-13 season.
Population trends are derived from the Bowhunter Observation Survey and Furbearer Sign Station
Survey. For a detailed description of these surveys, see Section II of this report. During the hunting
season of 2016, bowhunters submitted the number of raccoons observed during archery hunting hours and
the number of hours spent afield. Based on these observations, the number of raccoons sighted per 1,000
hours decreased by 34% to 36.6 in 2016 from 55.2 in 2015 (Figure 2). Presence of raccoon tracks at
furbearer sign stations also decreased to an index of 183 in 2016, after peaking at 193 in 2015 (Figure 3).
Although raccoon abundance data is based on trend information, multiple surveys indicate an overall
increasing trend in population abundance. Short-term fluctuations are normal and expected due to the
dynamic nature of raccoon populations. Based on harvest and pelt prices of previous trapping and
hunting seasons, harvest pressure is expected to, once again, be reduced in the 2017-18 season.
RACCOON HARVEST AND
POPULATION TRENDS

P a g e | 8
Figure 1. Comparison of Missouri raccoon harvest and pelt prices over the last 25 years. Harvest estimates are
derived from fur buyer records. Annual pelt prices are the average price from the Missouri Trappers Association
Fur Auction.
Figure 2. Raccoon population trends based on the Archer’s Index, derived from the MDC
Bowhunter Observation Survey.
$0
$2
$4
$6
$8
$10
$12
$14
$16
$18
$20
$22
0
25,000
50,000
75,000
100,000
125,000
150,000
175,000
200,000
225,0001
992
-93
19
93
-94
19
94
-95
19
95
-96
19
96
-97
19
97
-98
19
98
-99
19
99
-00
20
00
-01
20
01
-02
20
02
-03
20
03
-04
20
04
-05
20
05
-06
20
06
-07
20
07
-08
20
08
-09
20
09
-10
20
10
-11
20
11
-12
20
12
-13
20
13
-14
20
14
-15
20
15
-16
20
16
-17
Pelt P
rice
Nu
mb
er
Harv
este
d
SEASON
Raccoon Harvest and Pelt Prices
Harvest Price
0
10
20
30
40
50
60
70
80
1994
1995
1996
1997
1998
1999
2000
2001
2002
2003
2004
2005
2006
2007
2008
2009
2010
2011
2012
2013
2014
2015
2016
Sig
hti
ng
s/1
000 H
ou
rs
Year
Archer's Index: Raccoon
Raccoon Index Raccoon Trend

P a g e | 9
Figure 3. Missouri raccoon population trends based on Furbearer Sign Station Survey Index.
0
20
40
60
80
100
120
140
160
180
200
1977
1980
1983
1986
1989
1992
1995
1998
2001
2004
2007
2010
2013
2016V
isit
s/1
00
0 O
pe
rab
le S
tati
on
s
Year
Sign Station Survey: Raccoon
Raccoon Raccoon Trend

P a g e | 10
Coyote harvest during the 2016-17 furbearer season was up 49% from the 2015-16 season with 6,586
individuals harvested (Figure 4) despite low pelt prices. Predator hunting continues to increase in
popularity and survey data suggest over 25,000 people hunt coyotes annually. Although coyote pelt
prices averaged only $12.52 this year, many trappers still enjoy the challenge of catching coyotes and this
is reflected in the harvest totals. Additionally, the use of cable restraints has increased opportunity for
coyote harvest, supplying both the fur and live markets. Coyote pelts also are becoming increasingly
popular as trim for jackets, which may be influencing the local market for this species (North American
Fur Auctions).
Population trends are derived from the Bowhunter Observation Survey and Furbearer Sign Station
Survey. For a detailed description of these surveys, see Section II of this report. Population trend data
from the Archer’s Index (Figure 5) and sign station survey (Figure 6) for coyotes suggest populations are
stable. However, the coyote population appears to be on the increase since the 1970s when the sign
station survey began and the early 1980s when the Archer’s Index began.
COYOTE HARVEST AND
POPULATION TRENDS

P a g e | 11
Figure 4. Comparison of Missouri coyote harvest and pelt prices over the last 25 years. Harvest estimates are
derived from fur buyer records. Annual pelt price estimates are the average price from the Missouri Trappers
Association Fur Auction.
Figure 5. Coyote population trends based on the Archer’s Index, derived from the MDC
Bowhunter Observation Survey.
$0
$2
$4
$6
$8
$10
$12
$14
$16
$18
$20
$22
$24
0500
1,0001,5002,0002,5003,0003,5004,0004,5005,0005,5006,0006,5007,0007,5008,0008,500
19
92
-93
19
93
-94
19
94
-95
19
95
-96
19
96
-97
19
97
-98
19
98
-99
19
99
-00
20
00
-01
20
01
-02
20
02
-03
20
03
-04
20
04
-05
20
05
-06
20
06
-07
20
07
-08
20
08
-09
20
09
-10
20
10
-11
20
11
-12
20
12
-13
20
13
-14
20
14
-15
20
15
-16
20
16
-17
Pelt P
rice
Nu
mb
er
Harv
este
d
SEASON
Coyote Harvest and Pelt Prices
Harvest Price
0
5
10
15
20
25
30
35
1994
1995
1996
1997
1998
1999
2000
2001
2002
2003
2004
2005
2006
2007
2008
2009
2010
2011
2012
2013
2014
2015
2016
Sig
hti
ng
s/1
000 H
ou
rs
Year
Archer's Index: Coyote
Coyote Index Coyote Trend

P a g e | 12
Figure 6. Missouri coyote population trends based on Furbearer Sign Station Survey Index.
0
20
40
60
80
100
120
1977
1980
1983
1986
1989
1992
1995
1998
2001
2004
2007
2010
2013
2016V
isit
s/1
000 O
pera
ble
Sta
tio
ns
Year
Sign Station Survey: Coyote
Coyote Coyote Trend

P a g e | 13
Red fox harvest during the 2016-17 season decreased 8.71% from 643 to 587 individuals harvested
(Figure 7). Gray fox harvest also decreased in 2016-17 by 4.87% to 293 individuals compared with last
year’s harvest of 308 (Figure 8). Fox harvest is typically a by-product of bobcat or coyote trapper effort.
Bobcat pelt prices dropped in 2015-16, and as a result, land trappers were less active resulting in less by-
catch of foxes.
Population trends are derived from the Bowhunter Observation Survey and Furbearer Sign Station
Survey. For a detailed description of these surveys, see Section II of this report. Bowhunter observations
and sign station surveys offer a long-term perspective suggesting declines in both red and gray fox
populations (Figures 9 and 10). Long-term fox population declines may be the result of interspecific
competition with coyotes and bobcats. Another possible strain on gray fox populations is the increasing
population of raccoons and the associated distemper virus, for which gray fox may be particularly
vulnerable. We continue to observe slight upticks in trend indicators for both red and gray fox around
suburban areas where foxes may be seeking refuge from coyotes, but the overall trend is still in decline.
Figure 7. Comparison of Missouri red fox harvest and pelt prices over the last 25 years.
$0
$5
$10
$15
$20
$25
$30
$35
$40
$45
0
200
400
600
800
1,000
1,200
1,400
1,600
1,800
2,000
19
92
-93
19
93
-94
19
94
-95
19
95
-96
19
96
-97
19
97
-98
19
98
-99
19
99
-00
20
00
-01
20
01
-02
20
02
-03
20
03
-04
20
04
-05
20
05
-06
20
06
-07
20
07
-08
20
08
-09
20
09
-10
20
10
-11
20
11
-12
20
12
-13
20
13
-14
20
14
-15
20
15
-16
20
16
-17
Pelt P
rice
Nu
mb
er
Harv
este
d
SEASON
Red Fox Harvest and Pelt Prices
Harvest Price
FOX HARVEST AND
POPULATION TRENDS

P a g e | 14
Figure 8. Comparison of Missouri gray fox harvest and pelt prices over the last 25 years.
Figure 9. Missouri fox population trends based on the Archer’s Index, derived from the
MDC Bowhunter Observation Survey.
$0
$5
$10
$15
$20
$25
$30
$35
$40
0
200
400
600
800
1,000
1,200
1,400
1,600
1,800
2,000
2,200
19
92
-93
19
93
-94
19
94
-95
19
95
-96
19
96
-97
19
97
-98
19
98
-99
19
99
-00
20
00
-01
20
01
-02
20
02
-03
20
03
-04
20
04
-05
20
05
-06
20
06
-07
20
07
-08
20
08
-09
20
09
-10
20
10
-11
20
11
-12
20
12
-13
20
13
-14
20
14
-15
20
15
-16
20
16
-17
Pelt P
rice
Nu
mb
er
Harv
este
d
SEASON
Gray Fox Harvest and Pelt Prices
Harvest Price
0
1
2
3
4
5
6
19
94
19
95
19
96
19
97
19
98
19
99
20
00
20
01
20
02
20
03
20
04
20
05
20
06
20
07
20
08
20
09
20
10
20
11
20
12
20
13
20
14
20
15
20
16
Sig
hti
ng
s/1
000 H
ou
rs
Year
Archer's Index: Red & Gray Foxes
Red Fox Index Gray Fox Index
Red Fox Trend Gray Fox Trend

P a g e | 15
Figure 10. Missouri fox population trends based on Furbearer Sign Station Survey Index.
0
10
20
30
40
50
1977
1980
1983
1986
1989
1992
1995
1998
2001
2004
2007
2010
2013
2016
Vis
its/1
00
0 O
pe
rab
le S
tati
on
s
Year
Sign Station Survey: Foxes
Red Fox Gray Fox

P a g e | 16
Bobcat harvest during the 2016-17 season was down 4.67% from 2015-16, and 34.84% below the 2014-
15 season harvest (Figure 11), with 2,104 bobcats harvested. Prices during 2016-17 remained steady
from the previous year and slightly fewer bobcats were harvested. Trappers and hunters are required to
check or register bobcat carcasses or green pelts at MDC offices or with Conservation Agents. The
number of bobcat pelts purchased by fur dealers (1,148) was significantly less than those registered by
trappers and hunters as required by CITES (2,104). Instead of selling to fur buyers, trappers may make
more money selling carcasses to taxidermists or selling mounted bobcats. The decline in harvest and in
the number of bobcat pelts purchased by fur dealers is also likely attributed to a poor global fur market.
Population trends are derived from the Bowhunter Observation Survey and Furbearer Sign Station
Survey. For a detailed description of these surveys, see Section II of this report. Both sign station survey
and Archer’s Index data suggest bobcat populations may have dipped over the last couple years; however,
the overall trend appears to be stable (Figures 12 and 13).
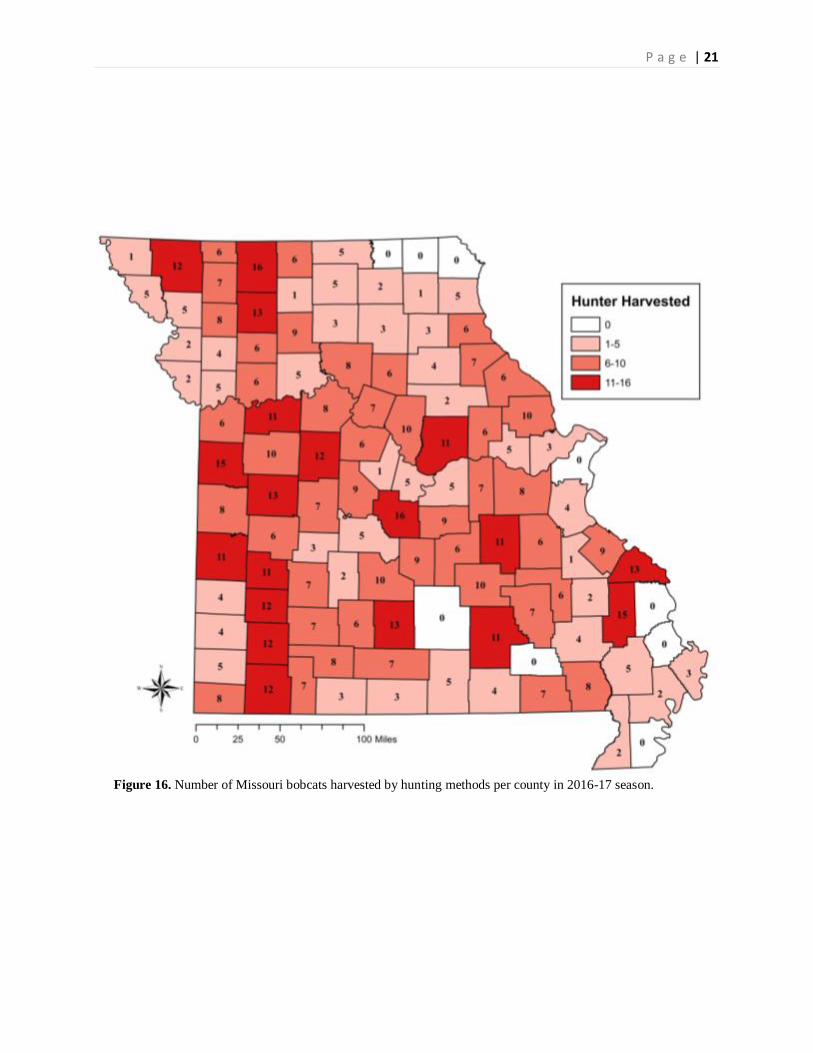
Geographic distribution of harvest varies by county and method. Vernon County had the highest total
harvest (Figure 14) and trapping harvest (Figure 15), while Harrison and Miller Counties had the highest
hunter harvest (Figure 16).
BOBCAT HARVEST AND
POPULATION TRENDS

P a g e | 17
Figure 11. Missouri bobcat harvest trends over the last 25 years compared to average pelt prices.
Figure 12. Missouri bobcat population trends based on the Archer’s Index, derived from
the MDC Bowhunter Observation Survey.
$0
$10
$20
$30
$40
$50
$60
$70
$80
$90
$100
$110
$120
$130
0
1000
2000
3000
4000
5000
60001
992
-93
19
93
-94
19
94
-95
19
95
-96
19
96
-97
19
97
-98
19
98
-99
19
99
-00
20
00
-01
20
01
-02
20
02
-03
20
03
-04
20
04
-05
20
05
-06
20
06
-07
20
07
-08
20
08
-09
20
09
-10
20
10
-11
20
11
-12
20
12
-13
20
13
-14
20
14
-15
20
15
-16
20
16
-17
Pelt P
rice
Nu
mb
er
Harv
este
d
SEASON
Bobcat Harvest Based on Mandatory Pelt RegistrationCompared to Average Pelt Price
Harvest Price
0
1
2
3
4
5
6
7
8
9
1994
1995
1996
1997
1998
1999
2000
2001
2002
2003
2004
2005
2006
2007
2008
2009
2010
2011
2012
2013
2014
2015
2016
Sig
hti
ng
s/1
000 H
ou
rs
Year
Archer's Index: Bobcat
Bobcat Index Bobcat Trend

P a g e | 18
Figure 13. Missouri bobcat population trends based on Furbearer Sign Station Survey Index.
0
5
10
15
20
25
30
1977
1980
1983
1986
1989
1992
1995
1998
2001
2004
2007
2010
2013
2016
Vis
its/1
00
0 O
pe
rab
le S
tati
on
s
Year
Sign Station Survey: Bobcat
Bobcat Bobcat Trend

P a g e | 19
Figure 14. Number of Missouri bobcats harvested per county during the 2016-17 season.

P a g e | 20
Figure 15. Number of Missouri bobcats harvested by trapping methods per county in 2016-17 season.
P a g e | 21
Figure 16. Number of Missouri bobcats harvested by hunting methods per county in 2016-17 season.

P a g e | 22
River otter harvest for the 2016-17 furbearer season was 1,403 river otters, up 3.47% from last year,
but down 35.43% from the 2014-15 season. River otter pelt prices increased 20.6% from last year
reflecting increased interest for river otter pelts in China (North American Fur Auctions, 2017). The
recent 2 years of low harvest can be attributed to the steady decline in pelt prices and the low, but minor
increase in pelt prices during the 2016-17 season (Figure 17). Trappers are required to check or register
river otter carcasses or green hides at MDC offices or with Conservation Agents in accordance with
requirements by CITES for exportation outside of the United States. The majority of trappers take
between 1 and 5 river otters.
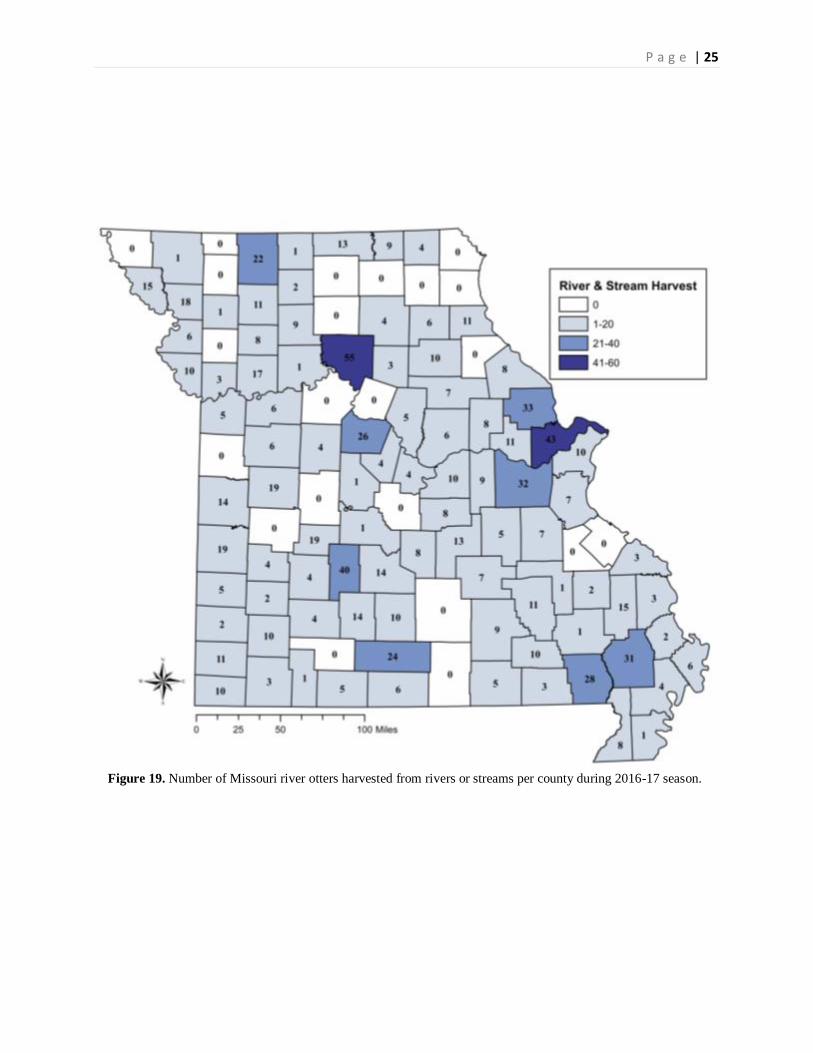
River otter harvest was highest in Henry, Chariton, and Shelby counties with more than 50 individuals
harvested in each of these three counties (Figure 18). Harvest in Henry and Chariton counties was also
highest in the 2015-16 season. Opportunity to harvest river otter from impoundments (i.e., ponds and
lakes) and rivers or streams is abundant in Missouri, but a majority (921) of river otters is harvested from
streams (Figure 19), while about a third of the harvest was from an impoundment in 2016-17 (Figure 20).
River otter harvest during the 2016-17 season was highest in the Missouri River, Grand River, Chariton
River, Osage River West, and Blackwater River watersheds (Figure 21). Approximately 33% of the total
harvest was taken from these five watersheds (Table 4). River otters harvested from an undeclared
watershed were combined into one category of “unknown” (Table 4) and comprised nearly 12% of the
total harvest.
RIVER OTTER HARVEST

P a g e | 23
Figure 17. Missouri river otter harvest and average pelt prices from 1996 to 2017.
$0
$20
$40
$60
$80
$100
$120
0
500
1,000
1,500
2,000
2,500
3,000
3,500
4,000
4,500199
6-9
7
199
7-9
8
199
8-9
9
199
9-0
0
200
0-0
1
200
1-0
2
200
2-0
3
200
3-0
4
200
4-0
5
200
5-0
6
200
6-0
7
200
7-0
8
200
8-0
9
200
9-1
0
201
0-1
1
201
1-1
2
201
2-1
3
201
3-1
4
201
4-1
5
201
5-1
6
201
6-1
7
Pe
lt Pric
eN
um
be
r H
arv
es
ted
SEASON
River Otter Harvest Based on Mandatory Pelt RegistrationCompared to Average Pelt Price
Harvest Price

P a g e | 24
Figure 18. Number of Missouri river otters harvested in each county during the 2016-17 season.
P a g e | 25
Figure 19. Number of Missouri river otters harvested from rivers or streams per county during 2016-17 season.

P a g e | 26
Figure 20. Number of Missouri river otters harvested from impoundments (i.e., ponds or lakes) per county
during 2016-17 season.

P a g e | 27
Figure 21. Missouri river otter harvest distribution among watersheds during the 2016-17 trapping season.

P a g e | 28
Table 4. Missouri river otter harvest distribution among watersheds during the 2016-17 trapping season.
Watershed Number Harvested Percent of Harvest
Big Piney River 5 0.36%
Big River 15 1.07%
Black River 45 3.21%
Blackwater River 76 5.42%
Bourbeuse River 8 0.57%
Chariton River 80 5.70%
Cuivre River 34 2.42%
Current River 9 0.64%
Eleven Point River 8 0.57%
Elk River 14 1.00%
Fabius River 1 0.07%
Fox River 0 0.00%
Gasconade River 50 3.56%
Grand River 101 7.20%
Headwater Diversion 25 1.78%
Jacks Fork River 6 0.43%
James River 8 0.57%
Lamine River 17 1.21%
Locust Creek 16 1.14%
Meramec River 32 2.28%
Mississippi River (lower) 24 1.71%
Mississippi River (upper) 26 1.85%
Missouri River 128 9.12%
Moreau River 9 0.64%
N. Fork White River 33 2.35%
Niangua River 50 3.56%
Nodaway River 4 0.29%
North River 7 0.50%
Osage River East 31 2.21%
Osage River West 86 6.13%
Platte River 27 1.92%
Pomme de Terre River 28 2.00%
S. Grand River 72 5.13%
Sac River 56 3.99%
Salt River 20 1.43%
Spring River 16 1.14%
St. Francis River 46 3.28%
Thompson River 7 0.50%
White River 16 1.14%
Wyaconda River 0 0.00%
Unknown 167 11.90%
Total Harvest 1,403 100%

P a g e | 29
Muskrat and beaver harvest continues to fluctuate in somewhat predictable ranges. Since 1990
muskrat harvests have varied from about 5,000 – 20,000 (Figure 22) and beaver from 2,000 – 10,000
(Figure 23). Historically, muskrat numbers have fluctuated widely; however, habitat degradation has
limited populations and subsequently reduced harvest. Beavers are a longer- lived species and less
vulnerable to depredation; harvest rates are more likely related to pelt values. Trappers harvested 10,205
muskrats (Figure 22) and 3,522 beavers (Figure 23) during the 2016-17 season. Increased interest from
China in muskrat has boosted demand and prices for muskrat this year. Beaver is still an important item
for hatters, which will help the market for this species (North American Fur Auctions, 2017).
Figure 22. Comparison of Missouri muskrat harvest and pelt prices over the last 50 years. Harvest estimates are
derived from fur buyer records. Annual pelt prices are the average price from the Missouri Trappers Association Fur
Auction.
0
2
4
6
8
10
12
14
0
25,000
50,000
75,000
100,000
125,000
1966-67
1968-69
1970-71
1972-73
1974-75
1976-77
1978-79
1980-81
1982-83
1984-85
1986-87
1988-89
1990-91
1992-93
1994-95
1996-97
1998-99
2000-01
2002-03
2004-05
2006-07
2008-09
2010-11
2012-13
2014-15
2016-17
Pel
t P
rice
s ($
)
Har
vest
Year
Muskrat Harvest Over the Past 50 Years
Muskrat Price
MUSKRAT AND BEAVER
HARVEST AND POPULATION
TRENDS

P a g e | 30
Figure 23. Comparison of Missouri beaver harvest and pelt prices over the last 50 years. Harvest estimates are
derived from fur buyer records. Annual pelt prices are the average price from the Missouri Trappers Association Fur
Auction.
0
5
10
15
20
25
0
2,000
4,000
6,000
8,000
10,000
12,000
1966-67
1968-69
1970-71
1972-73
1974-75
1976-77
1978-79
1980-81
1982-83
1984-85
1986-87
1988-89
1990-91
1992-93
1994-95
1996-97
1998-99
2000-01
2002-03
2004-05
2006-07
2008-09
2010-11
2012-13
2014-15
2016-17
Pel
t P
rice
s ($
)
Har
vest
Year
Beaver Harvest Over the Past 50 Years
Beaver Price

P a g e | 31
The American badger is a native, but uncommon, furbearing species in Missouri and is state-ranked as a
Vulnerable Species of Conservation Concern by MDC. American badgers are a fossorial (burrowing
animal) species and require habitat where suitable soil is available to dig burrows. Additionally, many of
the American badger’s prey species, such as prairie dogs, ground squirrels, or other small rodents, also are
fossorial. American badgers can be found throughout the state in any of the 8 zoological regions (Figure
24), but soil most suitable for burrowing mammals occurs primarily in four zoological regions: Western
Prairie, Northwest Prairie, Northern Riverbreaks, and Northeast Riverbreaks. Consequently, the bulk of
the recorded sightings in the Missouri Natural Heritage database occur in these four regions.
Figure 24. American badger sightings in the Missouri Natural Heritage database range
from the 1940s to present and occur in all 8 zoological regions. This includes 234
records added between 2009 and 2011.
AMERICAN BADGER STATUS IN
MISSOURI

P a g e | 32
Considered a furbearing species in the state of Missouri, American badgers are harvested annually during
the trapping season. However, harvest has been historically low compared to other furbearers because
American badger pelts are not highly sought after and typically sell for lower prices than other, more
valuable pelts (Figure 25). Furthermore, most American badger harvest occurs as a result of removing
nuisance animals. In recent decades, harvest has declined and is likely a result of several factors. First,
grasslands and prairies, where the soil substrate is suitable for burrowing, are primary habitat types for
American badgers. As these habitats are converted to intensive agriculture, available habitat for
American badgers decreases, mostly due to the loss of prey species in these areas. Second, interest in
trapping also has declined and fewer individuals participate in trapping.
Figure 25. American badger harvest (1961 to present) and pelt prices (1983 to present) in
Missouri.
Although sightings have been recorded since the 1940s, a concerted effort to collect and record American
badger observations and specimens from citizens (e.g., trappers) and MDC personnel began in 2009 and
continued through 2011 to better understand the demographics and distribution of American badgers in
Missouri. As a result, more than 300 records occur within the Missouri Natural Heritage database
allowing the Department to determine where the species is
most prevalent in the state. Since 2011, sightings and
specimens have been collected opportunistically and MDC
will continue to collect information about American
badgers from citizens and MDC personnel. Demographic
data was summarized in past annual reports and will be
periodically updated in the future. The public is
encouraged to submit sightings or carcasses, both road-kill
and trapped animals, to the Department in the future.
0
5
10
15
20
25
30
35
0
50
100
150
200
250
300
350
Pel
t P
rice
Nu
mb
er H
arve
sted
Year
American Badger Harvest and Pelt Prices
Badger Prices

P a g e | 33
Missouri residents are fortunate to reside in a state with
abundant natural resources, including wildlife, and exceptional
diversity of furbearing species. As a result, opportunities for
observing wildlife, hunting, and trapping also are abundant.
Three traditional furbearing species, the eastern spotted skunk
(subspecies plains spotted skunk), least weasel, and long-tailed
weasel, recently (within the last 3 decades) exhibited declines
in population trends and harvest. The Missouri Department of
Conservation (MDC) decided to close trapping for those
species due to this significant decline.
The subspecies of eastern spotted skunks native to Missouri is the plains spotted skunk. This species
was once abundant, albeit not as abundant as their striped cousins, and harvest of 30,000 or more
individuals each year was common in Missouri. Declines in annual harvest began in the late 1940s as
total harvest dropped precipitously from a high point of more than 55,000 to less than 10,000 individuals
over a period of 7 years. After another 5 years, annual harvest dipped to less than 1,000 individuals until
harvest dropped to less than 10 each
year and MDC closed the season for
spotted skunks in 1991-92 (Figure
26). Currently, the plains spotted
skunk is listed as state Endangered
and state-ranked as a critically
imperiled Species of Conservation
Concern in Missouri. Records of
spotted skunk sightings are
maintained in the MDC Missouri
Natural Heritage database, which
tracks locations of all Missouri
species of conservation concern
(Figure 27). Figure 26. Historic spotted skunk harvest in Missouri from the harvest
peak in 1940-41 to the close of the spotted skunk trapping season in
1991-92.
RARE FURBEARERS OF MISSOURI
1
10
100
1,000
10,000
100,000
Spotted Skunk Harvest
Season Closed:1991-1992
Harvest Peak:55,440

P a g e | 34
Figure 27. Plains spotted skunk sighting locations in the Missouri Natural Heritage database.
Northern Missouri is the southern extent of the least weasel’s range, therefore the species was never
widespread in the state. Although traditionally considered a furbearer, Missouri’s Wildlife Code does not
define least weasels as a furbearing or game species. Conversely, long-tailed weasels can be found from
central Canada into portions of South America and thus, can be found throughout the state of Missouri.
Long-tailed weasels are the primary target of weasel trapping efforts in Missouri, but harvest records
indicate an overall ‘weasel’ category suggesting take of both species occurred. Weasels were never a
large proportion of the fur harvest in Missouri, but harvest peaked in the mid-1930s before steadily
declining until the season was closed in
2000-01 (Figure 28). Currently, both
weasel species are classified as Species
of Conservation Concern and state-
ranked as Vulnerable. Similar to
spotted skunks, sightings of both weasel
species are maintained in the Missouri
Natural Heritage database providing an
indication of their distributions in
Missouri (Figures 29 and 30). 1
10
100
1,000
10,000
Weasel Harvest
Season Closed:2000-2001
Harvest Peak:4,585
Figure 28. Historic weasel harvest in Missouri from the harvest peak in
1934-35 to the close of the weasel trapping season in 2000-01 with a
gap in harvest data from 1935-36 through 1939-40.

P a g e | 35
Figure 29. Least weasel sighting locations in the Missouri Natural
Heritage database.
Figure 30. Long-tailed weasel sighting locations in the Missouri Natural
Heritage database.

P a g e | 36
The Missouri Department of Conservation developed a Mountain Lion Response Team (MLRT) in
1996 to address the concerns and reports from the public regarding mountain lions and the occasional
confirmed occurrence of a mountain lion in the state. The MLRT consists of MDC employees across the
state. MLRT members have special qualifications or have received training to address mountain lion
concerns and conduct investigations when evidence is present.
All reported mountain lion sightings are categorized and entered into a long-term database. The MLRT
also keeps track of confirmed cases of mountain lions in Missouri when there is physical evidence to
support a sighting, such as a track, carcass, photo, video, etc. The MLRT has logged over 3,000 reported
sightings in the database since 1994. During this time period there have been 69 mountain lion
observations confirmed in the state (Figure 31). Mountain lion confirmations continue to increase in the
Midwest, and Missouri has confirmed more mountain lion incidents than any other state without a
resident population of mountain lions. Mountain lion confirmations in Missouri are primarily the result
of game camera photos or videos (72.5%), followed by mountain lion carcasses (11.6%) and DNA
confirmations from hair and elk/deer carcasses (8.7%, Figure 32). Genetic analyses indicate origins of
South Dakota (n=6), Montana (n=1), Wyoming (n=1), and Colorado (n=1). Prior to 2016, all DNA
confirmations were male mountain lions; however, female DNA was detected in Shannon County. In
February of 2016, a three year old cow elk, suspected to be affected by brain worm, was killed by a
mountain lion. Genetic analyses of samples collected from the elk carcass revealed the mountain lion was
a female with a probable population of origin in the Black Hills of Wyoming and South Dakota, and
northwest Nebraska. When sex and age can be determined, most mountain lions confirmed in Missouri
are dispersing sub-adult males, which is consistent with other Midwestern states. Breeding has not been
documented in Missouri.
There have been 5 new mountain lion confirmations since June 2016. The six-county region of
Shannon, Texas, Oregon, Carter, Ripley, and Reynolds counties continues to be a “hot-spot” for
confirmations with 2 of the last 5 confirmations falling in this region. Three of the last 5 confirmations
were trail camera photos, 1 was a trail camera video, and 1 was a road-killed animal. In the last year,
nearly 300 reports were submitted to the MLRT via the website reporting form and e-mail account
associated with the MLRT; however, this is a minimum count because many reports that are sent to local
agency staff (e.g., Sheriff’s departments, state police, etc.) are not recorded. For more information on
mountain lions in Missouri, or to submit a report, please visit: https://nature.mdc.mo.gov/discover-
nature/report-wildlife-sightings/mountain-lion-reports
MOUNTAIN LION RESPONSE
TEAM ANNUAL UPDATES

P a g e | 37
Figure 31. Geographic distribution of the 69 mountain lion confirmations in Missouri from
1994 to July 2017.
Figure 32. The proportion of mountain lion confirmations made by each type of
evidence.
Mountain Lion Confirmations by
Evidence Type
Elk/Deer Carcass
Hair
Lion Carcass
Live Capture
Photo
Tracks
Video
P a g e | 38
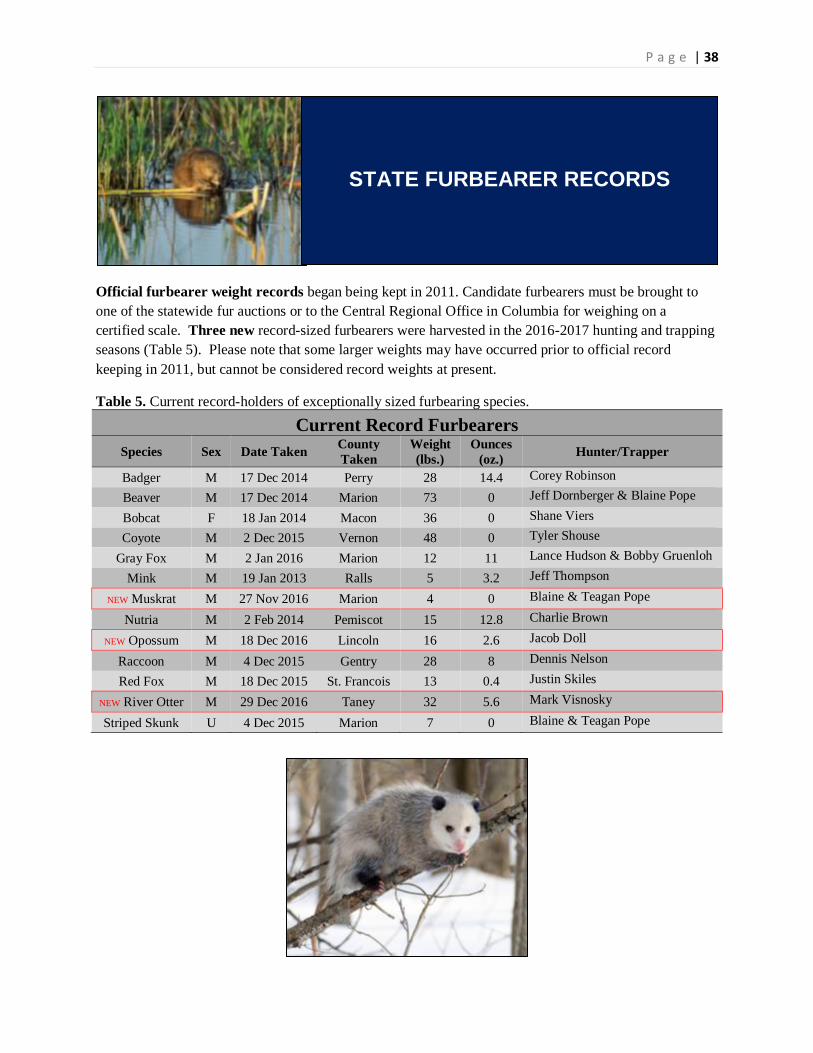
Official furbearer weight records began being kept in 2011. Candidate furbearers must be brought to
one of the statewide fur auctions or to the Central Regional Office in Columbia for weighing on a
certified scale. Three new record-sized furbearers were harvested in the 2016-2017 hunting and trapping
seasons (Table 5). Please note that some larger weights may have occurred prior to official record
keeping in 2011, but cannot be considered record weights at present.
Table 5. Current record-holders of exceptionally sized furbearing species.
Current Record Furbearers
Species Sex Date Taken County
Taken
Weight
(lbs.)
Ounces
(oz.) Hunter/Trapper
Badger M 17 Dec 2014 Perry 28 14.4 Corey Robinson
Beaver M 17 Dec 2014 Marion 73 0 Jeff Dornberger & Blaine Pope
Bobcat F 18 Jan 2014 Macon 36 0 Shane Viers
Coyote M 2 Dec 2015 Vernon 48 0 Tyler Shouse
Gray Fox M 2 Jan 2016 Marion 12 11 Lance Hudson & Bobby Gruenloh
Mink M 19 Jan 2013 Ralls 5 3.2 Jeff Thompson
NEW Muskrat M 27 Nov 2016 Marion 4 0 Blaine & Teagan Pope
Nutria M 2 Feb 2014 Pemiscot 15 12.8 Charlie Brown
NEW Opossum M 18 Dec 2016 Lincoln 16 2.6 Jacob Doll
Raccoon M 4 Dec 2015 Gentry 28 8 Dennis Nelson
Red Fox M 18 Dec 2015 St. Francois 13 0.4 Justin Skiles
NEW River Otter M 29 Dec 2016 Taney 32 5.6 Mark Visnosky
Striped Skunk U 4 Dec 2015 Marion 7 0 Blaine & Teagan Pope
STATE FURBEARER RECORDS

P a g e | 39
In 2004, a cooperative agreement between the Missouri Trappers Association (MTA) and the Missouri
Department of Conservation (MDC) was established to provide Missouri resident trappers with training to
safely and efficiently use cable restraints on land for appropriate furbearers. When used properly, cable
restraints hold captured coyotes and foxes without mortalities and with minimal injuries. As with
trapping in general, the use of cable restraints is a highly regulated activity in Missouri. Anyone who
wishes to trap must hold a valid trapping permit and follow strict rules established and enforced by the
Missouri Department of Conservation. Trappers may use cable restraints after completing a certified
Cable Restraint Training course offered at several locations across the state. Check the MDC website
or Wildlife Code, for full regulations on the use of cable restraints in Missouri. To date, there have been
6,408 trappers certified to use cable restraints since 2004 (Figure 33) and in 2016, a total of 232 trappers
went through the certification process to legally employ cable restraints as a trapping method. Most
Missouri resident trappers have been certified since the training course was initiated and there is no longer
a requirement to take the course to operate cable restraints; therefore, 2017 will be the last year courses
will be required.
Figure 33. Number of Missouri resident trappers certified to use cable restraints by year.
553271 277 389
582 535
0 0
1542
705838
480232
0
500
1000
1500
2000
Nu
mb
er o
f P
erm
its
Year
Cable Restraint Certifications by Year
*No data for 2010-2011
CABLE RESTRAINTS IN
MISSOURI

P a g e | 40
SECTION II: Project Updates and Summaries
Beginning in 1977, annual sign station surveys for furbearers have been conducted each September and
October. The purpose of the survey is to collect population trend information for Missouri’s furbearing
species. Twenty-five routes are distributed throughout the state in 25 different counties. Routes consist
of five segments with 10 sign stations per segment for a total of 50 stations per route. Each sign station is
a 36-inch diameter circle of sifted soil, spaced 0.3 miles along gravel road shoulders. A fatty acid scent
disc is placed in the center of each station as an attractant. Each station is operated for one night and
evaluated the following day for visitation.
Each station is described as operable or inoperable by the observer, stations with tire tracks or those
destroyed by a road grader were deemed inoperable. All operable stations were included in calculations
of indices, regardless of track presence, but inoperable stations were not used for calculations. Tracks
were identified within the 36-inch circle of the station. Occupancy of a station by a species was recorded,
but not the number of individuals per species.
Seventeen of 25 routes (Figure 34) were completed in 2016 with a total of 797 operable stations out of
a possible 850. A summary of operable stations for each zoological region is presented in Table 6. Tire
tracks were the only cause of inoperable stations. The most common furbearers to visit stations were
raccoon, opossum, and coyote (Figure 35). The least common were weasel, gray and red fox. Non-
mammalian visitors were primarily birds, such as turkeys.
Species specific population index trends from 1977 to 2016 based on the Furbearer Sign Station Survey
are displayed in Figures 36 through 39. Most furbearers have an overall increasing trend with the
exception of red and gray fox populations, which have been in an overall decline since the initiation of the
Sign Station Survey. These trends are also reflected in the Archer’s Index and harvest records.
FURBEARER SIGN STATION
SURVEY

P a g e | 41
Figure 34. Map of Missouri’s 8 zoological regions and counties where sign
station surveys were completed (green) and counties where surveys were not
completed (red hash) in 2016.
Table 6. Summary of operable and inoperable sign stations in 2016 by zoological regions
of Missouri.
Zooregion Routes
Completed
Operable
Stations
Inoperable
Stations
Northwest Prairie 2 91 9
Northern Riverbanks 2 97 3
Northeast Riverbanks 3 133 17
Western Prairie 3 141 9
Western Ozark Border 2 98 2
Ozark Plateau 1 48 2 North & East Ozark Border 3 140 10
Mississippi Lowlands 1 49 1
TOTAL 17 797 53

P a g e | 42
Figure 35. The number of stations visited by each mammal species, including non-
furbearer species, out of 797 operable stations in the 2016 Missouri Furbearer Sign Station
Survey.
Figure 36. Raccoon and Virginia opossum population index trends from 1977 to 2016 in Missouri.

P a g e | 43
Figure 37. Coyote and bobcat population index trends from 1977 to 2016 in Missouri.
Figure 38. Striped skunk population index trend from
1977 to 2016 in Missouri.
Figure 39. Red and gray fox population index trends from 1977 to 2016 in Missouri.

P a g e | 44
Missouri Department of Conservation has conducted annual surveys of wildlife populations via the
Bowhunter Observation Survey for 34 consecutive years (1983-2016). Each fall, several thousand
archery deer and turkey hunters keep daily observation records of furbearers, other small game animals,
deer, and turkeys. Archers volunteer through post-season surveys, articles in the Missouri
Conservationist magazine, and during sign-ups at bowhunter club meetings and other outdoor events.
Archery hunters are asked to record the number of hours hunted, during both morning and evening hunts,
and to use a standardized daily diary to record hours and sightings of wildlife. MDC uses the number of
sightings of each species divided by the total number of hours hunted statewide to calculate a sighting
index which is expressed as sightings per 1,000 hunter hours, called the Archer’s Index.
Wildlife population indices calculated from archer’s diaries are useful trend indicators for terrestrial
wildlife species, such as coyotes, raccoons, foxes, and bobcats. Hunters are well distributed statewide
with volunteers in 113 of the 114 counties during most years. Bowhunters averaged 53,285 hours per
year in the stand over the last 34 years, and ranged from 30,990 hours in 1985 to 84,497 hours in 1988
(Table 7). In 2016, hunters spent 41,409 total hours in the stand, which is down from 58,203 hours in
2015.
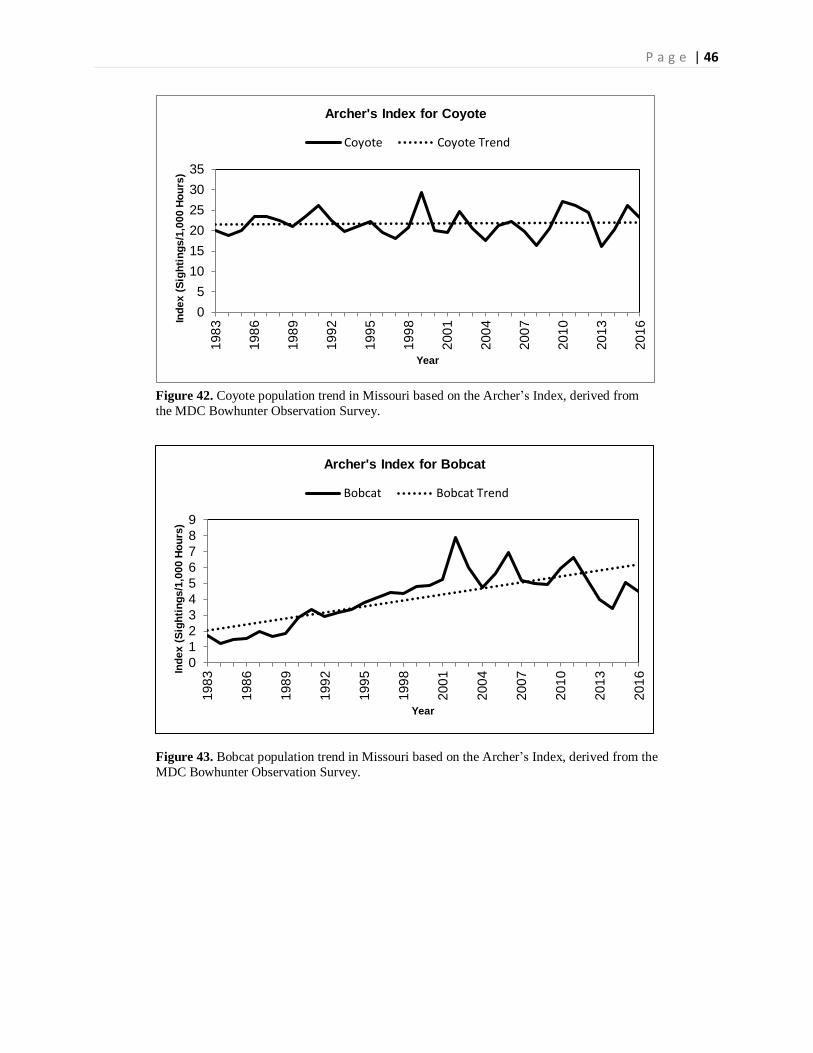
Line graph representations of Archer’s Indices for several furbearer species are shown in Figures 40
through 45. Based on these indices, long term raccoon, bobcat and opossum observations suggest
population increases. Striped skunk and coyote populations are relatively steady, while observations
suggest a downward trend for red and gray fox populations. Wildlife population indices are also depicted
by county (Table 8).
ARCHER’S INDEX OF FURBEARER POPULATIONS

P a g e | 45
Figure 40. Raccoon population trend in Missouri based on the Archer’s Index, derived from
the MDC Bowhunter Observation Survey
Figure 41. Virginia opossum population trend in Missouri based on the Archer’s Index,
derived from the MDC Bowhunter Observation Survey.
0
10
20
30
40
50
60
70
80
198
3
198
6
198
9
199
2
199
5
199
8
200
1
200
4
200
7
201
0
201
3
201
6Ind
ex
(S
igh
tin
gs
/1,0
00
Ho
urs
)
Year
Archer's Index for Raccoon
Raccoon Raccoon Trend
0
2
4
6
8
10
12
14
16
18
198
3
198
6
198
9
199
2
199
5
199
8
200
1
200
4
200
7
201
0
201
3
201
6Ind
ex
(S
igh
tin
gs
/1,0
00
Ho
urs
)
Year
Archer's Index for Opossum
Opossum Opossum Trend
P a g e | 46
Figure 42. Coyote population trend in Missouri based on the Archer’s Index, derived from
the MDC Bowhunter Observation Survey.
Figure 43. Bobcat population trend in Missouri based on the Archer’s Index, derived from the
MDC Bowhunter Observation Survey.
0
5
10
15
20
25
30
35
198
3
198
6
198
9
199
2
199
5
199
8
200
1
200
4
200
7
201
0
201
3
201
6Ind
ex
(S
igh
tin
gs
/1,0
00
Ho
urs
)
Year
Archer's Index for Coyote
Coyote Coyote Trend
0
1
2
3
4
5
6
7
8
9
198
3
198
6
198
9
199
2
199
5
199
8
200
1
200
4
200
7
201
0
201
3
201
6Ind
ex
(S
igh
tin
gs
/1,0
00
Ho
urs
)
Year
Archer's Index for Bobcat
Bobcat Bobcat Trend

P a g e | 47
Figure 44. Striped skunk population trends in Missouri based on the Archer’s Index, derived
from the MDC Bowhunter Observation Survey.
Figure 45. Red fox and gray fox population trends in Missouri based on the Archer’s Index,
derived from the MDC Bowhunter Observation Survey.
0
1
2
3
4
5
6
198
3
198
6
198
9
199
2
199
5
199
8
200
1
200
4
200
7
201
0
201
3
201
6Ind
ex
(S
igh
tin
gs
/1,0
00
Ho
urs
)
Year
Archer's Index for Striped Skunk
Striped Skunk Striped Skunk Trend
0
1
2
3
4
5
6
7
8
198
3
198
6
198
9
199
2
199
5
199
8
200
1
200
4
200
7
201
0
201
3
201
6Ind
ex
(S
igh
tin
gs
/1,0
00
Ho
urs
)
Year
Archer's Index for Fox Species
Red Fox Gray Fox
Red Fox Trend Gray Fox Trend

P a g e | 48
Table 7. Missouri hunter hours and furbearer population indices based on archer's diaries, 1983 to 2016.
YEAR Hunter Hours
Coyote Red Fox
Gray Fox
Bobcat Raccoon Virginia
Opossum Striped Skunk
Mink Beaver Muskrat Weasel Badger River Otter
Black Bear
1983 55,374 20.0 6.5 5.1 1.7 23.8 12.6 5.0 0.7 0.3 0.5 0.1 0.1 0.0 0.0
1984 32,746 18.8 6.8 3.1 1.2 16.9 6.4 3.5 0.3 0.3 0.1 0.0 0.1 0.0 0.0
1985 30,990 20.1 5.3 2.8 1.5 15.4 8.6 4.2 0.5 0.4 0.4 0.1 0.1 0.1 0.0
1986 51,727 23.5 5.7 2.8 1.5 15.3 6.9 3.5 0.3 0.4 0.0 0.0 0.0 0.0 0.0
1987 57,457 23.5 4.5 2.5 2.0 23.3 10.1 3.0 0.3 0.7 0.2 0.1 0.1 0.1 0.0
1988 84,497 22.4 4.7 2.4 1.7 16.7 4.8 2.7 0.3 0.6 0.1 0.0 0.1 0.1 0.0
1989 72,992 21.1 5.1 2.4 1.8 19.6 5.6 3.5 0.1 0.6 0.1 0.0 0.2 0.1 0.0
1990 72,227 23.6 4.9 2.3 2.9 24.0 7.2 3.5 0.2 0.4 0.1 0.0 0.1 0.1 0.0
1991 64,434 26.1 4.7 3.0 3.3 30.5 11.7 4.0 0.3 0.3 0.1 0.0 0.1 0.0 0.1
1992 64,452 22.5 4.7 2.3 2.9 24.3 8.9 2.8 0.6 0.7 0.1 0.0 0.1 0.3 0.0
1993 53,857 19.7 4.2 2.1 3.2 28.1 7.7 3.7 0.2 0.5 0.2 0.0 0.1 0.3 0.0
1994 49,102 21.0 5.1 2.0 3.4 32.0 7.6 3.2 0.1 0.5 0.2 0.0 0.2 0.2 0.0
1995 66,106 22.3 4.6 2.1 3.8 36.5 9.6 3.6 0.1 0.3 0.1 0.0 0.1 0.3 0.1
1996 60,077 19.6 4.5 1.8 4.1 29.7 6.6 2.7 0.0 0.3 0.0 0.0 0.1 0.5 0.0
1997 47,816 18.0 4.0 2.0 4.5 31.2 7.4 2.7 0.1 0.4 0.0 0.0 0.1 0.6 0.0
1998 43,152 20.8 4.1 2.4 4.4 33.0 10.6 4.2 0.1 0.3 0.1 0.0 0.2 0.3 0.1
1999 44,012 29.2 3.7 2.2 4.8 45.9 12.5 4.0 0.2 0.3 0.1 - 0.1 0.5 -
2000 50,795 20.0 3.7 2.0 4.9 32.1 8.1 3.3 0.0 0.2 0.0 0.0 0.1 0.3 0.0
2001 47,023 19.5 3.6 2.1 5.2 38.7 8.2 4.7 0.1 0.4 0.0 0.0 0.1 0.3 0.0
2002 42,826 24.6 3.8 1.5 7.9 42.6 14.4 5.6 0.3 0.1 0.0 0.0 0.1 0.8 0.1
2003 39,964 20.5 2.7 1.5 6.0 37.9 7.2 3.2 0.1 0.1 0.0 0.0 0.2 0.6 0.0
2004 35,071 17.6 2.8 1.1 4.7 37.3 7.9 2.6 0.1 0.1 0.1 0.0 0.1 1.2 0.0
2005 68,440 21.2 2.8 1.3 5.6 37.3 8.5 2.5 0.1 0.3 0.0 0.0 0.1 0.5 0.0
2006 60,040 22.2 3.2 1.3 6.9 54.4 14.4 3.8 0.3 0.2 0.0 0.0 0.1 0.5 0.0
2007 50,390 19.8 3.0 1.5 5.2 40.0 9.4 4.0 0.0 0.1 0.0 0.0 0.1 0.4 0.0
2008 44,471 16.3 2.6 1.2 5.0 41.5 7.8 3.7 0.1 0.1 0.1 0.0 0.4 0.3 0.0
2009 44,919 20.6 2.6 1.2 4.9 42.0 12.4 4.4 0.1 0.1 0.1 0.0 0.2 1.2 0.1
2010 42,907 27.1 2.1 1.0 5.9 60.6 12.9 3.1 0.2 0.1 0.0 0.0 0.2 0.7 0.0
2011 41,370 26.1 2.7 1.1 6.6 70.1 16.6 4.6 0.2 0.1 0.1 0.0 0.2 0.9 0.0
2012 63,621 24.4 3.6 1.4 5.3 45.8 7.1 5.6 0.1 0.1 0.0 0.0 0.3 1.1 0.0
2013 68,674 16.2 2.1 1.4 4.0 33.3 5.7 2.9 0.1 0.2 0.1 0.0 0.1 0.6 0.1

P a g e | 49
YEAR Hunter Hours
Coyote Red Fox
Gray Fox
Bobcat Raccoon Virginia
Opossum Striped Skunk
Mink Beaver Muskrat Weasel Badger River Otter
Black Bear
2014 60,560 20.3 2.5 1.3 3.4 37.5 5.8 2.8 0.0 0.1 0.0 0.0 0.3 0.3 0.1
2015 58,203 26.2 2.5 2.0 5.0 55.2 13.4 3.8 0.0 0.0 0.1 0.0 0.3 0.6 0.1
2016 41,409 23.3 2.9 1.5 4.5 36.6 10.2 4.4 0.0 0.3 0.1 - 0.2 0.2 0.2
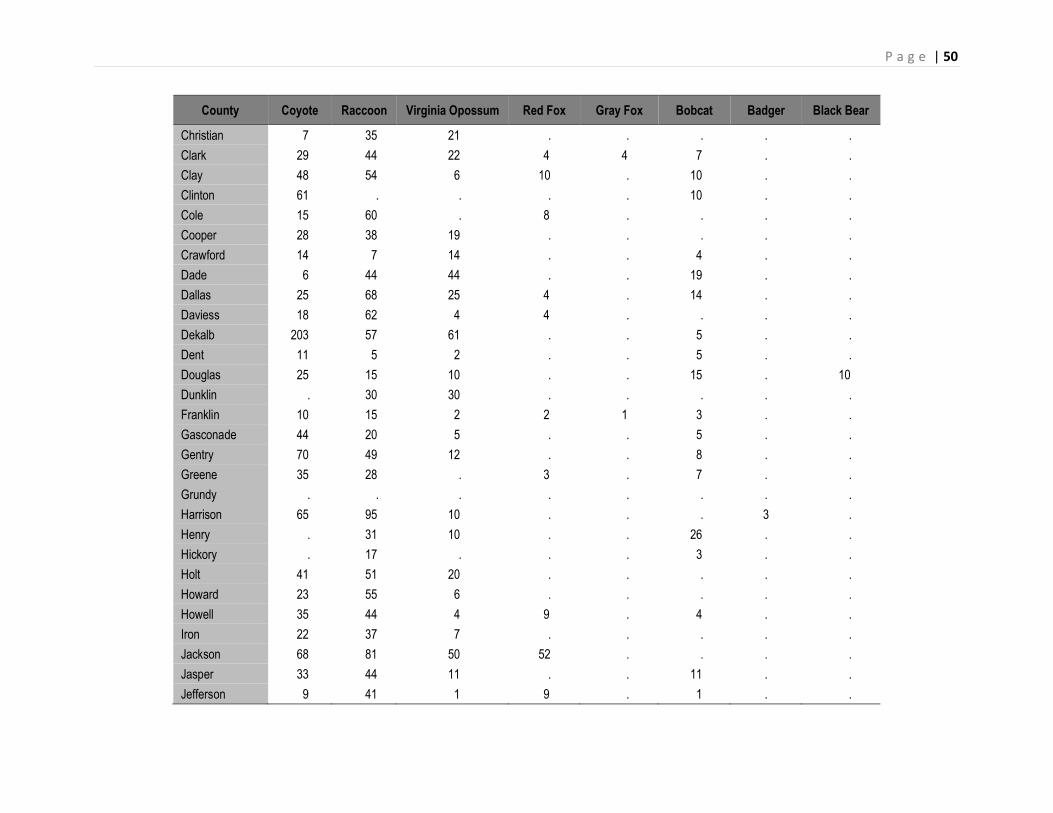
Table 8. Missouri furbearer species population indices (sightings/1,000 hours) by county derived from the MDC Bowhunter
Observation Survey in 2016.
County Coyote Raccoon Virginia Opossum Red Fox Gray Fox Bobcat Badger Black Bear
Adair 12 91 20 . . 7 . .
Andrew 18 30 7 4 . . . .
Atchison . 36 27 . . . . .
Audrain 38 57 15 4 . . . .
Barry 22 11 4 2 20 7 . .
Barton 38 151 52 . . 9 . .
Bates 79 65 22 . 4 11 . .
Benton 12 7 7 . 1 9 . .
Bollinger 8 13 3 10 . 13 . .
Boone 9 35 14 9 17 3 . .
Buchanan 38 131 14 5 . 5 . .
Butler 19 13 3 . . . 3 .
Caldwell 16 33 22 . . 27 . .
Callaway 9 17 4 4 9 1 . .
Camden 17 17 10 . . 7 . .
Cape Girardeau 17 21 18 . . 1 . .
Carroll 38 32 32 . . . 6 .
Carter 3 14 3 . . . . .
Cass 48 51 19 3 . 5 . .
Cedar 26 37 18 . . . . .
Chariton 21 73 . . . . . .
P a g e | 50
County Coyote Raccoon Virginia Opossum Red Fox Gray Fox Bobcat Badger Black Bear
Christian 7 35 21 . . . . .
Clark 29 44 22 4 4 7 . .
Clay 48 54 6 10 . 10 . .
Clinton 61 . . . . 10 . .
Cole 15 60 . 8 . . . .
Cooper 28 38 19 . . . . .
Crawford 14 7 14 . . 4 . .
Dade 6 44 44 . . 19 . .
Dallas 25 68 25 4 . 14 . .
Daviess 18 62 4 4 . . . .
Dekalb 203 57 61 . . 5 . .
Dent 11 5 2 . . 5 . .
Douglas 25 15 10 . . 15 . 10
Dunklin . 30 30 . . . . .
Franklin 10 15 2 2 1 3 . .
Gasconade 44 20 5 . . 5 . .
Gentry 70 49 12 . . 8 . .
Greene 35 28 . 3 . 7 . .
Grundy . . . . . . . .
Harrison 65 95 10 . . . 3 .
Henry . 31 10 . . 26 . .
Hickory . 17 . . . 3 . .
Holt 41 51 20 . . . . .
Howard 23 55 6 . . . . .
Howell 35 44 4 9 . 4 . .
Iron 22 37 7 . . . . .
Jackson 68 81 50 52 . . . .
Jasper 33 44 11 . . 11 . .
Jefferson 9 41 1 9 . 1 . .

P a g e | 51
County Coyote Raccoon Virginia Opossum Red Fox Gray Fox Bobcat Badger Black Bear
Johnson 33 84 24 . 3 . . .
Knox 21 96 14 8 . 12 . .
Laclede 32 34 24 8 2 8 . .
Lafayette 43 35 23 8 16 4 . .
Lawrence 59 43 5 . . . . .
Lewis 13 53 3 3 . 3 . .
Lincoln 10 20 7 2 5 5 . .
Linn 13 28 0 13 0 2 0 0
Livingston 7 29 4 2 . 2 . .
McDonald 21 . 7 . . 10 . .
Macon 27 31 4 . 12 1 1 .
Madison 14 23 36 . . 9 . .
Maries 63 . 8 . . . . .
Marion 9 21 10 . 3 . . .
Mercer 24 26 30 4 . 6 . .
Miller 5 49 . . 5 10 . .
Mississippi 63 47 110 . . . . .
Moniteau 26 26 26 . . 26 . .
Monroe 29 46 8 5 4 8 . .
Montgomery 11 17 13 2 . 11 . .
Morgan 11 27 6 2 . 8 . .
New Madrid . . . . . . . .
Newton 12 47 10 . . 2 . .
Nodaway 94 191 15 . . . . .
Oregon 22 22 5 . . 2 . .
Osage 12 14 2 . 5 5 . .
Ozark 34 7 . . 1 3 . 1
Pemiscot . . . . . . . .
Perry 66 37 6 . . . . .

P a g e | 52
County Coyote Raccoon Virginia Opossum Red Fox Gray Fox Bobcat Badger Black Bear
Pettis 43 43 12 . 6 . . .
Phelps 9 11 2 . . 9 . .
Pike 21 87 17 11 . 6 . .
Platte 27 37 17 . . 3 . .
Polk 17 62 23 . . . . .
Pulaski 6 19 . . . 6 . .
Putnam 24 32 19 . 8 14 . .
Ralls . 22 19 . . . . .
Randolph 23 47 . 12 . 8 . .
Ray . 44 15 . . . . .
Reynolds 16 . . . . 16 . .
Ripley 9 20 6 . . 3 . .
St. Charles 11 24 4 4 . 4 . .
St. Clair 19 . 6 . . . . .
St. Francois 14 14 3 7 . . 3 .
Ste. Genevieve 7 29 3 3 . 3 . .
St. Louis 18 20 8 . . . . .
Saline 45 84 22 2 . . . .
Schuyler 13 64 6 . . . . .
Scotland 8 52 11 10 . . 5 .
Scott . 106 . . . . . .
Shannon . . . . . 8 . .
Shelby 9 41 6 2 . 2 . .
Stoddard 23 23 . . . 5 . .
Stone 170 . . . . . . .
Sullivan 52 22 13 . . . . .
Taney 17 . . . . 3 . .
Texas 5 52 2 5 . 2 . .
Vernon 25 19 8 . 6 2 . .

P a g e | 53
County Coyote Raccoon Virginia Opossum Red Fox Gray Fox Bobcat Badger Black Bear
Warren 21 17 3 . . 5 . .
Washington 14 5 . . . 9 . .
Wayne 21 92 9 . 4 9 . 4
Webster 31 36 4 . . . . .
Worth 22 81 16 . . 12 . .
Wright 6 11 6 . . 6 . .
Statewide Index 23.3 36.6 10.2 2.9 1.5 4.5 0.2 0.2

P a g e | 54
River otter and bobcat are commonly sought after furbearers in Missouri and there are no harvest level
restrictions on river otters or bobcats. Various population indices suggest these species are not in danger
of being over harvested; however, harvest of these species has been challenged in a number of states.
MDC began a research project to document the sex and age of harvested animals and measure harvest
effort by trappers for these species. These and other data will enable MDC to utilize Statistical Population
Reconstruction (SPR) to generate abundance estimates and measure the impact of harvest and regulations
on river otter and bobcat populations. Through SPR, the MDC will have a better understanding of the
relationship between harvest rates and demographics of each species. Population reconstruction will also
provide the MDC with solid harvest and population data.
In order to utilize SPR, MDC collects information on harvested river otter and bobcat through mandatory
registration and voluntary tooth submission. Trappers are asked to remove one of the lower canine teeth
from each river otter and bobcat they harvest so that age-at-harvest can be determined. Sex, date of
harvest, method, and effort (trapped animals) are collected when river otter or bobcat are tagged or
registered with the Department.
During the 2015-16 river otter and bobcat harvest seasons, 437 lower canine teeth were collected from
both river otters and bobcats with 24 samples excluded from analysis because they were cut too short or
the wrong tooth was sent in for aging. The samples sent for aging consisted of 241 river otter (Figure 46)
and 172 bobcat teeth (Figure 47). Age data for the 2016-17 season are not yet complete.
MONITORING AND DEMOGRAPHIC
ASSESSMENT OF RIVER OTTERS AND
BOBCATS IN MISSOURI

P a g e | 55
Figure 46. Complete age results from the Missouri 2015-16 river otter harvest season.
Figure 47. Complete age results from the Missouri 2015-16 bobcat harvest season.
0
10
20
30
40
50
60
70
80
90
0 1 2 3 4 5 6 7 8 9 10 11 12 13
Nu
mb
er o
f A
nim
als
Age in Years
River Otter Age Results
0
10
20
30
40
50
60
0 1 2 3 4 5 6 7 8 9 10 11
Nu
mb
er o
f A
nim
als
Age in Years
Bobcat Age Results

P a g e | 56
Black bear goal/vision statement:
The current goal of black bear management in Missouri is to encourage black bear population expansion
within their natural range in Missouri, and to manage black bears consistent with the available habitat and
within the limits of human tolerance.
Black bear program objectives:
• Increase knowledge about current black bear population status in Missouri.
• Increase knowledge of black bear ecology in Missouri, how they move, disperse and travel on a
landscape level and identify source and sink populations.
• Develop black bear conservation and management strategies based on information gathered
through research, monitoring, and surveys.
• Educate Missouri’s public, the media, and other resource professionals in Missouri and the
Midwest about black bears and Missouri’s black bear management program.
The Black Bear Management Plan was drafted and approved in 2008 by a multi-agency group of
resource professionals from the Missouri Department of Conservation, U.S. Forest Service, National Park
Service, and Missouri Department of Natural Resources. The entire black bear management plan can be
viewed at:
https://nature.mdc.mo.gov/sites/default/files/downloads/black_bear_plan_2008_01-31-11.pdf
Citizen reports of black bear sightings are important for delineating bear range expansion in the state.
Reports of bears with cubs help to define the breeding range of bears in Missouri. Bear sightings are
reported to local Conservation staff and through an electronic reporting system available on the MDC
website. Primary bear range currently occurs south of Interstate 44, although dispersing young males have
been documented in many parts of the state (Figure 48).
Initial population research suggested a 2012 statewide estimated population of just under 300 bears. In
order to model statewide bear numbers and estimate population trajectory, MDC began a project to
measure reproductive and survival rates of female bears in Missouri. This black bear population model
will be used to predict growth and trajectory of Missouri’s black bear population. Current plans are to
propose a limited harvest once bear numbers exceed 500 animals. Other research objectives include
BLACK BEAR DISTRIBUTION AND
STATUS

P a g e | 57
measuring black bear habitat use and movement patterns, identifying suitable but unoccupied habitat and
to delineate travel corridors that link large tracts of suitable bear habitat in the state.
Since the initiation of the Missouri black bear research project in 2010 through June 30, 2017, MDC has
marked 145 black bears and has deployed collars on over 90 bears. As of June 30th, MDC was
monitoring 26 subadult and adult female bears and 3 adult male bears. Female bears will be monitored in
the winter den to assess cub production, cub sex ratios and cub survival, in addition to survival, habitat
use, and movements. Males will be monitored to assess survival, habitat use, movements, and breeding
range.
Winter den checks allow MDC to assess the condition of the sow, adjust or change her radio collar if
necessary, determine how many cubs or yearlings are with her in the den, and mark any young that can be
handled. During the winter of 2017, 15 adult female bears were monitored during the winter den season.
Dens were located via radio telemetry and were visited between January and March depending on the
sow’s reproductive status and age. Seven sows were handled in the den, of which 4 had newborn cubs and
3 had yearlings. MDC was unable to handle 5 bears due to the den type, but observed yearlings and cubs
at several of these dens. Three bears were mobile or had moved from their den prior to being able to
observe their reproductive status.
Spring and summer trapping is utilized to capture new bears for the study and to recapture bears that
had previously lost their collars or were not handled in the den. Bears are captured in barrel, culvert, or
box-style trailer traps. Traps and bait sites are monitored by regional staff from multiple Divisions within
the Department. Marked bears that do not need to be handled are released without workup. From May 10,
2017 – June 30, 2017 MDC spent 253 trap nights with traps run in Shannon, Oregon, Howell, Ozark,
Douglas, Webster, Wright and Taney Counties and had 65 capture events. Of these 65 capture events, 25
bears were immobilized, including 10 bears that had previously never been handled. Four new females
were collared and 1 new male was collared. Collared bears are currently distributed through the majority
of bear range (Figure 49).

P a g e | 58
Figure 48. Black bear sightings reported by MDC staff and the general public from 2008 – June 30, 2017.

P a g e | 59
Figure 49. Last known location of collared bears as of July 1, 2017. Yellow circles represent female bears and
blue triangles represent male bears.

P a g e | 60
There is mounting evidence that mountain lion populations are in the process of reclaiming former
habitats in the Midwest. Given the numerous mountain lion confirmations in Missouri, especially the
southeastern Ozarks, there seems to be an attraction to this area and it is possible that some mountain
lions may establish home ranges. In order to continue to learn about and monitor these animals, the
Department has initiated a small research project that will use opportunistic detections or captures of
mountain lions to better assess the biology and ecology of mountain lions in Missouri.
MDC has enlisted the aid of a scat detection dog trained to find only mountain lion scat. Collection of
mountain lion scats around confirmed reports will allow us to collect genetic material from these
mountain lions. Collected scats are preserved and shipped to the USDA Wildlife Ecology Research Unit
of the Rocky Mountain Research Station. Collected DNA is amplified and species, sex, and individual
genotype are identified. To infer the likely population of origin of these mountain lions, genotypes will
be compared with those in the laboratory’s database. Mountain lion genetic samples collected in Missouri
will be compared to those previously detected in the state and with those from surrounding states to
quantify a minimum number of individual mountain lions. Collecting genetic material is not without its
challenges. The time that has lapsed between a confirmed report and the mountain lion’s presence, as well
as the weather during that time period will affect the ability to detect scats. Given the infrequent nature of
mountain lion confirmations in the state (only 6-10 confirmations per year), the scat detection dog is used
minimally each year. The Department may also opportunistically capture and radio-mark mountain lions
with satellite equipped transmitters. Radio-marked animals will allow MDC to examine movement
patterns and, over time habitat use, prey selection, and home range size or dispersal movements.
DETERMINING ORIGIN, SEX,
GENOTYPE, AND MOVEMENTS OF
MOUNTAIN LIONS IN MISSOURI


