September 14, 2017 www.eia.gov/ieo International Energy Outlook 2017 #IEO2017 U.S. Energy Information Administration www.eia.gov/ieo #IEO2017 U.S. Energy Information Administration 2 Overview 3 Petroleum and other liquids______________________________________________________________31 Natural gas__________________________________________________________________________ 47 Coal________________________________________________________________________________61 Electricity ______________ 75 Buildings 91 Industrial 105 Transportation 117 Energy-related carbon dioxide 131 References 143 Table of contents Page
Transcript
September 14, 2017www.eia.gov/ieo
International Energy Outlook 2017
#IEO2017
U.S. Energy Information Administration www.eia.gov/ieo#IEO2017U.S. Energy Information Administration 2
Overview 3
Petroleum and other liquids______________________________________________________________31
U.S. Energy Information Administration www.eia.gov/ieo#IEO2017U.S. Energy Information Administration
Overview
U.S. Energy Information Administration www.eia.gov/ieo#IEO2017U.S. Energy Information Administration
U.S. Energy Information Administration www.eia.gov/ieo#IEO2017U.S. Energy Information Administration
• EIA’s International Energy Outlook 2017 (IEO2017) presents an assessment of long-term world energy markets. The IEO2017 is the first edition of this report to include model results through 2050, which are available on the IEO page of the EIA website. The graphics in this presentation focus on projections through 2040. IEO2017 energy consumption projections are provided for 16 world regions, divided according to Organization for Economic Cooperation and Development (OECD) members and nonmembers (non-OECD).
• U.S. projections appearing in IEO2017 are consistent with those released in the Annual Energy Outlook 2017. Between 2015 and 2040, world energy consumption increases by 28% in the IEO2017 Reference case, with more than half of the increase attributed to non-OECD Asia (including China and India), where strong economic growth drives increasing demand for energy.
Overview/key takeaways
5
U.S. Energy Information Administration www.eia.gov/ieo#IEO2017U.S. Energy Information Administration
• Projections in International Energy Outlook 2017 (IEO2017) are not predictions of what will happen, but rather modeled projections of what may happen given certain assumptions under different scenarios.
• The IEO is developed using the World Energy Projection System Plus (WEPS+), an integrated model that aims to capture various interactions of economic changes and energy supply, demand, and prices across regional markets.
• Energy market projections are subject to much uncertainty, as the events that shape future developments in technology, demographic changes, economic trends, and resource availability that drive energy use cannot be foreseen with certainty.
• The IEO projections are published under to the Department of Energy Organization Act of 1977, which requires the U.S. Energy Information Administration (EIA) to prepare reports on trends and projections for energy use and supply.
The International Energy Outlook 2017 provides long-term energy projections for the major world regions
6
U.S. Energy Information Administration www.eia.gov/ieo#IEO2017U.S. Energy Information Administration
• The Reference case assumes continual improvement in known technologies based on current trends and relies on the views of leading economic forecasters and demographers related to economic and demographic trends for 16 world regions based on OECD membership status.
• The IEO2017 considers current policies—as reflected in current laws, regulations, and stated targets that are judged to reflect an actual policy commitment—for major countries with the goal of realistically capturing their effects in the projections.
• Projections in the IEO should be interpreted with a clear understanding of the assumptions that inform them (e.g., economic growth, population, world oil prices, and existing government regulations and policies) and the limitations inherent in any modeling effort.
What is the Reference case?
7
U.S. Energy Information Administration www.eia.gov/ieo#IEO2017U.S. Energy Information Administration
• EIA addresses the uncertainty inherent in energy projections by developing side cases reflecting different economic growth rates and world oil prices.
• The effects of economic growth assumptions on energy consumption are addressed in the High and Low Economic Growth cases. World gross domestic product (GDP) increases by 3.3%/year from 2015 to 2040 in the High Economic Growth case and by 2.7%/year in the Low Economic Growth case, compared with 3.0%/year in the Reference case.
• The High and Low Oil Price cases address the uncertainty associated with the trajectory of world energy prices. In the Low Oil Price case, the price of North Sea Brent crude in 2016 dollars reaches $43/barrel by 2040, compared with $109/barrel in the Reference case and $226/barrel in the High Oil Price case.
What are the side cases?
8
U.S. Energy Information Administration www.eia.gov/ieo#IEO2017U.S. Energy Information Administration
World energy consumptionquadrillion Btu
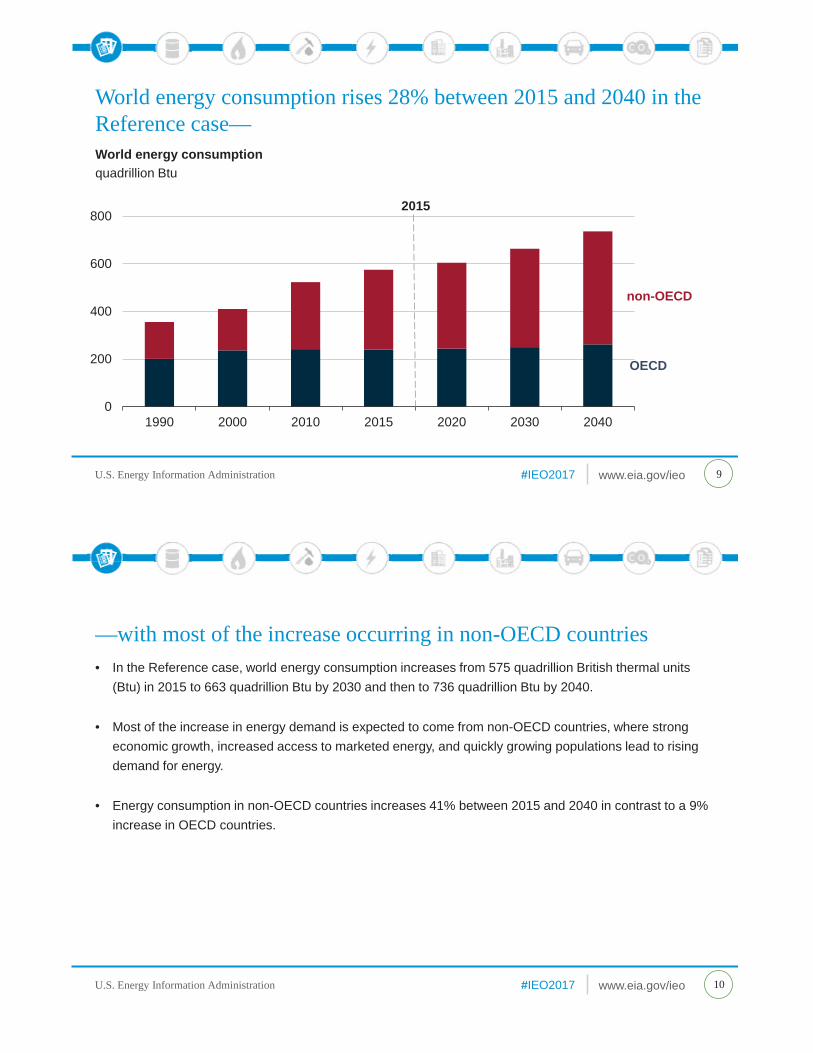
World energy consumption rises 28% between 2015 and 2040 in the Reference case—
9
0
200
400
600
800
1990 2000 2010 2015 2020 2030 2040
OECD
non-OECD
2015
U.S. Energy Information Administration www.eia.gov/ieo#IEO2017U.S. Energy Information Administration
• In the Reference case, world energy consumption increases from 575 quadrillion British thermal units (Btu) in 2015 to 663 quadrillion Btu by 2030 and then to 736 quadrillion Btu by 2040.
• Most of the increase in energy demand is expected to come from non-OECD countries, where strong economic growth, increased access to marketed energy, and quickly growing populations lead to rising demand for energy.
• Energy consumption in non-OECD countries increases 41% between 2015 and 2040 in contrast to a 9% increase in OECD countries.
—with most of the increase occurring in non-OECD countries
10
U.S. Energy Information Administration www.eia.gov/ieo#IEO2017U.S. Energy Information Administration
0
200
400
600
800
1,000
ReferenceCase
ReferenceCaseEconomic Growth Economic Growth
Low LowHigh High
OECD
non-OECD
World energy consumption in three economic growth casesquadrillion Btu
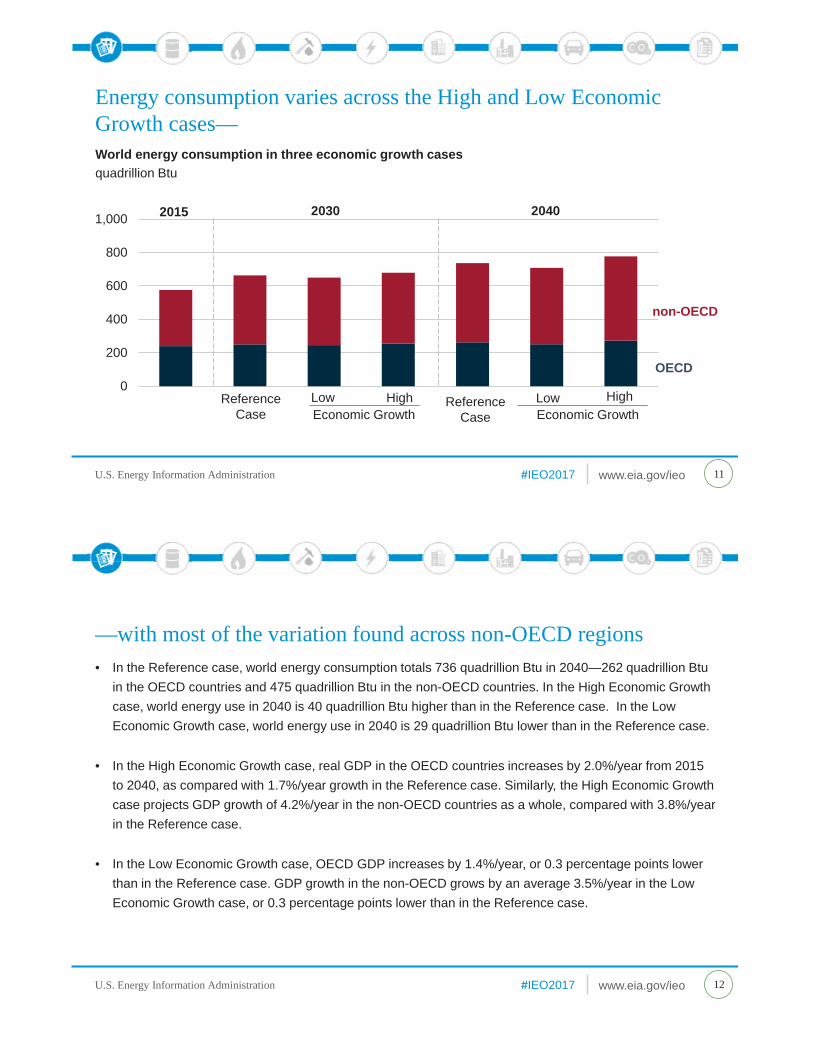
Energy consumption varies across the High and Low Economic Growth cases—
11
2015 2030 2040
U.S. Energy Information Administration www.eia.gov/ieo#IEO2017U.S. Energy Information Administration
• In the Reference case, world energy consumption totals 736 quadrillion Btu in 2040—262 quadrillion Btu in the OECD countries and 475 quadrillion Btu in the non-OECD countries. In the High Economic Growth case, world energy use in 2040 is 40 quadrillion Btu higher than in the Reference case. In the Low Economic Growth case, world energy use in 2040 is 29 quadrillion Btu lower than in the Reference case.
• In the High Economic Growth case, real GDP in the OECD countries increases by 2.0%/year from 2015 to 2040, as compared with 1.7%/year growth in the Reference case. Similarly, the High Economic Growth case projects GDP growth of 4.2%/year in the non-OECD countries as a whole, compared with 3.8%/year in the Reference case.
• In the Low Economic Growth case, OECD GDP increases by 1.4%/year, or 0.3 percentage points lower than in the Reference case. GDP growth in the non-OECD grows by an average 3.5%/year in the Low Economic Growth case, or 0.3 percentage points lower than in the Reference case.
—with most of the variation found across non-OECD regions
12
U.S. Energy Information Administration www.eia.gov/ieo#IEO2017U.S. Energy Information Administration
Future oil prices are another key source of uncertainty in the projections—
13
0
200
400
600
800
1,000
Ref Ref
Oil PriceCase
Low High
liquids
other
Ref
Oil PriceCase
Low High
2015 2030 2040
0255075
100125150175200225250
2015 2020 2025 2030 2035 2040
High Oil Price case
Reference case
Low Oil Price case
World oil prices in three casesreal 2016 dollars per barrel
World energy consumption in three casesquadrillion Btu
U.S. Energy Information Administration www.eia.gov/ieo#IEO2017U.S. Energy Information Administration
• In addition to the Reference case, EIA includes a Low Oil Price case and a High Oil Price case that use different assumptions about future oil prices, based on different views of supply and demand of liquid fuels.
• In the Reference case, oil prices rise to $109/barrel (real 2016 dollars) in 2040. Total liquids consumption increases from 191 quadrillion Btu in 2015 to 228 quadrillion Btu in 2040, when it accounts for 31% of total world energy use.
• In the Low Oil Price case, oil prices are $43/barrel in 2040, in part because of lower economic activity, especially in the developing world. Lower oil prices spur the demand for liquid fuels and discourage energy conservation and fuel switching. In 2040, liquids account for 32% of total world energy use.
• In the High Oil Price case, oil prices reach $226/barrel in 2040, as non-OECD economies grow more quickly and supply conditions are tighter than in the Reference case. Higher oil prices discourage liquids consumption, and consumers conserve or switch to alternative fuels whenever possible. Liquids account for 28% of total world energy use.
—but end-use demand doesn’t vary significantly
14
U.S. Energy Information Administration www.eia.gov/ieo#IEO2017U.S. Energy Information Administration
Non-OECD energy consumption by regionquadrillion Btu
In the Reference case, Asia accounts for most of the increase in energy use in non-OECD regions—
15
050
100150200250300350400450500
1990 2000 2010 2015 2020 2030 2040
Asia
Middle EastAfricaAmericasEurope and Eurasia
2015
U.S. Energy Information Administration www.eia.gov/ieo#IEO2017U.S. Energy Information Administration
• In the Reference case, more than half of the projected increase in global energy consumption occurs in non-OECD Asia, a region that includes China and India. Energy demand in non-OECD Asia is projected to increase by 51% (or by 102 quadrillion Btu) during the period of 2015–40. While much slower than the nearly 300% increase in energy use from 1990 to 2015, the projected growth in non-OECD Asia energy use still represents the largest regional growth in the world.
• Non-OECD regions outside of Asia are also projected to contribute to substantial increases in energy demand. Fast-paced population growth and access to ample domestic resources are both important determinants of energy demand in Africa and the Middle East, where energy use is expected to increase 51% and 45%, respectively, between 2015 and 2040.
• The smallest projected increase in energy demand is 2% in non-OECD Europe and Eurasia. Much of the low growth is related to Russia, where the population is expect to decline over the projection, and significant gains in energy efficiency are achieved by replacing older physical assets with more efficient ones.
—but there is substantial growth in other regions
16
U.S. Energy Information Administration www.eia.gov/ieo#IEO2017U.S. Energy Information Administration
World energy consumption by end-use sector quadrillion Btu
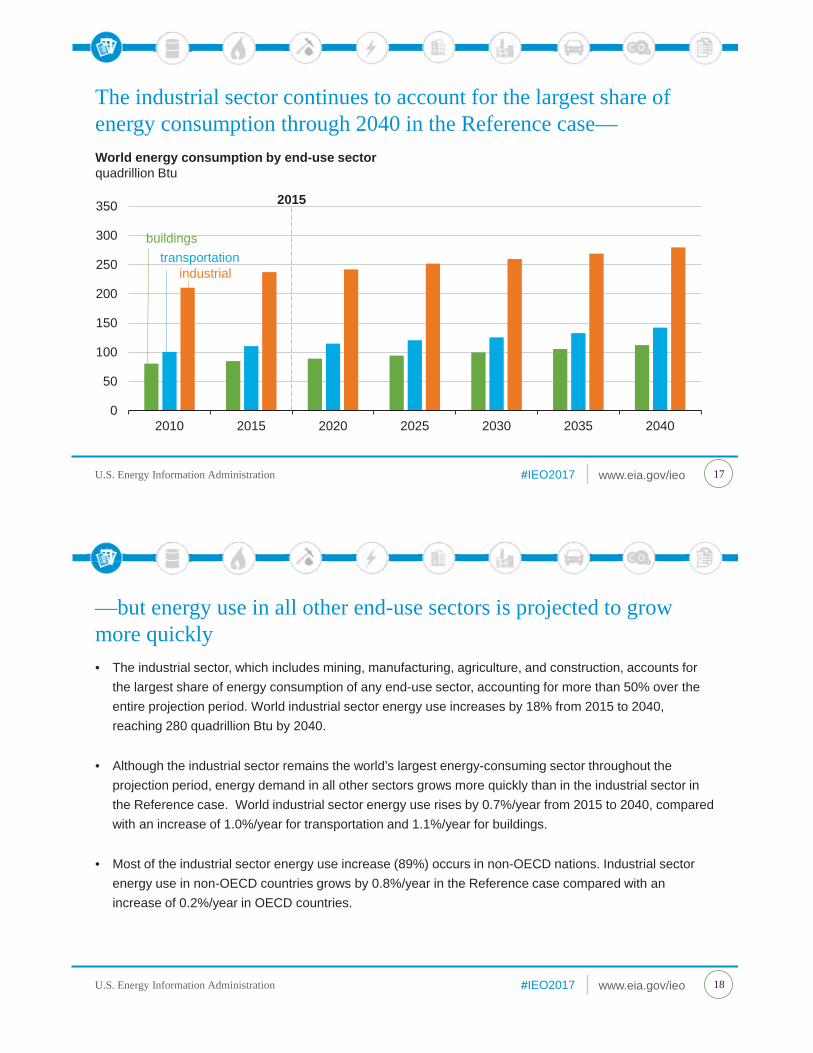
The industrial sector continues to account for the largest share of energy consumption through 2040 in the Reference case—
17
0
50
100
150
200
250
300
350
2010 2015 2020 2025 2030 2035 2040
industrial
buildingstransportation
2015
U.S. Energy Information Administration www.eia.gov/ieo#IEO2017U.S. Energy Information Administration
• The industrial sector, which includes mining, manufacturing, agriculture, and construction, accounts for the largest share of energy consumption of any end-use sector, accounting for more than 50% over the entire projection period. World industrial sector energy use increases by 18% from 2015 to 2040, reaching 280 quadrillion Btu by 2040.
• Although the industrial sector remains the world’s largest energy-consuming sector throughout the projection period, energy demand in all other sectors grows more quickly than in the industrial sector in the Reference case. World industrial sector energy use rises by 0.7%/year from 2015 to 2040, compared with an increase of 1.0%/year for transportation and 1.1%/year for buildings.
• Most of the industrial sector energy use increase (89%) occurs in non-OECD nations. Industrial sector energy use in non-OECD countries grows by 0.8%/year in the Reference case compared with an increase of 0.2%/year in OECD countries.
—but energy use in all other end-use sectors is projected to grow more quickly
18
U.S. Energy Information Administration www.eia.gov/ieo#IEO2017U.S. Energy Information Administration
World energy consumption by energy sourcequadrillion Btu
Energy consumption increases over the projection for all fuels other than coal in the Reference case—
U.S. Energy Information Administration www.eia.gov/ieo#IEO2017U.S. Energy Information Administration
• Use of all fuels except coal grows throughout the Reference case. Although renewable energy and nuclear power are the world’s fastest growing forms of energy, fossil fuels are expected to continue to meet much of world’s energy demand.
• Petroleum and other liquids remains the largest source of energy, but its share of world marketed energy declines from 33% in 2015 to 31% in 2040. On a worldwide basis, liquids consumption increases in the industrial and transportation sectors, and declines in the electric power sector.
• Natural gas is the world’s fastest growing fossil fuel, increasing by 1.4%/year, compared with liquid’s 0.7%/year growth and virtually no growth in coal use (0.1%/year).
• Compared with the strong growth in coal use in the early 2000s, worldwide coal use is projected to remain flat—with declines in OECD regions and China offsetting growth in India and the other non-OECD Asian nations. Coal is increasingly replaced by natural gas, renewables, and nuclear power (in the case of China) in electricity generation. Industrial demand for coal also weakens.
—with renewables being the fastest-growing energy source
20
U.S. Energy Information Administration www.eia.gov/ieo#IEO2017U.S. Energy Information Administration
World gross domestic producttrillion 2010 dollars, purchasing power parity
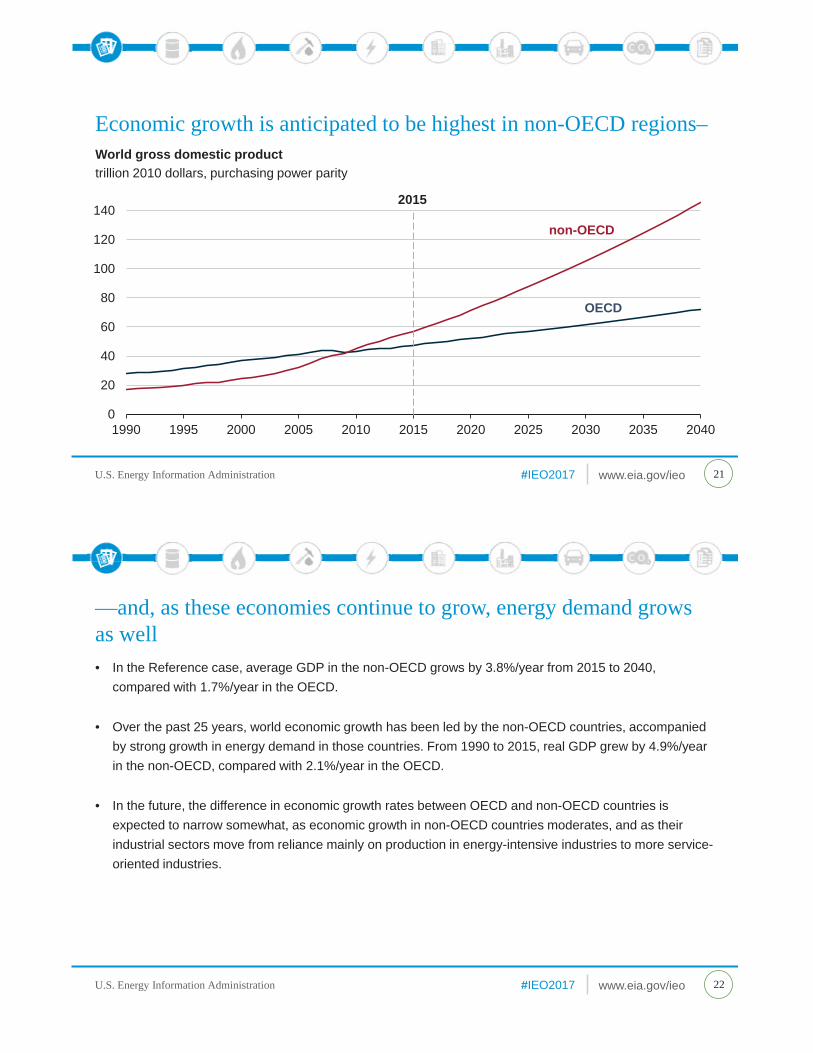
Economic growth is anticipated to be highest in non-OECD regions–
U.S. Energy Information Administration www.eia.gov/ieo#IEO2017U.S. Energy Information Administration
• In the Reference case, average GDP in the non-OECD grows by 3.8%/year from 2015 to 2040, compared with 1.7%/year in the OECD.
• Over the past 25 years, world economic growth has been led by the non-OECD countries, accompanied by strong growth in energy demand in those countries. From 1990 to 2015, real GDP grew by 4.9%/year in the non-OECD, compared with 2.1%/year in the OECD.
• In the future, the difference in economic growth rates between OECD and non-OECD countries is expected to narrow somewhat, as economic growth in non-OECD countries moderates, and as their industrial sectors move from reliance mainly on production in energy-intensive industries to more service-oriented industries.
—and, as these economies continue to grow, energy demand grows as well
22
U.S. Energy Information Administration www.eia.gov/ieo#IEO2017U.S. Energy Information Administration
Economic growth varies widely across non-OECD regions in the Reference case—
23
0.0 1.0 2.0 3.0 4.0 5.0 6.0
OECD
0.0 1.0 2.0 3.0 4.0 5.0 6.0
non-OECD
Average annual percent change in GDP, 2015-40percent per year
U.S. Energy Information Administration www.eia.gov/ieo#IEO2017U.S. Energy Information Administration
• Australia and New Zealand combined has the fastest economic growth across the OECD regions. GDP in this region grows by an average 2.6%/year from 2015 to 2040.
• Japan is the slowest-growing economy, averaging 0.2%/year, primarily attributable to declining population and aging workforce.
• India has the world’s fastest-growing economy in the Reference case, averaging 5.0%/year from 2015 to 2040.
• In China, average GDP expected to increase by 4.3%/year between 2015 and 2040. GDP growth in China slows considerably compared with growth over the past decade when GDP increased by an average 9.6%/year.
—with the highest rates occurring in non-OECD Asia and Africa
24
U.S. Energy Information Administration www.eia.gov/ieo#IEO2017U.S. Energy Information Administration
Non-OECD total population grows at more than twice the rate as the total OECD population—
25
-1.0 0.0 1.0 2.0 3.0
Total OECD
Japan
South Korea
OECD Europe
United States
Canada
Mexico and Chile
Australia and New Zealand
OECD
-1.0 0.0 1.0 2.0 3.0
Total Non-OECD
RussiaOther Europe and Eurasia
ChinaBrazil
Other AmericasIndia
Other AsiaMiddle East
Africa
non-OECD
Average annual percent change in population, 2015-40percent per year
U.S. Energy Information Administration www.eia.gov/ieo#IEO2017U.S. Energy Information Administration
• Population is an important driver of energy demand.
• In Japan and many parts of non-OECD Europe and Eurasia, the population is expected to decline from 2015 to 2040. The populations of OECD Europe, South Korea, and China are expected to grow by about 0.2%/year or lower.
• Within the non-OECD, Africa, the Middle East, and countries in non-OECD Asia other than China are expected to experience among the highest rates of population growth in the world. However, relatively underdeveloped energy infrastructures and large rural populations constrain growth in energy consumption in many countries of these regions.
—which has implications for future energy consumption
26
U.S. Energy Information Administration www.eia.gov/ieo#IEO2017U.S. Energy Information Administration
Although population and per capita output continue to rise—
27
0
1,000
2,000
3,000
4,000
5,000
6,000
7,000
8,000
1990 2015 2040
non-OECD
OECD
0
10
20
30
40
50
60
1990 2015 20400
1
2
3
4
5
6
7
8
9
10
1990 2015 20400
10
20
30
40
50
60
70
1990 2015 2040
Populationmillion people
Gross domestic product per capitathousand dollars
Carbon intensitymetric tons CO2 per billion Btu
Energy intensitythousand Btu per dollar
U.S. Energy Information Administration www.eia.gov/ieo#IEO2017U.S. Energy Information Administration
• Worldwide, the amount of energy used per unit of economic growth (energy intensity) has declined steadily for many years, while the amount of CO2 emissions associated with energy consumption (carbon intensity) has generally declined in OECD countries since 2008.
• In OECD countries, these trends continue as increases in energy efficiency and fuel economy lower energy intensity.
• In non-OECD countries, declines in energy intensity are particularly strong in the first 10 years of the projection as many of the larger economies begin to shift production into less energy-intensive industries and services.
• Carbon intensity continues to decline largely as a result of a move away from coal in China and worldwide growth in the use of non-CO2-emitting sources of energy, such as wind and solar.
—energy and carbon intensity are projected to continue to fall in the Reference case
28
U.S. Energy Information Administration www.eia.gov/ieo#IEO2017U.S. Energy Information Administration
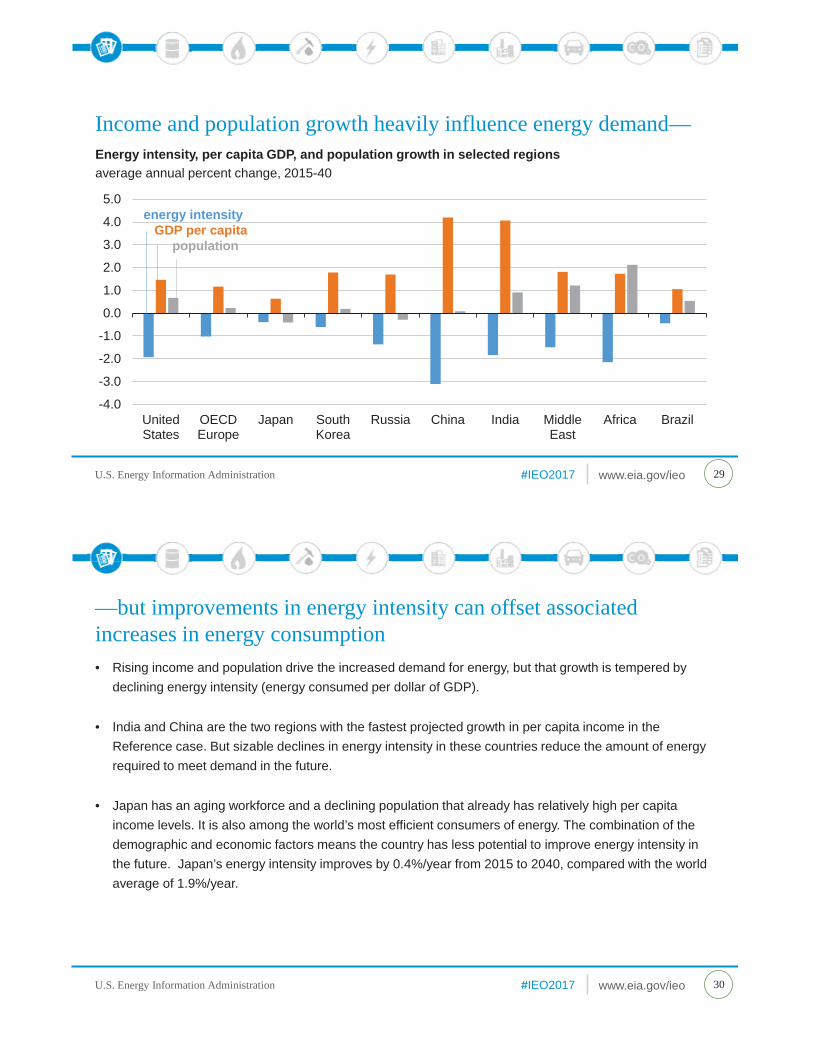
Energy intensity, per capita GDP, and population growth in selected regionsaverage annual percent change, 2015-40
Income and population growth heavily influence energy demand—
29
-4.0
-3.0
-2.0
-1.0
0.0
1.0
2.0
3.0
4.0
5.0
UnitedStates
OECDEurope
Japan SouthKorea
Russia China India MiddleEast
Africa Brazil
energy intensityGDP per capita
population
U.S. Energy Information Administration www.eia.gov/ieo#IEO2017U.S. Energy Information Administration
• Rising income and population drive the increased demand for energy, but that growth is tempered by declining energy intensity (energy consumed per dollar of GDP).
• India and China are the two regions with the fastest projected growth in per capita income in the Reference case. But sizable declines in energy intensity in these countries reduce the amount of energy required to meet demand in the future.
• Japan has an aging workforce and a declining population that already has relatively high per capita income levels. It is also among the world’s most efficient consumers of energy. The combination of the demographic and economic factors means the country has less potential to improve energy intensity in the future. Japan’s energy intensity improves by 0.4%/year from 2015 to 2040, compared with the world average of 1.9%/year.
—but improvements in energy intensity can offset associated increases in energy consumption
30
U.S. Energy Information Administration www.eia.gov/ieo#IEO2017U.S. Energy Information Administration
Petroleum and other liquids
U.S. Energy Information Administration www.eia.gov/ieo#IEO2017U.S. Energy Information Administration
U.S. Energy Information Administration www.eia.gov/ieo#IEO2017U.S. Energy Information Administration
Oil prices vary widely across the High Oil Price, Reference, and Low Oil Price cases—
33
0
10
20
30
40
50
60
70
80
Referencecase
Low Oil Pricecase
Referencecase
High OilPrice case
OECD
non-OECD
2015 2040
0
20
40
60
80
100
120
140
Referencecase
Low OilPrice case
Referencecase
High OilPrice case
other liquid fuels
non-OPECcrude and lease condensate
OPEC crude and lease condensate
2015 2040
World petroleum and other liquid fuels productionmillion barrels per day
Petroleum and other liquids consumption, 2015 and 2040million barrels per day
U.S. Energy Information Administration www.eia.gov/ieo#IEO2017U.S. Energy Information Administration
• In the Reference case, world consumption of liquid fuels rises from 95 million barrels per day (b/d) in 2015 to 113 million b/d in 2040. Non-OECD nations account for most of the increase, with demand rising by 1.3%/year compared with a slight decrease in the OECD. OPEC countries maintain or increase their combined market share of crude and lease condensate production.
• The High Oil Price case assumes faster economic growth among emerging, non-OECD nations, which contributes to higher energy demand; however, consumers switch to alternative fuels, act to conserve liquids, and adopt more-efficient technologies. World liquid fuels consumption in 2040 is 2.9 million b/d lower than in the Reference case. In this case, there is more production of crude and lease condensate from high-cost producers and less production from low-cost conventional resources.
• In the Low Oil Price case, slower non-OECD economic growth leads to lower energy demand, but the lower prices mean that consumers use more liquid fuels. In 2040, world liquids consumption is 4.5 million b/d higher than in the Reference case. There is more production of crude and lease condensate for low-cost producers and less production from high-cost producers.
—but without a large effect on global liquid fuels consumption
34
U.S. Energy Information Administration www.eia.gov/ieo#IEO2017U.S. Energy Information Administration
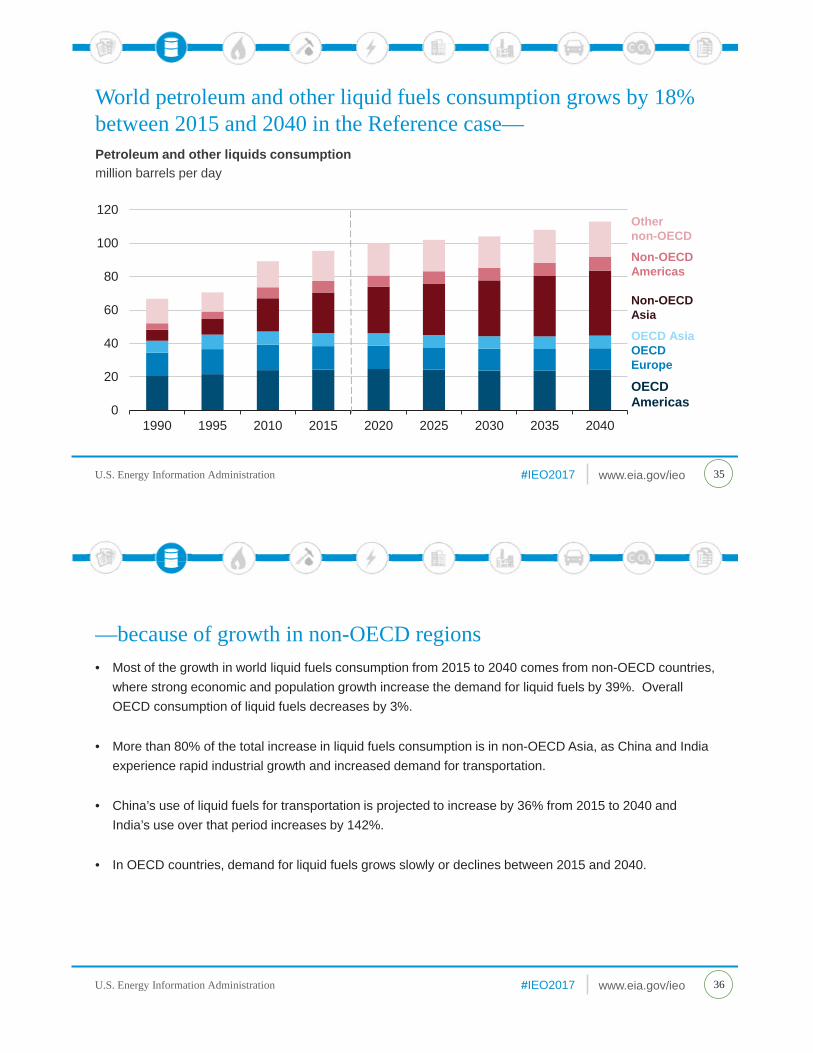
Petroleum and other liquids consumptionmillion barrels per day
World petroleum and other liquid fuels consumption grows by 18% between 2015 and 2040 in the Reference case—
35
0
20
40
60
80
100
120
1990 1995 2010 2015 2020 2025 2030 2035 2040
Othernon-OECD
Non-OECDAmericas
Non-OECDAsia
OECD AsiaOECDEurope
OECD Americas
U.S. Energy Information Administration www.eia.gov/ieo#IEO2017U.S. Energy Information Administration
• Most of the growth in world liquid fuels consumption from 2015 to 2040 comes from non-OECD countries, where strong economic and population growth increase the demand for liquid fuels by 39%. Overall OECD consumption of liquid fuels decreases by 3%.
• More than 80% of the total increase in liquid fuels consumption is in non-OECD Asia, as China and India experience rapid industrial growth and increased demand for transportation.
• China’s use of liquid fuels for transportation is projected to increase by 36% from 2015 to 2040 and India’s use over that period increases by 142%.
• In OECD countries, demand for liquid fuels grows slowly or declines between 2015 and 2040.
—because of growth in non-OECD regions
36
U.S. Energy Information Administration www.eia.gov/ieo#IEO2017U.S. Energy Information Administration
Refined petroleum and other liquids consumption by end-use sectorquadrillion Btu
World shares of liquids use hold relatively constant across sectors—
37
0
20
40
60
80
100
120
140
2015 2020 2025 2030 2035 2040
transportation
industrial
buildings
electricity
54%
36%
6%
4%
56%
36%
5%
2%
U.S. Energy Information Administration www.eia.gov/ieo#IEO2017U.S. Energy Information Administration
• The transportation sector remains the largest consumer of refined petroleum and other liquids as their use for travel and freight services increases at a faster rate than their use in other applications between 2015 and 2040.
• Petroleum and other liquids are used in the industrial sector to power equipment, serve as chemical feedstocks, and provide industrial heat. These uses increase slowly between 2015 and 2040.
• The use of liquid fuels in buildings, mainly liquefied petroleum gas (LPG) to provide space heat in regions where natural gas infrastructure is less developed, is nearly flat from 2015 to 2040.
• The use of petroleum and other liquids to generate electricity declines over the projection as various factors, including increasing oil prices and relatively less costly natural gas, encourage producers to switch to alternative energy sources.
—even as total consumption increases
38
U.S. Energy Information Administration www.eia.gov/ieo#IEO2017U.S. Energy Information Administration
World liquid fuels production by region and typemillions barrels per day
In the Reference case, liquid fuel supplies increase from 2015 to 2040—
39
0
10
20
30
40
50
60
2005 2010 2015 2020 2025 2030 2035 2040
non-OPEC crude and lease condensate
OPEC crude and lease condensate
other liquids
2015
U.S. Energy Information Administration www.eia.gov/ieo#IEO2017U.S. Energy Information Administration
• World liquid fuels production rises by 16.1 million b/d from 2015 to 2040, with more than half of the increase coming from a 10.3 million b/d increase in crude oil and lease condensate, including production from tight and non-tight resources, and extra-heavy crude oils and processed bitumen from oil sands from OPEC member countries.
• Production of other liquids (natural gas plant liquids, gas-to-liquids, coal-to-liquids, oil shale, refinery gain, and biofuels) increases by 4.2 million b/d (25%) from 2015 to 2040.
• Natural gas plant liquids, refinery gain, and biofuels account for about 95% of growth between 2015 and 2040 in the production of other liquid fuels.
—with most of the growth occurring in OPEC crude oil and lease condensate
40
U.S. Energy Information Administration www.eia.gov/ieo#IEO2017U.S. Energy Information Administration
OPEC crude and lease condensate production by regionmillion barrels per day
In the Reference case, OPEC crude oil production increases between 2015 and 2040—
41
0
5
10
15
20
25
30
35
Middle East North Africa West Africa South America
2040
2015
20302020
2010
U.S. Energy Information Administration www.eia.gov/ieo#IEO2017U.S. Energy Information Administration
• Middle East OPEC production of crude oil and lease condensate increases in the Reference case projection.
• Production from large and low-cost resources in the Middle East is expected to remain a critical part of global crude supply for the entire projection period.
• OPEC is expected to maintain its strategy of capturing market share during price downturns.
—with most of the growth occurring in the Middle East
42
U.S. Energy Information Administration www.eia.gov/ieo#IEO2017U.S. Energy Information Administration
Crude and lease condensate productionmillion barrels per day
Non-OPEC crude oil production in the Reference case increases less than 2% between 2015 and 2040—
43
0
2
4
6
8
10
12
Russia Canada Brazil Kazakhstan
2015
20402030
2020
2010
U.S. Energy Information Administration www.eia.gov/ieo#IEO2017U.S. Energy Information Administration
• Non-OPEC crude oil production outside of the United States grows by 630,000 b/d from 2015 to 2040, with increases in Russia, Canada, Brazil, and Kazakhstan. There are sizeable decreases projected for crude oil production from OECD Europe and China.
• Brazil’s 1.95 million b/d projected increase from 2015 to 2040 is attributable to greater offshore production, largely occurring after 2030.
• Russia’s 485,000 b/d increase in production by 2040 comes mainly from non-tight resources, but the country also sees moderated growth in tight oil production after 2030.
• Canada’s 1.26 million b/d increase in production by 2040 mainly comes from oil sands production, with small additions from tight and non-tight resources.
• Kazakhstan’s 687,000 b/d increase in production by 2040 is the result of increased supply from the Kashagan oil field.
—but growth coming from Russia, Canada, Brazil, and Kazakhstan increases by 24%
44
U.S. Energy Information Administration www.eia.gov/ieo#IEO2017U.S. Energy Information Administration
Gas-to-liquids plant productionthousand barrels per day
In the Reference case, gas-to-liquids growth is dominated by two large-scale projects—
45
0
50
100
150
200
250
300
350
400
450
2005 2010 2015 2020 2025 2030 2035 2040
Other
South Africa
Uzbekistan
Qatar
Nigeria
2015
U.S. Energy Information Administration www.eia.gov/ieo#IEO2017U.S. Energy Information Administration
• Gas-to-liquids (GTL) development is sensitive to product prices and regulatory factors, and small-scale projects may be used as an alternative to flaring natural gas or to capture emissions from landfills.
• Two large-scale GTL projects are projected to come online in the Reference case—a new 37,600 b/d GTL facility in Uzbekistan in 2021 and a conversion of a 160,000 b/d coal-to-liquids to GTL plant in South Africa in 2025.
• Besides the South Africa and Uzbekistan projects, the remaining growth in GTL output is expected to come from small (capacity of 5,000 b/d or less) facilities.
—located in South Africa and Uzbekistan
46
U.S. Energy Information Administration www.eia.gov/ieo#IEO2017U.S. Energy Information Administration
Natural gas
U.S. Energy Information Administration www.eia.gov/ieo#IEO2017U.S. Energy Information Administration
U.S. Energy Information Administration www.eia.gov/ieo#IEO2017U.S. Energy Information Administration 49
World natural gas consumption increases by 43% from 2015 to 2040 in the Reference case—
U.S. Energy Information Administration www.eia.gov/ieo#IEO2017U.S. Energy Information Administration 52
—with the electric power and industrial sectors accounting for nearly 75% of the increase between 2015 and 2040• Natural gas continues to be an attractive fuel for the electric power and industrial sectors in many
countries. These two uses account for nearly 75% of the projected increase in total consumption between 2015 and 2040.
• Natural gas-fired generation is attractive for new power plants because of low capital costs, favorable heat rates, and relatively low fuel cost.
• Natural gas-intensive industries, such as chemicals, refining, and primary metals, expand over the period of 2015–40—particularly in non-OECD countries—driving industrial demand.
• The International Convention for the Prevention of Pollution from Ships (MARPOL) Annex VI, which limits the sulfur content of marine fuels, and the growing spread between oil and natural gas prices are projected to lead to a greater use of liquefied natural gas (LNG) as a bunkering fuel towards the end of the projection.
U.S. Energy Information Administration www.eia.gov/ieo#IEO2017U.S. Energy Information Administration 53
The largest increases in Reference case natural gas production occur in the Middle East, United States, and China—
0 2 4 6 8 10 12 14
Non-OECD Americas
Canada
Other non-OECD Asia
Africa
Australia and New Zealand
Russia
China
United States
Middle East
Increase in natural gas production 2015-40trillion cubic feet
U.S. Energy Information Administration www.eia.gov/ieo#IEO2017U.S. Energy Information Administration 54
—accounting for 12%, 20%, and 18% of growth respectively• In the United States and China, increases in natural gas production between 2015 and 2040 are
projected to mainly come from the development of shale resources.
• Russia’s growth in natural gas production over the period of 2015–40 is supported by an increased development of resources in the country’s Arctic and the Eastern regions.
• Newly developed offshore fields in Mozambique and Tanzania and increasing production in Egypt’s Zohrfield support LNG exports from Africa.
U.S. Energy Information Administration www.eia.gov/ieo#IEO2017U.S. Energy Information Administration 55
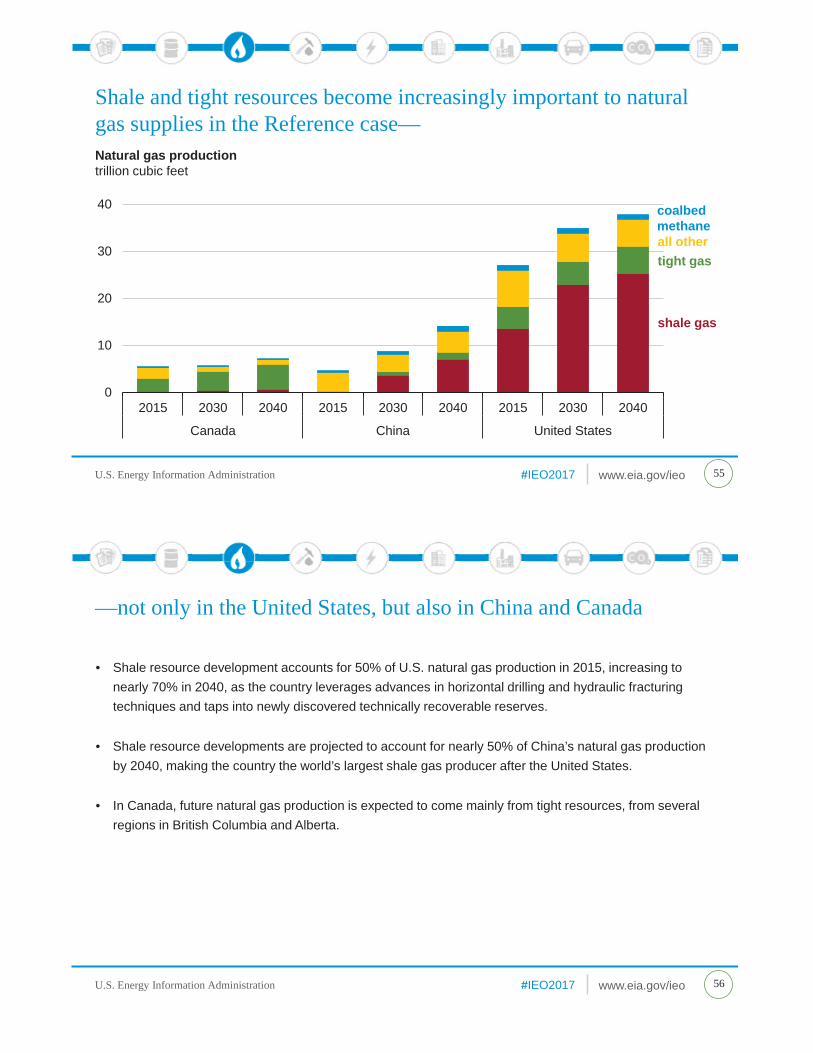
Shale and tight resources become increasingly important to natural gas supplies in the Reference case—
0
10
20
30
40
2015 2030 2040 2015 2030 2040 2015 2030 2040
Canada China United States
coalbed methaneall othertight gas
shale gas
Natural gas productiontrillion cubic feet
U.S. Energy Information Administration www.eia.gov/ieo#IEO2017U.S. Energy Information Administration 56
—not only in the United States, but also in China and Canada
• Shale resource development accounts for 50% of U.S. natural gas production in 2015, increasing to nearly 70% in 2040, as the country leverages advances in horizontal drilling and hydraulic fracturing techniques and taps into newly discovered technically recoverable reserves.
• Shale resource developments are projected to account for nearly 50% of China’s natural gas production by 2040, making the country the world’s largest shale gas producer after the United States.
• In Canada, future natural gas production is expected to come mainly from tight resources, from several regions in British Columbia and Alberta.
U.S. Energy Information Administration www.eia.gov/ieo#IEO2017U.S. Energy Information Administration 57
Shale resources lead natural gas production growth in China—
0
5
10
15
20
25
2015 2020 2025 2030 2035 2040
coalbed methanetight gas
shale gas
imports
conventional
China's natural gas supply mixtrillion cubic feet
U.S. Energy Information Administration www.eia.gov/ieo#IEO2017U.S. Energy Information Administration 58
—while production from coalbed methane resources continues to remain low• China’s imports of natural gas remain at 32% of supply in 2015 and 2040 as the country’s domestic shale
gas production grows from 2% in 2015 to 33% over the same period.
• Despite China’s prolonged developmental efforts in the past, coalbed methane is expected to remain a modest source of natural gas from 2015 to 2040 because of lower productivity compared with other production methods.
• Russian exports account for a growing share of China’s pipeline imports as pipeline capacity expands. China’s LNG imports are also projected to grow—supplied by an increasingly diversified pool of exporters.
• Tight gas is projected to increase by only 1.5 trillion cubic feet over the period of 2015–40 largely because of high production costs relative to other sources.
U.S. Energy Information Administration www.eia.gov/ieo#IEO2017U.S. Energy Information Administration
Non-OECD Asia growth rate propels it to the second highest net natural gas importer after OECD Europe by 2040 in the Reference case—
59
OOEEEEEEEEEEEEEECCCCCCCCCCCCCCCCCCCCD thhhhhhhhhhhhhhhhhhhhhh s it toiiiiiiiiiiiiiiit t hh d hhhhhhhhhhhhhhhhhhhhhhhhi ttttttNNNNNNNNNN
-15
-10
-5
0
5
10
15
20
OECDAmericas
OECDEurope
Australiaand NewZealand
Japan &South Korea
2010
OECD
20152020
20302040
imports
exports
Middle East Europe andEurasia
Africa Asia
Non-OECD
Net trade of natural gastrillion cubic feet
U.S. Energy Information Administration www.eia.gov/ieo#IEO2017U.S. Energy Information Administration 60
—with import demand increasingly met by non-OECD Europe and Eurasia• World liquefied natural gas (LNG) trade is projected to nearly triple, from 12 trillion cubic feet to 31 trillion
cubic feet, between 2015 and 2040.
• Despite strong growth in LNG trade, pipeline flows are projected to continue to account for 48% of the interregional natural gas flows in 2040 as pipeline infrastructure is further developed.
• Europe is projected to remain largely dependent on Russian pipeline gas, while Asia is projected to import a large share of the traded LNG.
• North America is projected to become a major exporter of natural gas by 2020, even though flows from Russia to Europe and Asia are expected to show the largest volumetric growth in trade.
U.S. Energy Information Administration www.eia.gov/ieo#IEO2017U.S. Energy Information Administration
Coal
U.S. Energy Information Administration www.eia.gov/ieo#IEO2017U.S. Energy Information Administration
U.S. Energy Information Administration www.eia.gov/ieo#IEO2017U.S. Energy Information Administration
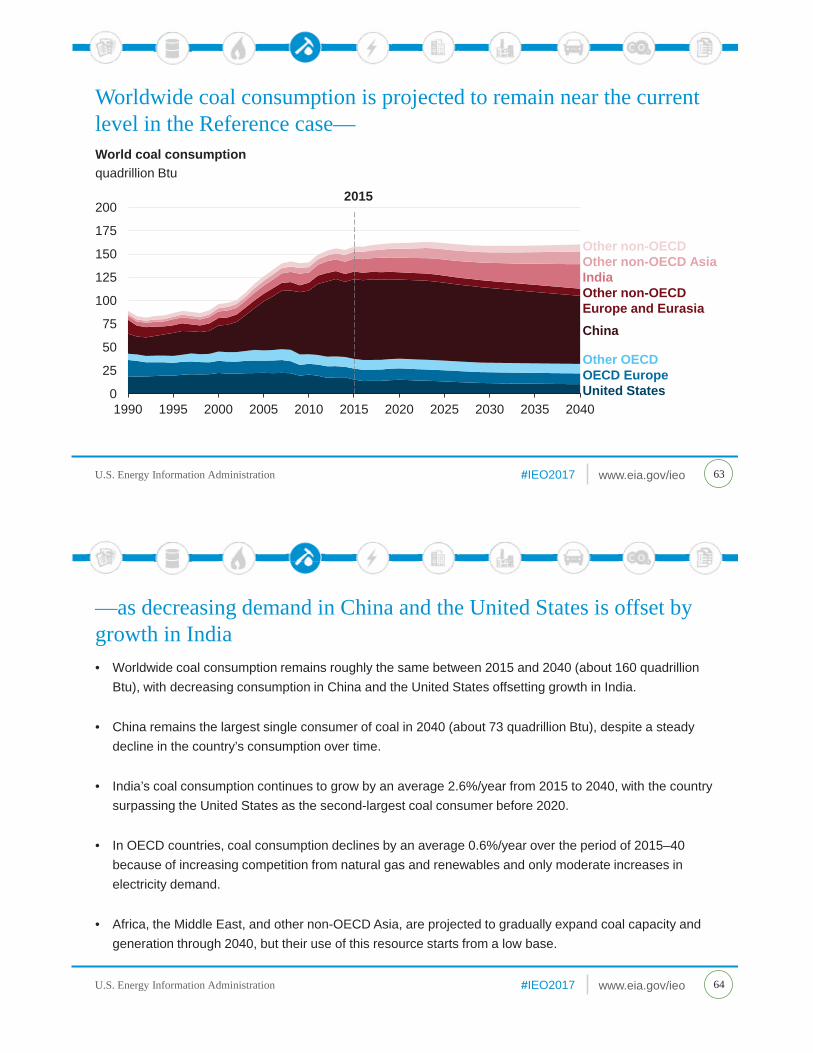
World coal consumptionquadrillion Btu
Worldwide coal consumption is projected to remain near the current level in the Reference case—
Other non-OECDOther non-OECD AsiaIndiaOther non-OECD Europe and EurasiaChina
Other OECDOECD EuropeUnited States
U.S. Energy Information Administration www.eia.gov/ieo#IEO2017U.S. Energy Information Administration
• Worldwide coal consumption remains roughly the same between 2015 and 2040 (about 160 quadrillion Btu), with decreasing consumption in China and the United States offsetting growth in India.
• China remains the largest single consumer of coal in 2040 (about 73 quadrillion Btu), despite a steady decline in the country’s consumption over time.
• India’s coal consumption continues to grow by an average 2.6%/year from 2015 to 2040, with the country surpassing the United States as the second-largest coal consumer before 2020.
• In OECD countries, coal consumption declines by an average 0.6%/year over the period of 2015–40 because of increasing competition from natural gas and renewables and only moderate increases in electricity demand.
• Africa, the Middle East, and other non-OECD Asia, are projected to gradually expand coal capacity and generation through 2040, but their use of this resource starts from a low base.
—as decreasing demand in China and the United States is offset by growth in India
64
U.S. Energy Information Administration www.eia.gov/ieo#IEO2017U.S. Energy Information Administration
China’s coal consumption in the Reference Case decreases through 2040—
65
0
20
40
60
80
100
120
2015 2020 2025 2030 2035 2040
buildings
electricpower
industrial
0
30
60
90
120
150
180
2015 2020 2025 2030 2035 2040
Coal consumption in Chinaquadrillion Btu
2015
Coal imports in Chinamillion short tons
U.S. Energy Information Administration www.eia.gov/ieo#IEO2017U.S. Energy Information Administration
—as a result of changes in industry mix and policies to encourage nuclear and renewable energy use
66
• The use of coal in Chinese electricity generation is projected to increase slightly through 2023 and then slowly decline to less than the 2015 level of 40 quadrillion Btu by 2035.
• Non-electricity consumption of coal in China is projected to fall from 46 quadrillion Btu to 34 quadrillion Btu between 2015 and 2040 because of a decreasing use of steam and metallurgical coal in industrial steam applications and steel manufacturing.
• China is expected to continue to import only about 3% of its coal for consumption through 2040 because of the country’s policy to maintain a course of self-sufficiency.
U.S. Energy Information Administration www.eia.gov/ieo#IEO2017U.S. Energy Information Administration
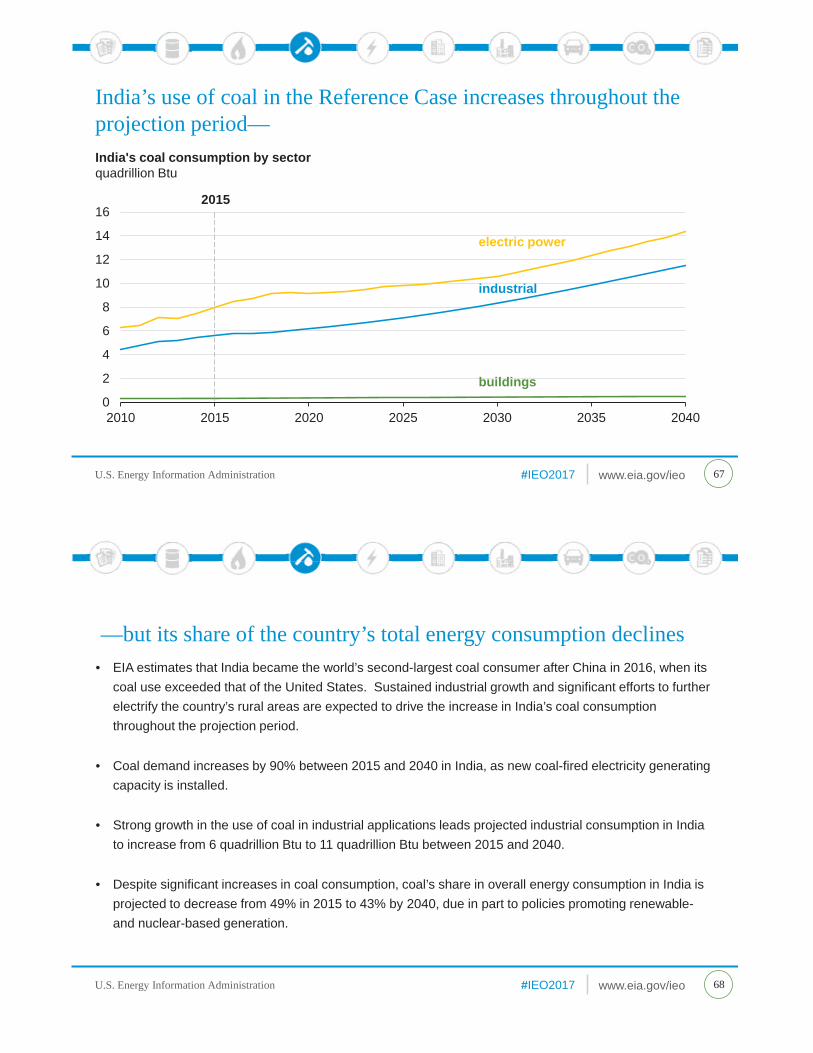
India's coal consumption by sectorquadrillion Btu
India’s use of coal in the Reference Case increases throughout the projection period—
67
0
2
4
6
8
10
12
14
16
2010 2015 2020 2025 2030 2035 2040
electric power
industrial
buildings
2015
U.S. Energy Information Administration www.eia.gov/ieo#IEO2017U.S. Energy Information Administration
—but its share of the country’s total energy consumption declines
68
• EIA estimates that India became the world’s second-largest coal consumer after China in 2016, when its coal use exceeded that of the United States. Sustained industrial growth and significant efforts to further electrify the country’s rural areas are expected to drive the increase in India’s coal consumption throughout the projection period.
• Coal demand increases by 90% between 2015 and 2040 in India, as new coal-fired electricity generating capacity is installed.
• Strong growth in the use of coal in industrial applications leads projected industrial consumption in India to increase from 6 quadrillion Btu to 11 quadrillion Btu between 2015 and 2040.
• Despite significant increases in coal consumption, coal’s share in overall energy consumption in India is projected to decrease from 49% in 2015 to 43% by 2040, due in part to policies promoting renewable-and nuclear-based generation.
U.S. Energy Information Administration www.eia.gov/ieo#IEO2017U.S. Energy Information Administration
Coal use in non-OECD Asia outside of China and India increases in the Reference case—
69
0
10
20
30
40
50
60
70
80
2010 2015 2020 2025 2030 2035 2040
2015
liquids
natural gas
coalrenewablesnuclear 0%
10%20%30%40%50%60%70%80%90%
100%
2010 2015 2020 2025 2030 2035 2040
2015
Energy consumption in other non-OECD Asiaquadrillion Btu
Energy consumption in other non-OECD Asiapercent of fuel share
U.S. Energy Information Administration www.eia.gov/ieo#IEO2017U.S. Energy Information Administration
• Total energy consumption in non-OECD Asia outside of China and India (other non-OECD Asia) is projected to increase by almost 80% from 2015 to 2040, reaching 69 quadrillion Btu.
• Coal consumption in the region increases by 2.4%/year from 2015 to 2040—maintaining a 20% share of total energy consumption—as many countries continue to take advantage of coal’s relatively low cost in their efforts to further develop their economies.
• The other non-OECD Asia region is projected to import a significant share of its coal requirements, even though Indonesia is a major exporter.
—but it maintains a constant share of energy consumption
70
U.S. Energy Information Administration www.eia.gov/ieo#IEO2017U.S. Energy Information Administration
World coal productionbillion short tons
Worldwide coal production remains flat through 2040 in the Reference Case—
71
0123456789
10
1990 2000 2010 2015 2020 2030 2040
rest of worldUnited StatesAustralia & New ZealandOECD EuropeOther non-OECD AsiaIndia
China
2015
U.S. Energy Information Administration www.eia.gov/ieo#IEO2017U.S. Energy Information Administration
—with decreases in China offset by increases in India
72
• World coal production is projected to increase 3% from 2015 to 2040, almost reaching 9.4 billions short tons.
• China, India, Australia, and the United States are projected to remain the largest coal-producing nations through 2040.
• China, which consumes nearly all of its coal production domestically, is projected to decrease production by 0.7 billion tons (15%) from 2015 to 2040 as demand within the country falls.
• India is projected to increase its annual coal production by 0.6 billion tons by 2040 to help meet growing domestic demand.
U.S. Energy Information Administration www.eia.gov/ieo#IEO2017U.S. Energy Information Administration
Asia remains the world’s largest importer of coal in 2040—
73
0.0
0.2
0.4
0.6
0.8
1.0
1.2
1.4
1.6
2015 2025 2040
rest of world
India
other non-OECD AsiaChinaSouth KoreaJapanOECD Europe
2015
0.0
0.2
0.4
0.6
0.8
1.0
1.2
1.4
1.6
2015 2025 2040
rest of worldUnited StatesSouth AmericaEurasiaSouthern Africa
Indonesia
Australia
2015
Coal imports billion short tons
Coal exports billion short tons
U.S. Energy Information Administration www.eia.gov/ieo#IEO2017U.S. Energy Information Administration
—and Australia and Indonesia remain the largest exporters
74
• Trade in coal (as measured by imports between regions) is projected to grow gradually from 2015 to 2040 at an average rate of 1%/year.
• Growth in Asian coal imports follows trends in coal consumption as countries other than China increase their demand in industrial applications and electricity generation.
• Metallurgical coal trade increases gradually over time as industrial consumption shifts to India and other countries with limited or no metallurgical coal production.
• In contrast to Asia, coal imports into the Americas and Europe remain flat through 2040 as demand for coal decreases in these regions.
• Australia continues to be the world’s top coal exporter, followed by Indonesia. In 2040, Australia provides 37% of coal exports, and Indonesia provides 28%.
U.S. Energy Information Administration www.eia.gov/ieo#IEO2017U.S. Energy Information Administration
Electricity
U.S. Energy Information Administration www.eia.gov/ieo#IEO2017U.S. Energy Information Administration
U.S. Energy Information Administration www.eia.gov/ieo#IEO2017U.S. Energy Information Administration
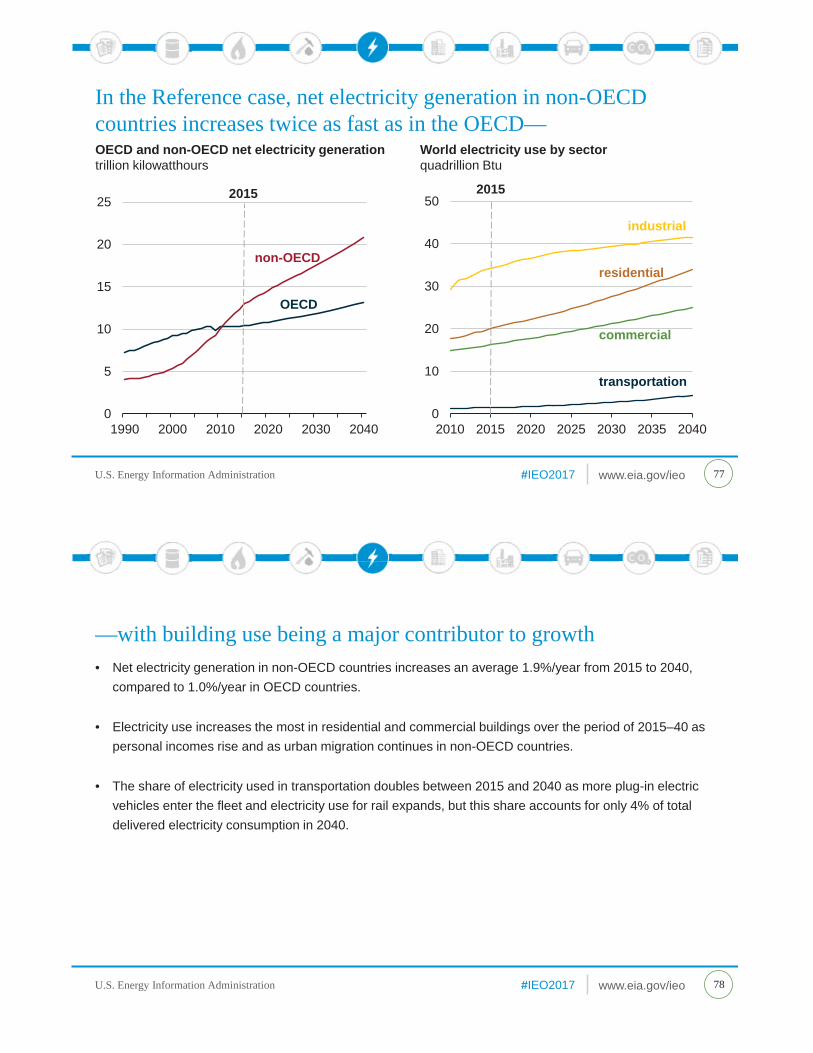
In the Reference case, net electricity generation in non-OECD countries increases twice as fast as in the OECD—
77
0
10
20
30
40
50
2010 2015 2020 2025 2030 2035 2040
industrial
residential
commercial
transportation
2015
0
5
10
15
20
25
1990 2000 2010 2020 2030 2040
non-OECD
OECD
OECD and non-OECD net electricity generationtrillion kilowatthours
World electricity use by sectorquadrillion Btu
2015
U.S. Energy Information Administration www.eia.gov/ieo#IEO2017U.S. Energy Information Administration
• Net electricity generation in non-OECD countries increases an average 1.9%/year from 2015 to 2040, compared to 1.0%/year in OECD countries.
• Electricity use increases the most in residential and commercial buildings over the period of 2015–40 as personal incomes rise and as urban migration continues in non-OECD countries.
• The share of electricity used in transportation doubles between 2015 and 2040 as more plug-in electric vehicles enter the fleet and electricity use for rail expands, but this share accounts for only 4% of total delivered electricity consumption in 2040.
—with building use being a major contributor to growth
78
U.S. Energy Information Administration www.eia.gov/ieo#IEO2017U.S. Energy Information Administration
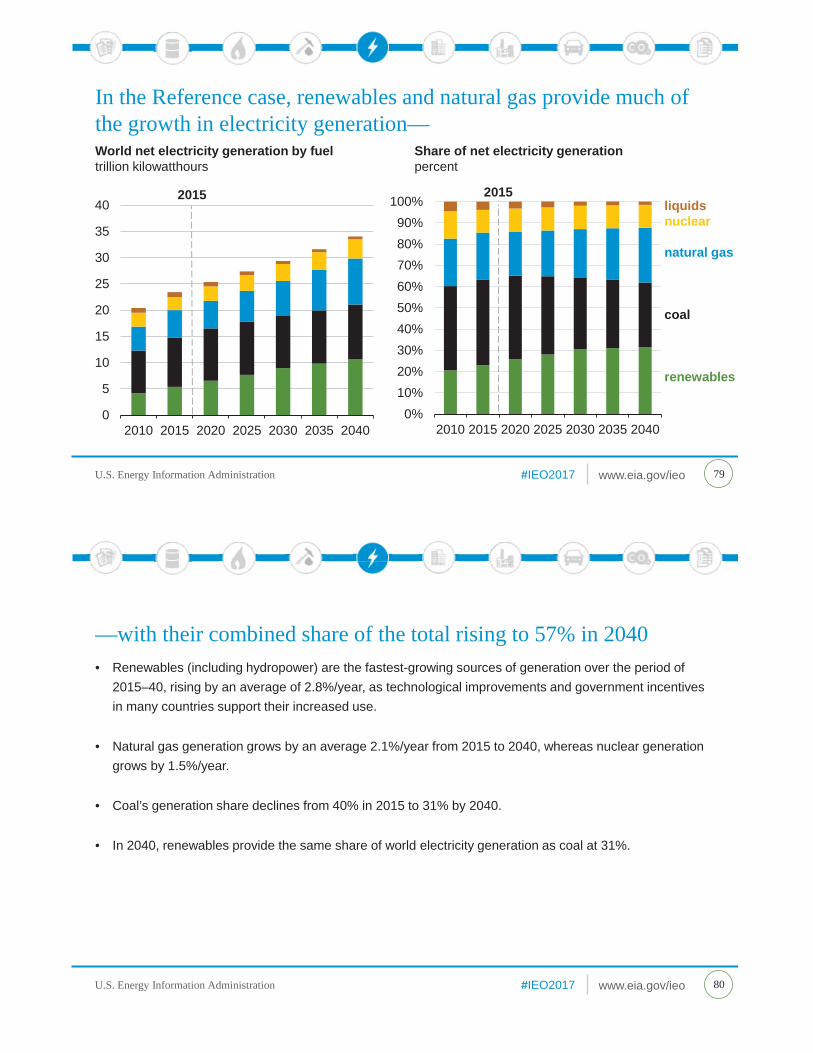
In the Reference case, renewables and natural gas provide much of the growth in electricity generation—
79
0%10%20%30%40%50%60%70%80%90%
100%
2010 2015 2020 2025 2030 2035 2040
liquidsnuclear
natural gas
coal
renewables
2015
0
5
10
15
20
25
30
35
40
2010 2015 2020 2025 2030 2035 2040
World net electricity generation by fueltrillion kilowatthours
2015
Share of net electricity generationpercent
U.S. Energy Information Administration www.eia.gov/ieo#IEO2017U.S. Energy Information Administration
• Renewables (including hydropower) are the fastest-growing sources of generation over the period of 2015–40, rising by an average of 2.8%/year, as technological improvements and government incentives in many countries support their increased use.
• Natural gas generation grows by an average 2.1%/year from 2015 to 2040, whereas nuclear generation grows by 1.5%/year.
• Coal’s generation share declines from 40% in 2015 to 31% by 2040.
• In 2040, renewables provide the same share of world electricity generation as coal at 31%.
—with their combined share of the total rising to 57% in 2040
80
U.S. Energy Information Administration www.eia.gov/ieo#IEO2017U.S. Energy Information Administration
0
2
4
6
8
10
12
2010 2015 2020 2025 2030 2035 2040
Wind and solar dominate growth in renewables—
81
0%
10%
20%
30%
40%
50%
60%
70%
80%
90%
100%
2010 2015 2020 2025 2030 2035 2040
othergeothermalsolar
wind
hydropower
2015
World net electricity generation from renewable powertrillion kilowatthours
2015
percent share of renewable energy
U.S. Energy Information Administration www.eia.gov/ieo#IEO2017U.S. Energy Information Administration
• Hydropower’s share of renewable generation falls from 71% in 2015 to 53% in 2040 as resource availability in OECD countries and environmental concerns in many countries limit the number of new mid- and large-scale hydropower projects.
• Generation from non-hydropower renewables rises an average 4.9%/year from 2015 to 2040.
• Among non-hydroelectric renewable energy sources, wind and solar increase the most over the period of 2015–40, reaching 2.5 and 1.4 trillion kilowatthours, respectively, as these technologies become more cost competitive over time.
—and represent over two-thirds of related capacity additions by 2040
82
U.S. Energy Information Administration www.eia.gov/ieo#IEO2017U.S. Energy Information Administration
0500
1,0001,5002,0002,5003,0003,5004,0004,5005,000
2010 2020 2030 2040
othersolar
wind
hydropower
2015
China’s use of coal to produce electricity starts to decline by 2030—
83
01,0002,0003,0004,0005,0006,0007,0008,0009,000
10,000
2010 2020 2030 2040
renewables
liquidsnatural gasnuclear
coal
2015
Sources of electricity generation in Chinabillion kilowatthours
Renewable generation in Chinabillion kilowatthours
U.S. Energy Information Administration www.eia.gov/ieo#IEO2017U.S. Energy Information Administration
• China’s share of coal generation declines from 72% in 2015 to 47% in 2040. The Chinese government’s 13th Five-Year Plan set a goal of capping coal capacity at 1,100 gigawatts (GW) by 2020, and the country has committed to cancelling 120 GW of previously planned additions to coal generating capacity.
• By displacing coal with renewables, nuclear, and natural gas, China is projected to achieve its maximum level of CO2 emissions before its 2030 targeted deadline.
• The renewable share of total generation in China rises from 22% in 2015 to 34% in 2040, as wind generation increases by more than six-fold.
• China’s share of nuclear generation increases from 3% in 2015 to 11% in 2040. Over the same period, the natural gas share increases from 2% to 7%.
—as shares of renewable and nuclear generation grow
84
U.S. Energy Information Administration www.eia.gov/ieo#IEO2017U.S. Energy Information Administration
0
500
1,000
1,500
2,000
2,500
3,000
2010 2020 2030 2040
renewables
natural gasliquidsnuclear
coal
Electricity from renewables in India increases rapidly in the Reference Case—
85
0
100
200
300
400
500
600
2010 2020 2030 2040
other
solar
wind
hydropower
2015
Sources of electricity generation in Indiabillion kilowatthours
Renewable generation in Indiabillion kilowatthours
2015
U.S. Energy Information Administration www.eia.gov/ieo#IEO2017U.S. Energy Information Administration
• Net electricity generation in India increases by an average of 3.2%/year from 2015 to 2040, driven by strong industrial growth and policies to increase the availability of electricity in rural areas.
• Coal’s share of total generation in India decreases from 77% in 2015 to 62% in 2040 as policies are implemented to promote non-CO2-emitting sources of electricity.
• The non-fossil fuel share of total capacity in India rises to 46% from 2015 to 2040, with 131 GW, 47 GW, and 35 GW of added solar, wind, and nuclear generating capacity, respectively.
• Indian nuclear capacity increases from 5 GW in 2015 to 17 GW in 2025 and then to 41 GW in 2040 and is limited by uncertainties in completing large-scale projects.
—but coal remains the primary generation source through 2040
86
U.S. Energy Information Administration www.eia.gov/ieo#IEO2017U.S. Energy Information Administration
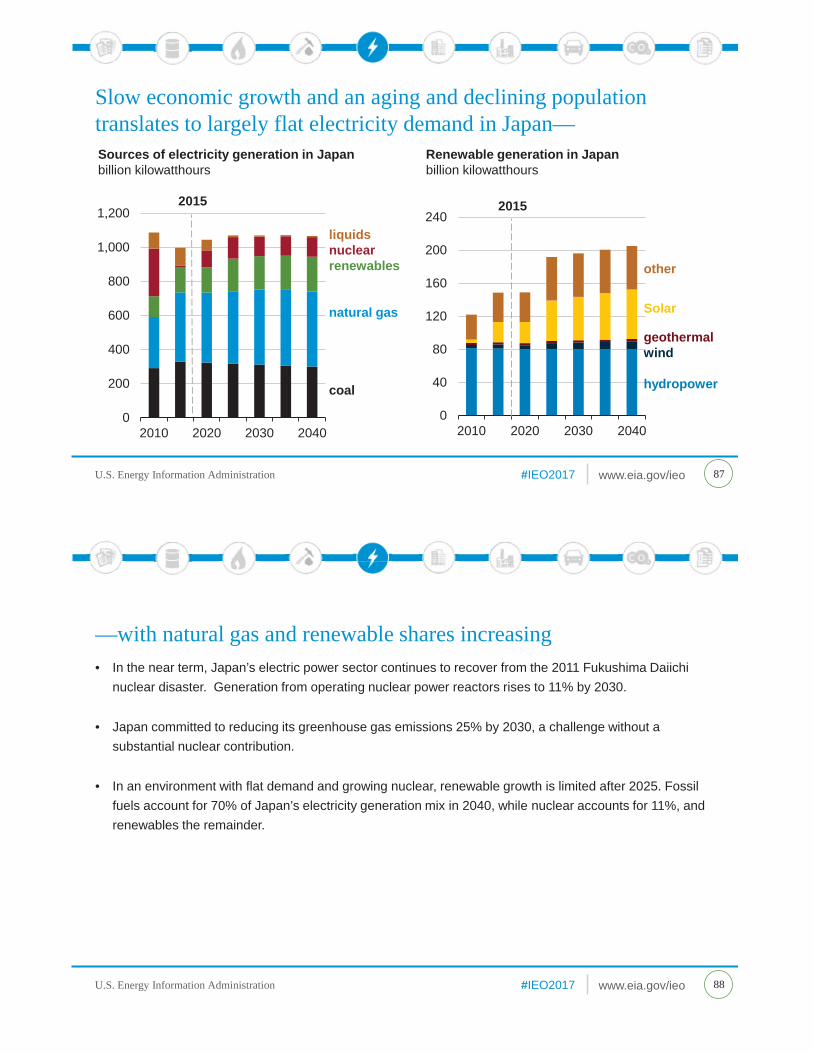
Slow economic growth and an aging and declining population translates to largely flat electricity demand in Japan—
87
0
200
400
600
800
1,000
1,200
2010 2020 2030 2040
liquidsnuclearrenewables
natural gas
coal
2015
0
40
80
120
160
200
240
2010 2020 2030 2040
other
Solar
geothermalwind
hydropower
2015
Sources of electricity generation in Japanbillion kilowatthours
Renewable generation in Japanbillion kilowatthours
U.S. Energy Information Administration www.eia.gov/ieo#IEO2017U.S. Energy Information Administration
• In the near term, Japan’s electric power sector continues to recover from the 2011 Fukushima Daiichi nuclear disaster. Generation from operating nuclear power reactors rises to 11% by 2030.
• Japan committed to reducing its greenhouse gas emissions 25% by 2030, a challenge without a substantial nuclear contribution.
• In an environment with flat demand and growing nuclear, renewable growth is limited after 2025. Fossil fuels account for 70% of Japan’s electricity generation mix in 2040, while nuclear accounts for 11%, and renewables the remainder.
—with natural gas and renewable shares increasing
88
U.S. Energy Information Administration www.eia.gov/ieo#IEO2017U.S. Energy Information Administration
0250500750
1,0001,2501,5001,7502,0002,2502,500
2010 2020 2030 2040
othersolargeothermalwind
hydropower
2015
OECD Europe reduces nuclear generation—
89
0500
1,0001,5002,0002,5003,0003,5004,0004,5005,000
2010 2020 2030 2040
nuclear
natural gas
renewables
liquidscoal
Electricity generation in OECD Europebillion kilowatthours
2015
Renewable generation in OECD Europebillion kilowatthours
U.S. Energy Information Administration www.eia.gov/ieo#IEO2017U.S. Energy Information Administration
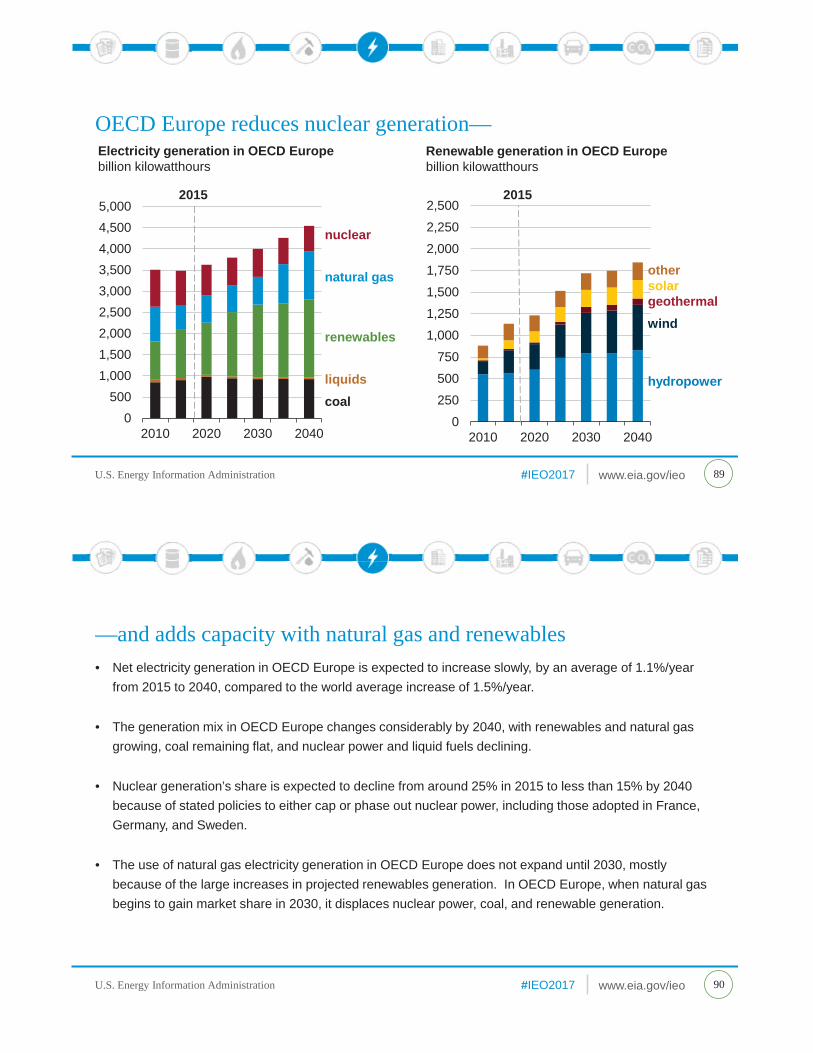
• Net electricity generation in OECD Europe is expected to increase slowly, by an average of 1.1%/year from 2015 to 2040, compared to the world average increase of 1.5%/year.
• The generation mix in OECD Europe changes considerably by 2040, with renewables and natural gas growing, coal remaining flat, and nuclear power and liquid fuels declining.
• Nuclear generation’s share is expected to decline from around 25% in 2015 to less than 15% by 2040 because of stated policies to either cap or phase out nuclear power, including those adopted in France, Germany, and Sweden.
• The use of natural gas electricity generation in OECD Europe does not expand until 2030, mostly because of the large increases in projected renewables generation. In OECD Europe, when natural gas begins to gain market share in 2030, it displaces nuclear power, coal, and renewable generation.
—and adds capacity with natural gas and renewables
90
U.S. Energy Information Administration www.eia.gov/ieo#IEO2017U.S. Energy Information Administration
Buildings
U.S. Energy Information Administration www.eia.gov/ieo#IEO2017U.S. Energy Information Administration
U.S. Energy Information Administration www.eia.gov/ieo#IEO2017U.S. Energy Information Administration
In the Reference case, residential and commercial energy consumption increases—
93
0
20
40
60
80
2010 2015 2020 2025 2030 2035 2040
2015
0
20
40
60
80
2010 2015 2020 2025 2030 2035 2040
2015
renewablescoalliquidsnatural gas
electricity
World residential sector energy consumption by fuelquadrillion Btu
World commercial sector energy consumption by fuelquadrillion Btu
U.S. Energy Information Administration www.eia.gov/ieo#IEO2017U.S. Energy Information Administration
• The buildings sector, which includes residential and commercial structures, accounts for almost 21% of the world’s delivered energy consumption in 2040, about the same as its share in 2015.
• Energy use in buildings is projected to increase by 32% between 2015 and 2040. Most of the increase occurs in large, emerging non-OECD countries, where population continues to shift from rural to urban areas.
• Electricity use in buildings grows 2% annually between 2015 and 2040 as rising standards of living in non-OECD countries increase the demand for appliances, personal equipment, and commercial services.
• Natural gas consumption in buildings grows by 20% over the period of 2015–40 as increased demand in non-OECD countries is partially offset by improvements in space heating equipment.
• The consumption of coal, used primarily for space heating, water heating, and cooking, continues to decline in the residential sector and remains relatively flat in the commercial sector.
—led by growth in the use of electricity and natural gas
94
U.S. Energy Information Administration www.eia.gov/ieo#IEO2017U.S. Energy Information Administration
Non-OECD countries drive increases in residential and commercial energy consumption—
95
0
10
20
30
40
50
60
70
80
2010 2015 2020 2025 2030 2035 2040
OECD
2015
0
10
20
30
40
50
60
70
80
2010 2015 2020 2025 2030 2035 2040
2015
other non-OECDnon-OECD Asia
OECD
World residential sector energy consumption by regionquadrillion Btu
World commercial sector energy consumption by regionquadrillion Btu
U.S. Energy Information Administration www.eia.gov/ieo#IEO2017U.S. Energy Information Administration
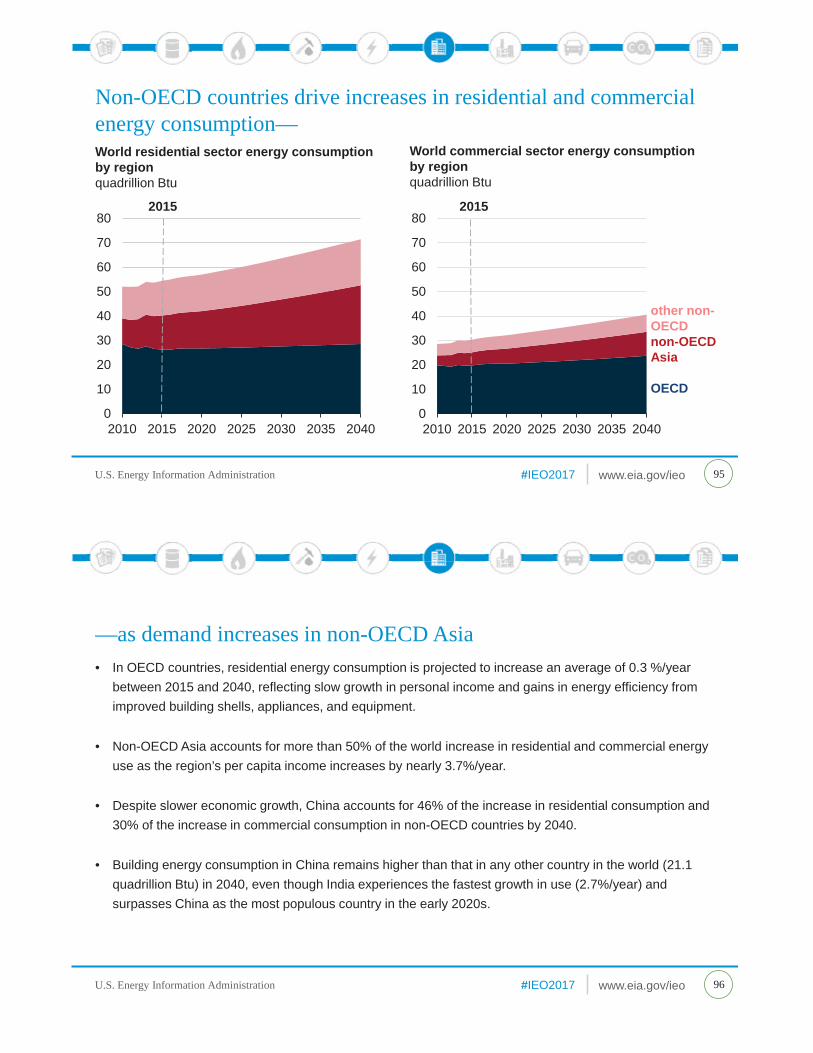
• In OECD countries, residential energy consumption is projected to increase an average of 0.3 %/year between 2015 and 2040, reflecting slow growth in personal income and gains in energy efficiency from improved building shells, appliances, and equipment.
• Non-OECD Asia accounts for more than 50% of the world increase in residential and commercial energy use as the region’s per capita income increases by nearly 3.7%/year.
• Despite slower economic growth, China accounts for 46% of the increase in residential consumption and 30% of the increase in commercial consumption in non-OECD countries by 2040.
• Building energy consumption in China remains higher than that in any other country in the world (21.1 quadrillion Btu) in 2040, even though India experiences the fastest growth in use (2.7%/year) and surpasses China as the most populous country in the early 2020s.
—as demand increases in non-OECD Asia
96
U.S. Energy Information Administration www.eia.gov/ieo#IEO2017U.S. Energy Information Administration
Electricity consumption leads the increase in non-OECD energy use in residential and commercial buildings—
97
0%
20%
40%
60%
80%
100%
2015
2040
2015
2040
2015
2040
2015
2040
2015
2040
Russia India MiddleEast
Africa China
0%
20%
40%
60%
80%
100%
2015
2040
2015
2040
2015
2040
2015
2040
2015
2040
Russia India MiddleEast
Africa China
renewables
electricity
coal
natural gasliquids
Residential sector fuel shares in selected non-OECD countries/regionspercentage of total
Commercial sector fuel shares in selected non-OECD countries/regionspercentage of total
U.S. Energy Information Administration www.eia.gov/ieo#IEO2017U.S. Energy Information Administration
• Electricity, the main source of energy for lighting, cooling, and appliances, is the fastest-growing source of energy used in buildings between 2015 and 2040. Personal incomes rise and urban migration continues over the period, offsetting increases in energy efficiency in building shells, appliances, and equipment.
• China and India account for one-fourth of the world’s buildings electricity consumption in 2040. China’s buildings fuel mix over the projection period shifts from coal toward electricity and natural gas; however in India, electricity and liquids remain the main energy sources.
• Russia’s residential fuel mix over the projection period moves away from natural gas, coal, and liquids toward electricity, but natural gas remains the main source because of its relatively low price.
—and is influenced by growing income and increased access to electricity
98
U.S. Energy Information Administration www.eia.gov/ieo#IEO2017U.S. Energy Information Administration
Per capita residential energy use increases in most non-OECD regions—
99
0 10 20 30 40 50
20152040
OECD
0 10 20 30 40 50
Non-OECD…
Russia
China
India
Middle East
Africa
Brazil
Total Non-OECD 20152040
Non-OECD
non-OECD Europe and Eurasia
Residential sector energy consumption per capitamillion Btu per person
U.S. Energy Information Administration www.eia.gov/ieo#IEO2017U.S. Energy Information Administration
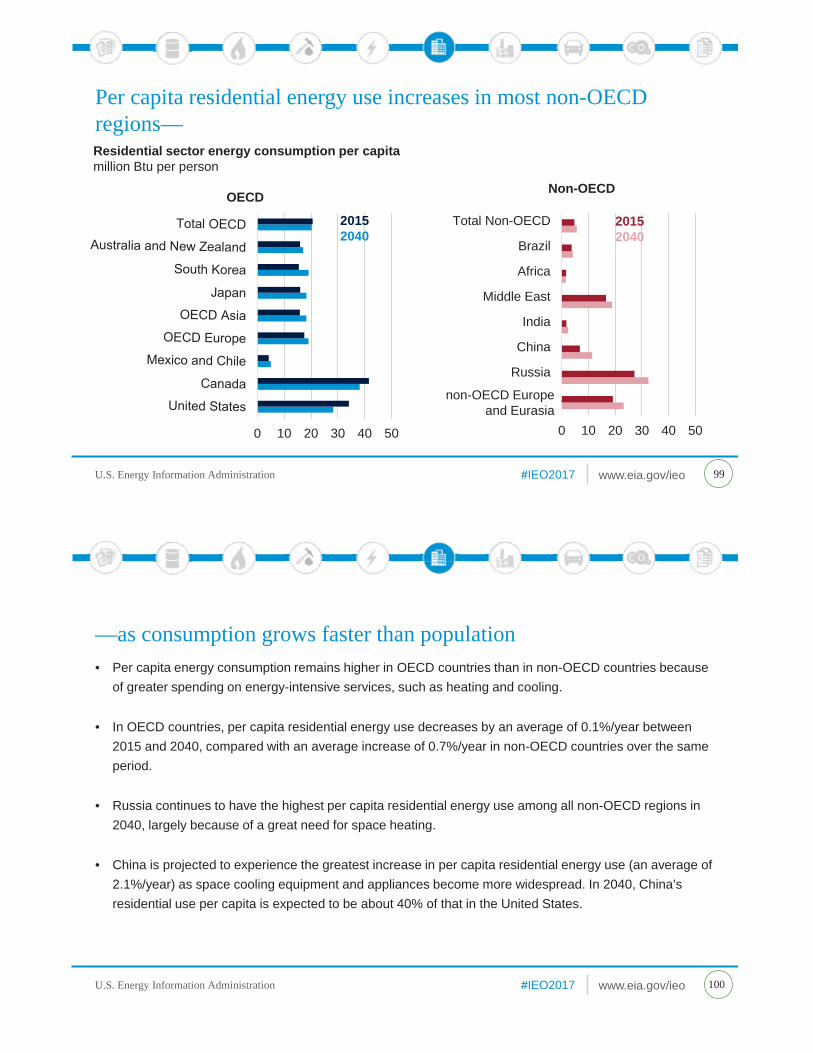
• Per capita energy consumption remains higher in OECD countries than in non-OECD countries because of greater spending on energy-intensive services, such as heating and cooling.
• In OECD countries, per capita residential energy use decreases by an average of 0.1%/year between 2015 and 2040, compared with an average increase of 0.7%/year in non-OECD countries over the same period.
• Russia continues to have the highest per capita residential energy use among all non-OECD regions in 2040, largely because of a great need for space heating.
• China is projected to experience the greatest increase in per capita residential energy use (an average of 2.1%/year) as space cooling equipment and appliances become more widespread. In 2040, China’s residential use per capita is expected to be about 40% of that in the United States.
—as consumption grows faster than population
100
U.S. Energy Information Administration www.eia.gov/ieo#IEO2017U.S. Energy Information Administration
0500
1,0001,5002,0002,5003,0003,5004,0004,500
2010 2020 2030 2040
China
2015
District heat is used in cold northern regions with dense urban areas—
101
0500
1,0001,5002,0002,5003,0003,5004,0004,500
2010 2020 2030 2040
Other non-OECD Europe/Eurasia
2015
Heat generationtrillion Btu
0
500
1,000
1,500
2,000
2,500
3,000
3,500
4,000
4,500
2010 2020 2030 2040
Russia
2015
renewablesliquidscoalnatural gas
U.S. Energy Information Administration www.eia.gov/ieo#IEO2017U.S. Energy Information Administration
• District heat is generated centrally in boiler or combined heat and power (CHP) facilities and transmitted to buildings through pipes for space heating or industrial processes.
• District heat is cost effective in dense, urban areas with cold climates. As a result, most district heat is used in China, Russia, OECD Europe, and non-OECD Europe and Eurasia. Japan and South Korea use smaller amounts of district heat; in South Korea, CHP satisfies most demand for heat.
• As electricity sectors grow and industrial heat demand declines between 2015 and 2040, district heat generation shifts towards CHP facilities, and fuel consumption declines. Additionally, aging infrastructure is refurbished or replaced with more energy-efficient equipment, further decreasing fuel consumption.
—and heat-only generation falls in several regions
102
U.S. Energy Information Administration www.eia.gov/ieo#IEO2017U.S. Energy Information Administration
Coal consumption for district heat declines in China—
103
0
1
2
3
4
5
6
2010 2015 2020 2025 2030 2035 2040
coal
natural gas
liquids
2015
0
1
2
3
4
5
6
2010 2015 2020 2025 2030 2035 2040
residential
district heat contribution
2015
District heat fuel consumption in Chinaquadrillion Btu
Residential coal consumption in Chinaquadrillion Btu
U.S. Energy Information Administration www.eia.gov/ieo#IEO2017U.S. Energy Information Administration
• Many coal-fired district heat boilers in China are projected to be replaced with more energy-efficient natural gas-fired boilers in response to rising coal prices and declining natural gas prices.
• Coal consumption in China’s district heat sector is projected to fall by 1.1 quadrillion Btu between 2015 and 2040. This drop is offset by an increase of 0.5 quadrillion Btu in natural gas consumption.
• In 2040, district heat continues to constitute a significant portion of coal consumption in the residential sector (38%). However, it accounts for 0.3 quadrillion Btu of the 1.0 quadrillion Btu total decrease in residential coal consumption between 2015 and 2040.
—contributing to a decline in residential coal use
104
U.S. Energy Information Administration www.eia.gov/ieo#IEO2017U.S. Energy Information Administration
Industrial
U.S. Energy Information Administration www.eia.gov/ieo#IEO2017U.S. Energy Information Administration
U.S. Energy Information Administration www.eia.gov/ieo#IEO2017U.S. Energy Information Administration
Gross output from industrial activities doubles by 2040 in the Reference case—
107
0
100,000
200,000
300,000
400,000
500,000
2015 2020 2025 2030 2035 2040
industrialsector
activities
services
non-energy intensive manufacturing
0
50
100
150
200
250
300
2015 2030 2040
energy intensive manufacturing
non-manufacturing
non-energyintensive manufacturing
World gross output by sectorbillion 2010 dollars purchasing power parity
World energy consumption by industryquadrillion Btu
energy intensive manufacturing
U.S. Energy Information Administration www.eia.gov/ieo#IEO2017U.S. Energy Information Administration
• Gross output, a measure of total sales across sectors, more than doubles between 2015 and 2040 with about half of this growth attributable to industrial activity. The remaining growth comes from the services sector and reflects non-industrial activities.
• The value of the output from energy-intensive manufacturing (basic chemicals, food, iron and steel, non-ferrous metals, non-metallic minerals, paper, and refining) more than doubles, but its share of total economic activity holds nearly constant.
• Output from non-manufacturing (agriculture, construction, and extraction) and non-energy-intensive manufacturing (metal-based durables, other chemicals, and other manufacturing) also increase over the forecast period.
• Following the gross output trends, the share of energy consumed by energy-intensive manufacturing declines slightly from 69% in 2015 to 68% in 2040. Over the same period, the share of energy consumed by non-energy-intensive manufacturing increases from 18% to 19%.
—and industrial energy consumption increases
108
U.S. Energy Information Administration www.eia.gov/ieo#IEO2017U.S. Energy Information Administration
U.S. Energy Information Administration www.eia.gov/ieo#IEO2017U.S. Energy Information Administration
• Industrial gross output growth slows in the Reference case, but the growth in non-OECD regions continues to outpace that of OECD regions.
• Industrial consumption of delivered energy grows slowly between 2015 and 2040 at less than 0.5%/year in OECD regions, and at less than 1%/year in non-OECD regions.
• Industrial output growth outpaces energy consumption growth because of increased industrial energy efficiency and higher growth in non-energy-intensive manufacturing output, especially in non-OECD regions. The slow-growing energy-intensive manufacturing corresponds to only slight growth in industrial sector energy consumption in the OECD.
• Non-OECD regions are responsible for a growing share of industrial energy consumption, as flat industrial energy consumption in China is more than offset by growth in other non-OECD regions.
• The industrial share of worldwide energy consumption declines from 55% in 2015 to 52% in 2040, largely because of faster growth of the transportation sector.
—but still drives growth in non-OECD industrial energy consumption in the Reference case
110
U.S. Energy Information Administration www.eia.gov/ieo#IEO2017U.S. Energy Information Administration
By 2030, industrial energy consumption in non-OECD Asia surpasses that of OECD Europe—
111
0
5
10
15
20
25
30
2015 2020 2025 2030 2035 2040
OECD Europe
0
5
10
15
20
25
30
2015 2020 2025 2030 2035 2040
Other non-OECD Asia2015 non-
manufacturingnon-energyintensive manufacturing
energyintensive manufacturing
Energy consumption by industryquadrillion Btu
2015
U.S. Energy Information Administration www.eia.gov/ieo#IEO2017U.S. Energy Information Administration
• OECD Europe and non-OECD Asia outside of China and India (other non-OECD Asia) have contrasting government policies and economic development in the industrial sector. In both regions, as the economies transition toward services, the industrial sector shrinks slightly relative to the overall economy.
• In OECD Europe, industrial energy consumption declines slightly, as the economy continues an ongoing transition away from energy-intensive manufacturing as energy efficiency increases.
• Other non-OECD Asia has a much higher non-manufacturing share than OECD Europe; within non-manufacturing, the agriculture gross output share declines, while the gross output in the construction industry grows nearly 5%/year to accommodate increasing urbanization.
• In the rapidly industrializing countries of the other non-OECD Asia region, energy consumption grows by an average of 2% annually across all three industry types.
—led by growth in energy-intensive manufacturing
112
U.S. Energy Information Administration www.eia.gov/ieo#IEO2017U.S. Energy Information Administration
In non-OECD regions, industrial coal consumption declines slightly and natural gas consumption increases—
113
020406080
100120140160180200
2010 2015 2020 2025 2030 2035 2040
OECD
2015
020406080
100120140160180200
2010 2015 2020 2025 2030 2035 2040
non-OECD
2015renewableselectricity
coal
natural gas
liquids
Industrial energy consumption by fuelquadrillion Btu
U.S. Energy Information Administration www.eia.gov/ieo#IEO2017U.S. Energy Information Administration
• In non-OECD regions, even as total industrial energy consumption grows, industrial coal consumption declines slightly. Non-OECD regions continue to consume seven times as much coal as OECD regions throughout the projection.
• For industrial equipment that operates on coal, fuel switching opportunities are rare, and the amount of new equipment, such as boilers, that can use other fuels is small relative to the installed base.
• The non-OECD share of natural gas increases from 19% to 23% between 2015 and 2040 as natural gas continues to be a relatively cost-effective industrial fuel.
—but within the OECD, fuel shares remain steady
114
U.S. Energy Information Administration www.eia.gov/ieo#IEO2017U.S. Energy Information Administration
Industrial coal consumption declines in China but rises in India—
115
0
10
20
30
40
50
60
70
80
2010 2015 2020 2025 2030 2035 2040
China2015
0
10
20
30
40
50
60
70
80
2010 2015 2020 2025 2030 2035 2040
India2015
renewableselectricity
coal
natural gas
liquids
Industrial energy consumption by fuelquadrillion Btu
U.S. Energy Information Administration www.eia.gov/ieo#IEO2017U.S. Energy Information Administration
• In the Reference case, growth in output of iron and steel — produced by energy-intensive industries —slows in China between 2015 and 2040. The less energy-intensive metal-based durables industries are the fastest growing and increasingly important contributors to the economy.
• Chinese coal consumption in the industrial sector declines 1%/year, and natural gas consumption increases nearly 4%/year because of slowing growth in steel output. Natural gas is also substituted for coal in industries such as cement and food.
• Indian coal consumption increases nearly 3%/year—a growth rate that is slightly higher than the growth rates for other fuels because of iron and steel industry growth. The iron and steel industry is coal intensive for two reasons: almost half of steel in India is produced in blast furnaces and direct-reduced iron, usually gas-fired in other countries, is largely coal-fired in India.
—as iron and steel production increases in India
116
U.S. Energy Information Administration www.eia.gov/ieo#IEO2017U.S. Energy Information Administration
Transportation
U.S. Energy Information Administration www.eia.gov/ieo#IEO2017U.S. Energy Information Administration
U.S. Energy Information Administration www.eia.gov/ieo#IEO2017U.S. Energy Information Administration
World transportation energy consumptionquadrillion Btu
0
20
40
60
80
100
120
140
160
2015 2020 2025 2030 2035 2040
electricitynatural gasjet fuel
LPG
diesel
motor gasoline
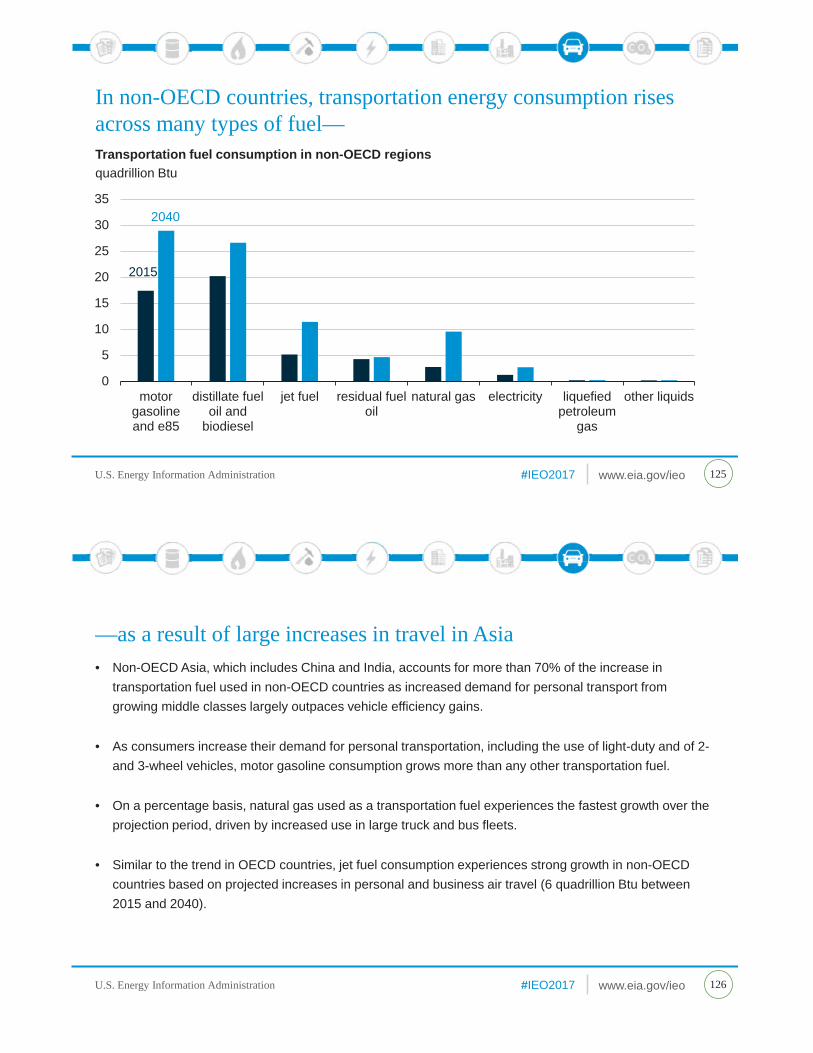
In the Reference case, the share of transportation fuel from alternative energy sources increases through 2040—
119
U.S. Energy Information Administration www.eia.gov/ieo#IEO2017U.S. Energy Information Administration
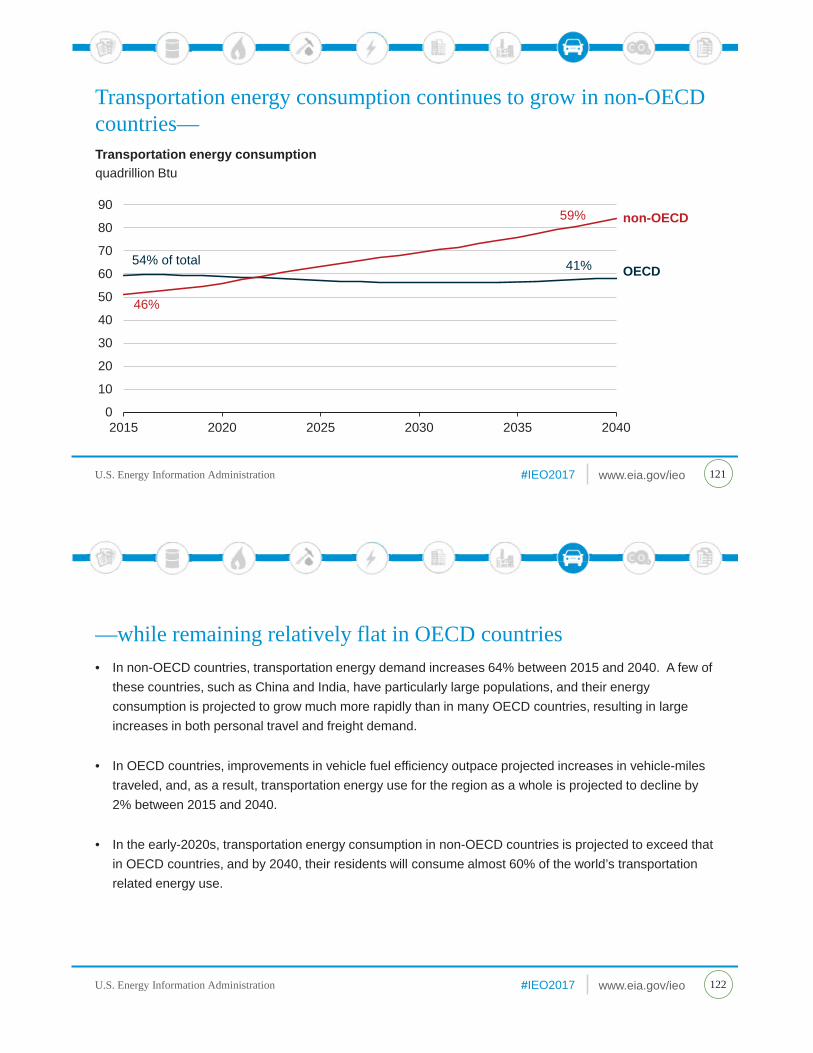
• The worldwide transportation sector accounts for 55% of total end-use sector liquid fuels consumption in 2040, about the same as its share in 2015.
• The use of refined petroleum and other liquid fuels in the transportation sector continues to increase through 2040, but their share decreases from 95% to approximately 88% as the use of alternative fuels slowly increases. Motor gasoline, including biofuel additives, remains the primary fuel for transportation, accounting for 36% of the world’s transportation-related energy use in 2040.
• A continuing global rise in air travel demand leads to a near doubling of jet fuel consumption between 2015 and 2040.
• Natural gas and electricity, while starting from much lower levels of use than liquid fuels in the transportation sector, are the fastest-growing forms of transportation energy use, with consumption of each approximately tripling between 2015 and 2040. Natural gas consumption for passenger and freight transportation increases nearly 500% from 2015 to 2040, up nearly 8 quadrillion Btu.
—but refined petroleum and other liquids remain dominant
120
U.S. Energy Information Administration www.eia.gov/ieo#IEO2017U.S. Energy Information Administration
0
10
20
30
40
50
60
70
80
90
2015 2020 2025 2030 2035 2040
non-OECD
OECD54% of total 41%
46%
59%
Transportation energy consumption continues to grow in non-OECD countries—
121
Transportation energy consumptionquadrillion Btu
U.S. Energy Information Administration www.eia.gov/ieo#IEO2017U.S. Energy Information Administration
• In non-OECD countries, transportation energy demand increases 64% between 2015 and 2040. A few of these countries, such as China and India, have particularly large populations, and their energy consumption is projected to grow much more rapidly than in many OECD countries, resulting in large increases in both personal travel and freight demand.
• In OECD countries, improvements in vehicle fuel efficiency outpace projected increases in vehicle-miles traveled, and, as a result, transportation energy use for the region as a whole is projected to decline by 2% between 2015 and 2040.
• In the early-2020s, transportation energy consumption in non-OECD countries is projected to exceed that in OECD countries, and by 2040, their residents will consume almost 60% of the world’s transportation related energy use.
—while remaining relatively flat in OECD countries
122
U.S. Energy Information Administration www.eia.gov/ieo#IEO2017U.S. Energy Information Administration
Transportation fuel consumption in OECD regionsquadrillion Btu
0
5
10
15
20
25
30
motorgasoline and
e85
distillate fueloil and
biodiesel
jet fuel residual fueloil
natural gas liquefiedpetroleum
gas
other liquids electricity
2015
2040
In OECD countries, increases in jet fuel consumption are more than offset by declines in motor gasoline and distillate fuel consumption—
123
U.S. Energy Information Administration www.eia.gov/ieo#IEO2017U.S. Energy Information Administration
• Improvements in on-road fuel economy are projected to result in a reduction of motor gasoline consumption in OECD countries by approximately 5 quadrillion Btu between 2015 and 2040. Most of the reduction occurs in the United States, where the effects of increasingly stringent fuel efficiency standards more than offset increases in vehicle-miles traveled.
• Diesel consumption also decreases, mainly in OECD Europe, in part as the result of improving on-road efficiency standards.
• Natural gas (driven by favorable economics in heavy trucking) and electricity (driven by its use in passenger rail and light-duty vehicles) are expected to be the fastest-growing forms of energy used for transportation in OECD countries on a percentage basis.
• Growing air travel is projected to increase jet fuel consumption by more than any other transportation fuel (4.7 quadrillion Btu between 2015 and 2040) in the OECD.
—as efficiency gains related to on-road vehicles are realized
124
U.S. Energy Information Administration www.eia.gov/ieo#IEO2017U.S. Energy Information Administration
Transportation fuel consumption in non-OECD regionsquadrillion Btu
In non-OECD countries, transportation energy consumption rises across many types of fuel—
125
0
5
10
15
20
25
30
35
motorgasolineand e85
distillate fueloil and
biodiesel
jet fuel residual fueloil
natural gas electricity liquefiedpetroleum
gas
other liquids
2015
2040
U.S. Energy Information Administration www.eia.gov/ieo#IEO2017U.S. Energy Information Administration
• Non-OECD Asia, which includes China and India, accounts for more than 70% of the increase in transportation fuel used in non-OECD countries as increased demand for personal transport from growing middle classes largely outpaces vehicle efficiency gains.
• As consumers increase their demand for personal transportation, including the use of light-duty and of 2-and 3-wheel vehicles, motor gasoline consumption grows more than any other transportation fuel.
• On a percentage basis, natural gas used as a transportation fuel experiences the fastest growth over the projection period, driven by increased use in large truck and bus fleets.
• Similar to the trend in OECD countries, jet fuel consumption experiences strong growth in non-OECD countries based on projected increases in personal and business air travel (6 quadrillion Btu between 2015 and 2040).
—as a result of large increases in travel in Asia
126
U.S. Energy Information Administration www.eia.gov/ieo#IEO2017U.S. Energy Information Administration
Air travel becomes an increasingly large portion of transportation energy consumption in OECD countries—
127
0
10
20
30
40
50
60
2015 2020 2025 2030 2035 2040
OECD
0
10
20
30
40
50
60
2015 2020 2025 2030 2035 2040
non-OECD
2-3 wheelvehiclesrailbusesair
light duty
Passenger transportation energy consumptionquadrillion Btu
U.S. Energy Information Administration www.eia.gov/ieo#IEO2017U.S. Energy Information Administration
• In OECD countries, many of which are projected to have slower economic growth and stricter fuel economy standards than in non-OECD countries, energy consumption for passenger travel decreases by 4% (1.6 quadrillion Btu) between 2015 and 2040.
• In non-OECD countries, increased demand across all passenger modes of travel is projected to outpace improvements in fuel efficiency standards.
• The largest changes in passenger transportation occur in light-duty vehicles. Between 2015 and 2040, related energy consumption decreases by 6.5 quadrillion Btu in OECD countries and increases by 15.0 quadrillion Btu in non-OECD countries.
• From 2015 to 2040, energy used in air travel nearly doubles in OECD countries and more than doubles in non-OECD countries.
—while light-duty vehicle energy consumption grows rapidly in non-OECD countries
128
U.S. Energy Information Administration www.eia.gov/ieo#IEO2017U.S. Energy Information Administration
Freight transportation energy consumption remains relatively constant in OECD countries—
129
0
5
10
15
20
25
30
35
2015 2020 2025 2030 2035 2040
OECD
0
5
10
15
20
25
30
35
2015 2020 2025 2030 2035 2040
non-OECD
pipeline
marine
railheavy heavy truckmediumheavy trucklightheavy truck
Freight transportation energy consumptionquadrillion Btu
U.S. Energy Information Administration www.eia.gov/ieo#IEO2017U.S. Energy Information Administration
• In OECD countries, energy used to haul freight hovers just under 20 quadrillion Btu over the entire projection, with heavy trucks and marine vessels remaining the dominant modes of freight transport.
• In non-OECD countries, increases in industrial output lead to growing energy use in all modes of freight transport.
• More than half of the increase in the world’s freight travel energy use is attributable to marine vessels, as residents in non-OECD countries continue to increase their demand for goods and services and producers become further integrated into global supply chains.
• As transportation infrastructure improves and roadways become more capable of supporting heavy trucks in non-OECD countries, energy consumption shifts from light and medium heavy-duty trucks to heavier vehicles.
—while international marine transportation continues to grow in non-OECD countries
130
U.S. Energy Information Administration www.eia.gov/ieo#IEO2017U.S. Energy Information Administration
Energy-related carbon dioxide
U.S. Energy Information Administration www.eia.gov/ieo#IEO2017U.S. Energy Information Administration
U.S. Energy Information Administration www.eia.gov/ieo#IEO2017U.S. Energy Information Administration
U.S. Energy Information Administration www.eia.gov/ieo#IEO2017U.S. Energy Information Administration
• World energy-related carbon dioxide (CO2) emissions are projected to grow an average 0.6%/year between 2015 and 2040, 1.3%/year below the level from 1990 to 2015.
• Energy-related CO2 emission growth is slowed by increases in energy efficiency and a gradual shift from coal toward natural gas and renewable energy sources that began before 2015 but continue through the projection period.
• In OECD countries, energy-related CO2 emissions remain essentially flat through 2040 at 9% lower than their 2005 level even as their economies gradually expand.
• Energy-related CO2 emissions from non-OECD countries grow at a rate of less than 1%/year from 2015 to 2040, a lower rate than from 1990 to 2015, when emissions grew by 3%/year.
—but at a slower rate than in the recent past
134
U.S. Energy Information Administration www.eia.gov/ieo#IEO2017U.S. Energy Information Administration
U.S. Energy Information Administration www.eia.gov/ieo#IEO2017U.S. Energy Information Administration
• Coal-related CO2 emissions are projected to increase at an average rate of 0.1%/year between 2015 and 2040, in contrast to the 2.3%/year rate seen from 1990 to 2015.
• Liquids-related CO2 emissions grow an average 0.7%/year between 2015 and 2040. Despite large increases in transportation demand, particularly in China and India, this rate is lower than the 1.2%/year increase seen from 1990 to 2015.
• Natural gas CO2 emissions increase an average 1.4%/year between 2015 and 2040. Even though the use of natural gas in electricity rises over the period, the related emission rates are lower than the 2.2%/year increases seen from 1990 to 2015.
—while liquids and natural gas emissions continue to grow
136
U.S. Energy Information Administration www.eia.gov/ieo#IEO2017U.S. Energy Information Administration
Liquids-related carbon dioxide emissions for selected countries/regionsbillion metric tons
Liquids-related carbon dioxide emissions remain flat in OECD countries—
U.S. Energy Information Administration www.eia.gov/ieo#IEO2017U.S. Energy Information Administration
• Growth in CO2 emissions from liquid fuels, about 55% of which is used in transportation, levels off in OECD countries as increases in energy efficiency largely offset increases in passenger and freight services.
• China’s liquids-related CO2 emissions grow at a decreasing rate as growth in the country’s population slows. By 2040, China and U.S. liquids-related CO2 emissions levels are similar.
• India experiences continuous growth in liquids-related CO2 emissions, but it starts from a low base. By 2040, India’s emissions exceed those in OECD Asia and non-OECD Europe and Eurasia.
—but grow rapidly in some non-OECD countries
138
U.S. Energy Information Administration www.eia.gov/ieo#IEO2017U.S. Energy Information Administration
Natural gas exhibits the greatest carbon dioxide emissions growth in the Reference case—
U.S. Energy Information Administration www.eia.gov/ieo#IEO2017U.S. Energy Information Administration
• CO2 emissions from natural gas, a relatively lower emitting fossil fuel used in many applications, grows across all regions between 2015 and 2040 as natural gas prices remain relatively low throughout the projection period.
• The largest growth in natural gas-related CO2 emissions is in China, as the primary fuel used to generate electricity in the country shifts from coal towards less carbon-intensive natural gas.
• In OECD Europe, natural gas-related CO2 emissions begin increasing more rapidly after 2030 as natural gas-fired capacity begins to replace retiring nuclear generation, putting upward pressure on overall emission levels and increasing the carbon intensity of their fuel mix.
—with increases in China, Europe, and the United States
140
U.S. Energy Information Administration www.eia.gov/ieo#IEO2017U.S. Energy Information Administration 141
Coal-related carbon dioxide emissions for selected countries/regions billion metric tons
U.S. Energy Information Administration www.eia.gov/ieo#IEO2017U.S. Energy Information Administration
• China shifts from the use of coal toward natural gas, nuclear power, and renewable energy between 2015 and 2040. This shift has a major effect on global energy-related CO2 emissions because of the size of China’s economy.
• The decline in Chinese coal-related CO2 emissions is partially offset by growth in India’s coal-related emissions. However, coal-related emissions in India remain much lower than in China through 2040.
• World coal-related CO2 emissions grow at only 0.1% annually from 2015 to 2040, compared with the growth rate of 2.3%/year from 1990 to 2015.
—but future declines help to stabilize global coal-related carbon dioxide emissions
142
U.S. Energy Information Administration www.eia.gov/ieo#IEO2017U.S. Energy Information Administration
References
U.S. Energy Information Administration www.eia.gov/ieo#IEO2017U.S. Energy Information Administration
AEO = Annual Energy Outlook
b/d = barrels per day
BkW = billion kilowatts
Btu = British thermal unit
CHP = combined heat and power
CO2 = carbon dioxide
EIA = U.S. Energy Information Administration
GDP = gross domestic product
GTL = gas-to-liquids
GW = gigawatts
IEO = International Energy Outlook
LNG = liquefied natural gas
LPG = liquefied petroleum gas
MARPOL = “marine pollution,” the International Convention for the Prevention of Pollution from Ships
Acronyms and abbreviations used in this report
144
U.S. Energy Information Administration www.eia.gov/ieo#IEO2017U.S. Energy Information Administration
OECD = Organization for Economic Cooperation and Development
OPEC = Organization of the Petroleum Exporting Countries = Algeria, Angola, Ecuador, Equatorial Guinea, Gabon, Iran, Iraq, Kuwait, Libya, Nigeria, Qatar, Saudi Arabia, United Arab Emirates, and Venezuela. (Note: Equatorial Guinea became a member of OPEC on May 25, 2017, but their membership is not yet reflected in the IEO2017 projections.)
Petroleum and other liquids = crude oil and lease condensate (including tight oil, shale oil, extra-heavy oil, field condensate, and bitumen) and other liquid fuels (natural gas plant liquids; liquids from renewable sources—biofuels, including ethanol, biodiesel, and biomass-to-liquids [BTL]; liquids from natural gas—gas-to-liquids [GTL],liquids from coal—coal to liquids [CTL]; and liquids from kerogen—oil shale.
Tcf = trillion cubic feet
WEPS+ = World Energy Projection System Plus
Acronyms and abbreviations used in this report
145
U.S. Energy Information Administration www.eia.gov/ieo#IEO2017U.S. Energy Information Administration
OECD Americas = United States, Canada, Chile, and Mexico.
OECD Europe = Austria, Belgium, Czech Republic, Denmark, Estonia, Finland, France, Germany, Greece, Hungary, Iceland, Ireland, Italy, Luxembourg, Netherlands, Norway, Poland, Portugal, Slovakia, Slovenia, Spain, Sweden, Switzerland, Turkey, and United Kingdom. (Note: Israel is included in OECD Europe for statistical reporting purposes. Latvia became an OECD member country on July 16, 2016, but it is not reported in OECD Europe for IEO2017.)
OECD Asia = Australia, Japan, New Zealand, and South Korea.
IEO regional definitions – OECD Regions
146
U.S. Energy Information Administration www.eia.gov/ieo#IEO2017U.S. Energy Information Administration
Non-OECD Europe and Eurasia = Albania, Armenia, Azerbaijan, Belarus, Bosnia and Herzegovina, Bulgaria, Croatia, Cyprus, Faroe Islands, Georgia, Gibraltar, Kazakhstan, Kosovo, Latvia, Lithuania, Macedonia, Malta, Moldova, Montenegro, Romania, Russia, Serbia, Tajikistan, Turkmenistan, Ukraine, and Uzbekistan. (Note: Latvia became an OECD member country on July 16, 2016, but it is reported in non-OECD Europe and Eurasia for IEO2017.)
Non-OECD Asia = Afghanistan, American Samoa, Bangladesh, Bhutan, Brunei, Burma (Myanmar), Cambodia (Kampuchea), China, Cook Islands, Fiji, French Polynesia, Guam, Hawaiian Trade Zone, Hong Kong, India, Indonesia, Kiribati, Laos, Macau, Malaysia, Maldives, Mongolia, Nauru, Nepal, New Caledonia, Niue, North Korea, Pakistan, Papua New Guinea, Philippines, Samoa, Singapore, Solomon Islands, Sri Lanka, Taiwan, Thailand, Timor-Leste (East Timor), Tonga, U.S. Pacific Islands, Vanuatu, Vietnam, and Wake Islands.
Middle East = Bahrain, Iran, Iraq, Jordan, Kuwait, Lebanon, Oman, Palestinian Territories, Qatar, Saudi Arabia, Syria, United Arab Emirates, and Yemen.
IEO regional definitions – non-OECD Regions
147
U.S. Energy Information Administration www.eia.gov/ieo#IEO2017U.S. Energy Information Administration
Africa = Algeria, Angola, Benin, Botswana, Burkina Faso, Burundi, Cameroon, Cape Verde, Central African Republic, Chad, Comoros, Congo (Brazzaville), Congo (Kinshasa), Côte d’Ivoire, Djibouti, Egypt, Equatorial Guinea, Eritrea, Ethiopia, Gabon, The Gambia, Ghana, Guinea, Guinea-Bissau, Kenya, Lesotho, Liberia, Libya, Madagascar, Malawi, Mali, Mauritania, Mauritius, Morocco, Mozambique, Namibia, Niger, Nigeria, Reunion, Rwanda, Sao Tome and Principe, Senegal, Seychelles, Sierra Leone, Somalia, South Africa, South Sudan, St. Helena, Sudan, Swaziland, Tanzania, Togo, Tunisia, Uganda, Western Sahara, Zambia, and Zimbabwe
Non-OECD Americas = Antarctica, Antigua and Barbuda, Argentina, Aruba, The Bahamas, Barbados, Belize, Bermuda, Bolivia, Brazil, British Virgin Islands, Cayman Islands, Colombia, Costa Rica, Cuba, Dominica, Dominican Republic, Ecuador, El Salvador, Falkland Islands, French Guiana, Greenland, Grenada, Guadeloupe, Guatemala, Guyana, Haiti, Honduras, Jamaica, Martinique, Montserrat, Netherlands Antilles, Nicaragua, Panama, Paraguay, Peru, Puerto Rico, St. Kitts and Nevis, St. Lucia, St. Pierre and Miquelon, St. Vincent/Grenadines, Suriname, Trinidad and Tobago, Turks and Caicos Islands, Uruguay, U.S. Virgin Islands, and Venezuela.
IEO regional definitions – non-OECD Regions
148
U.S. Energy Information Administration www.eia.gov/ieo#IEO2017U.S. Energy Information Administration
Map of IEO regions
149
U.S. Energy Information Administration www.eia.gov/ieo#IEO2017U.S. Energy Information Administration
Model Improvements
150
• This IEO is the first projection to include model results through 2050, which are available on the IEO page at: http://www.eia.gov/ieo. The graphics in this report include projections through 2040.
• IEO2017 improves the representation of district heating to better capture the dynamics between fuel prices and electricity generation as new capacity is added.
• Projections of residential and commercial energy demand are now based a richer set of determinants, including household disposable income and output in service industries. Previously, the projections were based primarily on growth in GDP across regions.
• Projections related to air travel now separately account for movement within and between 13 distinct regions of the world. The projections update 2013–15 regional data, including aircraft sales, stocks, active and parked aircraft, seat-miles traveled, cargo travel, and fuel use.
• Projections related to industrial activity are now based on a more detailed representation of industrial output by expanding the model’s coverage from 21 to 37 industries.
U.S. Energy Information Administration www.eia.gov/ieo#IEO2017U.S. Energy Information Administration
Contacts
151
Refer questions about the IEO2017 to the following analysts:
Topic Subject matter expert contact informationGeneral questions Linda E. Doman [email protected] 202-586-1041
Energy-related CO2 emissions Perry Lindstrom [email protected] 202-586-0934
U.S. Energy Information Administration www.eia.gov/ieo#IEO2017U.S. Energy Information AdministrationU S Energy I f rmati n Administration www.eia.gov/ieo#IEO2017U.S. Energy Information AdministrationU.S. Energy Information AdmU.S. Energy Information Adm
For more information
U.S. Energy Information Administration home page | www.eia.gov
Short-Term Energy Outlook | www.eia.gov/outlooks/steo
Annual Energy Outlook | www.eia.gov/aeo
International Energy Outlook | www.eia.gov/ieo
Monthly Energy Review | www.eia.gov/mer
Today in Energy | www.eia.gov/todayinenergy
September 14, 2017www.eia.gov/outlooks/ieo#IEO2017