83
2017 Investment Community Meeting September 7, 2017

2017Investment Community MeetingSeptember 7, 2017

©20
17 M
aste
rcar
d.
Agenda7:30 a.m. Registration 10:30 a.m. International Markets
Ann Cairns
8:30 a.m. WelcomeWarren Kneeshaw
10:40 a.m. Europe Panel DiscussionAnn Cairns, Javier Perez, Mark Barnett, Carlo Enrico
8:35 a.m. Our Strategy AdvancesAjay Banga
11:05 a.m. Emerging MarketsLing Hai, Ari Sarker, Gilberto Caldart
8:50 a.m. Global Products:Powering Choice and ConvenienceMichael Miebach
11:20 a.m. Financial PerspectiveMartina Hund-Mejean
9:15 a.m. Addressing Digital OpportunitiesGarry Lyons
11:35 a.m. Q&A Session
9:35 a.m. Securing and Advancing CommerceAjay Bhalla
9:45 a.m. North American MarketsCraig Vosburg
10:10 a.m. Break

©20
17 M
aste
rcar
d.
Forward looking statements
Today’s presentation may contain, in addition to historical information, forward-looking statements within the meaning of the Private Securities Litigation Reform Act of 1995.
These forward-looking statements are based on our current assumptions, expectations and projections about future events which reflect the best judgment of management and involve a number of risks and uncertainties that could cause actual results to differ materially from those suggested by our comments today. You should review and consider the information contained in our filings with the SEC regarding these risks and uncertainties.
Mastercard disclaims any obligation to publicly update or revise any forward-looking statements or information provided during today’s presentations.
Any non-GAAP information contained in today’s presentations is reconciled to its GAAP equivalent in the appendices at the end of this presentation.

2017 Investment Community Meeting
Our Strategy AdvancesAjay BangaPresident and Chief Executive Officer

©20
17 M
aste
rcar
d.
2012 2013 2014 2015 2016 2017YTD
Net Revenue 13%
EPS 19%
Creating shareholder value
Total Shareholder Return1
Jan 1, 2012 - Aug 31, 2017
Currency-Neutral5-Year CAGR%2
1 Source: Factset. 2 Note: See Appendix A for non-GAAP reconciliation.
-25%
0%
25%
50%
75%
100%
125%
150%
175%
200%
225%
250%
275%269%
MastercardS&P 500S&P 500 Info Tech
121%
168%

©20
17 M
aste
rcar
d.
Our strategy advances
Enabled by Brand, Data, Technology and People
GROWCore Business
• Consumer Credit• Debit• Commercial• Prepaid• Physical-Digital
Convergence
DIVERSIFYCustomers & Geographies
• Merchants• Businesses• Governments• Financial Inclusion• New Markets
• Advisors• Safety & Security• Loyalty & Rewards• Processing• Fast ACH
BUILDNew Businesses

©20
17 M
aste
rcar
d.
Shift to card Real-time payments and Fast ACH
Consulting, data analytics,fraud and loyalty solutions Automated services, ACH services
Digital payments, QR codes Artificial Intelligence, IoT-based payments
POS and online focused Protecting data across all devicesand channels
Digital players, telcos, startups Emerging market and social media players
Financial inclusion, interchange regulation, domestic schemes
New domestic schemes,increasing regulatory actions
Rapidly evolving payments landscape
Acceleration ofElectronic Payments
Evolution ofTechnology
Security andCybersecurity Threats
Regulatory Interestand Nationalism
Demand forAdjacent Services
New Entrants
Current trends Emerging trends

©20
17 M
aste
rcar
d.
202
225
60
49
114
17
58
11
86
PCE B2B P2P/B2C TOTAL
Market size by payment flowVolume in $ Trillions
Carded ACH Cash & Check
Expanded capabilities increasing our opportunity...more than
4x 90%
10%
$451 $120 $60 $2251,2
Note: Figures may not sum due to rounding. 1 Includes approximately $4 trillion in non-purchase personal consumption. 2 Includes non-PCE card spend.Sources: 2016 – Oxford Economics, Euromonitor International, Kaiser Associates, McKinsey Payment Data; Mastercard internal analysis.

©20
17 M
aste
rcar
d.
Delivering value through services
Card orAccount-basedsolutions
DataAnalytics
Advisors
Processing
Labs asa Service
Safety &Security
Loyalty& Rewards Driving Our
Core Business
Delivering Differentiation
WinningDeals

©20
17 M
aste
rcar
d.
Closing thoughts
Significant untapped opportunity ahead of us
Executing our strategyaround the world
Buildingnew capabilitiesanddifferentiatingwith services
Anticipating market and technology trends
Addressing nationalism, regulatory risks andcompetitive disruption
Well-positionedfor continuedlong-term growth
2017 Investment Community Meeting
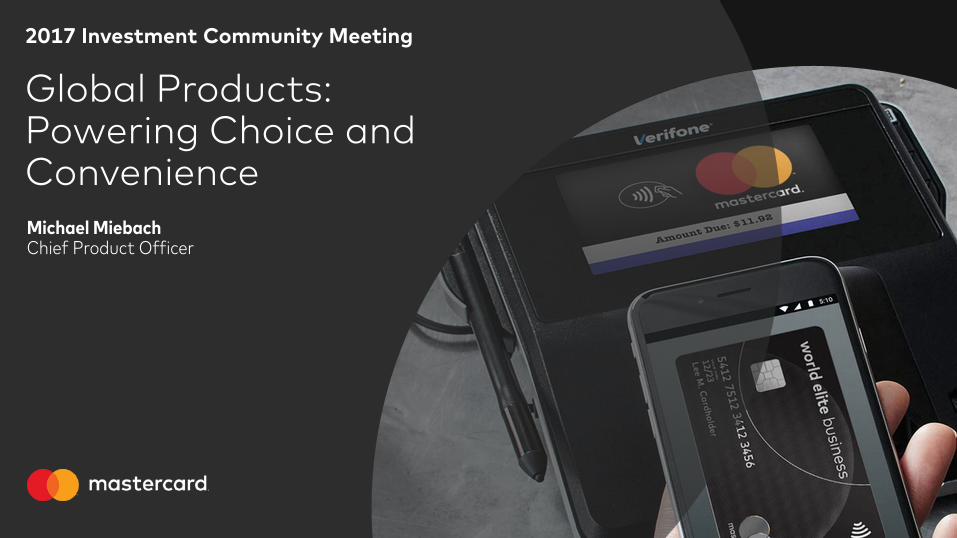
Global Products:Powering Choice andConvenienceMichael MiebachChief Product Officer

©20
17 M
aste
rcar
d.
Our product strategy – powering choice and convenience
Who What How
Consumers
Partners
World Class Brand
Value-Added Services
Differentiated Products Seamless, Digitized Technology
Every Device an Acceptance Device
Multi-Rail Network
Grow, Diversify, Build

©20
17 M
aste
rcar
d.
Capturing more payment flows
Product Solutions
PCE B2B P2P / B2CPoint of
InteractionAccounts Payable
Consumer Cards (Credit, Debit, Prepaid)
Commercial Cards (SME, T&E, P-Card, Fleet)
Virtual Cards / Mastercard B2B Hub™
Mastercard Send™ / HomeSend
Fast ACH
Market Size* $45T $120T $60T
Opportunity$225T
Card Rails ACH / Fast ACH Rails
* Source: 2016 – Oxford Economics, Euromonitor, McKinsey Payment Data, Kaiser, Mastercard Estimates

©20
17 M
aste
rcar
d.
Delivering strong results and growth
Global1H 17 GDV*
Consumer Credit +7%
Consumer Debit +8%
Prepaid +15%
Commercial +15%
* Adjusted for the impact of recent EU regulatory changes (Article 8). See Appendix F

©20
17 M
aste
rcar
d.
Winning affluent credit around the world
Digital
Experiences over Things
Hyper-Personalized
Easy to Use
Personalized Benefits
Priceless Experiences and Luxury Properties
Digital by Default
Ease & Consistency
Affluent cards growing 5x faster than affluent segment*
Leading share ofaffluent spend in UK
Winning 9 out of 10 dealsin MEA
Affluent portfolio growing ~30% YoY in LAC
Expanding into India;Premium wins in China
Citi Prestige enhancementsin US
Evolving AffluentConsumer Expectations What We BringYielding Results
* Mastercard internal analysis.

©20
17 M
aste
rcar
d.
Accelerating commercial growth into the B2B opportunitySizeable B2B opportunity Dual track approach
Global Commercial Flows ($T)
Point of Interaction
Accounts PayablePrimarily ACH and
check
Point of Interaction
Primarily card, check
and cash
20Total
20
100
120 SME
Accounts Payable
T&E
Purchasing
VirtualCards
MastercardSend
Mastercard B2B Hub™ Vocalink
Yielding Results
MA Commercial Card PV
20162013
+13% CAGR
the market
MA growth
Real-time payment certainty
Data and efficiency
significantly outpacing
Fleet

©20
17 M
aste
rcar
d.
Person
Government
Merchant
Business
Senders
Our network strategy – enabling all electronic payments
Receivers
Person
Government
Merchant
Business
All Electronic Rails
Value-Added Services
Differentiated Products

©20
17 M
aste
rcar
d.
Driving Fast ACH through Vocalink
Market leading provider of Fast ACH
Proven deployments in multiple markets
Extends Mastercard reach beyond cards
Well suited forAccounts Payable flows
Enhanced data & messaging capabilities
Faster, nearreal-time payments
Card Rails + Vocalink MA is a one-stop shop providing seamless,omni-channel, multi-payment support
Fast ACH features Competitively advantaged to succeed

©20
17 M
aste
rcar
d.
Our go-to-market approach with Fast ACH
Infrastructure
Scheme & Applications
Services
ACH operates atmultiple levels How will we play?
Strategically deploy and license
RetailPayments
BillPayments
Personal PaymentsB2B
FraudSolutions
DataAnalyticsConsulting
Underlying technology and rails
End user solutions built on Franchise rules and standards
Enhanced ACH capabilities

©20
17 M
aste
rcar
d.
Mastercard is at the forefront of acceptance growth
Every Device is an Acceptance Device…from Millions to Billions
Rails
Flows
Devices
Cards Emerging Technologies
Fast ACH
Person Merchant
GovernmentBusiness
More Merchants
More Acceptance
Merchants Beyond
Acceptance
Acceptance Beyond
Merchants
1
2
3

©20
17 M
aste
rcar
d.
DifferentiatedValue Propositions
Every Device an Acceptance Device
All Electronic Payments on All Rails
Cards ACH
Well positioned to capture more payment flows

2017 Investment Community Meeting
Addressing Digital OpportunitiesGarry LyonsChief Innovation Officer

©20
17 M
aste
rcar
d.
Increasingly connected world
Public-private partnerships
Advances in AI
Security and privacy top of mind
On-demand economy
Lines blurring between physical and digital
Pace of change
Urbanization and smarter cities
Focus on sustainability
Consumer expectations
…and it’s impacted by multiple trends
The digital shift is the biggest change inpayments since plastic cards
Digital commerce as share of retail payments
10% → 17%2016→2021
©20
17 M
aste
rcar
d.
Source: McKinsey study, excludes travel, 2017

©20
17 M
aste
rcar
d.
Our strategy – enable our customers and partners tobe at the forefront of digital payments
Identifying and experimenting with future technologies, start-ups & trends
Digitizing all forms of personal and business payments
Securingevery transaction
Delivering the best digital experience everywhere
Simplifyingaccess to, and integration of,our digital assets
Mastercard Digital Enablement Service,
Biometrics and Machine Learning
Mastercard Send
andand

©20
17 M
aste
rcar
d.
Delivering the best digital experience everywhereDriving the best-in-market digital payment service with Masterpass
90+ millionEnabled ‘Digital by Default’ accounts
Strong progress with customers in 2017
38Countries
140+Issuers live
Expanding acceptance with key merchants and partners
©20
17 M
aste
rcar
d.
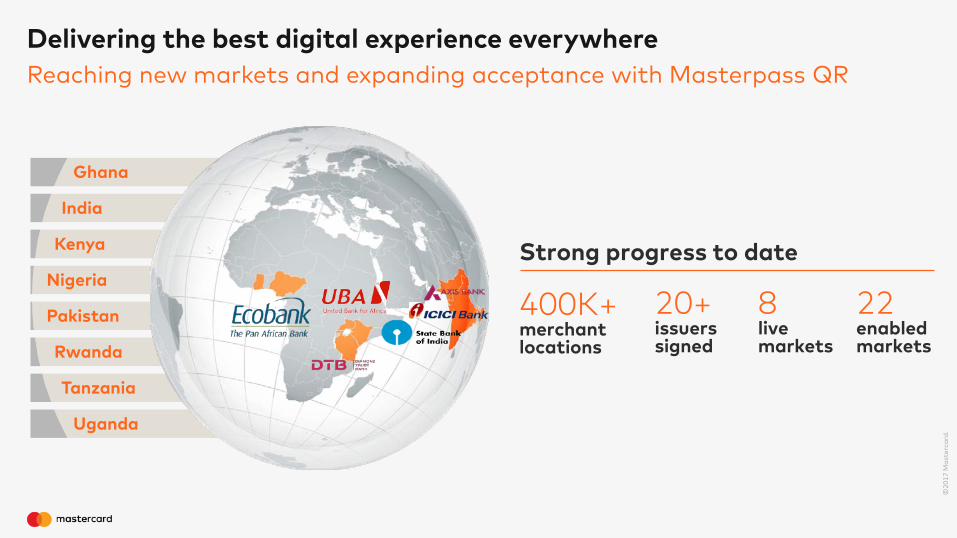
Ghana
India
Kenya
Nigeria
Pakistan
Rwanda
Tanzania
Uganda
Delivering the best digital experience everywhereReaching new markets and expanding acceptance with Masterpass QR
Strong progress to date
400K+merchant locations
20+issuers signed
8live markets
22enabled markets
©20
17 M
aste
rcar
d.
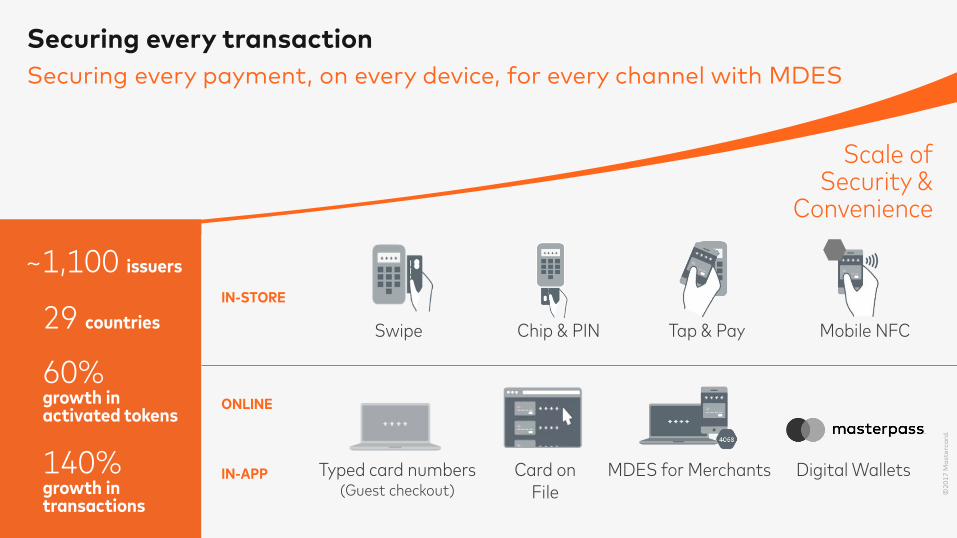
Securing every transactionSecuring every payment, on every device, for every channel with MDES
Typed card numbers(Guest checkout)
MDES for Merchants
Chip & PIN Mobile NFC
IN-STORE
ONLINE
IN-APP Digital WalletsCard onFile
Swipe Tap & Pay
©20
17 M
aste
rcar
d.
29 countries
60%growth inactivated tokens
140%growth in transactions
Scale of Security &
Convenience
~1,100 issuers

©20
17 M
aste
rcar
d.
Securing every transactionKeeping the consumer in control

©20
17 M
aste
rcar
d.
Capturing more payment flows
Product Solutions
PCE B2B P2P / B2CPoint of
InteractionAccounts Payable
Consumer Cards (Credit, Debit, Prepaid)
Commercial Cards (SME, T&E, P-Card, Fleet)
Virtual Cards / Mastercard B2B Hub
Mastercard Send / HomeSend
Fast ACH
Market Size* $45T $120T $60T
Opportunity$225T
Card Rails ACH / Fast ACH Rails
* Source: 2016 – Oxford Economics, Euromonitor, McKinsey Payment Data, Kaiser, MA Estimates

©20
17 M
aste
rcar
d.
Digitizing all forms of personal and business payments
Businesses
Governments
LicensedEntity
Sin
gle
Con
nect
ion MA Cards Purpose-Specified
PrepaidNon-MA
Cards
CashPick-up
Mobile Wallets
Person-to-Person
Bank Accounts
Mastercard Send™, a global integrated push payments platform, enabling domestic and cross-border funds transfers
Domestic
100Countries
HomeSend
Mastercard Send

©20
17 M
aste
rcar
d.
Disbursements
Domestic Person-to-Person Payments
Person-to-Merchant Payments
Cross-Border B2B Payments
Digitizing all forms of personal and business paymentsSignificant opportunity with good progress tapping into new flows
Cross-Border Remittances
HomeSend
Mastercard Send

©20
17 M
aste
rcar
d.
Simplifying integration of our services
An API for Everything strategy
Enables others to easily integrate our services
Digitizes core product propositions and enables access to underlying network services
Provides tools to simplify the process further – SDKs, automation and test frameworks, sandboxes, etc.
More than 60 APIs available for banks, processors, merchants, startups across payments, data and security
©20
17 M
aste
rcar
d.

©20
17 M
aste
rcar
d.
Identifying and experimenting withfuture technologies, start-ups and trends
Augmenting our customers’ product
development and innovation capabilities
Embracingnew ways of innovating
Incubation of new products and solutions
Looking at the future from a
fresh perspective
Showcasing innovation
and co-creating with partners
Anticipating and building beyond the payment with Mastercard Labs

©20
17 M
aste
rcar
d.
Our approach is very straightforward
Partner-centric in everything we do
Delivering a great experience across every device and every channel
Enabling more payment flows in real-time
Experimenting andco-innovating with customers and partners
Leading set of APIs
Relentlessly securing every transaction

2017 Investment Community Meeting
Securing & Advancing Commerce
Ajay BhallaPresident, Enterprise Security Solutions

©20
17 M
aste
rcar
d.
Rapidly changing world creating huge opportunities
Internet of Things
I amMy Data
Trust in the Sharing Economy
First ‘Digital Native’ Generation
Attacks more global,contagion more rapid

©20
17 M
aste
rcar
d.
A strategy anchored on the principle of ‘security by design’
Issuers Merchants Consumers Governments
Secure assets againstcyber attacks
Prevent
Detect fraudulent behavior & attacksDetect
Redesign customer security experienceExperience
Identify Secure the account holder

©20
17 M
aste
rcar
d.
Successful strategy driving future vision to secure payments
Securing devices,data & networks
Leveraging Artificial Intelligence for smart solutions
Enhancing trust with‘Digital Identity’
Building frictionlesspayment experiences
Success so far Future focus
1.7 billion chip cards globally…
…chip security embedded in devices
Safety Net & Decision Intelligence®saving $ millions for issuers
4.5 billion digital identities verified over past year…
Account Continuity, IQ Series & Alerts optimize the consumer experience
…launched biometrics for mobile & cards
&

©20
17 M
aste
rcar
d.
Securing the Internet of Things
Every connected device to be a secure payment device
Every connected device is a potential entry point for hackers
Our portfolio of solutions secures devices,data and networks
NuData enhances our IoT capabilities, including:botnet automation, user behavior and device reputation

©20
17 M
aste
rcar
d.
Leveraging artificial intelligence for smart solutions
Artificial Intelligence needed to mine mountains of data, and create the best experiences for stakeholders
Artificial Intelligence deeply embedded in Mastercard network
Brighterion enhances our capabilities –Collaborative Artificial Intelligence uncovers deeply hidden data relationships
Innovation is enhancing detection of increasingly sophisticated attacks and improving the consumer experience
Detect fraudulent behavior & attacksDetect

©20
17 M
aste
rcar
d.
Our strategy is…
Ensuring EcosystemSecurity
Working with stakeholders to deploy amulti-layered strategy to secure andadvance commerce
Building competitive advantage withmarket-leading solutions and services
Creating Sources of Differentiation
Enabling new growth opportunitiesand businesses
DeliveringNew Sourcesof Growth

2017 Investment Community Meeting
North American MarketsCraig VosburgPresident, North America

©20
17 M
aste
rcar
d.
North America
51
61
8
15
24
3
16
4
23
PCE B2B P2P/B2C TOTAL
Carded ACH Cash & Check
$141 $25 $18 $571
Market size by payment flowVolume in $ Trillions
2 of top 5 Mastercard markets• % of global revenues• % of total volume
Cash/Check Opportunity(all flows)
PCE Growth (2017)• US• Canada
ACH Opportunity(all flows)
$23T
4.1%4.5%
$24T
41%35%
Note: Figures may not sum due to rounding. 1 Includes approximately $4 trillion in non-purchase personal consumption.Sources: 2016 – Oxford Economics, Euromonitor International, Kaiser Associates, McKinsey Payment Data, US Bureau of Economic Analysis, 2017; Statistics Canada, 2017; Mastercard internal analysis.

©20
17 M
aste
rcar
d.
Clear strategy – focused on execution
Drivecore product
usage
Deliveradded value
to customers
Commercialize B2B, P2P, B2C
Grow share inall segments
Expandnew verticalsand segments
Partner First ApproachHelp our customers reach their consumers
anywhere, anytime, on any device, anyway they want to pay.
Win inDigital
ScaleServices
Build New Payments Businesses
ExpandProduct Distribution
GrowAcceptance
GROW
BUILD
DIVERSIFY

©20
17 M
aste
rcar
d.
Expand product distributionStrong and growing relationships
United States Canada• Positioned to grow consumer credit
share with 6 of top 8 issuers
• 25 co-brand wins since 2015
• Present on over 60% of US debit cards
• Share growth with 3 of 4 top commercial issuers
• Exclusive brand for many of the largest prepaid programs
• Growing credit share
• Strong co-brand position
• Growing Debit Mastercard
• Double digit commercial volumegrowth (twice the market)
• Significant new prepaid programs
Sources: The Nilson Report, 2017; Euromonitor International, 2017; Mastercard internal analysis.

©20
17 M
aste
rcar
d.
Grow acceptanceAccelerate growth through new verticals and partnerships
North America Acceptance Points
11% CAGRin North America acceptance points since 2012
Significant ongoing growth potentialNew verticals, digital, connected devices
2010 2011 2012 2013 2014 2015 2016 2017
Websites and new verticalssuch as rent, healthcare, utilities, etc.
Payments facilitators(e.g., Square)
Digital gateways(e.g., Stripe)
10MM
Sources: Mastercard internal analysis.

©20
17 M
aste
rcar
d.
Win in digitalSecuring the future
80% of eligible MA accounts enabled for tokenization
DigitalEnablement
DigitalPartnerships
DigitalFuture
600+ participantsin Mastercard Digital Enablement Express
40+ millionaccounts enabledfor digital by default
Sources: Mastercard internal analysis.

©20
17 M
aste
rcar
d.
Scale servicesDriving core product differentiation and incremental revenues
Advisors
65+ million accounts managed on our loyalty platform
Enabling digital payment and IoT strategies for merchants
Loyalty
Processing
Data & Analytics
Almost half of transactions benefit from our optional fraud scoring solutions (a 50% increase over last year)Fraud Solutions
Labs as a Service
Over 50% of customers use our project-based consulting services
30+ customer Launchpad events since January 2016
Over 60% of customers use our data & analytics solutions

©20
17 M
aste
rcar
d.
Packaging solutions to deliver customer value
Core Products
Instant Payouts
Digital Assets
Acceptance
Masterpass
All U.S. Co-Brands
Core ProductsDigital Assets
Data and Analytics
Fraud SolutionsMarketing Assets
Loyalty Solutions
Mastercard Labs
Consumer CreditConsumer Debit
Commercial
APT
Mastercard Advisors
Marketing Assets
Loyalty Solutions
AAdvantage™Co-Brand Programs
Fraud SolutionsMastercard Labs

©20
17 M
aste
rcar
d.
Build new payments businessesEnabling choice through single Mastercard partnership`
Products and SolutionsPotential Applications
B2B P2P B2CT&E Cards
Procurement Cards
Virtual Cards
Mastercard Send / HomeSend
Mastercard B2B Hub
Fast ACH
Established
New

©20
17 M
aste
rcar
d.
Positioning Mastercard for long-term success
Significant ongoing growth opportunity
Strongcustomer partnerships
Momentumacross the business
Focused ondelivering results

2017 Investment Community Meeting
International Markets OverviewAnn CairnsPresident, International

©20
17 M
aste
rcar
d.
International Markets
15
1
164
56
35
94
13
41
8
63
PCE B2B P2P/B2C TOTAL
Carded ACH Cash & Check
$311 $98 $43 $1731
Market size by payment flowVolume in $ Trillions
GDV Growth (2016)
Market share growing across all regions
14%
Note: Figures may not sum due to rounding.1 Includes non-PCE card spend.Sources: Oxford Economics, 2016 – Euromonitor International, Kaiser Associates, McKinsey Payment Data; Mastercard internal analysis.
Cash/Check Opportunity(all flows)
PCE Growth (2017)
ACH Opportunity(all flows)
$63T
7%
$94T

©20
17 M
aste
rcar
d.
Clear priorities, focused execution
Win in Digital
Grow Diversify
BuildSmartCities
EnterNew Markets
New flowsACH/B2B/P2P Differentiate
throughServices
Create newPartnerships
Attract newConsumers
Strengthen theCore Business
ExpandAcceptance
2017 Investment Community Meeting
Europe PanelAnn Cairns, Javier Perez, Mark Barnett, Carlo Enrico
©20
17 M
aste
rcar
d.
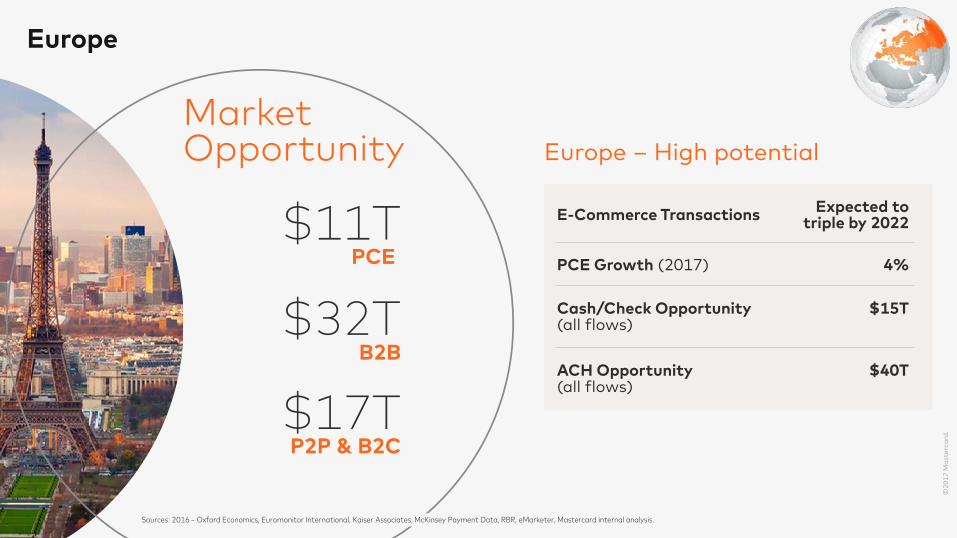
Europe
$11TPCE
$32TB2B
$17TP2P & B2C
MarketOpportunity Europe – High potential
E-Commerce Transactions
Cash/Check Opportunity(all flows)
PCE Growth (2017)
ACH Opportunity(all flows)
$15T
4%
$40T
Expected to triple by 2022
Sources: 2016 – Oxford Economics, Euromonitor International, Kaiser Associates, McKinsey Payment Data, RBR, eMarketer, Mastercard internal analysis.

2017 Investment Community Meeting
Asia Pacific OverviewLing Hai, Ari SarkerCo-Presidents, Asia-Pacific

©20
17 M
aste
rcar
d.
Asia Pacific
Asia – Dynamic and diverse
HNWI (2015)Wealth
Middle Class Consumption
#1 Wealthiest in the World$14T
PCE
$54TB2B
$20TP2P & B2C
MarketOpportunity
Cash/Check Opportunity(all flows)
PCE Growth (2017)
ACH Opportunity(all flows)
$39T
7%
$44T
Expected to more than double by 2025
Sources: 2016 – Oxford Economics, Euromonitor International, Kaiser Associates, McKinsey Payment Data, RBR, eMarketer, Mastercard internal analysis.

©20
17 M
aste
rcar
d.
Grow Diversify Build
Asia Pacific – China
Differentiatethrough Services
Strengthen theCore businesswith 4xsingle-brandedcard issuance
ExpandAcceptanceto 10 million in 5 years
Scale digitalPartnerships
GrowCommercial
• Loyalty• Insights• Safety & Security
M D E S
Win in Digital
Capitalizing on China… medium to long term opportunity

©20
17 M
aste
rcar
d.
Asia Pacific – IndiaThe rise of India…
Economy on the move...GDP expected to double by 20251.GrowthOutlook
Government Policy
Digital India push – Demonetization & Goods & Service Tax (GST); Regulatory environment fostering open competitive market.
DigitalEnablement
Technology Stack...1.2B2 biometric ID system; Proxy based FAST payment.Unprecedented investment in 4G/LTE & fiber broadband infrastructure.
Infrastructure Power Airports RoadRail
Accelerating Fintechs
Fintech operating at a large scale backed by local and international accelerators, angel investors, PE & VC firms.
1. Oxford Economics 2.UIDAI, GOI
©20
17 M
aste
rcar
d.
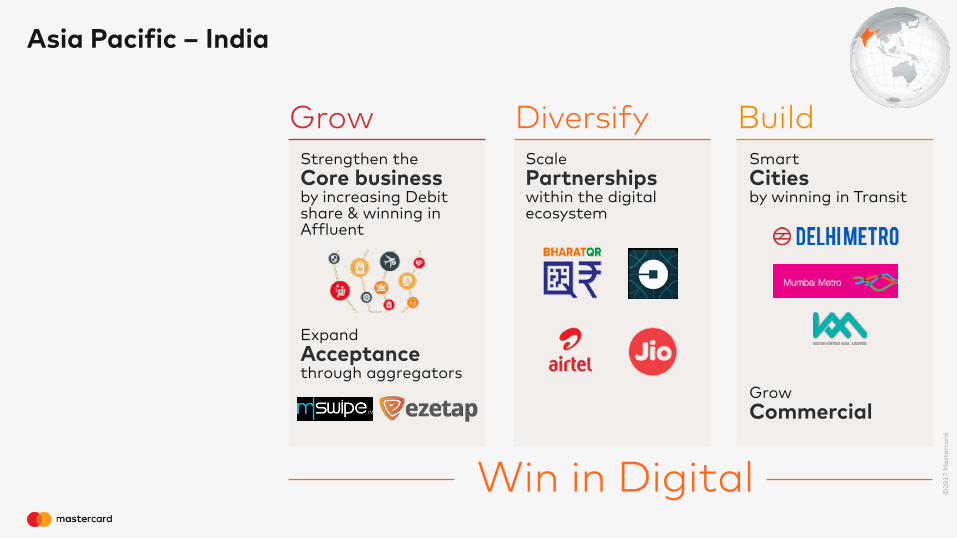
Grow Diversify Build
Asia Pacific – India
SmartCitiesby winning in Transit
ExpandAcceptancethrough aggregators
ScalePartnershipswithin the digital ecosystem
Strengthen theCore business by increasing Debit share & winning in Affluent
GrowCommercial
Win in Digital

2017 Investment Community Meeting
Latin America OverviewGilberto CaldartPresident, Latin America & Caribbean

©20
17 M
aste
rcar
d.
Latin America and Caribbean
$3TPCE
$6TB2B
$4TP2P & B2C
MarketOpportunity
Population 15+ (2016)% underbanked
478 M49%
Latin America – Young and vibrant
PurchaseVolume
2016 MA LAC PerformanceLast 5yr CAGR
$196 B(17%)
Cash/Check Opportunity(all flows)
PCE Growth (2017)
ACH Opportunity(all flows)
$5T
8%
$7T
Sources: 2016 – Oxford Economics, Euromonitor International, Kaiser Associates, McKinsey Payment Data, Frontier Strategy Group, eMarketer, Mastercard internal analysis.

©20
17 M
aste
rcar
d.
Grow Diversify Build
Latin America and Caribbean – Brazil
Strengthen theCore business
Expand Acceptance
Differentiate throughServices
Scale & build strong Partnerships
Capture more flowsACH/B2B/P2P
SmartCities
Win in Digital

©20
17 M
aste
rcar
d.
Emerging Markets takeaways
Some of the world’s biggest economies
High cash usage Digitally savvy and connected population
Strong relationships within a diversified customer base
A one-stop shop, various payments rails, different channels
Digital, key driver in migration of cash to electronic payments

2017 Investment Community Meeting
Financial PerspectiveMartina Hund-MejeanChief Financial Officer

©20
17 M
aste
rcar
d.
Raised2017FinancialOutlook
Net Revenue*
Operating Expense*
Tax Rate
FX Impact
High end of low double-digits growth range
High single-digit growth
Full-year rate of about28%
Positive Operating Leverage
Slight benefit
* All figures are on a currency-neutral basis. Amounts exclude acquisitions and special items; see Appendix B for reconciliation of non-GAAP measures.

©20
17 M
aste
rcar
d.
Investment priorities
GROWCore Business
• Digital / Masterpass
• Acceptance
• Mastercard B2B Hub
• Network
DIVERSIFYCustomers & Geographies
• Emerging Markets
– China
– India
• Artificial Intelligence
• Fast ACH
• Data Analytics
BUILDNew Businesses

©20
17 M
aste
rcar
d.
Fast ACH business model
Role EconomicsTiming / Dependencies
Infrastructure
Operator Fixed pricing based oncapacity Country
level decision by regulators/schemeTechnology provider License +
implementation fees
Scheme / AppB2B, Bill Pay, Disbursement, P2P & P2M solutions
Value-based pricing Pay by Bank app in trial in UK
Services Comprehensive value-added services
Similar to traditional services model
Initial solutions being offered

©20
17 M
aste
rcar
d.
Capital planning priorities
Balance Sheet Long-Term Business Growth
Shareholder Return Capital Structure
Preservestrong balance sheet, liquidity and credit ratings
Investmentsin organic opportunitiesand M&A
Continue toreturn excess cashwith bias towards share repurchases
Gradual and disciplinedmigration to more normalized mixof debt and equity over time

©20
17 M
aste
rcar
d.
Return of capital$23+ billion returned to shareholders since IPO
$1.1$1.7
$2.4
$3.4 $3.5 $3.5
$2.5
$0.1$0.1
$0.3
$0.5$0.7 $0.8
$0.7
$1.2
$1.9
$2.7
$3.9$4.2 $4.3
$3.2
2011 2012 2013 2014 2015 2016 Aug 2017 YTD$0.0
$1.0
$2.0
$3.0
$4.0
$5.0
$ in
bill
ion
s
Share Repurchase
Dividends
Note: Figures may not sum due to rounding

©20
17 M
aste
rcar
d.
Long-term revenue growth potential
Revenue Growth
Potential
B2BP2P/B2C
New Flows
~$180T
PCE
~$45TServices
Mix
Pricing
Share
Low - MidTeens
~5% Annual Growth4-5% Secular Growth**Adj. for available market
MarketVolume/
TransactionsOpportunity

©20
17 M
aste
rcar
d.
Driving growth beyond the core
Core~75%
Services~25%
% of 2016 Revenue
Margin Level
Processing
Loyalty
Advisors
Safety & Security
Margin Expansion with ScaleRevenue CAGR* (2014 – 2016)Core ~9% Services ~29%
23 ppt ex-acquisitions6 ppt acquisitions
* On a currency-neutral basis; see Appendix C for reconciliation of non-GAAP measures

©20
17 M
aste
rcar
d.
Minimal impact expected from new revenue recognition rules
Primary ImpactCertain customer incentives will be recognized over the life of the contract, rather than when earned by the customer
Rules have now been clarifiedRebates and Incentives to continue to be treated as contra revenue
Implementation will occur prospectively starting in
Jan 2018Impact on 2017
expected to be minimal

©20
17 M
aste
rcar
d.
Raised longer-term performance objectives
2016–2018Performance Objectives
Prior
Net RevenueCAGR %*
High end of low double-digit
~20%
Lowdouble-digit
Mid-teens
Annual Operating Margin %
EPS CAGR %*
Minimum50%
Minimum50%
Updated
* On a currency-neutral basis, excluding certain items. See Appendix D for reconciliation of non-GAAP measures.
©20
17 M
aste
rcar
d.
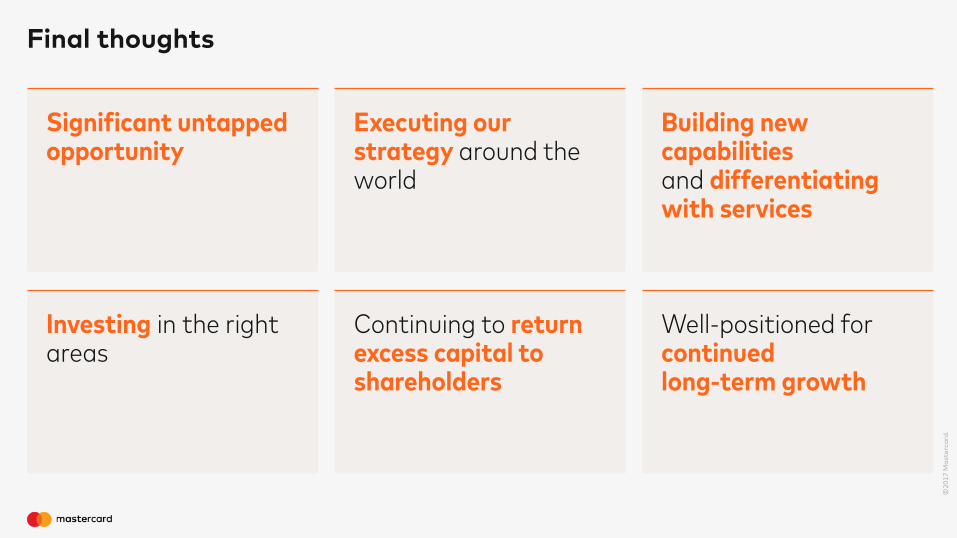
Final thoughts
Significant untapped opportunity
Executing our strategy around the world
Building new capabilitiesand differentiatingwith services
Investing in the right areas
Continuing to return excess capital to shareholders
Well-positioned for continuedlong-term growth

2017 Investment Community Meeting
Appendices

©20
17 M
aste
rcar
d.
Appendix ANon-GAAP reconciliation ($ in millions, except per share data)
Note: Table may not sum due to rounding1 Adjusted for both the translational and transactional foreign currency impact2 Impact of the U.S. Merchant Litigation Settlement (2011: $770 million pre-tax ($0.39 per diluted share); 2012: $20 million pre-tax ($0.01 per diluted share); 2013: $95 million pre-tax ($0.05 per diluted share); 2015: the termination of the U.S.
employee pension plan in $79 million pre-tax ($0.04 per diluted share) and U.K. Merchant Litigation Provision of $61 million pre-tax ($0.04 per diluted share); 2016: the U.K. Merchant Litigation Provision $117 million pre-tax ($0.08 per diluted share).
5-Year
2011 2012 2013 2014 2015 2016 CAGR
CAGRCurrency-neutral 1
Net revenue $ 6,714 $ 7,391 $ 8,312 $ 9,441 $ 9,667 $ 10,776 10% 13%
Operating income - as reported $ 2,713 $ 3,937 $ 4,503 $ 5,106 $ 5,078 $ 5,761 16% 20%Special items 2 770 20 95 - 140 117 Adjusted operating income $ 3,483 $ 3,957 $ 4,598 $ 5,106 $ 5,218 $ 5,878 11% 15%
Operating margin - as reported 40.4% 53.3% 54.2% 54.1% 52.5% 53.5%Special items 2 11.5% 0.3% 1.1% -% 1.4% 1.1%Adjusted operating margin 51.9% 53.5% 55.3% 54.1% 54.0% 54.5%
GAAP diluted EPS $ 1.48 $ 2.19 $ 2.56 $ 3.10 $ 3.35 $ 3.69 20% 24%Special items 2 0.39 0.01 0.05 - 0.08 0.08 Non-GAAP diluted EPS $ 1.87 $ 2.20 $ 2.61 $ 3.10 $ 3.43 $ 3.77 15% 19%

©20
17 M
aste
rcar
d.
Appendix BNon-GAAP reconciliation2017 full-year financial outlook
2017 vs. 2016Increase / (Decrease)
Net revenue Operating expenses
Forecasted growth - U.S. GAAP 1 Mid-teens High end of low-double digits
Special items 2 — 2%
Acquisitions (2)% (6)%
Foreign currency 3 (0-1)% (0-1)%
Forecasted growth - excluding special items andacquisitions, currency-neutral
High end of low-double digits High-single digit
1 2017 forecast versus 2016 actuals 2 Impact of Canadian merchant litigation (2017: $15M pre-tax) and U.K. merchant litigation provisions (2016: $117M pre-tax)3 Impact of foreign currency for both the translational and transactional impacts

©20
17 M
aste
rcar
d.
2014-20163-Year CAGR
Increase/(Decrease)
Core Revenue Services Revenue
GAAP 5% 25%
Foreign currency1 4% 4%
Non-GAAP – currency-neutral 9% 29%
Acquisitions2 — (6)%
Non-GAAP - excluding acquisitions, currency-neutral 9% 23%
Appendix CNon-GAAP reconciliation2014-2016 net revenue CAGR
1 Impact of foreign currency for both the translational and transactional impacts
2 Excludes the impact for acquisitions made during the 2014-2016 period.

©20
17 M
aste
rcar
d.
2016-20183-Year CAGR
Increase/(Decrease)
Prior Updated
Net Revenue EPS1 Net Revenue EPS1
GAAP Low-double digit Low-double digit Mid-teens High-teens
Special items2 — (1)% — (1)%
Acquisitions3 — — (1)% 1%
Foreign currency4 1% 1% (0-1)% (1)%
Significant tax items5 — 4% — 4%
Non-GAAP - excluding special items,acquisitions, currency-neutral, normalized taxes
Low-double digit Mid-teens High end of low double-digit ~20%
Appendix DNon-GAAP reconciliationLong-term performance objectives
1 Based on 2015 pro forma EPS utilized to measure 3‐year diluted EPS target performance (2016‐2018). See Appendix E 2 Impact of the 2015 termination of the U.S. employee pension plan ($0.04 per diluted share) and the U.K. merchant litigation provision ($0.04 per diluted share) 3 Impact of 2017 acquisitions 4 Impact of foreign currency for both the translational and transactional impacts5 Impact of discrete tax benefits and the tax impact of non-recurring repatriation benefits in 2015 ($0.31 per diluted share)
©20
17 M
aste
rcar
d.
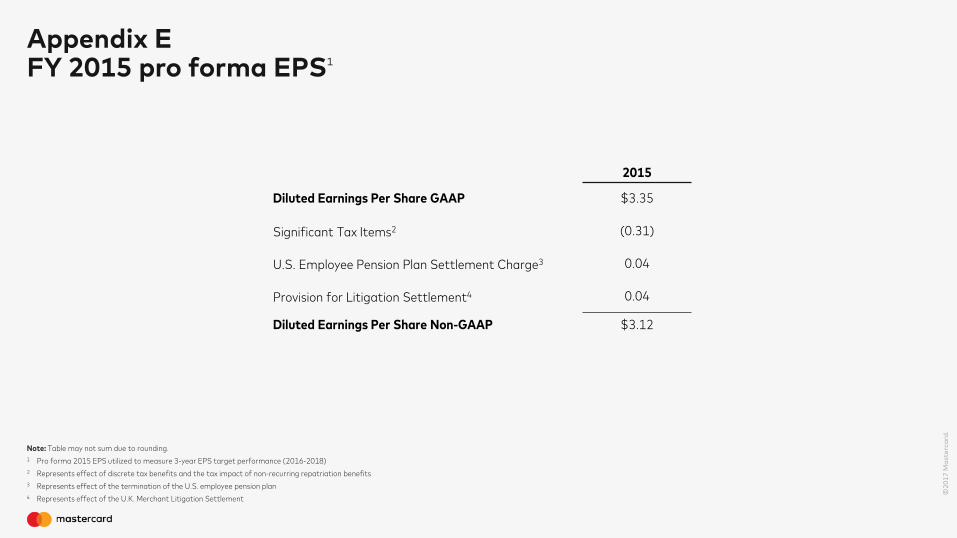
Appendix EFY 2015 pro forma EPS1
2015
Diluted Earnings Per Share GAAP $3.35
Significant Tax Items2 (0.31)
U.S. Employee Pension Plan Settlement Charge3 0.04
Provision for Litigation Settlement4 0.04
Diluted Earnings Per Share Non-GAAP $3.12
Note: Table may not sum due to rounding.1 Pro forma 2015 EPS utilized to measure 3-year EPS target performance (2016-2018)2 Represents effect of discrete tax benefits and the tax impact of non-recurring repatriation benefits3 Represents effect of the termination of the U.S. employee pension plan4 Represents effect of the U.K. Merchant Litigation Settlement

©20
17 M
aste
rcar
d.
Appendix FArticle 8 impacts on worldwide GDV
Growth (Local Currency)
1H2017GDV
Consumer Credit 6%Consumer Credit normalized for Article 8 7%
Consumer Debit 2%Consumer Debit normalized for Article 8 8%
Prepaid 14%Prepaid normalized for Article 8 15%
Commercial 13%Commercial normalized for Article 8 15%
Worldwide 5%Worldwide normalized for Article 8 8%
Note: Article 8 of the EU Interchange Fee Regulation which relates to card payments and which became effective June 9, 2016, states that a network can no longer charge fees on domestic EEA payment transactions that do not use its payment brand. Prior to that, Mastercard collected a de minimis assessment fee in a few countries, particularly France, on transactions with Mastercard co-badged cards if the brands of domestic networks (as opposed to Mastercard) were used. As a result, the non-Mastercard co-badged volume is no longer being included.
To aid in understanding the underlying trends in the business, the table above reflects adjusted growth rates for the impact of Article 8, by eliminating the related co-badged volumes in prior periods.


