94
2018 © Region One ESC Division of Instructional, School Improvement, & College Readiness Support 2018 Performance Based Monitoring Analysis System PBMAS 101

2018 © Region One ESC Division of Instructional, School Improvement, & College Readiness Support
2018 Performance Based Monitoring Analysis System
PBMAS 101

2018 © Region One ESC Division of Instructional, School Improvement, & College Readiness Support
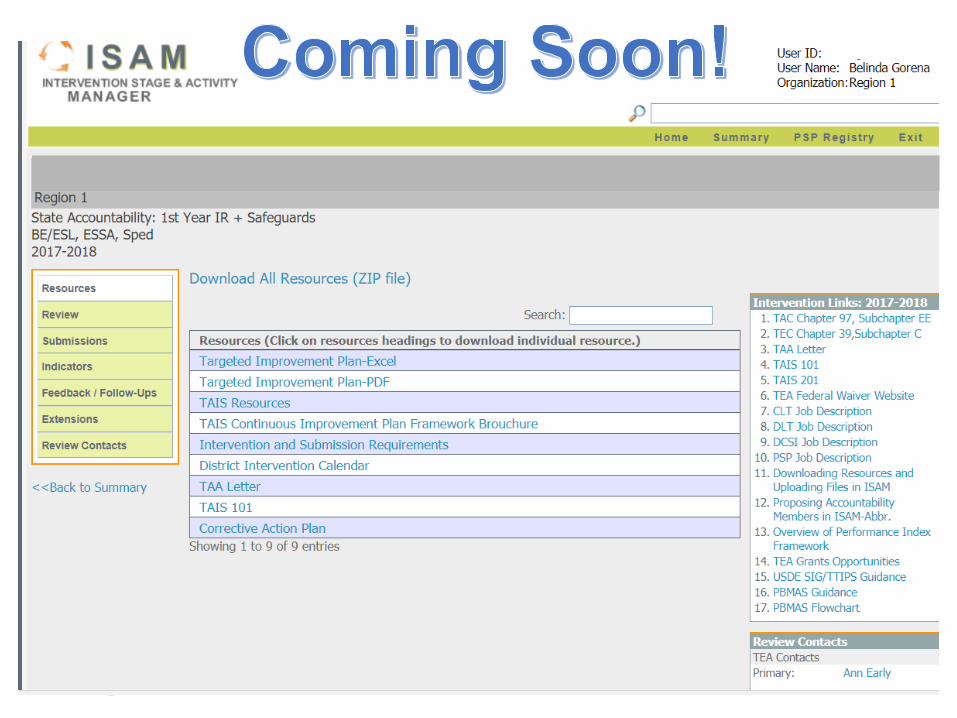
Today’s Resources...
2018 © Region One ESC Division of Instructional, School Improvement, & College Readiness Support
2018 © Region One ESC Division of Instructional, School Improvement, & College Readiness Support
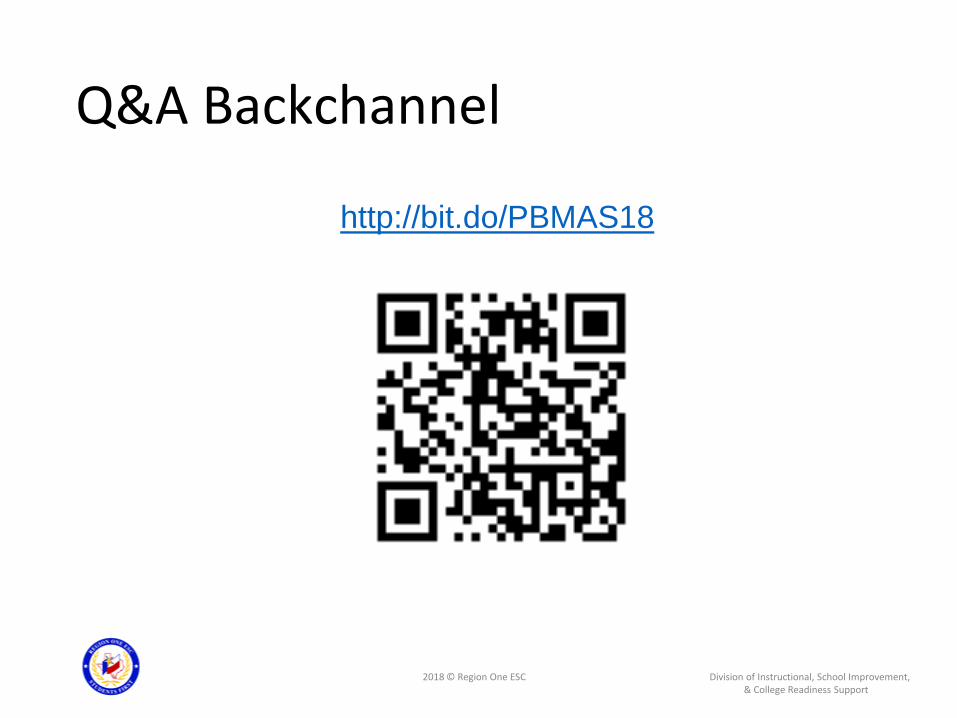
Q&A Backchannel
http://bit.do/PBMAS18

2018 © Region One ESC Division of Instructional, School Improvement, & College Readiness Support
Agenda• Welcome
• Introduction, Timeline, and Guiding Principles
• Staging Framework: Coming Soon!
• Background, General Changes and Updates per program area
• Engaging in the Continuous
Improvement Process

2018 © Region One ESC Division of Instructional, School Improvement, & College Readiness Support
Introduction and Guiding Principles

2018 © Region One ESC Division of Instructional, School Improvement, & College Readiness Support
PBMAS Introduction
Program Performance
&Program
Effectiveness
Performance-Based Monitoring Analysis System (PBMAS) is an automated data system that reports annually on the performance of school districts and charter schools in selected program areas.
Bilingual/ESL
CTE
Career technical Education
Special Education
ESSA
Every Student Succeeds Act
2018 © Region One ESC Division of Instructional, School Improvement, & College Readiness Support
Guiding Principles
Performance Based Monitoring Analysis System
2018 © Region One ESC Division of Instructional, School Improvement, & College Readiness Support
Guiding Principles

2018 © Region One ESC Division of Instructional, School Improvement, & College Readiness Support
Components of the 2018 PBMAS
Performance Based Monitoring Analysis System
Components of the 2018 PBMAS
Performance Based Monitoring Analysis System

2018 © Region One ESC Division of Instructional, School Improvement, & College Readiness Support
Components
•Data Sources•Student Assessment
•Research and Analysis Division (dropout and longitudinal rates)
•PEIMS
• Data Exclusions for annual dropout rates •Texas Education Code §39.053(g-3)
•(g-3) In the computation of dropout and completion rates such as high school graduation rates under Subsection (c)(1)(B)(ix), a student who is released from a juvenile pre-adjudication secure detention facility or juvenile post-adjudication secure correctional facility and fails to enroll in school or a student who leaves a residential treatment center after receiving treatment for fewer than 85 days and fails to enroll in school may not be considered to have dropped out from the school district or campus serving the facility or center unless that district or campus is the one to which the student is regularly assigned. The agency may not limit an appeal relating to dropout computations under this subsection

2018 © Region One ESC Division of Instructional, School Improvement, & College Readiness Support
• No Data Available for an Indicator•Receives a designation of No Data, cannot be evaluated
•Districts with one or more Performance Level (PL) of No Datashould examine local data collection and submission procedures
•Data validation analysis and reviews are conducted by the agency as part of PBM activities.
• Accountability Subset (AS)• Student enrolled in a district on Fall Snapshot date (October 27, 2017) and test in the same district in the Fall of 2017 or Spring of 2018.
• Summer 2017 is based on 2016 fall snapshot date
• Whether AS is used in an indicator is noted in the description of the indicator.
Components continued

2018 © Region One ESC Division of Instructional, School Improvement, & College Readiness Support
Components continued
• Rounding•All rates are rounded to the first decimal place
•79.877% is rounded to 79.9
•Intermediate results for al PBMAS significant disproportionality ratios are not rounded.
• Masking •District data released to district as allowed by FERPA
•Public release are masked to protect student confidentiality
• Performance Level (PL)• result that occurs when a standard is applied to a district’s performance on an indicator

2018 © Region One ESC Division of Instructional, School Improvement, & College Readiness Support
•PL’s continued • A PL is the result that occurs when a standard is applied to a district’s performance on an indicator.
•The PLs available for indicators in the 2018 PBMAS include Not Assigned (NA) (including Not Assigned through SA), 0, 0 SA, 0 RI, 1, 1 SA, 2, 2 SA, 3, 3 SA, 4, 4 SA, and SD.
•SA refers to Special Analysis, Minimum Size Requirement (MSR) and Special Analysis (SA).
•RI refers to Required Improvement
•SD refers to Significant Disproportionality and is used to meet federal requirements under 34 Code of Federal Regulations (CFR) §300.647.
Components continued
2018 © Region One ESC Division of Instructional, School Improvement, & College Readiness Support
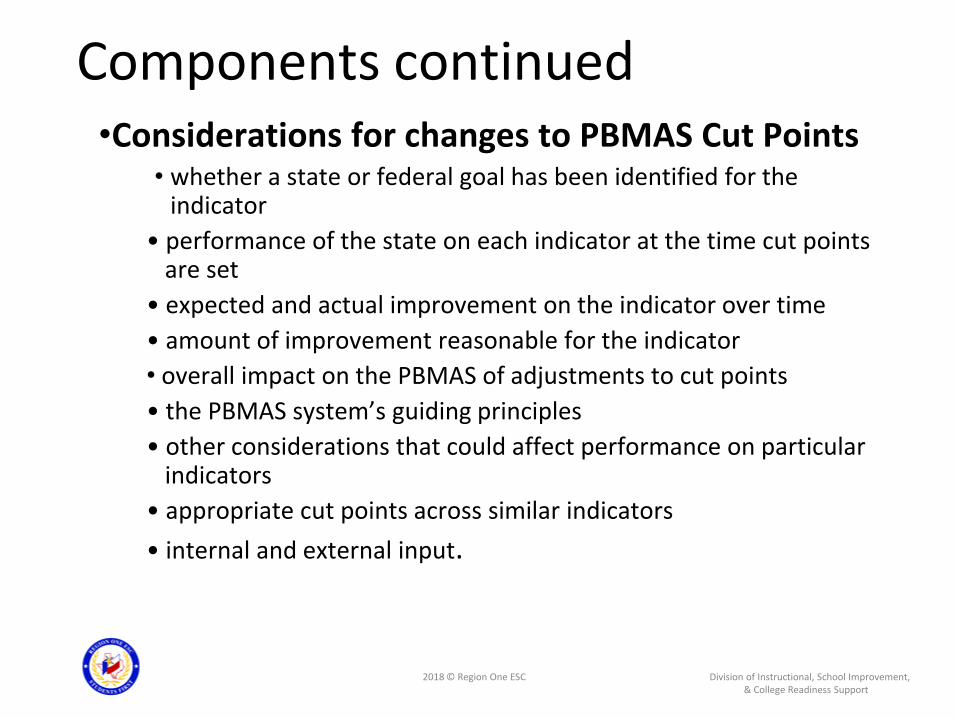
•Considerations for changes to PBMAS Cut Points• whether a state or federal goal has been identified for the
indicator
• performance of the state on each indicator at the time cut points are set
• expected and actual improvement on the indicator over time
• amount of improvement reasonable for the indicator
• overall impact on the PBMAS of adjustments to cut points
• the PBMAS system’s guiding principles
• other considerations that could affect performance on particular indicators
• appropriate cut points across similar indicators
• internal and external input.
Components continued
2018 © Region One ESC Division of Instructional, School Improvement, & College Readiness Support
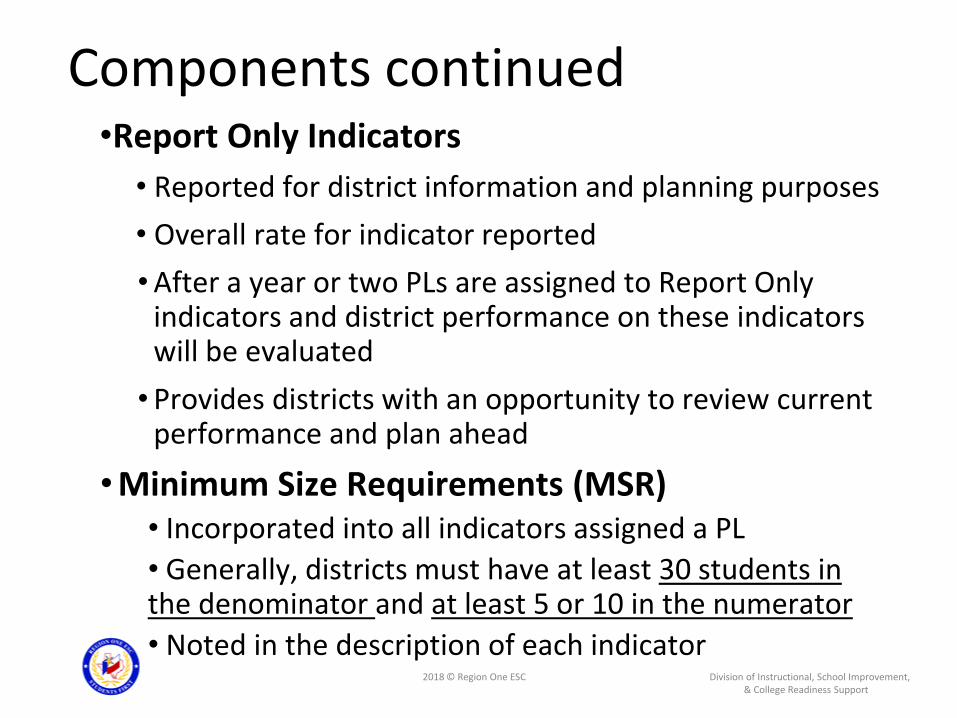
Components continued •Report Only Indicators
• Reported for district information and planning purposes
• Overall rate for indicator reported
• After a year or two PLs are assigned to Report Only indicators and district performance on these indicators will be evaluated
• Provides districts with an opportunity to review current performance and plan ahead
• Minimum Size Requirements (MSR)• Incorporated into all indicators assigned a PL
• Generally, districts must have at least 30 students in the denominator and at least 5 or 10 in the numerator
• Noted in the description of each indicator

2018 © Region One ESC Division of Instructional, School Improvement, & College Readiness Support
Regional PBM DataStudents Served
Coming Soon!
2018 © Region One ESC Division of Instructional, School Improvement, & College Readiness Support
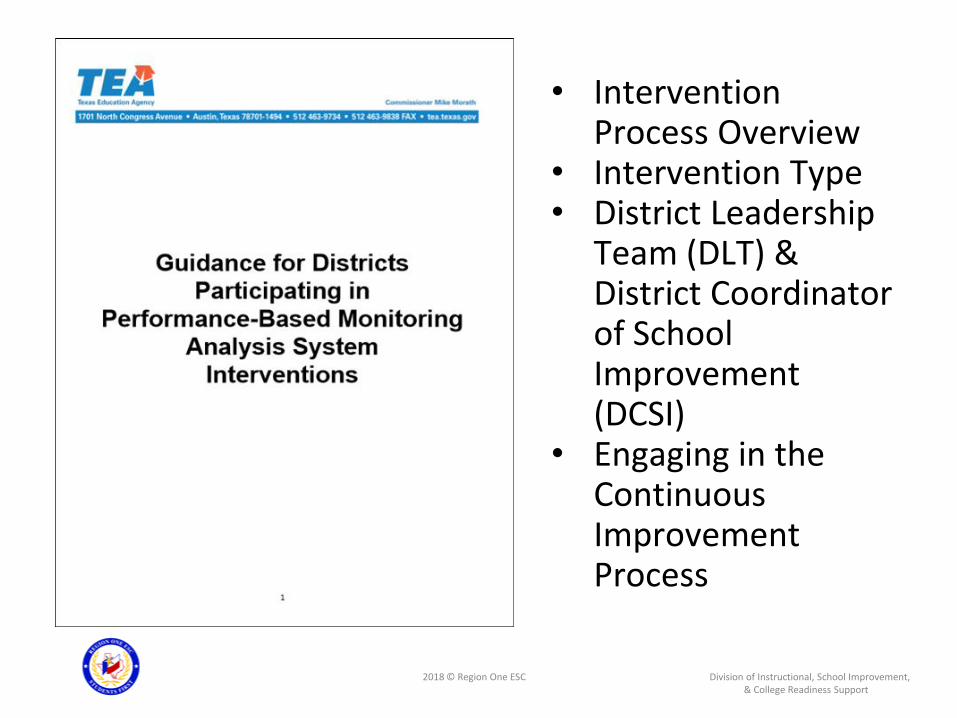
• Intervention Process Overview
• Intervention Type• District Leadership
Team (DLT) & District Coordinator of School Improvement (DCSI)
• Engaging in the Continuous Improvement Process

2018 © Region One ESC Division of Instructional, School Improvement, & College Readiness Support
2018 PBMAS Staging Framework
Coming Soon!
2018 © Region One ESC Division of Instructional, School Improvement, & College Readiness Support

2018 © Region One ESC Division of Instructional, School Improvement, & College Readiness Support
2018 © Region One ESC Division of Instructional, School Improvement, & College Readiness Support
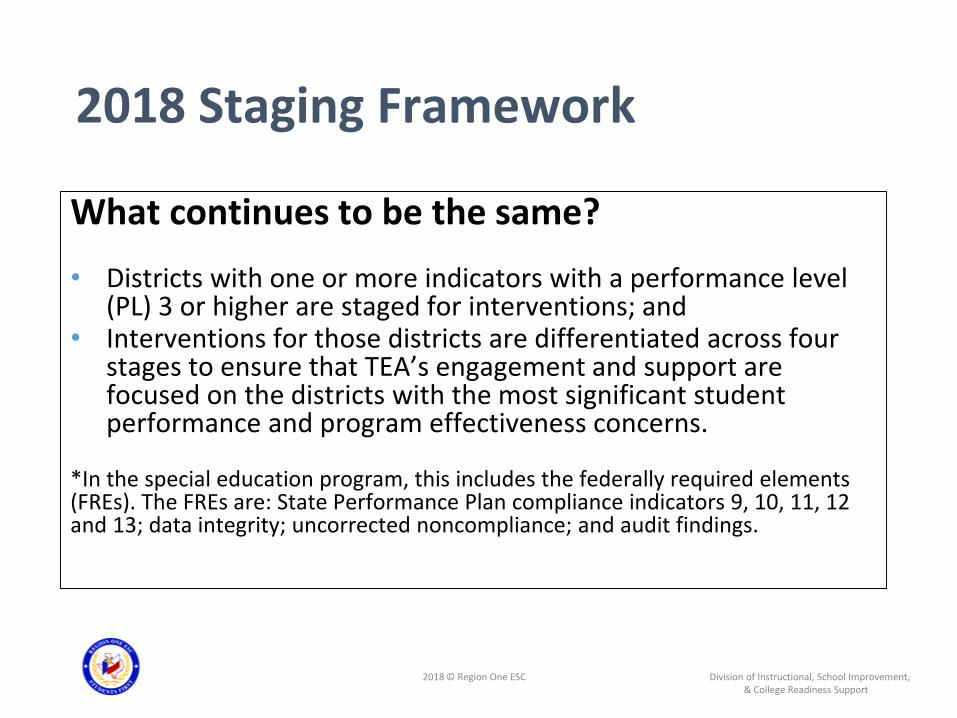
2018 Staging Framework
What continues to be the same?
• Districts with one or more indicators with a performance level (PL) 3 or higher are staged for interventions; and
• Interventions for those districts are differentiated across four stages to ensure that TEA’s engagement and support are focused on the districts with the most significant student performance and program effectiveness concerns.
*In the special education program, this includes the federally required elements (FREs). The FREs are: State Performance Plan compliance indicators 9, 10, 11, 12 and 13; data integrity; uncorrected noncompliance; and audit findings.
2018 © Region One ESC Division of Instructional, School Improvement, & College Readiness Support
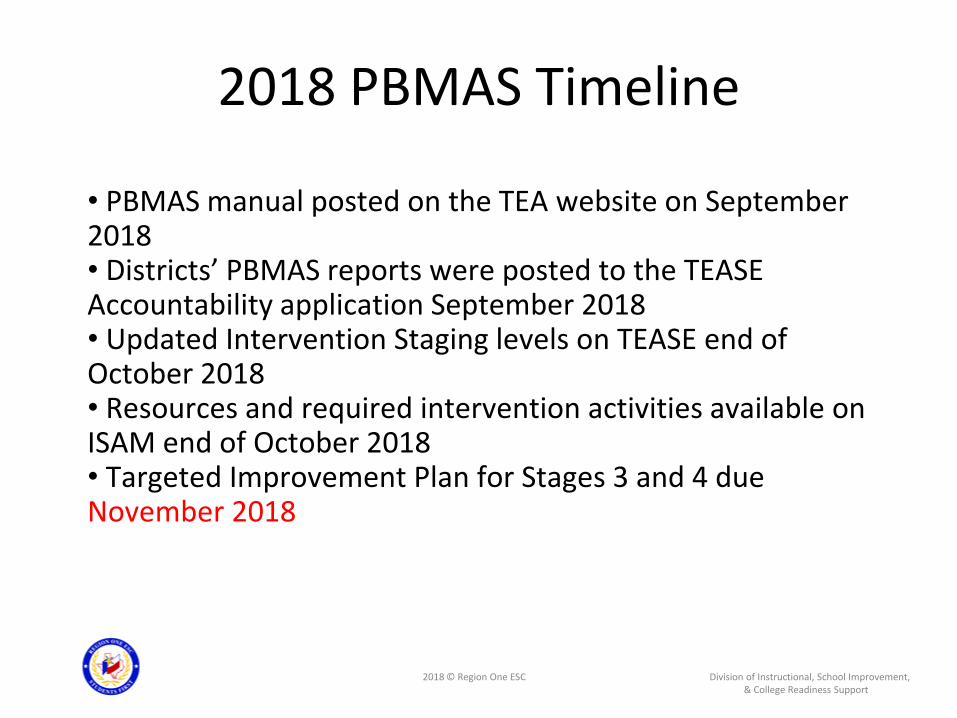
• PBMAS manual posted on the TEA website on September 2018• Districts’ PBMAS reports were posted to the TEASE Accountability application September 2018 • Updated Intervention Staging levels on TEASE end of October 2018• Resources and required intervention activities available on ISAM end of October 2018• Targeted Improvement Plan for Stages 3 and 4 due November 2018
2018 PBMAS Timeline

2018 © Region One ESC Division of Instructional, School Improvement, & College Readiness Support
PBMAS 2018Special Education

2018 © Region One ESC Division of Instructional, School Improvement, & College Readiness Support
What
is
PBMAS?
PBMAS
MANUAL
CONTENTS
Guiding
PrinciplesChanges Review of
IndicatorsStaging

2018 © Region One ESC Division of Instructional, School Improvement, & College Readiness Support
What
is
PBMAS?
2018 © Region One ESC Division of Instructional, School Improvement, & College Readiness Support
The PBMAS is a district-level, data-driven monitoring system developed and implemented annually by Performance-Based Monitoring (PBM) staff in coordination with other Texas Education Agency (TEA) divisions and departments.
The 2018 PBMAS
Manual is intended to
serve as a
comprehensive
technical resource for
the PBMAS, which is
used by TEA as one
part of its annual
evaluation of school
districts’1 performance
and program
effectiveness.
What is PBMAS?

2018 © Region One ESC Division of Instructional, School Improvement, & College Readiness Support
PBMAS
MANUAL
CONTENTS

2018 © Region One ESC Division of Instructional, School Improvement, & College Readiness Support
PBMAS Manual Contents
I. Introduction
II. Components
III. Performance Indicators I. Bilingual Education (BE)(1-9)
II. Career & Technical Education (CTE) (1-8)
III. Every Student Succeeds Act (ESSA) (1-8)
IV. Special Education (SPED) (1-16) Page 51
IV.Appendices

2018 © Region One ESC Division of Instructional, School Improvement, & College Readiness Support
Guiding
Principles

2018 © Region One ESC Division of Instructional, School Improvement, & College Readiness Support
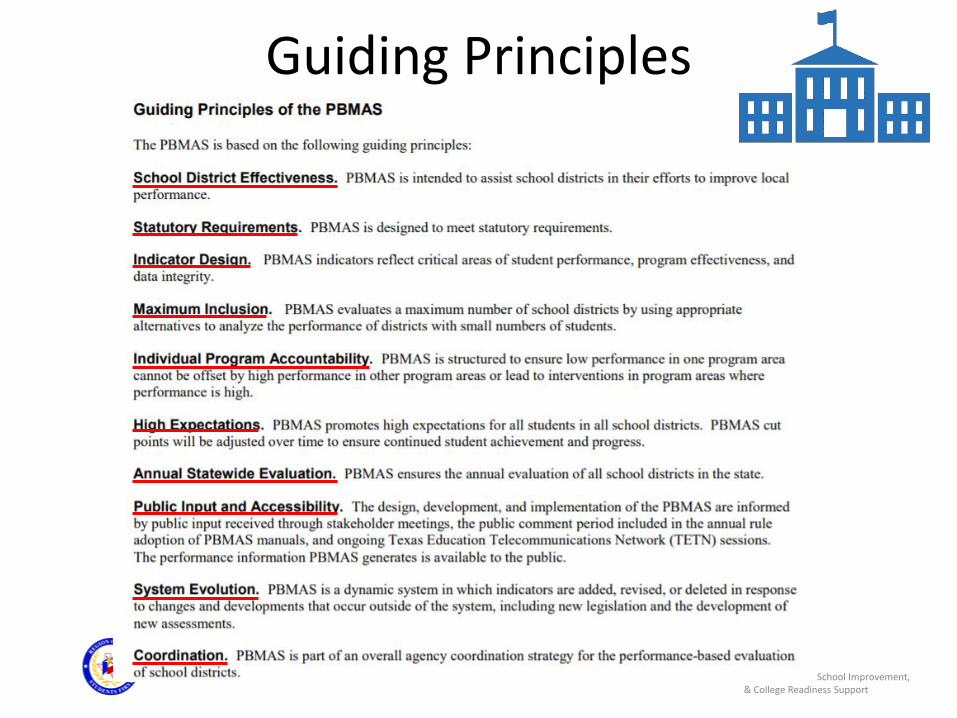
Public Input and Accessibility. The
design, development, and implementation of
the PBMAS are informed by public input
received through stakeholder meetings, the
public comment period included in the annual
rule adoption of PBMAS manuals, and
ongoing Texas Education Telecommunications
Network (TETN) sessions. The performance
information PBMAS generates is available to
the public.
School District Effectiveness. PBMAS is
intended to assist school districts in their efforts
to improve local performance.
Statutory Requirements. PBMAS is designed to
meet statutory requirements.
Indicator Design. PBMAS indicators reflect
critical areas of student performance, program
effectiveness, and data integrity.
Maximum Inclusion. PBMAS evaluates a maximum
number of school districts by using appropriate
alternatives to analyze the performance of districts with
small numbers of students.
Individual Program Accountability. PBMAS is
structured to ensure low performance in one program area
cannot be offset by high performance in other program areas
or lead to interventions in program areas where performance
is high.
High Expectations. PBMAS promotes high
expectations for all students in all school districts.
PBMAS cut points will be adjusted over time to
ensure continued student achievement and
progress.
Annual Statewide Evaluation. PBMAS ensures
the annual evaluation of all school districts in the
state.
System Evolution. PBMAS is a dynamic
system in which indicators are added,
revised, or deleted in response to changes and
developments that occur outside of the
system, including new legislation and the
development of new assessments.
Coordination. PBMAS is part of an overall agency
coordination strategy for the performance-based
evaluation of school districts.
2018 © Region One ESC Division of Instructional, School Improvement, & College Readiness Support
Changes
2018 © Region One ESC Division of Instructional, School Improvement, & College Readiness Support
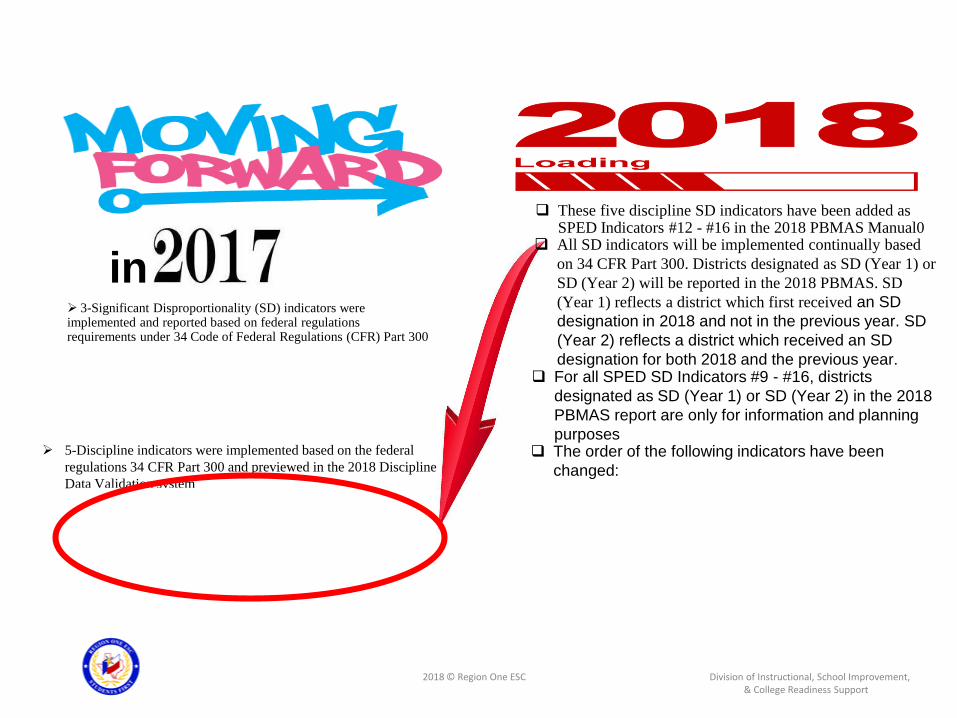
➢ 3-Significant Disproportionality (SD) indicators were implemented and reported based on federal regulations requirements under 34 Code of Federal Regulations (CFR) Part 300
1. SPED Representation (Ages 3-21),
2. SPED Regular Class <40% Rate (Ages 6-21), and
3. SPED Separate Settings Rate (Ages 6-21)
➢ 5-Discipline indicators were implemented based on the federal
regulations 34 CFR Part 300 and previewed in the 2018 Discipline
Data Validation system
1. SPED OSS and Expulsion <10 Days Rate (Ages 3-21),
2. SPED OSS and Expulsion >10 Days Rate (Ages 3-21),
3. SPED ISS <10 Days Rate (Ages 3-21),
4. SPED ISS >10 Days Rate (Ages 3-21), and
5. SPED Total Disciplinary Removals Rate (Ages 3-21),
in
❑ These five discipline SD indicators have been added as SPED Indicators #12 - #16 in the 2018 PBMAS Manual0
❑ All SD indicators will be implemented continually based
on 34 CFR Part 300. Districts designated as SD (Year 1) or
SD (Year 2) will be reported in the 2018 PBMAS. SD
(Year 1) reflects a district which first received an SD
designation in 2018 and not in the previous year. SD
(Year 2) reflects a district which received an SD
designation for both 2018 and the previous year. ❑ For all SPED SD Indicators #9 - #16, districts
designated as SD (Year 1) or SD (Year 2) in the 2018
PBMAS report are only for information and planning
purposes❑ The order of the following indicators have been
changed:
SPED Annual Dropout Rate (Grades 7-12) was # 9 now is # 5
SPED Graduation Rate was # 10 now is # 6
SPED Regular Early Childhood Program Rate (Ages 3-5) was # 5 now
is # 7
SPED Regular Class ≥80% (Ages 6-21) was # 6 now is # 8
SPED Regular Class <40% (Ages 6-21) was # 7 now is # 9
SPED Separate Settings Rate (Ages 6-21) was # 8 now is # 10

2018 © Region One ESC Division of Instructional, School Improvement, & College Readiness Support
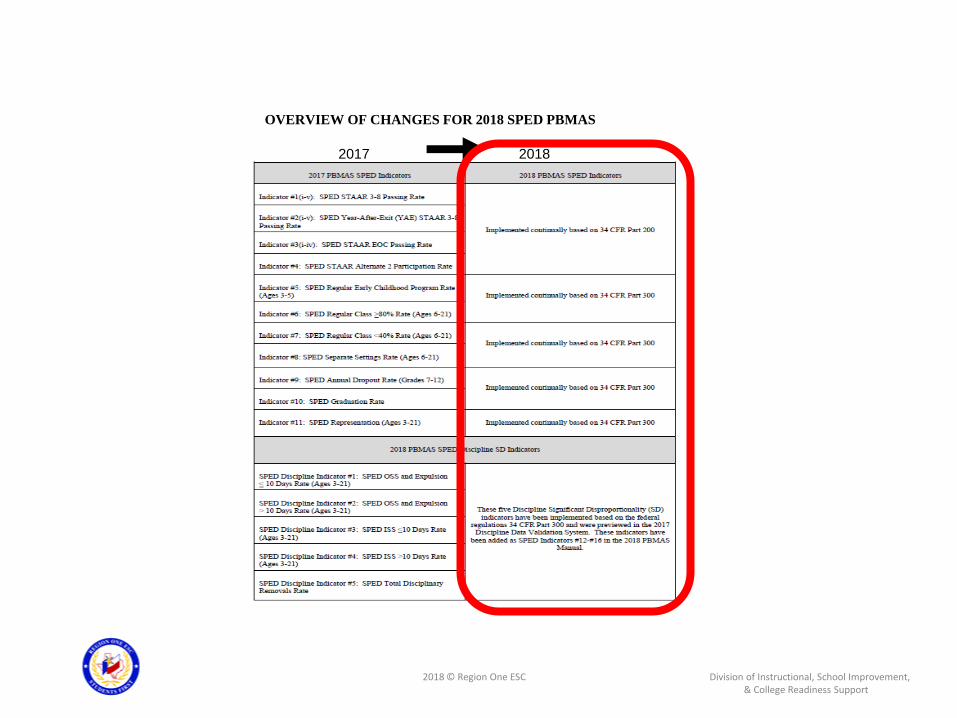
Recap--Discipline Indicators
PBMAS has historically included three discipline indicators that evaluate the placement of students with disabilities compared
to the placement of all students in:
•Disciplinary Alternative Education Programs (DAEP)
•In-School Suspension (ISS)
•Out of School Suspension (OSS)
They are back in PBMAS for 2018 as:
•SPED OSS and Expulsion < 10 Days Rate (Ages 3-21)
•SPED OSS and Expulsion > 10 Days Rate (Ages 3-21)
•SPED ISS < 10 Days Rate (Ages 3-21)
•SPED ISS > 10 Days Rate (Ages 3-21)
•SPED Total Disciplinary Removals Rate (Ages 3-21)
2018 © Region One ESC Division of Instructional, School Improvement, & College Readiness Support
OVERVIEW OF CHANGES FOR 2018 SPED PBMAS
2017 2018

2018 © Region One ESC Division of Instructional, School Improvement, & College Readiness Support
Review of
Indicators
2018 © Region One ESC Division of Instructional, School Improvement, & College Readiness Support

2018 © Region One ESC Division of Instructional, School Improvement, & College Readiness Support
Program Area
and Indicator
Number
Indicator Name 2017 PBMAS 2018 PBMAS Individual
Indicator
Summary
on Page
SPED #1(i-v) SPED STAAR 3-8 Passing Rate
(M, R, S, SS, W)
Add SA.
Three years of data available for analysis
No changes Page 53
2018 PBMAS Indicator: SPED

2018 © Region One ESC Division of Instructional, School Improvement, & College Readiness Support
SPED Indicator Number: #1 (i-v) SPED STAAR 3-8 Passing Rate
Description Measures the % of students served in special education who met the
minimum level of satisfactory performance of higher
Calculation Formula
Data Sources TSDS PEIMS 401 10 Sub-Category (SPED Indicator code)
Overall Processing Criteria MSR: Denominator > 30
RI: Yes
SA: Yes
Year(s) of Data Available for Analysis: 3
Accountability Subset: Yes
Test Administrations: Spring 2018 and May 2018 SSI Retest
Applicable TSDS PEIMS Collections: Fall 2018
Section II of this manual includes detailed information on these
and other PBMAS components
PL Assignment
Notes • SPED STAAR 3-8 base don STAAR, STAAR Spanish,
STAAR Alternate 2 results from the following grade-level
assessments…
• Students assessed with STAAR Alternate 2 are included in
numerator if they achieved a Level II performance or higher
Sample
number of SPED STAAR 3-8 [subject (i-v)] passers
number of SPED STAAR 3-8 [subject (i-v)] takers
2018 Performance-Based Monitoring Analysis System Manual 53

2018 © Region One ESC Division of Instructional, School Improvement, & College Readiness Support
Program Area
and Indicator
Number
Indicator Name 2017 PBMAS 2018 PBMAS Individual
Indicator
Summary
on Page
SPED #1(i-v) SPED STAAR 3-8 Passing Rate
(M, R, S, SS, W)
Add SA.
Three years of data available for analysis
No changes Page 53
SPED #2(i-v) SPED YAE STAAR 3-8 Passing
Rate
(M, R, S, SS, W)
Add SA.
Three years of data available for analysis
No changes Page 54
SPED #3(i-iv) SPED STAAR EOC Passing Rate
(M, S, SS, ELA)
Add RI for ELA.
Add SA (except ELA)
Three years of data available for analysis
(two years for ELA)
No changes Page 55
SPED #4 SPED STAAR Alternate 2
Participation Rate
No changes No changes Page 56
SPED # 5 SPED Annual Dropout Rate
(Grades 7-12)
No changes New indicator number Page 57
SPED # 6 SPED Graduation Rate No changes New indicator number Page 58
2018 PBMAS Indicator: SPED
2018 © Region One ESC Division of Instructional, School Improvement, & College Readiness Support
2018 PBMAS Indicator: SPED ContinuedProgram
Area and
Indicator
Number
Indicator Name 2017 PBMAS 2018 PBMAS Individual Indicator
Summary
on Page
SPED # 7 SPED Regular Early
Childhood Program Rate
(Ages 3-5)
• Three years of data available for analysis New indicator
number
Page 59
SPED # 8 SPED Regular Class ≥80%
Rate
(Ages 6-21)
• Add RI.
• Discontinue SD RO by race/ethnicity.
• Two years of data available for analysis
New indicator
number
Page 60
SPED # 9 SPED Regular Class <40%
Rate
(Ages 6-21)
• Revise the indicator based on final federal regulations
under 34 CFR Part 300, issued by USDE on December
19, 2018.
• Assign SD Year 1 PLs based on race/ethnicity.
• Add RI to overall component, where two years of data are
available.
New indicator
number
Pages 61-62
SPED # 10 SPED Separate Settings Rate
(Ages 6-21)
• New indicator required by final federal regulations under
34 CFR Part 300, issued by USDE on December 19, 2018.
• Assign SD Year 1 PLs based on race/ethnicity.
• Overall component is Report Only
New indicator
number
Pages 63-64
SPED # 11 SPED Representation • One integrated indicator based on final federal regulations
under 34 CFR Part 300, issued by USDE on December
19, 2018.
• Assign SD Year 1 PLs based on race/ethnicity and
disability category
No changes Pages 65-66

2018 © Region One ESC Division of Instructional, School Improvement, & College Readiness Support
2018 PBMAS Indicator: SPED ContinuedProgram Area
and Indicator
Number
Indicator Name 2017 PBMAS 2018 PBMAS Individual Indicator
Summary
on Page
SPED # 12 SPED OSS and Expulsion < 10
Days Rate
(Ages 3-21)
• Discontinue the indicator.
• New SPED discipline indicators based on final
federal regulations under 34 CFR Part 300,
issued by USDE on December 19, 2018, will be
previewed in the 2018 PBM Discipline Data
Validation System
New indicator Pages 67-68
SPED # 13 SPED OSS and Expulsion > 10
Days Rate
(Ages 3-21)
New indicator Pages 69-70
SPED # 14 SPED ISS < 10 Days Rate
(Ages 3-21)
• Discontinue the indicator.
• New SPED discipline indicators based on final
federal regulations under 34 CFR Part 300,
issued by USDE on December 19, 2018, will be
previewed in the 2018 PBM Discipline Data
Validation System
New indicator Pages 71-72
SPED # 15 SPED ISS >10 Days Rate
(Ages 3-21)New indicator Pages 73-74
SPED # 16 SPED Total Disciplinary
Removals Rate (Ages 3-21)
• Discontinue the indicator.
• New SPED discipline indicators based on final
federal regulations under 34 CFR Part 300,
issued by USDE on December 19, 2018, will be
previewed in the 2018 PBM Discipline Data
Validation System
New Indicator Pages 75-76
2018 © Region One ESC Division of Instructional, School Improvement, & College Readiness Support
2018 © Region One ESC Division of Instructional, School Improvement, & College Readiness Support
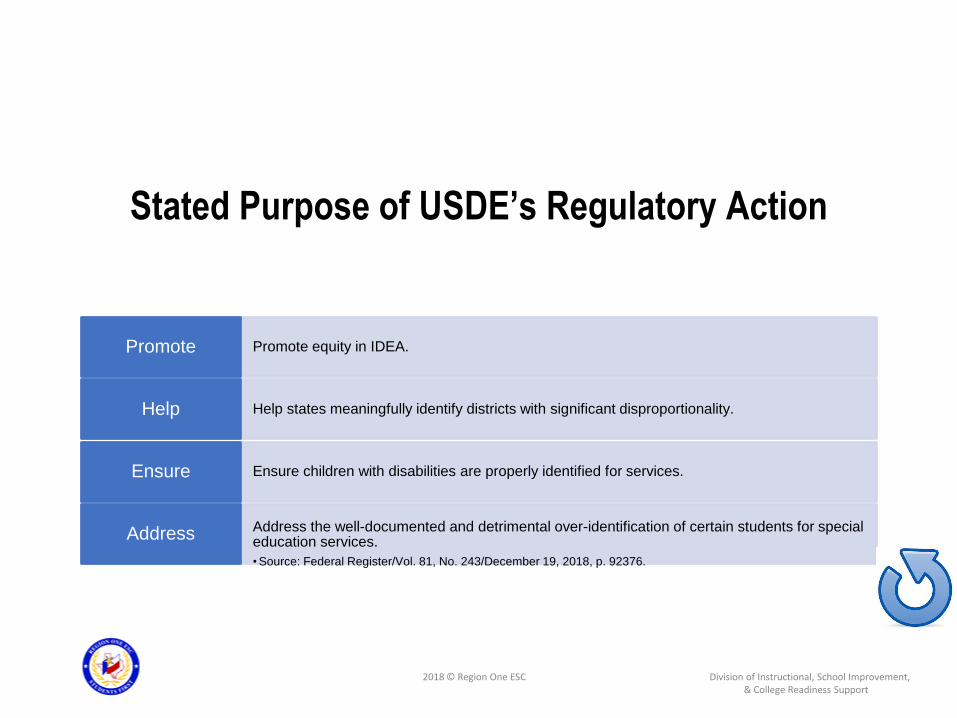
Stated Purpose of USDE’s Regulatory Action
Promote equity in IDEA.Promote
Help states meaningfully identify districts with significant disproportionality.Help
Ensure children with disabilities are properly identified for services.Ensure
Address the well-documented and detrimental over-identification of certain students for special education services.
• Source: Federal Register/Vol. 81, No. 243/December 19, 2018, p. 92376.
Address

2018 © Region One ESC Division of Instructional, School Improvement, & College Readiness Support
Summary of Major Changes to Representation Indicators
These different measures will identify districts that exceed the
threshold for a “disproportionate” level of
students of a particular race/ethnicity or disability category served in special
education.
States need to set thresholds for what is considered
significantly disproportionate and designate any district that
exceeds that threshold as having significant disproportionality.
The threshold has been set at 2.5.

2018 © Region One ESC Division of Instructional, School Improvement, & College Readiness Support
Analysis Categories
Identification
Age Range• Children ages 6-21
• Must also include children ages 3-5 by July 1, 2020
Categories• All Disabilities
• Intellectual Disabilities
• Specific Learning Disabilities
• Emotional Disturbance
• Speech or Language Impairments
• Other Health Impairments
• Autism

2018 © Region One ESC Division of Instructional, School Improvement, & College Readiness Support
Analysis Categories
Placement
Age Range• Children ages 6-21
Categories
• Inside a regular class for less than 40 percent of the day
• Inside separate schools and residential facilities (not including homebound or hospital settings, correctional facilities, or private schools)

2018 © Region One ESC Division of Instructional, School Improvement, & College Readiness Support
Analysis Categories
Discipline
Age Range• Children ages 3-21
Categories
• Out-of-school suspensions and expulsions of 10 days or fewer
• Out-of-school suspensions and expulsions of more than 10 days
• In-school suspensions of 10 days or fewer
• In-school suspensions of more than 10 days
• Disciplinary removals in total
2018 © Region One ESC Division of Instructional, School Improvement, & College Readiness Support
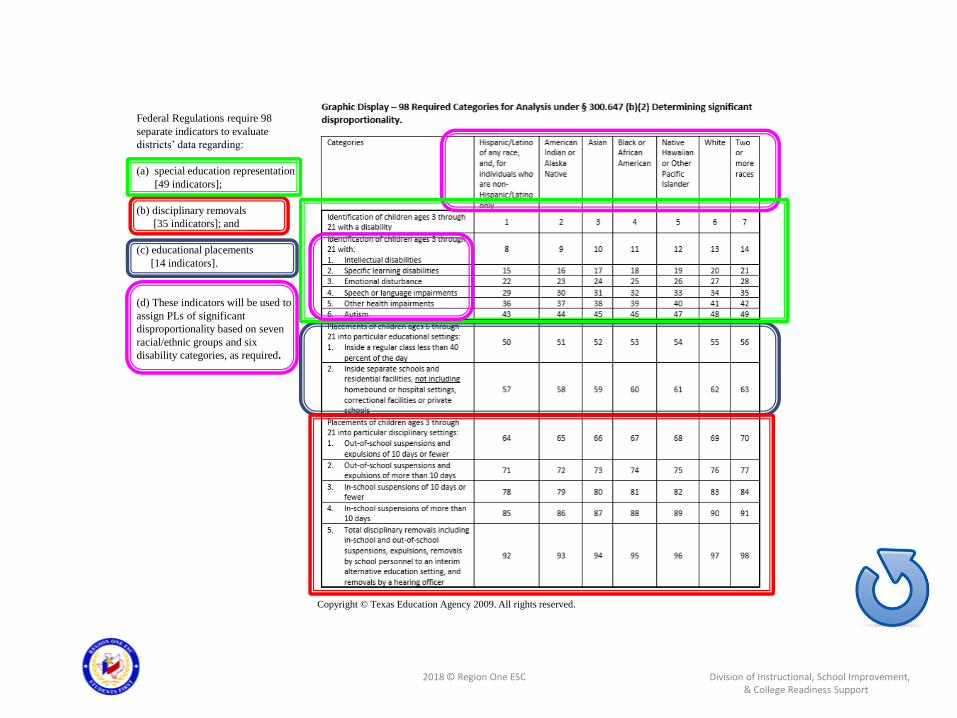
Copyright © Texas Education Agency 2009. All rights reserved.
Federal Regulations require 98
separate indicators to evaluate
districts’ data regarding:
(a) special education representation
[49 indicators];
(b) disciplinary removals
[35 indicators]; and
(c) educational placements
[14 indicators].
(d) These indicators will be used to
assign PLs of significant
disproportionality based on seven
racial/ethnic groups and six
disability categories, as required.

2018 © Region One ESC Division of Instructional, School Improvement, & College Readiness Support
Methodology – Risk Ratio
As compared to the risk for all other children?
Risk Ratio: What is a specific racial/ethnic group’s risk of
Receiving special education and related services for a
particular disability
Being placed in a particular educational environment
Experiencing a particular disciplinary removal
Must calculate a risk ratio for each LEA for each of the racial/ethnic groups for each analysis category (i.e., identification, placement, discipline)

2018 © Region One ESC Division of Instructional, School Improvement, & College Readiness Support
Methodology – Risk Ratio
Identification:
Number of children from racial/ethnic group in disability category
Number of enrolled children from racial/ethnic group
÷
Number of all other children in disability category
Number of all other enrolled children

2018 © Region One ESC Division of Instructional, School Improvement, & College Readiness Support
Methodology – Risk RatioPlacement:
Number of children from racial/ethnic group in placement category
Number of children with disabilities from racial/ethnic group
÷
Number of all other children in placement category
Number of all other children with disabilities
Discipline:
Number of children from racial/ethnic group in discipline category
Number of children with disabilities from racial/ethnic group
÷
Number of all other children in discipline category
Number of all other children with disabilities

2018 © Region One ESC Division of Instructional, School Improvement, & College Readiness Support
• States can choose to identify an LEA as having significant disproportionality only after an LEA exceeds the risk ratio threshold for up to three prior consecutiveyears, including the current reporting year
Consecutive Years
• A state need not identify an LEA with significant disproportionality if the LEA is making “reasonable progress” in lowering the risk ratios, where reasonable progress is determined by the state
Reasonable Progress
2018 © Region One ESC Division of Instructional, School Improvement, & College Readiness Support
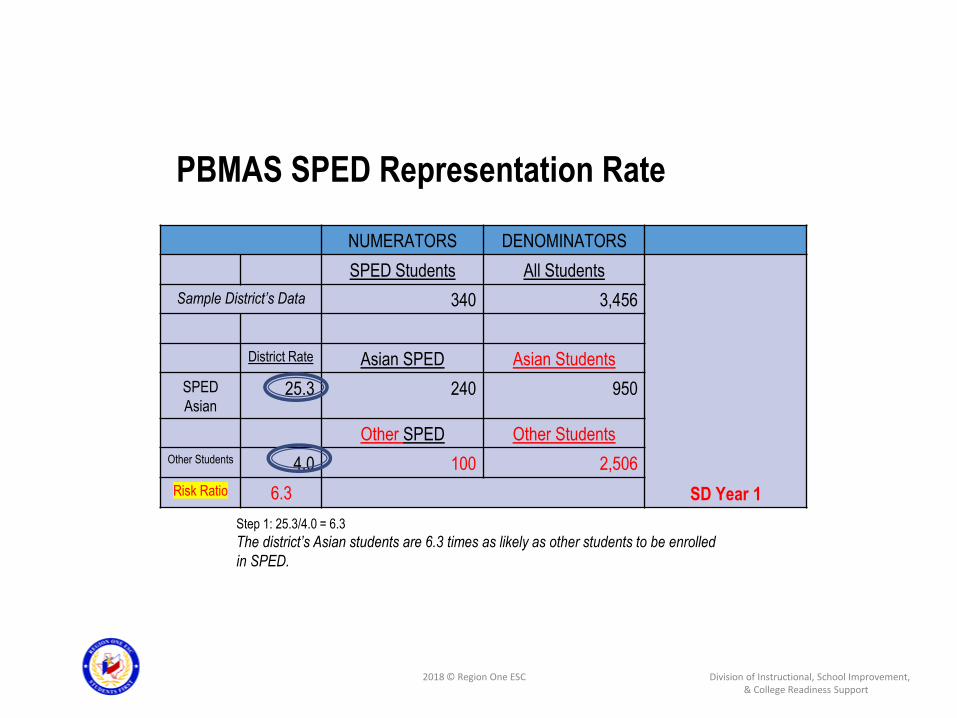
PBMAS SPED Representation Rate
NUMERATORS DENOMINATORS
SPED Students All Students
SD Year 1
Sample District’s Data 340 3,456
District Rate Asian SPED Asian Students
SPED
Asian25.3 240 950
Other SPED Other Students
Other Students 4.0 100 2,506
Risk Ratio 6.3
Step 1: 25.3/4.0 = 6.3
The district’s Asian students are 6.3 times as likely as other students to be enrolled
in SPED.
2018 © Region One ESC Division of Instructional, School Improvement, & College Readiness Support
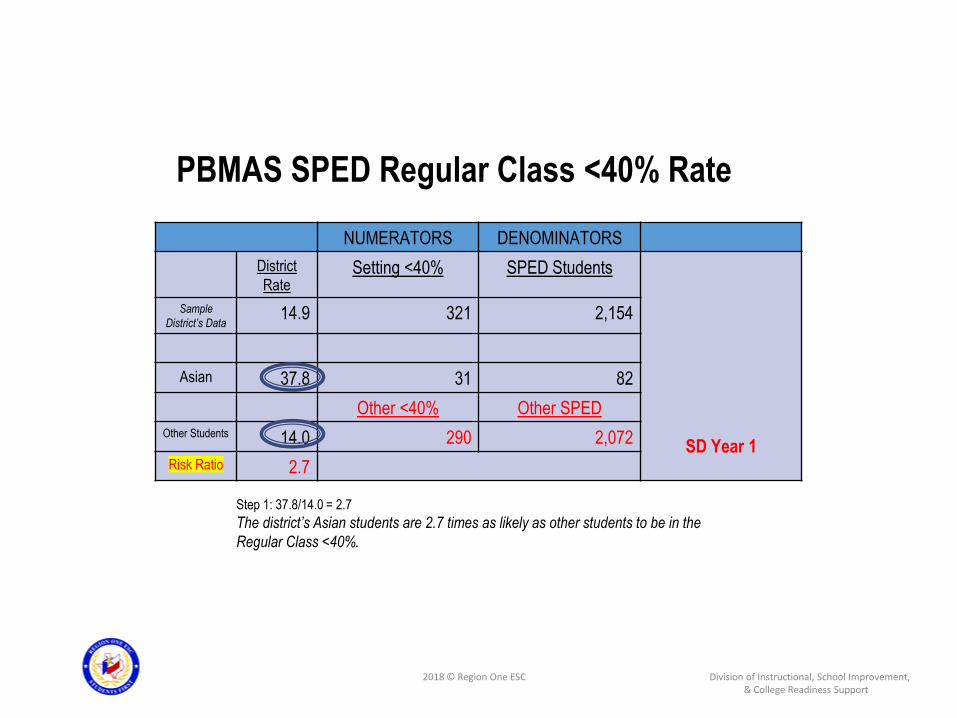
PBMAS SPED Regular Class <40% Rate
NUMERATORS DENOMINATORS
District
RateSetting <40% SPED Students
SD Year 1
Sample
District’s Data14.9 321 2,154
Asian 37.8 31 82
Other <40% Other SPED
Other Students 14.0 290 2,072
Risk Ratio 2.7
Step 1: 37.8/14.0 = 2.7
The district’s Asian students are 2.7 times as likely as other students to be in the
Regular Class <40%.

2018 © Region One ESC Division of Instructional, School Improvement, & College Readiness Support
Reasonable Progress
§300.647(d)(2): A State is not required to identify a district for
significant disproportionality until…the district has exceeded the risk ratio threshold and has
failed to demonstrate reasonable progress.
Reasonable Progress is lowering the risk ratio in each of
two consecutive prior years.

2018 © Region One ESC Division of Instructional, School Improvement, & College Readiness Support
Reasonable Progress
Example SD Year 1 SD Year 2 SD Year 3 RP?
District A 4.9 4.3 3.6 Yes
District B 4.9 3.6 4.3 No
• In this example, the risk ratio threshold is >3.0.
• Both districts started at the same place two years ago (SD Year 1).
• Both districts exceed the threshold in the current year (SD Year 3).
• Both districts reduced their risk ratio between SD Year 1 and SD Year 3.
State threshold is 2.5

2018 © Region One ESC Division of Instructional, School Improvement, & College Readiness Support
Reasonable Progress
Example SD Year 1 SD Year 2 SD Year 3 RP?
District A 4.9 4.3 3.6 Yes
District B 4.9 3.6 4.3 No
• However, per federal regulations, District B does not get RP because
its ratio increased from 3.6 to 4.3 between SD Years 2 and 3.
2018 © Region One ESC Division of Instructional, School Improvement, & College Readiness Support
Staging

2018 © Region One ESC Division of Instructional, School Improvement, & College Readiness Support
2017-2018 Staging Framework
Stage BE/ESL CTE ESSA SPED
1 1.1 – 1.2 0.2 – 0.8 0.2 – 0.9 0.1 – 1.3
2 1.3 – 1.7 0.9 – 1.3 1.0 – 1.5 1.4 – 1.5
3 1.8 – 2.0 1.4 – 1.5 1.6 – 2.2 1.6 – 1.8
4 2.1 – 3.2 1.6 – 2.4 2.3 – 3.0 1.9 – 2.2
Mean Ranges by Program Area for a 90%/10% Distribution
S
T
A
G
E
S
4 PBMAS PROGRAMS
0.2 -1.2

2018 © Region One ESC Division of Instructional, School Improvement, & College Readiness Support
Ongoing implementation of the PBMAS will include the addition of new indicators, revision of
current indicators, and deletion of indicators that are no longer necessary. Factors independent
from the PBMAS itself are also likely to have an impact on the future versions of PBMAS. These
factors include the following:
• legislatively required changes to the statewide assessment program, STAAR;
• changes resulting from reauthorizations of federal statutes, including the Elementary and
Secondary Education Act;
• results of any state or federal reviews, guidance, and regulations;
• changes to data collection definitions and processes; and
• legislation from a regular or special legislative session
2018 © Region One ESC Division of Instructional, School Improvement, & College Readiness Support
PBMAS 2018Bilingual/ESL

2018 © Region One ESC Division of Instructional, School Improvement, & College Readiness Support
Bilingual Education/English as a Second LanguageBE/ESL (Indicators 1-9)
• ELs are advancing academically and performing satisfactorily on state assessments
• ELs Not Served in BE or ESL are advancing academically and performing satisfactorily on state assessments
• ELs are graduating and not dropping out of school
• ELs grades 2-12 are not scoring beginning proficiency level for two consecutive years on TELPAS Reading
• ELs grades 5-12, 5 + years demonstrate progress on TELPAS Composite rating and are not continuing to be rated B or I

2018 © Region One ESC Division of Instructional, School Improvement, & College Readiness Support
REPORT
ONLY
2018 © Region One ESC Division of Instructional, School Improvement, & College Readiness Support
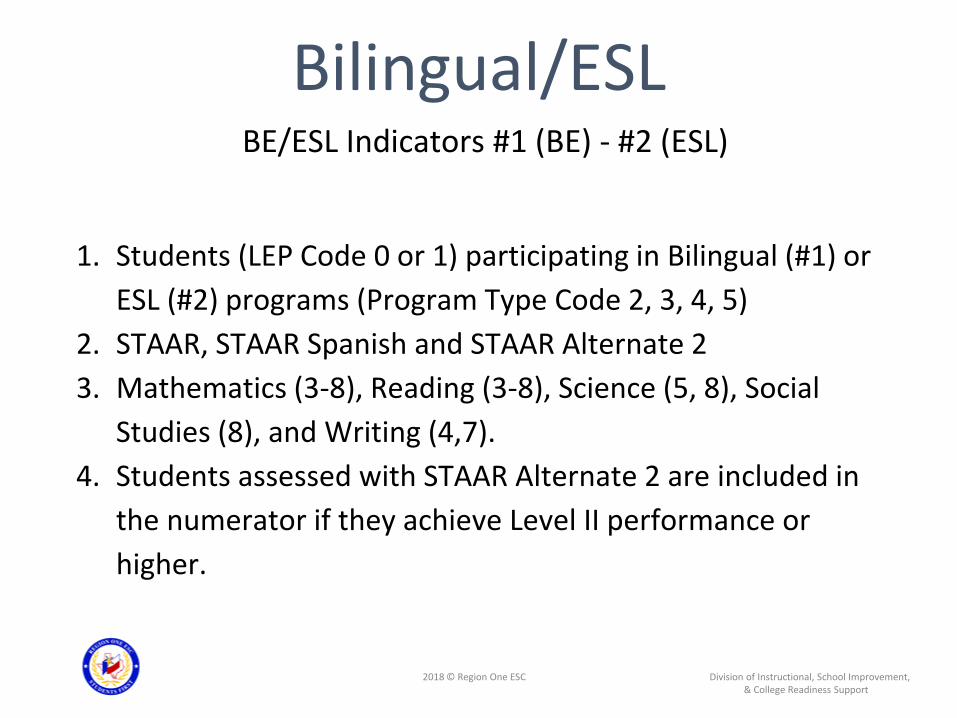
Bilingual/ESL BE/ESL Indicators #1 (BE) - #2 (ESL)
1. Students (LEP Code 0 or 1) participating in Bilingual (#1) or
ESL (#2) programs (Program Type Code 2, 3, 4, 5)
2. STAAR, STAAR Spanish and STAAR Alternate 2
3. Mathematics (3-8), Reading (3-8), Science (5, 8), Social
Studies (8), and Writing (4,7).
4. Students assessed with STAAR Alternate 2 are included in
the numerator if they achieve Level II performance or
higher.

2018 © Region One ESC Division of Instructional, School Improvement, & College Readiness Support
Bilingual/ESL BE/ESL Indicator #3 (Denials)
1. EL students (LEP Code 1) NOT participating in Bilingual or
ESL programs (Parental Permission Code C and Program
Type Code 0).
2. STAAR, STAAR Spanish and STAAR Alternate 2
3. Mathematics (3-8), Reading (3-8), Science (5,8), Social
Studies (8), and Writing (4,7).
4. Students assessed with STAAR Alternate 2 are included in
the numerator if they achieve Level II performance or
higher.

2018 © Region One ESC Division of Instructional, School Improvement, & College Readiness Support
Bilingual/ESL BE/ESL Indicator #4 (Year After Exit)
1. Monitored Year 1 students (LEP Code F).
2. STAAR and STAAR Alternate 2.
3. Mathematics (3-8), Reading (3-8), Science (5, 8), Social
Studies (8), and Writing (4,7).
4. Students assessed with STAAR Alternate 2 are included in
the numerator if they achieve Level II performance or
higher.

2018 © Region One ESC Division of Instructional, School Improvement, & College Readiness Support
Bilingual/ESLBE/ESL Indicator #5: EOC
1. Current EL students taking EOCs (LEP Code 1).
2. The LEP STAAR EOC passing rate is based on STAAR and
STAAR Alternate 2 results from the following EOC
assessments, as applicable: Mathematics (Algebra I), Science
(Biology), Social Studies (U.S. History), and English Language
Arts (English I and II).
3. Students assessed with STAAR Alternate 2 EOC are included
in the numerator if they achieve Level II performance or
higher.

2018 © Region One ESC Division of Instructional, School Improvement, & College Readiness Support
Bilingual/ESL BE/ESL Indicator #6: LEP Drop-Out
Dropout data are for the 2016-2017 school year and are the
most current data available for use in the 2018 PBMAS.
PL 0 = 0% - 1.8%
PL 1 = 1.9% - 3.3%
PL 2 = 3.4% - 5.3%
PL 3 = 5.4% - 100%
2018 © Region One ESC Division of Instructional, School Improvement, & College Readiness Support
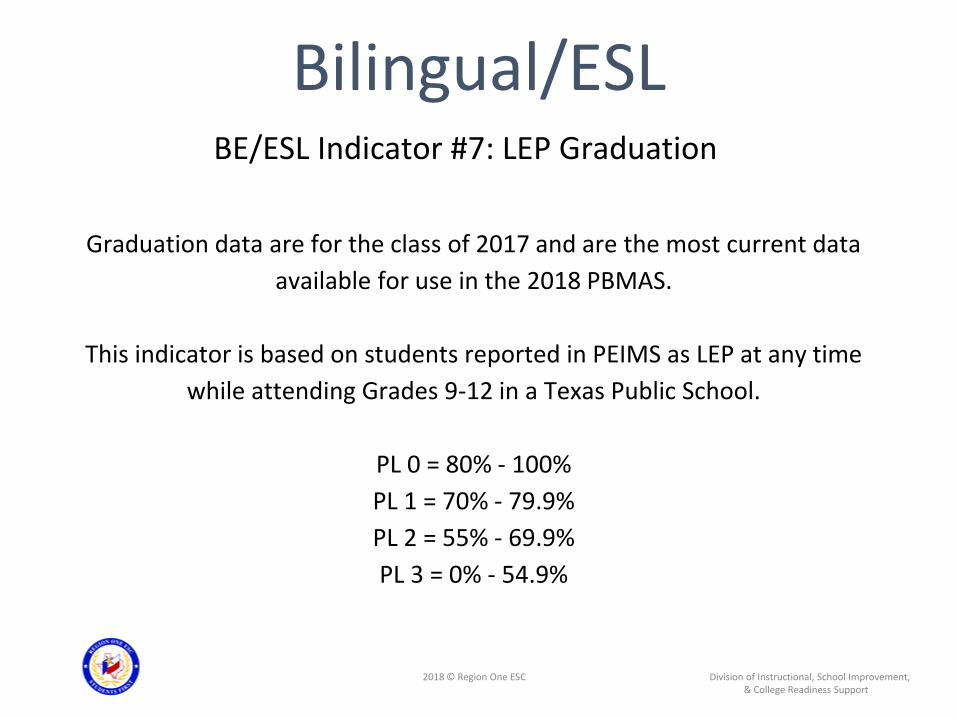
Bilingual/ESL BE/ESL Indicator #7: LEP Graduation
Graduation data are for the class of 2017 and are the most current data
available for use in the 2018 PBMAS.
This indicator is based on students reported in PEIMS as LEP at any time
while attending Grades 9-12 in a Texas Public School.
PL 0 = 80% - 100%
PL 1 = 70% - 79.9%
PL 2 = 55% - 69.9%
PL 3 = 0% - 54.9%
2018 © Region One ESC Division of Instructional, School Improvement, & College Readiness Support
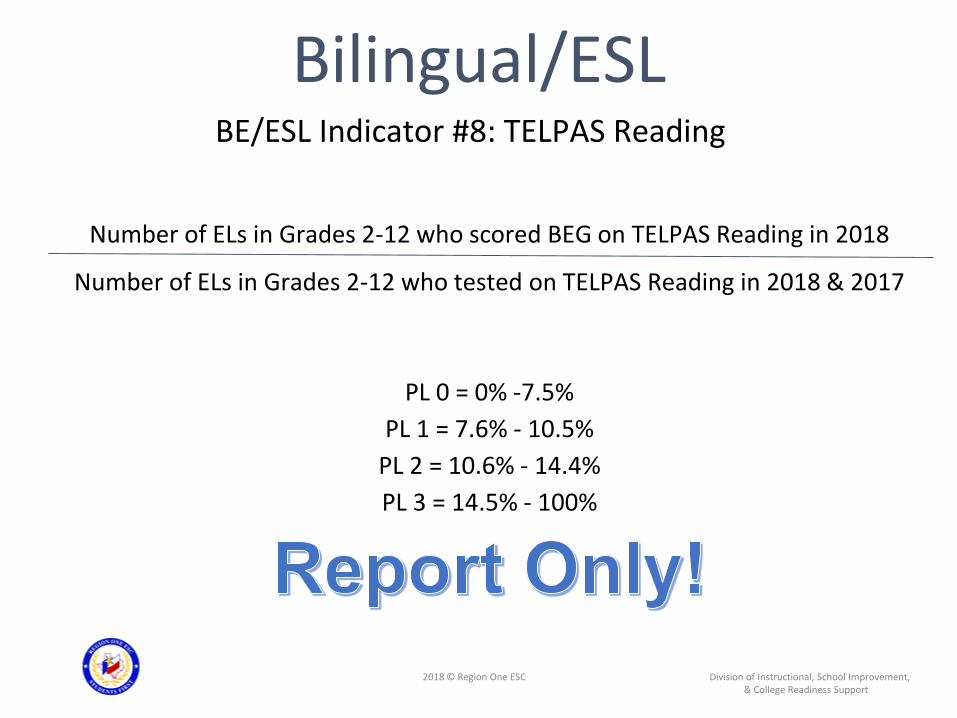
Bilingual/ESL BE/ESL Indicator #8: TELPAS Reading
Number of ELs in Grades 2-12 who scored BEG on TELPAS Reading in 2018
Number of ELs in Grades 2-12 who tested on TELPAS Reading in 2018 & 2017
PL 0 = 0% -7.5%
PL 1 = 7.6% - 10.5%
PL 2 = 10.6% - 14.4%
PL 3 = 14.5% - 100%

2018 © Region One ESC Division of Instructional, School Improvement, & College Readiness Support
Bilingual/ESL BE/ESL Indicator #9: TELPAS Composite
Number of ELs in Grades 5-12 (5+ Yrs) with TELPAS Composite BEG or INT
(who did not meet STAAR/EOC English satisfactory academic performance)
Number of ELs in Grades 5-12 (5+ Yrs) with a TELPAS Composite rating
PL 0 = 0% -7.5%
PL 1 = 7.6% - 10.5%
PL 2 = 10.6% - 14.4%
PL 3 = 14.5% - 100%
2018 © Region One ESC Division of Instructional, School Improvement, & College Readiness Support
2018 © Region One ESC Division of Instructional, School Improvement, & College Readiness Support
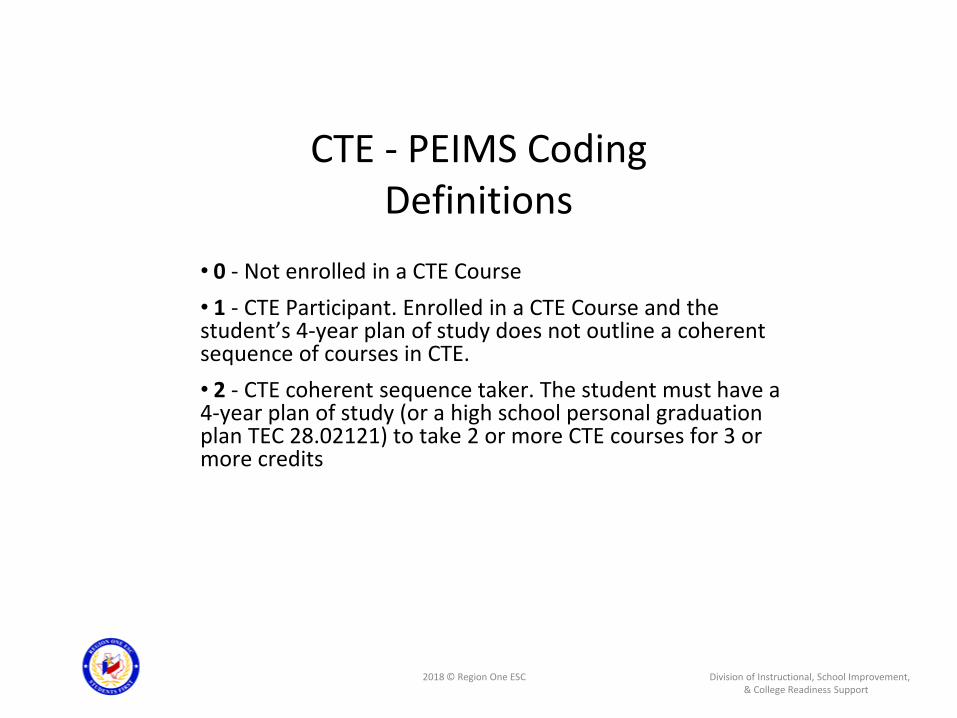
• 0 - Not enrolled in a CTE Course
• 1 - CTE Participant. Enrolled in a CTE Course and the student’s 4-year plan of study does not outline a coherent sequence of courses in CTE.
• 2 - CTE coherent sequence taker. The student must have a 4-year plan of study (or a high school personal graduation plan TEC 28.02121) to take 2 or more CTE courses for 3 or more credits
CTE - PEIMS CodingDefinitions

2018 © Region One ESC Division of Instructional, School Improvement, & College Readiness Support
Career & Technical Education
(PBMAS - Indicators 1-8)Students being served by Career and Technical Education (CTE) are advancing academically and performing satisfactorily on state assessments and other areas:
1. All CTE Students STAAR EOC Passing Rate2. CTE LEP STAAR EOC Passing Rate3. CTE Economically Disadvantage EOC Passing Rate4. CTE SPED EOC Passing Rate5. CTE Annual Dropout Rate (Grades 9-12)6. CTE Graduation Rate7. CTE Nontraditional Course Completion rate - Males8. CTE Nontraditional Course Completion Rate - Females

2018 © Region One ESC Division of Instructional, School Improvement, & College Readiness Support

2018 © Region One ESC Division of Instructional, School Improvement, & College Readiness Support
Career & Technical Education (PBMAS -Indicators 1-8)
2018 © Region One ESC Division of Instructional, School Improvement, & College Readiness Support
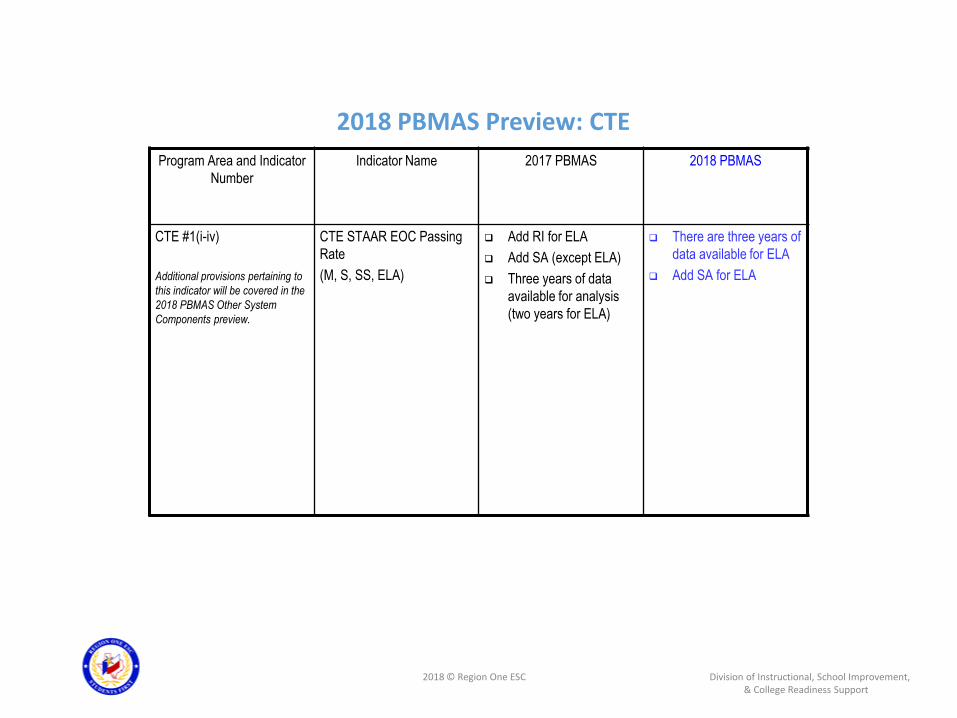
2018 PBMAS Preview: CTE
Program Area and Indicator
Number
Indicator Name 2017 PBMAS 2018 PBMAS
CTE #1(i-iv)
Additional provisions pertaining to
this indicator will be covered in the
2018 PBMAS Other System
Components preview.
CTE STAAR EOC Passing
Rate
(M, S, SS, ELA)
❑ Add RI for ELA
❑ Add SA (except ELA)
❑ Three years of data
available for analysis
(two years for ELA)
❑ There are three years of
data available for ELA
❑ Add SA for ELA

2018 © Region One ESC Division of Instructional, School Improvement, & College Readiness Support
2018 PBMAS Preview: CTE
Program Area and Indicator
Number
Indicator Name 2017 PBMAS 2018 PBMAS
CTE #2(i-iv)
Additional provisions pertaining to
this indicator will be covered in the
2018 PBMAS Other System
Components preview.
CTE LEP STAAR EOC
Passing Rate
(M, S, SS, ELA)
❑ Add RI for ELA
❑ Add PL 4 for ELA
❑ Add SA (except ELA)
❑ Three years of data
available for analysis
(two years for ELA)
❑ There are three years of
data available for ELA
❑ Add SA for ELA

2018 © Region One ESC Division of Instructional, School Improvement, & College Readiness Support
2018 PBMAS Preview: CTEProgram Area and Indicator
Number
Indicator Name 2017 PBMAS 2018 PBMAS
CTE #3(i-iv)
Additional provisions pertaining to
this indicator will be covered in the
2018 PBMAS Other System
Components preview.
CTE Economically
Disadvantaged STAAR EOC
Passing Rate
(M, S, SS, ELA)
❑ Add RI for ELA
❑ Add SA (except ELA)
❑ Three years of data
available for analysis
(two years for ELA)
❑ There are three years of
data available for ELA
❑ Add SA for ELA

2018 © Region One ESC Division of Instructional, School Improvement, & College Readiness Support
2018 PBMAS Preview: CTEProgram Area and Indicator
Number
Indicator Name 2017 PBMAS 2018 PBMAS
CTE #4(i-iv)
Additional provisions
pertaining to this indicator
will be covered in the 2018
PBMAS Other System
Components preview.
CTE SPED STAAR EOC
Passing Rate
(M, S, SS, ELA)
❑ Add RI for ELA
❑ Add PL 4 for ELA
❑ Add SA (except ELA)
❑ Three years of data
available for analysis
(two years for ELA)
❑ There are three years of
data available for ELA
❑ Add SA for ELA

2018 © Region One ESC Division of Instructional, School Improvement, & College Readiness Support
2018 PBMAS Preview: CTE
Program Area and Indicator
Number
Indicator Name 2017 PBMAS 2018 PBMAS
CTE #5 CTE Annual Dropout Rate
(Grades 9-12)
❑ No Changes ❑ No Changes
CTE #6 CTE Graduation Rate ❑ No Changes ❑ No Changes

2018 © Region One ESC Division of Instructional, School Improvement, & College Readiness Support
2018 PBMAS Preview: CTE
Program Area and
Indicator Number
Indicator Name 2017 PBMAS 2018 PBMAS
CTE #7 CTE Nontraditional
Course Completion Rate-
Males
❑ Implement new
course list
❑ Report Only
❑ One year of data
available for
analysis
❑ No RI or SA
❑ Add PL
Assignment
PL0- 40.0%-
100%
PL1- 23.0%-
39.9%
PL2- 15.0%-
22.9%
PL3- 0%-
14.9%
CTE #8 CTE Nontraditional
Course Completion Rate-
Females
❑ Implement new
course list
❑ Report Only
❑ One year of data
available for
analysis
❑ No RI or SA
❑ Add PL
Assignment
PL0- 40.0%-
100%
PL1- 23.0%-
39.9%
PL2- 15.0%-
22.9%
PL3- 0%-
14.9%
* Two courses removed from Nontraditional for Females 2018, Practicum in Transportation, Distribution and Logistics I and II

2018 © Region One ESC Division of Instructional, School Improvement, & College Readiness Support
Every Student Succeeds ActTitle I, Part A / Title I, Part C
(ESSA)
2018 © Region One ESC Division of Instructional, School Improvement, & College Readiness Support
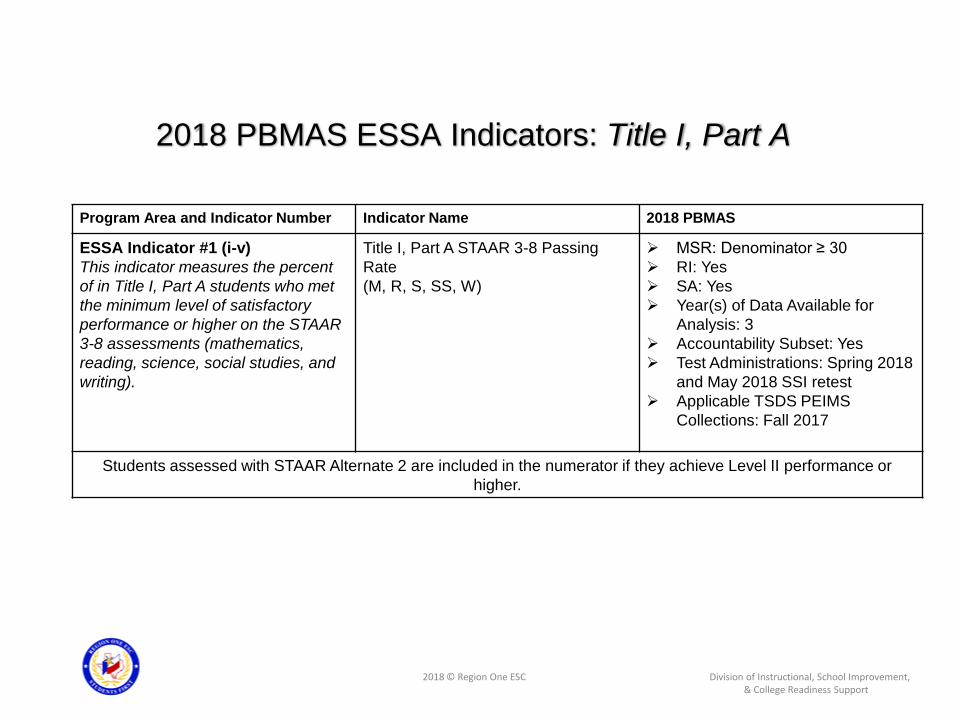
Program Area and Indicator Number Indicator Name 2018 PBMAS
ESSA Indicator #1 (i-v)
This indicator measures the percent
of in Title I, Part A students who met
the minimum level of satisfactory
performance or higher on the STAAR
3-8 assessments (mathematics,
reading, science, social studies, and
writing).
Title I, Part A STAAR 3-8 Passing
Rate
(M, R, S, SS, W)
➢ MSR: Denominator ≥ 30
➢ RI: Yes
➢ SA: Yes
➢ Year(s) of Data Available for
Analysis: 3
➢ Accountability Subset: Yes
➢ Test Administrations: Spring 2018
and May 2018 SSI retest
➢ Applicable TSDS PEIMS
Collections: Fall 2017
Students assessed with STAAR Alternate 2 are included in the numerator if they achieve Level II performance or
higher.
2018 PBMAS ESSA Indicators: Title I, Part A

2018 © Region One ESC Division of Instructional, School Improvement, & College Readiness Support
Program Area and Indicator Number Indicator Name 2018 PBMAS
ESSA Indicator #2 (i-iv)
This indicator measures the percent
of Title I, Part A students who met the
minimum level of satisfactory
performance or higher on the STAAR
EOC assessments (mathematics,
science, social studies, and English
language arts).
Title I, Part A STAAR EOC Passing
Rate (M, S, SS, ELA)
➢ MSR: Denominator ≥ 30
➢ RI: Yes
➢ SA: Yes (English language arts)
(New!)
➢ Year(s) of Data Available for
Analysis: 3
➢ Accountability Subset: Yes
➢ Test Administrations: Summer
2017, Fall 2017, and Spring 2018
➢ Applicable TSDS PEIMS
Collections: Fall 2016 and Fall
2017
Students assessed with STAAR Alternate 2 EOC are included in the numerator if they achieve Level II performance or
higher.
The performance standard in place when a student first takes an EOC assessment is the standard that is maintained
throughout the student’s school career.
2018 PBMAS ESSA Indicators: Title I, Part A
2018 © Region One ESC Division of Instructional, School Improvement, & College Readiness Support
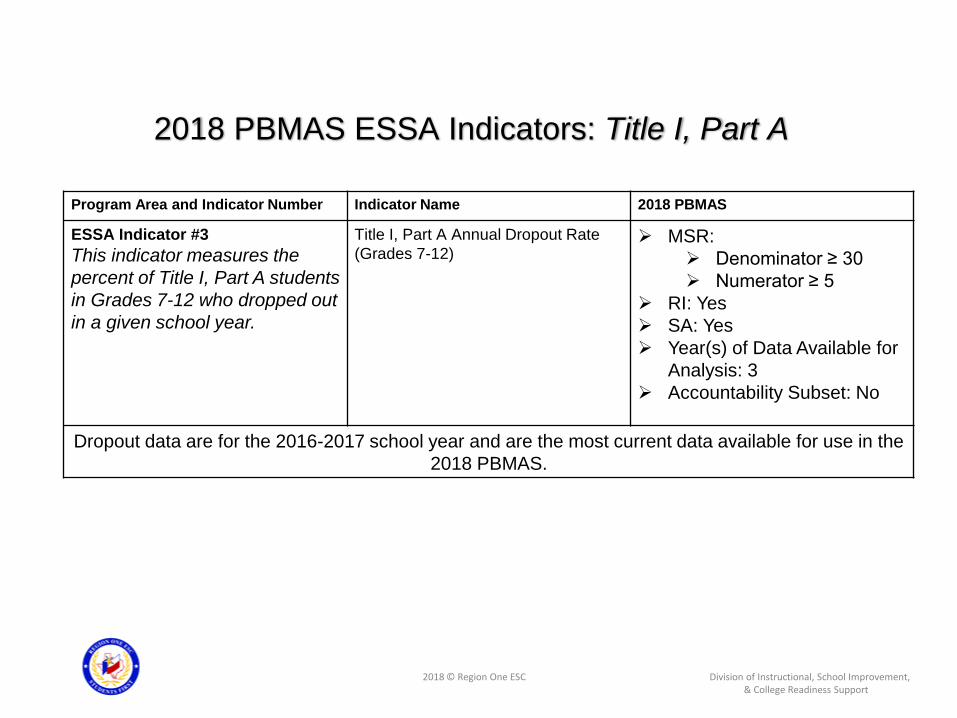
Program Area and Indicator Number Indicator Name 2018 PBMAS
ESSA Indicator #3
This indicator measures the
percent of Title I, Part A students
in Grades 7-12 who dropped out
in a given school year.
Title I, Part A Annual Dropout Rate
(Grades 7-12)➢ MSR:
➢ Denominator ≥ 30
➢ Numerator ≥ 5
➢ RI: Yes
➢ SA: Yes
➢ Year(s) of Data Available for
Analysis: 3
➢ Accountability Subset: No
Dropout data are for the 2016-2017 school year and are the most current data available for use in the
2018 PBMAS.
2018 PBMAS ESSA Indicators: Title I, Part A
2018 © Region One ESC Division of Instructional, School Improvement, & College Readiness Support
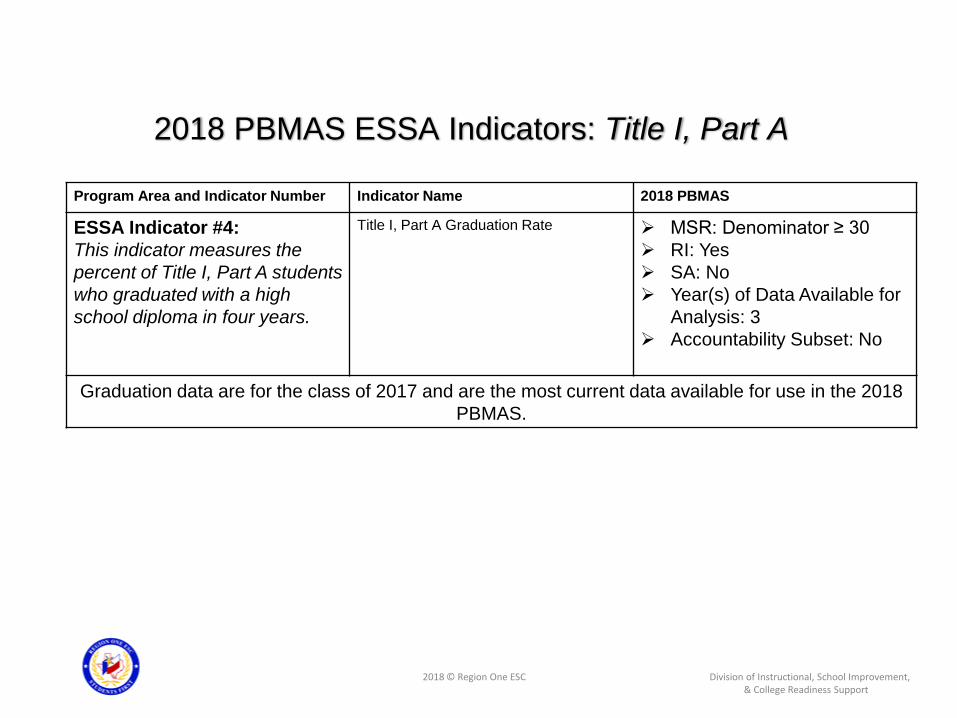
Program Area and Indicator Number Indicator Name 2018 PBMAS
ESSA Indicator #4:
This indicator measures the
percent of Title I, Part A students
who graduated with a high
school diploma in four years.
Title I, Part A Graduation Rate ➢ MSR: Denominator ≥ 30
➢ RI: Yes
➢ SA: No
➢ Year(s) of Data Available for
Analysis: 3
➢ Accountability Subset: No
Graduation data are for the class of 2017 and are the most current data available for use in the 2018
PBMAS.
2018 PBMAS ESSA Indicators: Title I, Part A
2018 © Region One ESC Division of Instructional, School Improvement, & College Readiness Support
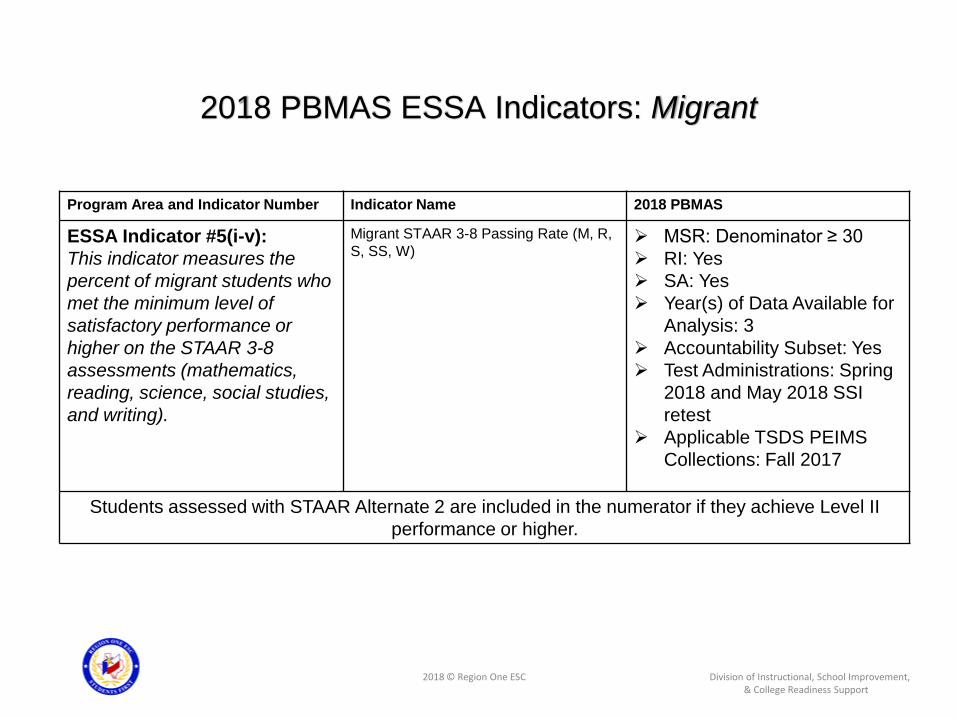
Program Area and Indicator Number Indicator Name 2018 PBMAS
ESSA Indicator #5(i-v):
This indicator measures the
percent of migrant students who
met the minimum level of
satisfactory performance or
higher on the STAAR 3-8
assessments (mathematics,
reading, science, social studies,
and writing).
Migrant STAAR 3-8 Passing Rate (M, R,
S, SS, W)➢ MSR: Denominator ≥ 30
➢ RI: Yes
➢ SA: Yes
➢ Year(s) of Data Available for
Analysis: 3
➢ Accountability Subset: Yes
➢ Test Administrations: Spring
2018 and May 2018 SSI
retest
➢ Applicable TSDS PEIMS
Collections: Fall 2017
Students assessed with STAAR Alternate 2 are included in the numerator if they achieve Level II
performance or higher.
2018 PBMAS ESSA Indicators: Migrant

2018 © Region One ESC Division of Instructional, School Improvement, & College Readiness Support
Program Area and Indicator Number Indicator Name 2018 PBMAS
ESSA Indicator #6(i-iv):
This indicator measures the
percent of migrant students who
met the minimum level of
satisfactory performance or
higher on the STAAR EOC
assessments (mathematics,
science, social studies, and
English language arts).
Migrant STAAR EOC Passing
Rate (M, S, SS, ELA)
➢ MSR: Denominator ≥ 30
➢ RI: Yes
➢ SA: Yes (English language
arts) (New!)
➢ Year(s) of Data Available for
Analysis: 3
➢ Accountability Subset: Yes
➢ Test Administrations:
Summer 2017, Fall 2017,
and Spring 2018
➢ Applicable TSDS PEIMS
Collections: Fall 2016 and
Fall 2017
Students assessed with STAAR Alternate 2 EOC are included in the numerator if they achieve Level
II performance or higher.
The performance standard in place when a student first takes an EOC assessment is the standard
that is maintained throughout the student’s school career.
2018 PBMAS ESSA Indicators: Migrant

2018 © Region One ESC Division of Instructional, School Improvement, & College Readiness Support
Program Area and Indicator Number Indicator Name 2018 PBMAS
ESSA Indicator #7:
This indicator measures the
percent of migrant students in
Grades 7-12 who dropped out in
a given school year.
Migrant Annual Dropout Rate
(Grades 7-12)
➢ MSR:
➢ Denominator ≥ 30
➢ Numerator ≥ 5
➢ RI: Yes
➢ SA: Yes
➢ Year(s) of Data Available for
Analysis: 3
➢ Accountability Subset: No
Dropout data are for the 2016-2017 school year and are the most current data available for use in the
2018 PBMAS.
2018 PBMAS ESSA Indicators: Migrant

2018 © Region One ESC Division of Instructional, School Improvement, & College Readiness Support
Program Area and Indicator Number Indicator Name 2018 PBMAS
ESSA Indicator #8:
This indicator measures the
percent of migrant students who
graduated with a high school
diploma in four years.
Migrant Graduation Rate ➢ MSR: Denominator ≥ 30
➢ RI: Yes
➢ SA: No
➢ Year(s) of Data Available for
Analysis: 3
➢ Accountability Subset: No
Graduation data are for the class of 2017 and are the most current data available for use in the 2018
PBMAS.
2018 PBMAS ESSA Indicators: Migrant

2018 © Region One ESC Division of Instructional, School Improvement, & College Readiness Support
Engaging in the Continuous Improvement Process

2018 © Region One ESC Division of Instructional, School Improvement, & College Readiness Support
PBMAS ContactsDivision of Instructional, School Improvement and College Readiness Support
Ruben Degollado, Coordinator956 984-6185
Benjamin Macias, Specialist956 984-6234
Eduardo Garcia, Specialist956 984-6243
Todd Larson, Coordinator956 984-6203
Carol Campos, Coordinator 956-984-6205
Karina Chapa, Director956 984-6246
Dr. Belinda S. Gorena, Administrator956 984-6173


