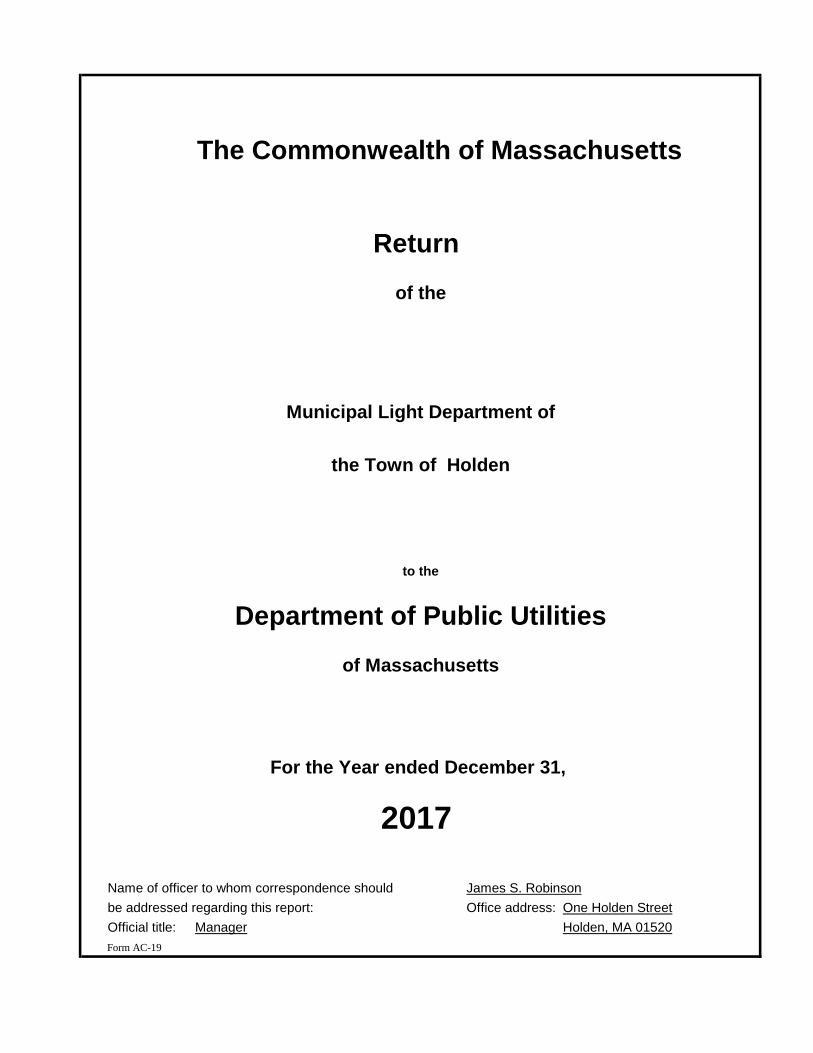
The Commonwealth of Massachusetts Return of the Municipal Light Department of the Town of Holden to the Department of Public Utilities of Massachusetts For the Year ended December 31, 2017 Name of officer to whom correspondence should James S. Robinson be addressed regarding this report: Office address: One Holden Street Official title: Manager Holden, MA 01520 Form AC-19
Transcript
The Commonwealth of Massachusetts
Return
of the
Municipal Light Department of
the Town of Holden
to the
Department of Public Utilities
of Massachusetts
For the Year ended December 31,
2017
Name of officer to whom correspondence should James S. Robinson
be addressed regarding this report: Office address: One Holden Street
Official title: Manager Holden, MA 01520
Form AC-19
324 Grove Street Worcester MA, 01605 • 54 East Main Street Webster MA, 01570
29 Total General Plant 6,249,930 164,930 (40,840) - - 6,374,020
30 Total Electric Plant in Service 27,123,061 916,088 (75,938) (33,007) - 27,930,204
31 Total Cost of Electric Plant.................... 27,930,204
33 Less Cost of Land, Land Rights, Rights of Way................. 72,500
34 Total Cost upon which Depreciation is based ........................ 27,857,704
The above figures should show the original cost of the existing property. In case any part of the property is sold or retired, the cost of such property
should be deducted from the cost of the plant. The net cost of the property, less the land value, should be taken as a basis for figuring depreciation.
Page 9 Annual Report of the Town of Holden Year Ended December 31, 2017
PAGE 9 IS A BLANK PAGE
Annual Report of the Town of Holden Year Ended December 31, 2017 Page 10
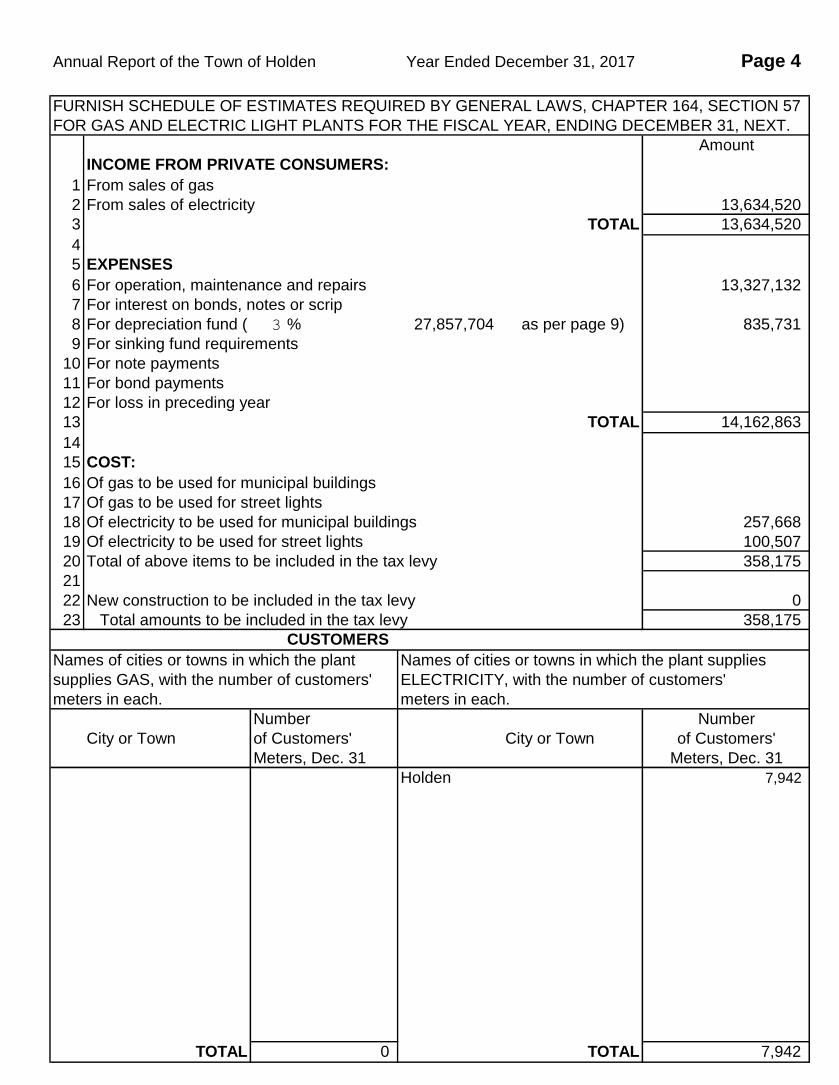
21 Ratio of operating expenses to operating revenues 103.95%
(carry out decimal two places, (e.g.. 0.00%)
Compute by dividing Revenues (Acct 400) into the sum of Operation
and Maintenance Expenses (Page 42, line 20 (d), Depreciation (Acct 403)
and Amortization (Acct 407)
22 Total salaries and wages of electric department for year, including 1,730,037
amounts charged to operating expenses, construction and other
accounts.
23 Total number of employees of electric department at end of year 23
including administrative, operating, maintenance, construction and
other employees (including part-time employees)
Next Page is 49
Page 49 Annual Report of the Town of Holden Year Ended December 31, 2017
TAXES CHARGED DURING THE YEAR
1. This schedule is intended to give the account distribution of total 3. The aggregate of each kind of tax should be listed under the appropriate 5. For any tax which it was necessary to apportion
taxes charged to operations and other final accounts during the year. heading of "Federal", "State" and "Local" in such manner that the total tax more than one utility department account, state in a
2. Do not include gasoline and other sales taxes which have been for each State and for all subdivisions can be readily ascertained. footnote the basis of apportioning such tax.
charged to accounts to which the material on which the tax was levied 4. The accounts to which the taxes charged were distributed should be 6. Do not include in this schedule entries with respect
which the tax was levied was charged. If the actual or estimated amounts shown in columns (c) to (h). Show both the utility department and number to deferred income taxes, or taxes collected through
of such taxes are known, they should be shown as a footnote and of account charged. For taxes charged to utility plant show the number of payroll deductions or otherwise pending transmittal
designated whether estimated or actual amounts the appropriate balance sheet plant account or subaccount. of such taxes to the taxing authority.
Total Taxes
Charged
Line Kind of Tax During Year Electric Gas
No. (a) (omit cents) Acct 408,409 Acct 408,409
(b) (c) (d) (e) (f) (g) (h) (i)
1
2
3
4
5
7
8
9
10
11
12
13
14
15
16
17
18
19
20
21
22
23
24
25
26
27
28
29
30
31
32
33 TOTALS
Annual Report of the Town of Holden Year Ended December 31, 2017 Page 50OTHER UTILITY OPERATING INCOME (Account 414)
Report below the particulars called for in each column
Amount Gain or
Amount of Amount of of Operating (Loss) from
Line Property Investment Department Expenses Operation
No. (a) (b) (c) (d) (e)
1
2
3
4
5
6
7
8
9
10
11
12
13
14
15
16
17
18
19
20
21
22
23
24
25
26
27
28
29
30
31
32
33
34
35
36
37
38
39
40
41
42
43
44
45
46
47
48
49
50
51 TOTALS
Annual Report of the Town of Holden Page 51
Report by utility departments the revenue, costs, expenses, and net income from merchandising, jobbing,
and contract work during the year.
Electric Gas Other Utility
Line Item Department Department Department Total
No. (a) (b) (c) (d) (e)
1 Revenues:
2 Merchandise sales, less discounts, - -
3 allowances and returns - -
4 Contract work (9,308) (9,308)
5 Commissions - -
6 Other (list according to major classes) - -
7
8
9
10 Total Revenues (9,308) - - (9,308)
11
12
13 Costs and Expenses:
14 Cost of sales (list according to major
15 classes of cost)
16
17 Materials
18 Outside Service Labor
19
20
21
22
23
24
25
26 Sales Expenses
27 Customer accounts expenses
28 Administrative and general expenses
29
30
31
32
33
34
35
36
37
38
39
40
41
42
43
44
45
46
47
48
49
50 TOTAL COSTS AND EXPENSES - - - -
51 Net Profit (or loss) (9,308) - - (9,308)
Year Ended December 31, 2017
INCOME FROM MERCHANDISE, JOBBING, AND CONTRACT WORK (Account 415)
Annual report of the Town of Holden Year Ended December 31, 2017 Page 52
SALES FOR RESALE (Account 447)
1. Report sales during year to other electric utilities and and place and "x" in column (c) if sale involves export across
to cities or other public authorities for distribution to a state line.
ultimate consumers. 3. Report separately firm, dump, and other power sold to
2. Provide subheadings and classify sales as to (1) Associ- the same utility. Describe the nature of any sales classified
ated Utilities, (2) Nonassociated Utilities, (3) Municipalities, as Other Power, column (b).
(4) R.E.A. Cooperatives, and (5) Other Public Authorities. 4. If delivery is made at a substation indicate ownership
For each sale designate statistical classification in column (b), in column (e), thus: respondent owned or leased, RS;
thus: firm power, FP; dump or surplus power, DP; other, G, customer owned or leased, CS.
Export Kw or Kva of Demand
Across Avg mo. Annual
Statistical State Sub Contract Maximum Maximum
Line Sales to: Classification Line Point of Delivery Station Demand Demand Demand
No. (a) (b) (c) (d) (e) (f) (g) (h)
1
2
3
4
5
6
7
8
9
10
11
12
13
14
15
16
17
18
19
20
21
22
23
24
25
26
27
28
29
30
31
32
33
34
35
36
37
38
39
40
41 * Winter period contract demand.
42
Annual Report of the Town of Holden Year Ended December 31, 2017 Page 53
SALES FOR RESALE (Account 447) - Continued
5. If a fixed number of kilowatts of maximum demand integrated).
is specified in the power contract as a basis of billings to 6. The number of kilowatt-hours sold should be the
the customer this number should be shown in column (f). quantities shown by the bills rendered to the purchasers.
The number of kilowatts of maximum demand to be shown 7. Explain any amounts entered in column (n) such as
in column (g) and (h) should be actual based on monthly fuel or other adjustments.
readings and should be furnished whether or not used in the 8. If a contract covers several points of delivery and
determination of demand charges. Show in column (i) type small amounts of electric energy are delivered at each point,
of demand reading (instantaneous, 15, 30, or 60 minutes such sales may be grouped.
Revenue (Omit Cents) Revenue
Type of Voltage per kwh
Demand at Which Kilowatt- Capacity Energy Other (CENTS)
Reading Delivered Hours Charges Charges Charges Total (0.0000) Line
(i) (j) (k) (l) (m) (n) (o) (p) No.
1
2
3
4
5
6
7
8
9
10
11
12
13
14
15
16
17
18
19
20
21
22
23
24
25
26
27
28
29
30
31
32
33
34
35
36
37
38
39
40
41
TOTALS: 0 0.00 0.00 0.00 42
54
Annual report of: HOLDEN MUNICIPAL LIGHT DEPT.
PURCHASED POWER (Account 555)
(EXCEPT INTERCHANGE POWER)
1. Report power purchased for resale during the year. Authorities. For each purchase designate statistical classi-
Exclude from this schedule and report on page 56 particulars fication in column (b), thus: firm power, FP; dump or
concerning interchange power transactions during the year. surplus power, DP; other, O, and place an "x" in column (c)
2. Provide subheadings and classify purchases as to if purchase involves import across a state line.
(1) Associated Utilities, (2) Nonassociated Utilities, (3) 3. Report separately firm, dump, and other power pur-
Associated Nonutilites, (4) Other Nonutilities, (5) Muni- chased from the same company. Describe the nature of any
cipalities, (6) R.E.A Cooperatives, and (7) Other Public purchases classified as Other Power, column (b).
Kw or Kva of Demand
Across Avg mo. Annual
Purchased Statistical State Sub ContractMaximum Maximum
Line From MMWEC: Classification Line Point of Receipt Station Demand Demand Demand
No. (a) (b) (c) (d) (e) (f) (g) (h)
1 New York Power Authority FP X TOWN LINE 1,034
2 Stonybrook Peaking O TOWN LINE 5,436
3 Stonybrook Intermediate O TOWN LINE 7,776
4 Nuclear Mix 1 (Seabrook) O X TOWN LINE 49
5 Nuclear Mix 1 (Millstone) O X TOWN LINE 500
6 Nuclear Project 3 (Millstone) O X TOWN LINE 330
7 Nuclear Project 4 (Seabrook) O X TOWN LINE 1,315
8 Nuclear Project 5 (Seabrook) O X TOWN LINE 131
9 Project 6 (Seabrook) O X TOWN LINE 3,069
10 Transmission Charges
11 Hydro Quebec O X TOWN LINE
12 NEPCO Transmission
13 Powdermill Hydro O X TOWN LINE
14 New Barre Hydro O X TOWN LINE
15 South Barre Hydro O X TOWN LINE
16 Webster Hydro O X TOWN LINE
17 ISO OATT O X TOWN LINE
18 System Power O TOWN LINE
19 Berkshire Wind Power Cooperative DP
20 Eagle Creek O TOWN LINE 357
21 Hancock Wind O TOWN LINE 951
22
23 Return of Surplus Funds
24
25
26
27
28 Miscellaneous Credits
29 Rate Stabilization
30
31
** Includes transmission and administrative charges.
Year Ended December 31, 2017
55
Annual Report of: HOLDEN MUNICIPAL LIGHT DEPT.
PURCHASED POWER (Account 555)
(EXCEPT INTERCHANGE POWER)
4. If receipt of power is at a substation indicate ownership should be furnished whether or not used in the determination
in column (e), thus: respondent owned or leased, RS; seller of demand charges. Show in column (i) type of demand
owned or leased, SS. reading (instantaneous, 15, 30, or 60 minutes integrated).
5. If a fixed number of kilowatts of maximum demand 6. The number of kilowatt hours purchased should be the
is specified in the power contract as a basis of billing, this quantities shown by the power bills.
number should be shown in column (f). The number of 7. Explain any amount entered in column (n) such as fuel
kilowatts of maximum demand to be shown in columns (g) or other adjustments.
and (h) should be actual based on monthly readings and
Cost of Energy (Omit Cents)
Type of Voltage KWH
Demand at Which Kilowatt- Capacity Energy Other (CENTS)
Reading Delivered Hours Charges Charges Charges Total (0.0000) Line
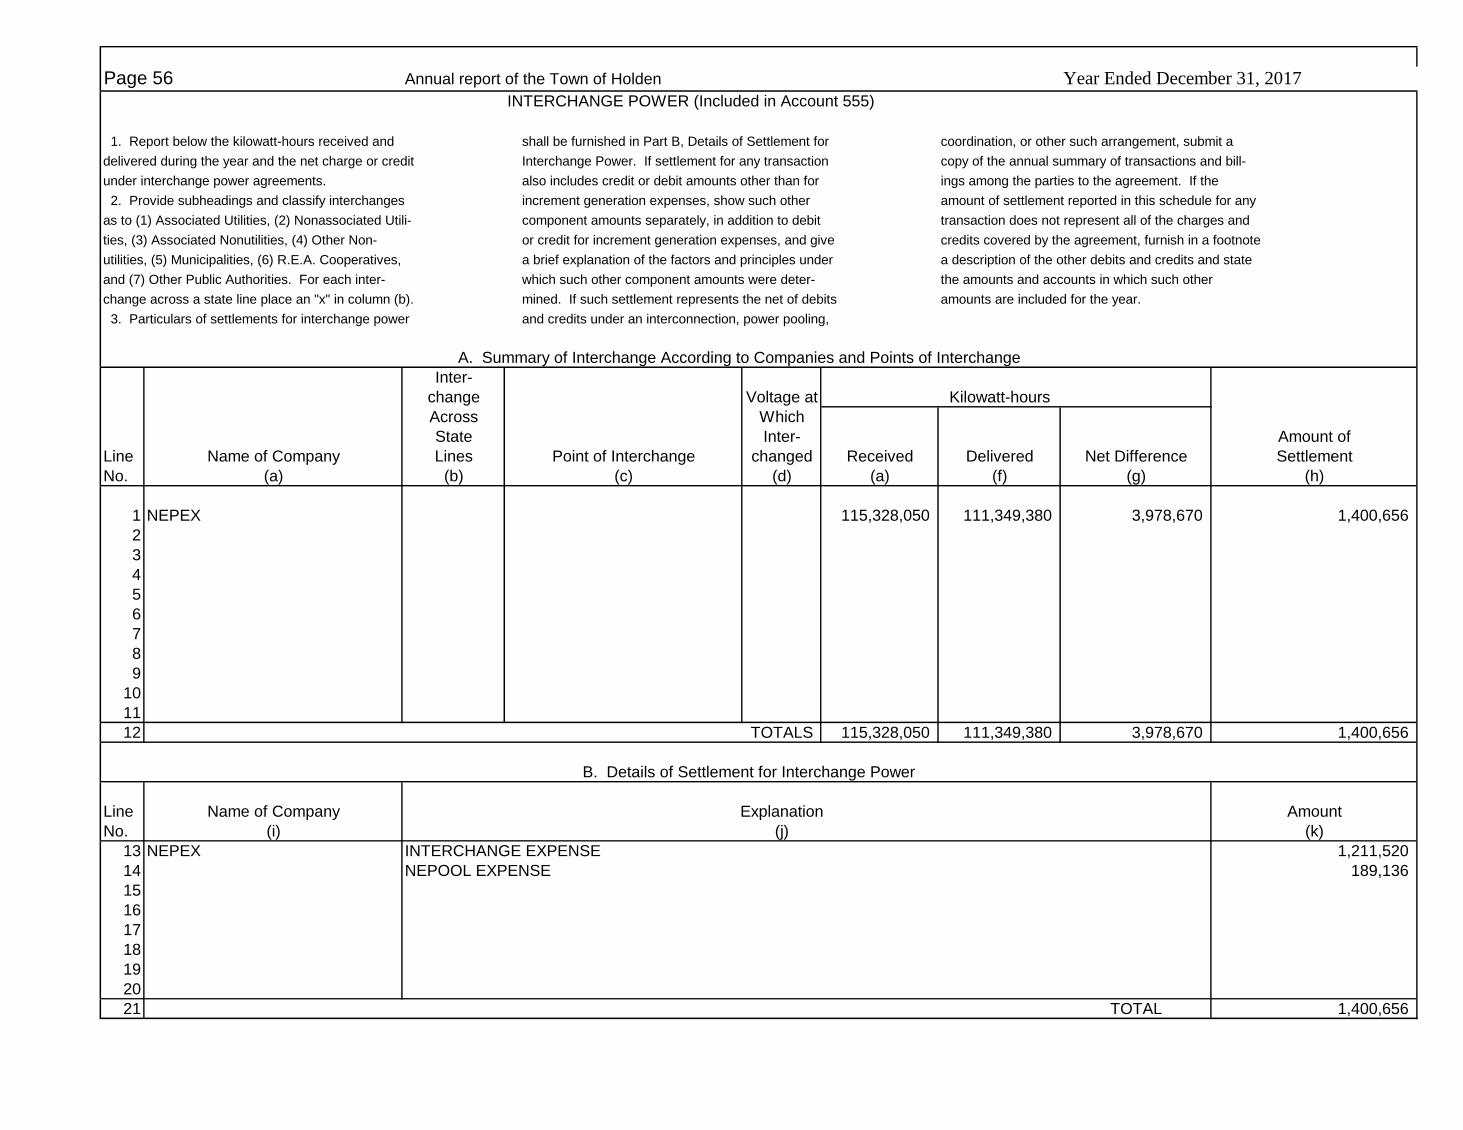
1. Report below the kilowatt-hours received and shall be furnished in Part B, Details of Settlement for coordination, or other such arrangement, submit a
delivered during the year and the net charge or credit Interchange Power. If settlement for any transaction copy of the annual summary of transactions and bill-
under interchange power agreements. also includes credit or debit amounts other than for ings among the parties to the agreement. If the
2. Provide subheadings and classify interchanges increment generation expenses, show such other amount of settlement reported in this schedule for any
as to (1) Associated Utilities, (2) Nonassociated Utili- component amounts separately, in addition to debit transaction does not represent all of the charges and
ties, (3) Associated Nonutilities, (4) Other Non- or credit for increment generation expenses, and give credits covered by the agreement, furnish in a footnote
utilities, (5) Municipalities, (6) R.E.A. Cooperatives, a brief explanation of the factors and principles under a description of the other debits and credits and state
and (7) Other Public Authorities. For each inter- which such other component amounts were deter- the amounts and accounts in which such other
change across a state line place an "x" in column (b). mined. If such settlement represents the net of debits amounts are included for the year.
3. Particulars of settlements for interchange power and credits under an interconnection, power pooling,
A. Summary of Interchange According to Companies and Points of Interchange
Inter-
change Voltage at Kilowatt-hours
Across Which
State Inter- Amount of
Line Name of Company Lines Point of Interchange changed Received Delivered Net Difference Settlement
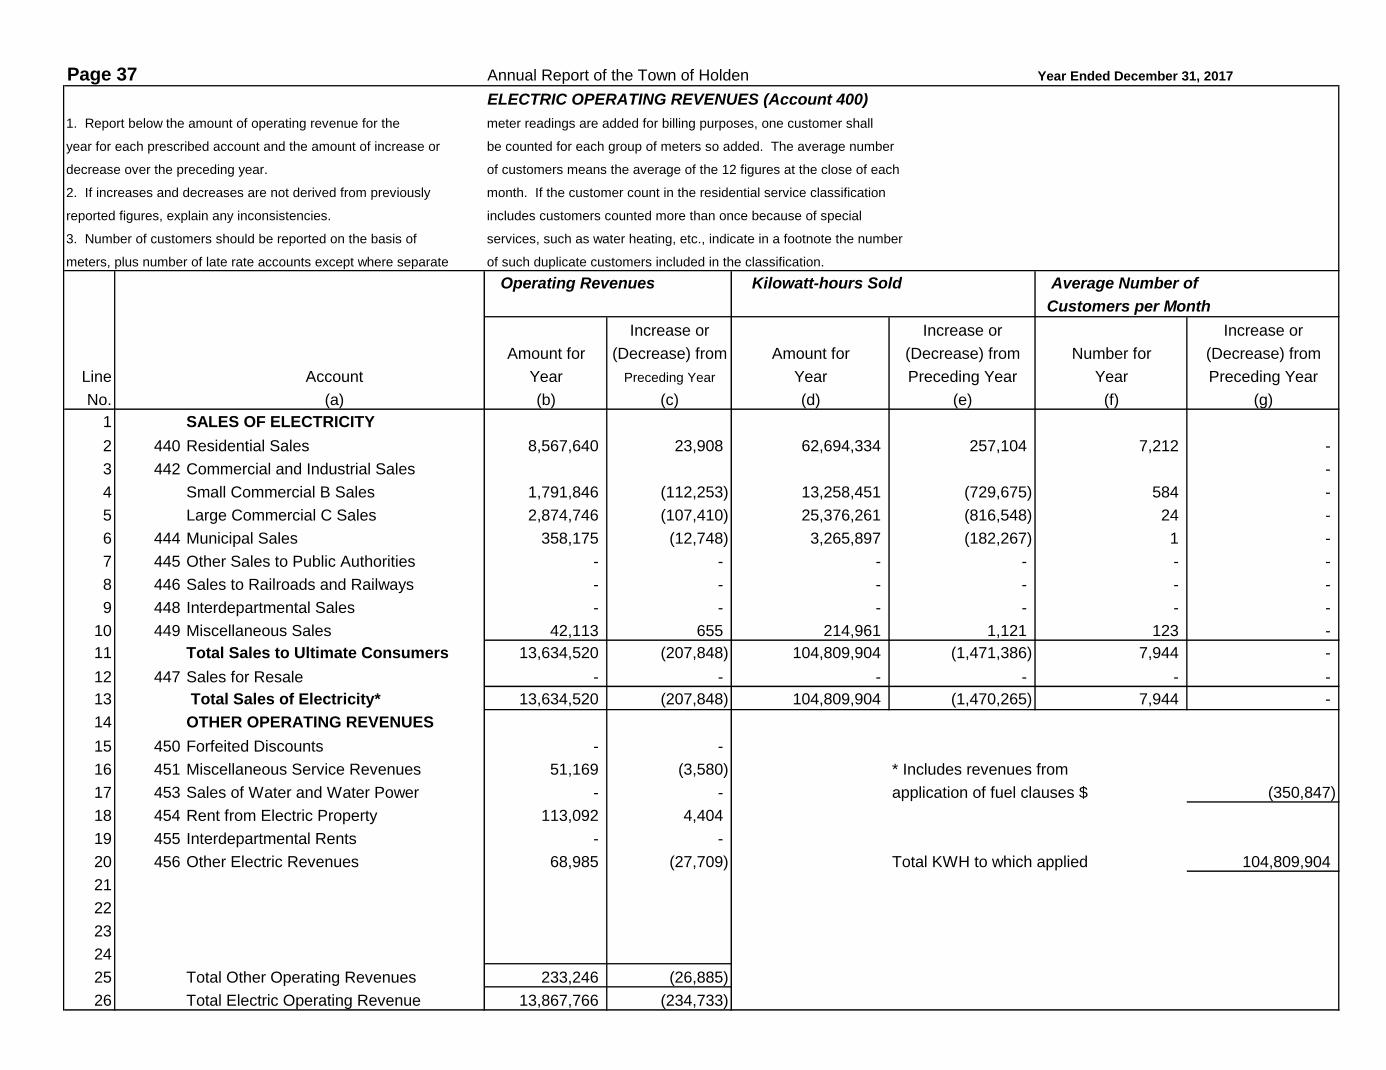
17 Sales to ultimate consumers (including interdepartmental sales) 104,809,904
18 Sales for resale -
19 Energy furnished without charge -
20 Energy used by the company (excluding station use): 257,658
21 Electric department only
22 Energy losses
23 Transmission and conversion losses 2.20% 2,447,158
24 Distribution losses 3.20% 3,548,713
25 Unaccounted for losses
26 Total energy losses 5,995,871
27 Energy losses as percent of total on line 15 5.40%
28 TOTAL 111,063,433
MONTHLY PEAKS AND OUTPUT 1. Report hereunder the information called for pertaining to simultaneous peaks as to the nature of the emergency.
established monthly (in kilowatts) and monthly output (in kilowatt-hours) for the 3. State type of monthly peak reading (instantaneous 15, 30, or 60 minutes integrated.)
combined sources of electric energy of respondent. 4. Monthly output should be the sum of respondent's net generation and purchases plus or
2. Monthly peak col. (b) should be respondent's maximum kw load as minus net interchange and plus or minus net transmission or wheeling. Total for the year
measured by the sum of its coincidental net generation and purchase plus or should agree with line 15 above.
minus net interchange, minus temporary deliveries (not interchange) of 5. If the respondent has two or more power systems not physically connected, the
emergency power to another system. Monthly peak including such information called for below should be furnished for each system.
emergency deliveries should be shown in a footnote with a brief explanation
Town of HOLDEN
Monthly Peak Monthly Output
Day of Day of Type of (kwh)
Line Month Kilowatts Week Month Hour Reading
No. (a) (b) (c) (d) (e) (f) (g)
29 January 19,829 Mon 9 19:00 60 min 10,057,672
30 February 19,165 Thu 9 19:00 60 min 8,675,838
31 March 17,237 Sun 5 19:00 60 min 9,313,861
32 April 15,673 Thu 6 19:00 60 min 7,817,046
33 May 18,361 Thu 18 21:00 60 min 8,280,631
34 June 22,026 Mon 12 19:00 60 min 9,228,677
35 July 21,896 Wed 19 16:00 60 min 10,273,710
36 August 21,435 Tue 22 17:00 60 min 10,075,249
37 September 20,539 Wed 27 20:00 60 min 9,135,090
38 October 17,858 Mon 9 19:00 60 min 8,608,423
39 November 17,623 Mon 27 19:00 60 min 8,981,942
40 December 20,836 Thu 28 18:00 60 min 10,615,294
41 TOTAL 111,063,433
Annual Report of the Town OF Holden Year Ended December 31, 2017
GENERATING STATIONS Pages 58 through 66
GENERATING STATION STATISTICS (Large Stations)
(Except Nuclear) Pages 58-59
Line Item Plant Plant Plant Plant
No. (a) (b) (c) (d) (e)
1
2
3
4
5
6
STEAM GENERATING STATIONS Pages 60-61
Line Item Plant Plant Plant Plant
No. (a) (b) (c) (d) (e)
1
2
3
4
5
6
HYDROELECTRIC GENERATING STATIONS Pages 62-63
Line Item Plant Plant Plant Plant
No. (a) (b) (c) (d) (e)
1
2
3
4
5
6
COMBUSTION ENGINE AND OTHER GENERATING STATIONS Pages 64-65
Line Item Plant Plant Plant Plant
No. (a) (b) (c) (d) (e)
1
2
3
4
5
6
GENERATING STATION STATISTICS (Small Stations) Page 66
Line Item Plant Plant Plant Plant
No. (a) (b) (c) (d) (e)
1
2
3
4
5
6
Annual Report of the Town of Holden Year Ended December 31, 2017 Page 67
TRANSMISSION LINE STATISTICS
Report information concerning transmission line as indicated below.
Type of Length (Pole Miles) Number Size of
Designation Operating Supportive On Structures of On Structures of of Conductors
Line From To Voltage Structure Line Designated Another Line Circuits and Material
No. (a) (b) (c) (d) (e) (f) (g) (h)
1
2
3
4
5
6
7
8
9
10
11
12
13
14
15
16
17
18
19
20
21
22
23
24
25
26
27
28
29
30
31
32
33
34
35
36
37
38
39
40
41
TOTALS 0
* where other than 60 cycle, 3 phase, so indicate.
Page 68 Annual Report of the Town of Holden Year Ended December 31, 2017
SUBSTATIONS1. Report below the information called for concerning substations of the 4. Indicate in column (b) the functional character of each substation, designating name of lessor, date and period of lease and annual rent. For any
respondent as of the end of the year. whether transmission or distribution and whether attended or unattended. substation or equipment operated other than by reason of sole
2. Substations which serve but one industrial or street railway customer 5. Show in columns (i), (j), and (k) special equipment such as rotary converters, ownership or lease, give name of co-owner or other party, explain
should not be listed hereunder. rectifiers, condensers, etc. and auxiliary equipment for increasing capacity. basis of sharing expenses of other accounting between the
3. Substations with capacities of less that 5000 kva, except those serving 6. Designate substations or major items of equipment leased from others, jointly parties, and state amounts and accounts affected in respondent's
customers with energy for resale, may be grouped according to functional owned with others, or operated otherwise than by reason of sole ownership by books of account. Specify in each case whether lessor, co-owner
character, but the number of such substations must be shown. the respondent. For any substation or equipment operated under lease, give or other party is an associated company.
Conversion Apparatus and
Character Voltage Capacity of Number of Number of Special Equipment
Name and Location of Substation in kva Transformers Spare Type of Number Total
Line of Substation Substation Primary Secondary Tertiary (In Service) In Service Transformers Equipment of Units Capacity
No. (a) (b) (c) (d) (e) (f) (g) (h) (i) (j) (k)
1 Chaffins Substation distribution 69 13.8 50 2 0
2
3 Bullard St Substation distribution 69 13.8 40 2 0
4
5
6
7
8
9
10
11
12
13
14
15
16
17
18
19
20
21
22
23
24
25
26 TOTALS 90 0
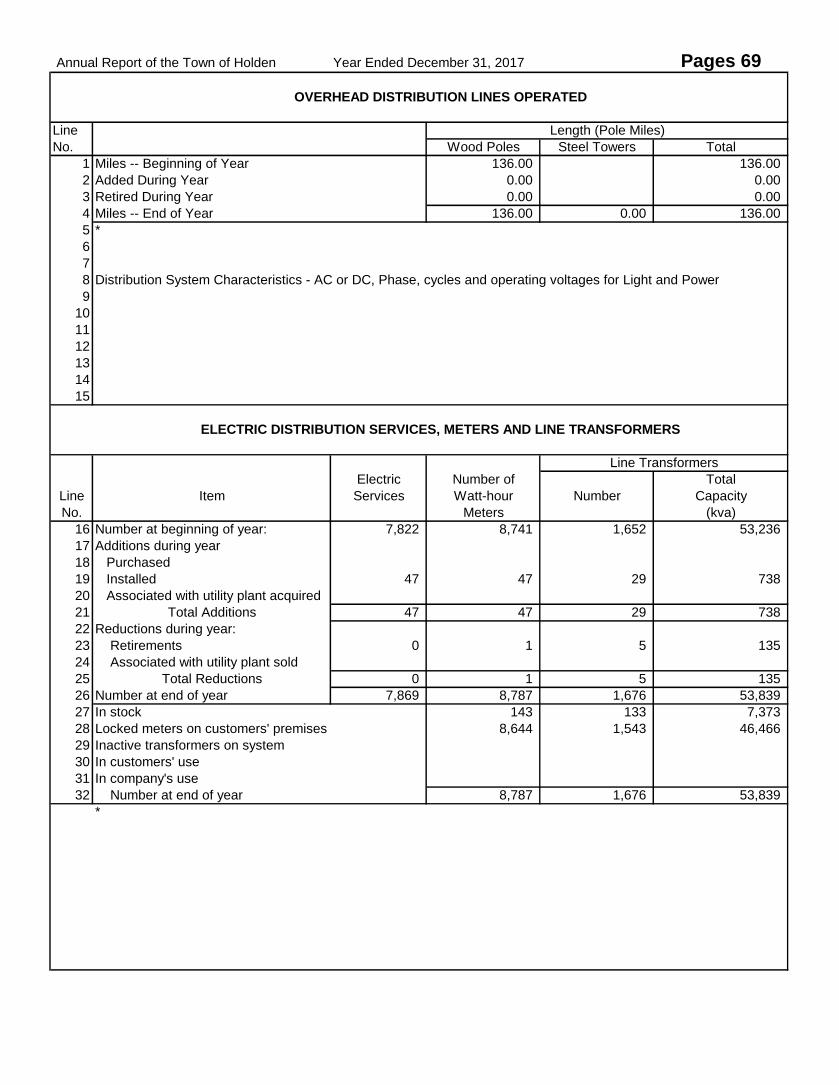
Annual Report of the Town of Holden Year Ended December 31, 2017 Pages 69
OVERHEAD DISTRIBUTION LINES OPERATED
Line Length (Pole Miles)
No. Wood Poles Steel Towers Total
1 Miles -- Beginning of Year 136.00 136.00
2 Added During Year 0.00 0.00
3 Retired During Year 0.00 0.00
4 Miles -- End of Year 136.00 0.00 136.00
5 *
6
7
8 Distribution System Characteristics - AC or DC, Phase, cycles and operating voltages for Light and Power
9
10
11
12
13
14
15
ELECTRIC DISTRIBUTION SERVICES, METERS AND LINE TRANSFORMERS
Line Transformers
Electric Number of Total
Line Item Services Watt-hour Number Capacity
No. Meters (kva)
16 Number at beginning of year: 7,822 8,741 1,652 53,236
17 Additions during year
18 Purchased
19 Installed 47 47 29 738
20 Associated with utility plant acquired
21 Total Additions 47 47 29 738
22 Reductions during year:
23 Retirements 0 1 5 135
24 Associated with utility plant sold
25 Total Reductions 0 1 5 135
26 Number at end of year 7,869 8,787 1,676 53,839
27 In stock 143 133 7,373
28 Locked meters on customers' premises 8,644 1,543 46,466
29 Inactive transformers on system
30 In customers' use
31 In company's use
32 Number at end of year 8,787 1,676 53,839
*
Page 70 Annual Report of the Town of Holden Year Ended December 31, 2017
CONDUIT, UNDERGROUND CABLE AND SUBMARINE CABLE - (Distribution System) Report below the information called for concerning conduit, underground cable, and submarine cable at end of year.
Miles of Conduit Bank Underground Cable Submarine Cable
Line Designation of Underground System (All Sizes and Types) Miles * Operating Feet * Operating
Voltage Voltage
No. (a) (b) (c) (d) (e) (f)
1 Parsons Road 0.124
2 Wachusett Valley Estates 0.557
3
4
5
6
7
8
9
10
11
12
13
14
15
16
17
18
19
20
21
22
23
24
25
26
27
28
29
30
31
32
33
34
35
36
37 TOTALS 0 0.681 NONE
Annual Report of the Town of Holden Page 71
Type
Incandescent Mercury Vapor LED Sodium
Line City or Town Total Municipal Other Municipal Other Municipal Other Municipal Other
No. (a) (b) (c) (d) (e) (f) (g) (h) (i) (j)
1 Town Streetlighting 1,624 - - - - 1,099 - 525 -
2 Protective Lighting 139 - - - 51 - - - 88
3
4
5
6
7
8
9
10
11
12
13
14
15
16
17
18
19
20
21
22
23
24
25
26
27
28
29
30
31
32
33
34
35
36
37
38
39
40
41
42
43
44
45
46
47
48
49
50
51
52 TOTALS 1763 0 0 0 51 1099 0 525 88
Next Page is 79
Year Ended December 31, 2017
STREET LAMPS CONNECTED TO SYSTEM
Annual Report of the Town of Holden Year Ended December 31, 2017 Page 79RATE SCHEDULE INFORMATION
1. Attach copies of all Filed Rates for General Consumers
2. Show below the changes in rate schedules during year and the estimated increase
or decrease in annual revenues predicted on the previous year's operations.
Estimated
Effective M.D.P.U. Rate Effect on
Date Number Schedule Annual Revenues
Increases Decreases
1/1/2011 #110 Residential Service
1/1/2011 #111 Small Commercial
1/1/2011 #109 General Service
1/1/2011 #116 General Service Non-Firm
1/1/2011 #112 Municipal Pumping
1/1/2011 #113 Municipal Street Lighting Rate
1/1/2011 #115 Protective Lighting
7/1/2014 #114 Purchased Power Clause
There were no changes to our rates in 2017
INDEXPage
Appropriations of Surplus 21
Appropriations Since Beginning of Year 5
Bonds 6
Cash Balances 14
Changes in the Property 5
Combustion Engine and Other Generating Stations 64-65
Comparative Balance Sheet 10-11
Conduit, Underground Cable and Submarine Cable 70
Cost of Plant 8- 8B
Customers in each City or Town 4
Depreciation Fund Account 14
Earned Surplus 12
Electric Distribution Services, Meters, and Line Transformers 69
Electric Energy Account 57
Electric Operating Revenues 37
Electric Operation and Maintenance Expenses 39-42
General Information 3
Generating Station Statistics 58-59
Generating Statistics (Small Stations) 66
Hydroelectric Generating Stations 62-63
Income from Merchandising, Jobbing and Contract Work 51
Income Statement 12
Interchange Power 56
Materials and Supplies 14
Miscellaneous Credits to Surplus 21
Miscellaneous Debits to Surplus 21
Miscellaneous Nonoperating Income 21
Monthly Peaks and Output 57
Municipal Revenues 22
Other Income Deductions 21
Other Utility Operating Income 50
Overhead Distribution Lines Operated 69
Production Fuel and Oil Stocks 18
Purchased Power 22
Purchased Power Detailed (except Interchange) 54-55
Rate Schedule Information 79
Sales for Resale 22
Sales for Resale Detailed 52-53
Sales of Electricity to Ultimate Consumers 38
Schedule of Estimates 4
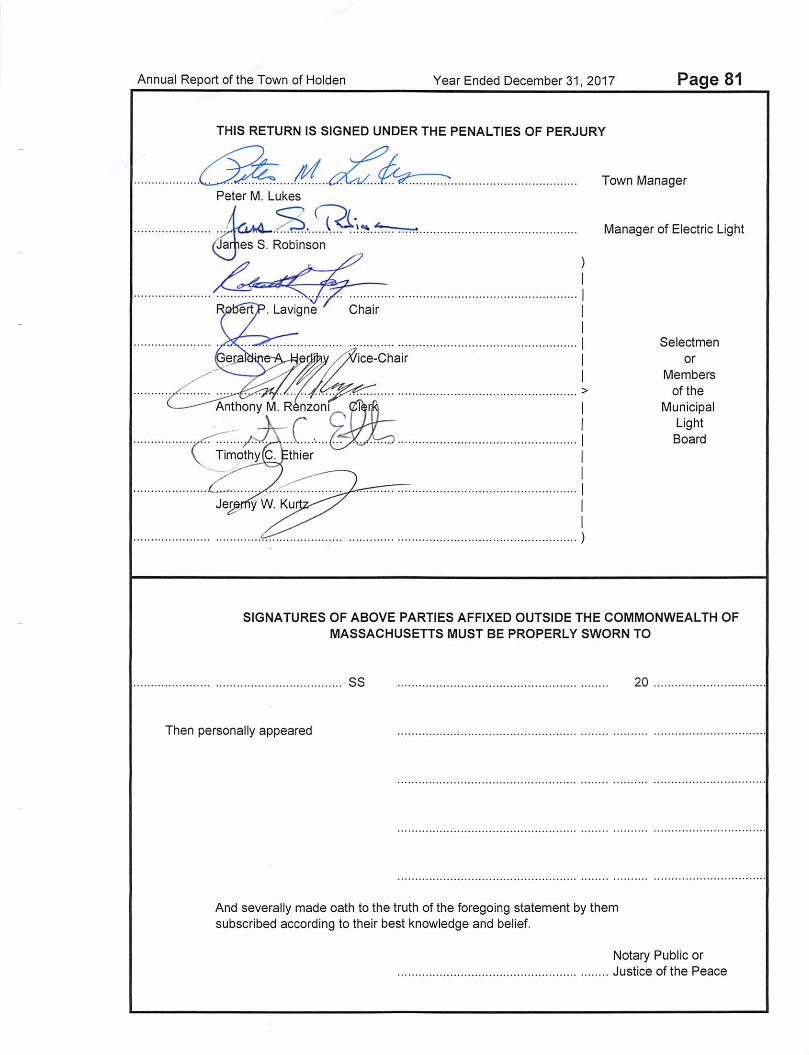
Signature Page 81
Steam Generating Stations 60-61
Streetlamps 71
Substations 68
Taxes Charged During Year 49
Town Notes 7
Transmission Line Statistics 67
Utility Plant-Electric 15-17
FOR GAS PLANTS ONLY: Page Page
Boilers 75 Purifieers 76
Gas Distribution Services, House Record of Sendout for the Year in MCF 72-73
Governors and Meters 78 Sales for Resale 48
Gas Generating Plant 74 Sales of Gas to Ultimate Customers 44