71
2017BUDGET NEW YORK STATE THRUWAY AUTHORITY
2017BUDGETNEW YORK STATE THRUWAY AUTHORITY

Board Members 1
Letter from Executive Director and Certification 2-4
Mission 5
Budget at a Glance and Executive Summary 6-17
2016 Revised Financial Plan
Comparison of Actual 2015 Expenditures to Revised 2016 Budget 18
Summary of Revised Financial Plan Changes - Revenues & Operating Expenses 19
Summary of Revised Financial Plan Changes - Capital Program 20
2016 Revised Budget - Sources and Uses of Funds 21
2017 Budget
Comparison of Revised 2016 Budget to 2017 Budget 22
Toll, Concession and Sundry Revenues 23
Departmental Operating Expenses 24
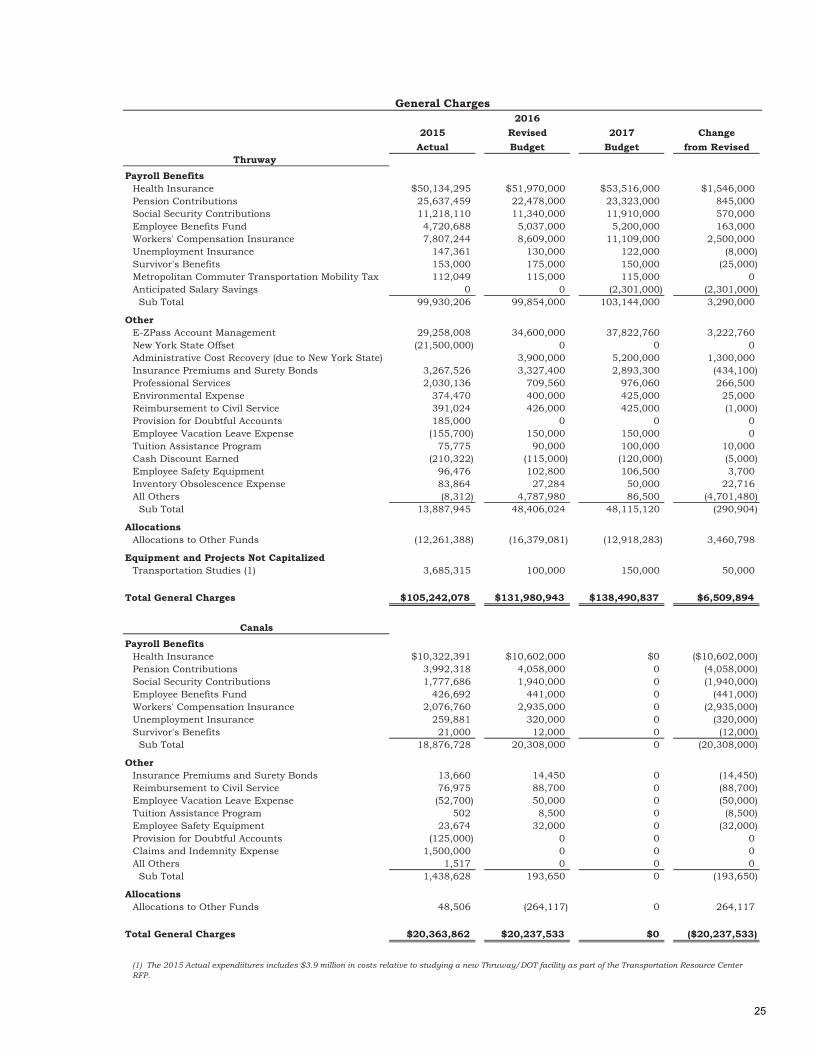
General Charges 25
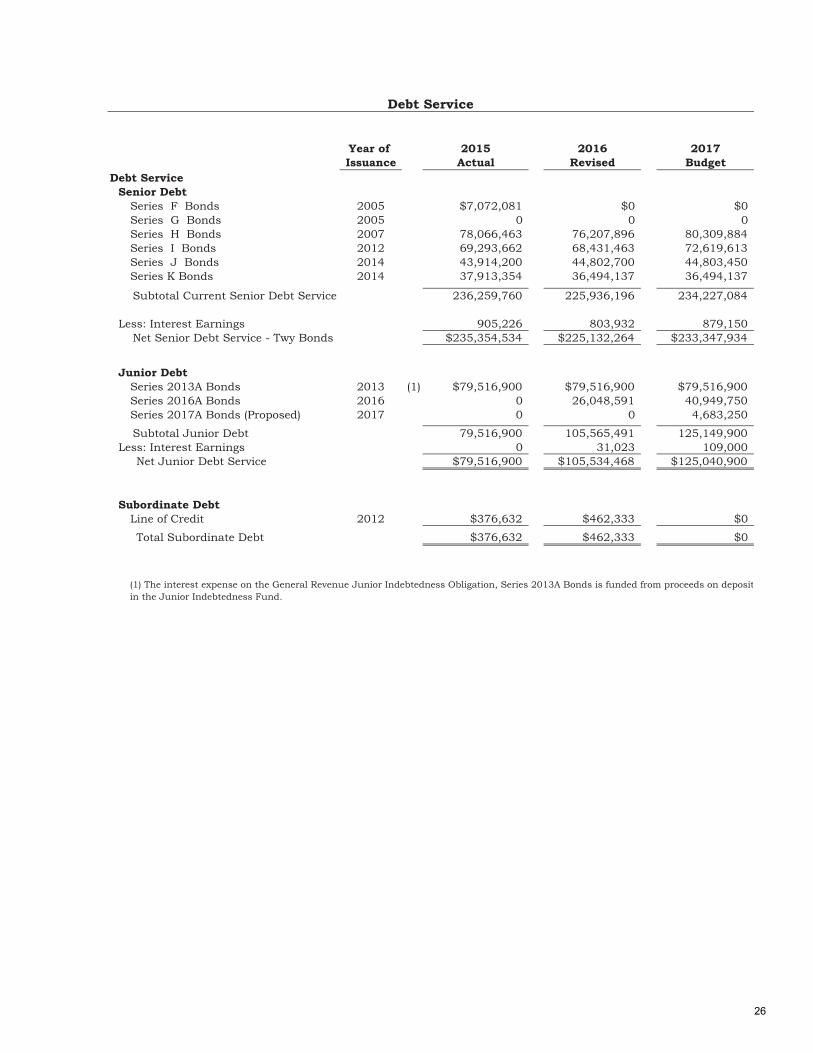
Debt Service 26
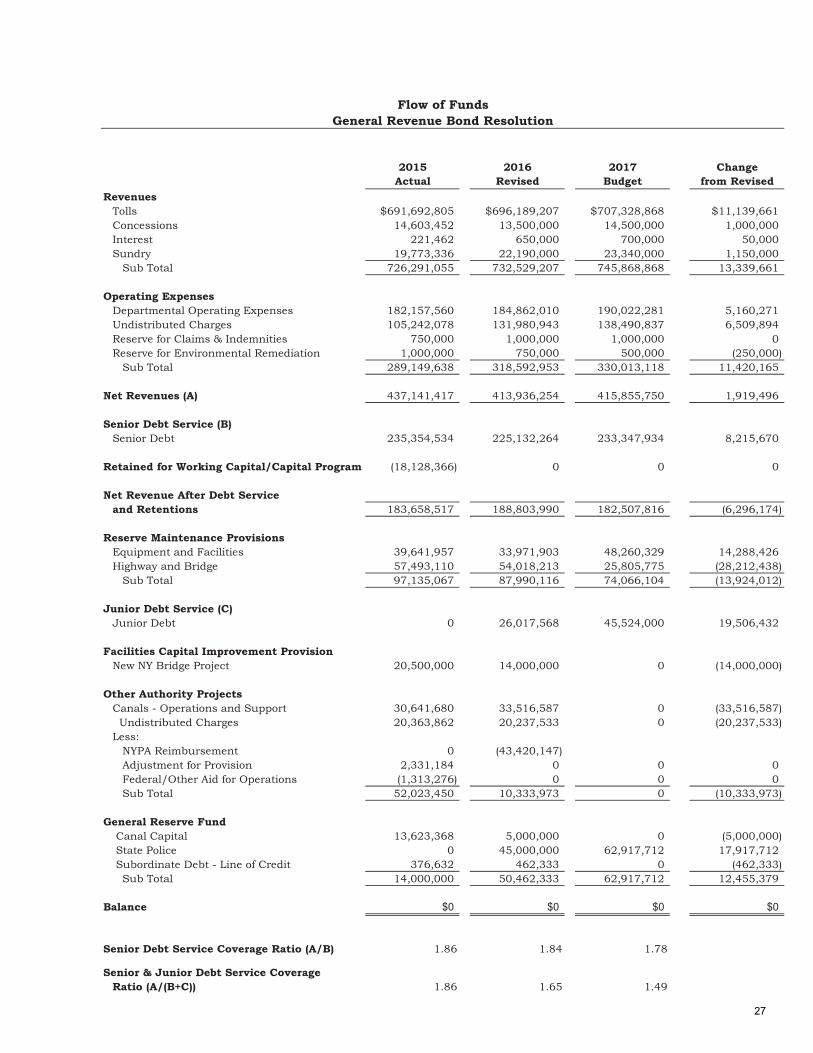
Flow of Funds - General Revenue Bond Resolution 27
Capital Program Funding Uses 28
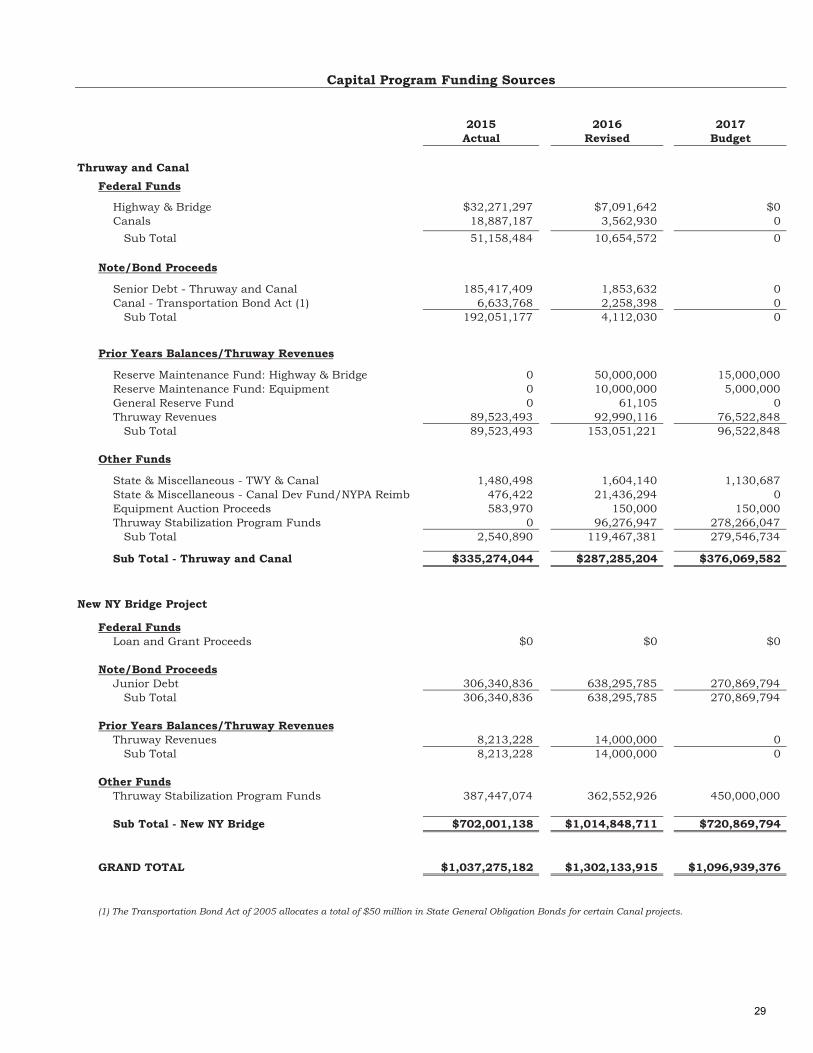
Capital Program Funding Sources 29
Comparison of Actual 2015, Revised 2016 Budget and 2017 Budget New NY Bridge 30
2017 Budget - Sources and Uses of Funds Schedule 31
2017 Departmental Operating Expenses
Administration, Operations, Engineering, Maintenance Engineering, 32
and General Charges
Administration, Operations, Engineering, Maintenance Engineering, 33-34
and General Charges (By Account)
Administration 35
Operations 36
Engineering 37
Maintenance Engineering 38
Personnel
History of Budgeted Positions 39
Independent Traffic Engineer's Report 40-50
Long Range Financial Plan
Long-Term Financial Plan 51
Schedule of Senior Debt Service 52
Schedule of Junior Debt Service 53
Multi-Year Capital Plan
2017 Budget - Capital Program - Sources and Uses 54
Multi-Year Capital Program - Letting Schedule 55-66
Appendix
Overview of the Authority's Budget Process 67
Budget Assumptions 68
Assessment of Budgetary Risks 69
TABLE OF CONTENTS
!
!
!
!
New York State Thruway Authority and New York State Canal Corporation
Board of Directors
Joanne M. Mahoney, Chair, Board of Directors
Donna J. Luh, Vice-Chair, Board of Directors
Richard N. Simberg, Member, Board of Directors
J. Donald Rice Jr., Member, Board of Directors
José Holguín-Veras, Ph.D., P.E., Member, Board of Directors
Robert L. Megna, Member, Board of Directors
Stephen M. Saland, Member, Board of Directors
1
!
Honorable Catharine Young Chair NYS Senate Finance Committee 307 Legislative Office Building Albany, NY 12247
Honorable Herman D. Farrell, Jr. Chairman NYS Assembly Ways & Means Com. 923 Legislative Office Building Albany, NY 12248
October 2016
Honorable Liz Krueger Ranking Minority Member NYS Senate Finance Committee 617 Legislative Office Building Albany, NY 12247
Honorable Robert C. Oaks Ranking Minority Member NYS Assembly Ways & Means Com. 448 Legislative Office Building Albany, NY 12248
Mr. Michael Farrar NYS Authorities Budget Office P.O. Box 2076 Albany, NY 12220-0076
To the Addressees:
In compliance with the provisions of the Public Authorities Law and on behalf of the Board of the New York State Thruway Authority (Authority), I am submitting a summary of the Authority’s Budget for the fiscal year beginning January 1, 2017. The overall 2017 Budget represents a total financial commitment of $1.8 billion. The 2017 Budget is one that is balanced; provides the necessary resources to maintain the current levels of maintenance, safety and service; and maximizes funding for critical infrastructure rehabilitation projects in the Authority’s multi-year Capital Plan.
Our comprehensive efforts to improve our operations will continue into 2017, reflecting our long-term commitment to keep the Thruway Authority on a sound fiscal footing. The 2017 budget that has been prepared continues our efforts to provide a balanced financial plan and makes no toll adjustments in 2017.
Specifically, the 2017 Budget includes the following:
! The 2017 Budget provides a total of $330 million for operating expenses of the Thruway Authority (including provisions). This represents an increase of $5.46 million or 1.68 percent above revised 2016 levels. After accounting for roughly $6 million in expenses previously allocated to the Canal Support Budget, the year to year change would be $11.42 million or 3.58 percent.
2

!
!
! The 2017 Budget does not include funds associated with the operation of the Canal Corporation. However, the 2017 budget does incorporate the impacts of the transfer of the Canal Corporation to the New York Power Authority (NYPA); the elimination of State operating support to the Thruway Authority; and the re-assumption of Thruway Authority reimbursement to the State of New York for costs associated with the State Police Troop T patrolling the system.
! The 2017 Budget continues the great progress on the New NY Bridge (NNYB) by providing $721.06 million in 2017.
! The 2017 Budget would provide a 2017-2021 capital plan of $2.77 billion. This includes roughly $1.7 billion for Thruway projects and roughly $1.1billion for NNYB over the 2017-2021 capital plan.
Thanks to the hard work and dedication of our employees, we continue to operate and maintain a safe, reliable, statewide superhighway system in a fiscally responsible manner. The Thruway Authority provides quality services for our customers while supporting economic growth and job creation across New York State. Under Governor Andrew Cuomo’s leadership, we have instituted major initiatives and cost controls that have substantially reduced operating costs, improved services, and fostered strategic investments in our infrastructure.
Finally, none of these accomplishments would have been possible without strong support, guidance and leadership from our Chair, Joanne M. Mahoney and the dedicated members of the Thruway Authority Board of Directors. Thank you for your interest in the Thruway Authority and Canal Corporation.
Sincerely,
William A. Finch Acting Executive Director William m m m m m m m m m m m m m m m m m m m m m m m m m m m m m m m m m m m m m m m m m A.A.A.A.A.A.A.A.A.A.A.A.A.A.A.A.A.A.A.A.A.A.A.A.A.A.A.A.A.A.A.A.A.A.A.A.A.A.A.A.A.A.A.A.A.A.A.A.A.A.A.A.A.A.A. Finch Actingngngngngngngngngngngngngngngngngngngngngngngngngngngngngngngngngngngngngngngngngngngngngngng E E EE EEEE E E E E E EE E E EE E E E E E E EEEEE EEE E EEE E E E E E Executive Directo
3
Certification of Assumptions and Method of Estimation for Budget and Financial Plan 2017-2020 in accordance with
the Comptroller’s Regulation Section 203.9 Certification
Date:
To: Board of Directors, New York State Thruway Authority
In accordance with Office of State Comptroller (OSC regulations), I certify that to the best of my knowledge and belief after reasonable inquiry, the Authority 2017 Budget is based on reasonable assumptions and methods of estimation; and the requirements of the OSC regulations have been satisfied.
___________________ Matthew A. Howard Chief Financial Officer
_______________________________________________________________________________________________________________________________________________________________________________________________________________________________________________________________________ _ MaMatttthehew A.A. Howard
October 2016
4

Mission
We offer a user-fee supported Highway System that delivers high levels of
safety and service.
New York State Thruway Authority
The New York State Thruway, a body corporate and politic constituting a public corporation, created in 1950, is empowered, among other things, to construct, operate and maintain a toll facility, and to improve and reconstruct the New York State Thruway subject to certain statutory limitations on the Authority’s right to impose tolls on certain parts of the Thruway, including the Cross-Westchester Expressway. The Thruway is a 570-mile superhighway system crossing the State and the largest toll superhighway system in the United States. In addition to being the principal artery of travel and commerce within New York connecting the State’s principal cities, the Thruway is a vital link to long distance interstate travel. In addition, the Thruway provides the major route of access for visitors to the State’s tourism magnets, including Niagara Falls, the Finger Lakes, the Adirondacks, the Catskills and New York City.
5
THRUWAY AUTHORITY 2017 BUDGET AT A GLANCE
! No Toll Increase: The 2017 Thruway Authority budget recommends no tollincrease for 2017, marking the seventh year since the last increase took effect.
! Traffic and Toll Revenue Growth: The 2017 Budget forecast total traffic of 267.3million vehicles, reflecting growth of 3.3 million vehicles or 1.3 percent above2016. This corresponds to a toll revenue forecast of $707.3 million reflecting anincrease of $11.1 million or 1.6 percent above 2016 levels.
! 2017 Overall Budget: The 2017 Overall budget for the Thruway and CanalCorporation totals $1.8 billion, which is $207 million or 10.1% below 2016 levels.This includes $721 million in spending on the New NY Bridge (a reduction of $293million from 2016), $330 million for the operating expenses of the ThruwayAuthority and $373.6 million for capital projects across the Thruway system in2017.
! 2017-2021 Capital Program: The 2017-2021 Capital Program would provide$2.77 billion for Thruway Authority capital projects. Over the course of the multi-year plan roughly $1.1 billion would be provided for NNYB and $1.7 billion forsystem-wide projects on the Thruway.
! Operating Budget: The 2017 Budget provides a total of $330 million foroperating expenses of the Thruway Authority (including provisions). Thisrepresents an increase of $5.46 million or 1.68 percent above revised 2016 levels.After accounting for roughly $6 million in expenses previously allocated to theCanal Support Budget, the year to year change would be $11.42 million or 3.58percent.
! Transfer of the Canal Corporation: The 2017 Budget includes no funding forthe operation of the Canal Corporation. However, it does incorporate the impactsof the transfer of the Canal Corporation to the New York Power Authority (NYPA);the elimination of State operating support to the Thruway Authority; and the re-assumption of Thruway Authority reimbursement to the State of New York forcosts associated with the State Police Troop T patrolling the system.
! All Electronic Tolling: The 2017 Budget provides for the continuedimplementation of a conversion to All Electronic Toll Collection at the Tappan ZeeBridge which began on April 24, 2016. Implementing this new technology offersmotorists many advantages including reducing travel times, removing any vehiclestopping at the toll interchange, enhancing safety by improving traffic flow andproviding environmental benefits by limiting idling by reducing delays.
6

2017 BUDGET EXECUTIVE SUMMARY
Revised
Actual Budget 2017
2015 2016 Budget $ Change % Change
Thruway Operating 293.12 322.80 328.51 5.71 1.8%
Provisions for Claims & Env.
Remediation 1.75 1.75 1.50 (0.25) -14.3%
Expenses Allocated to the Canal
Support Budget1 (5.73) (5.96) - 5.96 -100.0%
Canal Operating 51.01 53.75 - (53.75) -100.0%
State Police Troop T
Reimbursement - 45.00 62.92 17.92 39.8%
Canal Development Fund 2.03 2.95 - (2.95) -100.0%
Operating Expenses Subtotal 342.18 420.30 392.93 (27.37) -6.5%
Retained for Working Capital 10.00 - - - -
Debt Service 315.25 331.13 358.39 27.26 8.2%
Capital Program 1,037.28 1,302.13 1,094.48 (207.65) -15.9%
Total Uses 1,704.71 2,053.56 1,845.80 (207.76) -10.1%
New NY Bridge Project 702.21 1,015.03 721.06 (293.97) -29.0%
Total Uses - Net of New NY
Bridge Project 1,002.50 1,038.54 1,124.74 86.21 8.3%
1 Please Note: Allocation of Expenses to the Canal Support Budget in 2015 and 2016 are included in the General
Charges estimates in accompanying budget tables
2017 Budget Summary
(in $ millions)
SUMMARY
! The 2017 Budget provides for an overall budget of $1.84 billion, representing a$207 million or 10.1 percent reduction from revised 2016 levels (primarily due toNNYB). Exclusive of NNYB costs, the 2017 budget would provide $1.12 billionreflecting an increase of $86.2 million or 8.3 percent above revised 2016 levels.
7

! The 2017 Budget forecasts total traffic of 267.3 million vehicles, reflecting growthof 3.3 million vehicles or 1.3 percent above 2016. This corresponds to a tollrevenue forecast of $707.3 million reflecting an increase of $11.1 million or 1.6percent above 2016 levels.
! The 2017 Budget provides a total of $330 million for operating expenses of theThruway Authority (including provisions). This represents an increase of $5.46million or 1.68 percent above revised 2016 levels. After accounting for roughly $6million in expenses previously allocated to the Canal Support Budget, the year toyear change would be $11.42 million or 3.58 percent.
! The 2017 Budget does not include operating or capital expenses relating to theCanal Corporation. It does incorporate the impacts of the transfer of the CanalCorporation to the New York Power Authority (NYPA); the elimination of Stateoperating support to the Thruway Authority; and the re-assumption of ThruwayAuthority reimbursement to the State of New York for costs associated with theState Police Troop T patrolling the system (detailed descriptions of thesetransactions are provided below).
! The 2017 Budget provides a total of $1.094 billion to support the capital programof the Thruway Authority. This represents a reduction of $207.65 million or 15.9percent below revised 2016 levels (primarily due to NNYB).
! The 2017 Budget provides a 2017-2021 capital plan of $2.77 billion. Over themulti-year plan this includes roughly $1.7 billion for system-wide projects and$1.1 billion for NNYB in the 2017-2021 capital plan.
THRUWAY AUTHORITY REVENUE SUMMARY
! The 2017 Budget forecasts total Thruway Authority revenues of $745.8 million,
an increase of $13.3 million or 1.8 percent above revised 2016 levels. This
corresponds to a toll revenue forecast of $707.3 million reflecting an increase of
$11.1 million or 1.6 percent above revised 2016 levels; concessions revenues of
2015 2016 2017 $ % 2010-17
Actual Revised Budget Change Change Trend
Tolls 691.69 696.19 707.33 11.14 1.6%
Concessions 14.60 13.50 14.50 1.00 7.4%
Interest 0.22 0.65 0.70 0.05 7.7%
Sundry 19.77 22.19 23.34 1.15 5.2%
Total 726.29 732.53 745.87 13.34 1.8%
Thruway Authority Revenues (in $ Millions)
8
$14.5 million, sundry revenues of $23.3 million and interest income of roughly
$700,000.
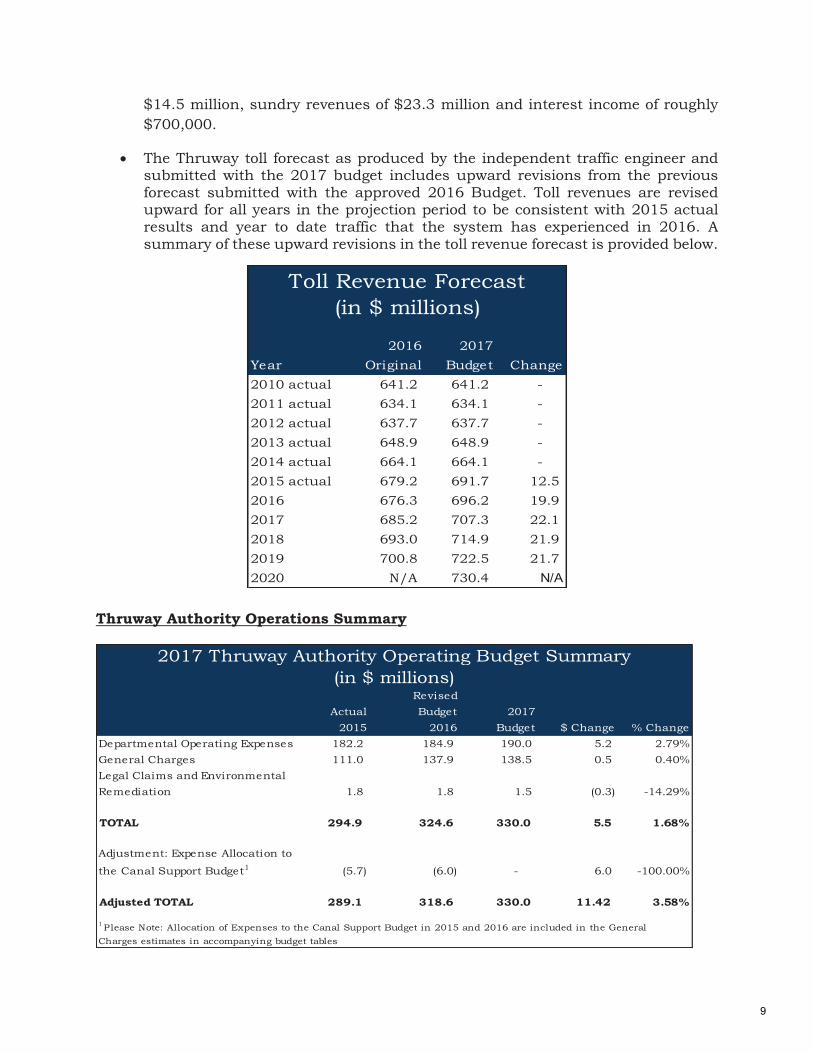
! The Thruway toll forecast as produced by the independent traffic engineer andsubmitted with the 2017 budget includes upward revisions from the previousforecast submitted with the approved 2016 Budget. Toll revenues are revisedupward for all years in the projection period to be consistent with 2015 actualresults and year to date traffic that the system has experienced in 2016. Asummary of these upward revisions in the toll revenue forecast is provided below.
Thruway Authority Operations Summary
Revised
Actual Budget 2017
2015 2016 Budget $ Change % Change
Departmental Operating Expenses 182.2 184.9 190.0 5.2 2.79%
General Charges 111.0 137.9 138.5 0.5 0.40%
Legal Claims and Environmental
Remediation 1.8 1.8 1.5 (0.3) -14.29%
TOTAL 294.9 324.6 330.0 5.5 1.68%
Adjustment: Expense Allocation to
the Canal Support Budget1 (5.7) (6.0) - 6.0 -100.00%
Adjusted TOTAL 289.1 318.6 330.0 11.42 3.58%
2017 Thruway Authority Operating Budget Summary
(in $ millions)
1 Please Note: Allocation of Expenses to the Canal Support Budget in 2015 and 2016 are included in the General
Charges estimates in accompanying budget tables
Year
2016
Original
2017
Budget Change
2010 actual 641.2 641.2 -
2011 actual 634.1 634.1 -
2012 actual 637.7 637.7 -
2013 actual 648.9 648.9 -
2014 actual 664.1 664.1 -
2015 actual 679.2 691.7 12.5
2016 676.3 696.2 19.9
2017 685.2 707.3 22.1
2018 693.0 714.9 21.9
2019 700.8 722.5 21.7
2020 N/A 730.4 N/A
Toll Revenue Forecast
(in $ millions)
9

! The 2017 Budget provides a total of $330 million (with provisions for legal claimsand environmental remediation) to support the operating expenses of theThruway Authority. This represents an increase of $5.46 million or 1.68 percentabove revised 2016 levels. This includes $190 million for departmental operations(a $5.2 million or 2.8 percent increase from revised 2016 levels), $138.5 millionfor general charges, an increase of $550,000 or 0.40 percent from revised 2016levels, $1.5 million for operating reserves which reflects a $250,000 reductionfrom 2016 levels and a $5.9 million increase to account for operating costs thathad previously been allocated to the Canal Support Budget. After accounting forthese expenses previously allocated to the Canal Support Budget, the year to yearchange would be $11.42 million or 3.58 percent.
Amount ($ millions)
Revised 2016 Operating Budget 318.59
Personal Services Costs, including Salary
Savings due maintaining strict hiring
controls and managing attrition (1.76)
Increase in Payroll Benefits including
Workers' Compensation, Health Insurance
and Pension contributions 5.59
Maintenance and Operating costs,
including snow and ice control, fuel, E-
ZPass account management, bridge and
highway contracts and less Federal
reimbursement for Maintenance and
Operations costs 6.03
Additional Expense associated with the
elimination of the allocation of expense to
Canal Support 5.96
Reduced Allocations to Other Funds to
reflect historical trends (4.97)
Studies, equipment and projects not
capitalized 0.82
Provisions for Environmental Remediation (0.25)
2017 Operating Budget 330.01
Year to Year Change 11.42
Thruway Authority 2017 Operating Budget
Major Components of Annual Change
10
! Major components of the $11.4 million annual change in the Thruway AuthorityOperating Budget include the following:
o Personal Services costs that are reduced by a net $1.7 million. Thisincludes an increase in baseline personal services of $3.0 million offset byprojected savings due to non-recurring personal services costs and $2.7million resulting from continued management of attrition and strict hiringcontrols.
o A net increase of $5.59 million for employee benefits. This includes anincrease of $1.5 million for health insurance costs; an increase of$850,000 in pension costs associated with employer contribution raterequirements recently announced by the New York State and LocalRetirement System; and, a $2.5 million increase in Workers’
Compensation Insurance costs based on recent projections fordetermining premium costs.
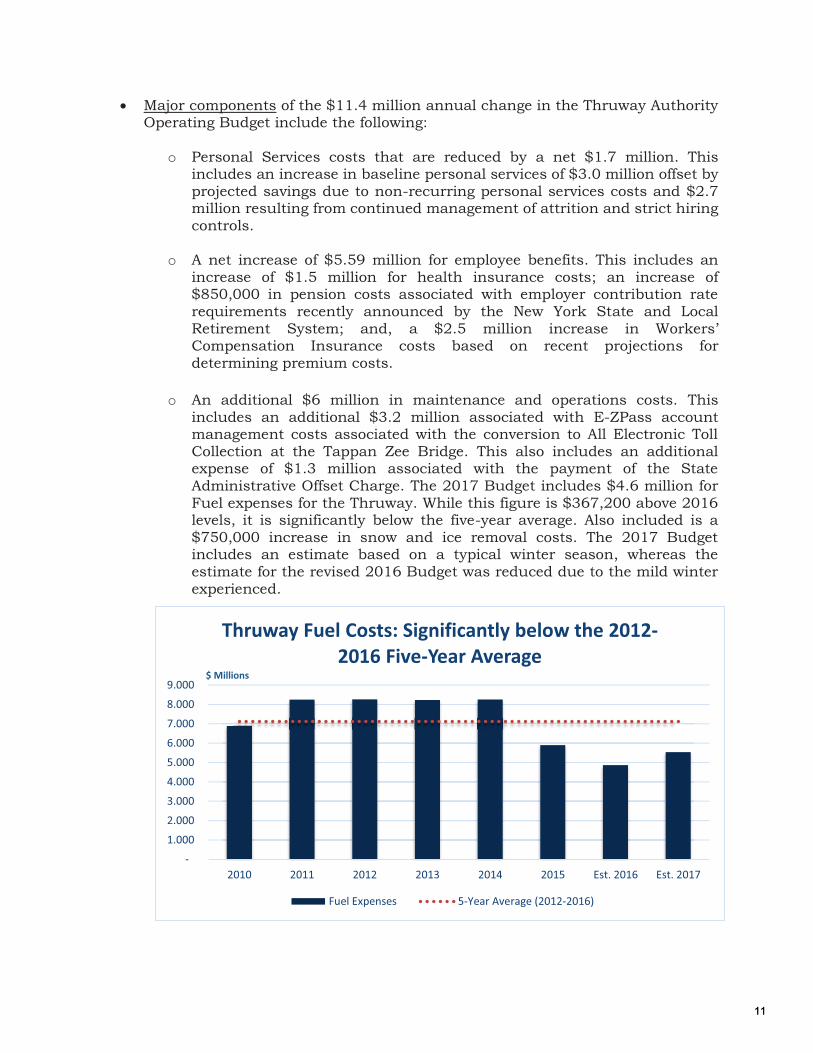
o An additional $6 million in maintenance and operations costs. Thisincludes an additional $3.2 million associated with E-ZPass accountmanagement costs associated with the conversion to All Electronic TollCollection at the Tappan Zee Bridge. This also includes an additionalexpense of $1.3 million associated with the payment of the StateAdministrative Offset Charge. The 2017 Budget includes $4.6 million forFuel expenses for the Thruway. While this figure is $367,200 above 2016levels, it is significantly below the five-year average. Also included is a$750,000 increase in snow and ice removal costs. The 2017 Budgetincludes an estimate based on a typical winter season, whereas theestimate for the revised 2016 Budget was reduced due to the mild winterexperienced.
-
1.000
2.000
3.000
4.000
5.000
6.000
7.000
8.000
9.000
2010 2011 2012 2013 2014 2015 Est. 2016 Est. 2017
Thruway Fuel Costs: Significantly below the 2012-
2016 Five-Year Average
Fuel Expenses 5-Year Average (2012-2016)
$ Millions
1111

o A year-to-year increase of $816,000 million in non-capitalized equipmentand project costs as a result of operating expenses related to theinstallation of a municipal waste water service connection to the MaldenService Area.
o An additional $5.9 million in expenses related to the transfer of the CanalCorporation to NYPA. Previously, these administrative costs were allocatedto the Canal Support budget. Due to the transfer of the Canal Corporation,these costs are fully accounted for in the Thruway Authority operatingbudget. In 2017, the Thruway Authority will continue to review theoperating impacts of the transfer in order to identify additional savings.Included in the 2017 Budget is an estimate of $200,000 in savings thatwill occur as a result of on-going review of the impacts of the transfer.
o Savings of $4.9 million resulting from increased allocations to capital andother funds based on the level of work included in the 2017 capital planand is consistent with levels set for such allocations in prior years.
o A savings of $250,000 for Provisions for Environmental Remediation.These savings are the result of the completion of several service arearemediation projects.
! After experiencing significant growth in operating expenses during the period of2000-2012, the Thruway Authority has operated at reduced levels since 2013(see figure 1). The 2017 Budget continues this trend by supporting an operating
$0
$2,000,000
$4,000,000
$6,000,000
$8,000,000
$10,000,000
$12,000,000
$14,000,000
2010 2011 2012 2013 2014 2015 est. 2016 est. 2017
Snow and Ice Control Costs
2010-2017
Annual Snow & Ice Control Costs Five-Year Average
12
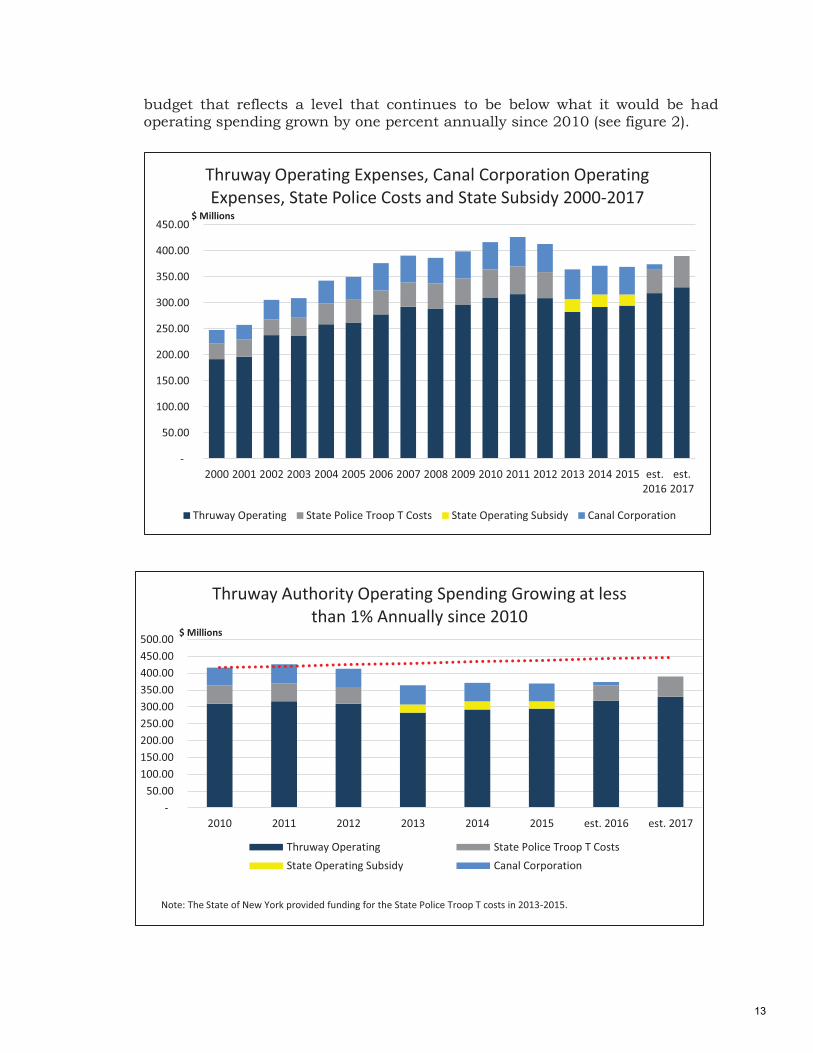
budget that reflects a level that continues to be below what it would be had operating spending grown by one percent annually since 2010 (see figure 2).
-
50.00
100.00
150.00
200.00
250.00
300.00
350.00
400.00
450.00
2000 2001 2002 2003 2004 2005 2006 2007 2008 2009 2010 2011 2012 2013 2014 2015 est.
2016
est.
2017
Thruway Operating Expenses, Canal Corporation Operating
Expenses, State Police Costs and State Subsidy 2000-2017
Thruway Operating State Police Troop T Costs State Operating Subsidy Canal Corporation
$ Millions
-
50.00
100.00
150.00
200.00
250.00
300.00
350.00
400.00
450.00
500.00
2010 2011 2012 2013 2014 2015 est. 2016 est. 2017
Thruway Authority Operating Spending Growing at less
than 1% Annually since 2010
Thruway Operating State Police Troop T Costs
State Operating Subsidy Canal Corporation
$ Millions
Note: The State of New York provided funding for the State Police Troop T costs in 2013-2015.
13

! The 2017 budget includes savings resulting from the reduction of 14 budgetedpositions and the continued management of personnel levels through strict hiringcontrols and the management of attrition. As of September 2016, the Thruwayhad 1,936 permanent filled positions, roughly unchanged from 2015 levels. The2017 Budget continues to rely on maintaining fill level at this overall amount inorder to achieve necessary savings to meet projections.
Summary- Canal Corporation Transfer to the New York Power Authority
2015 2016 2016 2017
Actual Original Revised Proposed
Canal Operating Expenses1 51.01 53.75 10.33 -
Canal Capital Expenses1 48.76 39.95 6.95 -
State Operating Subsidy (26.70) (26.70) 3.90 -
State Police Troop T - - 45.00 62.92
Thruway Operating Expenses
Previously allocated to the Canal
Support Budget (5.73) (5.84) (5.96) -
TOTAL 67.34 61.16 60.22 62.92
1 Net of NYPA Reimbursement for Revised 2016
Components of the Canal Corporation Transfer: Summary of
Changes (in $ Millions)
1,500
1,700
1,900
2,100
2,300
2,500
2,700
2,900
2010 2011 2012 2013 2014 2015 Est 2016 Est 2017
Po
siti
on
s
Thruway Authority Filled Positions 2010-2017
lower by 311 positions or 14 percent
Budgeted Vacant
14
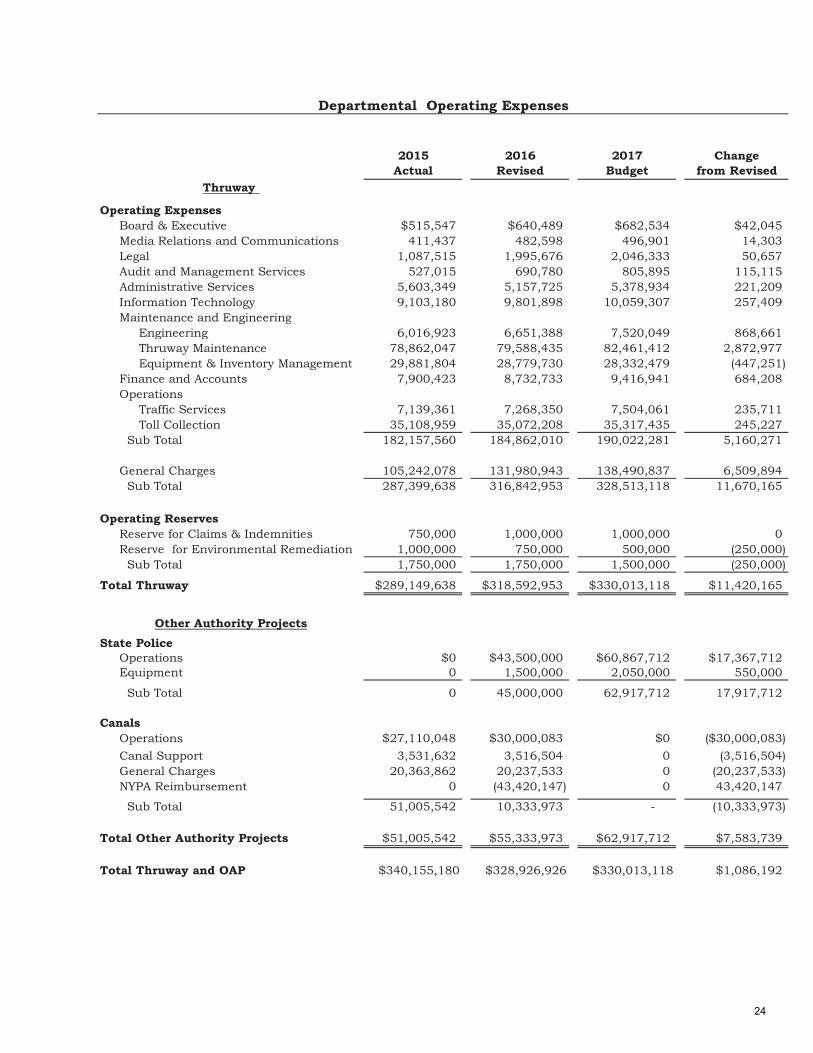
! The 2017 Budget does not include operating or capital expenses relating to theCanal Corporation. However, the 2017 Budget reflects the statutory changesincluded within the 2016 Enacted State Budget, which authorized: the transferof the Canal Corporation to the New York Power Authority (NYPA); requires theThruway Authority to reimburse the State Police for costs associated with TroopT patrolling the system; and removes a State operating subsidy that the ThruwayAuthority has received since 2013. The specific components of the CanalCorporation transfer legislation and the impacts on the revised 2016 Budget and2017 Budget are as follows:
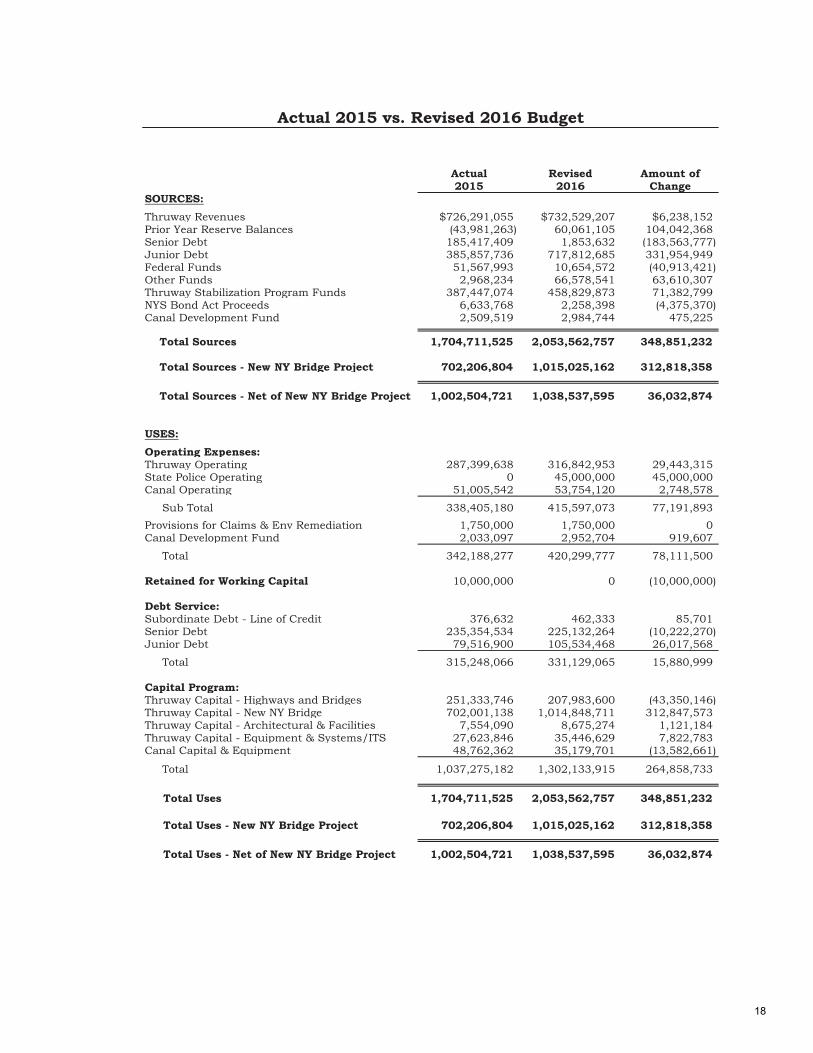
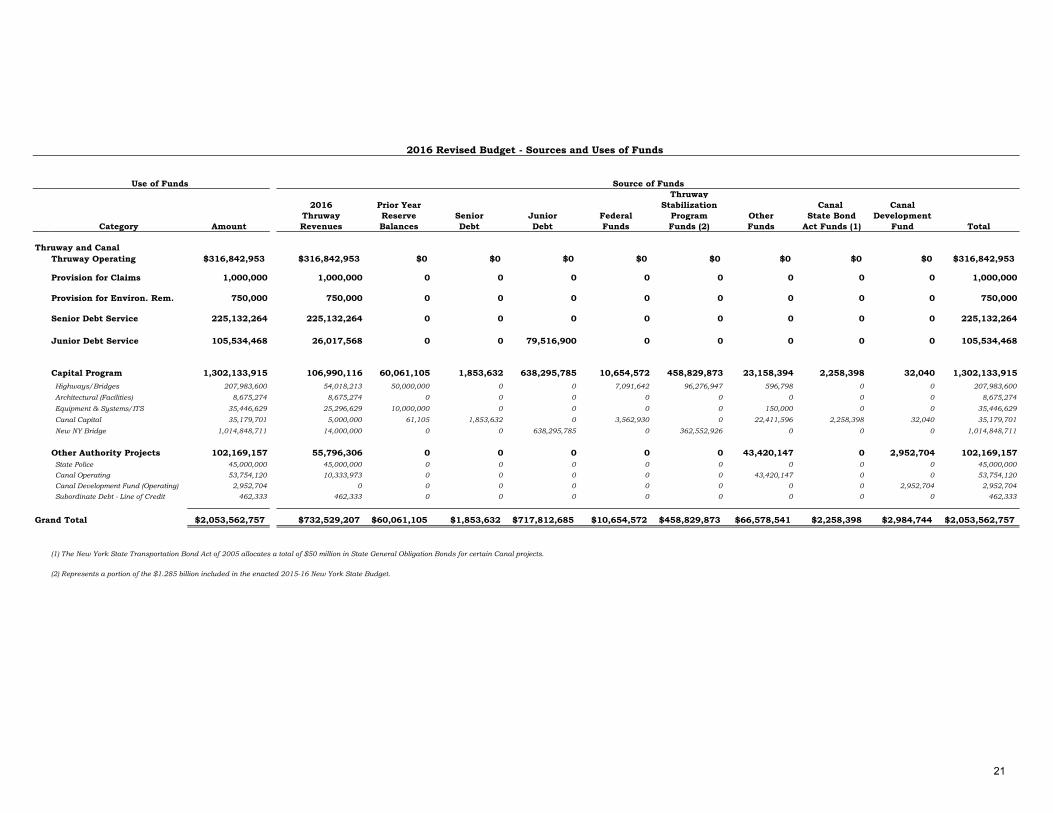
o Pursuant to the legislation, an agreement between the Thruway Authorityand NYPA has been executed, whereby NYPA will reimburse the ThruwayAuthority for operating and capital costs for the period of April 1-December 31, 2016. On January 1, 2017, jurisdiction for the operation ofthe Canal Corporation will be fully transferred to NYPA. As a result, therevised 2016 Budget includes a net $10.3 million in Canal Corporationoperating costs and $7 million in capital costs for the first quarter of 2016(January-March). Likewise, the 2017 Budget does not incorporate CanalCorporation operating and capital costs, in accordance with the transferto NYPA.
o Pursuant to the legislation, commencing on April 1, 2016, the ThruwayAuthority is responsible for reimbursement of the State Police for costsassociated Troop T patrolling the system. This reimbursement is to be fromthe Thruway General Reserve Fund (funds available after the payment ofoperating, maintenance and debt service costs). The revised 2016 budgetincorporates $45 million for reimbursement of State Police Troop T Costsfrom the General Reserve Fund. In 2017, $62.9 million is provided in theGeneral Reserve Fund for State Police Troop T costs.
o The revised 2016 budget includes the elimination of the $21.5 millionState Operating Subsidy that the Thruway has received annually for theperiod 2013-2015. In addition, the revised 2016 budget includes $3.9million in State Administrative Cost Recovery Charges. The 2017 Budgetincludes no operating subsidy by the State of New York and a $5.2 millioncosts associated with the payment of the State Administrative CostRecovery Charge.
o The 2017 Budget also provides for an increase of $6 million to account foradministrative costs of the Thruway that have been previously allocated tothe Canal Corporation budget. In 2017, as a result of the transfer of theCanal Corporation to NYPA, these costs are fully incorporated into theThruway Authority budget. In addition, it is anticipated thatreimbursement will be provided by NYPA for the costs of continuing limitedservices that the Thruway Authority will provide the Canal Corporation ona short-term basis after January 1, 2017.
15

CAPITAL PROGRAM
! The 2017 Budget provides a total of $1.094 billion to support the capital programof the Thruway Authority. This represents a reduction of $207.6 million or 15.9percent below Revised 2016 levels.
! The 2017 Budget incorporates estimates spending of $720.87 million in capitalprogram funding for the NNYB in 2017 a reduction of $293.98 million or 29percent below 2016 levels.
! The 2017 Budget would provide a 2017-2021 capital plan of $2.77 billion. Overthe course of the multi-year plan this includes $1.7 billion for Thruway projectsand roughly $1.1 billion for NNYB in the 2017-2021 capital plan.
0
200
400
600
800
1000
1200
2013 2014 2015 2016 2017 2018 2019
NNYB Project Construction Costs: 2013-2019$ Millions
2015 2016 2017 $ %
Actual Revised Budget Change Change
Highway & Bridge 251.33 207.98 320.20 112.22 54.0%
Architectural (Facilities) 7.55 8.68 12.80 4.13 47.6%
Equipment & Systems and ITS 27.62 35.45 40.61 5.16 14.6%
Canal Capital Program 48.76 35.18 - (35.18) -100.0%
Sub Total - Thruway and Canal 335.27 287.28 373.61 86.33 30.0%
New NY Bridge 702.00 1,014.85 720.87 (293.98) -29.0%
TOTAL 1,037.27 1,302.13 1,094.48 (207.65) -15.9%
2017 Budget
Capital Program Funding Uses (in $ millions)
16

! The 2017 Budget has incorporated the roughly $2 billion provided for theThruway Stabilization Program in 2015 and 2016. This includes $1.285 billionappropriated in 2015 and $700 million appropriated in the enacted 2016 StateBudget.
! In 2015 and 2016; the Thruway Authority is projected to have disbursed$848 million in Thruway Stabilization Funding. This includes $750 millionin support of the NNYB project and a projected $96.3 million for system-wide maintenance and repair projects.
! The 2017 budget projects that $728.3 million in 2017 capital spending willbe supported by Thruway Stabilization Program funds. This includes $450million for the NNYB and $278.3 million for system-wide maintenance andrepair projects.
! The 2017-2021 capital plan projects that in $352 million in System-wideprojects will be supported by Thruway Stabilization Program funds in2018-19. In addition, the plan forecasts that $58.5 million in ThruwayStabilization Program funds will be allocated to support the defeasance ofcurrently outstanding Senior debt.
! The 2017 Budget provides $358.4 million for debt service expenses. This reflectsan increase of $27.26 million or 8.2 percent above 2016 levels.
$-
$50
$100
$150
$200
$250
$300
$350
$400
$450
19
96
19
97
19
98
19
99
20
00
20
01
20
02
20
03
20
04
20
05
20
06
20
07
20
08
20
09
20
10
20
11
20
12
20
13
20
14
20
15
Est
20
16
Est
20
17
Est
20
18
Est
20
19
Est
20
20
Est
20
21
$ millions
Thruway Authority Capital Spending: 1996-
2021 (excluding NNYB)
Equipment, Facilities and ITS Highway and Bridge Capital
17
Actual Revised Amount of2015 2016 Change
SOURCES:
Thruway Revenues $726,291,055 $732,529,207 $6,238,152Prior Year Reserve Balances (43,981,263) 60,061,105 104,042,368Senior Debt 185,417,409 1,853,632 (183,563,777)Junior Debt 385,857,736 717,812,685 331,954,949Federal Funds 51,567,993 10,654,572 (40,913,421)Other Funds 2,968,234 66,578,541 63,610,307Thruway Stabilization Program Funds 387,447,074 458,829,873 71,382,799NYS Bond Act Proceeds 6,633,768 2,258,398 (4,375,370)Canal Development Fund 2,509,519 2,984,744 475,225
Total Sources 1,704,711,525 2,053,562,757 348,851,232
Total Sources - New NY Bridge Project 702,206,804 1,015,025,162 312,818,358
Total Sources - Net of New NY Bridge Project 1,002,504,721 1,038,537,595 36,032,874
USES:
Operating Expenses:Thruway Operating 287,399,638 316,842,953 29,443,315State Police Operating 0 45,000,000 45,000,000Canal Operating 51,005,542 53,754,120 2,748,578
Sub Total 338,405,180 415,597,073 77,191,893
Provisions for Claims & Env Remediation 1,750,000 1,750,000 0Canal Development Fund 2,033,097 2,952,704 919,607
Total 342,188,277 420,299,777 78,111,500
Retained for Working Capital 10,000,000 0 (10,000,000)
Debt Service:Subordinate Debt - Line of Credit 376,632 462,333 85,701Senior Debt 235,354,534 225,132,264 (10,222,270)Junior Debt 79,516,900 105,534,468 26,017,568
Total 315,248,066 331,129,065 15,880,999
Capital Program:Thruway Capital - Highways and Bridges 251,333,746 207,983,600 (43,350,146)Thruway Capital - New NY Bridge 702,001,138 1,014,848,711 312,847,573Thruway Capital - Architectural & Facilities 7,554,090 8,675,274 1,121,184Thruway Capital - Equipment & Systems/ITS 27,623,846 35,446,629 7,822,783Canal Capital & Equipment 48,762,362 35,179,701 (13,582,661)
Total 1,037,275,182 1,302,133,915 264,858,733
Total Uses 1,704,711,525 2,053,562,757 348,851,232
Total Uses - New NY Bridge Project 702,206,804 1,015,025,162 312,818,358
Total Uses - Net of New NY Bridge Project 1,002,504,721 1,038,537,595 36,032,874
Actual 2015 vs. Revised 2016 Budget
18

������������ � �������
�������������������������������
� � ��� !
�����"��#���$����� �� ������
������� � ������� ���%�� � �&
������� ��� ���� ����������������������������� ���������
� ��������� � �� �! "�����#��� ���� ������
$� ��%��� ��� �& '���������������%���� ���������#%� ������������������ ����
�����������"��#���$����� �� ��&(�!
�����"��#���$���������'(���� #�)*(� � �(����
������� � ������� ���%�� � �&
)��*��+$����,����� (��! )��� ���������� �������� ��
��������� �-$�������� �.� �����/ !�0 1�������� ����� ���������� ���� ��#� ������������� ����
����������������������
2� ����3������ 0�4 )� 5������� ������
��6� ���������3���������% &�� ��6� �������������������)��*��+$����
����6�����������78���� �� "�������� ����������9�� ��������������� ������
"������ ���� �� �� .����� ���������6��6�� �� ����6� �
$�� ������6� � �! ������� ����������������������� ���
����������������� �� �! .����� *�1��� �� �
"�����%� �.�����,������ �3� ������ - �!/ .����� #������������ ���6� �����%6� ��
)������2��7"���� �:��� - �!/ 1������������6����� ����������
$ ��� ����3� ���� - ��/ 1������������6����� ����������
��6#����6� �#%3���6 - ��/ .����� ���6#����6� ����������������
�������� - ��/ 1������������6����� ����������
8� ��� � -���/ .����� ����6����#���� ������������6�����6� ��%���6
:��� -(�&/ '������� �������������������
;��+���<3�6�� ���� -(�!/ 1����������������6� ��� �����������6��6
=������� ���� - ��/ =������� ����������6� ���������������� ��
�������������������'(���� #�"��#�� �&�4��
19

2016 Revised Financial PlanNew York State Thruway Authority
(in millions)
2016 Budget - Capital Program $1,395.7
Revised Financial Plan Adjustments:
New NY Bridge Project 0.0
Thruway Capital (88.8)
Canal Capital (4.8)
2016 Revised Budget - Capital Program $1,302.1
2016 Budget - Capital Program Explanations $1,395.7
Revised Financial Plan Adjustments:
New NY Bridge Project 0.0 No changes
Thruway Capital
Allocations (Salaries and Benefits) (2.0) Decrease in personal service and fringe benefit allocations due
to reduced personal service costs and fewer capital projects
Contract Bids and Projects completed under Contract value (7.3) Bid savings and projects closed out lower than contract value
Revised Letting Estimates (31.3)
Design Funding not spent (4.0)
Rejection of bids (1.0) Savings from contracts that were not awarded
Timing Differences (43.2)
Contractors spent more in 2015 than expected, thus reducing 2016 cash flow. Also, some contractors spending less in 2016 than originally projected.
(88.8)
Canal Capital
Revised Letting Estimates (2.0)
Contract Bids and Projects completed under Contract value (0.5) Bid savings and projects closed out lower than contract value
Timing Differences (2.3)
Contractors spent more in 2015 than expected, thus reducing 2016 cash flow. Also, some contractors spending less in 2016 than originally projected.
(4.8)
2016 Revised Capital Program Budget $1,302.1
20
Use of Funds Source of Funds
Thruway
2016 Prior Year Stabilization Canal Canal
Thruway Reserve Senior Junior Federal Program Other State Bond Development
Category Amount Revenues Balances Debt Debt Funds Funds (2) Funds Act Funds (1) Fund Total
Thruway and Canal
Thruway Operating $316,842,953 $316,842,953 $0 $0 $0 $0 $0 $0 $0 $0 $316,842,953
Provision for Claims 1,000,000 1,000,000 0 0 0 0 0 0 0 0 1,000,000
Provision for Environ. Rem. 750,000 750,000 0 0 0 0 0 0 0 0 750,000
Senior Debt Service 225,132,264 225,132,264 0 0 0 0 0 0 0 0 225,132,264
Junior Debt Service 105,534,468 26,017,568 0 0 79,516,900 0 0 0 0 0 105,534,468
Capital Program 1,302,133,915 106,990,116 60,061,105 1,853,632 638,295,785 10,654,572 458,829,873 23,158,394 2,258,398 32,040 1,302,133,915
Highways/Bridges 207,983,600 54,018,213 50,000,000 0 0 7,091,642 96,276,947 596,798 0 0 207,983,600
Architectural (Facilities) 8,675,274 8,675,274 0 0 0 0 0 0 0 0 8,675,274
Equipment & Systems/ITS 35,446,629 25,296,629 10,000,000 0 0 0 0 150,000 0 0 35,446,629
Canal Capital 35,179,701 5,000,000 61,105 1,853,632 0 3,562,930 0 22,411,596 2,258,398 32,040 35,179,701
New NY Bridge 1,014,848,711 14,000,000 0 0 638,295,785 0 362,552,926 0 0 0 1,014,848,711
Other Authority Projects 102,169,157 55,796,306 0 0 0 0 0 43,420,147 0 2,952,704 102,169,157
State Police 45,000,000 45,000,000 0 0 0 0 0 0 0 0 45,000,000
Canal Operating 53,754,120 10,333,973 0 0 0 0 0 43,420,147 0 0 53,754,120
Canal Development Fund (Operating) 2,952,704 0 0 0 0 0 0 0 0 2,952,704 2,952,704
Subordinate Debt - Line of Credit 462,333 462,333 0 0 0 0 0 0 0 0 462,333
Grand Total $2,053,562,757 $732,529,207 $60,061,105 $1,853,632 $717,812,685 $10,654,572 $458,829,873 $66,578,541 $2,258,398 $2,984,744 $2,053,562,757
2016 Revised Budget - Sources and Uses of Funds
(1) The New York State Transportation Bond Act of 2005 allocates a total of $50 million in State General Obligation Bonds for certain Canal projects.
(2) Represents a portion of the $1.285 billion included in the enacted 2015-16 New York State Budget.
21

���� ����
����� � ���� ����������
��������
����������� ������������ ������������ �����������
���������� �������� ���������� ���������� !����������"
#�����$%& ��������� � !���������"
'������$%&� ����������� ����������� !�����������"
()����(��) ���������� � !����������"
*&���(��) ���������� ��������� !����������"
��������#&�%���+�&�������,��-�(��) ����������� ����������� �����������
.�#����)�/ &���� ) ��������� � !���������"
0�����$���1-�&�(��) ��������� � !���������"
������������ ��� ��� !� ���� � ��"# �"����$� %��������#��&
������������ ����'�(�)�(*�������+��,��� ���� ��� ���� ����� "�!$# %�$!�$�����"&
������������ ����'�(������(�)�(*�������+��,��� ���!"� !�� $ ����#��#!�$�� "������!��
�����
�-����.���/-�.��
��������*1��&��, ����������� ����������� ����������
#&�&����� �*1��&��, ���������� ���������� ����������
0�����*1��&��, ���������� � !����������"
�����#�%���&�� ����������� ����������� !����������"
����� ��� �2���0���- �3�4��5�-)��&��� ��������� ��������� !�������"
0�����$���1-�&�(��) ��������� � !���������"
�������&�� ����������� ����������� !����������"
����.�������0��1.����-��� �
2�3���������
#�%��)���&�$%&�6�7����2�0�)�& ������� � !�������"
#�����$%&� ����������� ����������� ���������
'������$%& ����������� ����������� ����������
�������&�� ����������� ����������� ����������
��-����+�������
��������0�1�&���6�8�,���� ���)����), ����������� ����������� �����������
��������0�1�&���6�.��.�����), ������������� ����������� !�����������"
��������0�1�&���6�/� ��& &�����3�(� ���&� ��������� ���������� ���������
��������0�1�&���6�49��1-�&�3�#� &- :;�# ���������� ���������� ���������
0�����0�1�&���3�49��1-�&� ���������� � !����������"
�������&�� ������������� ������������� !�����������"
������������� ��� !� ���� � ��"# �"����$� %��������#��&
��������������'�(�)�(*�������+��,��� ���� ��� ���� ����� "�!$# %�$!�$�����"&
��������������'�(������(�)�(*�������+��,��� ���!"� !�� $ ����#��#!�$�� "������!��
������������ ������4������� ����
�5�.��
22

���� ���� ���� ���� ���� ������� ������ ������������
���������������������� ��� ��� � ������ ������ � ��� ��������������� ��� ���� ��������� ������ ����������������������������� ������� �� ����� ���� ����� � � ����������
��������������� ����������� ����� ����������� ����������������� ����������������� ������������������!���������� ��� ����������� ���� ������������� ���� ������������� ������������������������������ ��������������� ������������������ ����������������� ������������������
��������������"������� ���������������� �������������������� �������������������� �������������������������������� ���������������� �������������������� �������������������� ��������������������
���� ��������#������$�������������� ����������������� ������������������ ������������������ %���������������������������&�'�(����!������"����� ������������������� ������������������� ������������������� %���������������������)��������� ������������������� �������������������� �������������������� %�������������������������#�*������������� ������������������ ������������������� �������������������� ���������������������+�#��,������ ������������������ �������������������� ������������������� -������.���������������/����0���1����������� ������������������� �������������������� �������������������� %�������������������������,����/2�(0 -������.������������ -������.��������������� -������.��������������� %���������������������!�������#���3 �� ���������������� ������������������� �������������������� -�������.�������������/%4�����5��������� �� ���������������� ������������������ ������������������� ���������������������/%4�����6��#����7��� ���� �������������� �������������������� �������������������� %���������������������/%4�����6,����7��� ������������������� ������������������� ������������������� %���������������������6/��5������������,�7��� %��������������������� ������������������� ����������������� ���������������������7�����8��9��:�7��� ������������������� ������������������� ������������������ ���������������������������)�����7��� ������������������� ������������������� ������������������ ��������������������*�������������!�1���� ����� ������������� �������������������� �������������������� -�����.�������������������������������&�'�(�� ����� ������������ ����������������� ���������������� ������������������
������������ ������������������ ���������������� ���������������� ������������������
!������� ���"�#�"���$��� �%�"��#"���$��� �&�"'�'"'�'$��� �%"%%#"���$���
����"����������(����� ��������
23
���� ���� ���� ���� ���� ������� ������ ������������
��������� �����
����������� �� �������� �������� �������� �������
�������� ��� �����!�""����� ��� ������� ������� ������� ������
#$�� ��������� ��������� ��������� ������
%��� ���������$"� �&���� ������� ������� ������� �������
%�"��� �� ���&���� ��������� ��������� ��������� �������
'�(��"� ����)�*����$+ ��������� ��������� ���������� �������
���� �����������$�����$
��$�����$� ��������� ��������� ��������� �������
)*��,�+����� ���� ���������� ���������� ���������� ���������
�-��."� ���'��� ��+�����$"� ���������� ���������� ���������� /�������0
1����������%����� ��������� ��������� ��������� �������
2.�� ���
)��((���&���� ��������� ��������� ��������� �������
)����!���� ��� ���������� ���������� ���������� �������
��&�3�)� ��� ����������� ����������� ����������� ���������
4�����!*��$ � ����������� ����������� ����������� ���������
��&�3�)� ��� ����������� ����������� ����������� ����������
����������������
� ���(���!���" ���'��"�� � ������� ��������� ��������� �
� ����(����������"� ����"��� ��� ��������� ������� ������� /�������0
��&�3�)� ��� ��������� ��������� ��������� /�������0
!����!���"#� ������������ ������������ ������������ �����������
$����%�����
2.�� ��� �� ����������� ����������� ������������-��."� � ��������� ��������� �������
��&�3�)� ��� � ���������� ���������� ����������
���
2.�� ��� ����������� ����������� �� /�����������0
!�����&�..�� ��������� ��������� � /���������0
4�����!*��$ ���������� ���������� � /����������0
567%���"3�� "� � /����������0 � ����������
��&�3�)� ��� ���������������� ���������������� 8������������������ /����������0������
!���������� �������#�%��&���� ����������� ����������� ����������� ����������
!����!���"#���� %� ������������ ������������ ������������ ����������
!���"#�
������ �������#�%��&����
'������������������� �����
24
����
���� ����� ���� �����
������ ������ ������ ����������
��������������
����������� ���� ����������� ����������� ����������� ����������
��������������� ���������� ���������� ���������� �������
�� ������ ���� ����������� ���������� ���������� ���������� �������
!"#�� ���$��%���&�' ��������� ��������� ��������� �������
(��)��*���"#���������� � ��������� ��������� ���������� ���������
+�"#�� "������� � ������� ������� ������� ,�����-
���.�.��*�$��%�� ������� ������� ������� ,������-
/����#��������""�����0��#��������/������ �0�1 ������� ������� ������� �
2�� �#���'������ ���.�3 � � ,���������- ,���������-
������0���� ���������� ���������� ����������� ���������
�����
!45���2 ����/��3�"�� ���������� ���������� ���������� ���������
6�7�8��)�������9%%�� ,����������- � � �
2'"�������.������:� �.�� �,'������6�7�8��)������- ��������� ��������� ���������
���� �����"��"��'������ �$�' ��������� ��������� ��������� ,�������-
���%���������.� �� ��������� ������� ������� �������
!.���"�����!1#�� ������� ������� ������� ������
:��"����"��������.������.� � ������� ������� ������� ,�����-
���.����%���;����%���2 ��� ������� � � �
!"#�� ���<� �����=��.��!1#�� ,�������- ������� ������� �
0������2��� �����3��" ������ ������ ������� ������
����;� ����!���' ,�������- ,�������- ,�������- ,�����-
!"#�� �����%�� �!>��#"�� ������ ������� ������� �����
�.���� �9���� � ��!1#�� ������ ������ ������ ������
2���9���� ,�����- ��������� ������ ,���������-
������0���� ���������� ���������� ���������� ,�������-
���������
2��� ��������9�����&�' ,����������- ,����������- ,����������- ���������
!�"������������#����$��� �"���%��
0��#�����������'���,�- ��������� ������� ������� ������
&�����'������� ����� (���)�*�)��+ (�,�)-+�)-*, (�,+)*-�)+,� (�)��-)+-*
��������������
����������� ���� ����������� ����������� �� ,�����������-
��������������� ��������� ��������� � ,���������-
�� ������ ���� ����������� ��������� ��������� � ,���������-
!"#�� ���$��%���&�' ������� ������� � ,�������-
(��)��*���"#���������� � ��������� ��������� � ,���������-
+�"#�� "������� � ������� ������� � ,�������-
���.�.��*�$��%�� ������ ������ � ,������-
������0���� ���������� ���������� � ,����������-
�����
���� �����"��"��'������ �$�' ������ ������ � ,������-
:��"����"��������.������.� � ������ ������ � ,������-
!"#�� ���<� �����=��.��!1#�� ,������- ������ � ,������-
0������2��� �����3��" ��� ����� � ,�����-
!"#�� �����%�� �!>��#"�� ������ ������ � ,������-
���.����%���;����%���2 ��� ,�������- � � �
����"��'��'�"�� �!1#�� ��������� � � �
2���9���� ����� � � �
������0���� ��������� ������� � ,�������-
���������
2��� ��������9�����&�' ������ ,�������- � �������
&�����'������� ����� (��),�,)+�� (��)�,�)�,, (� .(��)�,�)�,,/
'������� �����
&���0���
����
�������������� ������������ ��������������������������������� ������ ���� ��� ����� �����!�����!��"#$��%����� �������� ��%� ����������� � ����&��������'�� ���
&()�
25
�������� �� �� �
�������� ������ ������� ������
������������
�����������
�������������� � � ��� ��� �� � � �������������� � � �������������� � � ��� ������ ���� ����� � �� ������������������� � �� ���������� ���������� ������������������������ � �� �������� ���� ��� ���� ���� ������������ � �� ���������� ���������� ����������
��������� !�"�����������#�������$�%� ���������� ����������� �������� ��
&���'���������( ��)� � ����� � ����� ������ ����*��������#�������$�%��+�,-.���� ������������ ������������ ������������
�����������
�������� ��/���� � �� 0�1 ��������� ��������� ��������� �������� ��/���� � �� ��� ������ � ������� �������� ��/�����02�3���1 � �� ��������
��������� !������#��� �������� � ��������� ��������� &���'���������( ��)� ��� �� � �� �����*��������#�������$�%� ��������� �� ��������� ����� � ��
����������������
&���4�"����� � �� �������� �������� �
�����,� !������� ���#��� �������� �������� �
������������
0�1�,5�����������63������5������ !�7�$��������������������8�!�) ������������ ��/��������4�����4�9�3�%��������3����
���5���������������������:
26
���� ���� ���� ����
���� ������� ������ ������������
�������
����� �������� ��������� ��������� ���������
����������� ������ �� ����� �� ����� �������
�������� ��� � ���� ������ ����
������ �������� ������ ������� �� ����
���������� ����� �� ��� �� ������ ��������
��������� �����
�!���"������#!������$�%&!����� ��� � �� �������� ������ �����
'��������������(��$�� �� ���� ��������� ��������� � �����
)����*��+�������"��,�����"������ � ���� ������� ������� �
)����*��+���%�*����"������)�"�������� ������� � ���� ����� - ����.
���������� �������� ��� �� � ��������� ������
!�����������" # ��������� ������ � �� � � � �������
$�����%�&��$�������"�#
������� ��� � � � �� ���� �������� �� ���
�����������'��(��������)������*����� -�������. � � �
!���������� �����%�&��$������
���������� ���� � �� ��������� �� ����� -������.
��������+������*��������
%/��!"��������0��������� ������ � �������� ������ ������
1�$(2�������3���$� ������� ������ �� �� -�����.
��������� ���� ��� �������� �������� -������.
,�����%�&��$�������"�#
4������ ��� � ���� �� � ���� �� ����
-���������������.����������*�������
5�2�56�3���$��7��8��� � ����� �������� � -��������.
������ �������/�*��0����
�������9�#!���������������!!��� �������� �� �� �� � -�� �� ��.
��'��������������(��$�� ������ ��� �� � -��� ��.
:���;
567<�)��"�����"��� � -�������.
<�8���"����+���7��*����� ������ � � �
0������=#�(���<���+���#!�������� -������. � � �
���������� ��� � �������� � -��������.
1�������������-��
���������!����� ������� ������ � - ������.
�������7����� � � ������ ������ �������
������������� ����9�:�����+������� ����� ����� � -�����.
���������� �������� ������ ������ �� ���
���� $0 $0 $0 $0
$�����%�&��$��������������������" )�# �>�� �>�� �>��
$�����2�,�����%�&��$��������������
�����" )"�3�## �>�� �>� �>��
-��4����-���
1�������������������������
27

�������������� �����������
���� ���� ����
������ ������� ������
� �!�"�����������
#�� !�"�$�������
��������� �� ��� ��� ��� ��� �� �� ��� ���
������������������������ � �� ��� ��� �� ��� �� �� ���
���!�"����� �� ��� ��� �� ��� ��� �� � ���
�� ���������% ���������&
���� ����������������� � ��� ��� � ��� �� � ��� ���
���!�"����� � ��� ��� � ��� �� � ��� ���
'(��������$�)"����������*�)
#$��%&������!����&� � �� �� � ��� ��� �� ��� ���
'��� �(���������%���������!����&������������� � �� �� ��� �� � ��� ���
���!�"����� � �� ��� �� ��� �� �� ��� ���
������������������
����������� �� �� ��� � ��� ��� �
���������������������������� � � ��� ��� � ��� ��� �
#$��%&��� ��� ��� ��� � �
���!�"����� �� �� �� �� ��� ��� �
)�+������,�� �!�"���������� -..�/��0/�00 -�1�/�1�/��0 -.�./���/1.1
2�!�23��������4���
2�!�23������
��������� ��� ��� ��� � ��� ��� ��� ��� ��� ���
������������������������ � � �� ��� � ��� � � ��� ���
)�+������,�2�!�23������ -���/���/�.1 -�/��0/101/��� -���/1�5/�50
6��27��8��9 -�/�.�/���/�1� -�/.��/�../5�� -�/�50/01�/�.�
28
���� ���� �������� ������ ����
�����������������
������������
������������� ����������� ���������� �������� ���������� ��������� �
����� �!"#�� ���������� ���������� �
��� �����!�������
� ��"��$ #�%�!���������������� ����������� ��������� �������%�!����&"�#�#�"��"���'(#�)�* ��������� ��������� ������ �!"#�� ����������� ��������� �
+ � �, �-���# ���( �.���/�������������� � ���������� ����������+ � �, �-���# ���( �.���/�01��&2 �# � ���������� ���������3 � ����+ � �, �.��� � ������ �!�������+ , �� � ���������� ���������� ��������������� �!"#�� ���������� ����������� ����������
"��������
�#�# ��-��( ���� "���%�!45������� ��������� ��������� ����������#�# ��-��( ���� "���%�������$ ,�.���6758'�+ �2 ������� ���������� �01��&2 �#�'�(#�"��8�"( �� ������� ������� �������!��������#� ���9�#�"��8�"���2�.���� � ���������� ���������������� �!"#�� ��������� ����������� �����������
#$������%����������������� &''�(��)(�)) &�*�(�*�(��) &'��(��+(�*�
�����,��������!��-��
������������:"�������3���#�8�"( �� �� �� ��
��� �����!�������;���"��$ # ����������� ����������� ���������������� �!"#�� ����������� ����������� �����������
!�������+ , �� � ��������� ���������� ������ �!"#�� ��������� ���������� �
"��������!��������#� ���9�#�"��8�"���2�.���� ����������� ����������� �����������
#$������%������,������� &���(���(�'* &�(��)(*)*(��� &���(*�+(�+)
. ��/��"��0 &�(�'�(���(�*� &�('��(�''(+�� &�(�+�(+'+('��
��1����!�����2��������#�����
!�����,������������� ������� ������
������������ ���� �� ������ ��������� ������� ��� ����������� ��������������������� �� ���� �������� ���� !����"
!�����,������������� ������� ������
29

���� ���� ����
���� ������ ����
��� ����
����������� ���������� ����������� ��������
���������� ��������� � � �
������� !"� #���#����#� �#��$������ $����������
%&����%��& � � �
'�����(�)"�"�*���" #���������� #�$���$��$� �����������
��������������� �������� �! ������������� ������ �"#!
�����
�$����%���&$�%����
��������+,��"��- $������ ������� �������
�'�(�)���$����*��+�$,�%�-��)��,�./���
./��,0�" � � �
�'�(�)���$����*�0�(�01��������
��������%��� �1�2�"���� ��������# ������$$� ���������
3��"���" ����������� ��������#���� ��$������#�
3�00���"����4�" �%��& $����� #�������� $��������
�-�"��4�5�� �$���� � �
�����)�!���"�� ��$������#� ������������� �$���������
�������������� �������� �! ������������� ������ �"#!
����������� �������������������2����������
0�(�01�������
30
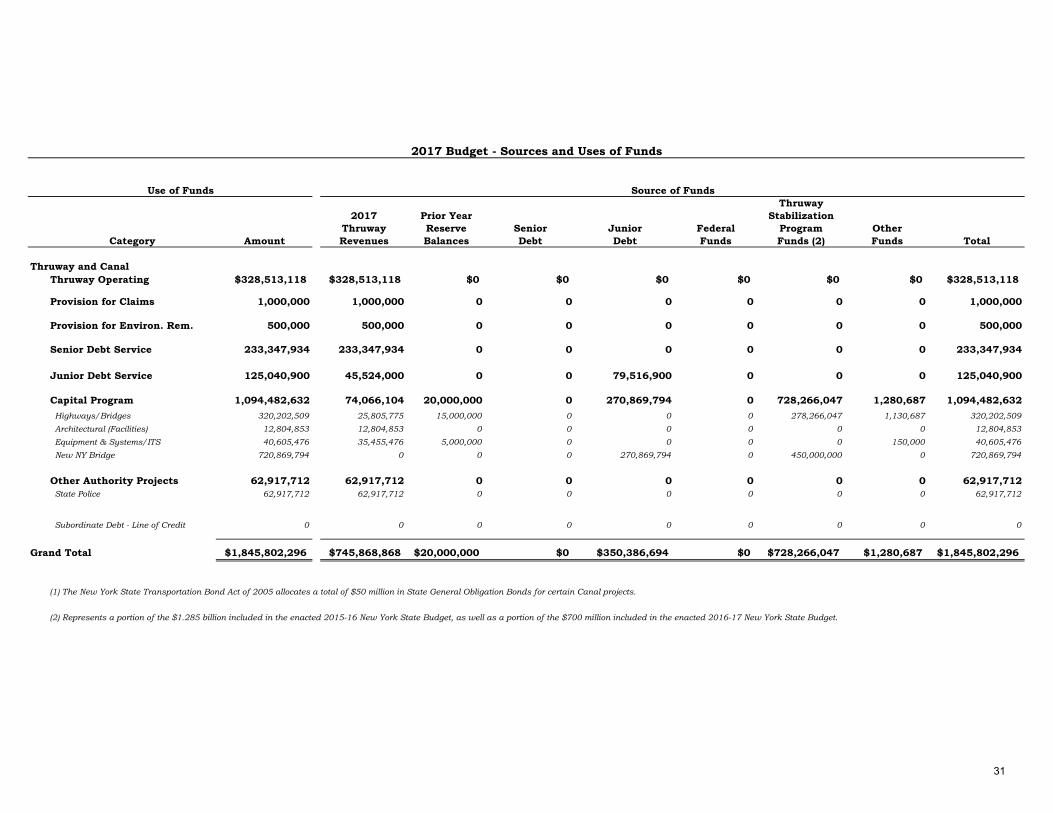
2017 Budget - Sources and Uses of Funds
Use of Funds Source of Funds
Thruway
2017 Prior Year Stabilization
Thruway Reserve Senior Junior Federal Program Other
Category Amount Revenues Balances Debt Debt Funds Funds (2) Funds Total
Thruway and Canal
Thruway Operating $328,513,118 $328,513,118 $0 $0 $0 $0 $0 $0 $328,513,118
Provision for Claims 1,000,000 1,000,000 0 0 0 0 0 0 1,000,000
Provision for Environ. Rem. 500,000 500,000 0 0 0 0 0 0 500,000
Senior Debt Service 233,347,934 233,347,934 0 0 0 0 0 0 233,347,934
Junior Debt Service 125,040,900 45,524,000 0 0 79,516,900 0 0 0 125,040,900
Capital Program 1,094,482,632 74,066,104 20,000,000 0 270,869,794 0 728,266,047 1,280,687 1,094,482,632
Highways/Bridges 320,202,509 25,805,775 15,000,000 0 0 0 278,266,047 1,130,687 320,202,509
Architectural (Facilities) 12,804,853 12,804,853 0 0 0 0 0 0 12,804,853
Equipment & Systems/ITS 40,605,476 35,455,476 5,000,000 0 0 0 0 150,000 40,605,476
New NY Bridge 720,869,794 0 0 0 270,869,794 0 450,000,000 0 720,869,794
Other Authority Projects 62,917,712 62,917,712 0 0 0 0 0 0 62,917,712
State Police 62,917,712 62,917,712 0 0 0 0 0 0 62,917,712
Subordinate Debt - Line of Credit 0 0 0 0 0 0 0 0 0
Grand Total $1,845,802,296 $745,868,868 $20,000,000 $0 $350,386,694 $0 $728,266,047 $1,280,687 $1,845,802,296
(1) The New York State Transportation Bond Act of 2005 allocates a total of $50 million in State General Obligation Bonds for certain Canal projects.
(2) Represents a portion of the $1.285 billion included in the enacted 2015-16 New York State Budget, as well as a portion of the $700 million included in the enacted 2016-17 New York State Budget.
31
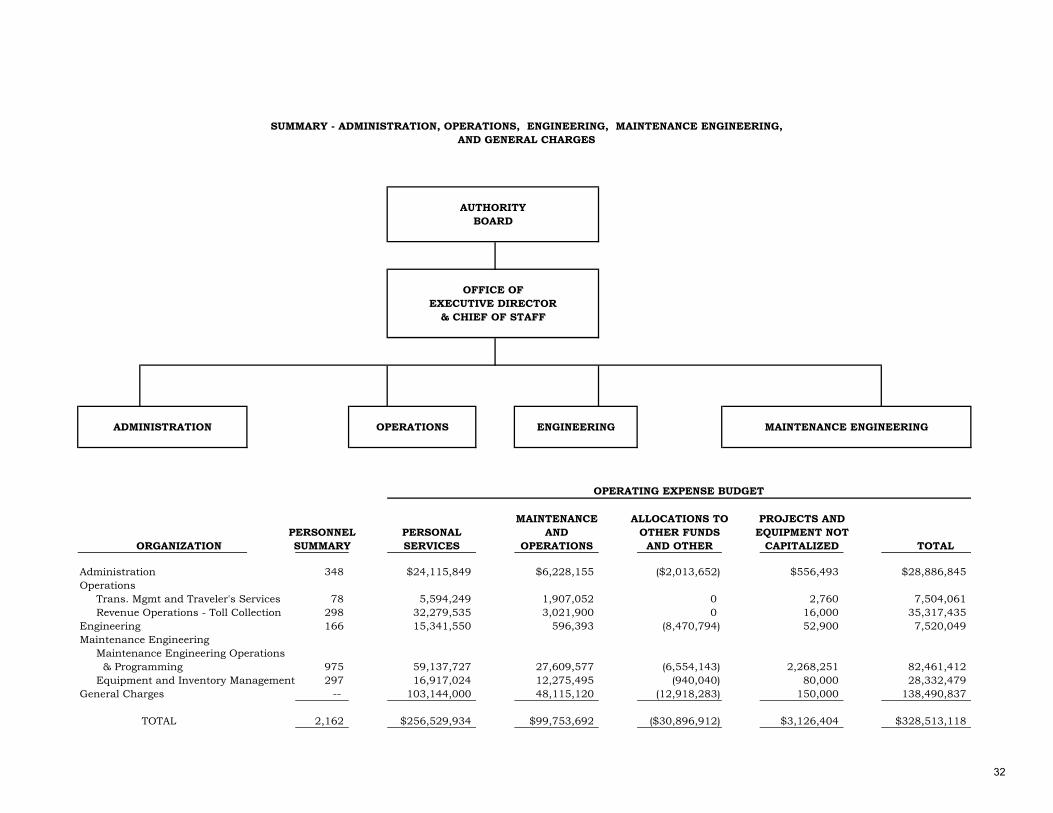
SUMMARY - ADMINISTRATION, OPERATIONS, ENGINEERING, MAINTENANCE ENGINEERING,
AND GENERAL CHARGES
AUTHORITY
BOARD
OFFICE OF
EXECUTIVE DIRECTOR
& CHIEF OF STAFF
ADMINISTRATION OPERATIONS ENGINEERING MAINTENANCE ENGINEERING
OPERATING EXPENSE BUDGET
MAINTENANCE ALLOCATIONS TO PROJECTS AND
PERSONNEL PERSONAL AND OTHER FUNDS EQUIPMENT NOT
ORGANIZATION SUMMARY SERVICES OPERATIONS AND OTHER CAPITALIZED TOTAL
Administration 348 $24,115,849 $6,228,155 ($2,013,652) $556,493 $28,886,845
Operations
Trans. Mgmt and Traveler's Services 78 5,594,249 1,907,052 0 2,760 7,504,061
Revenue Operations - Toll Collection 298 32,279,535 3,021,900 0 16,000 35,317,435
Engineering 166 15,341,550 596,393 (8,470,794) 52,900 7,520,049
Maintenance Engineering
Maintenance Engineering Operations
& Programming 975 59,137,727 27,609,577 (6,554,143) 2,268,251 82,461,412
Equipment and Inventory Management 297 16,917,024 12,275,495 (940,040) 80,000 28,332,479
General Charges -- 103,144,000 48,115,120 (12,918,283) 150,000 138,490,837
TOTAL 2,162 $256,529,934 $99,753,692 ($30,896,912) $3,126,404 $328,513,118
32
����������� ���������
���� ������������
���������������� � �
������������
����������������������������������������������� ��
������������������������������������������� � �
����!���������� "##
��������������!���������
�������������������!���������$�������������%������� �&
���������!'�����������(������)��������� � �������%������� �$"#�
���� ������� !"���
����������������� *"��$� #$��&
����+�����,���-��� ".&$ &$...
�����������������)����!/� "�$.��$&.
������������%)�������� #$&"&$�#�
����!/����0,��������1����2������,�)�,�1 "$ #$."�
�����3�-��4�--������ #& $� �
������������%)��������)����!/� &&$� �
�����3��1�����%)���� �"&$"�
����������������5���� 6��$"".7
�����������������5���� 6"&.$ ..7
������)������� 6 $�� $ ��7
�����%������������� �&#$&� $ �
��!������"����#� �����! ���
����!�8%������������������� ��$���$�#.
�������9�:�(��������� ".$&� $&�
�����������;�$���� $#"�$�..
������������������� &$"� $...
����,����� &$�" $"�"
����������������������������)�6�������<�9�=�1�����7 &$�..$...
������������������ $&&&$
����!������ �$&.&$�.�
����(�������%�������:�����)�,���� �$� �$�..
�����3�9)����9) � �$�..$...
��������������:���������!'������� �$&#.$� �
���������3��� "$�& $"�.
����,�������� "$ .&$. #
���������� "$ �#$ "�
���������:�(���!'���������3�9)9��� "$.. $"��
����%�-��������������� "$�&#$�#.
����<����;� � "$&..
����������4��������������� #�&$ &.
��������3������������ # �$���
����%���35�������� &� $�.#
����>������+��� .#$...
����!�����������!/������ �&$...
����������������������������������� #�$#��
��������5����������������������� �&$...
�����������;�����!/����� ��$�&�
����4���$�,��1�$���5��������� �&�$�"�
����?��������������� � $"�&
����%�������������� � .$&"�
����������)�+��� �#�$&��
������������������ � "$...
33

����������� ����������$%������&'
����+��������:�%�������-��)��������� � �$���
�����--�����������-��)��������� �#"$�..
����@�� �" $�&"
����������������!/����� �. $��.
������������(������) "��$� �
���������!/����������� " �$&�#
��������3���������� " $..
����+�����)�+��� "�.$...
����!����)���2������A����!/����� "&.$...
�������-���������������<���(������) "".$...
��������������������� "..$...
����!����)����-��)�!'������� ".�$"..
�����������!/����� ""�$ ."
����%����� ".&$�..
����%���� �&$&..
��������5�����������2��������+����������� "..$...
�������������������� �#$� &
����+���3��%����%��� �#$�#
�����������(������ # $...
����%�������:�4��������� &.$...
������������3���!/����� "..$...
����!����)���4���������� �$�..
�������������+��� .$...
����(������)��5�����������!/����� &.$...
���������������B�����) �&$...
����4����� ��$�..
��������5�����������<=��A9�4������� "&$...
����!������������������ "�$.
����������3�� ��$ ��
����(������)�(����������� 6� $...7
��������5���������-�����������!/����� 6&.$...7
����%�C�����-��������� 6��$ � 7
��������������:��������������5��������+�������� 6"..$...7
������3�4��������!��� 6"�.$...7
��������5��������5)����� 6�$"�.$...7
����<�9�=�1������%�9�����3���)���������� 6&..$...7
����<�9�=�1�������--������������� .
�������������������������� $�&�$# �
��� "��! �����#� �(���
����������������-��3�9)�%�����������+�����,���-��� 6�.$� #$ "�7
���������������������3� 6�.$� #$ "�7
�� )�"�����#��*�!������� ��"��!���!+�#
����%�C���������������D�� �$� �$"..
����!'������������������D�� �� $�.
�����%�C��������!'��������<���������D�� �$"�#$ .
� ������(��,�� -.�/01�.0��/
34
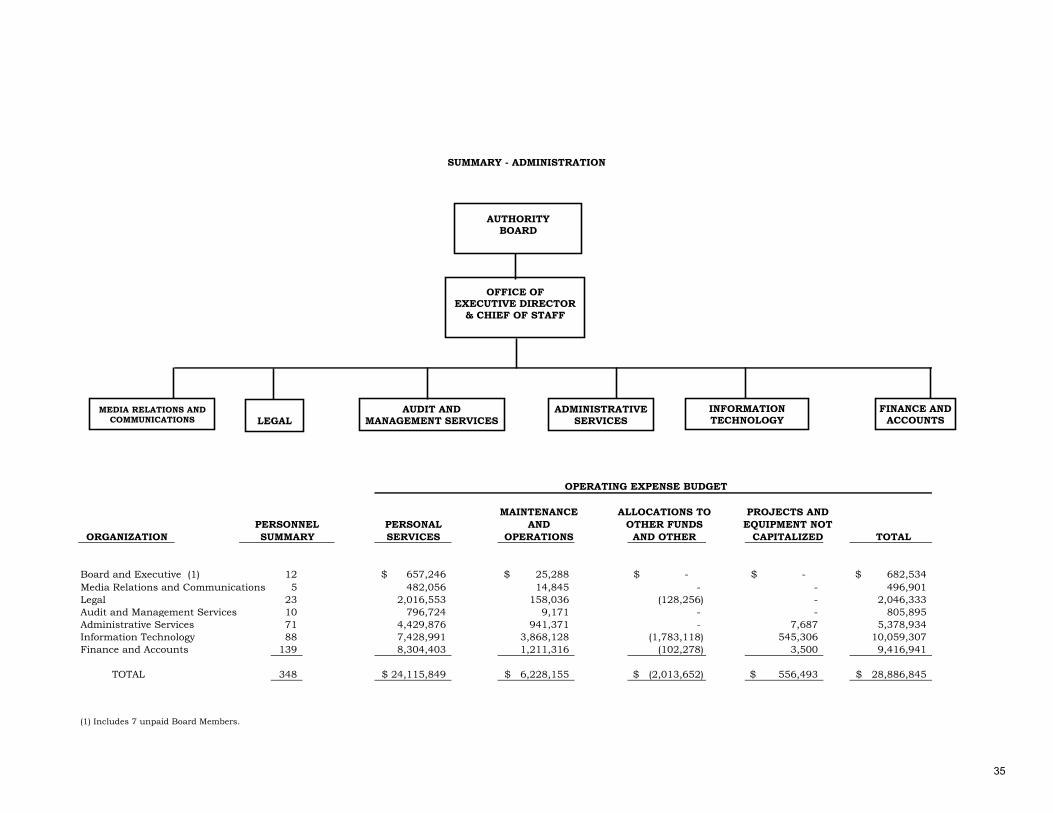
SUMMARY - ADMINISTRATION
OPERATING EXPENSE BUDGET
MAINTENANCE ALLOCATIONS TO PROJECTS AND
PERSONNEL PERSONAL AND OTHER FUNDS EQUIPMENT NOT
ORGANIZATION SUMMARY SERVICES OPERATIONS AND OTHER CAPITALIZED TOTAL
Board and Executive (1) 12 657,246$ 25,288$ -$ -$ 682,534$
Media Relations and Communications 5 482,056 14,845 - - 496,901
Legal 23 2,016,553 158,036 (128,256) - 2,046,333
Audit and Management Services 10 796,724 9,171 - - 805,895
Administrative Services 71 4,429,876 941,371 - 7,687 5,378,934
Information Technology 88 7,428,991 3,868,128 (1,783,118) 545,306 10,059,307
Finance and Accounts 139 8,304,403 1,211,316 (102,278) 3,500 9,416,941
TOTAL 348 24,115,849$ 6,228,155$ (2,013,652)$ 556,493$ 28,886,845$
(1) Includes 7 unpaid Board Members.
MEDIA RELATIONS AND
COMMUNICATIONS LEGAL
AUDIT ANDMANAGEMENT SERVICES
ADMINISTRATIVESERVICES
INFORMATIONTECHNOLOGY
FINANCE ANDACCOUNTS
AUTHORITYBOARD
OFFICE OFEXECUTIVE DIRECTOR
& CHIEF OF STAFF
35
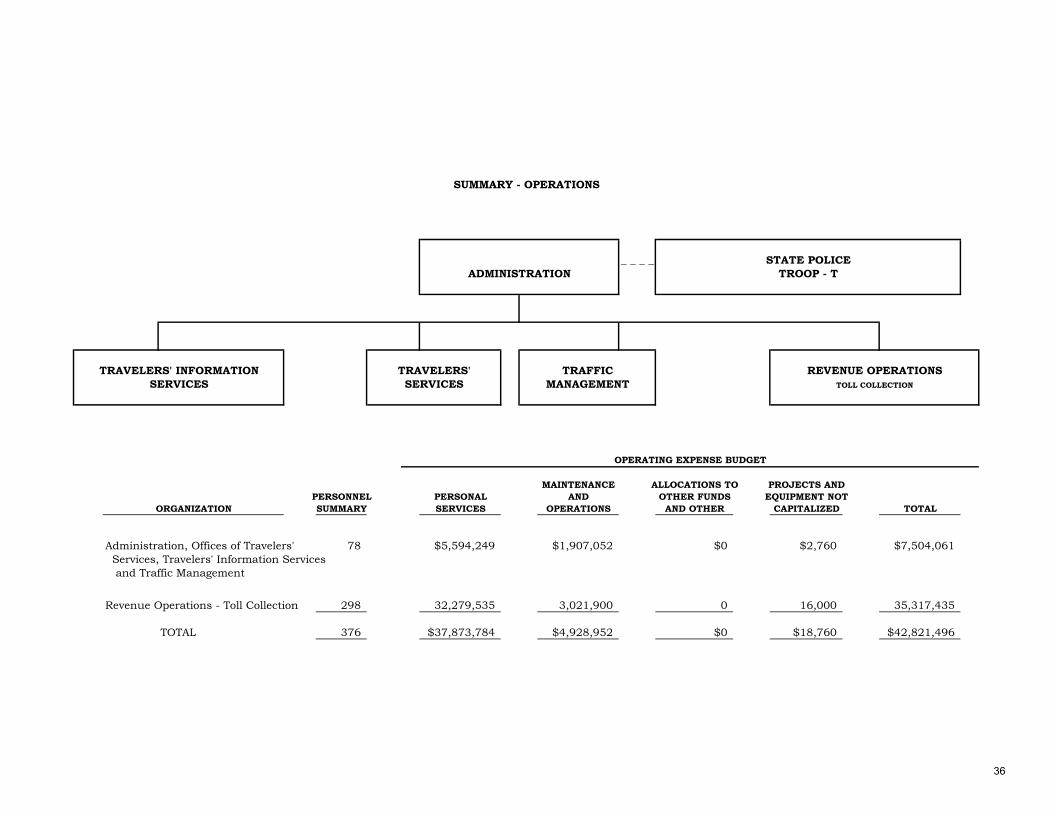
SUMMARY - OPERATIONS
_ _ _ _ _ _ STATE POLICE
ADMINISTRATION TROOP - T
TRAVELERS' INFORMATION TRAVELERS' TRAFFIC REVENUE OPERATIONS
SERVICES SERVICES MANAGEMENT TOLL COLLECTION
OPERATING EXPENSE BUDGET
MAINTENANCE ALLOCATIONS TO PROJECTS AND
PERSONNEL PERSONAL AND OTHER FUNDS EQUIPMENT NOT
ORGANIZATION SUMMARY SERVICES OPERATIONS AND OTHER CAPITALIZED TOTAL
Administration, Offices of Travelers' 78 $5,594,249 $1,907,052 $0 $2,760 $7,504,061
Services, Travelers' Information Services
and Traffic Management
Revenue Operations - Toll Collection 298 32,279,535 3,021,900 0 16,000 35,317,435
TOTAL 376 $37,873,784 $4,928,952 $0 $18,760 $42,821,496
36

SUMMARY - ENGINEERING
OPERATING EXPENSE BUDGET
MAINTENANCE ALLOCATIONS TO PROJECTS AND
PERSONNEL PERSONAL AND OTHER FUNDS EQUIPMENT NOT
ORGANIZATION SUMMARY SERVICES OPERATIONS AND OTHER CAPITALIZED TOTAL
Engineering 166 $15,341,550 $596,393 ($8,470,794) $52,900 $7,520,049
- Design
- Transportation Planning & Environmental Services
- Construction Management
- Contract Management
- Capital Program Management
- New NY Bridge Project
DESIGN
TRANSPORTATIONPLANNING &
ENVIRONMENTAL
SERVICES
CONSTRUCTION
MANAGEMENT
CONTRACT
MANAGEMENT
ENGINEERING
CAPITALPROGRAM
MANAGEMENT
NEW NY BRIDGE PROJECT
37
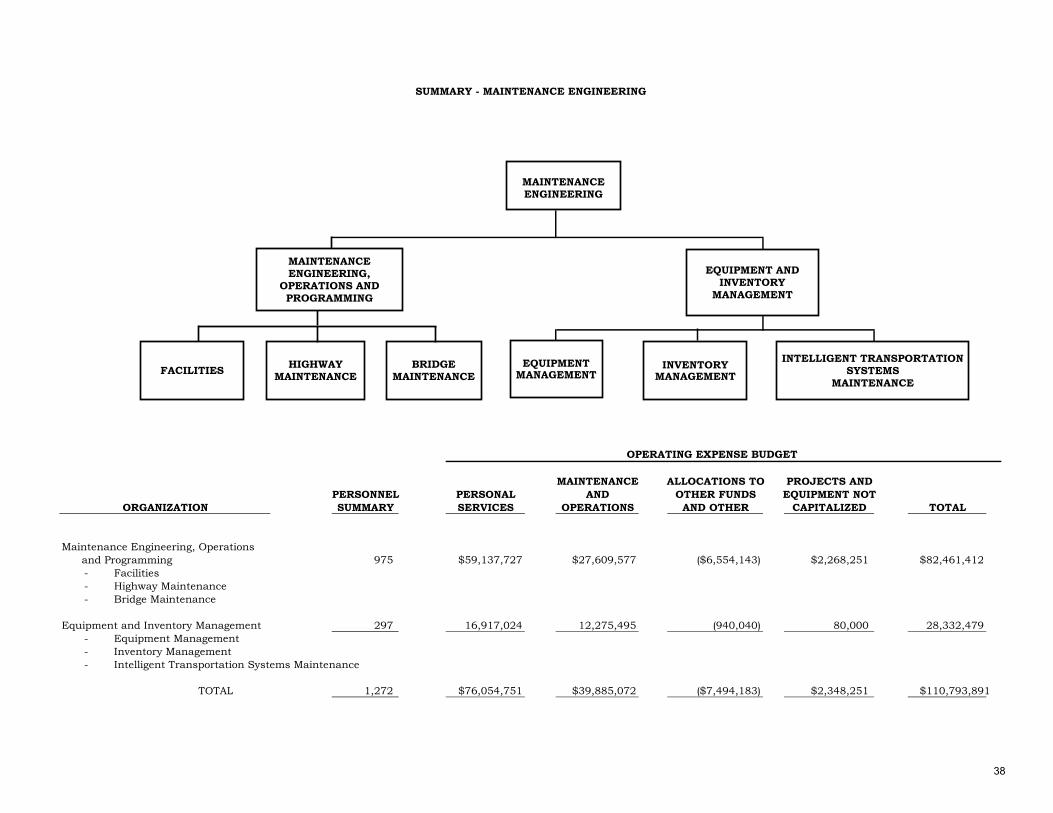
SUMMARY - MAINTENANCE ENGINEERING
OPERATING EXPENSE BUDGET
MAINTENANCE ALLOCATIONS TO PROJECTS AND
PERSONNEL PERSONAL AND OTHER FUNDS EQUIPMENT NOT
ORGANIZATION SUMMARY SERVICES OPERATIONS AND OTHER CAPITALIZED TOTAL
Maintenance Engineering, Operations
and Programming 975 $59,137,727 $27,609,577 ($6,554,143) $2,268,251 $82,461,412
- Facilities
- Highway Maintenance
- Bridge Maintenance
Equipment and Inventory Management 297 16,917,024 12,275,495 (940,040) 80,000 28,332,479
- Equipment Management
- Inventory Management
- Intelligent Transportation Systems Maintenance
TOTAL 1,272 $76,054,751 $39,885,072 ($7,494,183) $2,348,251 $110,793,891
MAINTENANCEENGINEERING,
OPERATIONS AND
PROGRAMMING
EQUIPMENT ANDINVENTORY
MANAGEMENT
FACILITIESHIGHWAY
MAINTENANCE
BRIDGE
MAINTENANCEINVENTORY
MANAGEMENT
INTELLIGENT TRANSPORTATION SYSTEMS
MAINTENANCE
EQUIPMENTMANAGEMENT
MAINTENANCE
ENGINEERING
38

�������� ���� � ��������� ����� ������
����������
�������������
���
���� ����� ��� ��� ���� � �
���� �� �� ��� ��� ��� � ����� �����
���� ����� ��� ��� ����� ��� � �����
��� ���� � � ��� ���� ���� �����
���� ��� � � ��� ��� ��� �����
� ���� �� ��� ��� �� � ����
� � ��� �� �� ���� �� �����
� � ��� � ��� ����� ��� ��� �
� � ���� � ��� ����� ���� �����
� � ���� � ��� ����� ��� �����
� � ����� � ��� ����� ��� �����
� � ��� � ��� ����� ���� ��� �
� � ���� � ��� ����� � �����
� ����� � ��� ��� � �� � �����
� � ���� � �� ����� �� � �����
� � ��� � � ��� ����� ��� �����
� �� ����� ��� ����� ��� � �����
� �� ���� �� ���� ���� �����
� �� ���� �� ���� ��� � �� ��
� �� ����� �� ����� ����� �������
� �� ���� ��� ����� �� � �������
� ����������� ���� ��� ����� ���� ������
� �� ����� ��� ����� ���� �������
� �� ����� ����� ����� �������
��������������� �������������������� ��������� �������� ���� �������������������� �������� ���� !� ����"�#�
$ �%�&���'�������� ��(����� �� �)
������������ �����!��"�#�$����$����������
#�$����$����������
�������������*�������������+����,�������� ������� �����-�����- �� �� ��#����������������� ����"�#�$ �%�&���
. #������ ��)
39

! ! ! ! !!!!!!!!!!!!!!!!!!!!!Memorandum! ! ! ! ! ! !!!!!!!!!Page!1!of!11!
Jacobs!NAI!Surface!Transportation!Consultancy!
Date! August!19,!2016!
To! Matt!Howard!and!Dorraine!Steele;!NYSTA!
From! Richard!Gobeille,!Suzanne!Seegmuller,!and!Liz!Horta!
Subject! NYSTA!Budget!Forecast!
!
The! New! York! State! Thruway! Authority! (“Authority”)! has! requested! that! Jacobs! Civil! Consultants,! Inc.!
provide!forecasts!of!traffic!and!revenue!for!use!in!its!2017!Budget!Forecast.!!!It!is!important!to!note!that!the!
forecasts!contained!herein!represent!our!baseline!view!of!projected!traffic!and!toll!revenue!trends!without!
consideration!of!any!changes!to!toll!rates!or!collection!methods!other!than! the!transition!to!all!electronic!
tolling!(AET)!at!the!Tappan!Zee!Bridge!which!occurred!on!April!23,!2016.!!!We!have!included!a!discussion!of!
recent!economic!trends!to!provide!a!better!understanding!of!the!process!that!went!into!the!development!of!
the!current!forecast.!!!
Current!Baseline!Traffic!and!Toll!Revenue!Forecasts!
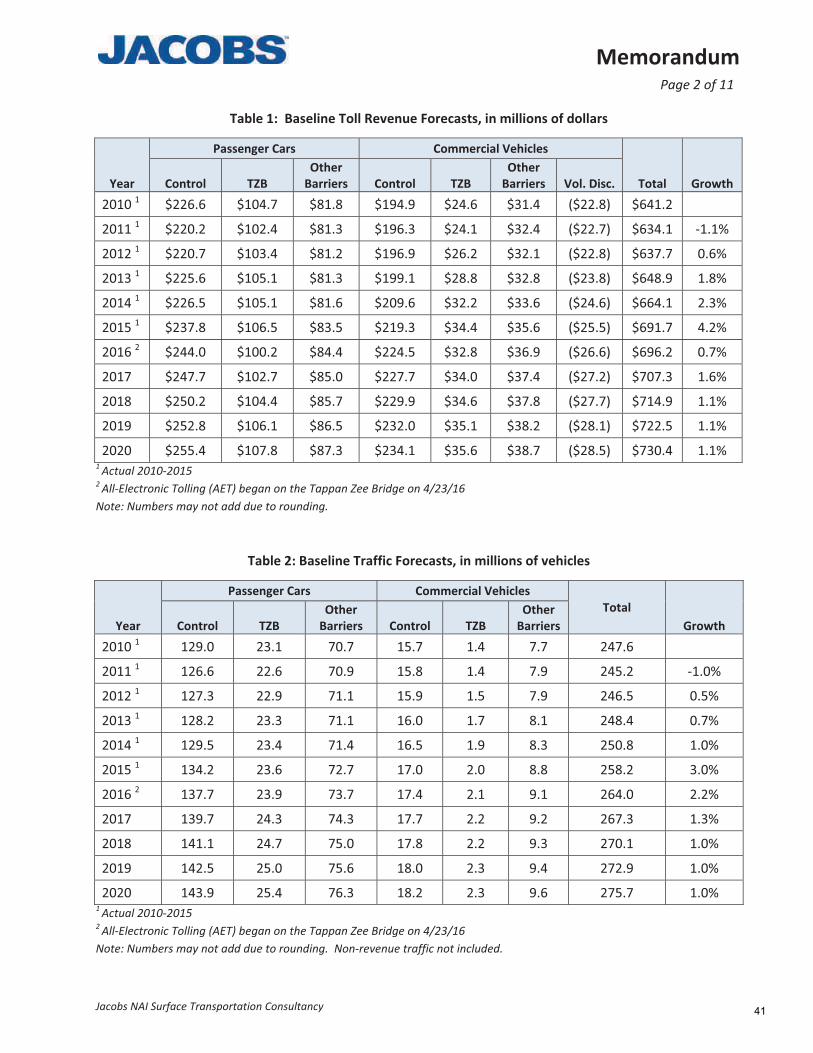
Table! !and!Table! !present!actual! traffic!and! toll! revenue! from!2010! through!2015!and! forecasts! for!2016!
through! 2020.! ! It! is! important! to! note! that! estimated! revenue! growth! is! expected! to! be! higher! than!
projected!traffic!growth!because!trucks,!which!pay!more!per!mile!than!passenger!vehicles,!have!been!and!
are!expected! to!continue!growing!at!a! faster! rate.! !There! is!an!exception! to! the! revenue!growth! trend! in!
2016!due!to!the!implementation!of!AET!on!the!Tappan!Zee!Bridge,!where!there!is!a!lag!in!collection!of!toll!
revenue!from!customers!who!are!billed!for!their!tolls!by!mail.!!
As!shown!in!Table!,!most!years!between!2010!and!2014!saw!little!passenger!car!growth;!however,!2015!and!
early!data!for!2016!show!higher!growth.!!!Over!this!same!timeframe,!truck!traffic!growth!has!generally!been!
strong,!especially!at!the!Tappan!Zee!Bridge.!With! lower!gas!prices!and!recent!signs!of!economic!recovery,!
future!traffic!is!expected!to!be!higher!than!previous!forecasts.!!!
Though!traffic!growth!on!the!Thruway!has!been!greater!in!2015!and!2016!than!in!previous!years,!we!see!this!
as!a!recovery!and!do!not!expect!annual!growth!to!remain!this!high!in!the!long!term.!!We!anticipate!a!longer!
period!of!modest!growth!as!the!economy!continues!to!improve.!!! !
40
! ! ! ! !!!!!!!!!!!!!!!!!!!!!Memorandum! ! ! ! ! ! !!!!!!!!!Page!2!of!11!
Jacobs!NAI!Surface!Transportation!Consultancy! !
Table!1:!!Baseline!Toll!Revenue!Forecasts,!in!millions!of!dollars!
Year!
Passenger!Cars! Commercial!Vehicles!
Total! Growth!Control! TZB!
Other!
Barriers! Control! TZB!
Other!
Barriers! Vol.!Disc.!
2010!1! $226.6! $104.7! $81.8! $194.9! $24.6! $31.4! ($22.8)! $641.2!
2011!1! $220.2! $102.4! $81.3! $196.3! $24.1! $32.4! ($22.7)! $634.1! "1.1%!
2012!1! $220.7! $103.4! $81.2! $196.9! $26.2! $32.1! ($22.8)! $637.7! 0.6%!
2013!1! $225.6! $105.1! $81.3! $199.1! $28.8! $32.8! ($23.8)! $648.9! 1.8%!
2014!1! $226.5! $105.1! $81.6! $209.6! $32.2! $33.6! ($24.6)! $664.1! 2.3%!
2015!1! $237.8! $106.5! $83.5! $219.3! $34.4! $35.6! ($25.5)! $691.7! 4.2%!
2016!2! $244.0! $100.2! $84.4! $224.5! $32.8! $36.9! ($26.6)! $696.2! 0.7%!
2017! $247.7! $102.7! $85.0! $227.7! $34.0! $37.4! ($27.2)! $707.3! 1.6%!
2018! $250.2! $104.4! $85.7! $229.9! $34.6! $37.8! ($27.7)! $714.9! 1.1%!
2019! $252.8! $106.1! $86.5! $232.0! $35.1! $38.2! ($28.1)! $722.5! 1.1%!
2020! $255.4! $107.8! $87.3! $234.1! $35.6! $38.7! ($28.5)! $730.4! 1.1%!1!Actual!2010"2015!
2!All"Electronic!Tolling!(AET)!began!on!the!Tappan!Zee!Bridge!on!4/23/16!
Note:!Numbers!may!not!add!due!to!rounding.!!!
!
!
Table!2:!Baseline!Traffic!Forecasts,!in!millions!of!vehicles!
Year!
Passenger!Cars! Commercial!Vehicles!
Total!
Growth!Control! TZB!
Other!
Barriers! Control! TZB!
Other!
Barriers!
2010!1! 129.0! 23.1! 70.7! 15.7! 1.4! 7.7! 247.6!
2011!1! 126.6! 22.6! 70.9! 15.8! 1.4! 7.9! 245.2! "1.0%!
2012!1! 127.3! 22.9! 71.1! 15.9! 1.5! 7.9! 246.5! 0.5%!
2013!1! 128.2! 23.3! 71.1! 16.0! 1.7! 8.1! 248.4! 0.7%!
2014!1! 129.5! 23.4! 71.4! 16.5! 1.9! 8.3! 250.8! 1.0%!
2015!1! 134.2! 23.6! 72.7! 17.0! 2.0! 8.8! 258.2! 3.0%!
2016!2! 137.7! 23.9! 73.7! 17.4! 2.1! 9.1! 264.0! 2.2%!
2017! 139.7! 24.3! 74.3! 17.7! 2.2! 9.2! 267.3! 1.3%!
2018! 141.1! 24.7! 75.0! 17.8! 2.2! 9.3! 270.1! 1.0%!
2019! 142.5! 25.0! 75.6! 18.0! 2.3! 9.4! 272.9! 1.0%!
2020! 143.9! 25.4! 76.3! 18.2! 2.3! 9.6! 275.7! 1.0%!1!Actual!2010"2015!
2!All"Electronic!Tolling!(AET)!began!on!the!Tappan!Zee!Bridge!on!4/23/16!
Note:!Numbers!may!not!add!due!to!rounding.!!Non"revenue!traffic!not!included.!
!
41
! ! ! ! !!!!!!!!!!!!!!!!!!!!!Memorandum! ! ! ! ! ! !!!!!!!!!Page!3!of!11!
Jacobs!NAI!Surface!Transportation!Consultancy! !
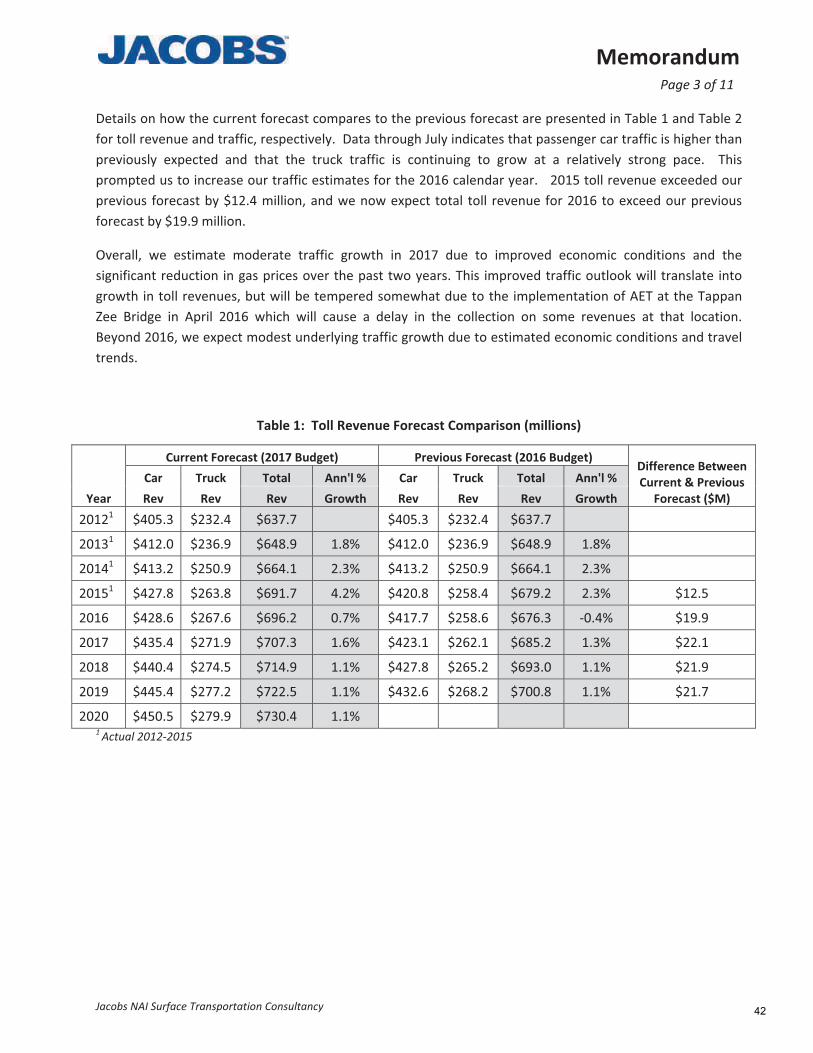
Details!on!how!the!current!forecast!compares!to!the!previous!forecast!are!presented!in!Table!1!and!Table!2!
for!toll!revenue!and!traffic,!respectively.!!Data!through!July!indicates!that!passenger!car!traffic!is!higher!than!
previously! expected! and! that! the! truck! traffic! is! continuing! to! grow! at! a! relatively! strong! pace.! ! This!
prompted!us!to!increase!our!traffic!estimates!for!the!2016!calendar!year.!!!2015!toll!revenue!exceeded!our!
previous! forecast!by!$12.4!million,!and!we!now!expect!total! toll!revenue! for!2016!to!exceed!our!previous!
forecast!by!$19.9!million.!
Overall,! we! estimate! moderate! traffic! growth! in! 2017! due! to! improved! economic! conditions! and! the!
significant!reduction! in!gas!prices!over!the!past!two!years.!This! improved!traffic!outlook!will!translate! into!
growth! in!toll!revenues,!but!will!be!tempered!somewhat!due!to!the! implementation!of!AET!at!the!Tappan!
Zee! Bridge! in! April! 2016!which!will! cause! a! delay! in! the! collection! on! some! revenues! at! that! location.!!
Beyond!2016,!we!expect!modest!underlying!traffic!growth!due!to!estimated!economic!conditions!and!travel!
trends.!!
!
Table!1:!!Toll!Revenue!Forecast!Comparison!(millions)!
!! Current!Forecast!(2017!Budget)! Previous!Forecast!(2016!Budget)!Difference!Between!
Current!&!Previous!
Forecast!($M)!
!! Car! Truck! Total! Ann'l!%! Car! Truck! Total! Ann'l!%!
Year! Rev! Rev! Rev! Growth! Rev! Rev! Rev! Growth!
20121! $405.3! $232.4! $637.7! ! $405.3! $232.4! $637.7! !
20131! $412.0! $236.9! $648.9! 1.8%! $412.0! $236.9! $648.9! 1.8%! !
20141! $413.2! $250.9! $664.1! 2.3%! $413.2! $250.9! $664.1! 2.3%! !
20151! $427.8! $263.8! $691.7! 4.2%! $420.8! $258.4! $679.2! 2.3%! $12.5!
2016! $428.6! $267.6! $696.2! 0.7%! $417.7! $258.6! $676.3! "0.4%! $19.9!
2017! $435.4! $271.9! $707.3! 1.6%! $423.1! $262.1! $685.2! 1.3%! $22.1!
2018! $440.4! $274.5! $714.9! 1.1%! $427.8! $265.2! $693.0! 1.1%! $21.9!
2019! $445.4! $277.2! $722.5! 1.1%! $432.6! $268.2! $700.8! 1.1%! $21.7!
2020! $450.5! $279.9! $730.4! 1.1%! ! ! ! ! !
1!Actual!2012"2015!
! !
42

! ! ! ! !!!!!!!!!!!!!!!!!!!!!Memorandum! ! ! ! ! ! !!!!!!!!!Page!4!of!11!
Jacobs!NAI!Surface!Transportation!Consultancy! !
!
Table!2:!!Traffic!Forecast!Comparison!(millions!of!trips)!
!! Current!Forecast!(2017!Budget)! Previous!Forecast!(2016!Budget)!Difference!Between!
Current!&!Previous!
Forecast!
!! Car! Truck! Total! Ann'l!%! Car! Truck! Total! Ann'l!%!
Year! Traffic! Traffic! Traffic! Growth! Traffic! Traffic! Traffic! Growth!
20121! 221.3! 25.3! 246.5! ! 221.3! 25.3! 246.5! ! !
20131! 222.6! 25.8! 248.4! 0.7%! 222.6! 25.8! 248.4! 0.7%! !
20141! 224.2! 26.6! 250.8! 1.0%! 224.2! 26.6! 250.8! 1.0%! !
20151! 230.5! 27.8! 258.2! 3.0%! 228.4! 27.5! 255.9! 2.0%! 2.3!
2016! 235.3! 28.6! 264.0! 2.2%! 231.2! 28.0! 259.3! 1.3%! 4.7!
2017! 238.3! 29.1! 267.3! 1.3%! 233.8! 28.4! 262.2! 1.1%! 5.1!
2018! 240.7! 29.4! 270.1! 1.0%! 236.2! 28.7! 264.9! 1.0%! 5.2!
2019! 243.1! 29.7! 272.9! 1.0%! 238.6! 29.1! 267.7! 1.0%! 5.2!
2020! 245.6! 30.0! 275.7! 1.0%! ! ! ! ! !
1!Actual!2012"2015!
!
It!is!important!to!note!that!additional!revenues!may!be!needed!for!the!Authority!to!be!able!to!successfully!
complete! the!New!NY!Bridge!project!and! fulfill! its!system"wide!operating,!debt!service,!and!capital!needs!
through! the! forecast! period.! ! Future! funding! needs! will! be! established! by! the! Authority! at! amounts!
necessary! to! continue!high! levels!of! safety! and! service,!maintain! good! infrastructure! conditions,! support!
Thruway!and!Canal!operations,!and!maintain!debt! service! coverage! levels!appropriate! for! its! current! “A”!
credit! rating.! ! Any! additional! revenues! needed! and! the! impact! of! any! rate! changes! will! be! studied!
independently!from!these!forecasts.!!
Economic!Backdrop!and!Outlook!for!the!Future!
In! the!preparation!of!Thruway! toll! revenue! forecasts,!we!considered!a!number!of! important!national!and!
regional!economic!trends!that!influence!traffic!and!motorist!behavior.!!Historically,!passenger!vehicle!traffic!
has! generally! correlated! to! Gross! Domestic! Product! (GDP)! while! truck! traffic! growth! has! shown! some!
correlation!to!the!Industrial!Production!Index!(IPI).!!Factors!such!as!unemployment!and!gas!prices!have!also!
affected!vehicle"miles!traveled!(VMT)!by!passenger!vehicles.!
Gross!Domestic!Product!
From!2000!to!2015,!real!GDP! in!the!United!States! increased!at!an!average!annual!rate!of!1.8!percent.!This!
period!included!the!2001!recession!and!the!recession!that!began!in!late!2007!and!ended!in!June!2009.!The!
2007!to!2009!recession,!which!some!economists!termed!the!“Great!Recession”,!was!far!more!severe!than!
originally! predicted! and! significantly! deeper! and! longer! than! previous! recessions.! In! 2008,! real! GDP!
decreased!by!0.3!percent.!!In!2009!the!recession!reached!its!apex,!with!real!GDP!decreasing!by!2.8!percent.!!
43

! ! ! ! !!!!!!!!!!!!!!!!!!!!!Memorandum! ! ! ! ! ! !!!!!!!!!Page!5!of!11!
Jacobs!NAI!Surface!Transportation!Consultancy! !
As! the!U.S.! economy! began! to! recover,! real!GDP! increased! on! an! annual! basis! by! between! 1.5! and! 2.5!
percent!in!the!years!2010!to!2015.!!As!of!2015,!real!GDP!reached!$16.3!trillion!as!shown!in!Figure!1.!
!
Note! that! gray! shaded! areas! on! the! figures! in! this! section! of! the! report! represent! U.S.! recessions! as!
determined! by! the! National! Bureau! of! Economic! Research.! ! Recessions! are! technically! defined! as! two!
consecutive! calendar! quarters! of! negative!GDP! growth.! ! According! to! the!National! Bureau! of! Economic!
Research,!the!2007!to!2009!recession!lasted!18!months,!making!it!the!longest!economic!downturn!since!the!
Great!Depression!and!deeper!than!the! large!recessions!of!the!early!1970’s!and!1980’s.!Typically,!economic!
downturns! that!occurred!after! the!Great!Depression!were! triggered!by!a! contraction! in!monetary! supply!
(typified!by!higher! interest!rates)!or!an!external!shock!(e.g.,!sudden!rise! in!oil!prices,!political!turmoil,!etc.)!
resulting! in! decreased! consumer! confidence,! economic! growth,! and! employment.! Once! expansionary!
conditions!are!in!place,!these!historical!post"recessionary!periods!have!typically!been!characterized!by!rapid,!
strong!and!sustained!increases!in!GDP!and!employment.!!!
Figure!1:!Real!Gross!Domestic!Product!
!
Source:!U.S.!Census!Bureau,!Bureau!of!Economic!Analysis,!National!Bureau!of!Economic!Research!
Financial!and!economic!analysts!expect!the!U.S.!economy!to!grow!in!the!near"term!future.!!The!most!recent!
consensus! forecast,! derived! from! projections! from!more! than! 50! financial! institutions! and! professional!
forecasting!firms,!is!that!real!GDP!will!grow!by!1.9!percent!in!2016!and!2.2!percent!in!2017.1!!!
!!!!!!!!!!!!!!!!!!!!!!!!!!!!!!!!!!!!!!!!!!!!!!!!!!!!!!!!!!!!
1!“Blue!Chip!Economic!Indicators:!Top!Analysts’!Forecasts!of!the!U.S.!Economic!Outlook!for!the!Year!Ahead”,!Wolters!and!Kluwer!Law!&!Business,!July!
10,!2016.!
$0
$2,000
$4,000
$6,000
$8,000
$10,000
$12,000
$14,000
$16,000
$18,000
-6.0
-4.0
-2.0
0.0
2.0
4.0
6.0
8.0
10.0
12.0
19
80
19
81
19
82
19
83
19
84
19
85
19
86
19
87
19
88
19
89
19
90
19
91
19
92
19
93
19
94
19
95
19
96
19
97
19
98
19
99
20
00
20
01
20
02
20
03
20
04
20
05
20
06
20
07
20
08
20
09
20
10
20
11
20
12
20
13
20
14
20
15
Bill
ion
s o
f C
ha
ine
d 2
00
9 $
Pe
rce
nt C
ha
ng
e fro
m P
revio
us Y
ea
r
44

! ! ! ! !!!!!!!!!!!!!!!!!!!!!Memorandum! ! ! ! ! ! !!!!!!!!!Page!6!of!11!
Jacobs!NAI!Surface!Transportation!Consultancy! !
Industrial!Production!
The!Industrial!Production!Index!(IPI)!is!a!measure!of!real!output!published!by!the!Board!of!Governors!of!the!
Federal!Reserve!System.!!The!index!is!measured!as!a!percentage!of!real!output!of!a!given!base!year,!in!this!
case!2012.! !Changes! in!U.S.! industrial!production!have!historically!moved! in!tandem!with!GDP,!albeit!with!
steeper!decreases!during!recessions!and!larger!increases!during!recovery!periods.!!Similar!to!other!economic!
indicators,!the!IPI!decreased!sharply!during!the!most!recent!recession!but!has!since!rebounded.!
!
As!shown! in!Figure!2,!the! IPI!hit! its!most!recent! trough! in! June!2009,!the! last!month!of! the!2007! to!2009!
recession.!!Since!that!time,!it!has!been!on!an!upward!trajectory,!increasing!by!18.5!percent!from!June!2009!
to!May!2016.!The!consensus! forecast!among!analysts! is! that! the! index!will!decrease! in!2016!and! increase!
2017.2!
We!expect!that!the!immediate!future!growth!in!the!shipment!of!goods!across!the!nation’s!highways!will!be!
tempered,!resulting! in!a!more!modest!rate!of!growth! in!commercial!traffic!on!the!Thruway’s!facilities!than!
had! been! experienced! in! the! pre"recession! past.! ! This! trend! is! also! seen! on! other! toll! facilities! in! the!
Northeast!and!is!built!into!to!our!traffic!and!revenue!estimates!for!the!Thruway.!!
Figure!2:!Industrial!Production!Index!
Source:!Board!of!Governors!of!the!Federal!Reserve!System,!National!Bureau!of!Economic!Research!
Based!on!forecasts!developed!by!financial!institutions!and!industry!analysts,!the!IPI!is!forecasted!to!decrease!
by!0.8!percent!in!2016!and!increase!by!2.1!percent!in!2017.!!!
!!!!!!!!!!!!!!!!!!!!!!!!!!!!!!!!!!!!!!!!!!!!!!!!!!!!!!!!!!!!
2!Ibid.!
0
20
40
60
80
100
120
Jan-0
7
May-0
7
Sep
-07
Jan-0
8
May-0
8
Sep
-08
Jan-0
9
May-0
9
Sep
-09
Jan-1
0
May-1
0
Sep
-10
Jan-1
1
May-1
1
Sep
-11
Jan-1
2
May-1
2
Sep
-12
Jan-1
3
May-1
3
Sep
-13
Jan-1
4
May-1
4
Sep
-14
Jan-1
5
May-1
5
Sep
-15
Jan-1
6
May-1
6
Ind
ustr
ial P
rod
uctio
n In
de
x: 2
01
2 =
10
0
45

! ! ! ! !!!!!!!!!!!!!!!!!!!!!Memorandum! ! ! ! ! ! !!!!!!!!!Page!7!of!11!
Jacobs!NAI!Surface!Transportation!Consultancy! !
Employment!
At! the!beginning!of!2008,! the!national!unemployment! rate!was!5.0!percent.!By!October!2009!during! the!
depth!of! the! recent! recession,!unemployment!peaked!at!approximately!10.0!percent.! ! In!addition,!during!
2008! and! 2009,! total! employment! decreased! by! 2.6! percent! and! 3.8! percent,! respectively.! ! Total!
employment! has! finally! eclipsed! its! pre"recession! peak,! reaching! 151.1! million! persons! in! June! 2016.!!
Consequently,!as!shown!in!Figure!3,!the!national!unemployment!rate!has!fallen!to!5.1!percent.!
Figure!3:!Civilian!Unemployment!Rate,!Seasonally!Adjusted!
Source:!U.S.!Department!of!Labor,!Bureau!of!Labor!Statistics,!National!Bureau!of!Economic!Research!
Long"term!forecasts!of!employment!tend!to!differ,!depending!on!varying!assumptions!of!the!impact!of!long"
term! structural! trends! that! have! been!mentioned! herein,! such! as! advances! in! information! technology,!
outsourcing,!and!an!aging!population.! !The!U.S.!Congressional!Budget!Office!(CBO)!has!forecasted!that!the!
unemployment!rate!will!remain!in!the!4.8!percent!to!5.3!percent!range!for!the!immediate!future.!!However,!
other!institutions!and!economic!analysts!are!predicting!lower!levels!of!employment!in!the!U.S.!!In!any!event,!
the!most!recent!recession!has!had!a!more!severe!impact!on!employment,!especially!compared!to!previous!
downturns!other!than!the!Great!Depression.!!!
!
National!Trends!in!Vehicle!Miles!Traveled!(VMT)!
The!United!States!experienced!a!historic!flattening!and!drop!in!vehicle"miles!traveled!(VMT)!on!its!highways,!
starting!in!2008!and!lasting!until!approximately!2014.!!A!reduction!in!VMT!means!less!revenue!–!in!the!form!
of! gasoline! taxes! or! tolls! "! for! funding! transportation! operation,! maintenance! and! capital! expenses.!
However,!in!the!past!two!years!the!trend!has!slowly!reversed!itself!and!VMT!appears!to!be!growing!again.!!
0
2
4
6
8
10
12
Jan-0
0
Au
g-0
0
Mar-
01
Oct-
01
May-0
2
Dec-0
2
Jul-03
Fe
b-0
4
Se
p-0
4
Ap
r-0
5
Nov-0
5
Jun-0
6
Jan-0
7
Au
g-0
7
Mar-
08
Oct-
08
May-0
9
Dec-0
9
Jul-10
Fe
b-1
1
Se
p-1
1
Ap
r-1
2
Nov-1
2
Jun-1
3
Jan-1
4
Au
g-1
4
Mar-
15
Oct-
15
May-1
6
Pe
rce
nt
46
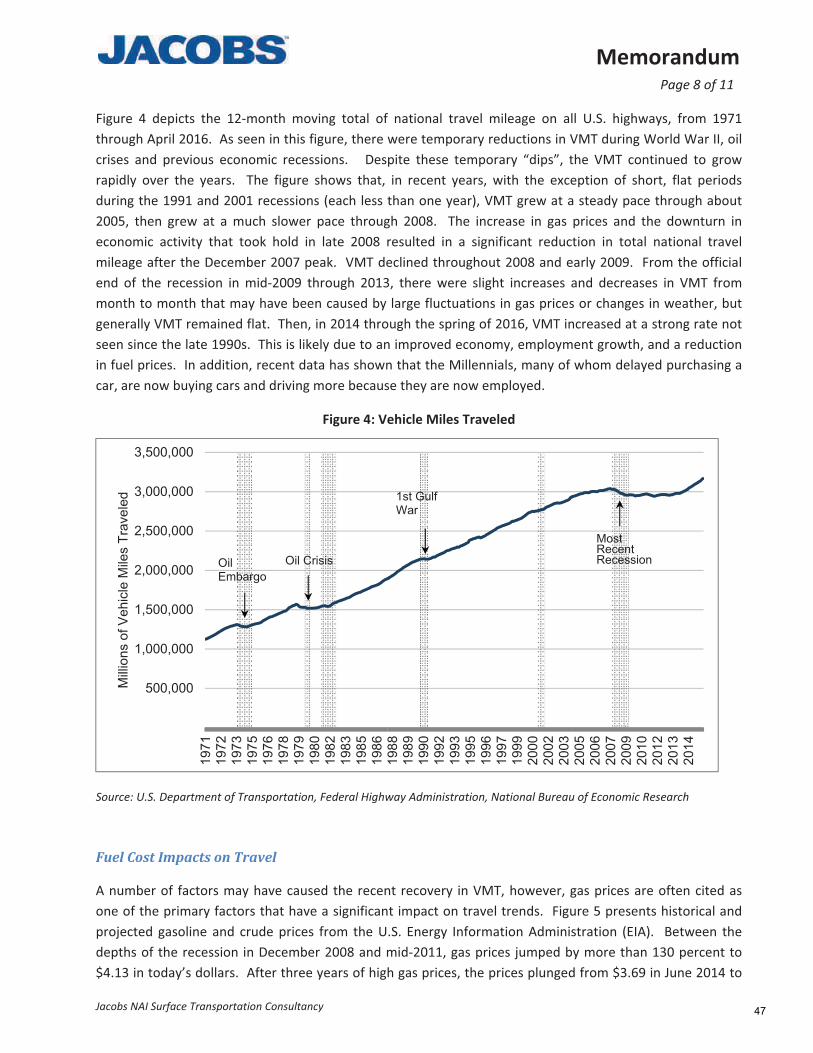
! ! ! ! !!!!!!!!!!!!!!!!!!!!!Memorandum! ! ! ! ! ! !!!!!!!!!Page!8!of!11!
Jacobs!NAI!Surface!Transportation!Consultancy! !
Figure! 4! depicts! the! 12"month!moving! total! of! national! travel!mileage! on! all!U.S.! highways,! from! 1971!
through!April!2016.!!As!seen!in!this!figure,!there!were!temporary!reductions!in!VMT!during!World!War!II,!oil!
crises! and!previous! economic! recessions.! ! !Despite! these! temporary! “dips”,! the!VMT! continued! to! grow!
rapidly!over! the! years.! ! The! figure! shows! that,! in! recent! years,!with! the! exception!of! short,! flat!periods!
during!the!1991!and!2001!recessions!(each! less!than!one!year),!VMT!grew!at!a!steady!pace!through!about!
2005,! then! grew! at! a!much! slower!pace! through!2008.! ! The! increase! in! gas!prices! and! the!downturn! in!
economic! activity! that! took! hold! in! late! 2008! resulted! in! a! significant! reduction! in! total! national! travel!
mileage!after!the!December!2007!peak.! !VMT!declined!throughout!2008!and!early!2009.! !From!the!official!
end!of! the! recession! in!mid"2009! through!2013,! there!were! slight! increases! and!decreases! in!VMT! from!
month!to!month!that!may!have!been!caused!by! large!fluctuations! in!gas!prices!or!changes! in!weather,!but!
generally!VMT!remained!flat.!!Then,!in!2014!through!the!spring!of!2016,!VMT!increased!at!a!strong!rate!not!
seen!since!the!late!1990s.!!This!is!likely!due!to!an!improved!economy,!employment!growth,!and!a!reduction!
in!fuel!prices.!!In!addition,!recent!data!has!shown!that!the!Millennials,!many!of!whom!delayed!purchasing!a!
car,!are!now!buying!cars!and!driving!more!because!they!are!now!employed.!!!
Figure!4:!Vehicle!Miles!Traveled!
!
Source:!U.S.!Department!of!Transportation,!Federal!Highway!Administration,!National!Bureau!of!Economic!Research!
!
Fuel!Cost!Impacts!on!Travel!
A!number!of! factors!may!have!caused! the!recent!recovery! in!VMT,!however,!gas!prices!are!often!cited!as!
one!of!the!primary!factors!that!have!a!significant! impact!on!travel!trends.! !Figure!5!presents!historical!and!
projected!gasoline!and!crude!prices! from! the!U.S.!Energy! Information!Administration! (EIA).! !Between! the!
depths!of!the!recession! in!December!2008!and!mid"2011,!gas!prices! jumped!by!more!than!130!percent!to!
$4.13!in!today’s!dollars.!!After!three!years!of!high!gas!prices,!the!prices!plunged!from!$3.69!in!June!2014!to!
500,000
1,000,000
1,500,000
2,000,000
2,500,000
3,000,000
3,500,000
197
11
97
21
97
31
97
51
97
61
97
81
97
91
98
01
98
21
98
31
98
51
98
61
98
81
98
91
99
01
99
21
99
31
99
51
99
61
99
71
99
92
00
02
00
22
00
32
00
52
00
62
00
72
00
92
01
02
01
22
01
32
01
4
Mill
ion
s o
f V
eh
icle
Mile
s T
rave
led
OilEmbargo
Oil Crisis
1st Gulf War
MostRecentRecession
47

! ! ! ! !!!!!!!!!!!!!!!!!!!!!Memorandum! ! ! ! ! ! !!!!!!!!!Page!9!of!11!
Jacobs!NAI!Surface!Transportation!Consultancy! !
$2.37! in! June! 2016.! !Data! from! the!most! recent! EIA! report! indicate! that! prices! are! expected! to! decline!
through!the!fall!and!winter,!as!gas!prices!typically!do.!!As!shown!in!the!graph,!prices!for!gasoline!and!crude!
oil!are!expected!to!remain!between!$2.00!and!$2.40!in!the!near"term!future.!!In!addition!to!the!reduced!gas!
prices,!it!is!important!to!note!that!average!fuel!economy!has!increased!by!25!percent!in!the!past!decade.!
Figure!5:!Historical!and!Projected!U.S.!Gasoline!and!Crude!Oil!Prices!
!
Source:!U.S.!Department!of!Energy,!U.S!Energy!Information!Administration,!Short"Term!Energy!Outlook,!August!2015!
!
This!relatively! low,!static!forecast!of!future!oil!and!gas!prices!may!be!reassuring;!however,!this!figure!does!
not! show! the! level!of!uncertainty! in! these!projections.! ! Figure!6!presents! the!EIA’s!projections! for!West!
Texas!Intermediate!Crude!Oil!Price.!!The!base!projection!is!similar!to!that!illustrated!in!Figure!5,!but!it!is!the!
possible!range!of!this!price!that!represents!a!downside!risk!to!the!U.S.!economy!and!VMT.!!Based!on!options!
markets! the!95!percent! confidence! interval! for!WTI! is!between!82!percent!more! to!58!percent! less! than!
current!forecasts!for!December!2017.!Recognizing!the!impact!fuel!prices!have!on!motorist!behavior,!with!a!
wide!range!of!possible!future!prices!of!oil!and!gasoline,!accurately!projecting!traffic!volumes!has!become!an!
increasingly!difficult!task.!
Forecast
0
0.5
1
1.5
2
2.5
3
3.5
4
4.5
5
Jan2012
Jun2012
Nov2012
Apr2013
Sep2013
Feb2014
Jul2014
Dec2014
May2015
Oct2015
Mar2016
Aug2016
Jan2017
Jun2017
Nov2017
U.S. Gasoline and Crude Oil Pricesdollars per gallon
Price difference
Retail regular gasoline
Crude oil
Crude oil price is composite refiner acquisition cost. Retail prices include state and federal taxes.
48

! ! ! ! !!!!!!!!!!!!!!!!!!!!!Memorandum! ! ! ! ! ! !!!!!!!!!Page!10!of!11!
Jacobs!NAI!Surface!Transportation!Consultancy! !
Figure!6:!Historical!and!Projected!Crude!Oil!Prices!with!Confidence!Ranges!
Source:!U.S.!Department!of!Energy,!Energy!Information!Administration,!Short"Term!Energy!Outlook,!July!2016!
To!understand!the!potential!impact!of!future!gas!prices!on!traffic!we!can!look!at!historical!reactions.!!Figure!
7!presents!historical!VMT! across! the!United! States! as! compared! to! real! retail! gasoline!prices! from! 1990!
through!today.!!The!VMT!and!real!gas!prices!represent!a!12"month!moving!total!and!average,!respectively,!
to!remove!any!seasonality!factors;!all!data!are! indexed!to!the!12!months!ending!January!1990.! !While!the!
Great!Recession!began!at!the!end!of!2007,!there!was!still!a!flattening,!then!decline,!in!vehicle!miles!traveled!
that!started!several!years!before.!!This!may!be!partially!attributed!to!rising!gas!prices.!!The!continuation!of!
the!decline,!post"fall!2008,!would!be!more!attributable!to!the!economic!meltdown,!as!gas!prices!dropped!
significantly!by!early!2009.!!Gas!prices!then!increased!throughout!the!rest!of!2009!and!through!the!spring!of!
2011!with!no!noticeable!change!to!VMT.! !However,!between!the!summers!of!2014!and!2015!there!was!a!
precipitous!drop!in!gas!prices!which!coincided!with!a!steep!increase!in!VMT.!!!!
!
This!data!shows!that!it!is!difficult!to!pinpoint!the!elasticity!of!travel!as!it!relates!to!gas!prices;!however,!very!
large!gas!price!changes!do!generally!result!in!a!change!in!driving!behavior.!!
0
20
40
60
80
100
120
140
Jan2015
Mar2015
May2015
Jul2015
Sep2015
Nov2015
Jan2016
Mar2016
May2016
Jul2016
Sep2016
Nov2016
Jan2017
Mar2017
May2017
Jul2017
Sep2017
Nov2017
West Texas Intermediate (WTI) Crude Oil Pricedollars per barrel
Historical spot priceSTEO price forecastNYMEX futures price95% NYMEX futures upper confidence interval95% NYMEX futures lower confidence interval
Note: Confidence interval derived from options market information for the 5 trading days ending Jul 7,
49

! ! ! ! !!!!!!!!!!!!!!!!!!!!!Memorandum! ! ! ! ! ! !!!!!!!!!Page!11!of!11!
Jacobs!NAI!Surface!Transportation!Consultancy! !
Figure!7:!National!VMT!vs.!Real!Gas!Prices!
Source:!U.S.!Department!of!Energy,!Energy!Information!Administration!and!U.S.!Department!of!Transportation,!Federal!
Highway!Administration!
!
Limits!and!Disclaimers!
In!Jacobs'!opinion,!the!assumptions!underlying!the!forecasts!provide!a!reasonable!basis!for!the!alternative!
analyzed.!However,!any!financial!projection!is!subject!to!uncertainties.!Inevitably,!some!assumptions!used!to!
develop!the!projections!will!not!be!realized,!and!unanticipated!events!and!circumstances!may!occur.!There!
are! likely! to! be! differences! between! the! projections! and! actual! results,! and! those! differences!may! be!
material.! Because! of! these! uncertainties,! Jacobs! makes! no! guaranty! or! warranty! with! respect! to! the!
projections!in!this!Study.!
This!document,!and! the!opinions,!analysis,!evaluations,!or! recommendations!contained!herein!are! for! the!
sole!use!and!benefit!of!the!contracting!parties.!There!are!no!intended!third!party!beneficiaries,!and!of!Jacobs!
Civil!Consultants,!Inc.!(and!its!affiliates)!shall!have!no!liability!whatsoever!to!any!third!parties!for!any!defect,!
deficiency,!error,!omission! in! any! statement! contained! in!or! in! any!way! related! to! this!document!or! the!
services!provided.!
Neither! this! document! nor! any! information! contained! therein! or! otherwise! supplied! by! of! Jacobs! Civil!
Consultants,! Inc.! in! connection!with! the! study! and! the! services! provided! to! our! client! shall! be! used! in!
connection!with!any! financing! solicitation,!proxy,!proxy! statement,!proxy! soliciting!materials,!prospectus,!
Securities!Registration!Statement!or!similar!document!without! the!express!written!consent!of! Jacobs!Civil!
Consultants,!Inc.!!
50

Revised
ACTUAL Budget Proposed Estimated Estimated Estimated
2015 2016 2017 2018 2019 2020
Toll Revenue $691.7 $696.2 $707.3 $714.9 $722.5 $730.4
Other Revenues 34.6 36.3 38.5 38.0 38.0 38.0
Total Revenue 726.3 732.5 745.9 752.9 760.6 768.4
Thruway Operating Expenses 287.4 316.8 328.5 331.8 335.1 338.5
Reserve for Claims and Indemnities and Environmental
Remediation 1.8 1.8 1.5 1.8 1.8 1.8
Net Revenue (A) 437.1 413.9 415.9 419.4 423.7 428.2
Current Senior Debt Service Outstanding 236.3 225.9 234.2 210.6 224.4 213.8
Proposed Senior Bonds 0.0 0.0 0.0 0.0 6.7 19.8
Less Interest Earnings on Sr. Debt Srvc Res Funds (0.9) (0.8) (0.9) (0.6) (0.6) (0.7)
Net Senior Debt Service (B) 235.4 225.1 233.3 210.0 230.4 232.9
Net Revenue after Senior Debt Service 201.8 188.8 182.5 209.4 193.3 195.3
Retain for Working Capital/Capital Program 18.1 0.0 0.0 0.0 0.0 0.0
Reserve Maintenance Deposit 97.1 88.0 74.1 66.1 56.1 56.2
Total Junior Debt Service 0.0 26.0 45.6 79.5 62.2 62.8
Less Interest Earnings on Jr. Debt Srvc Res Funds 0.0 (0.0) (0.1) (0.3) (0.4) (0.4)
Net Junior Debt Service (C) 0.0 26.0 45.5 79.3 61.8 62.4
TIFIA Debt Service Reserve Fund Deposit 0.0 0.0 0.0 0.0 10.0 10.0
Facilities Capital Improvement Deposit 20.5 14.0 0.0 0.0 0.0 0.0
Canal Corporation (Net of Federal Aid) 52.0 10.3 0.0 0.0 0.0 0.0
General Reserve Fund Provision - Canal Capital 13.6 5.0 0.0 0.0 0.0 0.0
General Reserve Fund Provision - State Police 0.0 45.0 62.9 64.1 65.4 66.7
General Reserve Fund - Subordinate Debt - Line of Credit 0.4 0.5 0.0 0.0 0.0 0.0
Balance 0.0 0.0 0.0 0.0 0.0 0.0
Senior Debt Service Coverage Ratio (A/B) (1) 1.86 1.84 1.78 2.00 1.84 1.84
Senior & Junior Debt Service Coverage Ratio (A/(B+C)) 1.86 1.65 1.49 1.45 1.45 1.45
Long-Term Financial Plan
Per the Thruway Authority General Revenue Bond Resolution
(millions)
51

Principal
Balance 1/1/17 Year of
Series or when issued Issuance 2017 2018 2019 2020
Series H 717.0$ 2007 80.3$ 51.9$ 45.1$ 34.5$
Series I 1,041.8 2012 72.6 72.6 72.6 72.6
Series J 650.6 2014 44.8 44.8 44.8 44.8
Series K 743.9 2014 36.5 41.3 61.8 61.8
Subtotal : Current Debt Service $234.2 $210.6 $224.4 $213.8
Series L (Proposed) 267.2 2019 0.0 0.0 6.7 13.4
Series M (Proposed) 259.0 2020 0.0 0.0 0.0 6.5
Summary
Total Annual Senior Debt Service 234.2$ 210.6$ 231.1$ 233.6$
Annual Change in Senior Debt Service as a % of Revenues 0.6% -3.4% 2.4% 0.0%
Cumulative Senior Debt Service as a % of Revenues 31.3% 27.9% 30.3% 30.3%
Outstanding Senior Debt at End of Year 3,070.5$ 2,979.4$ 3,130.5$ 3,273.5$
Notes:
The Projected Senior Debt Service is based on issuing 30 year bonds in the amount needed to fund the Thruway Capital Program and assumes it
would be issued during the year at an interest rate between 4.75 percent and 5.0 percent. Total revenues from Thruway tolls, concessionaire revenue, interest
and other revenue sources are pledged to senior debt service. The limit on senior debt capacity is reached once the debt service coverage ratio drops
below 1.2 X coverage.
Schedule of Senior Debt Service for The Thruway Capital Program
(millions)
52
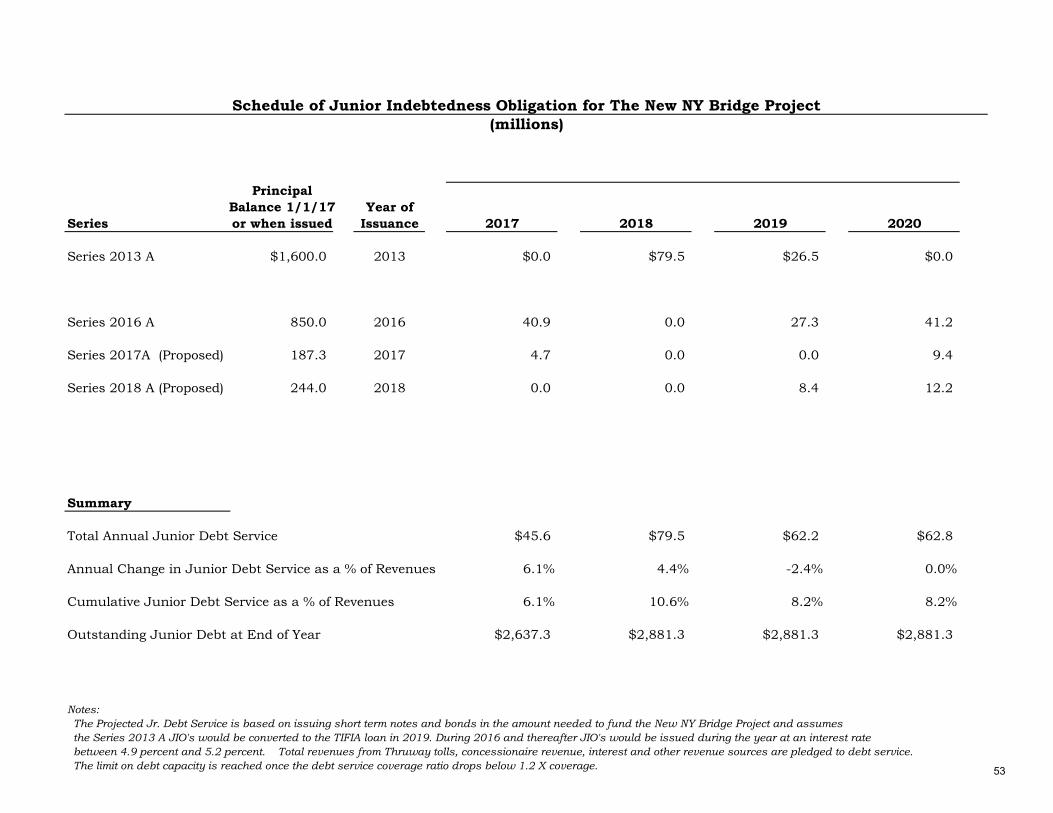
Schedule of Junior Indebtedness Obligation for The New NY Bridge Project
Principal
Balance 1/1/17 Year of
Series or when issued Issuance 2017 2018 2019 2020
Series 2013 A $1,600.0 2013 $0.0 $79.5 $26.5 $0.0
Series 2016 A 850.0 2016 40.9 0.0 27.3 41.2
Series 2017A (Proposed) 187.3 2017 4.7 0.0 0.0 9.4
Series 2018 A (Proposed) 244.0 2018 0.0 0.0 8.4 12.2
Summary
Total Annual Junior Debt Service $45.6 $79.5 $62.2 $62.8
Annual Change in Junior Debt Service as a % of Revenues 6.1% 4.4% -2.4% 0.0%
Cumulative Junior Debt Service as a % of Revenues 6.1% 10.6% 8.2% 8.2%
Outstanding Junior Debt at End of Year $2,637.3 $2,881.3 $2,881.3 $2,881.3
Notes:
The Projected Jr. Debt Service is based on issuing short term notes and bonds in the amount needed to fund the New NY Bridge Project and assumes
the Series 2013 A JIO's would be converted to the TIFIA loan in 2019. During 2016 and thereafter JIO's would be issued during the year at an interest rate
between 4.9 percent and 5.2 percent. Total revenues from Thruway tolls, concessionaire revenue, interest and other revenue sources are pledged to debt service.
The limit on debt capacity is reached once the debt service coverage ratio drops below 1.2 X coverage.
(millions)
53

������������������ ������
������������
����������� ���� ���� ���� ���� ����
�������� ����
��������
������ ������ ������ ������ ������ ������ ������ ������ ������
������ ����� ���� ����� ����� ����� ����� ����� �����
������ �� ��� ��� ���� ���� ���� ��� ��� ����
!"��#$�% ���� ���� ���� ���� ���� ���� ���� �����
&% ������% ���% #'� � �'%(� �$ ��� ��� ��� ��� ��� ���� ��� ����
(�)*�' �� ����� ����� ����� ����� ����� ����� ����� �+�����
,�%���
&%-�� ��� ���.�/ ���� ���� ��� ��� ��� ��� ��� ���
!"��#$�% ��� ��� ��� ��� ��� ��� ��� ���
����� ��� ��� ��� ��� ��� ��� ��� ���
(�)*�' �� ���� ���� ��� ��� ��� ��� ��� ���
!�"� ������� #��$�%��&����&�� ''�(' ���(' '�'(� )��() ''�(� '��() '��(� �*��)(�
0��01������2�'3�� �
0��01������ ����� �+����� ����� ����� ���� ��� ��� �+�����
!�"� �������+�$�+,�-����� ��.��� ���(� �*��)(� ���(� '��(� ��(� �(� �(� �*�)�(�
/��&�� ���� 0�*�'�(' 0�*'��(� 0�*��)(� 0���(� 0')'(� 0'��() 0'��(� 0�*���()
������������������ ������
������������
����������� ���� ���� ���� ���� ����
�������� ����
��������
(�%�'�4�) ������ ���� ���� ���� ������ ������ ������ ������
5� ��6�7��% �%�%����%� ���� ����� ���� ���� ���� ���� ���� �����
�������+( � ��%�8 �����%� ���� ��� ��� ��� ��� ��� ��� ���
&% ��� '%�'%�2�'���� ��� ��� ��� ��� ��� ��� ��� ���
�������( �)���9� �'%2�'���$��%� ��� ���� ����� ����� ���� ��� ��� �����
(�)*�' �� ����� ����� ����� ����� ����� ����� ����� �+�����
,�%���
(�%�'�4�) ���� ��� ��� ��� ��� ��� ��� ���
:�%����5� ��6���%� ���� ��� ��� ��� ��� ��� ��� ���
,�%��4�6��'#$�% ��%� ��� ��� ��� ��� ��� ��� ��� ���
�������+( � ��%�8 �����%� .�/ ���� ���� ��� ��� ��� ��� ��� ���
01(���% #'� � �'%�'%�;� ��� ��� ��� ��� ��� ��� ��� ���
�������( �)���9� �'%2�'���$��%� ��� ��� ��� ��� ��� ��� ��� ���
(�)*�' �� ���� ���� ��� ��� ��� ��� ��� ���
!�"� ������� #��$�%��&����&�� ''�(' ���(' '�'(� )��() ''�(� '��() '��(� �*��)(�
0��01������2�'3�� �
<�%�'�4�) ����� ����� ����� ����� ���� ��� ��� �����
������ �� ,�#� ��&$#�'6�$�% ��%� ��� ���� ��� ��� ��� ��� ��� ���
�������+( � ��%�8 �����%� ��� ��� ��� ��� ��� ��� ��� ���
�������( �)���9� �'%2�'���$��%� ����� ����� ����� ��� ��� ��� ��� �����
!�"� �������+�$�+,�-����� ��.��� ���(� �*��)(� ���(� '��(� ��(� �(� �(� �*�)�(�
/��&�� ���� 0�*�'�(' 0�*'��(� 0�*��)(� 0���(� 0')'(� 0'��() 0'��(� 0�*���()
�����-�������������� �������!��������&��1��������&��
������������� ������������������������������������������������������������ ���� �!������"!� ���������#��#��!�����$�����%
54
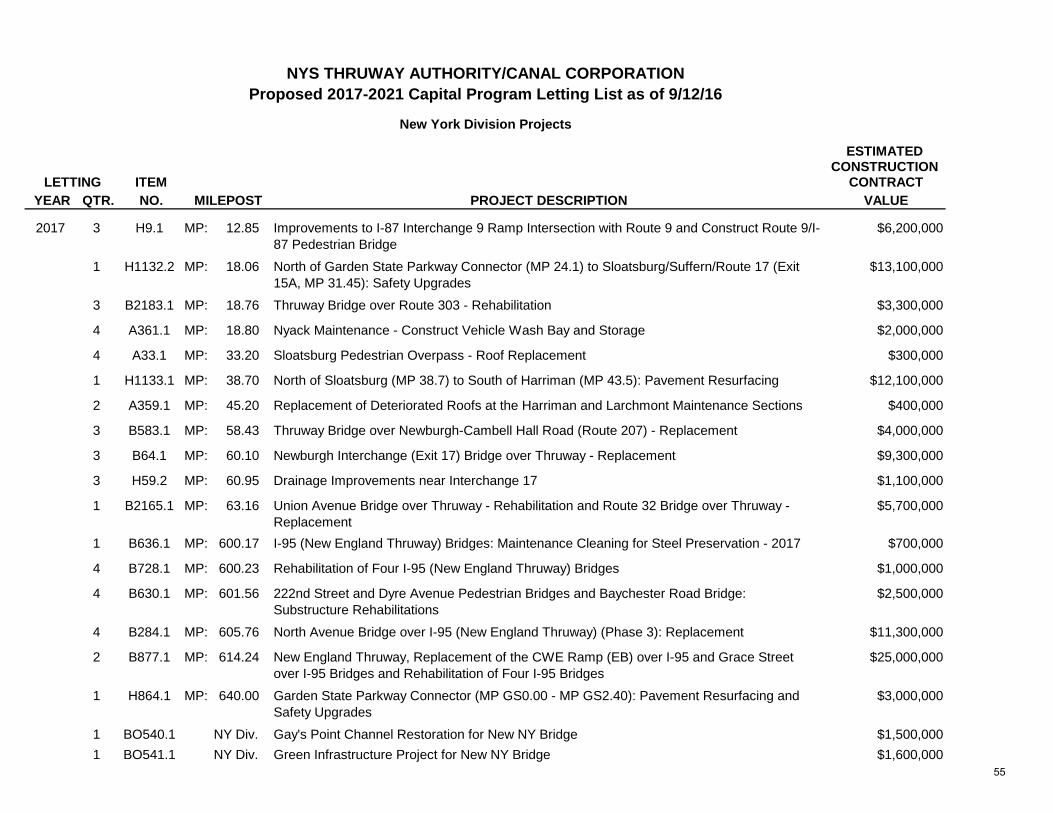
ESTIMATEDCONSTRUCTION
ITEM CONTRACT YEAR QTR. NO. MILEPOST PROJECT DESCRIPTION VALUE
2017 3 H9.1 MP: 12.85 Improvements to I-87 Interchange 9 Ramp Intersection with Route 9 and Construct Route 9/I-87 Pedestrian Bridge
$6,200,000
1 H1132.2 MP: 18.06 North of Garden State Parkway Connector (MP 24.1) to Sloatsburg/Suffern/Route 17 (Exit 15A, MP 31.45): Safety Upgrades
$13,100,000
3 B2183.1 MP: 18.76 Thruway Bridge over Route 303 - Rehabilitation $3,300,000
4 A361.1 MP: 18.80 Nyack Maintenance - Construct Vehicle Wash Bay and Storage $2,000,000
4 A33.1 MP: 33.20 Sloatsburg Pedestrian Overpass - Roof Replacement $300,000
1 H1133.1 MP: 38.70 North of Sloatsburg (MP 38.7) to South of Harriman (MP 43.5): Pavement Resurfacing $12,100,000
2 A359.1 MP: 45.20 Replacement of Deteriorated Roofs at the Harriman and Larchmont Maintenance Sections $400,000
3 B583.1 MP: 58.43 Thruway Bridge over Newburgh-Cambell Hall Road (Route 207) - Replacement $4,000,000
3 B64.1 MP: 60.10 Newburgh Interchange (Exit 17) Bridge over Thruway - Replacement $9,300,000
3 H59.2 MP: 60.95 Drainage Improvements near Interchange 17 $1,100,000
1 B2165.1 MP: 63.16 Union Avenue Bridge over Thruway - Rehabilitation and Route 32 Bridge over Thruway - Replacement
$5,700,000
1 B636.1 MP: 600.17 I-95 (New England Thruway) Bridges: Maintenance Cleaning for Steel Preservation - 2017 $700,000
4 B728.1 MP: 600.23 Rehabilitation of Four I-95 (New England Thruway) Bridges $1,000,000
4 B630.1 MP: 601.56 222nd Street and Dyre Avenue Pedestrian Bridges and Baychester Road Bridge: Substructure Rehabilitations
$2,500,000
4 B284.1 MP: 605.76 North Avenue Bridge over I-95 (New England Thruway) (Phase 3): Replacement $11,300,000
2 B877.1 MP: 614.24 New England Thruway, Replacement of the CWE Ramp (EB) over I-95 and Grace Street over I-95 Bridges and Rehabilitation of Four I-95 Bridges
$25,000,000
1 H864.1 MP: 640.00 Garden State Parkway Connector (MP GS0.00 - MP GS2.40): Pavement Resurfacing and Safety Upgrades
$3,000,000
1 BO540.1 NY Div. Gay's Point Channel Restoration for New NY Bridge $1,500,000
1 BO541.1 NY Div. Green Infrastructure Project for New NY Bridge $1,600,000
LETTING
NYS THRUWAY AUTHORITY/CANAL CORPORATIONProposed 2017-2021 Capital Program Letting List as of 9/12/16
New York Division Projects
55
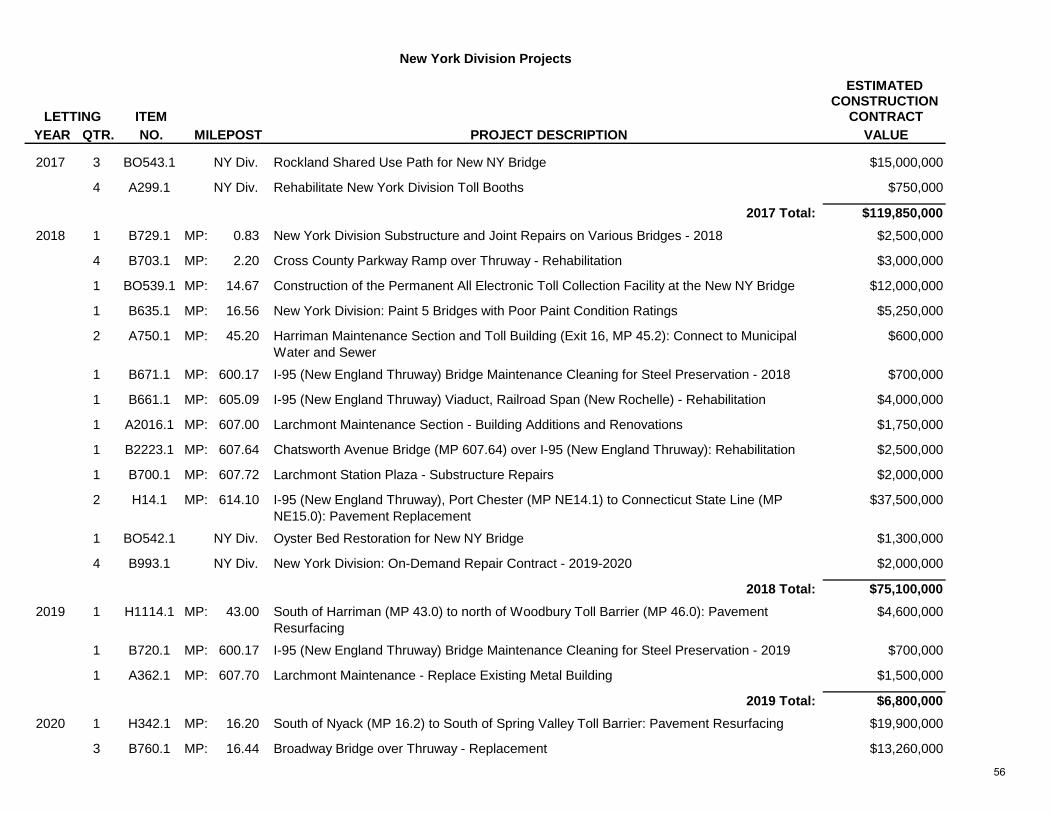
ESTIMATEDCONSTRUCTION
ITEM CONTRACT YEAR QTR. NO. MILEPOST PROJECT DESCRIPTION VALUE
2017 3 BO543.1 NY Div. Rockland Shared Use Path for New NY Bridge $15,000,000
4 A299.1 NY Div. Rehabilitate New York Division Toll Booths $750,000
2017 Total: $119,850,000
2018 1 B729.1 MP: 0.83 New York Division Substructure and Joint Repairs on Various Bridges - 2018 $2,500,000
4 B703.1 MP: 2.20 Cross County Parkway Ramp over Thruway - Rehabilitation $3,000,000
1 BO539.1 MP: 14.67 Construction of the Permanent All Electronic Toll Collection Facility at the New NY Bridge $12,000,000
1 B635.1 MP: 16.56 New York Division: Paint 5 Bridges with Poor Paint Condition Ratings $5,250,000
2 A750.1 MP: 45.20 Harriman Maintenance Section and Toll Building (Exit 16, MP 45.2): Connect to Municipal Water and Sewer
$600,000
1 B671.1 MP: 600.17 I-95 (New England Thruway) Bridge Maintenance Cleaning for Steel Preservation - 2018 $700,000
1 B661.1 MP: 605.09 I-95 (New England Thruway) Viaduct, Railroad Span (New Rochelle) - Rehabilitation $4,000,000
1 A2016.1 MP: 607.00 Larchmont Maintenance Section - Building Additions and Renovations $1,750,000
1 B2223.1 MP: 607.64 Chatsworth Avenue Bridge (MP 607.64) over I-95 (New England Thruway): Rehabilitation $2,500,000
1 B700.1 MP: 607.72 Larchmont Station Plaza - Substructure Repairs $2,000,000
2 H14.1 MP: 614.10 I-95 (New England Thruway), Port Chester (MP NE14.1) to Connecticut State Line (MPNE15.0): Pavement Replacement
$37,500,000
1 BO542.1 NY Div. Oyster Bed Restoration for New NY Bridge $1,300,000
4 B993.1 NY Div. New York Division: On-Demand Repair Contract - 2019-2020 $2,000,000
2018 Total: $75,100,000
2019 1 H1114.1 MP: 43.00 South of Harriman (MP 43.0) to north of Woodbury Toll Barrier (MP 46.0): Pavement Resurfacing
$4,600,000
1 B720.1 MP: 600.17 I-95 (New England Thruway) Bridge Maintenance Cleaning for Steel Preservation - 2019 $700,000
1 A362.1 MP: 607.70 Larchmont Maintenance - Replace Existing Metal Building $1,500,000
2019 Total: $6,800,000
2020 1 H342.1 MP: 16.20 South of Nyack (MP 16.2) to South of Spring Valley Toll Barrier: Pavement Resurfacing $19,900,000
3 B760.1 MP: 16.44 Broadway Bridge over Thruway - Replacement $13,260,000
New York Division Projects
LETTING
56
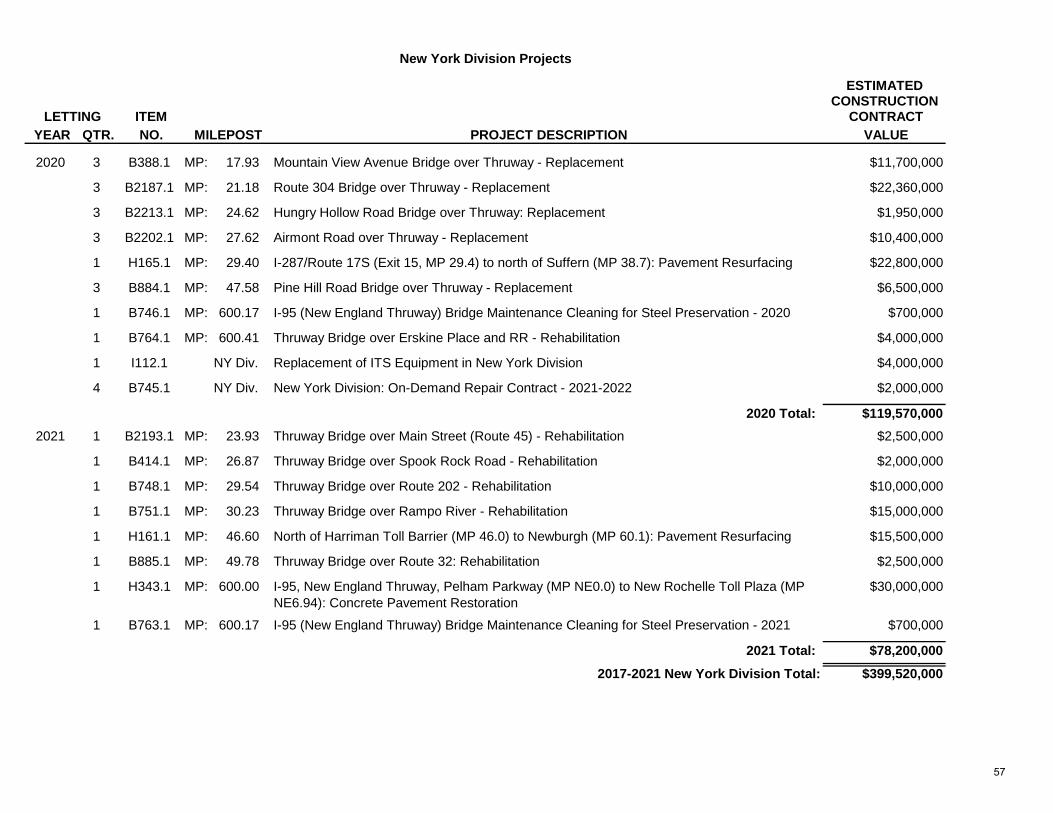
ESTIMATEDCONSTRUCTION
ITEM CONTRACT YEAR QTR. NO. MILEPOST PROJECT DESCRIPTION VALUE
2020 3 B388.1 MP: 17.93 Mountain View Avenue Bridge over Thruway - Replacement $11,700,000
3 B2187.1 MP: 21.18 Route 304 Bridge over Thruway - Replacement $22,360,000
3 B2213.1 MP: 24.62 Hungry Hollow Road Bridge over Thruway: Replacement $1,950,000
3 B2202.1 MP: 27.62 Airmont Road over Thruway - Replacement $10,400,000
1 H165.1 MP: 29.40 I-287/Route 17S (Exit 15, MP 29.4) to north of Suffern (MP 38.7): Pavement Resurfacing $22,800,000
3 B884.1 MP: 47.58 Pine Hill Road Bridge over Thruway - Replacement $6,500,000
1 B746.1 MP: 600.17 I-95 (New England Thruway) Bridge Maintenance Cleaning for Steel Preservation - 2020 $700,000
1 B764.1 MP: 600.41 Thruway Bridge over Erskine Place and RR - Rehabilitation $4,000,000
1 I112.1 NY Div. Replacement of ITS Equipment in New York Division $4,000,000
4 B745.1 NY Div. New York Division: On-Demand Repair Contract - 2021-2022 $2,000,000
2020 Total: $119,570,000
2021 1 B2193.1 MP: 23.93 Thruway Bridge over Main Street (Route 45) - Rehabilitation $2,500,000
1 B414.1 MP: 26.87 Thruway Bridge over Spook Rock Road - Rehabilitation $2,000,000
1 B748.1 MP: 29.54 Thruway Bridge over Route 202 - Rehabilitation $10,000,000
1 B751.1 MP: 30.23 Thruway Bridge over Rampo River - Rehabilitation $15,000,000
1 H161.1 MP: 46.60 North of Harriman Toll Barrier (MP 46.0) to Newburgh (MP 60.1): Pavement Resurfacing $15,500,000
1 B885.1 MP: 49.78 Thruway Bridge over Route 32: Rehabilitation $2,500,000
1 H343.1 MP: 600.00 I-95, New England Thruway, Pelham Parkway (MP NE0.0) to New Rochelle Toll Plaza (MPNE6.94): Concrete Pavement Restoration
$30,000,000
1 B763.1 MP: 600.17 I-95 (New England Thruway) Bridge Maintenance Cleaning for Steel Preservation - 2021 $700,000
2021 Total: $78,200,000
2017-2021 New York Division Total: $399,520,000
New York Division Projects
LETTING
57

ESTIMATEDCONSTRUCTION
ITEM CONTRACT YEAR QTR. NO. MILEPOST PROJECT DESCRIPTION VALUE
2017 2 B975.1 MP: 81.72 Thruway Bridge over Wallkill River - Rehabilitation $9,500,000
2 B728.2 MP: 84.14 Rehabilitation of 15 Albany Division Bridges $3,500,000
1 H330.1 MP: 86.80 South of Kingston (MP 86.8) to South of Saugerties (MP 93.8): Pavement Resurfacing $11,800,000
1 A358.1 MP: 103.00 Malden Service Area: Pitched Roof Replacement $700,000
1 BO544.1 MP: 173.59 Disaster Recovery Building Modifications $500,000
3 B943.1 MP: 191.32 Thruway Bridge over Flat Creek - Replacement $8,000,000
1 H2178.1 MP: 814.25 Berkshire Thruway, west of Taconic Parkway - Rock Removal $9,000,000
2017 Total: $43,000,000
2018 1 A828.2 MP: 91.40 Kingston Maintenance Section - Replace Salt Shed $500,000
1 H331.1 MP: 121.20 South of Coxsackie (MP 121.2) to south of Albany (MP 141.2): Pavement Resurfacing, including New Baltimore Service Area (MP 127.0)
$19,800,000
1 B629.1 MP: 128.08 Thruway Bridge over Hannacroix Creek - Rehabilitation $1,900,000
1 A829.1 MP: 141.90 Albany Maintenance Section: Replace Salt Shed $800,000
2 B146.1 MP: 165.11 Rehabilitate or Replace Retaining Wall west of Exit 26 $3,500,000
1 H338.1 MP: 180.00 East of Fultonville (MP 180.0) to east of Canajoharie (MP 190.0): Pavement Resurfacing $10,300,000
1 H338.2 MP: 190.00 East of Canajoharie (MP 190.0) to east of Little Falls (MP 197.9): Pavement Resurfacing $7,300,000
1 H81.1 MP: 805.70 Berkshire Thruway, West of Exit B-1 (MP BS5.7) to Canaan Toll Barrier (MP BS17.9): Pavement Resurfacing and Safety Upgrades
$11,400,000
2 A299.2 ALB Div. Rehabilitate Albany Division Toll Booths $750,000
4 B993.2 ALB Div. Albany Division: On-Demand Repair Contract - 2019-2020 $2,000,000
2018 Total: $58,250,000
2019 1 B688.1 MP: 84.54 Thruway Bridge over County Road 73- Rehabilitation $2,000,000
3 B950.1 MP: 85.33 Kingston High Falls Route 32 Bridge over Thruway - Replacement $10,400,000
3 B346.1 MP: 112.57 Leeds-Old Kings Highway Bridge over Thruway - Replacement $5,200,000
1 B725.1 MP: 113.22 Catskill Creek Slope Stabilization $1,000,000
1 B681.1 MP: 131.90 Thruway Bridge over Coeymans Creek - Rehabilitation $6,000,000
Albany Division Projects
LETTING
58
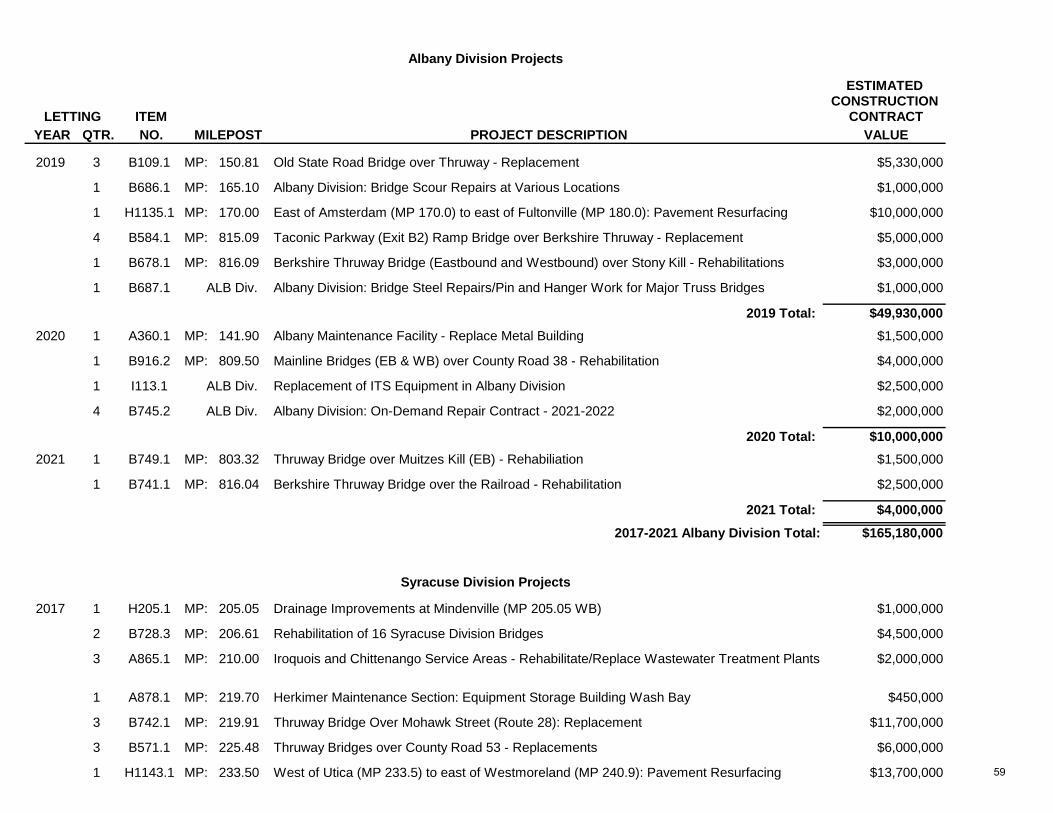
ESTIMATEDCONSTRUCTION
ITEM CONTRACT YEAR QTR. NO. MILEPOST PROJECT DESCRIPTION VALUE
2019 3 B109.1 MP: 150.81 Old State Road Bridge over Thruway - Replacement $5,330,000
1 B686.1 MP: 165.10 Albany Division: Bridge Scour Repairs at Various Locations $1,000,000
1 H1135.1 MP: 170.00 East of Amsterdam (MP 170.0) to east of Fultonville (MP 180.0): Pavement Resurfacing $10,000,000
4 B584.1 MP: 815.09 Taconic Parkway (Exit B2) Ramp Bridge over Berkshire Thruway - Replacement $5,000,000
1 B678.1 MP: 816.09 Berkshire Thruway Bridge (Eastbound and Westbound) over Stony Kill - Rehabilitations $3,000,000
1 B687.1 ALB Div. Albany Division: Bridge Steel Repairs/Pin and Hanger Work for Major Truss Bridges $1,000,000
2019 Total: $49,930,000
2020 1 A360.1 MP: 141.90 Albany Maintenance Facility - Replace Metal Building $1,500,000
1 B916.2 MP: 809.50 Mainline Bridges (EB & WB) over County Road 38 - Rehabilitation $4,000,000
1 I113.1 ALB Div. Replacement of ITS Equipment in Albany Division $2,500,000
4 B745.2 ALB Div. Albany Division: On-Demand Repair Contract - 2021-2022 $2,000,000
2020 Total: $10,000,000
2021 1 B749.1 MP: 803.32 Thruway Bridge over Muitzes Kill (EB) - Rehabiliation $1,500,000
1 B741.1 MP: 816.04 Berkshire Thruway Bridge over the Railroad - Rehabilitation $2,500,000
2021 Total: $4,000,000
2017-2021 Albany Division Total: $165,180,000
2017 1 H205.1 MP: 205.05 Drainage Improvements at Mindenville (MP 205.05 WB) $1,000,000
2 B728.3 MP: 206.61 Rehabilitation of 16 Syracuse Division Bridges $4,500,000
3 A865.1 MP: 210.00 Iroquois and Chittenango Service Areas - Rehabilitate/Replace Wastewater Treatment Plants $2,000,000
1 A878.1 MP: 219.70 Herkimer Maintenance Section: Equipment Storage Building Wash Bay $450,000
3 B742.1 MP: 219.91 Thruway Bridge Over Mohawk Street (Route 28): Replacement $11,700,000
3 B571.1 MP: 225.48 Thruway Bridges over County Road 53 - Replacements $6,000,000
1 H1143.1 MP: 233.50 West of Utica (MP 233.5) to east of Westmoreland (MP 240.9): Pavement Resurfacing $13,700,000
Albany Division Projects
LETTING
Syracuse Division Projects
59
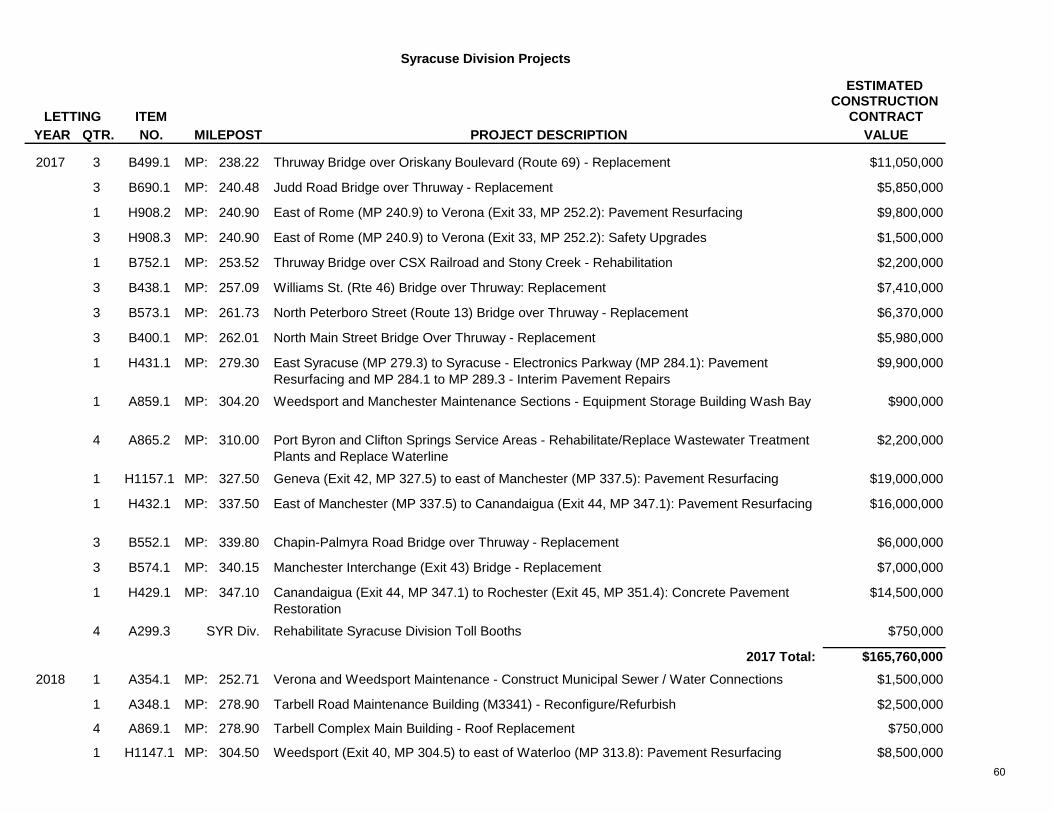
ESTIMATEDCONSTRUCTION
ITEM CONTRACT YEAR QTR. NO. MILEPOST PROJECT DESCRIPTION VALUE
2017 3 B499.1 MP: 238.22 Thruway Bridge over Oriskany Boulevard (Route 69) - Replacement $11,050,000
3 B690.1 MP: 240.48 Judd Road Bridge over Thruway - Replacement $5,850,000
1 H908.2 MP: 240.90 East of Rome (MP 240.9) to Verona (Exit 33, MP 252.2): Pavement Resurfacing $9,800,000
3 H908.3 MP: 240.90 East of Rome (MP 240.9) to Verona (Exit 33, MP 252.2): Safety Upgrades $1,500,000
1 B752.1 MP: 253.52 Thruway Bridge over CSX Railroad and Stony Creek - Rehabilitation $2,200,000
3 B438.1 MP: 257.09 Williams St. (Rte 46) Bridge over Thruway: Replacement $7,410,000
3 B573.1 MP: 261.73 North Peterboro Street (Route 13) Bridge over Thruway - Replacement $6,370,000
3 B400.1 MP: 262.01 North Main Street Bridge Over Thruway - Replacement $5,980,000
1 H431.1 MP: 279.30 East Syracuse (MP 279.3) to Syracuse - Electronics Parkway (MP 284.1): Pavement Resurfacing and MP 284.1 to MP 289.3 - Interim Pavement Repairs
$9,900,000
1 A859.1 MP: 304.20 Weedsport and Manchester Maintenance Sections - Equipment Storage Building Wash Bay $900,000
4 A865.2 MP: 310.00 Port Byron and Clifton Springs Service Areas - Rehabilitate/Replace Wastewater Treatment Plants and Replace Waterline
$2,200,000
1 H1157.1 MP: 327.50 Geneva (Exit 42, MP 327.5) to east of Manchester (MP 337.5): Pavement Resurfacing $19,000,000
1 H432.1 MP: 337.50 East of Manchester (MP 337.5) to Canandaigua (Exit 44, MP 347.1): Pavement Resurfacing $16,000,000
3 B552.1 MP: 339.80 Chapin-Palmyra Road Bridge over Thruway - Replacement $6,000,000
3 B574.1 MP: 340.15 Manchester Interchange (Exit 43) Bridge - Replacement $7,000,000
1 H429.1 MP: 347.10 Canandaigua (Exit 44, MP 347.1) to Rochester (Exit 45, MP 351.4): Concrete Pavement Restoration
$14,500,000
4 A299.3 SYR Div. Rehabilitate Syracuse Division Toll Booths $750,000
2017 Total: $165,760,000
2018 1 A354.1 MP: 252.71 Verona and Weedsport Maintenance - Construct Municipal Sewer / Water Connections $1,500,000
1 A348.1 MP: 278.90 Tarbell Road Maintenance Building (M3341) - Reconfigure/Refurbish $2,500,000
4 A869.1 MP: 278.90 Tarbell Complex Main Building - Roof Replacement $750,000
1 H1147.1 MP: 304.50 Weedsport (Exit 40, MP 304.5) to east of Waterloo (MP 313.8): Pavement Resurfacing $8,500,000
Syracuse Division Projects
LETTING
60
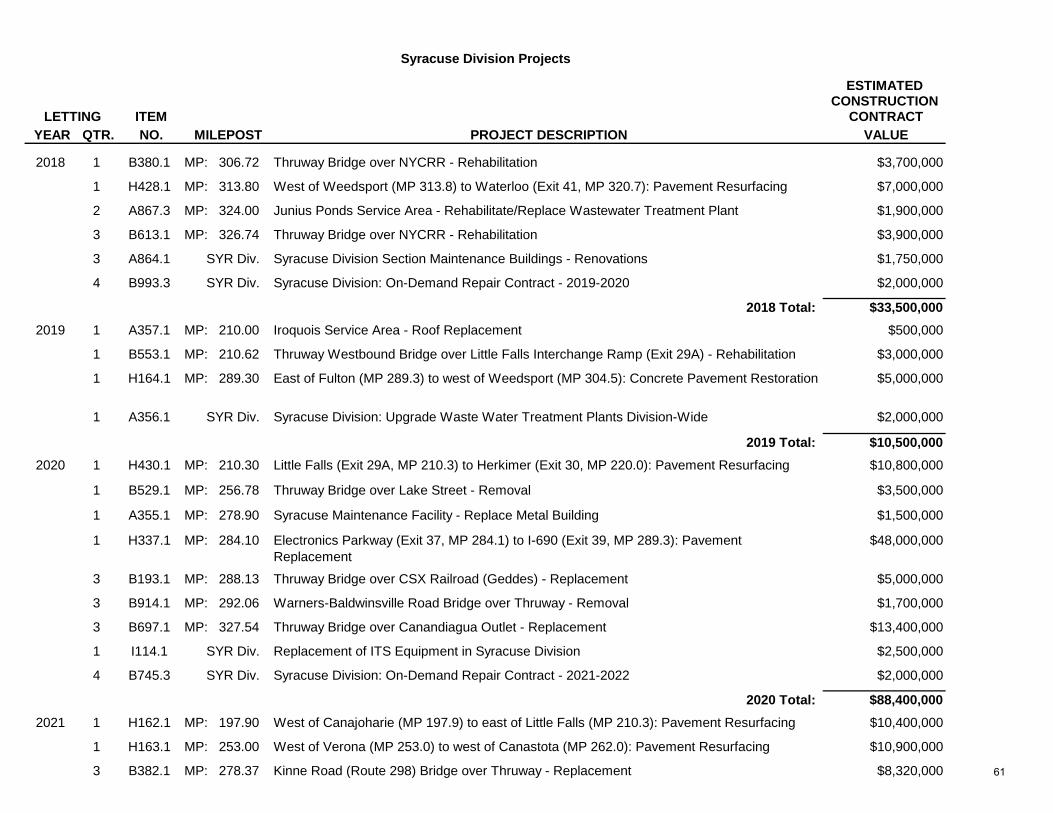
ESTIMATEDCONSTRUCTION
ITEM CONTRACT YEAR QTR. NO. MILEPOST PROJECT DESCRIPTION VALUE
2018 1 B380.1 MP: 306.72 Thruway Bridge over NYCRR - Rehabilitation $3,700,000
1 H428.1 MP: 313.80 West of Weedsport (MP 313.8) to Waterloo (Exit 41, MP 320.7): Pavement Resurfacing $7,000,000
2 A867.3 MP: 324.00 Junius Ponds Service Area - Rehabilitate/Replace Wastewater Treatment Plant $1,900,000
3 B613.1 MP: 326.74 Thruway Bridge over NYCRR - Rehabilitation $3,900,000
3 A864.1 SYR Div. Syracuse Division Section Maintenance Buildings - Renovations $1,750,000
4 B993.3 SYR Div. Syracuse Division: On-Demand Repair Contract - 2019-2020 $2,000,000
2018 Total: $33,500,000
2019 1 A357.1 MP: 210.00 Iroquois Service Area - Roof Replacement $500,000
1 B553.1 MP: 210.62 Thruway Westbound Bridge over Little Falls Interchange Ramp (Exit 29A) - Rehabilitation $3,000,000
1 H164.1 MP: 289.30 East of Fulton (MP 289.3) to west of Weedsport (MP 304.5): Concrete Pavement Restoration $5,000,000
1 A356.1 SYR Div. Syracuse Division: Upgrade Waste Water Treatment Plants Division-Wide $2,000,000
2019 Total: $10,500,000
2020 1 H430.1 MP: 210.30 Little Falls (Exit 29A, MP 210.3) to Herkimer (Exit 30, MP 220.0): Pavement Resurfacing $10,800,000
1 B529.1 MP: 256.78 Thruway Bridge over Lake Street - Removal $3,500,000
1 A355.1 MP: 278.90 Syracuse Maintenance Facility - Replace Metal Building $1,500,000
1 H337.1 MP: 284.10 Electronics Parkway (Exit 37, MP 284.1) to I-690 (Exit 39, MP 289.3): Pavement Replacement
$48,000,000
3 B193.1 MP: 288.13 Thruway Bridge over CSX Railroad (Geddes) - Replacement $5,000,000
3 B914.1 MP: 292.06 Warners-Baldwinsville Road Bridge over Thruway - Removal $1,700,000
3 B697.1 MP: 327.54 Thruway Bridge over Canandiagua Outlet - Replacement $13,400,000
1 I114.1 SYR Div. Replacement of ITS Equipment in Syracuse Division $2,500,000
4 B745.3 SYR Div. Syracuse Division: On-Demand Repair Contract - 2021-2022 $2,000,000
2020 Total: $88,400,000
2021 1 H162.1 MP: 197.90 West of Canajoharie (MP 197.9) to east of Little Falls (MP 210.3): Pavement Resurfacing $10,400,000
1 H163.1 MP: 253.00 West of Verona (MP 253.0) to west of Canastota (MP 262.0): Pavement Resurfacing $10,900,000
3 B382.1 MP: 278.37 Kinne Road (Route 298) Bridge over Thruway - Replacement $8,320,000
LETTING
Syracuse Division Projects
61

ESTIMATEDCONSTRUCTION
ITEM CONTRACT YEAR QTR. NO. MILEPOST PROJECT DESCRIPTION VALUE
2021 3 B413.1 MP: 278.93 Syracuse Interchange (Exit 35) Bridge Over Thruway - Replacement $7,540,000
3 B559.1 MP: 282.62 Thruway over Bear Trap Creek Bridge - Replacement $4,550,000
3 B694.1 MP: 283.79 Electronics Parkway Interchange (Exit 37) Ramp Bridge over Thruway - Replacement $6,500,000
3 B439.1 MP: 292.49 Warners-Ionia Road Bridge over Thruway - Replacement $7,800,000
3 B498.1 MP: 310.98 Thruway Bridge over Crane Brook - Replacement $7,150,000
3 B200.1 MP: 313.31 Thruway Bridge over Old Seneca River - Replacement $5,330,000
2021 Total: $68,490,000
2017-2021 Syracuse Division Total: $366,650,000
2017 1 H1088.1 MP: 351.00 Victor (Exit 45, MP 351.0) to I-390 (Exit 46, MP 362.5): Pavement Resurfacing $3,800,000
4 A876.1 MP: 362.40 Henrietta State Police - Roof Replacement $250,000
1 A870.3 MP: 376.00 Ontario Service Area - Replace Pitched Roof $500,000
1 H411.1 MP: 378.20 LeRoy/I-490 (MP 378.2, Exit 47) to west of Pembroke (MP 404.7): Pavement Resurfacing $7,100,000
1 H1154.1 MP: 416.90 East of Depew (MP 416.90) to Williamsville Toll Barrier: Pavement Resurfacing $11,200,000
2 H1154.2 MP: 419.69 Rehabilitation of Williamsville Toll Barrier Pavement $7,500,000
4 A352.1 MP: 423.19 Walden Avenue Maintenance Facility - Replace Metal Buildings and Construct Vehicle Wash Bay
$1,500,000
2 H1017.3 MP: 429.50 Springville (Exit 55, MP 429.5) to Lackawanna Toll Barrier (MP 430.4): Pavement Rehabilitation and Safety Upgrades
$16,300,000
2 B511.2 MP: 429.78 Thruway Bridge over Smokes Creek - Rehabilitation $3,200,000
2 B510.1 MP: 430.05 Thruway Bridge over NYCRR & Penn RR: Replacement $30,000,000
2 H1155.1 MP: 430.50 Lackawanna Toll Barrier (MP 430.51): Pavement Resurfacing $500,000
2 B873.1 MP: 436.70 Thruway Bridge over Camp Road (Exit 57) - Removal $3,500,000
1 H336.1 MP: 447.00 Angola Travel Plaza - Pavement Resurfacing $500,000
4 H874.2 MP: 451.50 East of Silver Creek (MP 451.5) to Silver Creek (Exit 58, MP 455.2): Pavement Rehabilitation $30,000,000
Buffalo Division Projects
Syracuse Division Projects
LETTING
62

ESTIMATEDCONSTRUCTION
ITEM CONTRACT YEAR QTR. NO. MILEPOST PROJECT DESCRIPTION VALUE
2017 1 A872.1 MP: 455.50 Silver Creek, Westfield and Niagara Maintenance Sections - Equipment Storage Building Wash Bay
$1,200,000
1 H1162.1 MP: 467.00 Dunkirk (MP 467.0, Exit 59) to east of Westfield (MP 483.0): Pavement Resurfacing $5,000,000
1 H551.1 MP: 900.00 I-190, I-90 (N0.00) to South Ogden Street (Exit N1, N0.70): Pavement Resurfacing andMedian Light Pole Replacements from I-90 to Route 5 (Exit 7)
$3,500,000
1 A363.1 MP: 900.70 Construction of New Salt Shed at Niagara Interchange $800,000
1 B640.1 MP: 914.35 South Grand Island Bridge Maintenance Cleaning for Steel Preservation - 2017 $400,000
1 B641.1 MP: 920.35 North Grand Island Southbound and Northbound Bridges - Painting $37,500,000
1 A369.1 BUF Div. Construct Western New York Welcome Center $0
2017 Total: $164,250,000
2018 1 B729.2 MP: 355.25 Buffalo Division Substructure and Joint Repairs on Various Bridges - 2018 $5,500,000
4 A870.2 MP: 366.00 Scottsville, Ontario and Pembroke Service Areas - Replace Flat Roofs $1,000,000
1 H525.1 MP: 404.70 West of Pembroke (MP 404.7) to Depew (Exit 49, MP 416.9): Pavement Resurfacing $14,900,000
3 B2174.1 MP: 420.34 Interchange 50 Northbound Ramp Bridge to I-290 - Replacement $15,340,000
3 B2176.1 MP: 420.36 Thruway Southbound Ramp Bridge over Wherle Drive (I-290) - Replacement $7,800,000
1 B699.1 MP: 434.48 Thruway Bridges over Erie RR - Rehabilitations $1,000,000
3 B713.1 MP: 434.85 South Park Ave. (Route 62) Bridge over Thruway - Replacement $26,910,000
3 B651.1 MP: 435.60 Sowles Road Bridge over Thruway - Replacement $13,780,000
4 B986.1 MP: 454.47 Thruway Bridge over Cattaraugus Creek - Rehabilitation $3,000,000
1 B668.1 MP: 485.59 Chautauqua Creek (Eastbound & Westbound) and Hawley Street Bridges - Rehabilitations $1,000,000
3 B770.1 MP: 900.37 Rossler Street Bridge over Thruway - Replacement $7,410,000
3 B521.1 MP: 901.06 Weiss Street Bridge over Thruway - Replacement $9,230,000
1 B718.1 MP: 914.35 Grand Island Bridges: Maintenance Cleaning for Steel Preservation - 2018 $400,000
3 B558.1 MP: 915.46 Beaver Island State Parkway Bridge over I-190 Thruway - Replacement $10,140,000
3 B908.1 MP: 917.27 Whitehaven Road Bridge over I-190 Thruway - Replacement $7,800,000
LETTING
Buffalo Division Projects
63
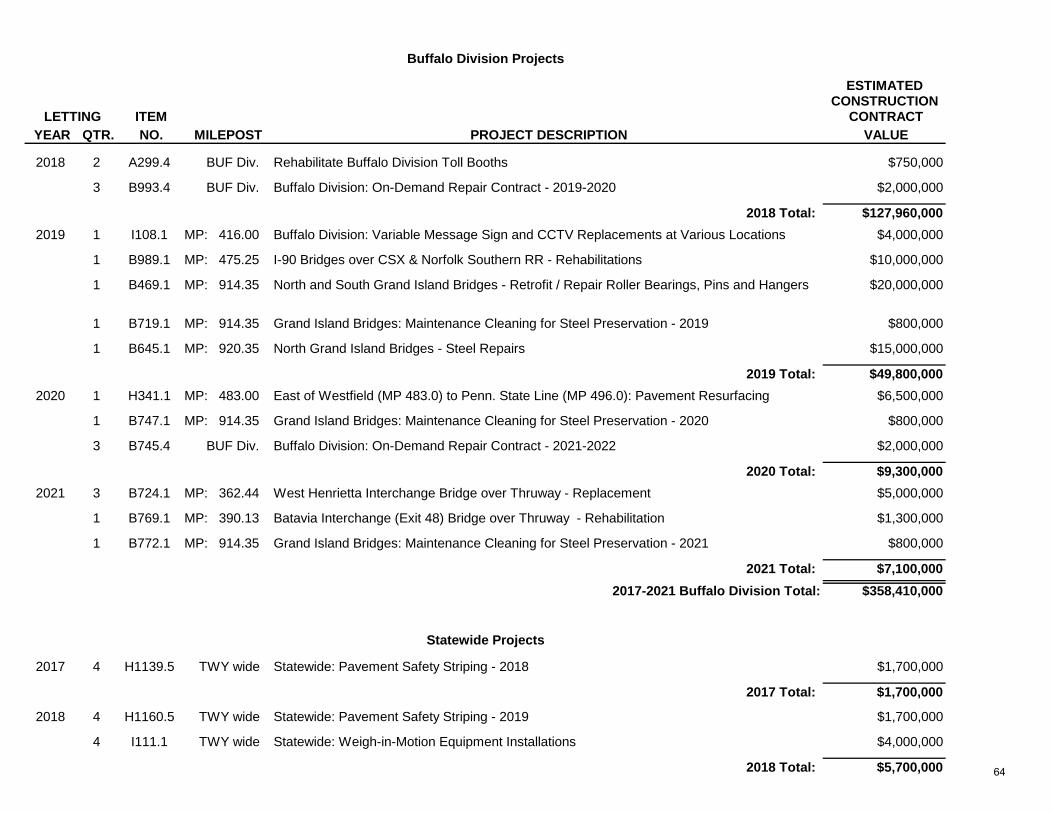
ESTIMATEDCONSTRUCTION
ITEM CONTRACT YEAR QTR. NO. MILEPOST PROJECT DESCRIPTION VALUE
2018 2 A299.4 BUF Div. Rehabilitate Buffalo Division Toll Booths $750,000
3 B993.4 BUF Div. Buffalo Division: On-Demand Repair Contract - 2019-2020 $2,000,000
2018 Total: $127,960,000
2019 1 I108.1 MP: 416.00 Buffalo Division: Variable Message Sign and CCTV Replacements at Various Locations $4,000,000
1 B989.1 MP: 475.25 I-90 Bridges over CSX & Norfolk Southern RR - Rehabilitations $10,000,000
1 B469.1 MP: 914.35 North and South Grand Island Bridges - Retrofit / Repair Roller Bearings, Pins and Hangers $20,000,000
1 B719.1 MP: 914.35 Grand Island Bridges: Maintenance Cleaning for Steel Preservation - 2019 $800,000
1 B645.1 MP: 920.35 North Grand Island Bridges - Steel Repairs $15,000,000
2019 Total: $49,800,000
2020 1 H341.1 MP: 483.00 East of Westfield (MP 483.0) to Penn. State Line (MP 496.0): Pavement Resurfacing $6,500,000
1 B747.1 MP: 914.35 Grand Island Bridges: Maintenance Cleaning for Steel Preservation - 2020 $800,000
3 B745.4 BUF Div. Buffalo Division: On-Demand Repair Contract - 2021-2022 $2,000,000
2020 Total: $9,300,000
2021 3 B724.1 MP: 362.44 West Henrietta Interchange Bridge over Thruway - Replacement $5,000,000
1 B769.1 MP: 390.13 Batavia Interchange (Exit 48) Bridge over Thruway - Rehabilitation $1,300,000
1 B772.1 MP: 914.35 Grand Island Bridges: Maintenance Cleaning for Steel Preservation - 2021 $800,000
2021 Total: $7,100,000
2017-2021 Buffalo Division Total: $358,410,000
2017 4 H1139.5 TWY wide Statewide: Pavement Safety Striping - 2018 $1,700,000
2017 Total: $1,700,000
2018 4 H1160.5 TWY wide Statewide: Pavement Safety Striping - 2019 $1,700,000
4 I111.1 TWY wide Statewide: Weigh-in-Motion Equipment Installations $4,000,000
2018 Total: $5,700,000
Buffalo Division Projects
LETTING
Statewide Projects
64

ESTIMATEDCONSTRUCTION
ITEM CONTRACT YEAR QTR. NO. MILEPOST PROJECT DESCRIPTION VALUE
2019 1 B679.1 TWY wide Statewide: Bridge Painting at Various Locations $8,000,000
1 H15.3 TWY wide Statewide: Various Culvert Rehabilitations/Replacements - 2019 $3,000,000
4 H1161.1 TWY wide Statewide: Pavement Safety Striping - 2020 $1,700,000
2019 Total: $12,700,000
2020 1 A365.1 TWY wide Statewide: Replacement of Maintenance Facility Roofs $1,000,000
1 B730.1 TWY wide Statewide: Bridge Preservation for Various Bridges $7,000,000
1 B734.1 TWY wide Statewide: Bridge Painting at Various Locations $7,000,000
1 H15.4 TWY wide Statewide: Various Culvert Rehabilitations/Replacements - 2020 $3,500,000
4 H748.1 TWY wide Statewide: Pavement Safety Striping - 2021 $1,700,000
2020 Total: $20,200,000
2021 1 A367.1 TWY wide Statewide: Rehabilitation of Maintenance Facilities $2,000,000
1 B754.1 TWY wide Statewide: Bridge Preservation for Various Bridges $7,000,000
4 H752.1 TWY wide Statewide: Pavement Safety Striping - 2022 $1,700,000
4 I116.1 TWY wide Statewide: Replacement of ITS Equipment $3,000,000
2021 Total: $13,700,000
2017-2021 Statewide Total: $54,000,000
Thruway Project Totals by Division
2017-2021 New York Division Total: $399,520,000
2017-2021 Albany Division Total: $165,180,000
2017-2021 Syracuse Division Total: $366,650,000
2017-2021 Buffalo Division Total: $358,410,000
2017-2021 Statewide Total: $54,000,000
2017-2021 Thruway Authority Total: $1,343,760,000
Statewide Projects
LETTING
65

Thruway Project Totals by Year
2017 Total: $494,560,000
2018 Total: $300,510,000
2019 Total: $129,730,000
2020 Total: $247,470,000
2021 Total: $171,490,000
2017-2021 Thruway Authority Total: $1,343,760,0009/12/16
66

Appendix 1
Overview of the Authority’s Budget Process
Each year the Authority constructs a budget and financial plan that is consistent with its strategic goals. Our strategic plan has long served as the foundation in which staff and the Authority’s Board have planned and made decisions on the allocation of important, and often scarce, resources. This plan identifies three principal goals:
! Maintaining high levels of customer service and safety; ! Maintaining infrastructure and deliver the capital program; and ! Enhancing the efficiency and effectiveness of Authority operations.
The Authority pursues an interaction and dynamic budget process that involves input from all levels of the organization. The budget process begins with a bulletin issued by the Chief Financial Officer in February that provides strategic direction and guidelines on how the ensuing year’s budget will be constructed. The bulletin is issued to all Department Heads and Division Directors, providing them with timelines, pricing assumptions and other guidance that will allow them to begin recommending their budgetary needs for the upcoming year.
Once this information is entered into the Authority’s Budget Reporting and Analysis Support System in March or April, discussions begin these recommended budgets, often involving visits into the field to provide a more hands-on experience to the budget process. These important discussions allow staff to exchange information with employees from all levels of the organization regarding the impacts the budget may have on operational efficiency and effectiveness and the condition of the Authority’s extensive infrastructure.
By November, this interactive process results in a balanced, proposed budget for the ensuing year that meets all of the established goals. The proposed budget is then submitted to the public and the Authority Board for their review. Once this review period is completed and all comments have been considered, the budget is updated and presented to the Board for final approval. Upon the Board’s approval, the budget becomes official and is placed on the Authority’s website (www.thruway.ny.gov) and distributed to New York State’s Authority Budget office, State Legislature and Office of the State Comptroller.
67
Budget Assumptions
As the annual budget is being developed, the Authority determines the principal financial and economic assumptions underlying projections for non-toll revenues, concession revenues, interest earnings on Authority investments and other revenues. Toll revenue projections are provided by the Authority’s independent traffic consultant (currently Jacobs Civil Consultants) who takes a conservative approach to its projections. Jacobs’ toll forecast is based on anticipated toll revenue changes, an analysis of past, current and projected traffic and transaction trends, E-ZPass penetration rates, economic trends and indicator’s, and experiences of other toll roads and interstate systems.
While revenue assumptions are being defined, the Authority also determines a number of underlying assumptions that impact operational expenses, including:
! Staffing levels, which are strictly controlled under a cost-benefit review process;
! Salary changes and employee benefits based on labor contracts with Union’s that represent the employees (Teamster’s, CSEA, and Management confidential employees);
! Contractual services and equipment purchases needed to maintain the Thruway system in a state of good repair;
! Estimates of future retirement, health insurance, worker’s compensation, insurance and other administrative costs;
! Projected fuel and utility market conditions, pricing and usage; and
! Allocations for operational savings achieved from streamlining and other planned initiatives.
68

Assessment of Budgetary Risks
There are several budgetary risks associated with developing a budget several months before the beginning of the fiscal year that are determined by variables that could measurably impact revenues and expenses. On the revenue side, toll collections account for over 90 percent of Thruway revenues, so accuracy of toll revenue projections is critical. The risks associated with toll revenue and concession revenue forecasts are principally focused on traffic and how it is impacted by weather patterns, fuel prices, general economic conditions, changing traveler behaviors, and construction activity along the highway. Other revenues include a very large number of smaller revenue items that collectively make up a very minor portion of Authority revenues. As a result, little budgetary risk is associated with this revenue category.
On the operational side, the risks associated with the operating budget generally include economic changes, such as changes in the cost of fuel and other inputs (such as utilities, steel, cement, and asphalt), inclement weather, the impacts of legal settlements and, while rare, legislative mandates that may increase overall costs.
It is important to note that revenues and expenditures are constantly monitored by the Authority and if any material and negative changes from the financial plan are encountered, the Executive Director and Chief Financial Officer will take immediate action to eliminate or reduce discretionary expenditures to maintain a balanced budget and healthy financial condition.
Projecting needs, remedies and costs into a five-year Capital Plan requires estimates of variables including future impacts of traffic, weather, and deterioration rates on a 570 mile, 60-year old highway system. As the Authority’s trailblazing progress in asset management continues to increase our ability to better assess these variables, its application to each successive annual budget and five-year plan should significantly reduce the risks of over or under expenditures.
69


