Page 1
1 | P a g e
Federal Housing Finance Agency
2017 REPORT CYCLE DODD-FRANK STRESS TESTS
SUMMARY INSTRUCTIONS AND GUIDANCE
Accompanying Order Nos. 2017-OR-B-01, 2017-OR-FNMA-01, AND 2017-OR-FHLMC-01
March 3, 2017
Page 2
2 | P a g e
Contents
Introduction ................................................................................................................................................ 3
Stress Test Scenarios .............................................................................................................................. 3
Reporting Format and Timing.............................................................................................................. 6
Stress Test Governance .......................................................................................................................... 6
Use of Stress Test Results ...................................................................................................................... 7
Incomplete Data ..................................................................................................................................... 7
Evaluation of Stress Test Processes ..................................................................................................... 7
Appendix 1: Regulatory Expectations for a Stress Testing Process ................................................... 8
Appendix 2: FHFA DFA Reporting Templates - Enterprises ............................................................ 14
Appendix 3: FHFA DFA Reporting Templates - FHLBanks ............................................................. 79
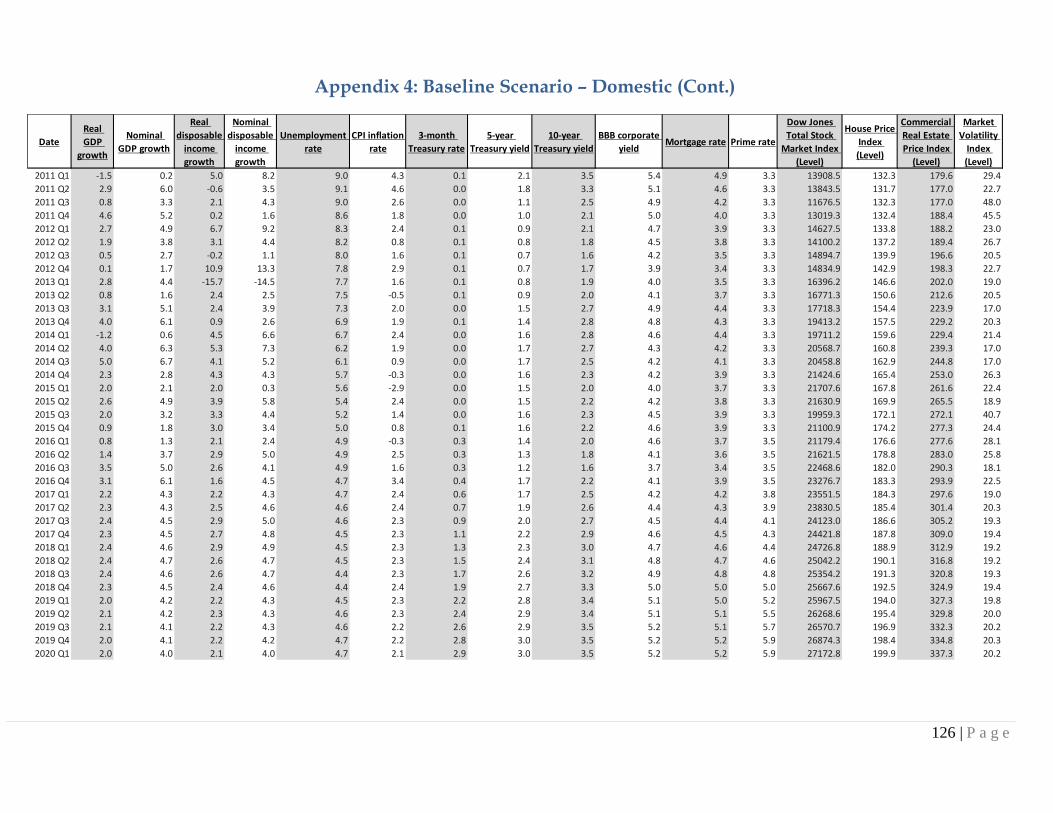
Appendix 4: Baseline Scenario - Domestic…………….…………………………………………….125
Appendix 5: Baseline Scenario - International………………………………………………………127
Appendix 6: Adverse Scenario - Domestic…………………………………………………………..129
Appendix 7: Adverse Scenario - International .................................................................................... 131
Appendix 8: Severely Adverse Scenario - Domestic………………………………………………..133
Appendix 9: Severely Adverse Scenario - International……………………………………………135
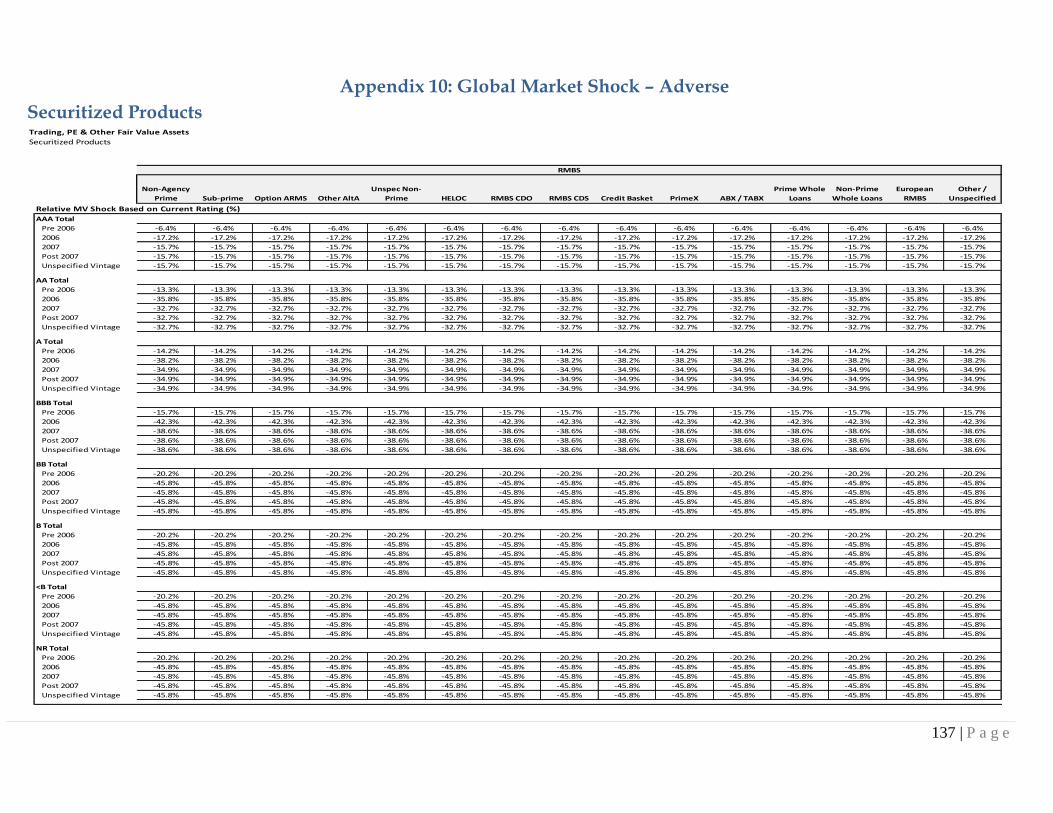
Appendix 10: Global Market Shock - Adverse…………………………………………………..….137
Appendix 11: Global Market Shock - Severely Adverse…………………………………………...153
Appendix 12: Data Notes ……………………………………………………………………………….169
Page 3
3 | P a g e
Introduction
Section 165(i)(2) of the Dodd-Frank Act
requires certain financial companies with
total consolidated assets of more than $10
billion, and which are regulated by a
primary federal financial regulatory agency,
to conduct annual stress tests to determine
whether the companies have the capital
necessary to absorb losses as a result of
adverse economic conditions. The Federal
Housing Finance Agency (FHFA) is the
primary federal financial regulator of
Fannie Mae and Freddie Mac (the
Enterprises), and the eleven Federal Home
Loan Banks (Banks). These entities are
referred to herein as regulated entities.
Each regulated entity has total consolidated
assets of more than $10 billion and, therefore,
each is required to conduct the annual stress
test. The Enterprises’ capital positions,
supported and restricted by the Senior
Preferred Stock Purchase Agreements with
the Department of the Treasury, are unique.
Nonetheless, the Enterprises incorporate
capital into their business decision-making
processes. FHFA expects the Enterprises to
have processes and procedures for managing
their businesses notwithstanding Treasury’s
support. Therefore, FHFA’s rule on Stress
Testing of Regulated Entities, 12 C.F.R. pt.
1238, and these instructions and guidance
apply equally to the Enterprises and the
Banks.
FHFA’s stress testing rule establishes the
basic requirements for each regulated entity
to conduct Dodd-Frank Act Stress Tests and
report the results. This summary instructions
and guidance document supplements the rule.
FHFA expects each regulated entity to follow
the instructions and guidance in conducting
stress tests and reporting and publishing
results under the rule. FHFA may
communicate specific instructions to address
particular issues relevant only to some of the
regulated entities’ completion of the stress
tests. Each regulated entity is also expected to
adhere to such individualized instructions.
General instructions and guidance are
provided relating to:
Scenario assumptions,
Reporting and timing,
Stress test process governance,
Use of stress test results,
Incomplete data,
Evaluation of stress test processes, and
Correspondence related to stress tests.
Stress Test Scenarios
The stress tests are based on portfolios as of
December 31, 2016. The planning horizon
for the stress test is nine quarters starting
with the first quarter of 2017 and extending
through the first quarter of 2019. The
regulated entities are required to submit
the results of stress tests based on three
scenarios: Baseline, Adverse, and Severely
Adverse. Assumptions for the variables in
each scenario are contained in Appendices
4 through 9.
FHFA expects each regulated entity to use
those variables that are relevant to the entity’s
Page 4
4 | P a g e
line of business and that are consumed by
the entity’s models. However, FHFA expects
each regulated entity to apply all of the
relevant global market shocks provided.
Each regulated entity is expected to indicate
which variables are included in its stress
tests in its report to FHFA and the Federal
Reserve Board of Governors (Board). FHFA
also expects each regulated entity to
extrapolate any of the aforementioned
variables beyond the projection date as
required. A year of scenario assumptions
beyond the nine-quarter planning horizon
will be provided and may be utilized, if
needed. Historical data is provided in the
event that models require that information.
It is important to note that the scenarios and
assumptions provided are not forecasts, but
instead are hypothetical scenarios and
assumptions to assess the financial strength
of the regulated entities.
Global Market Shock Assumptions
The global market assumptions provided by
FHFA are to be applied to the regulated
entities’ trading securities, available-for-sale
securities and other fair value assets as of
December 31, 2016 for the Adverse and
Severely Adverse scenarios.
The result of the global market shock is to be
taken as an instantaneous loss and reduction
of capital in the first quarter of the planning
horizon. The global market shock should be
treated as an add-on that is exogenous to the
macroeconomic and financial market
environment specified in the supervisory
stress scenarios. The regulated entities
should assume no recoveries of the losses
generated by the global market shock over
the nine quarters. The capital impact of the
global market shock is carried over the
planning horizon.
If a regulated entity can demonstrate that
its loss-estimation methodology stresses
identical positions under both the global
market shock and the macroeconomic
scenario, the regulated entity may assume
that the combined losses from such
positions do not exceed the losses resulting
from the greater of the global market shock
losses or the macroeconomic losses.
Counterparty Default Scenario Component
The counterparty default scenario
component of the global market shock
should be treated as an add-on to the
macroeconomic and financial market
scenarios specified in the Adverse and
Severely Adverse scenarios. The
counterparty default scenario component
involves an instantaneous and unexpected
default of one of the following:
a regulated entity’s largest
counterparty across the regulated
entity’s secured and unsecured
lending, securities lending,
repurchase/reverse repurchase
agreements (collectively Securities
Financing Transactions or SFTs) and
derivative exposures, and the
potential losses and effects on capital
associated with such a default;
a regulated entity’s largest
counterparty across the regulated
entity’s single-family mortgage
insurance providers, and the potential
losses and effects on capital associated
with such a default; or
a regulated entity’s largest
counterparty across the regulated
Page 5
5 | P a g e
entity’s providers of multifamily
credit enhancements, and the
potential losses and effects on
capital associated with such a
default.
The regulated entity should identify its
largest counterparty by the counterparty
that represents the largest total net
stressed loss if the counterparty defaulted
on its obligations. Net stressed losses for
SFT counterparties are calculated after
applying the instantaneous market shock
to any non-cash SFT assets
(securities/collateral) posted or received,
and for derivatives, to the value of the
trade position and non-cash collateral
exchanged.1
The as-of date for the counterparty default
scenario component is December 31, 2016
– the same date as the global market
shock.
All estimated losses from the counterparty
default scenario component should be
assumed to occur instantaneously and
should be reported in the initial quarter of
the planning horizon.
More detailed instructions for
implementing certain assumptions follow:
House Prices
The House Price Index assumptions
provided by FHFA describe the path of
national house prices. Each regulated entity
should extrapolate the national house price
path beyond the projection date as needed.
1 In selecting its largest counterparty, a regulated entity will not consider certain sovereign entities (Canada, France, Germany, Italy, Japan, the United Kingdom, and the United States) or designated central clearing counterparties.
Each regulated entity should also translate
the national house price path in each scenario
to regional house price paths as appropriate
for each regulated entity’s models, and
should interpolate the house price paths to
accommodate the frequency of data required
by their models.
Missing Variables
Each regulated entity should use its internal
assumptions for variables that its models
consume but that FHFA does not provide.
Balance Sheet Evolution
Each regulated entity should also use its
internal assumptions to roll its balance
sheets forward through the nine-quarter
projection period. The assumptions should
reflect reasonable expectations for future
business and should conform to the
regulated entity’s internal strategic plan. The
Enterprise should ensure that the size and
composition of its book of business during
the stress test is consistent with the goals in
FHFA's Conservatorship Scorecard.
Capital Actions
For capital actions, each Bank should take
into account its actual capital actions as of
the end of the calendar quarter preceding
the first quarter of the nine-quarter planning
horizon. For each succeeding quarter, each
Bank should either assume payment of stock
dividends equal to those paid in the year
ending immediately prior to the first
quarter of the planning horizon or follow
any established rules it has for dividends
payments.
Each Bank should either assume that it does
not redeem or repurchase any capital
instrument over the planning horizon or that
Page 6
6 | P a g e
its capital actions will accord with its
established capital plans. It should also
assume that it will redeem all mandatorily
redeemable capital stock per its usual
practice unless restricted from doing so by
FHFA actions.
Finally, each Bank should assume that it
will cease dividend payments, capital
redemptions, or repurchases (as applicable)
when retained earnings fall to zero.
The Enterprises should comply with the
terms of the Senior Preferred Stock
Purchase Agreements, as amended, to
determine the level of dividends to pay
over the planning horizon.
Operational Risk Losses
Operational risk losses are losses that arise
from external events or from inadequate
internal processes, people, or systems. The
regulated entities should estimate
operational risk losses for each scenario and
submit the results to FHFA.
Reporting Format and Timing
The Enterprises must submit results of the
Baseline, Adverse, and Severely Adverse
scenarios to FHFA and the Board on or
before May 20, 2017 and must publicly
disclose a summary of the results of only the
Severely Adverse scenario between August 1
and August 15. The Banks are to report
results of the Baseline, Adverse, and Severely
Adverse scenarios to FHFA and the Board by
August 31 and publicly disclose a summary
of the results of only the Severely Adverse
scenario between November 15 and
November 30.
The results of a regulated entity’s analysis
for each scenario should encompass all
potential losses and other impacts to net
income and capital that the regulated entity
might experience under the scenarios. In all
cases, each regulated entity should
substantiate that its results are consistent with
the specified macroeconomic and financial
environment and that the components of its
results are internally consistent within each
scenario.
The regulated entities are required to report
the results using the Dodd Frank Act (DFA)
templates provided in Appendices 2 and 3.
The regulated entities are also required to
submit qualitative information describing the
methodologies, including any simplifying or
other assumptions used to produce the
estimates, as well as any other information
necessary to fully support the reasonableness
of the stress test results.
Each regulated entity must submit its
results and any supporting information to
FHFA through a secure site. The Enterprises
must use the secure server. The Banks must
use the secure bank portal.
Stress Test Governance
The board of directors of each regulated
entity or a designated committee thereof is
responsible for reviewing and approving
policies and procedures established to
comply with the rule. Each board of
directors should also receive and review the
results of the stress tests for compliance
with the rule and established policies and
procedures. Senior management of each
regulated entity is responsible for
establishing and testing controls. Senior
management and each member of the
board of directors are to receive a summary
of the stress test results.
Page 7
7 | P a g e
Use of Stress Test Results
The rule requires that each regulated
entity take the results of the annual stress
test into account in making changes as
appropriate to its capital structure
(including the level and composition of
capital); and any changes to its exposures,
concentrations, and risk positions; plans for
recovery and resolution; or to improve
overall risk management. Consultation with
FHFA staff is expected in making any such
changes. If a regulated entity is under FHFA
conservatorship, any post-assessment
actions would require FHFA’s prior
approval.
Results should include effects on capital,
as required under the DFA stress testing
rule. Specifically, and in accordance with
the rule, each regulated entity must
calculate how each of the following is
affected during each quarter of the stress
test planning horizon, for each scenario:
Potential losses, pre-provision net
revenues, allowance for loan losses,
and capital positions over the
planning horizon; and
Capital levels and capital ratios,
including regulatory capital and net
worth, each Bank’s leverage and
permanent capital ratios, and any
other capital ratios, as specified by
FHFA.
Incomplete Data
All regulated entities are required to report
all data elements in the attached FHFA DFA
templates. Failure to submit complete data to
FHFA in a timely manner may result in
remedy or penalty authorized under the
Federal Housing Enterprises Financial Safety
and Soundness Act of 1992, as amended (12
U.S.C. 4501 et seq.) (Safety and Soundness
Act) and the Federal Home Loan Bank Act, as
amended (12 U.S.C. 1421 through 1449).
Evaluation of Stress Test Processes
and Results
FHFA will focus particular attention on the
processes related to the implementation of
the scenarios to ensure that these processes
are robust and that they capture and stress
key vulnerabilities and idiosyncratic risks
facing the firm and that the translation of
the scenario into loss, revenue, and capital
projections is conceptually sound and
implemented in a well-controlled manner.
FHFA will evaluate the extent to which
stress testing processes at the regulated
entities adhere to the regulatory principles
outlined in Appendix 1. FHFA will also
review the stress results for reasonableness.
FHFA will review each regulated entity’s
assumptions for reasonableness and
consistency with the assumptions used by
other regulated entities. FHFA may require
a regulated entity to adjust its assumptions
or resubmit its results where FHFA deems
the stress test results, assumptions, or
processes are unacceptable.
Page 8
8 | P a g e
Appendix 1: Regulatory Expectations for a Stress Testing Process
A regulated entity’s stress testing
process should adhere to the following
principles:
Principle 1: The regulated entity has a
sound risk measurement and
management infrastructure that
supports the identification,
measurement, assessment, and control
of all material risks arising from its
exposures and business activities.
• A satisfactory stress testing process
requires (1) a comprehensive risk
identification process, and (2) complete
and accurate measurement and
assessment of all material risks.
• A regulated entity should measure or
assess the full spectrum of risks that face
the regulated entity, using both
quantitative and qualitative methods,
where applicable.
• The regulated entity should have data
capture and retention systems that allow
for the input, use, and storage of
information required for sound risk
identification and measurement and to
produce reliable inputs for assessments of
capital adequacy.
• Quantitative processes for measuring
risks should meet supervisory
expectations for model effectiveness and
be supported by robust model
development, documentation, validation,
and overall model governance practices.
Both qualitative and quantitative
processes for assessing risk should be
transparent, repeatable, and reviewable
by an independent party.
• Any identified weaknesses in risk
measures used as inputs to the stress
testing process should be documented
and reported to relevant parties, with an
assessment of the potential impact of risk-
measurement weaknesses on the
reliability of the stress test results.
Principle 2: The regulated entity has
effective processes for translating risk
measures into estimates of potential losses
over a range of stressful scenarios and
environments and for aggregating those
estimated losses across the regulated entity.
• Stress tests should include
methodologies that generate estimates of
potential losses for all material risk
exposures, one of which should be an
enterprise-wide stress test using scenario
analysis. Methodologies should be
complementary, not suffer from common
limitations, and minimize reliance on
common assumptions.
• Using the loss estimation methodologies
for its various risk exposures, a regulated
entity should develop consistent and
repeatable processes to aggregate its loss
estimates on an enterprise-wide basis.
• A regulated entity should demonstrate
that its loss estimation tools are developed
Page 9
9 | P a g e
using sound modeling approaches,
appropriate for the manner in which they
are being employed, and that the most
relevant limitations are clearly identified,
well documented, and appropriately
communicated.
• A regulated entity should recognize that
its loss projections are estimates and should
have a good understanding of the
uncertainty around those estimates,
including the potential margin of error and
the sensitivity of the estimates to changes in
inputs and key assumptions.
Principle 3: The regulated entity has a clear
definition of available capital resources and
an effective process for estimating available
capital resources (including any projected
revenues) over the same range of stressful
scenarios and environments used for
estimating losses.
• Management and the board of
directors should understand the loss
absorption capabilities of the
components of the regulated entity’s
capital base, and maintain projection
methodologies for each of the capital
components included in relevant capital
adequacy metrics.
• In estimating available capital resources,
a regulated entity will need to consider
not only its current positions and mix of
capital instruments, but also how its
capital resources may evolve over time
under varying circumstances and stress
scenarios.
• As part of a comprehensive enterprise-
wide stress testing program, projections of
pre-provision net revenue (PPNR) should
be consistent with balance sheet and other
exposure assumptions used for related loss
estimation. Projections should estimate all
key elements of PPNR, including net
interest income, non-interest income, and
non-interest expense at a level of
granularity consistent with material
revenue and expense components.
• A regulated entity should
demonstrate that its capital resource
estimation tools are developed using
sound modeling approaches,
appropriate for the manner in which
they are being employed, and that the
most relevant limitations are clearly
identified, well documented, and
appropriately communicated.
• A regulated entity should recognize that
its projections of capital resources are
estimates and should have a good
understanding of the uncertainty around
those estimates, including the potential
margin of error and the sensitivity of the
estimates to changes in inputs and key
assumptions.
Principle 4: The regulated entity has
processes for bringing together estimates of
losses and capital resources to assess the
combined impact on capital adequacy in
relation to the regulated entity’s stated goals
for the level and composition of capital.
• A regulated entity should have a
comprehensive and consistently executed
process for combining loss, resource, and
balance sheet estimates to assess the
baseline and post-stress impact of those
estimates on capital measures.
Page 10
10 | P a g e
• A regulated entity should calculate and
use several capital measures that represent
both leverage and risk at specified time
horizons under both baseline and
stressful conditions, consistent with its
capital policy framework. Measures
should include quarterly estimates for the
impact on capital and leverage ratios as
well as other capital and risk measures
useful in assessing overall capital
adequacy.
• The processes for bringing together
estimates of losses and capital resources
should ensure that appropriately stressful
conditions over the regulated entity’s
planning horizon have been incorporated
to properly address the institution’s unique
vulnerabilities.
• The processes should provide for the
presentation of any information that may
have material bearing on the regulated
entity’s capital adequacy assessment,
including all relevant risks and strategic
factors, as well as key uncertainties and
process limitations.
Principle 5: The regulated entity has a
comprehensive capital policy and robust
capital planning practices for establishing
capital goals, determining appropriate
capital levels and composition of capital,
making decisions about capital actions, and
maintaining capital contingency plans.
Capital Policy
• A capital policy is defined as a regulated
entity’s written assessment of the
principles and guidelines used for capital
planning, capital issuance, and usage and
distributions, including internal capital
goals, the quantitative or qualitative
guidelines for dividend and stock repurchase
decisions, the strategies for addressing
potential capital shortfalls, and the internal
governance procedures around capital policy
principles and guidelines.
• A regulated entity should establish capital
goals aligned with its risk appetite and risk
profile as well as expectations of
stakeholders, providing specific targets for
the level and composition of capital. The
regulated entity should ensure that
maintaining its internal capital goals will
allow it to continue its operations under
stressful conditions.
• The capital policy should describe the
decision making processes regarding capital
goals, the level and composition of capital,
capital actions, and capital contingency
plans, including an explanation of the roles
and responsibilities of key decision makers
and information and analysis used to make
decisions.
• The regulated entity should outline in its
policy specific capital contingency actions it
would consider to remedy any current or
prospective deficiencies in its capital
position, including any triggers and
escalation procedures. The policy should
also include a detailed explanation of the
circumstances in which it will reduce or
suspend a dividend or repurchase program,
or will not execute a previously planned
capital action.
• A regulated entity should establish a
minimum frequency with which its capital
plan is reevaluated (at least annually). In
addition, a regulated entity should review
its capital policy at least annually to ensure
Page 11
11 | P a g e
it remains relevant and current.
Capital Planning Practices
• At regular intervals, a regulated entity
should compare the estimates of baseline
and post-stress capital measures (see
Principle 4) to the capital goals established
in the capital policy for purposes of
informing capital decisions.
• For capital decisions, consideration
should be given to any information that
may have material bearing on the regulated
entity’s capital adequacy assessment,
including all relevant risks and strategic
factors, key uncertainties, and limitations of
the stress test.
• Assessments of capital adequacy and
decisions about capital should be
supported by high quality data and
information, informed by current and
relevant analysis, and subject to challenge
by senior management and the board of
directors.
• Periodically, the regulated entity should
conduct a thorough assessment of its
capital contingency strategies, including
their feasibility under stress, impact,
timing, and potential stakeholder reactions.
• A regulated entity should administer its
capital planning activities and capital
decision processes in conformance with its
policy framework, documenting, and
justifying any divergence from policy.
Principle 6: The regulated entity has
robust internal controls governing capital
adequacy process components, including
policies and procedures, change control,
model validation and independent review,
comprehensive documentation, and review
by internal audit.
• The internal control framework should
encompass the entire stress test, including
the risk measurement and management
systems used to produce input data, the
models and other techniques used to
estimate loss and resource estimates, the
process for making capital adequacy
decisions, and the aggregation and reporting
framework used to produce management
and board reporting. The set of control
functions in place should provide
confirmation that all aspects of the stress test
are functioning as intended.
• Policies and procedures should ensure a
consistent and repeatable process and
provide transparency to third parties for
their understanding of a regulated entity’s
stress test processes and practices. Policies
and procedures should be comprehensive,
relevant to their use in the stress test,
periodically updated and approved, and
cover the entire stress test and all of its
components.
• Specific to the stress test, a regulated
entity should have internal controls that
ensure the integrity of reported results and
that all material changes to the stress test
and its components are appropriately
documented, reviewed, and approved. A
regulated entity should have controls to
ensure that management information
systems are robust enough to support stress
tests with sufficient flexibility to run ad hoc
analysis as needed.
Page 12
12 | P a g e
• Expectations for validation and independent
review for components of the stress test are
consistent with existing supervisory guidance on
model risk management. Models should be
independently validated or otherwise reviewed in
line with model risk management and model
governance expectations.
• A regulated entity should have clear and
comprehensive documentation for all aspects of
its stress test, including its risk measurement and
management infrastructure, loss- and resource-
estimation methodologies, the process for
making capital decisions, and efficacy of control
and governance functions.
• A regulated entity’s internal audit should play
a strong role in evaluating the stress test and its
components. A full review of the capital adequacy
process component should be done by audit
periodically to ensure that as a whole the stress
test is functioning as expected and in accordance
with the regulated entity’s policies and
procedures. Internal audit should review the
manner in which stress test deficiencies are
identified, tracked, and remediated.
Principle 7: The regulated entity has effective board
and senior management oversight of the stress test,
including periodic review of the regulated entity’s
risk infrastructure and loss and resource estimation
methodologies, evaluation of capital goals,
assessment of the appropriateness of stressful
scenarios considered, regular review of any
limitations and uncertainties in all aspects of the
stress test, and approval of capital decisions.
• The board of directors should make informed
decisions on capital adequacy for its regulated
entity by receiving sufficient information
detailing the risks the regulated entity faces, its
exposures and activities, and the impact that loss
and resource estimates may have on its capital
position.
• Information provided to the board of directors
about capital adequacy should be framed against
the capital goals established by the regulated
entity and by obligations to external stakeholders,
and consider capital adequacy for the regulated
entity with respect to the current circumstances as
well as on a pro forma, post-stress basis.
• The information the board of directors reviews
should include a representation of key limitations,
assumptions, and uncertainties within the stress
test, enabling the board of directors to have the
perspective to effectively understand and
challenge reported results. The board of directors
should take action when weaknesses in the stress
test are identified, giving full consideration to the
impact of those weaknesses in their capital
decisions.
• Senior management should ensure that all
weaknesses in the stress test are identified, as well
as key assumptions, limitations, and uncertainties,
and evaluate them for materiality (both
individually and collectively). Senior
management also should have remediation plans
for any weaknesses affecting stress test reliability
or results.
• Using appropriate information, senior
management should make informed
recommendations to the board of directors about
the regulated entity’s capital, including capital
goals and distribution decisions. Senior
management should include supporting
information to highlight key assumptions,
limitations, and uncertainties in the stress test that
may affect capital decisions.
• A regulated entity should appropriately
document the key decisions about capital
Page 13
13 | P a g e
adequacy—including capital actions—made by
the board of directors and senior management,
and describe the information used to make those
decisions.
Page 14
14 | P a g e
Appendix 2: FHFA DFA Reporting Templates - Enterprises
Institution Name:
Date of Data Submission:
Institution Contact Name:
Institution Contact Phone Number:
Institution Contact Email Address:
Scenario Templates Cover Sheet
Each regulated entity is expected to provide input data for all the tabs in this spreadsheet .
Page 15
15 | P a g e
(Please indicate which scenarios were used in your model by checking the appropriate box:)
Domestic Variables International Variables
For variables not used, please provide a brief explanation below as to why it was not used:
Explanation
1
2
3
4
5
Supplied Scenario Variables
Variable Name
Real GDP Growth
Nominal GDP Growth
Real Disposable Income Growth
Unemployment Rate
Nominal Disposable Income Growth
CPI Inflation Rate
3-month Treasury Yield
5-year Treasury Yield
10-year Treasury Yield
BBB Corporate Yield
Mortgage Rate
Prime Rate
Dow Jones Total Stock Market Index
House Price Index
Commercial Real Estate Price Index
Market Volatility Index (VIX)
Private Label Securities (PLS) or Non-Agency Prices for Residential Mortgage-backed Securities (RMBS), Asset-based Securities (ABS), Commercial Mortgage-backed Securities (CMBS) and other collateral
Counterparty Default Risk
Agency Securities Option-Adjusted Spreads (OAS)
Municipal Securities
Euro Area Real GDP Growth
Euro Area Inflation
Euro Area Bilateral Dollar Exchange Rate ($/euro)
Developing Asia Real GDP Growth
Developing Asia Inflation
Developing Asia Bilateral Dollar Exchange Rate (F/UDS, indes, base = 2000,Q1)
Japan Real GDP Growth
Japan Bilateral Dollar Exchange Rate (yen/USD)
Japan Inflation
U.K. Real GDP Growth
U.K. Inflation
U.K. Bilaeral Dollar Exchange Rate (USD/pound)
Page 16
16 | P a g e
Variable
Number Variable Name Variable Definition
1
2
3
4
5
Variable
Number Variable Name Variable Definition
1
2
3
4
5
Variable
Number Variable Name Variable Definition
1
2
3
4
5
Baseline Scenario (additional variables used beyond those supplied)
Adverse Scenario (additional variables used beyond those supplied)
Severely Adverse Scenario (additional variables used beyond those supplied)
Scenario Variables Beyond Those Supplied
Page 17
17 | P a g e
Actual
Category Benchmark 4Q 2016 Q1 Q2 Q3 Q4 Q5 Q6 Q7 Q8 Q9
Example: Advance 3-Month LIBOR 10.0 10.0 10.0 10.0 15.0 15.0 15.0 15.0 15.0 15.0
Actual
Variable Name 4Q 2016 Q1 Q2 Q3 Q4 Q5 Q6 Q7 Q8 Q9
Actual
Maturity 4Q 2016 Q1 Q2 Q3 Q4 Q5 Q6 Q7 Q8 Q9
3-Month Treasury 0.4 0.6 0.7 0.9 1.1 1.3 1.5 1.7 1.9 2.2
6-Month
1 year
2 year
5 year Treasury 1.7 1.7 1.9 2.0 2.2 2.3 2.4 2.6 2.7 2.8
10 year Treasury 2.2 2.5 2.6 2.7 2.9 3.0 3.1 3.2 3.3 3.4
15 year
30 year
Actual
Region 4Q 2016 Jan-17 Feb-17 Mar-17 Apr-17 May-17 Jun-17 Jul-17 Aug-17 Sep-17 Oct-17
Region 1
Region 2
.
.
.
.
.
.
House Price Index(NOTE: For printing purposes dates only goes to Oct-17. However, the underlying excel spreadsheet collects 30 years of data.)
Projected
Baseline
Spread Assumptions
Projected
Forward Curve
Projected
Variables Used Beyond Those Supplied
Projected
Spread to Benchmark
Page 18
18 | P a g e
Actual
Category Benchmark 4Q 2016 Q1 Q2 Q3 Q4 Q5 Q6 Q7 Q8 Q9
Example: Advance 3-Month LIBOR 10.0 10.0 10.0 10.0 15.0 15.0 15.0 15.0 15.0 15.0
Actual
Variable Name 4Q 2016 Q1 Q2 Q3 Q4 Q5 Q6 Q7 Q8 Q9
Actual
Maturity 4Q 2016 Q1 Q2 Q3 Q4 Q5 Q6 Q7 Q8 Q9
3-Month Treasury 0.4 0.1 0.1 0.1 0.1 0.1 0.1 0.1 0.1 0.1
6-Month
1 year
2 year
5 year Treasury 1.7 1.7 1.8 1.8 1.9 1.9 1.9 2.0 2.0 2.0
10 year Treasury 2.2 2.3 2.4 2.5 2.5 2.6 2.7 2.7 2.7 2.7
15 year
30 year
Actual
Region 4Q 2016 Jan-17 Feb-17 Mar-17 Apr-17 May-17 Jun-17 Jul-17 Aug-17 Sep-17 Oct-17
Region 1
Region 2
.
.
.
.
.
.
House Price Index(NOTE: For printing purposes dates only goes to Oct-17. However, the underlying excel spreadsheet collects 30 years of data.)
Projected
Adverse
Spread to Benchmark
Forward Curve
Projected
Spread Assumptions
Projected
Variables Used Beyond Those Supplied
Projected
Page 19
19 | P a g e
Actual
Category Benchmark 4Q 2016 Q1 Q2 Q3 Q4 Q5 Q6 Q7 Q8 Q9
Example: Advance 3-Month LIBOR 10.0 10.0 10.0 10.0 15.0 15.0 15.0 15.0 15.0 15.0
Actual
Variable Name 4Q 2016 Q1 Q2 Q3 Q4 Q5 Q6 Q7 Q8 Q9
Actual
Maturity 4Q 2016 Q1 Q2 Q3 Q4 Q5 Q6 Q7 Q8 Q9
3-Month Treasury 0.4 0.1 0.1 0.1 0.1 0.1 0.1 0.1 0.1 0.1
6-Month
1 year
2 year
5 year Treasury 1.7 0.3 0.4 0.5 0.6 0.7 0.7 0.8 0.9 1.0
10 year Treasury 2.2 0.8 0.8 0.9 1.0 1.1 1.2 1.3 1.4 1.5
15 year
30 year
Actual
Region 4Q 2016 Jan-17 Feb-17 Mar-17 Apr-17 May-17 Jun-17 Jul-17 Aug-17 Sep-17 Oct-17
Region 1
Region 2
.
.
.
.
.
.
House Price Index(NOTE: For printing purposes dates only go to Oct-17. However, the underlying excel spreadsheet collects 30 years of data.)
Projected
Severely Adverse
Variables Used Beyond Those Supplied
Projected
Forward Curve
Projected
Spread Assumptions
Projected
Spread to Benchmark
Page 20
20 | P a g e
1. All numbers should be reported in millions
Stress Test Template Instructions
2. Reported numbers should reflect the 12/31/2016 start date.
Page 21
21 | P a g e
($s in millions)
Most
Recent
Quarter Q1 Q2 Q3 Q4 Q5 Q6 Q7 Q8 Q9
Nine
Quarter
Cumulative
Total
1 Net interest income (excluding management and guaranty fee income)
2 Management and guaranty fee income1
3 Total net interest income
4 Other income
5 Total revenue
6 REO (foreclosed property expense)
7 SOP 03-3 losses, net
8 Security impairments
9 Operational risk losses
10 Administrative expenses
11 Other expenses
12 Pre-provision net revenue
13 (Provision) benefit for credit losses
14 Derivatives gains (losses)
15 Trading gains (losses)
16 Other gains (losses)
17 Global market shock impact on trading securities and held-for-sale loans
18 Counterparty default losses
19 Pre-Tax income (loss)
20 (Provision) benefit for federal income taxes
21 Extraordinary gains (losses), net of tax effect
22 Net income (loss)
23 Global market shock impact on available-for-sale securities
24 Other comprehensive income
25 Comprehensive income (loss)
1 Includes guaranty fees received for managing credit risk on mortgage loans of consolidated trusts/PCs.
Income Statement (BASELINE)
Enterprise Dodd-Frank Stress Test Template
(Disclosure to FHFA ONLY)
Page 22
22 | P a g e
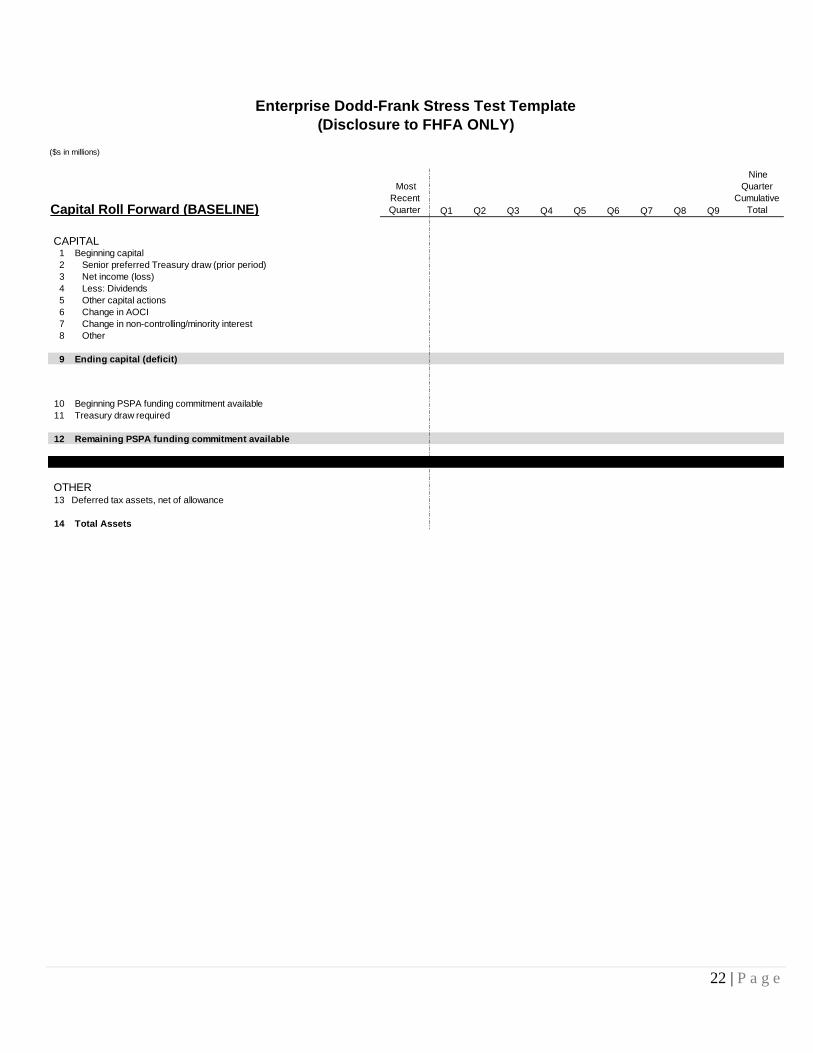
($s in millions)
Most
Recent
Quarter Q1 Q2 Q3 Q4 Q5 Q6 Q7 Q8 Q9
Nine
Quarter
Cumulative
Total
CAPITAL1 Beginning capital
2 Senior preferred Treasury draw (prior period)
3 Net income (loss)
4 Less: Dividends
5 Other capital actions
6 Change in AOCI
7 Change in non-controlling/minority interest
8 Other
9 Ending capital (deficit)
10 Beginning PSPA funding commitment available
11 Treasury draw required
12 Remaining PSPA funding commitment available
OTHER13 Deferred tax assets, net of allowance
14 Total Assets
Capital Roll Forward (BASELINE)
Enterprise Dodd-Frank Stress Test Template
(Disclosure to FHFA ONLY)
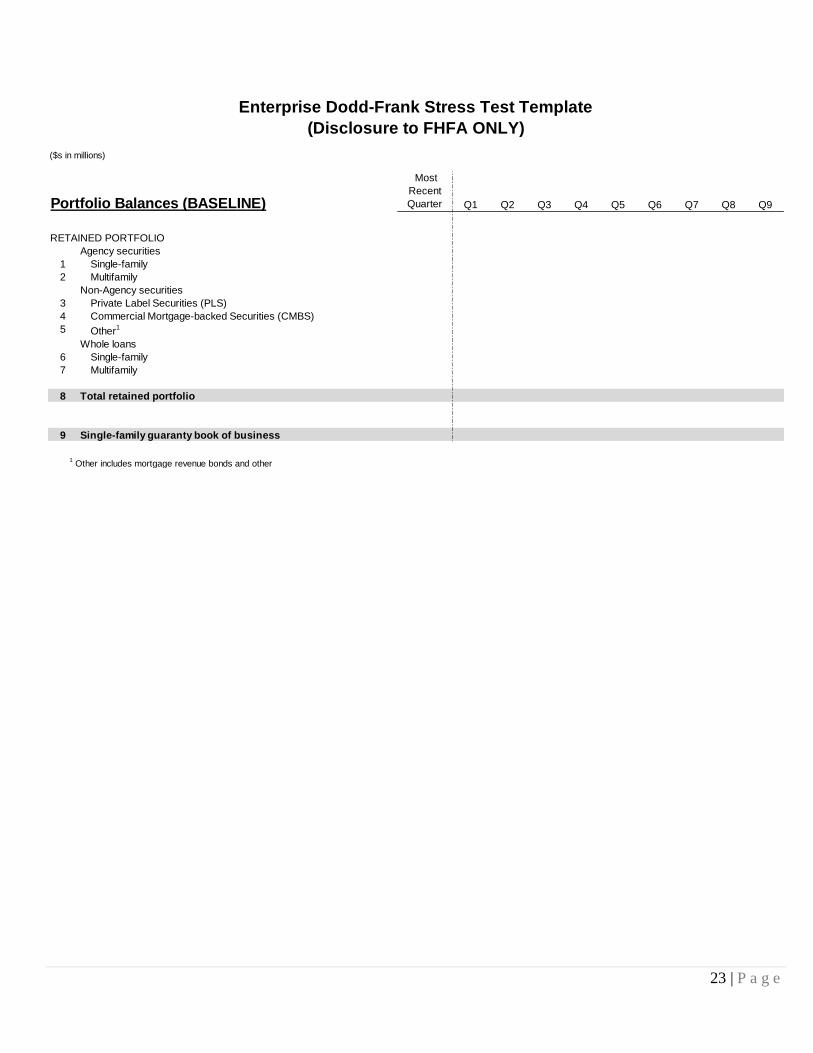
Page 23
23 | P a g e
($s in millions)
Most
Recent
Quarter Q1 Q2 Q3 Q4 Q5 Q6 Q7 Q8 Q9
RETAINED PORTFOLIO
Agency securities
1 Single-family
2 Multifamily
Non-Agency securities
3 Private Label Securities (PLS)
4 Commercial Mortgage-backed Securities (CMBS)
5 Other1
Whole loans
6 Single-family
7 Multifamily
8 Total retained portfolio
9 Single-family guaranty book of business
1 Other includes mortgage revenue bonds and other
Enterprise Dodd-Frank Stress Test Template
(Disclosure to FHFA ONLY)
Portfolio Balances (BASELINE)
Page 24
24 | P a g e
Most
Recent
Quarter Q1 Q2 Q3 Q4 Q5 Q6 Q7 Q8 Q9
Nine
Quarter
Cumulative
Total
TOTAL PORTFOLIO
CREDIT EXPENSES ($s in millions)
1 Foreclosed property expense (REO)
2 Net charge-offs
3 Credit losses
4 Provision for credit losses
5 Credit Expenses
LOAN LOSS RESERVE ($s in millions)
6 Beginning loan loss reserve
7 Net charge-offs
8 Provison (benefit) for loan losses
9 Other
10 Ending Total Loan Loss Reserve
11 Unpaid Principal Balance ($s in millions)
1 Amount depicts the summation of foreclosed property expense and provision for credit losses.
Enterprise Dodd-Frank Stress Test Template
(Disclosure to FHFA ONLY)
Credit Overview - Quarterly (BASELINE)
(includes single-family and multifamily)
1
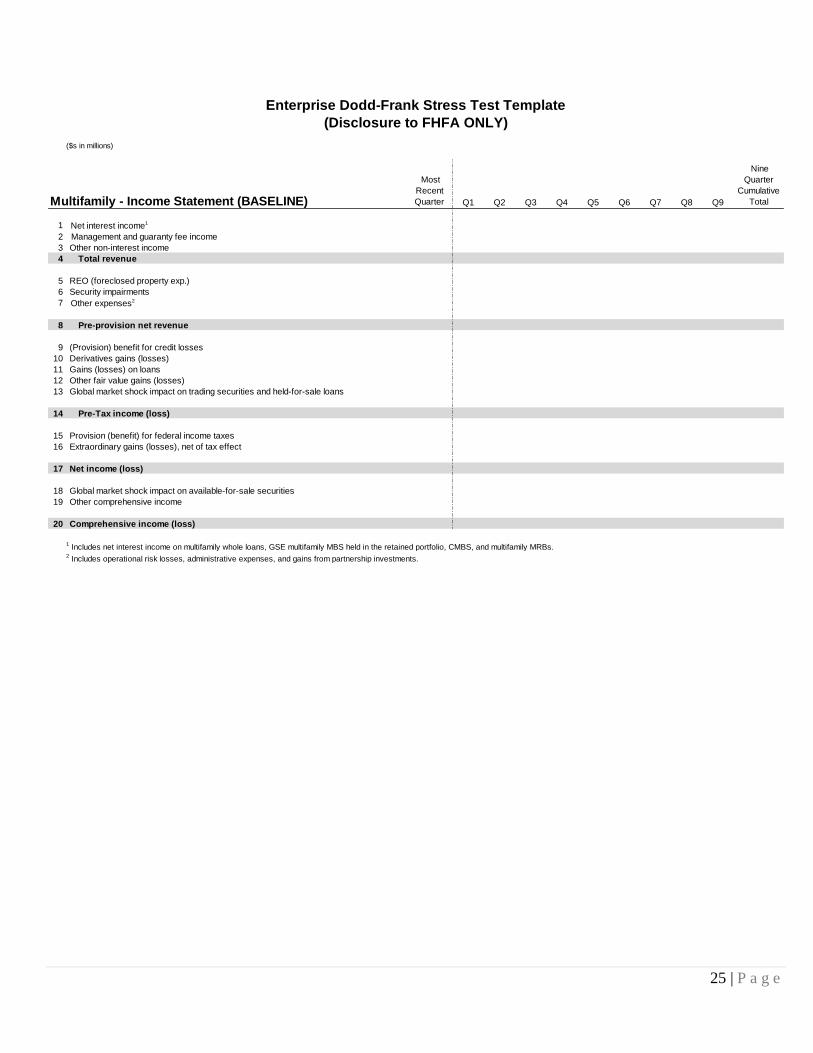
Page 25
25 | P a g e
($s in millions)
Most
Recent
Quarter Q1 Q2 Q3 Q4 Q5 Q6 Q7 Q8 Q9
Nine
Quarter
Cumulative
Total
1 Net interest income1
2 Management and guaranty fee income
3 Other non-interest income
4 Total revenue
5 REO (foreclosed property exp.)
6 Security impairments
7 Other expenses2
8 Pre-provision net revenue
9 (Provision) benefit for credit losses
10 Derivatives gains (losses)
11 Gains (losses) on loans
12 Other fair value gains (losses)
13 Global market shock impact on trading securities and held-for-sale loans
14 Pre-Tax income (loss)
15 Provision (benefit) for federal income taxes
16 Extraordinary gains (losses), net of tax effect
17 Net income (loss)
18 Global market shock impact on available-for-sale securities
19 Other comprehensive income
20 Comprehensive income (loss)
1 Includes net interest income on multifamily whole loans, GSE multifamily MBS held in the retained portfolio, CMBS, and multifamily MRBs.
2 Includes operational risk losses, administrative expenses, and gains from partnership investments.
Enterprise Dodd-Frank Stress Test Template
(Disclosure to FHFA ONLY)
Multifamily - Income Statement (BASELINE)
Page 26
26 | P a g e
Most
Recent
Quarter Q1 Q2 Q3 Q4 Q5 Q6 Q7 Q8 Q9
Nine
Quarter
Cumulative
Total
TOTAL PORTFOLIO
CREDIT EXPENSES ($s in millions)
1 Foreclosed property expense (REO)
2 Net charge-offs
3 Credit losses
4 Provision for credit losses
5 Credit Expenses
LOAN LOSS RESERVE ($s in millions)
6 Beginning loan loss reserve
7 Net charge-offs
8 Provison (benefit) for loan losses
9 Other
10 Ending Total Loan Loss Reserve
11 Unpaid Principal Balance ($s in millions)
1 Amount depicts the summation of foreclosed property expense and provision for credit losses.
Enterprise Dodd-Frank Stress Test Template
(Disclosure to FHFA ONLY)
Multifamily Credit Overview - Quarterly (BASELINE)
1
Page 27
27 | P a g e
Most
Recent
Quarter Q1 Q2 Q3 Q4 Q5 Q6 Q7 Q8 Q9
Nine
Quarter
Cumulative
Total
($s in millions)
1 Total multifamily market volume (industry)
2 Enterprise market share percentage
3 New acquisition volume
4 Liquidation volume1
5 Securitization volume
6 Effective guaranty fee rate2 (bps)
7 Guaranty portfolio balance
8 Loans and securities held in portfolio
1 Includes property sales and other run-off/prepayments.
2 Guaranty fee income divided by weighted average portfolio balance.
Enterprise Dodd-Frank Stress Test Template
(Disclosure to FHFA ONLY)
Multifamily Key Metrics (BASELINE)
Page 28
28 | P a g e
Most
Recent
Quarter Q1 Q2 Q3 Q4 Q5 Q6 Q7 Q8 Q9
Nine
Quarter
Cumulative
Total
TOTAL PORTFOLIO
CREDIT EXPENSES ($s in millions)
1 Foreclosed property expense (REO)
2 Net charge-offs
3 Credit losses
4 Provision for credit losses
5 Credit Expenses
LOAN LOSS RESERVE ($s in millions)
6 Beginning loan loss reserve
7 Net charge-offs
8 Provison (benefit) for loan losses/guaranty losses
9 Other
10 Ending Total Loan Loss Reserve
Memo:
11 FAS 5 Loan Loss Reserve
12 FAS 114 Loan Loss Reserve
13 Concessions in FAS 114 Loan Loss Reserve
14 Unpaid Principal Balance ($s in millions)
CURRENT BOOK (as of 12/31/16)
CREDIT EXPENSES ($s in millions)
15 Foreclosed property expense (REO)
16 Net charge-offs
17 Credit losses
18 Provision for credit losses
19 Credit Expenses
LOAN LOSS RESERVE ($s in millions)
20 Beginning loan loss reserve
21 Net charge-offs
22 Provison (benefit) for loan losses/guaranty losses
23 Other
24 Ending Loan Loss Reserve - Current Book
25 Unpaid Principal Balance ($s in millions)
NEW BUSINESS
CREDIT EXPENSES ($s in millions)
26 Foreclosed property expense (REO)
27 Net charge-offs
28 Credit losses
29 Provision for credit losses
30 Credit Expenses
LOAN LOSS RESERVE ($s in millions)
31 Beginning loan loss reserve
32 Net charge-offs
33 Provison (benefit) for loan losses/guaranty losses
34 Other
35 Ending Loan Loss Reserve - New Business
36 Unpaid Principal Balance ($s in millions)
1 Amount depicts the summation of foreclosed property expense, provision for credit losses, and SOP 03-3 losses.
2 Amount includes the impact of all troubled debt restructuring (TDR) related impairments.
Enterprise Dodd-Frank Stress Test Template
(Disclosure to FHFA ONLY)
Single-Family Credit Overview - Quarterly (BASELINE)
2
1
1
1
Page 29
29 | P a g e
Most
Recent
Quarter Q1 Q2 Q3 Q4 Q5 Q6 Q7 Q8 Q9
SERIOUSLY DELINQUENT LOAN ACTIVITY (count in '000s)
1 Beginning seriously delinquent loans
2 Seriously delinquent inflows - new SDQ
3 Seriously delinquent inflows - cured
4 Seriously delinquent cured by modification
5 Seriously delinquent - cured
6 Seriously delinquent to default
7 Seriously delinquent to payoff
8 Ending Seriously Delinquent Loans
9 Ending seriously delinquent rate (%)
10 Aggregate UPB of seriously delinquent loans ($s in millions)
11 Loan modifications (count in 000s)
PAYMENTS FROM PRIVATE MORTGAGE INSURERS (after haircut) ($s in millions)
12 Mortgage Guaranty Insurance Corporation
13 Triad Guaranty Insurance Corporation
14 Radian Guaranty Inc.
15 United Guaranty Residential Insurance Co.
16 Genworth Mortgage Insurance Corporation
17 PMI Mortgage Insurance Co.
18 Republic Mortgage Insurance Company
19 Essent Guaranty, Inc.
20 Arch Mortgage Insurance Company
21 Other
NOTE: Seriously delinquent loans are 90 days or more delinquent, or in the process of foreclosure.
Enterprise Dodd-Frank Stress Test Template
(Disclosure to FHFA ONLY)
Single-Family Credit Overview - Quarterly (BASELINE)
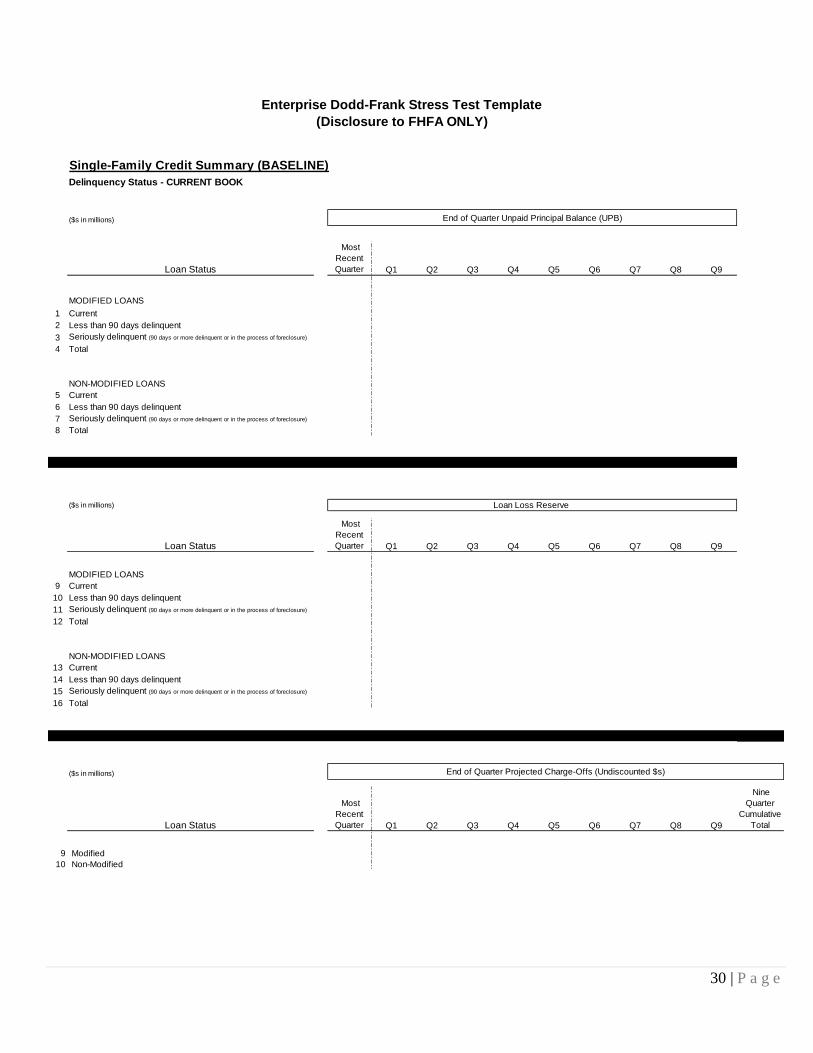
Page 30
30 | P a g e
Single-Family Credit Summary (BASELINE)
Delinquency Status - CURRENT BOOK
($s in millions)
Most
Recent
Quarter Q1 Q2 Q3 Q4 Q5 Q6 Q7 Q8 Q9
MODIFIED LOANS
1 Current
2 Less than 90 days delinquent
3
4 Total
NON-MODIFIED LOANS
5 Current
6 Less than 90 days delinquent
7
8 Total
($s in millions)
Most
Recent
Quarter Q1 Q2 Q3 Q4 Q5 Q6 Q7 Q8 Q9
MODIFIED LOANS
9 Current
10 Less than 90 days delinquent
11
12 Total
NON-MODIFIED LOANS
13 Current
14 Less than 90 days delinquent
15
16 Total
($s in millions)
Most
Recent
Quarter Q1 Q2 Q3 Q4 Q5 Q6 Q7 Q8 Q9
Nine
Quarter
Cumulative
Total
9 Modified
10 Non-Modified
Seriously delinquent (90 days or more delinquent or in the process of foreclosure)
Enterprise Dodd-Frank Stress Test Template
(Disclosure to FHFA ONLY)
End of Quarter Unpaid Principal Balance (UPB)
Loan Status
Seriously delinquent (90 days or more delinquent or in the process of foreclosure)
End of Quarter Projected Charge-Offs (Undiscounted $s)
Loan Status
Seriously delinquent (90 days or more delinquent or in the process of foreclosure)
Seriously delinquent (90 days or more delinquent or in the process of foreclosure)
Loan Loss Reserve
Loan Status
Page 31
31 | P a g e
Single-Family Credit Summary (BASELINE)
Mark-to-Market Loan-to-Value - CURRENT BOOK
($s in millions)
Most
Recent
Quarter Q1 Q2 Q3 Q4 Q5 Q6 Q7 Q8 Q9
1 <=80%
2 >80% - 100%
3 >100%
4 Total
($s in millions)
Most
Recent
Quarter Q1 Q2 Q3 Q4 Q5 Q6 Q7 Q8 Q9
5 <=80%
6 >80% - 100%
7 >100%
8 Total
($s in millions)
Most
Recent
Quarter Q1 Q2 Q3 Q4 Q5 Q6 Q7 Q8 Q9
Nine
Quarter
Cumulative
Total
9 <=80%
10 >80% - 100%
11 >100%
End of Quarter Projected Charge-Offs (Undiscounted $s)
Loan Status
Loan Status
Enterprise Dodd-Frank Stress Test Template
(Disclosure to FHFA ONLY)
End of Quarter Unpaid Principal Balance (UPB)
Loan Status
Loan Loss Reserve
Page 32
32 | P a g e
Single-Family Credit Summary (BASELINE)
Vintage Status - CURRENT BOOK
($s in millions)
Loan Status
Most
Recent
Quarter Q1 Q2 Q3 Q4 Q5 Q6 Q7 Q8 Q9
1 2004 and prior
2 2005
3 2006
4 2007
5 2008
6 2009
7 2010
8 2011
9 2012
10 2013
11 2014
12 2015
13 2016
($s in millions)
Loan Status
Most
Recent
Quarter Q1 Q2 Q3 Q4 Q5 Q6 Q7 Q8 Q9
14 2004 and prior
15 2005
16 2006
17 2007
18 2008
19 2009
20 2010
21 2011
22 2012
23 2013
24 2014
25 2015
26 2016
($s in millions)
Loan Status
Most
Recent
Quarter Q1 Q2 Q3 Q4 Q5 Q6 Q7 Q8 Q9
Nine
Quarter
Cumulative
Total
27 2004 and prior
28 2005
29 2006
30 2007
31 2008
32 2009
33 2010
34 2011
35 2012
36 2013
37 2014
38 2015
39 2016
End of Quarter Projected Charge-Offs (Undiscounted $s)
Enterprise Dodd-Frank Stress Test Template
(Disclosure to FHFA ONLY)
End of Quarter Unpaid Principal Balance (UPB)
Loan Loss Reserve
Page 33
33 | P a g e
($s in millions)
Single-Family - 9 Quarter Cumulative Credit Losses (BASELINE)
<30 30 - 60 61 -70 71 - 75 76 - 80 81 - 85 86 - 90 91 - 95 96 - 100 101 - 110 111 - 120 >120
<620
620 - 640
641 - 660
661 - 680
681 - 700
701 - 720
721 -740
741 - 760
761 - 780
>780
Credit losses represent the summation of net charge-offs and foreclosed property expenses (REO).
Use LTV and credit score as of December 31, 2016.
Enterprise Dodd-Frank Stress Test Template
(Disclosure to FHFA ONLY)
Loan-To-Value
Cre
dit
Sc
ore
Page 34
34 | P a g e
($s in millions)
Single-Family - Loan Loss Reserves (BASELINE)
Loan Loss Reserves as of 12/31/16
<30 30 - 60 61 -70 71 - 75 76 - 80 81 - 85 86 - 90 91 - 95 96 - 100 101 - 110 111 - 120 >120
<620
620 - 640
641 - 660
661 - 680
681 - 700
701 - 720
721 -740
741 - 760
761 - 780
>780
Use LTV and credit score as of December 31, 2016
Loan Loss Reserves at 3/31/19 (end of nine quarters)
<30 30 - 60 61 -70 71 - 75 76 - 80 81 - 85 86 - 90 91 - 95 96 - 100 101 - 110 111 - 120 >120
<620
620 - 640
641 - 660
661 - 680
681 - 700
701 - 720
721 -740
741 - 760
761 - 780
>780
Use LTV and credit score as of December 31, 2016
Cre
dit
Sc
ore
Enterprise Dodd-Frank Stress Test Template
(Disclosure to FHFA ONLY)
Loan-To-Value
Cre
dit
Sc
ore
Loan-To-Value
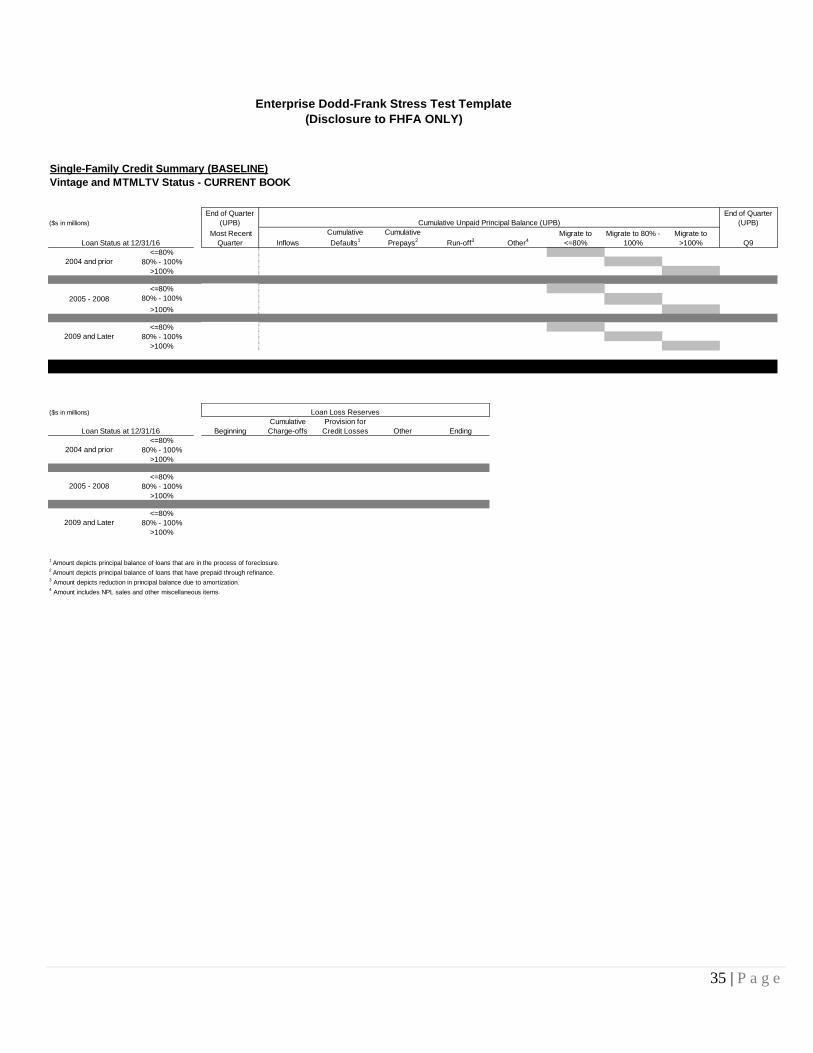
Page 35
35 | P a g e
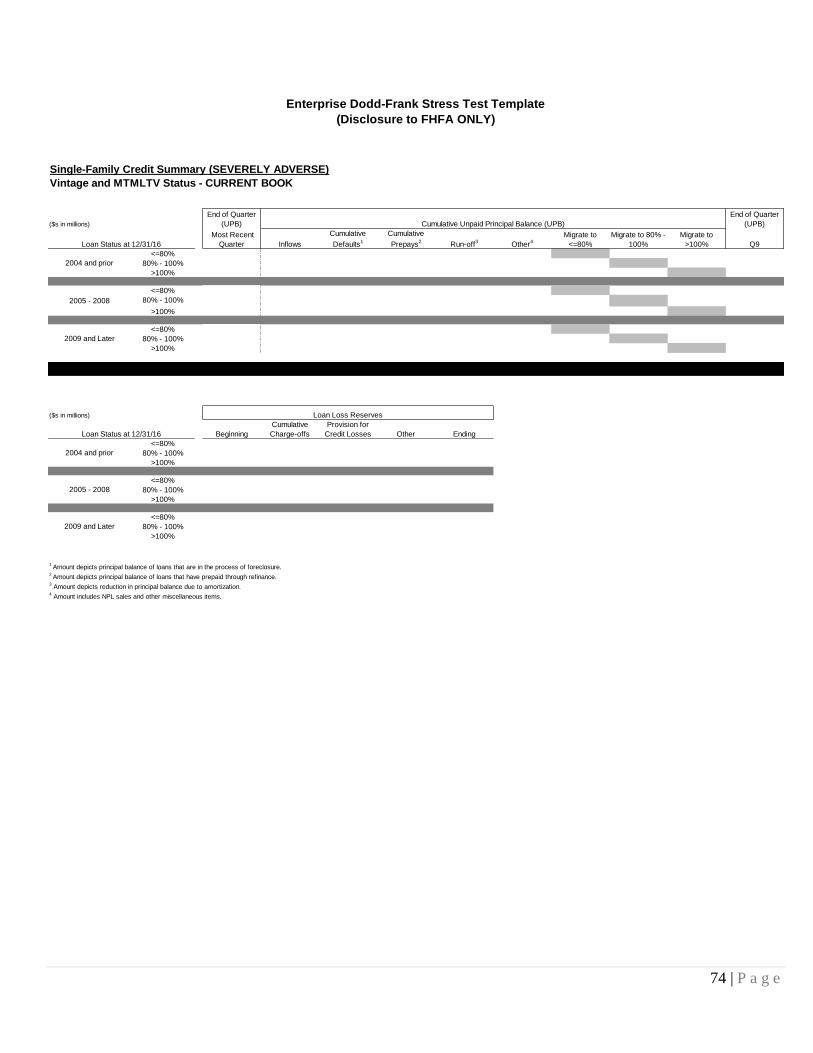
Single-Family Credit Summary (BASELINE)
Vintage and MTMLTV Status - CURRENT BOOK
($s in millions)
End of Quarter
(UPB)
End of Quarter
(UPB)
Most Recent
Quarter Inflows
Cumulative
Defaults1
Cumulative
Prepays2
Run-off3
Other4
Migrate to
<=80%
Migrate to 80% -
100%
Migrate to
>100% Q9
<=80%
80% - 100%
>100%
<=80%
80% - 100%
>100%
<=80%
80% - 100%
>100%
($s in millions)
Beginning
Cumulative
Charge-offs
Provision for
Credit Losses Other Ending
<=80%
80% - 100%
>100%
<=80%
80% - 100%
>100%
<=80%
80% - 100%
>100%
1 Amount depicts principal balance of loans that are in the process of foreclosure.
2 Amount depicts principal balance of loans that have prepaid through refinance.
3 Amount depicts reduction in principal balance due to amortization.
4 Amount includes NPL sales and other miscellaneous items.
Loan Status at 12/31/16
2004 and prior
2005 - 2008
2009 and Later
Loan Loss Reserves
Enterprise Dodd-Frank Stress Test Template
(Disclosure to FHFA ONLY)
2004 and prior
2005 - 2008
2009 and Later
Loan Status at 12/31/16
Cumulative Unpaid Principal Balance (UPB)
Page 36
36 | P a g e
Single-Family Credit Summary (BASELINE)
Vintage and Delinquency Status - CURRENT BOOK
($s in millions)
End of Quarter
(UPB)
End of Quarter
(UPB)
Most Recent
Quarter Inflows
Cumulative
Defaults1
Cumulative
Prepays2
Run-off3
Other4
Migrate to
Modified Current
Migrate to
Modified
<90 Days
Migrate to
Modified
SDQ
Migrate to
Non-Modified
Current
Migrate to
Non-Modified
<90 Days
Migrate to
Non-Modified
SDQ Q9
Current
<90 Days
SDQ
Current
<90 Days
SDQ
Current
<90 Days
SDQ
Current
<90 Days
SDQ
Current
<90 Days
SDQ
Current
<90 Days
SDQ
($s in millions)
Beginning
Cumulative
Charge-offs
Provision
for
Credit Losses Other Ending
Current
<90 Days
SDQ
Current
<90 Days
SDQ
Current
<90 Days
SDQ
Current
<90 Days
SDQ
Current
<90 Days
SDQ
Current
<90 Days
SDQ
1 Amount depicts principal balance of loans that are in the process of foreclosure.
2 Amount depicts principal balance of loans that have prepaid through refinance.
3 Amount depicts reduction in principal balance due to amortization.
4 Amount includes NPL sales and other miscellaneous items.
Loan Status at 12/31/16
2004 and prior
Modified
Non-Modified
Loan Loss Reserves
2005 - 2008
Modified
Non-Modified
2009 and Later
Modified
Non-Modified
Loan Status at 12/31/16
Enterprise Dodd-Frank Stress Test Template
(Disclosure to FHFA ONLY)
2009 and Later
Modified
Non-Modified
2004 and prior
Modified
Non-Modified
2005 - 2008
Modified
Non-Modified
Cumulative Unpaid Principal Balance (UPB)
Page 37
37 | P a g e
Single-Family Credit Summary (BASELINE)
MTMLTV and Delinquency Status - CURRENT BOOK
($s in millions)
End of Quarter
(UPB)
End of Quarter
(UPB)
Most Recent
Quarter Inflows
Cumulative
Defaults1
Cumulative
Prepays2
Run-off3
Other4
Migrate to
Modified Current
Migrate to
Modified
<90 Days
Migrate to
Modified
SDQ
Migrate to
Non-Modified
Current
Migrate to
Non-Modified
<90 Days
Migrate to
Non-Modified
SDQ Q9
Current
<90 Days
SDQ
Current
<90 Days
SDQ
Current
<90 Days
SDQ
Current
<90 Days
SDQ
Current
<90 Days
SDQ
Current
<90 Days
SDQ
($s in millions)
Beginning
Cumulative
Charge-offs
Provision
for
Credit Losses Other Ending
Current
<90 Days
SDQ
Current
<90 Days
SDQ
Current
<90 Days
SDQ
Current
<90 Days
SDQ
Current
<90 Days
SDQ
Current
<90 Days
SDQ
1 Amount depicts principal balance of loans that are in the process of foreclosure.
2 Amount depicts principal balance of loans that have prepaid through refinance.
3 Amount depicts reduction in principal balance due to amortization.
4 Amount includes NPL sales and other miscellaneous items.
>100%
Modified
Non-Modified
Loan Status at 12/31/16
<=80%
Modified
Non-Modified
80% - 100%
Modified
Non-Modified
Loan Loss Reserves
Non-Modified
Enterprise Dodd-Frank Stress Test Template
(Disclosure to FHFA ONLY)
Loan Status at 12/31/16
<=80%
Modified
80% - 100%
Modified
Non-Modified
>100%
Modified
Non-Modified
Cumulative Unpaid Principal Balance (UPB)
Page 38
38 | P a g e
Most
Recent
Quarter Q1 Q2 Q3 Q4 Q5 Q6 Q7 Q8 Q9
Nine
Quarter
Cumulative
Total
($s in millions)
CAS/STACR
1 Interest Expense
2 Fair Value Gain (Loss)
3 Other Expenses
4 Recoveries
CIRT/ACIS Premiums
5 Premium Expense
6 Other Expenses
7 Recoveries
8 Total Income (Loss)
9 CAS/STACR Debt Issuances
10 CIRT/ACIS Transactions
11 Reference Pool (Quarter)
12 Outstanding Reference Pool
Enterprise Dodd-Frank Stress Test Template
(Disclosure to FHFA ONLY)
Credit Risk Transfers - Quarterly (BASELINE)
Page 39
39 | P a g e
($s in millions)
Most
Recent
Quarter Q1 Q2 Q3 Q4 Q5 Q6 Q7 Q8 Q9
Nine
Quarter
Cumulative
Total
1 Net interest income (excluding management and guaranty fee income)
2 Management and guaranty fee income1
3 Total net interest income
4 Other income
5 Total revenue
6 REO (foreclosed property expense)
7 SOP 03-3 losses, net
8 Security impairments
9 Operational risk losses
10 Administrative expenses
11 Other expenses
12 Pre-provision net revenue
13 (Provision) benefit for credit losses
14 Derivatives gains (losses)
15 Trading gains (losses)
16 Other gains (losses)
17 Global market shock impact on trading securities and held-for-sale loans
18 Counterparty default losses
19 Pre-Tax income (loss)
20 (Provision) benefit for federal income taxes
21 Extraordinary gains (losses), net of tax effect
22 Net income (loss)
23 Global market shock impact on available-for-sale securities
24 Other comprehensive income
25 Comprehensive income (loss)
1 Includes guaranty fees received for managing credit risk on mortgage loans of consolidated trusts/PCs.
Income Statement (ADVERSE)
Enterprise Dodd-Frank Stress Test Template
(Disclosure to FHFA ONLY)
Page 40
40 | P a g e
($s in millions)
Most
Recent
Quarter Q1 Q2 Q3 Q4 Q5 Q6 Q7 Q8 Q9
Nine
Quarter
Cumulative
Total
CAPITAL1 Beginning capital
2 Senior preferred Treasury draw (prior period)
3 Net income (loss)
4 Less: Dividends
5 Other capital actions
6 Change in AOCI
7 Change in non-controlling/minority interest
8 Other
9 Ending capital (deficit)
10 Beginning PSPA funding commitment available
11 Treasury draw required
12 Remaining PSPA funding commitment available
OTHER13 Deferred tax assets, net of allowance
14 Total Assets
Capital Roll Forward (ADVERSE)
Enterprise Dodd-Frank Stress Test Template
(Disclosure to FHFA ONLY)
Page 41
41 | P a g e
($s in millions)
Most
Recent
Quarter Q1 Q2 Q3 Q4 Q5 Q6 Q7 Q8 Q9
RETAINED PORTFOLIO
Agency securities
1 Single-family
2 Multifamily
Non-Agency securities
3 Private Label Securities (PLS)
4 Commercial Mortgage-backed Securities (CMBS)
5 Other1
Whole loans
6 Single-family
7 Multifamily
8 Total retained portfolio
9 Single-family guaranty book of business
1 Other includes mortgage revenue bonds and other
Enterprise Dodd-Frank Stress Test Template
(Disclosure to FHFA ONLY)
Portfolio Balances (ADVERSE)
Page 42
42 | P a g e
($s in millions)
Global Market Shock (ADVERSE)Applicable
UPB Q1 Loss
1
2
3
4 Single-Family Agency Securities
5 Multifamily Agency Securities
6 Municipal Securities
7 Single-Family Loans
8 Multifamily Loans
9 Counterparty Default Risk*
Enterprise Dodd-Frank Stress Test Template
(Disclosure to FHFA ONLY)
Private Label Securities (PLS) or Non-Agency Prices for Residential Mortgage-backed Securities (RMBS)
Counterparty Name Counterparty Type
Commercial Mortgage-backed Securities (CMBS)
Asset-based Securities (ABS) and other collateral
Total Potential Income Statement Impact
Repo
Other
Total
Derivatives
Single-Family Mortgage Insurance Provider
Multifamily Credit Enhancement Provider
* Please provide the name and attribution of counterparty default risk by type (eg: derivatives, repo, etc.) of the largest
counterparty below:
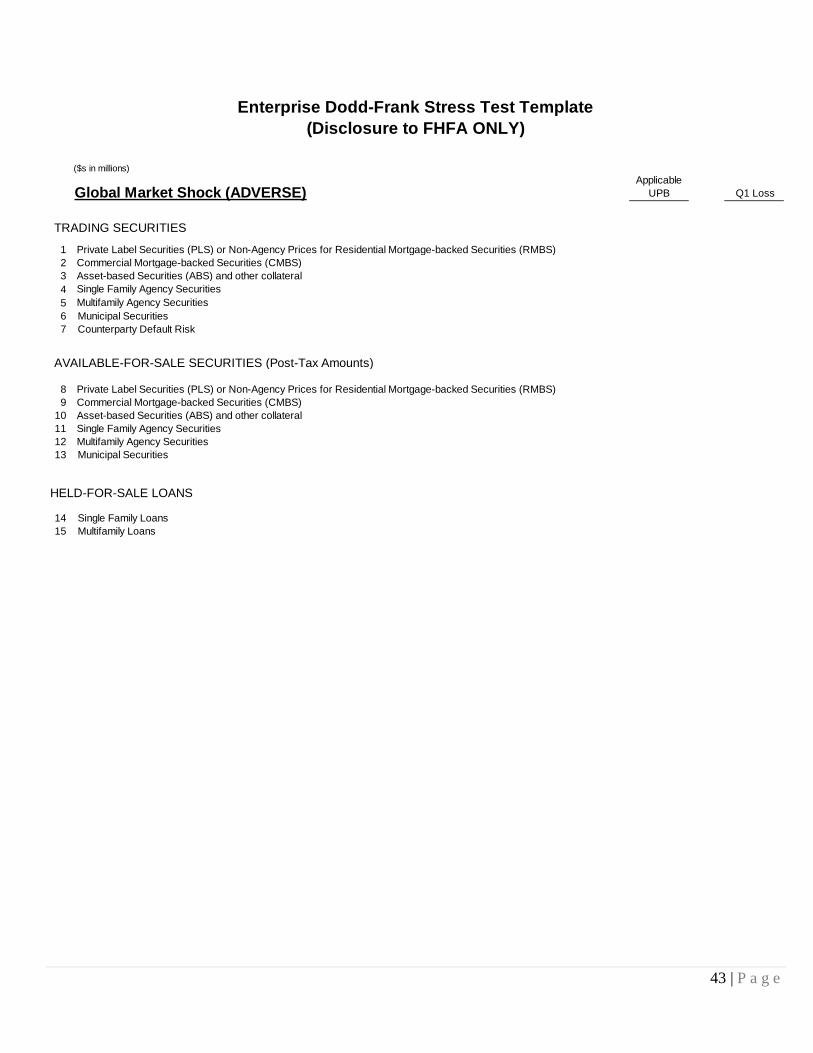
Page 43
43 | P a g e
($s in millions)
Global Market Shock (ADVERSE)Applicable
UPB Q1 Loss
TRADING SECURITIES
1
2
3
4 Single Family Agency Securities
5 Multifamily Agency Securities
6 Municipal Securities
7 Counterparty Default Risk
AVAILABLE-FOR-SALE SECURITIES (Post-Tax Amounts)
8
9
10
11 Single Family Agency Securities
12 Multifamily Agency Securities
13 Municipal Securities
HELD-FOR-SALE LOANS
14 Single Family Loans
15 Multifamily Loans
Commercial Mortgage-backed Securities (CMBS)
Asset-based Securities (ABS) and other collateral
Private Label Securities (PLS) or Non-Agency Prices for Residential Mortgage-backed Securities (RMBS)
Private Label Securities (PLS) or Non-Agency Prices for Residential Mortgage-backed Securities (RMBS)
Enterprise Dodd-Frank Stress Test Template
(Disclosure to FHFA ONLY)
Commercial Mortgage-backed Securities (CMBS)
Asset-based Securities (ABS) and other collateral
Page 44
44 | P a g e
Investment Securities and Fair Value Trading Assets
Securitized Products (ADVERSE)
(*Credit ratings should be as of December 31, 2016)
Non-
Agency
Prime
Sub-
prime
Option
ARMS
Other
AltA
Unspec
Non-
Prime HELOC
RMBS
CDO
RMBS
CDS
Credit
Basket PrimeX
ABX /
TABX
Prime
Whole
Loans
Non-Prime
Whole
Loans
European
RMBS
Other /
Unspecified
RMBS
SubTotal
MV* ($MM)
AAA Total $0 $0 $0 $0 $0 $0 $0 $0 $0 $0 $0 $0 $0 $0 $0 $0 $0
Pre 2006 $0 $0
2006 $0 $0
2007 $0 $0
Post 2007 $0 $0
Unspecified Vintage $0 $0
AA Total $0 $0 $0 $0 $0 $0 $0 $0 $0 $0 $0 $0 $0 $0 $0 $0 $0
Pre 2006 $0 $0
2006 $0 $0
2007 $0 $0
Post 2007 $0 $0
Unspecified Vintage $0 $0
A Total $0 $0 $0 $0 $0 $0 $0 $0 $0 $0 $0 $0 $0 $0 $0 $0 $0
Pre 2006 $0 $0
2006 $0 $0
2007 $0 $0
Post 2007 $0 $0
Unspecified Vintage $0 $0
BBB Total $0 $0 $0 $0 $0 $0 $0 $0 $0 $0 $0 $0 $0 $0 $0 $0 $0
Pre 2006 $0 $0
2006 $0 $0
2007 $0 $0
Post 2007 $0 $0
Unspecified Vintage $0 $0
BB Total $0 $0 $0 $0 $0 $0 $0 $0 $0 $0 $0 $0 $0 $0 $0 $0 $0
Pre 2006 $0 $0
2006 $0 $0
2007 $0 $0
Post 2007 $0 $0
Unspecified Vintage $0 $0
B Total $0 $0 $0 $0 $0 $0 $0 $0 $0 $0 $0 $0 $0 $0 $0 $0 $0
Pre 2006 $0 $0
2006 $0 $0
2007 $0 $0
Post 2007 $0 $0
Unspecified Vintage $0 $0
<B Total $0 $0 $0 $0 $0 $0 $0 $0 $0 $0 $0 $0 $0 $0 $0 $0 $0
Pre 2006 $0 $0
2006 $0 $0
2007 $0 $0
Post 2007 $0 $0
Unspecified Vintage $0 $0
NR Total $0 $0 $0 $0 $0 $0 $0 $0 $0 $0 $0 $0 $0 $0 $0 $0 $0
Pre 2006 $0 $0
2006 $0 $0
2007 $0 $0
Post 2007 $0 $0
Unspecified Vintage $0 $0
Total $0 $0 $0 $0 $0 $0 $0 $0 $0 $0 $0 $0 $0 $0 $0 $0 $0
Profit/Loss ($MM)
AAA Total $0 $0 $0 $0 $0 $0 $0 $0 $0 $0 $0 $0 $0 $0 $0 $0 $0
Pre 2006 $0 $0
2006 $0 $0
2007 $0 $0
Post 2007 $0 $0
Unspecified Vintage $0 $0
AA Total $0 $0 $0 $0 $0 $0 $0 $0 $0 $0 $0 $0 $0 $0 $0 $0 $0
Pre 2006 $0 $0
2006 $0 $0
2007 $0 $0
Post 2007 $0 $0
Unspecified Vintage $0 $0
A Total $0 $0 $0 $0 $0 $0 $0 $0 $0 $0 $0 $0 $0 $0 $0 $0 $0
Pre 2006 $0 $0
2006 $0 $0
2007 $0 $0
Post 2007 $0 $0
Unspecified Vintage $0 $0
BBB Total $0 $0 $0 $0 $0 $0 $0 $0 $0 $0 $0 $0 $0 $0 $0 $0 $0
Pre 2006 $0 $0
2006 $0 $0
2007 $0 $0
Post 2007 $0 $0
Unspecified Vintage $0 $0
BB Total $0 $0 $0 $0 $0 $0 $0 $0 $0 $0 $0 $0 $0 $0 $0 $0 $0
Pre 2006 $0 $0
2006 $0 $0
2007 $0 $0
Post 2007 $0 $0
Unspecified Vintage $0 $0
B Total $0 $0 $0 $0 $0 $0 $0 $0 $0 $0 $0 $0 $0 $0 $0 $0 $0
Pre 2006 $0 $0
2006 $0 $0
2007 $0 $0
Post 2007 $0 $0
Unspecified Vintage $0 $0
<B Total $0 $0 $0 $0 $0 $0 $0 $0 $0 $0 $0 $0 $0 $0 $0 $0 $0
Pre 2006 $0 $0
2006 $0 $0
2007 $0 $0
Post 2007 $0 $0
Unspecified Vintage $0 $0
NR Total $0 $0 $0 $0 $0 $0 $0 $0 $0 $0 $0 $0 $0 $0 $0 $0 $0
Pre 2006 $0 $0
2006 $0 $0
2007 $0 $0
Post 2007 $0 $0
Unspecified Vintage $0 $0
Total $0 $0 $0 $0 $0 $0 $0 $0 $0 $0 $0 $0 $0 $0 $0 $0 $0
Enterprise Dodd-Frank Stress Test Template
(Disclosure to FHFA ONLY)
Grand
Total
RMBS
Page 45
45 | P a g e
Investment Securities and Fair Value Trading Assets
Securitized Products (ADVERSE)
(*Credit ratings should be as of December 31, 2016)
Autos
Credit
Cards
Student
Loans
ABS
CDS
Credit
Basket
Index
Tranche
s
Other /
Unspecified
ABS
SubTotal
Cash Non-
Agency
CMBS
CMBS
CDS
CMBS
CDO
Credit
Basket
Index
Tranches
Whole
Loans
Other /
Unspecified
CMBS
SubTotal CLO
Other /
Unspecified
Corporate
CDO/CLO
SubTotal Total Size
Total
Protection
Other /
Unspecified
MV* ($MM)
AAA Total $0 $0 $0 $0 $0 $0 $0 $0 $0 $0 $0 $0 $0 $0 $0 $0 $0 $0 $0 $0 $0 $0 $0
Pre 2006 $0 $0 $0 $0
2006 $0 $0 $0 $0
2007 $0 $0 $0 $0
Post 2007 $0 $0 $0 $0
Unspecified Vintage $0 $0 $0 $0
AA Total $0 $0 $0 $0 $0 $0 $0 $0 $0 $0 $0 $0 $0 $0 $0 $0 $0 $0 $0 $0 $0 $0 $0
Pre 2006 $0 $0 $0 $0
2006 $0 $0 $0 $0
2007 $0 $0 $0 $0
Post 2007 $0 $0 $0 $0
Unspecified Vintage $0 $0 $0 $0
A Total $0 $0 $0 $0 $0 $0 $0 $0 $0 $0 $0 $0 $0 $0 $0 $0 $0 $0 $0 $0 $0 $0 $0
Pre 2006 $0 $0 $0 $0
2006 $0 $0 $0 $0
2007 $0 $0 $0 $0
Post 2007 $0 $0 $0 $0
Unspecified Vintage $0 $0 $0 $0
BBB Total $0 $0 $0 $0 $0 $0 $0 $0 $0 $0 $0 $0 $0 $0 $0 $0 $0 $0 $0 $0 $0 $0 $0
Pre 2006 $0 $0 $0 $0
2006 $0 $0 $0 $0
2007 $0 $0 $0 $0
Post 2007 $0 $0 $0 $0
Unspecified Vintage $0 $0 $0 $0
BB Total $0 $0 $0 $0 $0 $0 $0 $0 $0 $0 $0 $0 $0 $0 $0 $0 $0 $0 $0 $0 $0 $0 $0
Pre 2006 $0 $0 $0 $0
2006 $0 $0 $0 $0
2007 $0 $0 $0 $0
Post 2007 $0 $0 $0 $0
Unspecified Vintage $0 $0 $0 $0
B Total $0 $0 $0 $0 $0 $0 $0 $0 $0 $0 $0 $0 $0 $0 $0 $0 $0 $0 $0 $0 $0 $0 $0
Pre 2006 $0 $0 $0 $0
2006 $0 $0 $0 $0
2007 $0 $0 $0 $0
Post 2007 $0 $0 $0 $0
Unspecified Vintage $0 $0 $0 $0
<B Total $0 $0 $0 $0 $0 $0 $0 $0 $0 $0 $0 $0 $0 $0 $0 $0 $0 $0 $0 $0 $0 $0 $0
Pre 2006 $0 $0 $0 $0
2006 $0 $0 $0 $0
2007 $0 $0 $0 $0
Post 2007 $0 $0 $0 $0
Unspecified Vintage $0 $0 $0 $0
NR Total $0 $0 $0 $0 $0 $0 $0 $0 $0 $0 $0 $0 $0 $0 $0 $0 $0 $0 $0 $0 $0 $0 $0
Pre 2006 $0 $0 $0 $0
2006 $0 $0 $0 $0
2007 $0 $0 $0 $0
Post 2007 $0 $0 $0 $0
Unspecified Vintage $0 $0 $0 $0
Total $0 $0 $0 $0 $0 $0 $0 $0 $0 $0 $0 $0 $0 $0 $0 $0 $0 $0 $0 $0 $0 $0 $0
Profit/Loss ($MM)
AAA Total $0 $0 $0 $0 $0 $0 $0 $0 $0 $0 $0 $0 $0 $0 $0 $0 $0 $0 $0 $0 $0 $0 $0
Pre 2006 $0 $0 $0 $0
2006 $0 $0 $0 $0
2007 $0 $0 $0 $0
Post 2007 $0 $0 $0 $0
Unspecified Vintage $0 $0 $0 $0
AA Total $0 $0 $0 $0 $0 $0 $0 $0 $0 $0 $0 $0 $0 $0 $0 $0 $0 $0 $0 $0 $0 $0 $0
Pre 2006 $0 $0 $0 $0
2006 $0 $0 $0 $0
2007 $0 $0 $0 $0
Post 2007 $0 $0 $0 $0
Unspecified Vintage $0 $0 $0 $0
A Total $0 $0 $0 $0 $0 $0 $0 $0 $0 $0 $0 $0 $0 $0 $0 $0 $0 $0 $0 $0 $0 $0 $0
Pre 2006 $0 $0 $0 $0
2006 $0 $0 $0 $0
2007 $0 $0 $0 $0
Post 2007 $0 $0 $0 $0
Unspecified Vintage $0 $0 $0 $0
BBB Total $0 $0 $0 $0 $0 $0 $0 $0 $0 $0 $0 $0 $0 $0 $0 $0 $0 $0 $0 $0 $0 $0 $0
Pre 2006 $0 $0 $0 $0
2006 $0 $0 $0 $0
2007 $0 $0 $0 $0
Post 2007 $0 $0 $0 $0
Unspecified Vintage $0 $0 $0 $0
BB Total $0 $0 $0 $0 $0 $0 $0 $0 $0 $0 $0 $0 $0 $0 $0 $0 $0 $0 $0 $0 $0 $0 $0
Pre 2006 $0 $0 $0 $0
2006 $0 $0 $0 $0
2007 $0 $0 $0 $0
Post 2007 $0 $0 $0 $0
Unspecified Vintage $0 $0 $0 $0
B Total $0 $0 $0 $0 $0 $0 $0 $0 $0 $0 $0 $0 $0 $0 $0 $0 $0 $0 $0 $0 $0 $0 $0
Pre 2006 $0 $0 $0 $0
2006 $0 $0 $0 $0
2007 $0 $0 $0 $0
Post 2007 $0 $0 $0 $0
Unspecified Vintage $0 $0 $0 $0
<B Total $0 $0 $0 $0 $0 $0 $0 $0 $0 $0 $0 $0 $0 $0 $0 $0 $0 $0 $0 $0 $0 $0 $0
Pre 2006 $0 $0 $0 $0
2006 $0 $0 $0 $0
2007 $0 $0 $0 $0
Post 2007 $0 $0 $0 $0
Unspecified Vintage $0 $0 $0 $0
NR Total $0 $0 $0 $0 $0 $0 $0 $0 $0 $0 $0 $0 $0 $0 $0 $0 $0 $0 $0 $0 $0 $0 $0
Pre 2006 $0 $0 $0 $0
2006 $0 $0 $0 $0
2007 $0 $0 $0 $0
Post 2007 $0 $0 $0 $0
Unspecified Vintage $0 $0 $0 $0
Total $0 $0 $0 $0 $0 $0 $0 $0 $0 $0 $0 $0 $0 $0 $0 $0 $0 $0 $0 $0 $0 $0 $0
WarehouseABS CMBS Corporate CDO / CLO
Grand
Total
Enterprise Dodd-Frank Stress Test Template
(Disclosure to FHFA ONLY)
Page 46
46 | P a g e
Trading and Other Fair Value Assets
Munis (ADVERSE)
Bonds
AAA
AA
A
BBB
BB
B
<B
NR
Bonds Total $0 $0 $0 $0
1M
3M
6M
9M
1Y
2Y
3Y
5Y
7Y
10Y
15Y
20Y
30Y
Bonds Total $0 $0 $0 $0
Loans
AAA
AA
A
BBB
BB
B
<B
NR
Loans Total $0 $0 $0 $0
1M
3M
6M
9M
1Y
2Y
3Y
5Y
7Y
10Y
15Y
20Y
30Y
Loans Total $0 $0 $0 $0
CDS
AAA
AA
A
BBB
BB
B
<B
NR
CDS Total $0 $0 $0 $0
1M
3M
6M
9M
1Y
2Y
3Y
5Y
7Y
10Y
15Y
20Y
30Y
CDS Total $0 $0 $0 $0
MV ($MM)
Available-for-Sale
Securities
MV ($MM)
Trading
Securities
Profit/Loss
from OAS
Widening
(AFS)
Profit/Loss
from OAS
Widening
(Trading Secs)
Enterprise Dodd-Frank Stress Test Template
(Disclosure to FHFA ONLY)
Page 47
47 | P a g e
Trading and Other Fair Value Assets
Munis (ADVERSE)
Indices
AAA
AA
A
BBB
BB
B
<B
NR
Indices Total $0 $0 $0 $0
1M
3M
6M
9M
1Y
2Y
3Y
5Y
7Y
10Y
15Y
20Y
30Y
Indices Total $0 $0 $0 $0
Other / Unspecified Munis
AAA
AA
A
BBB
BB
B
<B
NR
Other / Unspecified Munis Total $0 $0 $0 $0
1M
3M
6M
9M
1Y
2Y
3Y
5Y
7Y
10Y
15Y
20Y
30Y
Other / Unspecified Munis Total $0 $0 $0 $0
Grand Total
AAA $0 $0 $0 $0
AA $0 $0 $0 $0
A $0 $0 $0 $0
BBB $0 $0 $0 $0
BB $0 $0 $0 $0
B $0 $0 $0 $0
<B $0 $0 $0 $0
NR $0 $0 $0 $0
Grand Total $0 $0 $0 $0
1M $0 $0 $0 $0
3M $0 $0 $0 $0
6M $0 $0 $0 $0
9M $0 $0 $0 $0
1Y $0 $0 $0 $0
2Y $0 $0 $0 $0
3Y $0 $0 $0 $0
5Y $0 $0 $0 $0
7Y $0 $0 $0 $0
10Y $0 $0 $0 $0
15Y $0 $0 $0 $0
20Y $0 $0 $0 $0
30Y $0 $0 $0 $0
Grand Total $0 $0 $0 $0
MV ($MM)
Available-for-Sale
Securities
MV ($MM)
Trading
Securities
Profit/Loss
from OAS
Widening
(AFS)
Profit/Loss
from OAS
Widening
(Trading Secs)
Enterprise Dodd-Frank Stress Test Template
(Disclosure to FHFA ONLY)
Page 48
48 | P a g e
Trading & Other Fair Value Assets Template
Agencies (ADVERSE)
US Residential Agency Products
IOs
POs
Other CMOs
Pass-Throughs
Agency Debt/Debentures
IOS Index
POS Index
MBX Index
Other Agency Derivatives
TBA's
Reverse Mortgages
Residential Other / Unspecified
Total $0 $0 $0 $0
US Commercial Agency Products
Cash Agency CMBS
Agency CMBS Derivatives
Commercial Other / Unspecified
Total $0 $0 $0 $0
Non-US Agency Products
AAA
AA
A
BBB
BB
B
<B
NR
Total $0 $0 $0 $0
MV ($MM)
Available-for-Sale
Securities
Profit/Loss
from OAS
Widening
(Trading Secs)
MV ($MM)
Trading
Securities
Profit/Loss
from OAS
Widening
(AFS)
Enterprise Dodd-Frank Stress Test Template
(Disclosure to FHFA ONLY)
Page 49
49 | P a g e
($s in millions)
Most
Recent
Quarter Q1 Q2 Q3 Q4 Q5 Q6 Q7 Q8 Q9
Nine
Quarter
Cumulative
Total
1 Net interest income1
2 Management and guaranty fee income
3 Other non-interest income
4 Total revenue
5 REO (foreclosed property exp.)
6 Security impairments
7 Other expenses2
8 Pre-provision net revenue
9 (Provision) benefit for credit losses
10 Derivatives gains (losses)
11 Gains (losses) on loans
12 Other fair value gains (losses)
13 Global market shock impact on trading securities and held-for-sale loans
14 Pre-Tax income (loss)
15 Provision (benefit) for federal income taxes
16 Extraordinary gains (losses), net of tax effect
17 Net income (loss)
18 Global market shock impact on available-for-sale securities
19 Other comprehensive income
20 Comprehensive income (loss)
1 Includes net interest income on multifamily whole loans, GSE multifamily MBS held in the retained portfolio, CMBS, and multifamily MRBs.
2 Includes operational risk losses, administrative expenses, and gains from partnership investments.
Enterprise Dodd-Frank Stress Test Template
(Disclosure to FHFA ONLY)
Multifamily - Income Statement (ADVERSE)
Page 50
50 | P a g e
Most
Recent
Quarter Q1 Q2 Q3 Q4 Q5 Q6 Q7 Q8 Q9
Nine
Quarter
Cumulative
Total
($s in millions)
CAS/STACR
1 Interest Expense
2 Fair Value Gain (Loss)
3 Other Expenses
4 Recoveries
CIRT/ACIS Premiums
5 Premium Expense
6 Other Expenses
7 Recoveries
8 Total Income (Loss)
9 CAS/STACR Debt Issuances
10 CIRT/ACIS Transactions
11 Reference Pool (Quarter)
12 Outstanding Reference Pool
Credit Risk Transfers - Quarterly (ADVERSE)
Enterprise Dodd-Frank Stress Test Template
(Disclosure to FHFA ONLY)
Page 51
51 | P a g e
($s in millions)
Most
Recent
Quarter Q1 Q2 Q3 Q4 Q5 Q6 Q7 Q8 Q9
Nine
Quarter
Cumulative
Total
1 Net interest income (excluding management and guaranty fee income)
2 Management and guaranty fee income1
3 Total net interest income
4 Other income
5 Total revenue
6 REO (foreclosed property expense)
7 SOP 03-3 losses, net
8 Security impairments
9 Operational risk losses
10 Administrative expenses
11 Other expenses
12 Pre-provision net revenue
13 (Provision) benefit for credit losses
14 Derivatives gains (losses)
15 Trading gains (losses)
16 Other gains (losses)
17 Global market shock impact on trading securities and held-for-sale loans
18 Counterparty default losses
19 Pre-Tax income (loss)
20 (Provision) benefit for federal income taxes
21 Extraordinary gains (losses), net of tax effect
22 Net income (loss)
23 Global market shock impact on available-for-sale securities
24 Other comprehensive income
25 Comprehensive income (loss)
1 Includes guaranty fees received for managing credit risk on mortgage loans of consolidated trusts/PCs.
Income Statement (SEVERELY ADVERSE)(without establishing DTA)
Enterprise Dodd-Frank Stress Test Template
(Disclosure to FHFA ONLY)
Page 52
52 | P a g e
($s in millions)
Most
Recent
Quarter Q1 Q2 Q3 Q4 Q5 Q6 Q7 Q8 Q9
Nine
Quarter
Cumulative
Total
1 Net interest income (excluding management and guaranty fee income)
2 Management and guaranty fee income1
3 Total net interest income
4 Other income
5 Total revenue
6 REO (foreclosed property exp.)
7 SOP 03-3 losses, net
8 Security impairments
9 Operational risk losses
10 Administrative expenses
11 Other expenses
12 Pre-provision net revenue
13 (Provision) benefit for credit losses
14 Derivatives gains (losses)
15 Trading gains (losses)
16 Other gains (losses)
17 Global market shock impact on trading securities and held-for-sale loans
18 Counterparty default losses
19 Pre-Tax income (loss)
20 (Provision) benefit for federal income taxes
21 Extraordinary gains (losses), net of tax effect
22 Net income (loss)
23 Global market shock impact on available-for-sale securities
24 Other comprehensive income
25 Comprehensive income (loss)
1 Includes guaranty fees received for managing credit risk on mortgage loans of consolidated trusts/PCs.
Income Statement (SEVERELY ADVERSE)(with establishing DTA)
Enterprise Dodd-Frank Stress Test Template
(Disclosure to FHFA ONLY)
Page 53
53 | P a g e
($s in millions)
Most
Recent
Quarter Q1 Q2 Q3 Q4 Q5 Q6 Q7 Q8 Q9
Nine
Quarter
Cumulative
Total
CAPITAL1 Beginning capital
2 Senior preferred Treasury draw (prior period)
3 Net income (loss)
4 Less: Dividends
5 Other capital actions
6 Change in AOCI
7 Change in non-controlling/minority interest
8 Other
9 Ending capital (deficit)
10 Beginning PSPA funding commitment available
11 Treasury draw required
12 Remaining PSPA funding commitment available
OTHER13 Deferred tax assets, net of allowance
14 Total Assets
Capital Roll Forward (SEVERELY ADVERSE)(without establishing DTA)
Enterprise Dodd-Frank Stress Test Template
(Disclosure to FHFA ONLY)
Page 54
54 | P a g e
($s in millions)
Most
Recent
Quarter Q1 Q2 Q3 Q4 Q5 Q6 Q7 Q8 Q9
Nine
Quarter
Cumulative
Total
CAPITAL1 Beginning capital
2 Senior preferred Treasury draw (prior period)
3 Net income (loss)
4 Less: Dividends
5 Other capital actions
6 Change in AOCI
7 Change in non-controlling/minority interest
8 Other
9 Ending capital (deficit)
10 Beginning PSPA funding commitment available
11 Treasury draw required
12 Remaining PSPA funding commitment available
OTHER13 Deferred tax assets, net of allowance
14 Total Assets
Capital Roll Forward (SEVERELY ADVERSE)(with establishing DTA)
Enterprise Dodd-Frank Stress Test Template
(Disclosure to FHFA ONLY)
Page 55
55 | P a g e
($s in millions)
Most
Recent
Quarter Q1 Q2 Q3 Q4 Q5 Q6 Q7 Q8 Q9
RETAINED PORTFOLIO
Agency securities
1 Single-family
2 Multifamily
Non-Agency securities
3 Private Label Securities (PLS)
4 Commercial Mortgage-backed Securities (CMBS)
5 Other1
Whole loans
6 Single-family
7 Multifamily
8 Total retained portfolio
9 Single-family guaranty book of business
1 Other includes mortgage revenue bonds and other
Enterprise Dodd-Frank Stress Test Template
(Disclosure to FHFA ONLY)
Portfolio Balances (SEVERELY ADVERSE)
Page 56
56 | P a g e
($s in millions)
Global Market Shock (SEVERELY ADVERSE)Applicable
UPB Q1 Loss
1
2
3
4 Single-Family Agency Securities
5 Multifamily Agency Securities
6 Municipal Securities
7 Single-Family Loans
8 Multifamily Loans
9 Counterparty Default Risk*
Enterprise Dodd-Frank Stress Test Template
(Disclosure to FHFA ONLY)
Private Label Securities (PLS) or Non-Agency Prices for Residential Mortgage-backed Securities (RMBS)
Counterparty Name Counterparty Type
Commercial Mortgage-backed Securities (CMBS)
Asset-based Securities (ABS) and other collateral
Total Potential Income Statement Impact
Repo
Other
Total
Derivatives
Single-Family Mortgage Insurance Provider
Multifamily Credit Enhancement Provider
* Please provide the name and attribution of counterparty default risk by type (eg: derivatives, repo, etc.) of the largest
counterparty below:
Page 57
57 | P a g e
($s in millions)
Global Market Shock (SEVERELY ADVERSE)Applicable
UPB Q1 Loss
TRADING SECURITIES
1
2
3
4 Single Family Agency Securities
5 Multifamily Agency Securities
6 Municipal Securities
7 Counterparty Default Risk
AVAILABLE-FOR-SALE SECURITIES (Post-Tax Amounts)
8
9
10
11 Single Family Agency Securities
12 Multifamily Agency Securities
13 Municipal Securities
HELD-FOR-SALE LOANS
14 Single Family Loans
15 Multifamily Loans
Commercial Mortgage-backed Securities (CMBS)
Asset-based Securities (ABS) and other collateral
Private Label Securities (PLS) or Non-Agency Prices for Residential Mortgage-backed Securities (RMBS)
Private Label Securities (PLS) or Non-Agency Prices for Residential Mortgage-backed Securities (RMBS)
Enterprise Dodd-Frank Stress Test Template
(Disclosure to FHFA ONLY)
Commercial Mortgage-backed Securities (CMBS)
Asset-based Securities (ABS) and other collateral
Page 58
58 | P a g e
Investment Securities and Fair Value Trading Assets
Securitized Products (Severely Adverse)
(*Credit ratings should be as of December 31, 2016)
Non-
Agency
Prime
Sub-
prime
Option
ARMS
Other
AltA
Unspec
Non-
Prime HELOC
RMBS
CDO
RMBS
CDS
Credit
Basket PrimeX
ABX /
TABX
Prime
Whole
Loans
Non-Prime
Whole
Loans
European
RMBS
Other /
Unspecified
RMBS
SubTotal
MV* ($MM)
AAA Total $0 $0 $0 $0 $0 $0 $0 $0 $0 $0 $0 $0 $0 $0 $0 $0 $0
Pre 2006 $0 $0
2006 $0 $0
2007 $0 $0
Post 2007 $0 $0
Unspecified Vintage $0 $0
AA Total $0 $0 $0 $0 $0 $0 $0 $0 $0 $0 $0 $0 $0 $0 $0 $0 $0
Pre 2006 $0 $0
2006 $0 $0
2007 $0 $0
Post 2007 $0 $0
Unspecified Vintage $0 $0
A Total $0 $0 $0 $0 $0 $0 $0 $0 $0 $0 $0 $0 $0 $0 $0 $0 $0
Pre 2006 $0 $0
2006 $0 $0
2007 $0 $0
Post 2007 $0 $0
Unspecified Vintage $0 $0
BBB Total $0 $0 $0 $0 $0 $0 $0 $0 $0 $0 $0 $0 $0 $0 $0 $0 $0
Pre 2006 $0 $0
2006 $0 $0
2007 $0 $0
Post 2007 $0 $0
Unspecified Vintage $0 $0
BB Total $0 $0 $0 $0 $0 $0 $0 $0 $0 $0 $0 $0 $0 $0 $0 $0 $0
Pre 2006 $0 $0
2006 $0 $0
2007 $0 $0
Post 2007 $0 $0
Unspecified Vintage $0 $0
B Total $0 $0 $0 $0 $0 $0 $0 $0 $0 $0 $0 $0 $0 $0 $0 $0 $0
Pre 2006 $0 $0
2006 $0 $0
2007 $0 $0
Post 2007 $0 $0
Unspecified Vintage $0 $0
<B Total $0 $0 $0 $0 $0 $0 $0 $0 $0 $0 $0 $0 $0 $0 $0 $0 $0
Pre 2006 $0 $0
2006 $0 $0
2007 $0 $0
Post 2007 $0 $0
Unspecified Vintage $0 $0
NR Total $0 $0 $0 $0 $0 $0 $0 $0 $0 $0 $0 $0 $0 $0 $0 $0 $0
Pre 2006 $0 $0
2006 $0 $0
2007 $0 $0
Post 2007 $0 $0
Unspecified Vintage $0 $0
Total $0 $0 $0 $0 $0 $0 $0 $0 $0 $0 $0 $0 $0 $0 $0 $0 $0
Profit/Loss ($MM)
AAA Total $0 $0 $0 $0 $0 $0 $0 $0 $0 $0 $0 $0 $0 $0 $0 $0 $0
Pre 2006 $0 $0
2006 $0 $0
2007 $0 $0
Post 2007 $0 $0
Unspecified Vintage $0 $0
AA Total $0 $0 $0 $0 $0 $0 $0 $0 $0 $0 $0 $0 $0 $0 $0 $0 $0
Pre 2006 $0 $0
2006 $0 $0
2007 $0 $0
Post 2007 $0 $0
Unspecified Vintage $0 $0
A Total $0 $0 $0 $0 $0 $0 $0 $0 $0 $0 $0 $0 $0 $0 $0 $0 $0
Pre 2006 $0 $0
2006 $0 $0
2007 $0 $0
Post 2007 $0 $0
Unspecified Vintage $0 $0
BBB Total $0 $0 $0 $0 $0 $0 $0 $0 $0 $0 $0 $0 $0 $0 $0 $0 $0
Pre 2006 $0 $0
2006 $0 $0
2007 $0 $0
Post 2007 $0 $0
Unspecified Vintage $0 $0
BB Total $0 $0 $0 $0 $0 $0 $0 $0 $0 $0 $0 $0 $0 $0 $0 $0 $0
Pre 2006 $0 $0
2006 $0 $0
2007 $0 $0
Post 2007 $0 $0
Unspecified Vintage $0 $0
B Total $0 $0 $0 $0 $0 $0 $0 $0 $0 $0 $0 $0 $0 $0 $0 $0 $0
Pre 2006 $0 $0
2006 $0 $0
2007 $0 $0
Post 2007 $0 $0
Unspecified Vintage $0 $0
<B Total $0 $0 $0 $0 $0 $0 $0 $0 $0 $0 $0 $0 $0 $0 $0 $0 $0
Pre 2006 $0 $0
2006 $0 $0
2007 $0 $0
Post 2007 $0 $0
Unspecified Vintage $0 $0
NR Total $0 $0 $0 $0 $0 $0 $0 $0 $0 $0 $0 $0 $0 $0 $0 $0 $0
Pre 2006 $0 $0
2006 $0 $0
2007 $0 $0
Post 2007 $0 $0
Unspecified Vintage $0 $0
Total $0 $0 $0 $0 $0 $0 $0 $0 $0 $0 $0 $0 $0 $0 $0 $0 $0
Enterprise Dodd-Frank Stress Test Template
(Disclosure to FHFA ONLY)
Grand
Total
RMBS
Page 59
59 | P a g e
Investment Securities and Fair Value Trading Assets
Securitized Products (Severely Adverse)
(*Credit ratings should be as of December 31, 2016)
Autos
Credit
Cards
Student
Loans
ABS
CDS
Credit
Basket
Index
Tranche
s
Other /
Unspecified
ABS
SubTotal
Cash Non-
Agency
CMBS
CMBS
CDS
CMBS
CDO
Credit
Basket
Index
Tranches
Whole
Loans
Other /
Unspecified
CMBS
SubTotal CLO
Other /
Unspecified
Corporate
CDO/CLO
SubTotal Total Size
Total
Protection
Other /
Unspecified
MV* ($MM)
AAA Total $0 $0 $0 $0 $0 $0 $0 $0 $0 $0 $0 $0 $0 $0 $0 $0 $0 $0 $0 $0 $0 $0 $0
Pre 2006 $0 $0 $0 $0
2006 $0 $0 $0 $0
2007 $0 $0 $0 $0
Post 2007 $0 $0 $0 $0
Unspecified Vintage $0 $0 $0 $0
AA Total $0 $0 $0 $0 $0 $0 $0 $0 $0 $0 $0 $0 $0 $0 $0 $0 $0 $0 $0 $0 $0 $0 $0
Pre 2006 $0 $0 $0 $0
2006 $0 $0 $0 $0
2007 $0 $0 $0 $0
Post 2007 $0 $0 $0 $0
Unspecified Vintage $0 $0 $0 $0
A Total $0 $0 $0 $0 $0 $0 $0 $0 $0 $0 $0 $0 $0 $0 $0 $0 $0 $0 $0 $0 $0 $0 $0
Pre 2006 $0 $0 $0 $0
2006 $0 $0 $0 $0
2007 $0 $0 $0 $0
Post 2007 $0 $0 $0 $0
Unspecified Vintage $0 $0 $0 $0
BBB Total $0 $0 $0 $0 $0 $0 $0 $0 $0 $0 $0 $0 $0 $0 $0 $0 $0 $0 $0 $0 $0 $0 $0
Pre 2006 $0 $0 $0 $0
2006 $0 $0 $0 $0
2007 $0 $0 $0 $0
Post 2007 $0 $0 $0 $0
Unspecified Vintage $0 $0 $0 $0
BB Total $0 $0 $0 $0 $0 $0 $0 $0 $0 $0 $0 $0 $0 $0 $0 $0 $0 $0 $0 $0 $0 $0 $0
Pre 2006 $0 $0 $0 $0
2006 $0 $0 $0 $0
2007 $0 $0 $0 $0
Post 2007 $0 $0 $0 $0
Unspecified Vintage $0 $0 $0 $0
B Total $0 $0 $0 $0 $0 $0 $0 $0 $0 $0 $0 $0 $0 $0 $0 $0 $0 $0 $0 $0 $0 $0 $0
Pre 2006 $0 $0 $0 $0
2006 $0 $0 $0 $0
2007 $0 $0 $0 $0
Post 2007 $0 $0 $0 $0
Unspecified Vintage $0 $0 $0 $0
<B Total $0 $0 $0 $0 $0 $0 $0 $0 $0 $0 $0 $0 $0 $0 $0 $0 $0 $0 $0 $0 $0 $0 $0
Pre 2006 $0 $0 $0 $0
2006 $0 $0 $0 $0
2007 $0 $0 $0 $0
Post 2007 $0 $0 $0 $0
Unspecified Vintage $0 $0 $0 $0
NR Total $0 $0 $0 $0 $0 $0 $0 $0 $0 $0 $0 $0 $0 $0 $0 $0 $0 $0 $0 $0 $0 $0 $0
Pre 2006 $0 $0 $0 $0
2006 $0 $0 $0 $0
2007 $0 $0 $0 $0
Post 2007 $0 $0 $0 $0
Unspecified Vintage $0 $0 $0 $0
Total $0 $0 $0 $0 $0 $0 $0 $0 $0 $0 $0 $0 $0 $0 $0 $0 $0 $0 $0 $0 $0 $0 $0
Profit/Loss ($MM)
AAA Total $0 $0 $0 $0 $0 $0 $0 $0 $0 $0 $0 $0 $0 $0 $0 $0 $0 $0 $0 $0 $0 $0 $0
Pre 2006 $0 $0 $0 $0
2006 $0 $0 $0 $0
2007 $0 $0 $0 $0
Post 2007 $0 $0 $0 $0
Unspecified Vintage $0 $0 $0 $0
AA Total $0 $0 $0 $0 $0 $0 $0 $0 $0 $0 $0 $0 $0 $0 $0 $0 $0 $0 $0 $0 $0 $0 $0
Pre 2006 $0 $0 $0 $0
2006 $0 $0 $0 $0
2007 $0 $0 $0 $0
Post 2007 $0 $0 $0 $0
Unspecified Vintage $0 $0 $0 $0
A Total $0 $0 $0 $0 $0 $0 $0 $0 $0 $0 $0 $0 $0 $0 $0 $0 $0 $0 $0 $0 $0 $0 $0
Pre 2006 $0 $0 $0 $0
2006 $0 $0 $0 $0
2007 $0 $0 $0 $0
Post 2007 $0 $0 $0 $0
Unspecified Vintage $0 $0 $0 $0
BBB Total $0 $0 $0 $0 $0 $0 $0 $0 $0 $0 $0 $0 $0 $0 $0 $0 $0 $0 $0 $0 $0 $0 $0
Pre 2006 $0 $0 $0 $0
2006 $0 $0 $0 $0
2007 $0 $0 $0 $0
Post 2007 $0 $0 $0 $0
Unspecified Vintage $0 $0 $0 $0
BB Total $0 $0 $0 $0 $0 $0 $0 $0 $0 $0 $0 $0 $0 $0 $0 $0 $0 $0 $0 $0 $0 $0 $0
Pre 2006 $0 $0 $0 $0
2006 $0 $0 $0 $0
2007 $0 $0 $0 $0
Post 2007 $0 $0 $0 $0
Unspecified Vintage $0 $0 $0 $0
B Total $0 $0 $0 $0 $0 $0 $0 $0 $0 $0 $0 $0 $0 $0 $0 $0 $0 $0 $0 $0 $0 $0 $0
Pre 2006 $0 $0 $0 $0
2006 $0 $0 $0 $0
2007 $0 $0 $0 $0
Post 2007 $0 $0 $0 $0
Unspecified Vintage $0 $0 $0 $0
<B Total $0 $0 $0 $0 $0 $0 $0 $0 $0 $0 $0 $0 $0 $0 $0 $0 $0 $0 $0 $0 $0 $0 $0
Pre 2006 $0 $0 $0 $0
2006 $0 $0 $0 $0
2007 $0 $0 $0 $0
Post 2007 $0 $0 $0 $0
Unspecified Vintage $0 $0 $0 $0
NR Total $0 $0 $0 $0 $0 $0 $0 $0 $0 $0 $0 $0 $0 $0 $0 $0 $0 $0 $0 $0 $0 $0 $0
Pre 2006 $0 $0 $0 $0
2006 $0 $0 $0 $0
2007 $0 $0 $0 $0
Post 2007 $0 $0 $0 $0
Unspecified Vintage $0 $0 $0 $0
Total $0 $0 $0 $0 $0 $0 $0 $0 $0 $0 $0 $0 $0 $0 $0 $0 $0 $0 $0 $0 $0 $0 $0
WarehouseABS CMBS Corporate CDO / CLO
Grand
Total
Enterprise Dodd-Frank Stress Test Template
(Disclosure to FHFA ONLY)
Page 60
60 | P a g e
Trading and Other Fair Value Assets
Munis (Severely Adverse)
Bonds
AAA
AA
A
BBB
BB
B
<B
NR
Bonds Total $0 $0 $0 $0
1M
3M
6M
9M
1Y
2Y
3Y
5Y
7Y
10Y
15Y
20Y
30Y
Bonds Total $0 $0 $0 $0
Loans
AAA
AA
A
BBB
BB
B
<B
NR
Loans Total $0 $0 $0 $0
1M
3M
6M
9M
1Y
2Y
3Y
5Y
7Y
10Y
15Y
20Y
30Y
Loans Total $0 $0 $0 $0
CDS
AAA
AA
A
BBB
BB
B
<B
NR
CDS Total $0 $0 $0 $0
1M
3M
6M
9M
1Y
2Y
3Y
5Y
7Y
10Y
15Y
20Y
30Y
CDS Total $0 $0 $0 $0
MV ($MM)
Available-for-Sale
Securities
MV ($MM)
Trading
Securities
Profit/Loss
from OAS
Widening
(AFS)
Profit/Loss
from OAS
Widening
(Trading Secs)
Enterprise Dodd-Frank Stress Test Template
(Disclosure to FHFA ONLY)
Page 61
61 | P a g e
Trading and Other Fair Value Assets
Munis (Severely Adverse)
Indices
AAA
AA
A
BBB
BB
B
<B
NR
Indices Total $0 $0 $0 $0
1M
3M
6M
9M
1Y
2Y
3Y
5Y
7Y
10Y
15Y
20Y
30Y
Indices Total $0 $0 $0 $0
Other / Unspecified Munis
AAA
AA
A
BBB
BB
B
<B
NR
Other / Unspecified Munis Total $0 $0 $0 $0
1M
3M
6M
9M
1Y
2Y
3Y
5Y
7Y
10Y
15Y
20Y
30Y
Other / Unspecified Munis Total $0 $0 $0 $0
Grand Total
AAA $0 $0 $0 $0
AA $0 $0 $0 $0
A $0 $0 $0 $0
BBB $0 $0 $0 $0
BB $0 $0 $0 $0
B $0 $0 $0 $0
<B $0 $0 $0 $0
NR $0 $0 $0 $0
Grand Total $0 $0 $0 $0
1M $0 $0 $0 $0
3M $0 $0 $0 $0
6M $0 $0 $0 $0
9M $0 $0 $0 $0
1Y $0 $0 $0 $0
2Y $0 $0 $0 $0
3Y $0 $0 $0 $0
5Y $0 $0 $0 $0
7Y $0 $0 $0 $0
10Y $0 $0 $0 $0
15Y $0 $0 $0 $0
20Y $0 $0 $0 $0
30Y $0 $0 $0 $0
Grand Total $0 $0 $0 $0
MV ($MM)
Available-for-Sale
Securities
MV ($MM)
Trading
Securities
Profit/Loss
from OAS
Widening
(AFS)
Profit/Loss
from OAS
Widening
(Trading Secs)
Enterprise Dodd-Frank Stress Test Template
(Disclosure to FHFA ONLY)
Page 62
62 | P a g e
Trading & Other Fair Value Assets Template
Agencies (Severely Adverse)
US Residential Agency Products
IOs
POs
Other CMOs
Pass-Throughs
Agency Debt/Debentures
IOS Index
POS Index
MBX Index
Other Agency Derivatives
TBA's
Reverse Mortgages
Residential Other / Unspecified
Total $0 $0 $0 $0
US Commercial Agency Products
Cash Agency CMBS
Agency CMBS Derivatives
Commercial Other / Unspecified
Total $0 $0 $0 $0
Non-US Agency Products
AAA
AA
A
BBB
BB
B
<B
NR
Total $0 $0 $0 $0
MV ($MM)
Available-for-Sale
Securities
Profit/Loss
from OAS
Widening
(Trading Secs)
MV ($MM)
Trading
Securities
Profit/Loss
from OAS
Widening
(AFS)
Enterprise Dodd-Frank Stress Test Template
(Disclosure to FHFA ONLY)
Page 63
63 | P a g e
Most
Recent
Quarter Q1 Q2 Q3 Q4 Q5 Q6 Q7 Q8 Q9
Nine
Quarter
Cumulative
Total
TOTAL PORTFOLIO
CREDIT EXPENSES ($s in millions)
1 Foreclosed property expense (REO)
2 Net charge-offs
3 Credit losses
4 Provision for credit losses
5 Credit Expenses
LOAN LOSS RESERVE ($s in millions)
6 Beginning loan loss reserve
7 Net charge-offs
8 Provison (benefit) for loan losses
9 Other
10 Ending Total Loan Loss Reserve
11 Unpaid Principal Balance ($s in millions)
1 Amount depicts the summation of foreclosed property expense and provision for credit losses.
Credit Overview - Quarterly (SEVERELY ADVERSE)(includes single-family and multifamily)
Enterprise Dodd-Frank Stress Test Template
(Disclosure to FHFA ONLY)
1
Page 64
64 | P a g e
($s in millions)
Most
Recent
Quarter Q1 Q2 Q3 Q4 Q5 Q6 Q7 Q8 Q9
Nine
Quarter
Cumulative
Total
1 Net interest income1
2 Management and guaranty fee income
3 Other non-interest income
4 Total revenue
5 REO (foreclosed property exp.)
6 Security impairments
7 Other expenses2
8 Pre-provision net revenue
9 (Provision) benefit for credit losses
10 Derivatives gains (losses)
11 Gains (losses) on loans
12 Other fair value gains (losses)
13 Global market shock impact on trading securities and held-for-sale loans
14 Pre-Tax income (loss)
15 Provision (benefit) for federal income taxes
16 Extraordinary gains (losses), net of tax effect
17 Net income (loss)
18 Global market shock impact on available-for-sale securities
19 Other comprehensive income
20 Comprehensive income (loss)
1 Includes net interest income on multifamily whole loans, GSE multifamily MBS held in the retained portfolio, CMBS, and multifamily MRBs.
2 Includes operational risk losses, administrative expenses, and gains from partnership investments.
Enterprise Dodd-Frank Stress Test Template
(Disclosure to FHFA ONLY)
Multifamily - Income Statement (SEVERELY ADVERSE)
Page 65
65 | P a g e
Most
Recent
Quarter Q1 Q2 Q3 Q4 Q5 Q6 Q7 Q8 Q9
Nine
Quarter
Cumulative
Total
TOTAL PORTFOLIO
CREDIT EXPENSES ($s in millions)
1 Foreclosed property expense (REO)
2 Net charge-offs
3 Credit losses
4 Provision for credit losses
5 Credit Expenses
LOAN LOSS RESERVE ($s in millions)
6 Beginning loan loss reserve
7 Net charge-offs
8 Provison (benefit) for loan losses
9 Other
10 Ending Total Loan Loss Reserve
11 Unpaid Principal Balance ($s in millions)
1 Amount depicts the summation of foreclosed property expense and provision for credit losses.
Multifamily Credit Overview - Quarterly (SEVERELY ADVERSE)
Enterprise Dodd-Frank Stress Test Template
(Disclosure to FHFA ONLY)
1
Page 66
66 | P a g e
Most
Recent
Quarter Q1 Q2 Q3 Q4 Q5 Q6 Q7 Q8 Q9
Nine
Quarter
Cumulative
Total
($s in millions)
1 Total multifamily market volume (industry)
2 Enterprise market share percentage
3 New acquisition volume
4 Liquidation volume1
5 Securitization volume
6 Effective guaranty fee rate2 (bps)
7 Guaranty portfolio balance
8 Loans and securities held in portfolio
1 Includes property sales and other run-off/prepayments.
2 Guaranty fee income divided by weighted average portfolio balance.
Multifamily Key Metrics (SEVERELY ADVERSE)
Enterprise Dodd-Frank Stress Test Template
(Disclosure to FHFA ONLY)
Page 67
67 | P a g e
Most
Recent
Quarter Q1 Q2 Q3 Q4 Q5 Q6 Q7 Q8 Q9
Nine
Quarter
Cumulative
Total
TOTAL PORTFOLIO
CREDIT EXPENSES ($s in millions)
1 Foreclosed property expense (REO)
2 Net charge-offs
3 Credit losses
4 Provision for credit losses
5 Credit Expenses
LOAN LOSS RESERVE ($s in millions)
6 Beginning loan loss reserve
7 Net charge-offs
8 Provison (benefit) for loan losses/guaranty losses
9 Other
10 Ending Total Loan Loss Reserve
Memo:
11 FAS 5 Loan Loss Reserve
12 FAS 114 Loan Loss Reserve
13 Concessions in FAS 114 Loan Loss Reserve
14 Unpaid Principal Balance ($s in millions)
CURRENT BOOK (as of 12/31/16)
CREDIT EXPENSES ($s in millions)
15 Foreclosed property expense (REO)
16 Net charge-offs
17 Credit losses
18 Provision for credit losses
19 Credit Expenses
LOAN LOSS RESERVE ($s in millions)
20 Beginning loan loss reserve
21 Net charge-offs
22 Provison (benefit) for loan losses/guaranty losses
23 Other
24 Ending Loan Loss Reserve - Current Book
25 Unpaid Principal Balance ($s in millions)
NEW BUSINESS
CREDIT EXPENSES ($s in millions)
26 Foreclosed property expense (REO)
27 Net charge-offs
28 Credit losses
29 Provision for credit losses
30 Credit Expenses
LOAN LOSS RESERVE ($s in millions)
31 Beginning loan loss reserve
32 Net charge-offs
33 Provison (benefit) for loan losses/guaranty losses
34 Other
35 Ending Loan Loss Reserve - New Business
36 Unpaid Principal Balance ($s in millions)
1 Amount depicts the summation of foreclosed property expense, provision for credit losses, and SOP 03-3 losses.
2 Amount includes the impact of all troubled debt restructuring (TDR) related impairments.
Single-Family Credit Overview - Quarterly (SEVERELY ADVERSE)
Enterprise Dodd-Frank Stress Test Template
(Disclosure to FHFA ONLY)
2
1
1
1
Page 68
68 | P a g e
Most
Recent
Quarter Q1 Q2 Q3 Q4 Q5 Q6 Q7 Q8 Q9
SERIOUSLY DELINQUENT LOAN ACTIVITY (count in '000s)
1 Beginning seriously delinquent loans
2 Seriously delinquent inflows - new SDQ
3 Seriously delinquent inflows - cured
4 Seriously delinquent cured by modification
5 Seriously delinquent - cured
6 Seriously delinquent to default
7 Seriously delinquent to payoff
8 Ending Seriously Delinquent Loans
9 Ending seriously delinquent rate (%)
10 Aggregate UPB of seriously delinquent loans ($s in millions)
11 Loan modifications (count in 000s)
PAYMENTS FROM PRIVATE MORTGAGE INSURERS (after haircut) ($s in millions)
12 Mortgage Guaranty Insurance Corporation
13 Triad Guaranty Insurance Corporation
14 Radian Guaranty Inc.
15 United Guaranty Residential Insurance Co.
16 Genworth Mortgage Insurance Corporation
17 PMI Mortgage Insurance Co.
18 Republic Mortgage Insurance Company
19 Essent Guaranty, Inc.
20 Arch Mortgage Insurance Company
21 Other
NOTE: Seriously delinquent loans are 90 days or more delinquent, or in the process of foreclosure.
Single-Family Credit Overview - Quarterly (SEVERELY ADVERSE)
Enterprise Dodd-Frank Stress Test Template
(Disclosure to FHFA ONLY)
Page 69
69 | P a g e
Single-Family Credit Summary (SEVERELY ADVERSE)
Delinquency Status - CURRENT BOOK
($s in millions)
Most
Recent
Quarter Q1 Q2 Q3 Q4 Q5 Q6 Q7 Q8 Q9
MODIFIED LOANS
1 Current
2 Less than 90 days delinquent
3
4 Total
NON-MODIFIED LOANS
5 Current
6 Less than 90 days delinquent
7
8 Total
($s in millions)
Most
Recent
Quarter Q1 Q2 Q3 Q4 Q5 Q6 Q7 Q8 Q9
MODIFIED LOANS
9 Current
10 Less than 90 days delinquent
11
12 Total
NON-MODIFIED LOANS
13 Current
14 Less than 90 days delinquent
15
16 Total
($s in millions)
Most
Recent
Quarter Q1 Q2 Q3 Q4 Q5 Q6 Q7 Q8 Q9
Nine
Quarter
Cumulative
Total
9 Modified
10 Non-Modified
End of Quarter Projected Charge-Offs (Undiscounted $s)
Loan Status
Seriously delinquent (90 days or more delinquent or in the process of foreclosure)
Seriously delinquent (90 days or more delinquent or in the process of foreclosure)
Loan Loss Reserve
Loan Status
Enterprise Dodd-Frank Stress Test Template
(Disclosure to FHFA ONLY)
Seriously delinquent (90 days or more delinquent or in the process of foreclosure)
End of Quarter Unpaid Principal Balance (UPB)
Loan Status
Seriously delinquent (90 days or more delinquent or in the process of foreclosure)
Page 70
70 | P a g e
Single-Family Credit Summary (SEVERELY ADVERSE)
Mark-to-Market Loan-to-Value - CURRENT BOOK
($s in millions)
Most
Recent
Quarter Q1 Q2 Q3 Q4 Q5 Q6 Q7 Q8 Q9
1 <=80%
2 >80% - 100%
3 >100%
4 Total
($s in millions)
Most
Recent
Quarter Q1 Q2 Q3 Q4 Q5 Q6 Q7 Q8 Q9
5 <=80%
6 >80% - 100%
7 >100%
8 Total
($s in millions)
Most
Recent
Quarter Q1 Q2 Q3 Q4 Q5 Q6 Q7 Q8 Q9
Nine
Quarter
Cumulative
Total
9 <=80%
10 >80% - 100%
11 >100%
Enterprise Dodd-Frank Stress Test Template
(Disclosure to FHFA ONLY)
End of Quarter Projected Charge-Offs (Undiscounted $s)
Loan Status
Loan Status
End of Quarter Unpaid Principal Balance (UPB)
Loan Status
Loan Loss Reserve
Page 71
71 | P a g e
Single-Family Credit Summary (SEVERELY ADVERSE)
Vintage Status - CURRENT BOOK
($s in millions)
Loan Status
Most
Recent
Quarter Q1 Q2 Q3 Q4 Q5 Q6 Q7 Q8 Q9
1 2004 and prior
2 2005
3 2006
4 2007
5 2008
6 2009
7 2010
8 2011
9 2012
10 2013
11 2014
12 2015
13 2016
($s in millions)
Loan Status
Most
Recent
Quarter Q1 Q2 Q3 Q4 Q5 Q6 Q7 Q8 Q9
14 2004 and prior
15 2005
16 2006
17 2007
18 2008
19 2009
20 2010
21 2011
22 2012
23 2013
24 2014
25 2015
26 2016
($s in millions)
Loan Status
Most
Recent
Quarter Q1 Q2 Q3 Q4 Q5 Q6 Q7 Q8 Q9
Nine
Quarter
Cumulative
Total
27 2004 and prior
28 2005
29 2006
30 2007
31 2008
32 2009
33 2010
34 2011
35 2012
36 2013
37 2014
38 2015
39 2016
Enterprise Dodd-Frank Stress Test Template
(Disclosure to FHFA ONLY)
End of Quarter Projected Charge-Offs (Undiscounted $s)
End of Quarter Unpaid Principal Balance (UPB)
Loan Loss Reserve
Page 72
72 | P a g e
($s in millions)
Single-Family - 9 Quarter Cumulative Credit Losses (SEVERELY ADVERSE)
<30 30 - 60 61 -70 71 - 75 76 - 80 81 - 85 86 - 90 91 - 95 96 - 100 101 - 110 111 - 120 >120
<620
620 - 640
641 - 660
661 - 680
681 - 700
701 - 720
721 -740
741 - 760
761 - 780
>780
Credit losses represent the summation of net charge-offs and foreclosed property expenses (REO).
Use LTV and credit score as of December 31, 2016.
Loan-To-Value
Cre
dit
Sc
ore
Enterprise Dodd-Frank Stress Test Template
(Disclosure to FHFA ONLY)
Page 73
73 | P a g e
($s in millions)
Single-Family - Loan Loss Reserves (SEVERELY ADVERSE)
Loan Loss Reserves as of 12/31/16
<30 30 - 60 61 -70 71 - 75 76 - 80 81 - 85 86 - 90 91 - 95 96 - 100 101 - 110 111 - 120 >120
<620
620 - 640
641 - 660
661 - 680
681 - 700
701 - 720
721 -740
741 - 760
761 - 780
>780
Use LTV and credit score as of December 31, 2016
Loan Loss Reserves at 3/31/19 (end of nine quarters)
<30 30 - 60 61 -70 71 - 75 76 - 80 81 - 85 86 - 90 91 - 95 96 - 100 101 - 110 111 - 120 >120
<620
620 - 640
641 - 660
661 - 680
681 - 700
701 - 720
721 -740
741 - 760
761 - 780
>780
Use LTV and credit score as of December 31, 2016
Cre
dit
Sc
ore
Enterprise Dodd-Frank Stress Test Template
(Disclosure to FHFA ONLY)
Loan-To-Value
Cre
dit
Sc
ore
Loan-To-Value
Page 74
74 | P a g e
Single-Family Credit Summary (SEVERELY ADVERSE)
Vintage and MTMLTV Status - CURRENT BOOK
($s in millions)
End of Quarter
(UPB)
End of Quarter
(UPB)
Most Recent
Quarter Inflows
Cumulative
Defaults1
Cumulative
Prepays2
Run-off3
Other4
Migrate to
<=80%
Migrate to 80% -
100%
Migrate to
>100% Q9
<=80%
80% - 100%
>100%
<=80%
80% - 100%
>100%
<=80%
80% - 100%
>100%
($s in millions)
Beginning
Cumulative
Charge-offs
Provision for
Credit Losses Other Ending
<=80%
80% - 100%
>100%
<=80%
80% - 100%
>100%
<=80%
80% - 100%
>100%
1 Amount depicts principal balance of loans that are in the process of foreclosure.
2 Amount depicts principal balance of loans that have prepaid through refinance.
3 Amount depicts reduction in principal balance due to amortization.
4 Amount includes NPL sales and other miscellaneous items.
2004 and prior
2005 - 2008
2009 and Later
Loan Status at 12/31/16
Cumulative Unpaid Principal Balance (UPB)
Enterprise Dodd-Frank Stress Test Template
(Disclosure to FHFA ONLY)
Loan Status at 12/31/16
2004 and prior
2005 - 2008
2009 and Later
Loan Loss Reserves
Page 75
75 | P a g e
Single-Family Credit Summary (SEVERELY ADVERSE)
Vintage and Delinquency Status - CURRENT BOOK
($s in millions)
End of Quarter
(UPB)
End of Quarter
(UPB)
Most Recent
Quarter Inflows
Cumulative
Defaults1
Cumulative
Prepays2
Run-off3
Other4
Migrate to
Modified Current
Migrate to
Modified
<90 Days
Migrate to
Modified
SDQ
Migrate to
Non-Modified
Current
Migrate to
Non-Modified
<90 Days
Migrate to
Non-Modified
SDQ Q9
Current
<90 Days
SDQ
Current
<90 Days
SDQ
Current
<90 Days
SDQ
Current
<90 Days
SDQ
Current
<90 Days
SDQ
Current
<90 Days
SDQ
($s in millions)
Beginning
Cumulative
Charge-offs
Provision
for
Credit Losses Other Ending
Current
<90 Days
SDQ
Current
<90 Days
SDQ
Current
<90 Days
SDQ
Current
<90 Days
SDQ
Current
<90 Days
SDQ
Current
<90 Days
SDQ
1 Amount depicts principal balance of loans that are in the process of foreclosure.
2 Amount depicts principal balance of loans that have prepaid through refinance.
3 Amount depicts reduction in principal balance due to amortization.
4 Amount includes NPL sales and other miscellaneous items.
Loan Status at 12/31/16
2009 and Later
Modified
Non-Modified
2004 and prior
Modified
Non-Modified
2005 - 2008
Modified
Non-Modified
Cumulative Unpaid Principal Balance (UPB)
Enterprise Dodd-Frank Stress Test Template
(Disclosure to FHFA ONLY)
2005 - 2008
Modified
Non-Modified
2009 and Later
Modified
Non-Modified
Loan Status at 12/31/16
2004 and prior
Modified
Non-Modified
Loan Loss Reserves
Page 76
76 | P a g e
Single-Family Credit Summary (SEVERELY ADVERSE)
MTMLTV and Delinquency Status - CURRENT BOOK
($s in millions)
End of Quarter
(UPB)
End of Quarter
(UPB)
Most Recent
Quarter Inflows
Cumulative
Defaults1
Cumulative
Prepays2
Run-off3
Other4
Migrate to
Modified Current
Migrate to
Modified
<90 Days
Migrate to
Modified
SDQ
Migrate to
Non-Modified
Current
Migrate to
Non-Modified
<90 Days
Migrate to
Non-Modified
SDQ Q9
Current
<90 Days
SDQ
Current
<90 Days
SDQ
Current
<90 Days
SDQ
Current
<90 Days
SDQ
Current
<90 Days
SDQ
Current
<90 Days
SDQ
($s in millions)
Beginning
Cumulative
Charge-offs
Provision
for
Credit Losses Other Ending
Current
<90 Days
SDQ
Current
<90 Days
SDQ
Current
<90 Days
SDQ
Current
<90 Days
SDQ
Current
<90 Days
SDQ
Current
<90 Days
SDQ
1 Amount depicts principal balance of loans that are in the process of foreclosure.
2 Amount depicts principal balance of loans that have prepaid through refinance.
3 Amount depicts reduction in principal balance due to amortization.
4 Amount includes NPL sales and other miscellaneous items.
Loan Loss Reserves
Non-Modified
Loan Status at 12/31/16
<=80%
Modified
80% - 100%
Modified
Non-Modified
>100%
Modified
Non-Modified
Cumulative Unpaid Principal Balance (UPB)
Enterprise Dodd-Frank Stress Test Template
(Disclosure to FHFA ONLY)
>100%
Modified
Non-Modified
Loan Status at 12/31/16
<=80%
Modified
Non-Modified
80% - 100%
Modified
Non-Modified
Page 77
77 | P a g e
Most
Recent
Quarter Q1 Q2 Q3 Q4 Q5 Q6 Q7 Q8 Q9
Nine
Quarter
Cumulative
Total
($s in millions)
CAS/STACR
1 Interest Expense
2 Fair Value Gain (Loss)
3 Other Expenses
4 Recoveries
CIRT/ACIS Premiums
5 Premium Expense
6 Other Expenses
7 Recoveries
8 Total Income (Loss)
9 CAS/STACR Debt Issuances
10 CIRT/ACIS Transactions
11 Reference Pool (Quarter)
12 Outstanding Reference Pool
Credit Risk Transfers - Quarterly (SEVERELY ADVERSE)
Enterprise Dodd-Frank Stress Test Template
(Disclosure to FHFA ONLY)
Page 78
78 | P a g e
($s in billions)
Results without
establishing valuation
allowance on deferred tax
assets
Impact of establishing
valuation allowance on
deferred tax assets
Results with
establishing valuation
allowance on deferred tax
assets
1 Pre-provision net revenue1
2 (Provision) benefit for credit losses
3 Mark-to-market gains (losses)2
4 Global market shock impact on trading securities
and counterparty3
5 Net income before taxes
6 (Provision) benefit for taxes
7 Other comprehensive income (loss)4
8 Total comprehensive income (loss)
9 Dividends paid
10 PSPA funding commitment as of December 31, 2016
11 Treasury draws required
12 Remaining PSPA funding commitment
13 Credit losses5
14 Credit losses (% of average portfolio balance)
1 Includes net interest income, security impairments, operational risk losses, foreclosed property income (expense), and other non-interest income/expenses.2 Includes fair value gains (losses) on derivative and trading securities, and other gains (losses) on investment securities.3 Includes global market shock impact on held-for-sale loans.4 Includes global market shock impact on available-for-sale securities.5 Credit losses are defined as charge-offs, net plus foreclosed property expenses.
Enterprise Dodd-Frank Stress Test Template - SEVERELY ADVERSE
(Disclosure to the Public)
Cumulative Projected Financial Metrics
(Q1 2017 - Q1 2019)
Page 79
79 | P a g e
Appendix 3: FHFA DFA Reporting Templates - FHLBanks
Stress Test Template Instructions
All numbers should be report in millions to two decimal places, except for capital ratios and credit enhancements in percentage.
Reported numbers should reflect the 12/31/2016 start date.
Page 80
80 | P a g e
Institution Name:
Date of Data Submission:
Institution Contact Name:
Institution Contact Phone Number:
Institution Contact Email Address:
Scenario Templates Cover Sheet
Each regulated entity is expected to provide input data for all the tabs in this spreadsheet .
Page 81
81 | P a g e
(Please indicate which scenarios were used in your model by checking the appropriate box:)
Domestic Variables International Variables
For variables not used, please provide a brief explanation below as to why it was not used:
Explanation
1
2
3
4
5
Supplied Scenario Variables
Variable Name
Real GDP Growth
Nominal GDP Growth
Real Disposable Income Growth
Unemployment Rate
Nominal Disposable Income Growth
CPI Inflation Rate
3-month Treasury Yield
5-year Treasury Yield
10-year Treasury Yield
BBB Corporate Yield
Mortgage Rate
Prime Rate
Dow Jones Total Stock Market Index
House Price Index
Commercial Real Estate Price Index
Market Volatility Index (VIX)
Private Label Securities (PLS) or Non-Agency Prices for Residential Mortgage-backed Securities (RMBS), Asset-based Securities (ABS), Commercial Mortgage-backed Securities (CMBS) and other collateral
Counterparty Default Risk
Agency Securities Option-Adjusted Spreads (OAS)
Municipal Securities
Euro Area Real GDP Growth
Euro Area Inflation
Euro Area Bilateral Dollar Exchange Rate ($/euro)
Developing Asia Real GDP Growth
Developing Asia Inflation
Developing Asia Bilateral Dollar Exchange Rate (F/UDS, indes, base = 2000,Q1)
Japan Real GDP Growth
Japan Bilateral Dollar Exchange Rate (yen/USD)
Japan Inflation
U.K. Real GDP Growth
U.K. Inflation
U.K. Bilaeral Dollar Exchange Rate (USD/pound)
Page 82
82 | P a g e
Variable
Number Variable Name Variable Definition
1
2
3
4
5
Variable
Number Variable Name Variable Definition
1
2
3
4
5
Variable
Number Variable Name Variable Definition
1
2
3
4
5
Baseline Scenario (additional variables used beyond those supplied)
Adverse Scenario (additional variables used beyond those supplied)
Severely Adverse Scenario (additional variables used beyond those supplied)
Scenario Variables Beyond Those Supplied
Page 83
83 | P a g e
Actual
Category Benchmark 4Q 2016 Q1 Q2 Q3 Q4 Q5 Q6 Q7 Q8 Q9
Example: Advance 3-Month LIBOR 10.0 10.0 10.0 10.0 15.0 15.0 15.0 15.0 15.0 15.0
Actual
Variable Name 4Q 2016 Q1 Q2 Q3 Q4 Q5 Q6 Q7 Q8 Q9
Actual
Maturity 4Q 2016 Q1 Q2 Q3 Q4 Q5 Q6 Q7 Q8 Q9
3-Month Treasury 0.4 0.6 0.7 0.9 1.1 1.3 1.5 1.7 1.9 2.2
6-Month
1 year
2 year
5 year Treasury 1.7 1.7 1.9 2.0 2.2 2.3 2.4 2.6 2.7 2.8
10 year Treasury 2.2 2.5 2.6 2.7 2.9 3.0 3.1 3.2 3.3 3.4
15 year
30 year
Actual
Region 4Q 2016 Jan-17 Feb-17 Mar-17 Apr-17 May-17 Jun-17 Jul-17 Aug-17 Sep-17 Oct-17
Region 1
Region 2
.
.
.
.
.
.
House Price Index(NOTE: For printing purposes dates only goes to Oct-17. However, the underlying excel spreadsheet collects 30 years of data.)
Projected
Baseline
Spread Assumptions
Projected
Forward Curve
Projected
Variables Used Beyond Those Supplied
Projected
Spread to Benchmark
Page 84
84 | P a g e
Actual
Category Benchmark 4Q 2016 Q1 Q2 Q3 Q4 Q5 Q6 Q7 Q8 Q9
Example: Advance 3-Month LIBOR 10.0 10.0 10.0 10.0 15.0 15.0 15.0 15.0 15.0 15.0
Actual
Variable Name 4Q 2016 Q1 Q2 Q3 Q4 Q5 Q6 Q7 Q8 Q9
Actual
Maturity 4Q 2016 Q1 Q2 Q3 Q4 Q5 Q6 Q7 Q8 Q9
3-Month Treasury 0.4 0.1 0.1 0.1 0.1 0.1 0.1 0.1 0.1 0.1
6-Month
1 year
2 year
5 year Treasury 1.7 1.7 1.8 1.8 1.9 1.9 1.9 2.0 2.0 2.0
10 year Treasury 2.2 2.3 2.4 2.5 2.5 2.6 2.7 2.7 2.7 2.7
15 year
30 year
Actual
Region 4Q 2016 Jan-17 Feb-17 Mar-17 Apr-17 May-17 Jun-17 Jul-17 Aug-17 Sep-17 Oct-17
Region 1
Region 2
.
.
.
.
.
.
House Price Index(NOTE: For printing purposes dates only goes to Oct-17. However, the underlying excel spreadsheet collects 30 years of data.)
Projected
Adverse
Spread to Benchmark
Forward Curve
Projected
Spread Assumptions
Projected
Variables Used Beyond Those Supplied
Projected
Page 85
85 | P a g e
Actual
Category Benchmark 4Q 2016 Q1 Q2 Q3 Q4 Q5 Q6 Q7 Q8 Q9
Example: Advance 3-Month LIBOR 10.0 10.0 10.0 10.0 15.0 15.0 15.0 15.0 15.0 15.0
Actual
Variable Name 4Q 2016 Q1 Q2 Q3 Q4 Q5 Q6 Q7 Q8 Q9
Actual
Maturity 4Q 2016 Q1 Q2 Q3 Q4 Q5 Q6 Q7 Q8 Q9
3-Month Treasury 0.4 0.1 0.1 0.1 0.1 0.1 0.1 0.1 0.1 0.1
6-Month
1 year
2 year
5 year Treasury 1.7 0.3 0.4 0.5 0.6 0.7 0.7 0.8 0.9 1.0
10 year Treasury 2.2 0.8 0.8 0.9 1.0 1.1 1.2 1.3 1.4 1.5
15 year
30 year
Actual
Region 4Q 2016 Jan-17 Feb-17 Mar-17 Apr-17 May-17 Jun-17 Jul-17 Aug-17 Sep-17 Oct-17
Region 1
Region 2
.
.
.
.
.
.
House Price Index(NOTE: For printing purposes dates only go to Oct-17. However, the underlying excel spreadsheet collects 30 years of data.)
Projected
Severely Adverse
Variables Used Beyond Those Supplied
Projected
Forward Curve
Projected
Spread Assumptions
Projected
Spread to Benchmark
Page 86
86 | P a g e
Most
Recent
Quarter Q1 Q2 Q3 Q4 Q5 Q6 Q7 Q8 Q9
Interest Income:
1 Advances
2 Whole loans held for portfolio
3 Investment Securities
4 Fed Funds
5 Other Interest Income
6 Total Interest Income
Interest Expense:
7 CO Bonds
8 Discount Notes
9 Member Deposits
10 Other Interest Expense
11 Total Interest Expense
12 Net interest income
13 Provision (reversal) for credit losses on mortgage loans
14 Net Interest Income after mortgage loan loss provision
15 Derivatives gains (losses)
16 Gains (losses) on securities
17 Total net gain (loss) on changes in fair value
18 Total OTTI credit charge
19 Other gains (losses)
20 Operating expenses
21 Other expenses
22 Income (loss) before assessments
23 Total assessments
24 Net Income (Loss)
FHLBank Dodd-Frank Stress Test Template
(Disclosure to FHFA ONLY)
Income Statement - Aggregate (BASE)
Page 87
72 1 P a g e
Most
Recent
Quarter Q1 Q2 Q3 Q4 Q5 Q6 Q7 Q8 Q9
Interest Income:
1 Advances
2 Whole loans held for portfolio
3 Investment Securities
4 Fed Funds
5 Other Interest Income
6 Total Interest Income
Interest Expense:
7 CO Bonds
8 Discount Notes
9 Member Deposits
10 Other Interest Expense
11 Total Interest Expense
12 Net interest income
13 Provision (reversal) for credit losses on mortgage loans
14 Net Interest Income after mortgage loan loss provision
15 Derivatives gains (losses)
16 Gains (losses) on securities
17 Total net gain (loss) on changes in fair value
18 Total OTTI credit charge
19 Other gains (losses)
20 Operating expenses
21 Other expenses
22 Income (loss) before assessments
23 Total assessments
24 Net Income (Loss)
FHLBank Dodd-Frank Stress Test Template
(Disclosure to FHFA ONLY)
Income Statement - Existing (BASE)
Page 88
88 | P a g e
Most
Recent
Quarter Q1 Q2 Q3 Q4 Q5 Q6 Q7 Q8 Q9
Interest Income:
1 Advances
2 Whole loans held for portfolio
3 Investment Securities
4 Fed Funds
5 Other Interest Income
6 Total Interest Income
Interest Expense:
7 CO Bonds
8 Discount Notes
9 Member Deposits
10 Other Interest Expense
11 Total Interest Expense
12 Net interest income
13 Provision (reversal) for credit losses on mortgage loans
14 Net Interest Income after mortgage loan loss provision
15 Derivatives gains (losses)
16 Gains (losses) on securities
17 Total net gain (loss) on changes in fair value
18 Total OTTI credit charge
19 Other gains (losses)
20 Operating expenses
21 Other expenses
22 Income (loss) before assessments
23 Total assessments
24 Net Income (Loss)
FHLBank Dodd-Frank Stress Test Template
(Disclosure to FHFA ONLY)
Income Statement - Replacement (BASE)
Page 89
89 | P a g e
Most
Recent
Quarter Q1 Q2 Q3 Q4 Q5 Q6 Q7 Q8 Q9
1 Advances
2 Investment Securities
3 Mortgage Loans
4 Allowance for loan losses
5 Fed Funds
6 Other assets
7 Total assets
8 CO bonds
9 Discount notes
10 Member deposits
11 Other liabilities
12 Total liabilities
13 Class B capital stock
14 Class A capital stock
15 Capital stock pre-conversion
16 Retained earnings (unrestricted)
17 Retained earnings (restricted)
18 Accumulated other comprehensive income (loss)
19 Total capital
20 Total liabilities and capital
FHLBank Dodd-Frank Stress Test Template
(Disclosure to FHFA ONLY)
Balance Sheet - Aggregate (BASE)
LIABILITIES
ASSETS
CAPITAL
Page 90
90 | P a g e
Most
Recent
Quarter Q1 Q2 Q3 Q4 Q5 Q6 Q7 Q8 Q9
1 Advances
2 Investment Securities
3 Mortgage Loans
4 Allowance for loan losses
5 Fed Funds
6 Other assets
7 Total assets
8 CO bonds
9 Discount notes
10 Member deposits
11 Other liabilities
12 Total liabilities
13 Class B capital stock
14 Class A capital stock
15 Capital stock pre-conversion
16 Retained earnings (unrestricted)
17 Retained earnings (restricted)
18 Accumulated other comprehensive income (loss)
19 Total capital
20 Total liabilities and capital
FHLBank Dodd-Frank Stress Test Template
(Disclosure to FHFA ONLY)
Balance Sheet - Existing (BASE)
ASSETS
LIABILITIES
CAPITAL
Page 91
91 | P a g e
Most
Recent
Quarter Q1 Q2 Q3 Q4 Q5 Q6 Q7 Q8 Q9
1 Advances
2 Investment Securities
3 Mortgage Loans
4 Allowance for loan losses
5 Fed Funds
6 Other assets
7 Total assets
8 CO bonds
9 Discount notes
10 Member deposits
11 Other liabilities
12 Total liabilities
13 Class B capital stock
14 Class A capital stock
15 Capital stock pre-conversion
16 Retained earnings (unrestricted)
17 Retained earnings (restricted)
18 Accumulated other comprehensive income (loss)
19 Total capital
20 Total liabilities and capital
FHLBank Dodd-Frank Stress Test Template
(Disclosure to FHFA ONLY)
Balance Sheet - Replacement (BASE)
ASSETS
LIABILITIES
CAPITAL
Page 92
92 | P a g e
Capital Roll Forward (BASE)
Most
Recent
Quarter Q1 Q2 Q3 Q4 Q5 Q6 Q7 Q8 Q9
CAPITAL
1 Beginning Capital
2 Net Income
3 Less: Dividends
4 Other Capital Actions
5 Change in AOCI
6 Other
7 Ending Capital
8 Regulatory Capital
Capital Ratios
9 Regulatory Capital
10 Leverage Capital
11 Permanent Capital
FHLBank Dodd-Frank Stress Test Template
(Disclosure to FHFA ONLY)
Page 93
93 | P a g e
Credit (BASE)
Most
Recent
Quarter Q1 Q2 Q3 Q4 Q5 Q6 Q7 Q8 Q9
CREDIT EXPENSES
1 Provision for credit losses
PLS CREDIT QUALITY
2 Principal
3 Principal writedown
4 Balance
5 Credit support
COUNTERPARTY CREDIT
6 Net Exposure
7 Secured Credit
8 Unsecured Credit
9 Unsecured derivative counterparty exposure
10 Payment from private mortgage insurers
FHLBank Dodd-Frank Stress Test Template
(Disclosure to FHFA ONLY)
Page 94
94 | P a g e
Most
Recent
Quarter Q1 Q2 Q3 Q4 Q5 Q6 Q7 Q8 Q9
Interest Income:
1 Advances
2 Whole loans held for portfolio
3 Investment Securities
4 Fed Funds
5 Other Interest Income
6 Total Interest Income
Interest Expense:
7 CO Bonds
8 Discount Notes
9 Member Deposits
10 Other Interest Expense
11 Total Interest Expense
12 Net interest income
13 Provision (reversal) for credit losses on mortgage loans
14 Net Interest Income after mortgage loan loss provision
15 Derivatives gains (losses)
16 Gains (losses) on securities
17 Total net gain (loss) on changes in fair value
18 Total OTTI credit charge
19 Other gains (losses)
20 Operating expenses
21 Other expenses
22 Income (loss) before assessments
23 Total assessments
24 Net Income (Loss)
FHLBank Dodd-Frank Stress Test Template
(Disclosure to FHFA ONLY)
Income Statement - Aggregate (ADVERSE)
Page 95
95 | P a g e
Most
Recent
Quarter Q1 Q2 Q3 Q4 Q5 Q6 Q7 Q8 Q9
Interest Income:
1 Advances
2 Whole loans held for portfolio
3 Investment Securities
4 Fed Funds
5 Other Interest Income
6 Total Interest Income
Interest Expense:
7 CO Bonds
8 Discount Notes
9 Member Deposits
10 Other Interest Expense
11 Total Interest Expense
12 Net interest income
13 Provision (reversal) for credit losses on mortgage loans
14 Net Interest Income after mortgage loan loss provision
15 Derivatives gains (losses)
16 Gains (losses) on securities
17 Total net gain (loss) on changes in fair value
18 Total OTTI credit charge
19 Other gains (losses)
20 Operating expenses
21 Other expenses
22 Income (loss) before assessments
23 Total assessments
24 Net Income (Loss)
FHLBank Dodd-Frank Stress Test Template
(Disclosure to FHFA ONLY)
Income Statement - Existing (ADVERSE)
Page 96
96 | P a g e
Most
Recent
Quarter Q1 Q2 Q3 Q4 Q5 Q6 Q7 Q8 Q9
Interest Income:
1 Advances
2 Whole loans held for portfolio
3 Investment Securities
4 Fed Funds
5 Other Interest Income
6 Total Interest Income
Interest Expense:
7 CO Bonds
8 Discount Notes
9 Member Deposits
10 Other Interest Expense
11 Total Interest Expense
12 Net interest income
13 Provision (reversal) for credit losses on mortgage loans
14 Net Interest Income after mortgage loan loss provision
15 Derivatives gains (losses)
16 Gains (losses) on securities
17 Total net gain (loss) on changes in fair value
18 Total OTTI credit charge
19 Other gains (losses)
20 Operating expenses
21 Other expenses
22 Income (loss) before assessments
23 Total assessments
24 Net Income (Loss)
FHLBank Dodd-Frank Stress Test Template
(Disclosure to FHFA ONLY)
Income Statement - Replacement (ADVERSE)
Page 97
97 | P a g e
Most
Recent
Quarter Q1 Q2 Q3 Q4 Q5 Q6 Q7 Q8 Q9
1 Advances
2 Investment Securities
3 Mortgage Loans
4 Allowance for loan losses
5 Fed Funds
6 Other assets
7 Total assets
8 CO bonds
9 Discount notes
10 Member deposits
11 Other liabilities
12 Total liabilities
13 Class B capital stock
14 Class A capital stock
15 Capital stock pre-conversion
16 Retained earnings (unrestricted)
17 Retained earnings (restricted)
18 Accumulated other comprehensive income (loss)
19 Total capital
20 Total liabilities and capital
FHLBank Dodd-Frank Stress Test Template
(Disclosure to FHFA ONLY)
Balance Sheet-Aggregate (ADVERSE)
ASSETS
LIABILITIES
CAPITAL
Page 98
98 | P a g e
Most
Recent
Quarter Q1 Q2 Q3 Q4 Q5 Q6 Q7 Q8 Q9
1 Advances
2 Investment Securities
3 Mortgage Loans
4 Allowance for loan losses
5 Fed Funds
6 Other assets
7 Total assets
8 CO bonds
9 Discount notes
10 Member deposits
11 Other liabilities
12 Total liabilities
13 Class B capital stock
14 Class A capital stock
15 Capital stock pre-conversion
16 Retained earnings (unrestricted)
17 Retained earnings (restricted)
18 Accumulated other comprehensive income (loss)
19 Total capital
20 Total liabilities and capital
FHLBank Dodd-Frank Stress Test Template
(Disclosure to FHFA ONLY)
Balance Sheet - Existing (ADVERSE)
ASSETS
LIABILITIES
CAPITAL
Page 99
99 | P a g e
Most
Recent
Quarter Q1 Q2 Q3 Q4 Q5 Q6 Q7 Q8 Q9
1 Advances
2 Investment Securities
3 Mortgage Loans
4 Allowance for loan losses
5 Fed Funds
6 Other assets
7 Total assets
8 CO bonds
9 Discount notes
10 Member deposits
11 Other liabilities
12 Total liabilities
13 Class B capital stock
14 Class A capital stock
15 Capital stock pre-conversion
16 Retained earnings (unrestricted)
17 Retained earnings (restricted)
18 Accumulated other comprehensive income (loss)
19 Total capital
20 Total liabilities and capital
FHLBank Dodd-Frank Stress Test Template
(Disclosure to FHFA ONLY)
Balance Sheet - Replacement (ADVERSE)
ASSETS
LIABILITIES
CAPITAL
Page 100
100 | P a g e
Capital Roll Forward (ADVERSE)
Most
Recent
Quarter Q1 Q2 Q3 Q4 Q5 Q6 Q7 Q8 Q9
CAPITAL
1 Beginning Capital
2 Net Income
3 Less: Dividends
4 Other Capital Actions
5 Change in AOCI
6 Other
7 Ending Capital
8 Regulatory Capital
Capital Ratios
9 Regulatory Capital
10 Leverage Capital
11 Permanent Capital
FHLBank Dodd-Frank Stress Test Template
(Disclosure to FHFA ONLY)
Page 101
101 | P a g e
Credit (ADVERSE)
Most
Recent
Quarter Q1 Q2 Q3 Q4 Q5 Q6 Q7 Q8 Q9
CREDIT EXPENSES
1 Provision for credit losses
PLS CREDIT QUALITY
2 Principal
3 Principal writedown
4 Balance
5 Credit support
COUNTERPARTY CREDIT
6 Unsecured credit
7 Unsecured derivative counterparty exposure
8 Payment from private mortgage insurers
FHLBank Dodd-Frank Stress Test Template
(Disclosure to FHFA ONLY)
Page 102
102 | P a g e
Global Market Shock (ADVERSE) Q1 Loss
1
2 Agency Securities Option-Adjusted Spread
3 Municipal Securities
4 Counterparty Default Risk*
FHLBank Dodd-Frank Stress Test Template
(Disclosure to FHFA ONLY)
Private Label Securities (PLS) or Non-Agency Prices for Residential Mortgage-
backed Securities (RMBS), Asset-based Securities (ABS), Commercial Mortgage-
backed Securities (CMBS) and other collateral
Counterparty Name Counterparty Type
* Please provide the name and type (eg: derivatives, repo, etc.) of the largest counterparty below:
Page 103
103 | P a g e
Global Market Shock (ADVERSE) Q1 Loss
TRADING SECURITIES
1
2 Agency Securities Option-Adjusted Spread
3 Municipal Securities
AVAILABLE-FOR-SALE SECURITIES
4
5 Agency Securities Option-Adjusted Spread
6 Municipal Securities
FHLBank Dodd-Frank Stress Test Template
(Disclosure to FHFA ONLY)
Private Label Securities (PLS) or Non-Agency Prices for Residential Mortgage-backed
Securities (RMBS), Asset-based Securities (ABS), Commercial Mortgage-backed
Securities (CMBS) and other collateral
Private Label Securities (PLS) or Non-Agency Prices for Residential Mortgage-backed
Securities (RMBS), Asset-based Securities (ABS), Commercial Mortgage-backed
Securities (CMBS) and other collateral
Page 104
104 | P a g e
Investment Securities and Fair Value Trading Assets
Securitized Products (ADVERSE)
(*Credit ratings should be as of December 31, 2016)
Non-
Agency
Prime
Sub-
prime
Option
ARMS
Other
AltA
Unspec
Non-
Prime HELOC
RMBS
CDO
RMBS
CDS
Credit
Basket PrimeX
ABX /
TABX
Prime
Whole
Loans
Non-Prime
Whole
Loans
European
RMBS
Other /
Unspecified
RMBS
SubTotal
MV* ($MM)
AAA Total $0 $0 $0 $0 $0 $0 $0 $0 $0 $0 $0 $0 $0 $0 $0 $0 $0
Pre 2006 $0 $0
2006 $0 $0
2007 $0 $0
Post 2007 $0 $0
Unspecified Vintage $0 $0
AA Total $0 $0 $0 $0 $0 $0 $0 $0 $0 $0 $0 $0 $0 $0 $0 $0 $0
Pre 2006 $0 $0
2006 $0 $0
2007 $0 $0
Post 2007 $0 $0
Unspecified Vintage $0 $0
A Total $0 $0 $0 $0 $0 $0 $0 $0 $0 $0 $0 $0 $0 $0 $0 $0 $0
Pre 2006 $0 $0
2006 $0 $0
2007 $0 $0
Post 2007 $0 $0
Unspecified Vintage $0 $0
BBB Total $0 $0 $0 $0 $0 $0 $0 $0 $0 $0 $0 $0 $0 $0 $0 $0 $0
Pre 2006 $0 $0
2006 $0 $0
2007 $0 $0
Post 2007 $0 $0
Unspecified Vintage $0 $0
BB Total $0 $0 $0 $0 $0 $0 $0 $0 $0 $0 $0 $0 $0 $0 $0 $0 $0
Pre 2006 $0 $0
2006 $0 $0
2007 $0 $0
Post 2007 $0 $0
Unspecified Vintage $0 $0
B Total $0 $0 $0 $0 $0 $0 $0 $0 $0 $0 $0 $0 $0 $0 $0 $0 $0
Pre 2006 $0 $0
2006 $0 $0
2007 $0 $0
Post 2007 $0 $0
Unspecified Vintage $0 $0
<B Total $0 $0 $0 $0 $0 $0 $0 $0 $0 $0 $0 $0 $0 $0 $0 $0 $0
Pre 2006 $0 $0
2006 $0 $0
2007 $0 $0
Post 2007 $0 $0
Unspecified Vintage $0 $0
NR Total $0 $0 $0 $0 $0 $0 $0 $0 $0 $0 $0 $0 $0 $0 $0 $0 $0
Pre 2006 $0 $0
2006 $0 $0
2007 $0 $0
Post 2007 $0 $0
Unspecified Vintage $0 $0
Total $0 $0 $0 $0 $0 $0 $0 $0 $0 $0 $0 $0 $0 $0 $0 $0 $0
Profit/Loss ($MM)
AAA Total $0 $0 $0 $0 $0 $0 $0 $0 $0 $0 $0 $0 $0 $0 $0 $0 $0
Pre 2006 $0 $0
2006 $0 $0
2007 $0 $0
Post 2007 $0 $0
Unspecified Vintage $0 $0
AA Total $0 $0 $0 $0 $0 $0 $0 $0 $0 $0 $0 $0 $0 $0 $0 $0 $0
Pre 2006 $0 $0
2006 $0 $0
2007 $0 $0
Post 2007 $0 $0
Unspecified Vintage $0 $0
A Total $0 $0 $0 $0 $0 $0 $0 $0 $0 $0 $0 $0 $0 $0 $0 $0 $0
Pre 2006 $0 $0
2006 $0 $0
2007 $0 $0
Post 2007 $0 $0
Unspecified Vintage $0 $0
BBB Total $0 $0 $0 $0 $0 $0 $0 $0 $0 $0 $0 $0 $0 $0 $0 $0 $0
Pre 2006 $0 $0
2006 $0 $0
2007 $0 $0
Post 2007 $0 $0
Unspecified Vintage $0 $0
BB Total $0 $0 $0 $0 $0 $0 $0 $0 $0 $0 $0 $0 $0 $0 $0 $0 $0
Pre 2006 $0 $0
2006 $0 $0
2007 $0 $0
Post 2007 $0 $0
Unspecified Vintage $0 $0
B Total $0 $0 $0 $0 $0 $0 $0 $0 $0 $0 $0 $0 $0 $0 $0 $0 $0
Pre 2006 $0 $0
2006 $0 $0
2007 $0 $0
Post 2007 $0 $0
Unspecified Vintage $0 $0
<B Total $0 $0 $0 $0 $0 $0 $0 $0 $0 $0 $0 $0 $0 $0 $0 $0 $0
Pre 2006 $0 $0
2006 $0 $0
2007 $0 $0
Post 2007 $0 $0
Unspecified Vintage $0 $0
NR Total $0 $0 $0 $0 $0 $0 $0 $0 $0 $0 $0 $0 $0 $0 $0 $0 $0
Pre 2006 $0 $0
2006 $0 $0
2007 $0 $0
Post 2007 $0 $0
Unspecified Vintage $0 $0
Total $0 $0 $0 $0 $0 $0 $0 $0 $0 $0 $0 $0 $0 $0 $0 $0 $0
FHLBank Dodd-Frank Stress Test Template
(Disclosure to FHFA ONLY)
Grand
Total
RMBS
Page 105
105 | P a g e
Investment Securities and Fair Value Trading Assets
Securitized Products (ADVERSE)
(*Credit ratings should be as of December 31, 2016)
Autos
Credit
Cards
Student
Loans
ABS
CDS
Credit
Basket
Index
Tranche
s
Other /
Unspecified
ABS
SubTotal
Cash Non-
Agency
CMBS
CMBS
CDS
CMBS
CDO
Credit
Basket
Index
Tranches
Whole
Loans
Other /
Unspecified
CMBS
SubTotal CLO
Other /
Unspecified
Corporate
CDO/CLO
SubTotal Total Size
Total
Protection
Other /
Unspecified
MV* ($MM)
AAA Total $0 $0 $0 $0 $0 $0 $0 $0 $0 $0 $0 $0 $0 $0 $0 $0 $0 $0 $0 $0 $0 $0 $0
Pre 2006 $0 $0 $0 $0
2006 $0 $0 $0 $0
2007 $0 $0 $0 $0
Post 2007 $0 $0 $0 $0
Unspecified Vintage $0 $0 $0 $0
AA Total $0 $0 $0 $0 $0 $0 $0 $0 $0 $0 $0 $0 $0 $0 $0 $0 $0 $0 $0 $0 $0 $0 $0
Pre 2006 $0 $0 $0 $0
2006 $0 $0 $0 $0
2007 $0 $0 $0 $0
Post 2007 $0 $0 $0 $0
Unspecified Vintage $0 $0 $0 $0
A Total $0 $0 $0 $0 $0 $0 $0 $0 $0 $0 $0 $0 $0 $0 $0 $0 $0 $0 $0 $0 $0 $0 $0
Pre 2006 $0 $0 $0 $0
2006 $0 $0 $0 $0
2007 $0 $0 $0 $0
Post 2007 $0 $0 $0 $0
Unspecified Vintage $0 $0 $0 $0
BBB Total $0 $0 $0 $0 $0 $0 $0 $0 $0 $0 $0 $0 $0 $0 $0 $0 $0 $0 $0 $0 $0 $0 $0
Pre 2006 $0 $0 $0 $0
2006 $0 $0 $0 $0
2007 $0 $0 $0 $0
Post 2007 $0 $0 $0 $0
Unspecified Vintage $0 $0 $0 $0
BB Total $0 $0 $0 $0 $0 $0 $0 $0 $0 $0 $0 $0 $0 $0 $0 $0 $0 $0 $0 $0 $0 $0 $0
Pre 2006 $0 $0 $0 $0
2006 $0 $0 $0 $0
2007 $0 $0 $0 $0
Post 2007 $0 $0 $0 $0
Unspecified Vintage $0 $0 $0 $0
B Total $0 $0 $0 $0 $0 $0 $0 $0 $0 $0 $0 $0 $0 $0 $0 $0 $0 $0 $0 $0 $0 $0 $0
Pre 2006 $0 $0 $0 $0
2006 $0 $0 $0 $0
2007 $0 $0 $0 $0
Post 2007 $0 $0 $0 $0
Unspecified Vintage $0 $0 $0 $0
<B Total $0 $0 $0 $0 $0 $0 $0 $0 $0 $0 $0 $0 $0 $0 $0 $0 $0 $0 $0 $0 $0 $0 $0
Pre 2006 $0 $0 $0 $0
2006 $0 $0 $0 $0
2007 $0 $0 $0 $0
Post 2007 $0 $0 $0 $0
Unspecified Vintage $0 $0 $0 $0
NR Total $0 $0 $0 $0 $0 $0 $0 $0 $0 $0 $0 $0 $0 $0 $0 $0 $0 $0 $0 $0 $0 $0 $0
Pre 2006 $0 $0 $0 $0
2006 $0 $0 $0 $0
2007 $0 $0 $0 $0
Post 2007 $0 $0 $0 $0
Unspecified Vintage $0 $0 $0 $0
Total $0 $0 $0 $0 $0 $0 $0 $0 $0 $0 $0 $0 $0 $0 $0 $0 $0 $0 $0 $0 $0 $0 $0
Profit/Loss ($MM)
AAA Total $0 $0 $0 $0 $0 $0 $0 $0 $0 $0 $0 $0 $0 $0 $0 $0 $0 $0 $0 $0 $0 $0 $0
Pre 2006 $0 $0 $0 $0
2006 $0 $0 $0 $0
2007 $0 $0 $0 $0
Post 2007 $0 $0 $0 $0
Unspecified Vintage $0 $0 $0 $0
AA Total $0 $0 $0 $0 $0 $0 $0 $0 $0 $0 $0 $0 $0 $0 $0 $0 $0 $0 $0 $0 $0 $0 $0
Pre 2006 $0 $0 $0 $0
2006 $0 $0 $0 $0
2007 $0 $0 $0 $0
Post 2007 $0 $0 $0 $0
Unspecified Vintage $0 $0 $0 $0
A Total $0 $0 $0 $0 $0 $0 $0 $0 $0 $0 $0 $0 $0 $0 $0 $0 $0 $0 $0 $0 $0 $0 $0
Pre 2006 $0 $0 $0 $0
2006 $0 $0 $0 $0
2007 $0 $0 $0 $0
Post 2007 $0 $0 $0 $0
Unspecified Vintage $0 $0 $0 $0
BBB Total $0 $0 $0 $0 $0 $0 $0 $0 $0 $0 $0 $0 $0 $0 $0 $0 $0 $0 $0 $0 $0 $0 $0
Pre 2006 $0 $0 $0 $0
2006 $0 $0 $0 $0
2007 $0 $0 $0 $0
Post 2007 $0 $0 $0 $0
Unspecified Vintage $0 $0 $0 $0
BB Total $0 $0 $0 $0 $0 $0 $0 $0 $0 $0 $0 $0 $0 $0 $0 $0 $0 $0 $0 $0 $0 $0 $0
Pre 2006 $0 $0 $0 $0
2006 $0 $0 $0 $0
2007 $0 $0 $0 $0
Post 2007 $0 $0 $0 $0
Unspecified Vintage $0 $0 $0 $0
B Total $0 $0 $0 $0 $0 $0 $0 $0 $0 $0 $0 $0 $0 $0 $0 $0 $0 $0 $0 $0 $0 $0 $0
Pre 2006 $0 $0 $0 $0
2006 $0 $0 $0 $0
2007 $0 $0 $0 $0
Post 2007 $0 $0 $0 $0
Unspecified Vintage $0 $0 $0 $0
<B Total $0 $0 $0 $0 $0 $0 $0 $0 $0 $0 $0 $0 $0 $0 $0 $0 $0 $0 $0 $0 $0 $0 $0
Pre 2006 $0 $0 $0 $0
2006 $0 $0 $0 $0
2007 $0 $0 $0 $0
Post 2007 $0 $0 $0 $0
Unspecified Vintage $0 $0 $0 $0
NR Total $0 $0 $0 $0 $0 $0 $0 $0 $0 $0 $0 $0 $0 $0 $0 $0 $0 $0 $0 $0 $0 $0 $0
Pre 2006 $0 $0 $0 $0
2006 $0 $0 $0 $0
2007 $0 $0 $0 $0
Post 2007 $0 $0 $0 $0
Unspecified Vintage $0 $0 $0 $0
Total $0 $0 $0 $0 $0 $0 $0 $0 $0 $0 $0 $0 $0 $0 $0 $0 $0 $0 $0 $0 $0 $0 $0
Grand
Total
ABS CMBS Corporate CDO / CLO Warehouse
FHLBank Dodd-Frank Stress Test Template
(Disclosure to FHFA ONLY)
Page 106
106 | P a g e
Trading and Other Fair Value Assets
Munis (Adverse)
Bonds
AAA
AA
A
BBB
BB
B
<B
NR
Bonds Total $0 $0 $0 $0
1M
3M
6M
9M
1Y
2Y
3Y
5Y
7Y
10Y
15Y
20Y
30Y
Bonds Total $0 $0 $0 $0
Loans
AAA
AA
A
BBB
BB
B
<B
NR
Loans Total $0 $0 $0 $0
1M
3M
6M
9M
1Y
2Y
3Y
5Y
7Y
10Y
15Y
20Y
30Y
Loans Total $0 $0 $0 $0
CDS
AAA
AA
A
BBB
BB
B
<B
NR
CDS Total $0 $0 $0 $0
1M
3M
6M
9M
1Y
2Y
3Y
5Y
7Y
10Y
15Y
20Y
30Y
CDS Total $0 $0 $0 $0
MV ($MM)
Available-for-Sale
Securities
MV ($MM)
Trading
Securities
Profit/Loss
from OAS
Widening
(AFS)
Profit/Loss
from OAS
Widening
(Trading Secs)
FHLBank Dodd-Frank Stress Test Template
(Disclosure to FHFA ONLY)
Page 107
107 | P a g e
Trading and Other Fair Value Assets
Munis (Adverse)
Indices
AAA
AA
A
BBB
BB
B
<B
NR
Indices Total $0 $0 $0 $0
1M
3M
6M
9M
1Y
2Y
3Y
5Y
7Y
10Y
15Y
20Y
30Y
Indices Total $0 $0 $0 $0
Other / Unspecified Munis
AAA
AA
A
BBB
BB
B
<B
NR
Other / Unspecified Munis Total $0 $0 $0 $0
1M
3M
6M
9M
1Y
2Y
3Y
5Y
7Y
10Y
15Y
20Y
30Y
Other / Unspecified Munis Total $0 $0 $0 $0
Grand Total
AAA $0 $0 $0 $0
AA $0 $0 $0 $0
A $0 $0 $0 $0
BBB $0 $0 $0 $0
BB $0 $0 $0 $0
B $0 $0 $0 $0
<B $0 $0 $0 $0
NR $0 $0 $0 $0
Grand Total $0 $0 $0 $0
1M $0 $0 $0 $0
3M $0 $0 $0 $0
6M $0 $0 $0 $0
9M $0 $0 $0 $0
1Y $0 $0 $0 $0
2Y $0 $0 $0 $0
3Y $0 $0 $0 $0
5Y $0 $0 $0 $0
7Y $0 $0 $0 $0
10Y $0 $0 $0 $0
15Y $0 $0 $0 $0
20Y $0 $0 $0 $0
30Y $0 $0 $0 $0
Grand Total $0 $0 $0 $0
MV ($MM)
Available-for-Sale
Securities
MV ($MM)
Trading
Securities
Profit/Loss
from OAS
Widening
(AFS)
Profit/Loss
from OAS
Widening
(Trading Secs)
FHLBank Dodd-Frank Stress Test Template
(Disclosure to FHFA ONLY)
Page 108
108 | P a g e
Available-for-Sale
Securities
Profit/Loss
FHLBank Dodd-Frank Stress Test Template
(Disclosure to FHFA ONLY)
Trading & Other Fair Value Assets Template
Agencies (Adverse)
US Residential Agency Products
US Commercial Agency Products
Non-US Agency Products
IOs
POs
Other CMOs
Pass-Throughs
Agency Debt/Debentures
IOS Index
POS Index
MBX Index
Other Agency Derivatives
TBA's
Reverse Mortgages
Residential Other / Unspecified
Total $0 $0
$0 $0
Cash Agency CMBS
Agency CMBS Derivatives
Commercial Other / Unspecified
Total $0 $0
$0 $0
AAA
AA
A
BBB
BB
B
<B
NR
Total $0 $0
$0 $0
Page 109
109 | P a g e
Most
Recent
Quarter Q1 Q2 Q3 Q4 Q5 Q6 Q7 Q8 Q9
Interest Income:
1 Advances
2 Whole loans held for portfolio
3 Investment Securities
4 Fed Funds
5 Other Interest Income
6 Total Interest Income
Interest Expense:
7 CO Bonds
8 Discount Notes
9 Member Deposits
10 Other Interest Expense
11 Total Interest Expense
12 Net interest income
13 Provision (reversal) for credit losses on mortgage loans
14 Net Interest Income after mortgage loan loss provision
15 Derivatives gains (losses)
16 Gains (losses) on securities
17 Total net gain (loss) on changes in fair value
18 Total OTTI credit charge
19 Other gains (losses)
20 Operating expenses
21 Other expenses
22 Income (loss) before assessments
23 Total assessments
24 Net Income (Loss)
FHLBank Dodd-Frank Stress Test Template
(Disclosure to FHFA ONLY)
Income Statement-Aggregate (SEVERELY ADVERSE)
Page 110
110 | P a g e
Most
Recent
Quarter Q1 Q2 Q3 Q4 Q5 Q6 Q7 Q8 Q9
Interest Income:
1 Advances
2 Whole loans held for portfolio
3 Investment Securities
4 Fed Funds
5 Other Interest Income
6 Total Interest Income
Interest Expense:
7 CO Bonds
8 Discount Notes
9 Member Deposits
10 Other Interest Expense
11 Total Interest Expense
12 Net interest income
13 Provision (reversal) for credit losses on mortgage loans
14 Net Interest Income after mortgage loan loss provision
15 Derivatives gains (losses)
16 Gains (losses) on securities
17 Total net gain (loss) on changes in fair value
18 Total OTTI credit charge
19 Other gains (losses)
20 Operating expenses
21 Other expenses
22 Income (loss) before assessments
23 Total assessments
24 Net Income (Loss)
FHLBank Dodd-Frank Stress Test Template
(Disclosure to FHFA ONLY)
Income Statement - Existing (SEVERELY ADVERSE)
Page 111
111 | P a g e
Most
Recent
Quarter Q1 Q2 Q3 Q4 Q5 Q6 Q7 Q8 Q9
Interest Income:
1 Advances
2 Whole loans held for portfolio
3 Investment Securities
4 Fed Funds
5 Other Interest Income
6 Total Interest Income
Interest Expense:
7 CO Bonds
8 Discount Notes
9 Member Deposits
10 Other Interest Expense
11 Total Interest Expense
12 Net interest income
13 Provision (reversal) for credit losses on mortgage loans
14 Net Interest Income after mortgage loan loss provision
15 Derivatives gains (losses)
16 Gains (losses) on securities
17 Total net gain (loss) on changes in fair value
18 Total OTTI credit charge
19 Other gains (losses)
20 Operating expenses
21 Other expenses
22 Income (loss) before assessments
23 Total assessments
24 Net Income (Loss)
FHLBank Dodd-Frank Stress Test Template
(Disclosure to FHFA ONLY)
Income Statement - Replacement (SEVERELY ADVERSE)
Page 112
112 | P a g e
Most
Recent
Quarter Q1 Q2 Q3 Q4 Q5 Q6 Q7 Q8 Q9
1 Advances
2 Investment Securities
3 Mortgage Loans
4 Allowance for loan losses
5 Fed Funds
6 Other assets
7 Total assets
8 CO bonds
9 Discount notes
10 Member deposits
11 Other liabilities
12 Total liabilities
13 Class B capital stock
14 Class A capital stock
15 Capital stock pre-conversion
16 Retained earnings (unrestricted)
17 Retained earnings (restricted)
18 Accumulated other comprehensive income (loss)
19 Total capital
20 Total liabilities and capital
FHLBank Dodd-Frank Stress Test Template
(Disclosure to FHFA ONLY)
Balance Sheet-Aggregate (SEVERELY ADVERSE)
ASSETS
LIABILITIES
CAPITAL
Page 113
113 | P a g e
Most
Recent
Quarter Q1 Q2 Q3 Q4 Q5 Q6 Q7 Q8 Q9
1 Advances
2 Investment Securities
3 Mortgage Loans
4 Allowance for loan losses
5 Fed Funds
6 Other assets
7 Total assets
8 CO bonds
9 Discount notes
10 Member deposits
11 Other liabilities
12 Total liabilities
13 Class B capital stock
14 Class A capital stock
15 Capital stock pre-conversion
16 Retained earnings (unrestricted)
17 Retained earnings (restricted)
18 Accumulated other comprehensive income (loss)
19 Total capital
20 Total liabilities and capital
FHLBank Dodd-Frank Stress Test Template
(Disclosure to FHFA ONLY)
Balance Sheet - Existing (SEVERELY ADVERSE)
ASSETS
LIABILITIES
CAPITAL
Page 114
114 | P a g e
Most
Recent
Quarter Q1 Q2 Q3 Q4 Q5 Q6 Q7 Q8 Q9
1 Advances
2 Investment Securities
3 Mortgage Loans
4 Allowance for loan losses
5 Fed Funds
6 Other assets
7 Total assets
8 CO bonds
9 Discount notes
10 Member deposits
11 Other liabilities
12 Total liabilities
13 Class B capital stock
14 Class A capital stock
15 Capital stock pre-conversion
16 Retained earnings (unrestricted)
17 Retained earnings (restricted)
18 Accumulated other comprehensive income (loss)
19 Total capital
20 Total liabilities and capital
FHLBank Dodd-Frank Stress Test Template
(Disclosure to FHFA ONLY)
Balance Sheet - Replacement (SEVERELY ADVERSE)
ASSETS
LIABILITIES
CAPITAL
Page 115
115 | P a g e
Capital Roll Forward (SEVERELY ADVERSE)
Most
Recent
Quarter Q1 Q2 Q3 Q4 Q5 Q6 Q7 Q8 Q9
CAPITAL
1 Beginning Capital
2 Net Income
3 Less: Dividends
4 Other Capital Actions
5 Change in AOCI
6 Other
7 Ending Capital
8 Regulatory Capital
Capital Ratios
9 Regulatory Capital
10 Leverage Capital
11 Permanent Capital
FHLBank Dodd-Frank Stress Test Template
(Disclosure to FHFA ONLY)
Page 116
116 | P a g e
Credit (SEVERELY ADVERSE)
Most
Recent
Quarter Q1 Q2 Q3 Q4 Q5 Q6 Q7 Q8 Q9
CREDIT EXPENSES
1 Provision for credit losses
PLS CREDIT QUALITY
2 Principal
3 Principal writedown
4 Balance
5 Credit support
COUNTERPARTY CREDIT
6 Unsecured credit
7 Unsecured derivative counterparty exposure
8 Payment from private mortgage insurers
FHLBank Dodd-Frank Stress Test Template
(Disclosure to FHFA ONLY)
Page 117
117 | P a g e
Global Market Shock (SEVERELY ADVERSE) Q1 Loss
1
2 Agency Securities Option-Adjusted Spread
3 Municipal Securities
4 Counterparty Default Risk*
FHLBank Dodd-Frank Stress Test Template
(Disclosure to FHFA ONLY)
Private Label Securities (PLS) or Non-Agency Prices for Residential Mortgage-
backed Securities (RMBS), Asset-based Securities (ABS), Commercial Mortgage-
backed Securities (CMBS) and other collateral
Counterparty Name Counterparty Type
* Please provide the name and type (eg: derivatives, repo, etc.) of the largest counterparty below:
Page 118
118 | P a g e
Global Market Shock (SEVERELY ADVERSE) Q1 Loss
TRADING SECURITIES
1
2 Agency Securities Option-Adjusted Spread
3 Municipal Securities
AVAILABLE-FOR-SALE SECURITIES
4
5 Agency Securities Option-Adjusted Spread
6 Municipal Securities
FHLBank Dodd-Frank Stress Test Template
(Disclosure to FHFA ONLY)
Private Label Securities (PLS) or Non-Agency Prices for Residential Mortgage-backed
Securities (RMBS), Asset-based Securities (ABS), Commercial Mortgage-backed
Securities (CMBS) and other collateral
Private Label Securities (PLS) or Non-Agency Prices for Residential Mortgage-backed
Securities (RMBS), Asset-based Securities (ABS), Commercial Mortgage-backed
Securities (CMBS) and other collateral
Page 119
119 | P a g e
Investment Securities and Fair Value Trading Assets
Securitized Products (Severely Adverse)
(*Credit ratings should be as of December 31, 2016)
Non-
Agency
Prime
Sub-
prime
Option
ARMS
Other
AltA
Unspec
Non-
Prime HELOC
RMBS
CDO
RMBS
CDS
Credit
Basket PrimeX
ABX /
TABX
Prime
Whole
Loans
Non-Prime
Whole
Loans
European
RMBS
Other /
Unspecified
RMBS
SubTotal
MV* ($MM)
AAA Total $0 $0 $0 $0 $0 $0 $0 $0 $0 $0 $0 $0 $0 $0 $0 $0 $0
Pre 2006 $0 $0
2006 $0 $0
2007 $0 $0
Post 2007 $0 $0
Unspecified Vintage $0 $0
AA Total $0 $0 $0 $0 $0 $0 $0 $0 $0 $0 $0 $0 $0 $0 $0 $0 $0
Pre 2006 $0 $0
2006 $0 $0
2007 $0 $0
Post 2007 $0 $0
Unspecified Vintage $0 $0
A Total $0 $0 $0 $0 $0 $0 $0 $0 $0 $0 $0 $0 $0 $0 $0 $0 $0
Pre 2006 $0 $0
2006 $0 $0
2007 $0 $0
Post 2007 $0 $0
Unspecified Vintage $0 $0
BBB Total $0 $0 $0 $0 $0 $0 $0 $0 $0 $0 $0 $0 $0 $0 $0 $0 $0
Pre 2006 $0 $0
2006 $0 $0
2007 $0 $0
Post 2007 $0 $0
Unspecified Vintage $0 $0
BB Total $0 $0 $0 $0 $0 $0 $0 $0 $0 $0 $0 $0 $0 $0 $0 $0 $0
Pre 2006 $0 $0
2006 $0 $0
2007 $0 $0
Post 2007 $0 $0
Unspecified Vintage $0 $0
B Total $0 $0 $0 $0 $0 $0 $0 $0 $0 $0 $0 $0 $0 $0 $0 $0 $0
Pre 2006 $0 $0
2006 $0 $0
2007 $0 $0
Post 2007 $0 $0
Unspecified Vintage $0 $0
<B Total $0 $0 $0 $0 $0 $0 $0 $0 $0 $0 $0 $0 $0 $0 $0 $0 $0
Pre 2006 $0 $0
2006 $0 $0
2007 $0 $0
Post 2007 $0 $0
Unspecified Vintage $0 $0
NR Total $0 $0 $0 $0 $0 $0 $0 $0 $0 $0 $0 $0 $0 $0 $0 $0 $0
Pre 2006 $0 $0
2006 $0 $0
2007 $0 $0
Post 2007 $0 $0
Unspecified Vintage $0 $0
Total $0 $0 $0 $0 $0 $0 $0 $0 $0 $0 $0 $0 $0 $0 $0 $0 $0
Profit/Loss ($MM)
AAA Total $0 $0 $0 $0 $0 $0 $0 $0 $0 $0 $0 $0 $0 $0 $0 $0 $0
Pre 2006 $0 $0
2006 $0 $0
2007 $0 $0
Post 2007 $0 $0
Unspecified Vintage $0 $0
AA Total $0 $0 $0 $0 $0 $0 $0 $0 $0 $0 $0 $0 $0 $0 $0 $0 $0
Pre 2006 $0 $0
2006 $0 $0
2007 $0 $0
Post 2007 $0 $0
Unspecified Vintage $0 $0
A Total $0 $0 $0 $0 $0 $0 $0 $0 $0 $0 $0 $0 $0 $0 $0 $0 $0
Pre 2006 $0 $0
2006 $0 $0
2007 $0 $0
Post 2007 $0 $0
Unspecified Vintage $0 $0
BBB Total $0 $0 $0 $0 $0 $0 $0 $0 $0 $0 $0 $0 $0 $0 $0 $0 $0
Pre 2006 $0 $0
2006 $0 $0
2007 $0 $0
Post 2007 $0 $0
Unspecified Vintage $0 $0
BB Total $0 $0 $0 $0 $0 $0 $0 $0 $0 $0 $0 $0 $0 $0 $0 $0 $0
Pre 2006 $0 $0
2006 $0 $0
2007 $0 $0
Post 2007 $0 $0
Unspecified Vintage $0 $0
B Total $0 $0 $0 $0 $0 $0 $0 $0 $0 $0 $0 $0 $0 $0 $0 $0 $0
Pre 2006 $0 $0
2006 $0 $0
2007 $0 $0
Post 2007 $0 $0
Unspecified Vintage $0 $0
<B Total $0 $0 $0 $0 $0 $0 $0 $0 $0 $0 $0 $0 $0 $0 $0 $0 $0
Pre 2006 $0 $0
2006 $0 $0
2007 $0 $0
Post 2007 $0 $0
Unspecified Vintage $0 $0
NR Total $0 $0 $0 $0 $0 $0 $0 $0 $0 $0 $0 $0 $0 $0 $0 $0 $0
Pre 2006 $0 $0
2006 $0 $0
2007 $0 $0
Post 2007 $0 $0
Unspecified Vintage $0 $0
Total $0 $0 $0 $0 $0 $0 $0 $0 $0 $0 $0 $0 $0 $0 $0 $0 $0
FHLBank Dodd-Frank Stress Test Template
(Disclosure to FHFA ONLY)
Grand
Total
RMBS
Page 120
120 | P a g e
Investment Securities and Fair Value Trading Assets
Securitized Products (Severely Adverse)
(*Credit ratings should be as of December 31, 2016)
Autos
Credit
Cards
Student
Loans
ABS
CDS
Credit
Basket
Index
Tranche
s
Other /
Unspecified
ABS
SubTotal
Cash Non-
Agency
CMBS
CMBS
CDS
CMBS
CDO
Credit
Basket
Index
Tranches
Whole
Loans
Other /
Unspecified
CMBS
SubTotal CLO
Other /
Unspecified
Corporate
CDO/CLO
SubTotal Total Size
Total
Protection
Other /
Unspecified
MV* ($MM)
AAA Total $0 $0 $0 $0 $0 $0 $0 $0 $0 $0 $0 $0 $0 $0 $0 $0 $0 $0 $0 $0 $0 $0 $0
Pre 2006 $0 $0 $0 $0
2006 $0 $0 $0 $0
2007 $0 $0 $0 $0
Post 2007 $0 $0 $0 $0
Unspecified Vintage $0 $0 $0 $0
AA Total $0 $0 $0 $0 $0 $0 $0 $0 $0 $0 $0 $0 $0 $0 $0 $0 $0 $0 $0 $0 $0 $0 $0
Pre 2006 $0 $0 $0 $0
2006 $0 $0 $0 $0
2007 $0 $0 $0 $0
Post 2007 $0 $0 $0 $0
Unspecified Vintage $0 $0 $0 $0
A Total $0 $0 $0 $0 $0 $0 $0 $0 $0 $0 $0 $0 $0 $0 $0 $0 $0 $0 $0 $0 $0 $0 $0
Pre 2006 $0 $0 $0 $0
2006 $0 $0 $0 $0
2007 $0 $0 $0 $0
Post 2007 $0 $0 $0 $0
Unspecified Vintage $0 $0 $0 $0
BBB Total $0 $0 $0 $0 $0 $0 $0 $0 $0 $0 $0 $0 $0 $0 $0 $0 $0 $0 $0 $0 $0 $0 $0
Pre 2006 $0 $0 $0 $0
2006 $0 $0 $0 $0
2007 $0 $0 $0 $0
Post 2007 $0 $0 $0 $0
Unspecified Vintage $0 $0 $0 $0
BB Total $0 $0 $0 $0 $0 $0 $0 $0 $0 $0 $0 $0 $0 $0 $0 $0 $0 $0 $0 $0 $0 $0 $0
Pre 2006 $0 $0 $0 $0
2006 $0 $0 $0 $0
2007 $0 $0 $0 $0
Post 2007 $0 $0 $0 $0
Unspecified Vintage $0 $0 $0 $0
B Total $0 $0 $0 $0 $0 $0 $0 $0 $0 $0 $0 $0 $0 $0 $0 $0 $0 $0 $0 $0 $0 $0 $0
Pre 2006 $0 $0 $0 $0
2006 $0 $0 $0 $0
2007 $0 $0 $0 $0
Post 2007 $0 $0 $0 $0
Unspecified Vintage $0 $0 $0 $0
<B Total $0 $0 $0 $0 $0 $0 $0 $0 $0 $0 $0 $0 $0 $0 $0 $0 $0 $0 $0 $0 $0 $0 $0
Pre 2006 $0 $0 $0 $0
2006 $0 $0 $0 $0
2007 $0 $0 $0 $0
Post 2007 $0 $0 $0 $0
Unspecified Vintage $0 $0 $0 $0
NR Total $0 $0 $0 $0 $0 $0 $0 $0 $0 $0 $0 $0 $0 $0 $0 $0 $0 $0 $0 $0 $0 $0 $0
Pre 2006 $0 $0 $0 $0
2006 $0 $0 $0 $0
2007 $0 $0 $0 $0
Post 2007 $0 $0 $0 $0
Unspecified Vintage $0 $0 $0 $0
Total $0 $0 $0 $0 $0 $0 $0 $0 $0 $0 $0 $0 $0 $0 $0 $0 $0 $0 $0 $0 $0 $0 $0
Profit/Loss ($MM)
AAA Total $0 $0 $0 $0 $0 $0 $0 $0 $0 $0 $0 $0 $0 $0 $0 $0 $0 $0 $0 $0 $0 $0 $0
Pre 2006 $0 $0 $0 $0
2006 $0 $0 $0 $0
2007 $0 $0 $0 $0
Post 2007 $0 $0 $0 $0
Unspecified Vintage $0 $0 $0 $0
AA Total $0 $0 $0 $0 $0 $0 $0 $0 $0 $0 $0 $0 $0 $0 $0 $0 $0 $0 $0 $0 $0 $0 $0
Pre 2006 $0 $0 $0 $0
2006 $0 $0 $0 $0
2007 $0 $0 $0 $0
Post 2007 $0 $0 $0 $0
Unspecified Vintage $0 $0 $0 $0
A Total $0 $0 $0 $0 $0 $0 $0 $0 $0 $0 $0 $0 $0 $0 $0 $0 $0 $0 $0 $0 $0 $0 $0
Pre 2006 $0 $0 $0 $0
2006 $0 $0 $0 $0
2007 $0 $0 $0 $0
Post 2007 $0 $0 $0 $0
Unspecified Vintage $0 $0 $0 $0
BBB Total $0 $0 $0 $0 $0 $0 $0 $0 $0 $0 $0 $0 $0 $0 $0 $0 $0 $0 $0 $0 $0 $0 $0
Pre 2006 $0 $0 $0 $0
2006 $0 $0 $0 $0
2007 $0 $0 $0 $0
Post 2007 $0 $0 $0 $0
Unspecified Vintage $0 $0 $0 $0
BB Total $0 $0 $0 $0 $0 $0 $0 $0 $0 $0 $0 $0 $0 $0 $0 $0 $0 $0 $0 $0 $0 $0 $0
Pre 2006 $0 $0 $0 $0
2006 $0 $0 $0 $0
2007 $0 $0 $0 $0
Post 2007 $0 $0 $0 $0
Unspecified Vintage $0 $0 $0 $0
B Total $0 $0 $0 $0 $0 $0 $0 $0 $0 $0 $0 $0 $0 $0 $0 $0 $0 $0 $0 $0 $0 $0 $0
Pre 2006 $0 $0 $0 $0
2006 $0 $0 $0 $0
2007 $0 $0 $0 $0
Post 2007 $0 $0 $0 $0
Unspecified Vintage $0 $0 $0 $0
<B Total $0 $0 $0 $0 $0 $0 $0 $0 $0 $0 $0 $0 $0 $0 $0 $0 $0 $0 $0 $0 $0 $0 $0
Pre 2006 $0 $0 $0 $0
2006 $0 $0 $0 $0
2007 $0 $0 $0 $0
Post 2007 $0 $0 $0 $0
Unspecified Vintage $0 $0 $0 $0
NR Total $0 $0 $0 $0 $0 $0 $0 $0 $0 $0 $0 $0 $0 $0 $0 $0 $0 $0 $0 $0 $0 $0 $0
Pre 2006 $0 $0 $0 $0
2006 $0 $0 $0 $0
2007 $0 $0 $0 $0
Post 2007 $0 $0 $0 $0
Unspecified Vintage $0 $0 $0 $0
Total $0 $0 $0 $0 $0 $0 $0 $0 $0 $0 $0 $0 $0 $0 $0 $0 $0 $0 $0 $0 $0 $0 $0
Corporate CDO / CLO Warehouse
FHLBank Dodd-Frank Stress Test Template
(Disclosure to FHFA ONLY)
Grand
Total
ABS CMBS
Page 121
121 | P a g e
Trading and Other Fair Value Assets
Munis (Severely Adverse)
Bonds
AAA
AA
A
BBB
BB
B
<B
NR
Bonds Total $0 $0 $0 $0
1M
3M
6M
9M
1Y
2Y
3Y
5Y
7Y
10Y
15Y
20Y
30Y
Bonds Total $0 $0 $0 $0
Loans
AAA
AA
A
BBB
BB
B
<B
NR
Loans Total $0 $0 $0 $0
1M
3M
6M
9M
1Y
2Y
3Y
5Y
7Y
10Y
15Y
20Y
30Y
Loans Total $0 $0 $0 $0
CDS
AAA
AA
A
BBB
BB
B
<B
NR
CDS Total $0 $0 $0 $0
1M
3M
6M
9M
1Y
2Y
3Y
5Y
7Y
10Y
15Y
20Y
30Y
CDS Total $0 $0 $0 $0
MV ($MM)
Available-for-Sale
Securities
MV ($MM)
Trading
Securities
Profit/Loss
from OAS
Widening
(AFS)
Profit/Loss
from OAS
Widening
(Trading Secs)
FHLBank Dodd-Frank Stress Test Template
(Disclosure to FHFA ONLY)
Page 122
122 | P a g e
Trading and Other Fair Value Assets
Munis (Severely Adverse)
Indices
AAA
AA
A
BBB
BB
B
<B
NR
Indices Total $0 $0 $0 $0
1M
3M
6M
9M
1Y
2Y
3Y
5Y
7Y
10Y
15Y
20Y
30Y
Indices Total $0 $0 $0 $0
Other / Unspecified Munis
AAA
AA
A
BBB
BB
B
<B
NR
Other / Unspecified Munis Total $0 $0 $0 $0
1M
3M
6M
9M
1Y
2Y
3Y
5Y
7Y
10Y
15Y
20Y
30Y
Other / Unspecified Munis Total $0 $0 $0 $0
Grand Total
AAA $0 $0 $0 $0
AA $0 $0 $0 $0
A $0 $0 $0 $0
BBB $0 $0 $0 $0
BB $0 $0 $0 $0
B $0 $0 $0 $0
<B $0 $0 $0 $0
NR $0 $0 $0 $0
Grand Total $0 $0 $0 $0
1M $0 $0 $0 $0
3M $0 $0 $0 $0
6M $0 $0 $0 $0
9M $0 $0 $0 $0
1Y $0 $0 $0 $0
2Y $0 $0 $0 $0
3Y $0 $0 $0 $0
5Y $0 $0 $0 $0
7Y $0 $0 $0 $0
10Y $0 $0 $0 $0
15Y $0 $0 $0 $0
20Y $0 $0 $0 $0
30Y $0 $0 $0 $0
Grand Total $0 $0 $0 $0
MV ($MM)
Available-for-Sale
Securities
MV ($MM)
Trading
Securities
Profit/Loss
from OAS
Widening
(AFS)
Profit/Loss
from OAS
Widening
(Trading Secs)
FHLBank Dodd-Frank Stress Test Template
(Disclosure to FHFA ONLY)
Page 123
123 | P a g e
MV ($MM)
Available-for-Sale
Securities
MV ($MM)
Trading
Securities
Profit/Loss
from OAS
Widening
(AFS)
Profit/Loss
from OAS
Widening
(Trading Secs)
FHLBank Dodd-Frank Stress Test Template
(Disclosure to FHFA ONLY)
Trading & Other Fair Value Assets Template
Agencies (Severely Adverse)
US Residential Agency Products
US Commercial Agency Products
Non-US Agency Products
IOs
POs
Other CMOs
Pass-Throughs
Agency Debt/Debentures
IOS Index
POS Index
MBX Index
Other Agency Derivatives
TBA's
Reverse Mortgages
Residential Other / Unspecified
Total $0 $0
$0 $0
Cash Agency CMBS
Agency CMBS Derivatives
Commercial Other / Unspecified
Total $0 $0
$0 $0
AAA
AA
A
BBB
BB
B
<B
NR
Total $0 $0
$0 $0
Page 124
124 | P a g e
Cumulative Projected
Financial Metrics
(Q1 2017 - Q1 2019)
1 Net interest income + other non-interest income, net
2 (Provision) benefit for credit losses on mortgage loans
3 OTTI credit losses
4 Mark-to-market gains (losses)
5 Global market shock impact on trading securities
6 Counterparty default losses
7 AHP assessments
8 Net income (loss)
9 Other comprehensive income (loss)
10 Total comprehensive income (loss)
11 Total capital (GAAP) - starting
12 Total capital (GAAP) - ending
13 Regulatory capital ratio - starting
14 Regulatory capital ratio - ending
FHLBank Dodd-Frank Stress Test Template - SEVERELY ADVERSE
(Disclosure to the Public)
Page 125
125 | P a g e
Appendix 4: Baseline Scenario – Domestic
Date
Real
GDP
growth
Nominal
GDP growth
Real
disposable
income
growth
Nominal
disposable
income
growth
Unemployment
rate
CPI inflation
rate
3-month
Treasury rate
5-year
Treasury yield
10-year
Treasury yield
BBB corporate
yieldMortgage rate Prime rate
Dow Jones
Total Stock
Market Index
(Level)
House Price
Index
(Level)
Commercial
Real Estate
Price Index
(Level)
Market
Volatility
Index
(Level)
2002 Q1 3.7 5.1 10.1 10.9 5.7 1.3 1.7 4.5 5.4 7.6 7.0 4.8 10775.7 120.3 137.4 26.1
2002 Q2 2.2 3.8 2.0 5.2 5.8 3.2 1.7 4.5 5.4 7.6 6.8 4.8 9384.0 123.4 135.8 28.4
2002 Q3 2.0 3.8 -0.5 1.5 5.7 2.2 1.6 3.4 4.5 7.3 6.2 4.8 7773.6 126.5 138.7 45.1
2002 Q4 0.3 2.4 1.9 3.8 5.9 2.4 1.3 3.1 4.3 7.0 6.1 4.5 8343.2 129.2 142.5 42.6
2003 Q1 2.1 4.6 1.1 4.0 5.9 4.2 1.2 2.9 4.2 6.5 5.8 4.3 8051.9 131.8 147.9 34.7
2003 Q2 3.8 5.1 5.9 6.3 6.1 -0.7 1.0 2.6 3.8 5.7 5.5 4.2 9342.4 134.6 149.2 29.1
2003 Q3 6.9 9.3 6.7 9.3 6.1 3.0 0.9 3.1 4.4 6.0 6.1 4.0 9649.7 138.5 147.3 22.7
2003 Q4 4.8 6.8 1.6 3.3 5.8 1.5 0.9 3.2 4.4 5.8 5.9 4.0 10799.6 143.0 145.7 21.1
2004 Q1 2.3 5.9 2.9 6.1 5.7 3.4 0.9 3.0 4.1 5.5 5.6 4.0 11039.4 148.0 152.9 21.6
2004 Q2 3.0 6.6 4.0 7.0 5.6 3.2 1.1 3.7 4.7 6.1 6.2 4.0 11144.6 153.9 160.4 20.0
2004 Q3 3.7 6.3 2.1 4.5 5.4 2.6 1.5 3.5 4.4 5.8 5.9 4.4 10893.8 159.4 171.8 19.3
2004 Q4 3.5 6.4 5.1 8.5 5.4 4.4 2.0 3.5 4.3 5.4 5.7 4.9 11951.5 165.3 175.8 16.6
2005 Q1 4.3 8.3 -3.8 -1.8 5.3 2.0 2.5 3.9 4.4 5.4 5.8 5.4 11637.3 172.2 175.8 14.6
2005 Q2 2.1 5.1 3.2 6.0 5.1 2.7 2.9 3.9 4.2 5.5 5.7 5.9 11856.7 179.0 182.3 17.7
2005 Q3 3.4 7.3 2.1 6.6 5.0 6.2 3.4 4.0 4.3 5.5 5.8 6.4 12282.9 185.2 187.1 14.2
2005 Q4 2.3 5.4 3.4 6.6 5.0 3.8 3.8 4.4 4.6 5.9 6.2 7.0 12497.2 190.7 195.4 16.5
2006 Q1 4.9 8.2 9.5 11.5 4.7 2.1 4.4 4.6 4.7 6.0 6.3 7.4 13121.6 193.9 200.0 14.6
2006 Q2 1.2 4.5 0.6 3.7 4.6 3.7 4.7 5.0 5.2 6.5 6.6 7.9 12808.9 193.1 209.0 23.8
2006 Q3 0.4 3.2 1.2 4.1 4.6 3.8 4.9 4.8 5.0 6.4 6.5 8.3 13322.5 191.6 218.6 18.6
2006 Q4 3.2 4.6 5.3 4.6 4.4 -1.6 4.9 4.6 4.7 6.1 6.2 8.3 14215.8 191.2 217.3 12.7
2007 Q1 0.2 4.8 2.6 6.5 4.5 4.0 5.0 4.6 4.8 6.1 6.2 8.3 14354.0 189.0 227.1 19.6
2007 Q2 3.1 5.4 0.8 4.0 4.5 4.6 4.7 4.7 4.9 6.3 6.4 8.3 15163.1 183.4 236.4 18.9
2007 Q3 2.7 4.2 1.1 3.4 4.7 2.6 4.3 4.5 4.8 6.5 6.5 8.2 15317.8 177.7 249.1 30.8
2007 Q4 1.4 3.2 0.3 4.4 4.8 5.0 3.4 3.8 4.4 6.4 6.2 7.5 14753.6 171.8 251.5 31.1
2008 Q1 -2.7 -0.5 2.9 6.5 5.0 4.4 2.1 2.8 3.9 6.5 5.9 6.2 13284.1 164.5 239.9 32.2
2008 Q2 2.0 4.0 8.7 13.3 5.3 5.3 1.6 3.2 4.1 6.8 6.1 5.1 13016.4 156.6 223.9 24.1
2008 Q3 -1.9 0.8 -8.9 -5.1 6.0 6.3 1.5 3.1 4.1 7.2 6.3 5.0 11826.0 149.2 233.4 46.7
2008 Q4 -8.2 -7.7 2.6 -3.2 6.9 -8.9 0.3 2.2 3.7 9.4 5.8 4.1 9056.7 141.5 222.5 80.9
2009 Q1 -5.4 -4.5 -0.8 -3.0 8.3 -2.7 0.2 1.9 3.2 9.0 5.0 3.3 8044.2 137.2 208.9 56.7
2009 Q2 -0.5 -1.2 2.9 4.7 9.3 2.1 0.2 2.3 3.7 8.2 5.1 3.3 9342.8 137.1 178.5 42.3
2009 Q3 1.3 1.2 -4.3 -1.9 9.6 3.5 0.2 2.5 3.8 6.8 5.1 3.3 10812.8 137.7 154.0 31.3
2009 Q4 3.9 5.2 -0.5 2.2 9.9 3.2 0.1 2.3 3.7 6.1 4.9 3.3 11385.1 138.2 155.2 30.7
2010 Q1 1.7 3.2 0.4 1.8 9.8 0.6 0.1 2.4 3.9 5.8 5.0 3.3 12032.5 138.3 149.8 27.3
2010 Q2 3.9 5.8 5.3 5.8 9.6 -0.1 0.1 2.3 3.6 5.6 4.8 3.3 10645.8 137.4 164.5 45.8
2010 Q3 2.7 4.6 2.0 3.2 9.5 1.2 0.2 1.6 2.9 5.1 4.4 3.3 11814.0 134.7 166.9 32.9
2010 Q4 2.5 4.7 2.8 5.0 9.5 3.3 0.1 1.5 3.0 5.0 4.5 3.3 13131.5 133.5 172.7 23.5
Page 126
126 | P a g e
Appendix 4: Baseline Scenario – Domestic (Cont.)
Date
Real
GDP
growth
Nominal
GDP growth
Real
disposable
income
growth
Nominal
disposable
income
growth
Unemployment
rate
CPI inflation
rate
3-month
Treasury rate
5-year
Treasury yield
10-year
Treasury yield
BBB corporate
yieldMortgage rate Prime rate
Dow Jones
Total Stock
Market Index
(Level)
House Price
Index
(Level)
Commercial
Real Estate
Price Index
(Level)
Market
Volatility
Index
(Level)
2011 Q1 -1.5 0.2 5.0 8.2 9.0 4.3 0.1 2.1 3.5 5.4 4.9 3.3 13908.5 132.3 179.6 29.4
2011 Q2 2.9 6.0 -0.6 3.5 9.1 4.6 0.0 1.8 3.3 5.1 4.6 3.3 13843.5 131.7 177.0 22.7
2011 Q3 0.8 3.3 2.1 4.3 9.0 2.6 0.0 1.1 2.5 4.9 4.2 3.3 11676.5 132.3 177.0 48.0
2011 Q4 4.6 5.2 0.2 1.6 8.6 1.8 0.0 1.0 2.1 5.0 4.0 3.3 13019.3 132.4 188.4 45.5
2012 Q1 2.7 4.9 6.7 9.2 8.3 2.4 0.1 0.9 2.1 4.7 3.9 3.3 14627.5 133.8 188.2 23.0
2012 Q2 1.9 3.8 3.1 4.4 8.2 0.8 0.1 0.8 1.8 4.5 3.8 3.3 14100.2 137.2 189.4 26.7
2012 Q3 0.5 2.7 -0.2 1.1 8.0 1.6 0.1 0.7 1.6 4.2 3.5 3.3 14894.7 139.9 196.6 20.5
2012 Q4 0.1 1.7 10.9 13.3 7.8 2.9 0.1 0.7 1.7 3.9 3.4 3.3 14834.9 142.9 198.3 22.7
2013 Q1 2.8 4.4 -15.7 -14.5 7.7 1.6 0.1 0.8 1.9 4.0 3.5 3.3 16396.2 146.6 202.0 19.0
2013 Q2 0.8 1.6 2.4 2.5 7.5 -0.5 0.1 0.9 2.0 4.1 3.7 3.3 16771.3 150.6 212.6 20.5
2013 Q3 3.1 5.1 2.4 3.9 7.3 2.0 0.0 1.5 2.7 4.9 4.4 3.3 17718.3 154.4 223.9 17.0
2013 Q4 4.0 6.1 0.9 2.6 6.9 1.9 0.1 1.4 2.8 4.8 4.3 3.3 19413.2 157.5 229.2 20.3
2014 Q1 -1.2 0.6 4.5 6.6 6.7 2.4 0.0 1.6 2.8 4.6 4.4 3.3 19711.2 159.6 229.4 21.4
2014 Q2 4.0 6.3 5.3 7.3 6.2 1.9 0.0 1.7 2.7 4.3 4.2 3.3 20568.7 160.8 239.3 17.0
2014 Q3 5.0 6.7 4.1 5.2 6.1 0.9 0.0 1.7 2.5 4.2 4.1 3.3 20458.8 162.9 244.8 17.0
2014 Q4 2.3 2.8 4.3 4.3 5.7 -0.3 0.0 1.6 2.3 4.2 3.9 3.3 21424.6 165.4 253.0 26.3
2015 Q1 2.0 2.1 2.0 0.3 5.6 -2.9 0.0 1.5 2.0 4.0 3.7 3.3 21707.6 167.8 261.6 22.4
2015 Q2 2.6 4.9 3.9 5.8 5.4 2.4 0.0 1.5 2.2 4.2 3.8 3.3 21630.9 169.9 265.5 18.9
2015 Q3 2.0 3.2 3.3 4.4 5.2 1.4 0.0 1.6 2.3 4.5 3.9 3.3 19959.3 172.1 272.1 40.7
2015 Q4 0.9 1.8 3.0 3.4 5.0 0.8 0.1 1.6 2.2 4.6 3.9 3.3 21100.9 174.2 277.3 24.4
2016 Q1 0.8 1.3 2.1 2.4 4.9 -0.3 0.3 1.4 2.0 4.6 3.7 3.5 21179.4 176.6 277.6 28.1
2016 Q2 1.4 3.7 2.9 5.0 4.9 2.5 0.3 1.3 1.8 4.1 3.6 3.5 21621.5 178.8 283.0 25.8
2016 Q3 3.5 5.0 2.6 4.1 4.9 1.6 0.3 1.2 1.6 3.7 3.4 3.5 22468.6 182.0 290.3 18.1
2016 Q4 3.1 6.1 1.6 4.5 4.7 3.4 0.4 1.7 2.2 4.1 3.9 3.5 23276.7 183.3 293.9 22.5
2017 Q1 2.2 4.3 2.2 4.3 4.7 2.4 0.6 1.7 2.5 4.2 4.2 3.8 23551.5 184.3 297.6 19.0
2017 Q2 2.3 4.3 2.5 4.6 4.6 2.4 0.7 1.9 2.6 4.4 4.3 3.9 23830.5 185.4 301.4 20.3
2017 Q3 2.4 4.5 2.9 5.0 4.6 2.3 0.9 2.0 2.7 4.5 4.4 4.1 24123.0 186.6 305.2 19.3
2017 Q4 2.3 4.5 2.7 4.8 4.5 2.3 1.1 2.2 2.9 4.6 4.5 4.3 24421.8 187.8 309.0 19.4
2018 Q1 2.4 4.6 2.9 4.9 4.5 2.3 1.3 2.3 3.0 4.7 4.6 4.4 24726.8 188.9 312.9 19.2
2018 Q2 2.4 4.7 2.6 4.7 4.5 2.3 1.5 2.4 3.1 4.8 4.7 4.6 25042.2 190.1 316.8 19.2
2018 Q3 2.4 4.6 2.6 4.7 4.4 2.3 1.7 2.6 3.2 4.9 4.8 4.8 25354.2 191.3 320.8 19.3
2018 Q4 2.3 4.5 2.4 4.6 4.4 2.4 1.9 2.7 3.3 5.0 5.0 5.0 25667.6 192.5 324.9 19.4
2019 Q1 2.0 4.2 2.2 4.3 4.5 2.3 2.2 2.8 3.4 5.1 5.0 5.2 25967.5 194.0 327.3 19.8
2019 Q2 2.1 4.2 2.3 4.3 4.6 2.3 2.4 2.9 3.4 5.1 5.1 5.5 26268.6 195.4 329.8 20.0
2019 Q3 2.1 4.1 2.2 4.3 4.6 2.2 2.6 2.9 3.5 5.2 5.1 5.7 26570.7 196.9 332.3 20.2
2019 Q4 2.0 4.1 2.2 4.2 4.7 2.2 2.8 3.0 3.5 5.2 5.2 5.9 26874.3 198.4 334.8 20.3
2020 Q1 2.0 4.0 2.1 4.0 4.7 2.1 2.9 3.0 3.5 5.2 5.2 5.9 27172.8 199.9 337.3 20.2
Page 127
127 | P a g e
Appendix 5: Baseline Scenario – International
DateEuro area real
GDP growth
Euro area
inflation
Euro area
bilateral dollar
exchange rate
(USD/euro)
Developing
Asia real GDP
growth
Developing
Asia inflation
Developing
Asia bilateral
dollar
exchange rate
(F/USD, index)
Japan real
GDP growthJapan inflation
Japan bilateral
dollar exchange
rate (yen/USD)
U.K. real GDP
growthU.K. inflation
U.K. bilateral
dollar
exchange rate
(USD/pound)
2002 Q1 0.7 3.1 0.9 7.7 0.4 107.3 0.3 -2.7 132.7 1.7 2.0 1.4
2002 Q2 1.9 2.0 1.0 8.1 1.1 104.8 3.2 1.7 119.9 3.0 0.9 1.5
2002 Q3 1.6 1.6 1.0 7.2 1.5 105.5 1.7 -0.7 121.7 3.1 1.3 1.6
2002 Q4 0.4 2.3 1.0 6.5 0.8 104.5 1.5 -0.4 118.8 3.5 1.9 1.6
2003 Q1 -0.8 3.3 1.1 6.7 3.6 105.5 -1.2 -1.6 118.1 3.3 1.7 1.6
2003 Q2 0.2 0.5 1.2 2.1 1.2 104.0 3.8 1.7 119.9 3.7 0.2 1.7
2003 Q3 2.2 2.1 1.2 14.3 0.1 102.6 1.7 -0.7 111.4 4.0 1.7 1.7
2003 Q4 2.9 2.3 1.3 13.0 5.5 103.4 4.3 -0.6 107.1 3.3 1.7 1.8
2004 Q1 2.4 2.2 1.2 5.6 4.1 101.4 3.5 -0.9 104.2 2.3 1.4 1.8
2004 Q2 2.1 2.6 1.2 6.9 4.1 102.8 -0.3 1.1 109.4 1.9 0.8 1.8
2004 Q3 1.3 2.0 1.2 8.3 4.0 102.7 1.9 0.1 110.2 0.8 1.1 1.8
2004 Q4 1.4 2.4 1.4 6.4 0.8 98.9 -1.6 1.7 102.7 2.4 2.4 1.9
2005 Q1 0.8 1.4 1.3 10.6 2.9 98.6 2.2 -2.7 107.2 2.3 2.6 1.9
2005 Q2 2.6 2.2 1.2 8.6 1.5 98.9 3.6 -1.0 110.9 4.4 1.8 1.8
2005 Q3 3.1 3.1 1.2 9.3 2.3 98.6 3.9 -1.0 113.3 4.4 2.8 1.8
2005 Q4 2.5 2.5 1.2 11.7 1.7 98.1 0.7 0.2 117.9 5.5 1.4 1.7
2006 Q1 3.7 1.7 1.2 11.0 2.4 96.8 0.2 1.2 117.5 1.3 1.9 1.7
2006 Q2 4.2 2.5 1.3 7.0 3.2 96.7 1.7 0.4 114.5 0.9 3.0 1.8
2006 Q3 2.6 2.1 1.3 10.3 2.1 96.4 -0.7 0.4 118.0 0.6 3.3 1.9
2006 Q4 4.4 0.9 1.3 11.2 3.7 94.6 4.5 -0.6 119.0 1.4 2.7 2.0
2007 Q1 3.1 2.3 1.3 13.9 3.6 94.0 3.6 -0.7 117.6 4.1 2.5 2.0
2007 Q2 2.5 2.3 1.4 10.5 4.9 91.9 -0.4 0.4 123.4 3.0 1.8 2.0
2007 Q3 1.8 2.1 1.4 8.7 7.5 90.6 -1.2 0.3 115.0 3.1 0.3 2.0
2007 Q4 2.2 4.9 1.5 12.8 6.0 89.4 1.9 2.2 111.7 3.0 4.0 2.0
2008 Q1 2.0 4.3 1.6 7.2 8.1 88.0 1.6 1.3 99.9 0.6 3.4 2.0
2008 Q2 -1.3 3.2 1.6 5.9 6.4 88.7 -2.8 1.8 106.2 -2.6 5.8 2.0
2008 Q3 -2.2 3.2 1.4 3.1 2.8 91.5 -4.8 3.5 105.9 -6.6 5.9 1.8
2008 Q4 -6.8 -1.4 1.4 0.3 -1.0 92.2 -8.3 -2.1 90.8 -8.7 0.4 1.5
2009 Q1 -11.4 -1.1 1.3 4.4 -1.4 94.2 -18.0 -3.6 99.2 -6.4 -0.2 1.4
2009 Q2 -0.9 0.0 1.4 15.1 2.2 92.2 8.2 -1.6 96.4 -0.9 2.3 1.6
2009 Q3 1.2 1.1 1.5 12.8 3.9 91.3 -0.3 -1.4 89.5 0.3 3.6 1.6
2009 Q4 2.1 1.6 1.4 9.2 5.1 90.6 6.1 -1.6 93.1 1.6 2.8 1.6
2010 Q1 1.8 1.8 1.4 9.9 4.4 89.8 4.4 1.1 93.4 2.2 4.2 1.5
2010 Q2 4.0 2.0 1.2 9.7 3.4 91.0 4.0 -1.4 88.5 4.1 3.3 1.5
2010 Q3 1.6 1.6 1.4 8.8 4.0 88.4 7.7 -2.1 83.5 2.3 2.2 1.6
2010 Q4 2.3 2.6 1.3 9.3 7.7 87.4 -2.7 1.4 81.7 0.5 3.9 1.5
Page 128
128 | P a g e
Appendix 5: Baseline Scenario – International (Cont.)
DateEuro area real
GDP growth
Euro area
inflation
Euro area
bilateral dollar
exchange rate
(USD/euro)
Developing
Asia real GDP
growth
Developing
Asia inflation
Developing
Asia bilateral
dollar
exchange rate
(F/USD, index)
Japan real
GDP growthJapan inflation
Japan bilateral
dollar exchange
rate (yen/USD)
U.K. real GDP
growthU.K. inflation
U.K. bilateral
dollar
exchange rate
(USD/pound)
2011 Q1 3.2 3.7 1.4 9.8 6.3 86.4 -5.7 0.0 82.8 2.2 7.0 1.6
2011 Q2 0.0 3.2 1.5 6.5 5.4 85.3 -2.0 -0.8 80.6 0.3 4.6 1.6
2011 Q3 0.1 1.3 1.3 5.2 5.1 87.3 9.5 0.3 77.0 1.7 3.5 1.6
2011 Q4 -1.4 3.5 1.3 6.9 3.2 87.2 -0.5 -0.7 77.0 1.0 3.4 1.6
2012 Q1 -0.8 2.8 1.3 7.3 3.3 86.2 4.4 2.5 82.4 1.8 2.3 1.6
2012 Q2 -1.3 2.3 1.3 6.0 3.9 88.0 -1.6 -1.6 79.8 -0.3 1.9 1.6
2012 Q3 -0.6 1.6 1.3 6.5 2.1 86.3 -1.8 -1.8 77.9 4.7 2.0 1.6
2012 Q4 -1.7 2.4 1.3 7.3 3.6 85.9 0.3 0.3 86.6 -0.9 4.2 1.6
2013 Q1 -1.2 1.3 1.3 6.6 4.3 86.1 5.1 0.6 94.2 2.5 3.0 1.5
2013 Q2 1.8 0.4 1.3 6.5 2.9 87.1 4.3 -0.2 99.2 2.1 1.6 1.5
2013 Q3 1.3 1.2 1.4 7.8 3.7 86.7 2.4 2.4 98.3 3.1 2.0 1.6
2013 Q4 0.8 0.3 1.4 6.4 4.0 85.7 -0.8 3.1 105.3 2.0 1.7 1.7
2014 Q1 1.3 0.9 1.4 6.4 1.4 86.8 4.9 1.3 103.0 3.4 1.9 1.7
2014 Q2 0.7 -0.1 1.4 7.0 2.5 86.7 -7.1 7.7 101.3 3.8 1.5 1.7
2014 Q3 1.4 0.2 1.3 6.9 2.4 87.0 -0.8 1.6 109.7 3.3 0.6 1.6
2014 Q4 1.8 -0.4 1.2 5.6 1.2 88.1 2.1 -0.3 119.9 3.4 -0.4 1.6
2015 Q1 3.3 -0.8 1.1 6.2 0.8 88.1 6.3 0.4 120.0 1.0 -1.2 1.5
2015 Q2 1.5 1.8 1.1 6.6 2.7 88.3 -0.5 0.3 122.1 1.9 0.9 1.6
2015 Q3 1.1 -0.3 1.1 6.6 2.7 90.9 0.8 0.0 119.8 1.1 0.5 1.5
2015 Q4 2.0 0.0 1.1 5.4 1.6 92.2 -1.8 0.1 120.3 2.8 0.0 1.5
2016 Q1 2.0 -1.2 1.1 6.3 2.8 91.7 2.8 -0.1 112.4 1.4 0.1 1.4
2016 Q2 1.2 1.2 1.1 6.4 2.7 94.0 1.8 -1.3 102.8 2.6 0.9 1.3
2016 Q3 1.8 1.1 1.1 6.6 1.2 93.6 1.3 -0.8 101.2 2.3 1.9 1.3
2016 Q4 1.4 1.9 1.1 6.0 2.5 97.4 0.8 0.3 116.8 1.4 2.0 1.2
2017 Q1 1.5 1.3 1.1 6.0 2.4 97.9 0.9 0.5 116.4 1.2 1.9 1.2
2017 Q2 1.5 1.4 1.0 5.9 2.5 98.4 0.9 0.6 116.0 1.1 2.0 1.2
2017 Q3 1.6 1.5 1.0 5.9 2.6 98.9 0.9 0.8 115.6 1.0 2.1 1.2
2017 Q4 1.6 1.5 1.0 5.8 2.6 99.4 0.9 0.9 115.2 1.1 2.2 1.2
2018 Q1 1.6 1.5 1.0 5.8 2.6 99.7 0.9 1.1 115.6 1.3 2.2 1.2
2018 Q2 1.6 1.6 1.0 5.7 2.6 100.0 0.8 1.2 116.1 1.4 2.2 1.2
2018 Q3 1.5 1.6 1.0 5.7 2.6 100.3 0.8 1.3 116.5 1.6 2.2 1.2
2018 Q4 1.5 1.6 1.0 5.8 2.7 100.6 0.8 1.3 117.0 1.7 2.1 1.3
2019 Q1 1.5 1.7 1.0 5.8 2.7 100.6 0.8 1.4 117.0 1.8 2.1 1.3
2019 Q2 1.5 1.7 1.0 5.9 2.8 100.6 0.8 1.5 117.0 1.8 2.0 1.3
2019 Q3 1.5 1.7 1.0 5.9 2.9 100.6 0.8 1.5 117.0 1.9 2.0 1.3
2019 Q4 1.5 1.8 1.0 5.8 2.9 100.6 0.8 1.6 117.0 1.9 2.0 1.3
2020 Q1 1.5 1.8 1.0 5.8 3.0 100.6 0.8 1.6 117.0 1.9 1.9 1.3
Page 129
129 | P a g e
Appendix 6: Adverse Scenario – Domestic
DateReal GDP
growth
Nominal GDP
growth
Real
disposable
income
growth
Nominal
disposable
income
growth
Unemployment
rate
CPI inflation
rate
3-month
Treasury rate
5-year
Treasury yield
10-year
Treasury yield
BBB corporate
yieldMortgage rate Prime rate
Dow Jones
Total Stock
Market Index
(Level)
House Price
Index
(Level)
Commercial
Real Estate
Price Index
(Level)
Market
Volatility
Index
(Level)
2002 Q1 3.7 5.1 10.1 10.9 5.7 1.3 1.7 4.5 5.4 7.6 7.0 4.8 10775.7 120.3 137.4 26.1
2002 Q2 2.2 3.8 2.0 5.2 5.8 3.2 1.7 4.5 5.4 7.6 6.8 4.8 9384.0 123.4 135.8 28.4
2002 Q3 2.0 3.8 -0.5 1.5 5.7 2.2 1.6 3.4 4.5 7.3 6.2 4.8 7773.6 126.5 138.7 45.1
2002 Q4 0.3 2.4 1.9 3.8 5.9 2.4 1.3 3.1 4.3 7.0 6.1 4.5 8343.2 129.2 142.5 42.6
2003 Q1 2.1 4.6 1.1 4.0 5.9 4.2 1.2 2.9 4.2 6.5 5.8 4.3 8051.9 131.8 147.9 34.7
2003 Q2 3.8 5.1 5.9 6.3 6.1 -0.7 1.0 2.6 3.8 5.7 5.5 4.2 9342.4 134.6 149.2 29.1
2003 Q3 6.9 9.3 6.7 9.3 6.1 3.0 0.9 3.1 4.4 6.0 6.1 4.0 9649.7 138.5 147.3 22.7
2003 Q4 4.8 6.8 1.6 3.3 5.8 1.5 0.9 3.2 4.4 5.8 5.9 4.0 10799.6 143.0 145.7 21.1
2004 Q1 2.3 5.9 2.9 6.1 5.7 3.4 0.9 3.0 4.1 5.5 5.6 4.0 11039.4 148.0 152.9 21.6
2004 Q2 3.0 6.6 4.0 7.0 5.6 3.2 1.1 3.7 4.7 6.1 6.2 4.0 11144.6 153.9 160.4 20.0
2004 Q3 3.7 6.3 2.1 4.5 5.4 2.6 1.5 3.5 4.4 5.8 5.9 4.4 10893.8 159.4 171.8 19.3
2004 Q4 3.5 6.4 5.1 8.5 5.4 4.4 2.0 3.5 4.3 5.4 5.7 4.9 11951.5 165.3 175.8 16.6
2005 Q1 4.3 8.3 -3.8 -1.8 5.3 2.0 2.5 3.9 4.4 5.4 5.8 5.4 11637.3 172.2 175.8 14.6
2005 Q2 2.1 5.1 3.2 6.0 5.1 2.7 2.9 3.9 4.2 5.5 5.7 5.9 11856.7 179.0 182.3 17.7
2005 Q3 3.4 7.3 2.1 6.6 5.0 6.2 3.4 4.0 4.3 5.5 5.8 6.4 12282.9 185.2 187.1 14.2
2005 Q4 2.3 5.4 3.4 6.6 5.0 3.8 3.8 4.4 4.6 5.9 6.2 7.0 12497.2 190.7 195.4 16.5
2006 Q1 4.9 8.2 9.5 11.5 4.7 2.1 4.4 4.6 4.7 6.0 6.3 7.4 13121.6 193.9 200.0 14.6
2006 Q2 1.2 4.5 0.6 3.7 4.6 3.7 4.7 5.0 5.2 6.5 6.6 7.9 12808.9 193.1 209.0 23.8
2006 Q3 0.4 3.2 1.2 4.1 4.6 3.8 4.9 4.8 5.0 6.4 6.5 8.3 13322.5 191.6 218.6 18.6
2006 Q4 3.2 4.6 5.3 4.6 4.4 -1.6 4.9 4.6 4.7 6.1 6.2 8.3 14215.8 191.2 217.3 12.7
2007 Q1 0.2 4.8 2.6 6.5 4.5 4.0 5.0 4.6 4.8 6.1 6.2 8.3 14354.0 189.0 227.1 19.6
2007 Q2 3.1 5.4 0.8 4.0 4.5 4.6 4.7 4.7 4.9 6.3 6.4 8.3 15163.1 183.4 236.4 18.9
2007 Q3 2.7 4.2 1.1 3.4 4.7 2.6 4.3 4.5 4.8 6.5 6.5 8.2 15317.8 177.7 249.1 30.8
2007 Q4 1.4 3.2 0.3 4.4 4.8 5.0 3.4 3.8 4.4 6.4 6.2 7.5 14753.6 171.8 251.5 31.1
2008 Q1 -2.7 -0.5 2.9 6.5 5.0 4.4 2.1 2.8 3.9 6.5 5.9 6.2 13284.1 164.5 239.9 32.2
2008 Q2 2.0 4.0 8.7 13.3 5.3 5.3 1.6 3.2 4.1 6.8 6.1 5.1 13016.4 156.6 223.9 24.1
2008 Q3 -1.9 0.8 -8.9 -5.1 6.0 6.3 1.5 3.1 4.1 7.2 6.3 5.0 11826.0 149.2 233.4 46.7
2008 Q4 -8.2 -7.7 2.6 -3.2 6.9 -8.9 0.3 2.2 3.7 9.4 5.8 4.1 9056.7 141.5 222.5 80.9
2009 Q1 -5.4 -4.5 -0.8 -3.0 8.3 -2.7 0.2 1.9 3.2 9.0 5.0 3.3 8044.2 137.2 208.9 56.7
2009 Q2 -0.5 -1.2 2.9 4.7 9.3 2.1 0.2 2.3 3.7 8.2 5.1 3.3 9342.8 137.1 178.5 42.3
2009 Q3 1.3 1.2 -4.3 -1.9 9.6 3.5 0.2 2.5 3.8 6.8 5.1 3.3 10812.8 137.7 154.0 31.3
2009 Q4 3.9 5.2 -0.5 2.2 9.9 3.2 0.1 2.3 3.7 6.1 4.9 3.3 11385.1 138.2 155.2 30.7
2010 Q1 1.7 3.2 0.4 1.8 9.8 0.6 0.1 2.4 3.9 5.8 5.0 3.3 12032.5 138.3 149.8 27.3
2010 Q2 3.9 5.8 5.3 5.8 9.6 -0.1 0.1 2.3 3.6 5.6 4.8 3.3 10645.8 137.4 164.5 45.8
2010 Q3 2.7 4.6 2.0 3.2 9.5 1.2 0.2 1.6 2.9 5.1 4.4 3.3 11814.0 134.7 166.9 32.9
2010 Q4 2.5 4.7 2.8 5.0 9.5 3.3 0.1 1.5 3.0 5.0 4.5 3.3 13131.5 133.5 172.7 23.5
Page 130
130 | P a g e
Appendix 6: Adverse Scenario – Domestic (Cont.)
DateReal GDP
growth
Nominal GDP
growth
Real
disposable
income
growth
Nominal
disposable
income
growth
Unemployment
rate
CPI inflation
rate
3-month
Treasury rate
5-year
Treasury yield
10-year
Treasury yield
BBB corporate
yieldMortgage rate Prime rate
Dow Jones
Total Stock
Market Index
(Level)
House Price
Index
(Level)
Commercial
Real Estate
Price Index
(Level)
Market
Volatility
Index
(Level)
2011 Q1 -1.5 0.2 5.0 8.2 9.0 4.3 0.1 2.1 3.5 5.4 4.9 3.3 13908.5 132.3 179.6 29.4
2011 Q2 2.9 6.0 -0.6 3.5 9.1 4.6 0.0 1.8 3.3 5.1 4.6 3.3 13843.5 131.7 177.0 22.7
2011 Q3 0.8 3.3 2.1 4.3 9.0 2.6 0.0 1.1 2.5 4.9 4.2 3.3 11676.5 132.3 177.0 48.0
2011 Q4 4.6 5.2 0.2 1.6 8.6 1.8 0.0 1.0 2.1 5.0 4.0 3.3 13019.3 132.4 188.4 45.5
2012 Q1 2.7 4.9 6.7 9.2 8.3 2.4 0.1 0.9 2.1 4.7 3.9 3.3 14627.5 133.8 188.2 23.0
2012 Q2 1.9 3.8 3.1 4.4 8.2 0.8 0.1 0.8 1.8 4.5 3.8 3.3 14100.2 137.2 189.4 26.7
2012 Q3 0.5 2.7 -0.2 1.1 8.0 1.6 0.1 0.7 1.6 4.2 3.5 3.3 14894.7 139.9 196.6 20.5
2012 Q4 0.1 1.7 10.9 13.3 7.8 2.9 0.1 0.7 1.7 3.9 3.4 3.3 14834.9 142.9 198.3 22.7
2013 Q1 2.8 4.4 -15.7 -14.5 7.7 1.6 0.1 0.8 1.9 4.0 3.5 3.3 16396.2 146.6 202.0 19.0
2013 Q2 0.8 1.6 2.4 2.5 7.5 -0.5 0.1 0.9 2.0 4.1 3.7 3.3 16771.3 150.6 212.6 20.5
2013 Q3 3.1 5.1 2.4 3.9 7.3 2.0 0.0 1.5 2.7 4.9 4.4 3.3 17718.3 154.4 223.9 17.0
2013 Q4 4.0 6.1 0.9 2.6 6.9 1.9 0.1 1.4 2.8 4.8 4.3 3.3 19413.2 157.5 229.2 20.3
2014 Q1 -1.2 0.6 4.5 6.6 6.7 2.4 0.0 1.6 2.8 4.6 4.4 3.3 19711.2 159.6 229.4 21.4
2014 Q2 4.0 6.3 5.3 7.3 6.2 1.9 0.0 1.7 2.7 4.3 4.2 3.3 20568.7 160.8 239.3 17.0
2014 Q3 5.0 6.7 4.1 5.2 6.1 0.9 0.0 1.7 2.5 4.2 4.1 3.3 20458.8 162.9 244.8 17.0
2014 Q4 2.3 2.8 4.3 4.3 5.7 -0.3 0.0 1.6 2.3 4.2 3.9 3.3 21424.6 165.4 253.0 26.3
2015 Q1 2.0 2.1 2.0 0.3 5.6 -2.9 0.0 1.5 2.0 4.0 3.7 3.3 21707.6 167.8 261.6 22.4
2015 Q2 2.6 4.9 3.9 5.8 5.4 2.4 0.0 1.5 2.2 4.2 3.8 3.3 21630.9 169.9 265.5 18.9
2015 Q3 2.0 3.2 3.3 4.4 5.2 1.4 0.0 1.6 2.3 4.5 3.9 3.3 19959.3 172.1 272.1 40.7
2015 Q4 0.9 1.8 3.0 3.4 5.0 0.8 0.1 1.6 2.2 4.6 3.9 3.3 21100.9 174.2 277.3 24.4
2016 Q1 0.8 1.3 2.1 2.4 4.9 -0.3 0.3 1.4 2.0 4.6 3.7 3.5 21179.4 176.6 277.6 28.1
2016 Q2 1.4 3.7 2.9 5.0 4.9 2.5 0.3 1.3 1.8 4.1 3.6 3.5 21621.5 178.8 283.0 25.8
2016 Q3 3.5 5.0 2.6 4.1 4.9 1.6 0.3 1.2 1.6 3.7 3.4 3.5 22468.6 182.0 290.3 18.1
2016 Q4 3.1 6.1 1.6 4.5 4.7 3.4 0.4 1.7 2.2 4.1 3.9 3.5 23276.7 183.3 293.9 22.5
2017 Q1 -1.5 0.9 0.7 2.4 5.2 1.8 0.1 1.7 2.3 5.6 4.7 3.3 15959.6 181.4 291.2 37.1
2017 Q2 -2.8 -0.7 -0.6 1.1 5.8 1.8 0.1 1.8 2.4 5.9 4.9 3.3 15042.3 179.0 283.1 32.7
2017 Q3 -2.0 0.0 -0.5 1.1 6.3 1.8 0.1 1.8 2.5 6.1 5.1 3.3 14289.9 176.1 275.2 34.4
2017 Q4 -1.5 0.5 -0.5 1.2 6.8 1.8 0.1 1.9 2.5 6.2 5.2 3.2 13982.2 173.0 267.1 32.0
2018 Q1 -0.5 1.4 0.2 1.9 7.1 1.8 0.1 1.9 2.6 6.0 5.2 3.2 14367.4 170.1 259.4 28.5
2018 Q2 1.0 3.0 0.6 2.4 7.3 2.0 0.1 1.9 2.7 5.8 5.2 3.2 15001.0 166.3 254.2 25.8
2018 Q3 1.4 3.3 1.0 2.7 7.4 2.0 0.1 2.0 2.7 5.6 5.1 3.2 15692.9 163.1 249.5 23.6
2018 Q4 2.6 4.4 1.5 3.4 7.3 2.1 0.1 2.0 2.7 5.4 5.1 3.2 16603.2 160.9 249.1 21.6
2019 Q1 2.6 4.3 1.6 3.5 7.2 2.1 0.1 2.0 2.7 5.2 5.0 3.2 17519.5 160.6 249.3 20.1
2019 Q2 3.0 4.6 2.1 3.8 7.1 2.0 0.1 2.0 2.7 5.0 4.9 3.2 18513.7 161.0 251.4 18.7
2019 Q3 3.0 4.5 2.2 3.8 7.0 2.0 0.1 2.0 2.7 4.8 4.8 3.2 19242.6 161.8 254.9 18.2
2019 Q4 3.0 4.5 2.1 3.8 6.9 1.9 0.1 2.0 2.7 4.7 4.8 3.2 20025.4 162.9 258.6 17.6
2020 Q1 3.0 4.5 2.0 3.5 6.8 1.8 0.1 2.0 2.7 4.5 4.7 3.2 20867.0 164.5 262.2 17.3
Page 131
131 | P a g e
Appendix 7: Adverse Scenario – International
DateEuro area real
GDP growth
Euro area
inflation
Euro area
bilateral dollar
exchange rate
(USD/euro)
Developing
Asia real GDP
growth
Developing
Asia inflation
Developing
Asia bilateral
dollar
exchange rate
(F/USD, index)
Japan real
GDP growthJapan inflation
Japan bilateral
dollar exchange
rate (yen/USD)
U.K. real GDP
growthU.K. inflation
U.K. bilateral
dollar
exchange rate
(USD/pound)
2002 Q1 0.7 3.1 0.9 7.7 0.4 107.3 0.3 -2.7 132.7 1.7 2.0 1.4
2002 Q2 1.9 2.0 1.0 8.1 1.1 104.8 3.2 1.7 119.9 3.0 0.9 1.5
2002 Q3 1.6 1.6 1.0 7.2 1.5 105.5 1.7 -0.7 121.7 3.1 1.3 1.6
2002 Q4 0.4 2.3 1.0 6.5 0.8 104.5 1.5 -0.4 118.8 3.5 1.9 1.6
2003 Q1 -0.8 3.3 1.1 6.7 3.6 105.5 -1.2 -1.6 118.1 3.3 1.7 1.6
2003 Q2 0.2 0.5 1.2 2.1 1.2 104.0 3.8 1.7 119.9 3.7 0.2 1.7
2003 Q3 2.2 2.1 1.2 14.3 0.1 102.6 1.7 -0.7 111.4 4.0 1.7 1.7
2003 Q4 2.9 2.3 1.3 13.0 5.5 103.4 4.3 -0.6 107.1 3.3 1.7 1.8
2004 Q1 2.4 2.2 1.2 5.6 4.1 101.4 3.5 -0.9 104.2 2.3 1.4 1.8
2004 Q2 2.1 2.6 1.2 6.9 4.1 102.8 -0.3 1.1 109.4 1.9 0.8 1.8
2004 Q3 1.3 2.0 1.2 8.3 4.0 102.7 1.9 0.1 110.2 0.8 1.1 1.8
2004 Q4 1.4 2.4 1.4 6.4 0.8 98.9 -1.6 1.7 102.7 2.4 2.4 1.9
2005 Q1 0.8 1.4 1.3 10.6 2.9 98.6 2.2 -2.7 107.2 2.3 2.6 1.9
2005 Q2 2.6 2.2 1.2 8.6 1.5 98.9 3.6 -1.0 110.9 4.4 1.8 1.8
2005 Q3 3.1 3.1 1.2 9.3 2.3 98.6 3.9 -1.0 113.3 4.4 2.8 1.8
2005 Q4 2.5 2.5 1.2 11.7 1.7 98.1 0.7 0.2 117.9 5.5 1.4 1.7
2006 Q1 3.7 1.7 1.2 11.0 2.4 96.8 0.2 1.2 117.5 1.3 1.9 1.7
2006 Q2 4.2 2.5 1.3 7.0 3.2 96.7 1.7 0.4 114.5 0.9 3.0 1.8
2006 Q3 2.6 2.1 1.3 10.3 2.1 96.4 -0.7 0.4 118.0 0.6 3.3 1.9
2006 Q4 4.4 0.9 1.3 11.2 3.7 94.6 4.5 -0.6 119.0 1.4 2.7 2.0
2007 Q1 3.1 2.3 1.3 13.9 3.6 94.0 3.6 -0.7 117.6 4.1 2.5 2.0
2007 Q2 2.5 2.3 1.4 10.5 4.9 91.9 -0.4 0.4 123.4 3.0 1.8 2.0
2007 Q3 1.8 2.1 1.4 8.7 7.5 90.6 -1.2 0.3 115.0 3.1 0.3 2.0
2007 Q4 2.2 4.9 1.5 12.8 6.0 89.4 1.9 2.2 111.7 3.0 4.0 2.0
2008 Q1 2.0 4.3 1.6 7.2 8.1 88.0 1.6 1.3 99.9 0.6 3.4 2.0
2008 Q2 -1.3 3.2 1.6 5.9 6.4 88.7 -2.8 1.8 106.2 -2.6 5.8 2.0
2008 Q3 -2.2 3.2 1.4 3.1 2.8 91.5 -4.8 3.5 105.9 -6.6 5.9 1.8
2008 Q4 -6.8 -1.4 1.4 0.3 -1.0 92.2 -8.3 -2.1 90.8 -8.7 0.4 1.5
2009 Q1 -11.4 -1.1 1.3 4.4 -1.4 94.2 -18.0 -3.6 99.2 -6.4 -0.2 1.4
2009 Q2 -0.9 0.0 1.4 15.1 2.2 92.2 8.2 -1.6 96.4 -0.9 2.3 1.6
2009 Q3 1.2 1.1 1.5 12.8 3.9 91.3 -0.3 -1.4 89.5 0.3 3.6 1.6
2009 Q4 2.1 1.6 1.4 9.2 5.1 90.6 6.1 -1.6 93.1 1.6 2.8 1.6
2010 Q1 1.8 1.8 1.4 9.9 4.4 89.8 4.4 1.1 93.4 2.2 4.2 1.5
2010 Q2 4.0 2.0 1.2 9.7 3.4 91.0 4.0 -1.4 88.5 4.1 3.3 1.5
2010 Q3 1.6 1.6 1.4 8.8 4.0 88.4 7.7 -2.1 83.5 2.3 2.2 1.6
2010 Q4 2.3 2.6 1.3 9.3 7.7 87.4 -2.7 1.4 81.7 0.5 3.9 1.5
Page 132
132 | P a g e
Appendix 7: Adverse Scenario – International (Cont.)
DateEuro area real
GDP growth
Euro area
inflation
Euro area
bilateral dollar
exchange rate
(USD/euro)
Developing
Asia real GDP
growth
Developing
Asia inflation
Developing
Asia bilateral
dollar
exchange rate
(F/USD, index)
Japan real
GDP growthJapan inflation
Japan bilateral
dollar exchange
rate (yen/USD)
U.K. real GDP
growthU.K. inflation
U.K. bilateral
dollar
exchange rate
(USD/pound)
2011 Q1 3.2 3.7 1.4 9.8 6.3 86.4 -5.7 0.0 82.8 2.2 7.0 1.6
2011 Q2 0.0 3.2 1.5 6.5 5.4 85.3 -2.0 -0.8 80.6 0.3 4.6 1.6
2011 Q3 0.1 1.3 1.3 5.2 5.1 87.3 9.5 0.3 77.0 1.7 3.5 1.6
2011 Q4 -1.4 3.5 1.3 6.9 3.2 87.2 -0.5 -0.7 77.0 1.0 3.4 1.6
2012 Q1 -0.8 2.8 1.3 7.3 3.3 86.2 4.4 2.5 82.4 1.8 2.3 1.6
2012 Q2 -1.3 2.3 1.3 6.0 3.9 88.0 -1.6 -1.6 79.8 -0.3 1.9 1.6
2012 Q3 -0.6 1.6 1.3 6.5 2.1 86.3 -1.8 -1.8 77.9 4.7 2.0 1.6
2012 Q4 -1.7 2.4 1.3 7.3 3.6 85.9 0.3 0.3 86.6 -0.9 4.2 1.6
2013 Q1 -1.2 1.3 1.3 6.6 4.3 86.1 5.1 0.6 94.2 2.5 3.0 1.5
2013 Q2 1.8 0.4 1.3 6.5 2.9 87.1 4.3 -0.2 99.2 2.1 1.6 1.5
2013 Q3 1.3 1.2 1.4 7.8 3.7 86.7 2.4 2.4 98.3 3.1 2.0 1.6
2013 Q4 0.8 0.3 1.4 6.4 4.0 85.7 -0.8 3.1 105.3 2.0 1.7 1.7
2014 Q1 1.3 0.9 1.4 6.4 1.4 86.8 4.9 1.3 103.0 3.4 1.9 1.7
2014 Q2 0.7 -0.1 1.4 7.0 2.5 86.7 -7.1 7.7 101.3 3.8 1.5 1.7
2014 Q3 1.4 0.2 1.3 6.9 2.4 87.0 -0.8 1.6 109.7 3.3 0.6 1.6
2014 Q4 1.8 -0.4 1.2 5.6 1.2 88.1 2.1 -0.3 119.9 3.4 -0.4 1.6
2015 Q1 3.3 -0.8 1.1 6.2 0.8 88.1 6.3 0.4 120.0 1.0 -1.2 1.5
2015 Q2 1.5 1.8 1.1 6.6 2.7 88.3 -0.5 0.3 122.1 1.9 0.9 1.6
2015 Q3 1.1 -0.3 1.1 6.6 2.7 90.9 0.8 0.0 119.8 1.1 0.5 1.5
2015 Q4 2.0 0.0 1.1 5.4 1.6 92.2 -1.8 0.1 120.3 2.8 0.0 1.5
2016 Q1 2.0 -1.2 1.1 6.3 2.8 91.7 2.8 -0.1 112.4 1.4 0.1 1.4
2016 Q2 1.2 1.2 1.1 6.4 2.7 94.0 1.8 -1.3 102.8 2.6 0.9 1.3
2016 Q3 1.8 1.1 1.1 6.6 1.2 93.6 1.3 -0.8 101.2 2.3 1.9 1.3
2016 Q4 1.4 1.9 1.1 6.0 2.5 97.4 0.8 0.3 116.8 1.4 2.0 1.2
2017 Q1 -3.0 0.7 1.0 1.4 1.7 105.4 -3.2 -2.5 111.4 -2.9 0.5 1.2
2017 Q2 -3.9 0.1 1.0 1.8 0.9 109.1 -6.3 -3.4 108.0 -4.3 0.0 1.2
2017 Q3 -2.7 0.3 1.0 3.5 0.0 108.8 -5.8 -2.7 109.2 -3.7 0.1 1.2
2017 Q4 -1.5 0.3 1.0 5.3 -0.1 109.4 -4.4 -2.7 108.8 -2.7 0.2 1.2
2018 Q1 -0.2 0.4 1.0 6.4 0.0 108.7 -3.1 -2.1 109.2 -1.4 0.4 1.2
2018 Q2 0.7 0.6 1.0 6.7 0.1 108.1 -1.9 -1.5 109.6 -0.2 0.7 1.2
2018 Q3 1.3 0.8 1.0 6.7 0.4 107.5 -0.9 -1.0 110.0 0.7 1.0 1.2
2018 Q4 1.7 1.0 1.0 6.8 0.7 106.9 -0.1 -0.5 110.5 1.5 1.2 1.2
2019 Q1 1.9 1.2 1.0 6.8 1.0 106.2 0.5 -0.2 110.6 2.0 1.3 1.2
2019 Q2 2.0 1.4 1.0 6.9 1.3 105.5 1.0 0.2 110.8 2.4 1.4 1.2
2019 Q3 2.0 1.5 1.0 7.0 1.6 105.0 1.3 0.5 111.1 2.6 1.5 1.2
2019 Q4 1.9 1.6 1.0 7.0 1.9 104.7 1.5 0.7 111.4 2.6 1.6 1.2
2020 Q1 1.9 1.6 1.0 7.0 2.1 104.4 1.6 0.9 111.6 2.7 1.6 1.2
Page 133
133 | P a g e
Appendix 8: Severely Adverse Scenario – Domestic
DateReal GDP
growth
Nominal GDP
growth
Real
disposable
income
growth
Nominal
disposable
income
growth
Unemployment
rate
CPI inflation
rate
3-month
Treasury rate
5-year
Treasury yield
10-year
Treasury yield
BBB corporate
yieldMortgage rate Prime rate
Dow Jones
Total Stock
Market Index
(Level)
House Price
Index
(Level)
Commercial
Real Estate
Price Index
(Level)
Market
Volatility
Index
(Level)
2002 Q1 3.7 5.1 10.1 10.9 5.7 1.3 1.7 4.5 5.4 7.6 7.0 4.8 10775.7 120.3 137.4 26.1
2002 Q2 2.2 3.8 2.0 5.2 5.8 3.2 1.7 4.5 5.4 7.6 6.8 4.8 9384.0 123.4 135.8 28.4
2002 Q3 2.0 3.8 -0.5 1.5 5.7 2.2 1.6 3.4 4.5 7.3 6.2 4.8 7773.6 126.5 138.7 45.1
2002 Q4 0.3 2.4 1.9 3.8 5.9 2.4 1.3 3.1 4.3 7.0 6.1 4.5 8343.2 129.2 142.5 42.6
2003 Q1 2.1 4.6 1.1 4.0 5.9 4.2 1.2 2.9 4.2 6.5 5.8 4.3 8051.9 131.8 147.9 34.7
2003 Q2 3.8 5.1 5.9 6.3 6.1 -0.7 1.0 2.6 3.8 5.7 5.5 4.2 9342.4 134.6 149.2 29.1
2003 Q3 6.9 9.3 6.7 9.3 6.1 3.0 0.9 3.1 4.4 6.0 6.1 4.0 9649.7 138.5 147.3 22.7
2003 Q4 4.8 6.8 1.6 3.3 5.8 1.5 0.9 3.2 4.4 5.8 5.9 4.0 10799.6 143.0 145.7 21.1
2004 Q1 2.3 5.9 2.9 6.1 5.7 3.4 0.9 3.0 4.1 5.5 5.6 4.0 11039.4 148.0 152.9 21.6
2004 Q2 3.0 6.6 4.0 7.0 5.6 3.2 1.1 3.7 4.7 6.1 6.2 4.0 11144.6 153.9 160.4 20.0
2004 Q3 3.7 6.3 2.1 4.5 5.4 2.6 1.5 3.5 4.4 5.8 5.9 4.4 10893.8 159.4 171.8 19.3
2004 Q4 3.5 6.4 5.1 8.5 5.4 4.4 2.0 3.5 4.3 5.4 5.7 4.9 11951.5 165.3 175.8 16.6
2005 Q1 4.3 8.3 -3.8 -1.8 5.3 2.0 2.5 3.9 4.4 5.4 5.8 5.4 11637.3 172.2 175.8 14.6
2005 Q2 2.1 5.1 3.2 6.0 5.1 2.7 2.9 3.9 4.2 5.5 5.7 5.9 11856.7 179.0 182.3 17.7
2005 Q3 3.4 7.3 2.1 6.6 5.0 6.2 3.4 4.0 4.3 5.5 5.8 6.4 12282.9 185.2 187.1 14.2
2005 Q4 2.3 5.4 3.4 6.6 5.0 3.8 3.8 4.4 4.6 5.9 6.2 7.0 12497.2 190.7 195.4 16.5
2006 Q1 4.9 8.2 9.5 11.5 4.7 2.1 4.4 4.6 4.7 6.0 6.3 7.4 13121.6 193.9 200.0 14.6
2006 Q2 1.2 4.5 0.6 3.7 4.6 3.7 4.7 5.0 5.2 6.5 6.6 7.9 12808.9 193.1 209.0 23.8
2006 Q3 0.4 3.2 1.2 4.1 4.6 3.8 4.9 4.8 5.0 6.4 6.5 8.3 13322.5 191.6 218.6 18.6
2006 Q4 3.2 4.6 5.3 4.6 4.4 -1.6 4.9 4.6 4.7 6.1 6.2 8.3 14215.8 191.2 217.3 12.7
2007 Q1 0.2 4.8 2.6 6.5 4.5 4.0 5.0 4.6 4.8 6.1 6.2 8.3 14354.0 189.0 227.1 19.6
2007 Q2 3.1 5.4 0.8 4.0 4.5 4.6 4.7 4.7 4.9 6.3 6.4 8.3 15163.1 183.4 236.4 18.9
2007 Q3 2.7 4.2 1.1 3.4 4.7 2.6 4.3 4.5 4.8 6.5 6.5 8.2 15317.8 177.7 249.1 30.8
2007 Q4 1.4 3.2 0.3 4.4 4.8 5.0 3.4 3.8 4.4 6.4 6.2 7.5 14753.6 171.8 251.5 31.1
2008 Q1 -2.7 -0.5 2.9 6.5 5.0 4.4 2.1 2.8 3.9 6.5 5.9 6.2 13284.1 164.5 239.9 32.2
2008 Q2 2.0 4.0 8.7 13.3 5.3 5.3 1.6 3.2 4.1 6.8 6.1 5.1 13016.4 156.6 223.9 24.1
2008 Q3 -1.9 0.8 -8.9 -5.1 6.0 6.3 1.5 3.1 4.1 7.2 6.3 5.0 11826.0 149.2 233.4 46.7
2008 Q4 -8.2 -7.7 2.6 -3.2 6.9 -8.9 0.3 2.2 3.7 9.4 5.8 4.1 9056.7 141.5 222.5 80.9
2009 Q1 -5.4 -4.5 -0.8 -3.0 8.3 -2.7 0.2 1.9 3.2 9.0 5.0 3.3 8044.2 137.2 208.9 56.7
2009 Q2 -0.5 -1.2 2.9 4.7 9.3 2.1 0.2 2.3 3.7 8.2 5.1 3.3 9342.8 137.1 178.5 42.3
2009 Q3 1.3 1.2 -4.3 -1.9 9.6 3.5 0.2 2.5 3.8 6.8 5.1 3.3 10812.8 137.7 154.0 31.3
2009 Q4 3.9 5.2 -0.5 2.2 9.9 3.2 0.1 2.3 3.7 6.1 4.9 3.3 11385.1 138.2 155.2 30.7
2010 Q1 1.7 3.2 0.4 1.8 9.8 0.6 0.1 2.4 3.9 5.8 5.0 3.3 12032.5 138.3 149.8 27.3
2010 Q2 3.9 5.8 5.3 5.8 9.6 -0.1 0.1 2.3 3.6 5.6 4.8 3.3 10645.8 137.4 164.5 45.8
2010 Q3 2.7 4.6 2.0 3.2 9.5 1.2 0.2 1.6 2.9 5.1 4.4 3.3 11814.0 134.7 166.9 32.9
2010 Q4 2.5 4.7 2.8 5.0 9.5 3.3 0.1 1.5 3.0 5.0 4.5 3.3 13131.5 133.5 172.7 23.5
Page 134
134 | P a g e
Appendix 8: Severely Adverse Scenario – Domestic (Cont.)
DateReal GDP
growth
Nominal GDP
growth
Real
disposable
income
growth
Nominal
disposable
income
growth
Unemployment
rate
CPI inflation
rate
3-month
Treasury rate
5-year
Treasury yield
10-year
Treasury yield
BBB corporate
yieldMortgage rate Prime rate
Dow Jones
Total Stock
Market Index
(Level)
House Price
Index
(Level)
Commercial
Real Estate
Price Index
(Level)
Market
Volatility
Index
(Level)
2011 Q1 -1.5 0.2 5.0 8.2 9.0 4.3 0.1 2.1 3.5 5.4 4.9 3.3 13908.5 132.3 179.6 29.4
2011 Q2 2.9 6.0 -0.6 3.5 9.1 4.6 0.0 1.8 3.3 5.1 4.6 3.3 13843.5 131.7 177.0 22.7
2011 Q3 0.8 3.3 2.1 4.3 9.0 2.6 0.0 1.1 2.5 4.9 4.2 3.3 11676.5 132.3 177.0 48.0
2011 Q4 4.6 5.2 0.2 1.6 8.6 1.8 0.0 1.0 2.1 5.0 4.0 3.3 13019.3 132.4 188.4 45.5
2012 Q1 2.7 4.9 6.7 9.2 8.3 2.4 0.1 0.9 2.1 4.7 3.9 3.3 14627.5 133.8 188.2 23.0
2012 Q2 1.9 3.8 3.1 4.4 8.2 0.8 0.1 0.8 1.8 4.5 3.8 3.3 14100.2 137.2 189.4 26.7
2012 Q3 0.5 2.7 -0.2 1.1 8.0 1.6 0.1 0.7 1.6 4.2 3.5 3.3 14894.7 139.9 196.6 20.5
2012 Q4 0.1 1.7 10.9 13.3 7.8 2.9 0.1 0.7 1.7 3.9 3.4 3.3 14834.9 142.9 198.3 22.7
2013 Q1 2.8 4.4 -15.7 -14.5 7.7 1.6 0.1 0.8 1.9 4.0 3.5 3.3 16396.2 146.6 202.0 19.0
2013 Q2 0.8 1.6 2.4 2.5 7.5 -0.5 0.1 0.9 2.0 4.1 3.7 3.3 16771.3 150.6 212.6 20.5
2013 Q3 3.1 5.1 2.4 3.9 7.3 2.0 0.0 1.5 2.7 4.9 4.4 3.3 17718.3 154.4 223.9 17.0
2013 Q4 4.0 6.1 0.9 2.6 6.9 1.9 0.1 1.4 2.8 4.8 4.3 3.3 19413.2 157.5 229.2 20.3
2014 Q1 -1.2 0.6 4.5 6.6 6.7 2.4 0.0 1.6 2.8 4.6 4.4 3.3 19711.2 159.6 229.4 21.4
2014 Q2 4.0 6.3 5.3 7.3 6.2 1.9 0.0 1.7 2.7 4.3 4.2 3.3 20568.7 160.8 239.3 17.0
2014 Q3 5.0 6.7 4.1 5.2 6.1 0.9 0.0 1.7 2.5 4.2 4.1 3.3 20458.8 162.9 244.8 17.0
2014 Q4 2.3 2.8 4.3 4.3 5.7 -0.3 0.0 1.6 2.3 4.2 3.9 3.3 21424.6 165.4 253.0 26.3
2015 Q1 2.0 2.1 2.0 0.3 5.6 -2.9 0.0 1.5 2.0 4.0 3.7 3.3 21707.6 167.8 261.6 22.4
2015 Q2 2.6 4.9 3.9 5.8 5.4 2.4 0.0 1.5 2.2 4.2 3.8 3.3 21630.9 169.9 265.5 18.9
2015 Q3 2.0 3.2 3.3 4.4 5.2 1.4 0.0 1.6 2.3 4.5 3.9 3.3 19959.3 172.1 272.1 40.7
2015 Q4 0.9 1.8 3.0 3.4 5.0 0.8 0.1 1.6 2.2 4.6 3.9 3.3 21100.9 174.2 277.3 24.4
2016 Q1 0.8 1.3 2.1 2.4 4.9 -0.3 0.3 1.4 2.0 4.6 3.7 3.5 21179.4 176.6 277.6 28.1
2016 Q2 1.4 3.7 2.9 5.0 4.9 2.5 0.3 1.3 1.8 4.1 3.6 3.5 21621.5 178.8 283.0 25.8
2016 Q3 3.5 5.0 2.6 4.1 4.9 1.6 0.3 1.2 1.6 3.7 3.4 3.5 22468.6 182.0 290.3 18.1
2016 Q4 3.1 6.1 1.6 4.5 4.7 3.4 0.4 1.7 2.2 4.1 3.9 3.5 23276.7 183.3 293.9 22.5
2017 Q1 -5.1 -2.7 -1.0 0.5 5.6 1.5 0.1 0.3 0.8 5.5 4.0 3.3 15373.6 179.2 288.0 68.7
2017 Q2 -7.5 -5.5 -4.0 -2.7 6.9 1.3 0.1 0.4 0.8 6.0 4.3 3.3 13537.6 174.0 269.6 50.9
2017 Q3 -5.9 -4.1 -3.9 -2.6 8.0 1.3 0.1 0.5 0.9 6.3 4.5 3.3 12294.8 168.0 251.5 57.2
2017 Q4 -5.1 -3.3 -3.7 -2.3 8.9 1.4 0.1 0.6 1.0 6.4 4.6 3.2 11704.3 161.7 234.0 49.3
2018 Q1 -3.0 -1.4 -2.5 -1.1 9.6 1.5 0.1 0.7 1.1 6.1 4.5 3.2 12337.7 155.7 217.8 39.1
2018 Q2 0.0 1.6 -1.4 0.2 9.8 1.7 0.1 0.7 1.2 5.7 4.4 3.2 13325.5 148.3 206.4 31.9
2018 Q3 0.7 2.3 -0.4 1.1 10.0 1.7 0.1 0.8 1.3 5.4 4.4 3.2 14348.1 142.1 196.2 26.7
2018 Q4 3.0 4.5 0.8 2.4 9.9 1.9 0.1 0.9 1.4 5.0 4.3 3.2 15625.0 138.0 193.4 22.2
2019 Q1 3.0 4.4 1.4 2.9 9.8 1.8 0.1 1.0 1.5 4.7 4.1 3.2 17069.7 137.5 192.1 19.3
2019 Q2 3.9 5.1 2.2 3.7 9.6 1.7 0.1 1.1 1.6 4.3 4.0 3.2 18738.7 138.2 194.0 16.8
2019 Q3 3.9 5.0 2.5 3.8 9.4 1.6 0.1 1.1 1.6 4.0 3.9 3.2 19908.7 139.6 198.0 16.0
2019 Q4 3.9 4.9 2.6 3.8 9.1 1.6 0.1 1.2 1.7 3.8 3.9 3.2 21185.7 141.8 202.6 14.9
2020 Q1 3.9 4.8 2.5 3.6 8.9 1.4 0.1 1.2 1.8 3.6 3.8 3.2 22577.4 144.6 207.3 14.3
Page 135
135 | P a g e
Appendix 9: Severely Adverse Scenario – International
DateEuro area real
GDP growth
Euro area
inflation
Euro area
bilateral dollar
exchange rate
(USD/euro)
Developing
Asia real GDP
growth
Developing
Asia inflation
Developing
Asia bilateral
dollar
exchange rate
(F/USD, index)
Japan real
GDP growthJapan inflation
Japan bilateral
dollar exchange
rate (yen/USD)
U.K. real GDP
growthU.K. inflation
U.K. bilateral
dollar
exchange rate
(USD/pound)
2002 Q1 0.7 3.1 0.9 7.7 0.4 107.3 0.3 -2.7 132.7 1.7 2.0 1.4
2002 Q2 1.9 2.0 1.0 8.1 1.1 104.8 3.2 1.7 119.9 3.0 0.9 1.5
2002 Q3 1.6 1.6 1.0 7.2 1.5 105.5 1.7 -0.7 121.7 3.1 1.3 1.6
2002 Q4 0.4 2.3 1.0 6.5 0.8 104.5 1.5 -0.4 118.8 3.5 1.9 1.6
2003 Q1 -0.8 3.3 1.1 6.7 3.6 105.5 -1.2 -1.6 118.1 3.3 1.7 1.6
2003 Q2 0.2 0.5 1.2 2.1 1.2 104.0 3.8 1.7 119.9 3.7 0.2 1.7
2003 Q3 2.2 2.1 1.2 14.3 0.1 102.6 1.7 -0.7 111.4 4.0 1.7 1.7
2003 Q4 2.9 2.3 1.3 13.0 5.5 103.4 4.3 -0.6 107.1 3.3 1.7 1.8
2004 Q1 2.4 2.2 1.2 5.6 4.1 101.4 3.5 -0.9 104.2 2.3 1.4 1.8
2004 Q2 2.1 2.6 1.2 6.9 4.1 102.8 -0.3 1.1 109.4 1.9 0.8 1.8
2004 Q3 1.3 2.0 1.2 8.3 4.0 102.7 1.9 0.1 110.2 0.8 1.1 1.8
2004 Q4 1.4 2.4 1.4 6.4 0.8 98.9 -1.6 1.7 102.7 2.4 2.4 1.9
2005 Q1 0.8 1.4 1.3 10.6 2.9 98.6 2.2 -2.7 107.2 2.3 2.6 1.9
2005 Q2 2.6 2.2 1.2 8.6 1.5 98.9 3.6 -1.0 110.9 4.4 1.8 1.8
2005 Q3 3.1 3.1 1.2 9.3 2.3 98.6 3.9 -1.0 113.3 4.4 2.8 1.8
2005 Q4 2.5 2.5 1.2 11.7 1.7 98.1 0.7 0.2 117.9 5.5 1.4 1.7
2006 Q1 3.7 1.7 1.2 11.0 2.4 96.8 0.2 1.2 117.5 1.3 1.9 1.7
2006 Q2 4.2 2.5 1.3 7.0 3.2 96.7 1.7 0.4 114.5 0.9 3.0 1.8
2006 Q3 2.6 2.1 1.3 10.3 2.1 96.4 -0.7 0.4 118.0 0.6 3.3 1.9
2006 Q4 4.4 0.9 1.3 11.2 3.7 94.6 4.5 -0.6 119.0 1.4 2.7 2.0
2007 Q1 3.1 2.3 1.3 13.9 3.6 94.0 3.6 -0.7 117.6 4.1 2.5 2.0
2007 Q2 2.5 2.3 1.4 10.5 4.9 91.9 -0.4 0.4 123.4 3.0 1.8 2.0
2007 Q3 1.8 2.1 1.4 8.7 7.5 90.6 -1.2 0.3 115.0 3.1 0.3 2.0
2007 Q4 2.2 4.9 1.5 12.8 6.0 89.4 1.9 2.2 111.7 3.0 4.0 2.0
2008 Q1 2.0 4.3 1.6 7.2 8.1 88.0 1.6 1.3 99.9 0.6 3.4 2.0
2008 Q2 -1.3 3.2 1.6 5.9 6.4 88.7 -2.8 1.8 106.2 -2.6 5.8 2.0
2008 Q3 -2.2 3.2 1.4 3.1 2.8 91.5 -4.8 3.5 105.9 -6.6 5.9 1.8
2008 Q4 -6.8 -1.4 1.4 0.3 -1.0 92.2 -8.3 -2.1 90.8 -8.7 0.4 1.5
2009 Q1 -11.4 -1.1 1.3 4.4 -1.4 94.2 -18.0 -3.6 99.2 -6.4 -0.2 1.4
2009 Q2 -0.9 0.0 1.4 15.1 2.2 92.2 8.2 -1.6 96.4 -0.9 2.3 1.6
2009 Q3 1.2 1.1 1.5 12.8 3.9 91.3 -0.3 -1.4 89.5 0.3 3.6 1.6
2009 Q4 2.1 1.6 1.4 9.2 5.1 90.6 6.1 -1.6 93.1 1.6 2.8 1.6
2010 Q1 1.8 1.8 1.4 9.9 4.4 89.8 4.4 1.1 93.4 2.2 4.2 1.5
2010 Q2 4.0 2.0 1.2 9.7 3.4 91.0 4.0 -1.4 88.5 4.1 3.3 1.5
2010 Q3 1.6 1.6 1.4 8.8 4.0 88.4 7.7 -2.1 83.5 2.3 2.2 1.6
2010 Q4 2.3 2.6 1.3 9.3 7.7 87.4 -2.7 1.4 81.7 0.5 3.9 1.5
Page 136
136 | P a g e
Appendix 9: Severely Adverse Scenario – International (Cont.)
DateEuro area real
GDP growth
Euro area
inflation
Euro area
bilateral dollar
exchange rate
(USD/euro)
Developing
Asia real GDP
growth
Developing
Asia inflation
Developing
Asia bilateral
dollar
exchange rate
(F/USD, index)
Japan real
GDP growthJapan inflation
Japan bilateral
dollar exchange
rate (yen/USD)
U.K. real GDP
growthU.K. inflation
U.K. bilateral
dollar
exchange rate
(USD/pound)
2011 Q1 3.2 3.7 1.4 9.8 6.3 86.4 -5.7 0.0 82.8 2.2 7.0 1.6
2011 Q2 0.0 3.2 1.5 6.5 5.4 85.3 -2.0 -0.8 80.6 0.3 4.6 1.6
2011 Q3 0.1 1.3 1.3 5.2 5.1 87.3 9.5 0.3 77.0 1.7 3.5 1.6
2011 Q4 -1.4 3.5 1.3 6.9 3.2 87.2 -0.5 -0.7 77.0 1.0 3.4 1.6
2012 Q1 -0.8 2.8 1.3 7.3 3.3 86.2 4.4 2.5 82.4 1.8 2.3 1.6
2012 Q2 -1.3 2.3 1.3 6.0 3.9 88.0 -1.6 -1.6 79.8 -0.3 1.9 1.6
2012 Q3 -0.6 1.6 1.3 6.5 2.1 86.3 -1.8 -1.8 77.9 4.7 2.0 1.6
2012 Q4 -1.7 2.4 1.3 7.3 3.6 85.9 0.3 0.3 86.6 -0.9 4.2 1.6
2013 Q1 -1.2 1.3 1.3 6.6 4.3 86.1 5.1 0.6 94.2 2.5 3.0 1.5
2013 Q2 1.8 0.4 1.3 6.5 2.9 87.1 4.3 -0.2 99.2 2.1 1.6 1.5
2013 Q3 1.3 1.2 1.4 7.8 3.7 86.7 2.4 2.4 98.3 3.1 2.0 1.6
2013 Q4 0.8 0.3 1.4 6.4 4.0 85.7 -0.8 3.1 105.3 2.0 1.7 1.7
2014 Q1 1.3 0.9 1.4 6.4 1.4 86.8 4.9 1.3 103.0 3.4 1.9 1.7
2014 Q2 0.7 -0.1 1.4 7.0 2.5 86.7 -7.1 7.7 101.3 3.8 1.5 1.7
2014 Q3 1.4 0.2 1.3 6.9 2.4 87.0 -0.8 1.6 109.7 3.3 0.6 1.6
2014 Q4 1.8 -0.4 1.2 5.6 1.2 88.1 2.1 -0.3 119.9 3.4 -0.4 1.6
2015 Q1 3.3 -0.8 1.1 6.2 0.8 88.1 6.3 0.4 120.0 1.0 -1.2 1.5
2015 Q2 1.5 1.8 1.1 6.6 2.7 88.3 -0.5 0.3 122.1 1.9 0.9 1.6
2015 Q3 1.1 -0.3 1.1 6.6 2.7 90.9 0.8 0.0 119.8 1.1 0.5 1.5
2015 Q4 2.0 0.0 1.1 5.4 1.6 92.2 -1.8 0.1 120.3 2.8 0.0 1.5
2016 Q1 2.0 -1.2 1.1 6.3 2.8 91.7 2.8 -0.1 112.4 1.4 0.1 1.4
2016 Q2 1.2 1.2 1.1 6.4 2.7 94.0 1.8 -1.3 102.8 2.6 0.9 1.3
2016 Q3 1.8 1.1 1.1 6.6 1.2 93.6 1.3 -0.8 101.2 2.3 1.9 1.3
2016 Q4 1.4 1.9 1.1 6.0 2.5 97.4 0.8 0.3 116.8 1.4 2.0 1.2
2017 Q1 -6.0 0.6 1.0 -0.1 0.5 107.4 -4.3 -3.1 113.0 -4.7 -0.1 1.2
2017 Q2 -7.0 -0.2 0.9 0.4 -0.5 112.1 -7.8 -4.1 110.4 -6.6 -0.8 1.2
2017 Q3 -5.7 -1.0 0.9 2.2 -1.2 114.3 -9.2 -4.6 109.5 -6.1 -1.1 1.1
2017 Q4 -4.7 -1.5 0.9 3.4 -1.6 115.8 -9.5 -4.9 108.0 -5.0 -1.0 1.1
2018 Q1 -2.9 -1.5 0.9 5.1 -1.6 114.5 -7.7 -4.2 108.1 -3.1 -0.6 1.1
2018 Q2 -1.5 -1.3 1.0 5.9 -1.3 113.2 -5.5 -3.5 108.2 -1.4 -0.1 1.2
2018 Q3 -0.3 -0.9 1.0 6.2 -1.0 112.0 -3.6 -2.8 108.4 0.1 0.2 1.2
2018 Q4 0.6 -0.4 1.0 6.3 -0.6 110.9 -2.1 -2.2 108.7 1.2 0.6 1.2
2019 Q1 1.3 0.1 1.0 6.4 -0.2 109.6 -0.9 -1.6 108.7 2.0 0.8 1.2
2019 Q2 1.8 0.5 1.0 6.5 0.2 108.5 0.0 -1.1 108.7 2.6 1.0 1.2
2019 Q3 2.0 0.7 1.0 6.6 0.6 107.5 0.7 -0.6 108.9 2.9 1.1 1.2
2019 Q4 2.1 0.9 1.0 6.6 0.9 106.7 1.1 -0.3 109.2 3.0 1.3 1.2
2020 Q1 2.1 1.1 1.0 6.7 1.3 106.0 1.4 0.1 109.4 3.0 1.4 1.2
Page 137
137 | P a g e
Appendix 10: Global Market Shock – Adverse
Securitized Products
Trading, PE & Other Fair Value Assets
Securitized Products
Non-Agency
Prime Sub-prime Option ARMS Other AltA
Unspec Non-
Prime HELOC RMBS CDO RMBS CDS Credit Basket PrimeX ABX / TABX
Prime Whole
Loans
Non-Prime
Whole Loans
European
RMBS
Other /
Unspecified
Relative MV Shock Based on Current Rating (%)
AAA Total
Pre 2006 -6.4% -6.4% -6.4% -6.4% -6.4% -6.4% -6.4% -6.4% -6.4% -6.4% -6.4% -6.4% -6.4% -6.4% -6.4%
2006 -17.2% -17.2% -17.2% -17.2% -17.2% -17.2% -17.2% -17.2% -17.2% -17.2% -17.2% -17.2% -17.2% -17.2% -17.2%
2007 -15.7% -15.7% -15.7% -15.7% -15.7% -15.7% -15.7% -15.7% -15.7% -15.7% -15.7% -15.7% -15.7% -15.7% -15.7%
Post 2007 -15.7% -15.7% -15.7% -15.7% -15.7% -15.7% -15.7% -15.7% -15.7% -15.7% -15.7% -15.7% -15.7% -15.7% -15.7%
Unspecified Vintage -15.7% -15.7% -15.7% -15.7% -15.7% -15.7% -15.7% -15.7% -15.7% -15.7% -15.7% -15.7% -15.7% -15.7% -15.7%
AA Total
Pre 2006 -13.3% -13.3% -13.3% -13.3% -13.3% -13.3% -13.3% -13.3% -13.3% -13.3% -13.3% -13.3% -13.3% -13.3% -13.3%
2006 -35.8% -35.8% -35.8% -35.8% -35.8% -35.8% -35.8% -35.8% -35.8% -35.8% -35.8% -35.8% -35.8% -35.8% -35.8%
2007 -32.7% -32.7% -32.7% -32.7% -32.7% -32.7% -32.7% -32.7% -32.7% -32.7% -32.7% -32.7% -32.7% -32.7% -32.7%
Post 2007 -32.7% -32.7% -32.7% -32.7% -32.7% -32.7% -32.7% -32.7% -32.7% -32.7% -32.7% -32.7% -32.7% -32.7% -32.7%
Unspecified Vintage -32.7% -32.7% -32.7% -32.7% -32.7% -32.7% -32.7% -32.7% -32.7% -32.7% -32.7% -32.7% -32.7% -32.7% -32.7%
A Total
Pre 2006 -14.2% -14.2% -14.2% -14.2% -14.2% -14.2% -14.2% -14.2% -14.2% -14.2% -14.2% -14.2% -14.2% -14.2% -14.2%
2006 -38.2% -38.2% -38.2% -38.2% -38.2% -38.2% -38.2% -38.2% -38.2% -38.2% -38.2% -38.2% -38.2% -38.2% -38.2%
2007 -34.9% -34.9% -34.9% -34.9% -34.9% -34.9% -34.9% -34.9% -34.9% -34.9% -34.9% -34.9% -34.9% -34.9% -34.9%
Post 2007 -34.9% -34.9% -34.9% -34.9% -34.9% -34.9% -34.9% -34.9% -34.9% -34.9% -34.9% -34.9% -34.9% -34.9% -34.9%
Unspecified Vintage -34.9% -34.9% -34.9% -34.9% -34.9% -34.9% -34.9% -34.9% -34.9% -34.9% -34.9% -34.9% -34.9% -34.9% -34.9%
BBB Total
Pre 2006 -15.7% -15.7% -15.7% -15.7% -15.7% -15.7% -15.7% -15.7% -15.7% -15.7% -15.7% -15.7% -15.7% -15.7% -15.7%
2006 -42.3% -42.3% -42.3% -42.3% -42.3% -42.3% -42.3% -42.3% -42.3% -42.3% -42.3% -42.3% -42.3% -42.3% -42.3%
2007 -38.6% -38.6% -38.6% -38.6% -38.6% -38.6% -38.6% -38.6% -38.6% -38.6% -38.6% -38.6% -38.6% -38.6% -38.6%
Post 2007 -38.6% -38.6% -38.6% -38.6% -38.6% -38.6% -38.6% -38.6% -38.6% -38.6% -38.6% -38.6% -38.6% -38.6% -38.6%
Unspecified Vintage -38.6% -38.6% -38.6% -38.6% -38.6% -38.6% -38.6% -38.6% -38.6% -38.6% -38.6% -38.6% -38.6% -38.6% -38.6%
BB Total
Pre 2006 -20.2% -20.2% -20.2% -20.2% -20.2% -20.2% -20.2% -20.2% -20.2% -20.2% -20.2% -20.2% -20.2% -20.2% -20.2%
2006 -45.8% -45.8% -45.8% -45.8% -45.8% -45.8% -45.8% -45.8% -45.8% -45.8% -45.8% -45.8% -45.8% -45.8% -45.8%
2007 -45.8% -45.8% -45.8% -45.8% -45.8% -45.8% -45.8% -45.8% -45.8% -45.8% -45.8% -45.8% -45.8% -45.8% -45.8%
Post 2007 -45.8% -45.8% -45.8% -45.8% -45.8% -45.8% -45.8% -45.8% -45.8% -45.8% -45.8% -45.8% -45.8% -45.8% -45.8%
Unspecified Vintage -45.8% -45.8% -45.8% -45.8% -45.8% -45.8% -45.8% -45.8% -45.8% -45.8% -45.8% -45.8% -45.8% -45.8% -45.8%
B Total
Pre 2006 -20.2% -20.2% -20.2% -20.2% -20.2% -20.2% -20.2% -20.2% -20.2% -20.2% -20.2% -20.2% -20.2% -20.2% -20.2%
2006 -45.8% -45.8% -45.8% -45.8% -45.8% -45.8% -45.8% -45.8% -45.8% -45.8% -45.8% -45.8% -45.8% -45.8% -45.8%
2007 -45.8% -45.8% -45.8% -45.8% -45.8% -45.8% -45.8% -45.8% -45.8% -45.8% -45.8% -45.8% -45.8% -45.8% -45.8%
Post 2007 -45.8% -45.8% -45.8% -45.8% -45.8% -45.8% -45.8% -45.8% -45.8% -45.8% -45.8% -45.8% -45.8% -45.8% -45.8%
Unspecified Vintage -45.8% -45.8% -45.8% -45.8% -45.8% -45.8% -45.8% -45.8% -45.8% -45.8% -45.8% -45.8% -45.8% -45.8% -45.8%
<B Total
Pre 2006 -20.2% -20.2% -20.2% -20.2% -20.2% -20.2% -20.2% -20.2% -20.2% -20.2% -20.2% -20.2% -20.2% -20.2% -20.2%
2006 -45.8% -45.8% -45.8% -45.8% -45.8% -45.8% -45.8% -45.8% -45.8% -45.8% -45.8% -45.8% -45.8% -45.8% -45.8%
2007 -45.8% -45.8% -45.8% -45.8% -45.8% -45.8% -45.8% -45.8% -45.8% -45.8% -45.8% -45.8% -45.8% -45.8% -45.8%
Post 2007 -45.8% -45.8% -45.8% -45.8% -45.8% -45.8% -45.8% -45.8% -45.8% -45.8% -45.8% -45.8% -45.8% -45.8% -45.8%
Unspecified Vintage -45.8% -45.8% -45.8% -45.8% -45.8% -45.8% -45.8% -45.8% -45.8% -45.8% -45.8% -45.8% -45.8% -45.8% -45.8%
NR Total
Pre 2006 -20.2% -20.2% -20.2% -20.2% -20.2% -20.2% -20.2% -20.2% -20.2% -20.2% -20.2% -20.2% -20.2% -20.2% -20.2%
2006 -45.8% -45.8% -45.8% -45.8% -45.8% -45.8% -45.8% -45.8% -45.8% -45.8% -45.8% -45.8% -45.8% -45.8% -45.8%
2007 -45.8% -45.8% -45.8% -45.8% -45.8% -45.8% -45.8% -45.8% -45.8% -45.8% -45.8% -45.8% -45.8% -45.8% -45.8%
Post 2007 -45.8% -45.8% -45.8% -45.8% -45.8% -45.8% -45.8% -45.8% -45.8% -45.8% -45.8% -45.8% -45.8% -45.8% -45.8%
Unspecified Vintage -45.8% -45.8% -45.8% -45.8% -45.8% -45.8% -45.8% -45.8% -45.8% -45.8% -45.8% -45.8% -45.8% -45.8% -45.8%
RMBS
Page 138
138 | P a g e
Securitized Products
Trading, PE & Other Fair Value Assets
Securitized Products
Autos Credit Cards
Student
Loans ABS CDS Credit Basket
Index
Tranches
Other /
Unspecified
Cash Non-
Agency CMBS CMBS CDS CMBS CDO Credit Basket
Index
Tranches Whole Loans
Other /
Unspecified CLO
Other /
Unspecified Total Size
Total
Protection
Other /
Unspecified
Relative MV Shock Based on Current Rating (%)
AAA Total
Pre 2006 -2.1% -6.6% -5.4% -6.6% -6.6% -6.6% -6.6% -2.5% -1.5% -2.5% -1.5% -1.5% -2.5% -2.5% -3.0% -3.0% -9.2% 9.2% -1.4%
2006 -2.1% -6.6% -6.0% -6.6% -6.6% -6.6% -6.6% -1.4% -0.8% -1.4% -0.8% -0.8% -1.4% -1.4% -3.0% -3.0% -11.1% 11.1% -1.4%
2007 -2.1% -6.6% -7.2% -7.2% -7.2% -7.2% -7.2% -2.7% -1.6% -2.7% -1.6% -1.6% -2.7% -2.7% -3.0% -3.0% -11.1% 11.1% -1.4%
Post 2007 -2.1% -6.6% -5.8% -6.6% -6.6% -6.6% -6.6% -11.7% -7.0% -11.7% -7.0% -7.0% -11.7% -11.7% -8.9% -8.9% -9.2% 9.2% -1.4%
Unspecified Vintage -2.1% -6.6% -7.2% -7.2% -7.2% -7.2% -7.2% -2.7% -1.6% -2.7% -1.6% -1.6% -2.7% -2.7% -3.0% -3.0% -11.1% 11.1% -1.4%
AA Total
Pre 2006 -3.9% -10.0% -13.0% -13.0% -13.0% -13.0% -13.0% -6.3% -3.8% -6.3% -3.8% -3.8% -6.3% -6.3% -13.1% -13.1% -9.2% 9.2% -1.4%
2006 -3.9% -10.0% -14.5% -14.5% -14.5% -14.5% -14.5% -3.4% -2.0% -3.4% -2.0% -2.0% -3.4% -3.4% -13.1% -13.1% -11.1% 11.1% -1.4%
2007 -3.9% -10.0% -17.3% -17.3% -17.3% -17.3% -17.3% -6.8% -4.1% -6.8% -4.1% -4.1% -6.8% -6.8% -13.1% -13.1% -11.1% 11.1% -1.4%
Post 2007 -3.9% -10.0% -14.0% -14.0% -14.0% -14.0% -14.0% -29.2% -17.5% -29.2% -17.5% -17.5% -29.2% -29.2% -28.0% -28.0% -9.2% 9.2% -1.4%
Unspecified Vintage -3.9% -10.0% -17.3% -17.3% -17.3% -17.3% -17.3% -6.8% -4.1% -6.8% -4.1% -4.1% -6.8% -6.8% -13.1% -13.1% -11.1% 11.1% -1.4%
A Total
Pre 2006 -7.3% -10.0% -14.7% -14.7% -14.7% -14.7% -14.7% -8.1% -4.8% -8.1% -4.8% -4.8% -8.1% -8.1% -20.9% -20.9% -9.2% 9.2% -1.4%
2006 -7.3% -10.0% -16.4% -16.4% -16.4% -16.4% -16.4% -4.3% -2.6% -4.3% -2.6% -2.6% -4.3% -4.3% -20.9% -20.9% -11.1% 11.1% -1.4%
2007 -7.3% -10.0% -19.6% -19.6% -19.6% -19.6% -19.6% -8.7% -5.2% -8.7% -5.2% -5.2% -8.7% -8.7% -20.9% -20.9% -11.1% 11.1% -1.4%
Post 2007 -7.3% -10.0% -15.9% -15.9% -15.9% -15.9% -15.9% -37.2% -22.3% -37.2% -22.3% -22.3% -37.2% -37.2% -41.2% -41.2% -9.2% 9.2% -1.4%
Unspecified Vintage -7.3% -10.0% -19.6% -19.6% -19.6% -19.6% -19.6% -8.7% -5.2% -8.7% -5.2% -5.2% -8.7% -8.7% -20.9% -20.9% -11.1% 11.1% -1.4%
BBB Total
Pre 2006 -7.3% -19.0% -17.7% -19.0% -19.0% -19.0% -19.0% -9.4% -5.6% -9.4% -5.6% -5.6% -9.4% -9.4% -22.3% -22.3% -9.2% 9.2% -22.0%
2006 -7.3% -19.0% -19.7% -19.7% -19.7% -19.7% -19.7% -5.0% -3.0% -5.0% -3.0% -3.0% -5.0% -5.0% -22.3% -22.3% -11.1% 11.1% -22.0%
2007 -7.3% -19.0% -23.5% -23.5% -23.5% -23.5% -23.5% -10.0% -6.0% -10.0% -6.0% -6.0% -10.0% -10.0% -22.3% -22.3% -11.1% 11.1% -22.0%
Post 2007 -7.3% -19.0% -19.0% -19.0% -19.0% -19.0% -19.0% -43.1% -25.8% -43.1% -25.8% -25.8% -43.1% -43.1% -43.0% -43.0% -9.2% 9.2% -22.0%
Unspecified Vintage -7.3% -19.0% -23.5% -23.5% -23.5% -23.5% -23.5% -10.0% -6.0% -10.0% -6.0% -6.0% -10.0% -10.0% -22.3% -22.3% -11.1% 11.1% -22.0%
BB Total
Pre 2006 -9.4% -19.0% -17.7% -19.0% -19.0% -19.0% -19.0% -9.4% -5.6% -9.4% -5.6% -5.6% -9.4% -9.4% -23.8% -23.8% -9.2% 9.2% -22.0%
2006 -9.4% -19.0% -19.7% -19.7% -19.7% -19.7% -19.7% -5.0% -3.0% -5.0% -3.0% -3.0% -5.0% -5.0% -23.8% -23.8% -11.1% 11.1% -22.0%
2007 -9.4% -19.0% -23.5% -23.5% -23.5% -23.5% -23.5% -10.0% -6.0% -10.0% -6.0% -6.0% -10.0% -10.0% -23.8% -23.8% -11.1% 11.1% -22.0%
Post 2007 -9.4% -19.0% -19.0% -19.0% -19.0% -19.0% -19.0% -43.1% -25.8% -43.1% -25.8% -25.8% -43.1% -43.1% -43.7% -43.7% -9.2% 9.2% -22.0%
Unspecified Vintage -9.4% -19.0% -23.5% -23.5% -23.5% -23.5% -23.5% -10.0% -6.0% -10.0% -6.0% -6.0% -10.0% -10.0% -22.3% -22.3% -11.1% 11.1% -22.0%
B Total
Pre 2006 -9.4% -19.0% -17.7% -19.0% -19.0% -19.0% -19.0% -9.4% -5.6% -9.4% -5.6% -5.6% -9.4% -9.4% -23.8% -23.8% -9.2% 9.2% -22.0%
2006 -9.4% -19.0% -19.7% -19.7% -19.7% -19.7% -19.7% -5.0% -3.0% -5.0% -3.0% -3.0% -5.0% -5.0% -23.8% -23.8% -11.1% 11.1% -22.0%
2007 -9.4% -19.0% -23.5% -23.5% -23.5% -23.5% -23.5% -10.0% -6.0% -10.0% -6.0% -6.0% -10.0% -10.0% -23.8% -23.8% -11.1% 11.1% -22.0%
Post 2007 -9.4% -19.0% -19.0% -19.0% -19.0% -19.0% -19.0% -43.1% -25.8% -43.1% -25.8% -25.8% -43.1% -43.1% -43.7% -43.7% -9.2% 9.2% -22.0%
Unspecified Vintage -9.4% -19.0% -23.5% -23.5% -23.5% -23.5% -23.5% -10.0% -6.0% -10.0% -6.0% -6.0% -10.0% -10.0% -22.3% -22.3% -11.1% 11.1% -22.0%
<B Total
Pre 2006 -9.4% -19.0% -17.7% -19.0% -19.0% -19.0% -19.0% -9.4% -5.6% -9.4% -5.6% -5.6% -9.4% -9.4% -23.8% -23.8% -9.2% 9.2% -22.0%
2006 -9.4% -19.0% -19.7% -19.7% -19.7% -19.7% -19.7% -5.0% -3.0% -5.0% -3.0% -3.0% -5.0% -5.0% -23.8% -23.8% -11.1% 11.1% -22.0%
2007 -9.4% -19.0% -23.5% -23.5% -23.5% -23.5% -23.5% -10.0% -6.0% -10.0% -6.0% -6.0% -10.0% -10.0% -23.8% -23.8% -11.1% 11.1% -22.0%
Post 2007 -9.4% -19.0% -19.0% -19.0% -19.0% -19.0% -19.0% -43.1% -25.8% -43.1% -25.8% -25.8% -43.1% -43.1% -43.7% -43.7% -9.2% 9.2% -22.0%
Unspecified Vintage -9.4% -19.0% -23.5% -23.5% -23.5% -23.5% -23.5% -10.0% -6.0% -10.0% -6.0% -6.0% -10.0% -10.0% -22.3% -22.3% -11.1% 11.1% -22.0%
NR Total
Pre 2006 -9.4% -19.0% -17.7% -19.0% -19.0% -19.0% -19.0% -9.4% -5.6% -9.4% -5.6% -5.6% -9.4% -9.4% -23.8% -23.8% -9.2% 9.2% -22.0%
2006 -9.4% -19.0% -19.7% -19.7% -19.7% -19.7% -19.7% -5.0% -3.0% -5.0% -3.0% -3.0% -5.0% -5.0% -23.8% -23.8% -11.1% 11.1% -22.0%
2007 -9.4% -19.0% -23.5% -23.5% -23.5% -23.5% -23.5% -10.0% -6.0% -10.0% -6.0% -6.0% -10.0% -10.0% -23.8% -23.8% -11.1% 11.1% -22.0%
Post 2007 -9.4% -19.0% -19.0% -19.0% -19.0% -19.0% -19.0% -43.1% -25.8% -43.1% -25.8% -25.8% -43.1% -43.1% -43.7% -43.7% -9.2% 9.2% -22.0%
Unspecified Vintage -9.4% -19.0% -23.5% -23.5% -23.5% -23.5% -23.5% -10.0% -6.0% -10.0% -6.0% -6.0% -10.0% -10.0% -22.3% -22.3% -11.1% 11.1% -22.0%
WarehouseABS CMBS Corporate CDO / CLO
Page 139
139 | P a g e
Municipals
Trading, PE & Other Fair Value Assets
Munis
Spread Widening (bps)
Bonds
AAA 43.3
AA 61.3
A 94.6
BBB 137.3
BB 274.6
B 411.9
<B 549.2
NR 549.2
Loans
AAA 43.3
AA 61.3
A 94.6
BBB 137.3
BB 274.6
B 411.9
<B 549.2
NR 549.2
CDS
AAA 30.3
AA 42.9
A 66.2
BBB 96.1
BB 192.2
B 288.3
<B 384.4
NR 384.4
Indices
AAA 21.5
AA 30.5
A 47.0
BBB 68.2
BB 136.5
B 204.7
<B 273.0
NR 273.0
Other / Unspecified Munis
AAA 43.3
AA 61.3
A 94.6
BBB 137.3
BB 274.6
B 411.9
<B 549.2
NR 549.2
Page 140
140 | P a g e
Agencies
Trading, PE & Other Fair Value Assets
Agencies
OAS Widening (bps)
US Residential Agency ProductsIOs 1,186.2
POs 109.9
Other CMOs 61.3
Pass-Throughs 50.5
Agency Debt/Debentures 13.6
IOS Index 1,186.2
POS Index 109.9
MBX Index 50.5
Other Agency Derivatives 13.6
TBA's 50.5
Reverse Mortgages 61.3
Residential Other / Unspecified 50.5
US Commercial Agency ProductsCash Agency CMBS 50.0
Agency CMBS Derivatives 50.0
Commercial Other / Unspecified 50.0
Non-US Agency ProductsAAA 74.9
AA 111.7
A 147.7
BBB 183.7
BB 219.7
B 255.7
<B 291.7
NR 291.7
Page 141
141 | P a g e
Rates DV01
DFAST 2017 Market Shocks: Adverse Scenario
Rates DV01
Rates Shocks (bps) 1M 3M 6M 9M 1Y 2Y 3Y 5Y 7Y 10Y 15Y 20Y 30Y
AUD Directional Risks
Governments (7.6) (7.6) (7.2) (6.8) (6.4) 7.5 16.8 25.6 35.1 41.2 48.6 52.4 57.2
Agencies (7.6) (7.6) (7.2) (6.8) (6.4) 7.5 16.8 25.6 35.1 41.2 48.6 52.4 57.2
Municipals (7.6) (7.6) (7.2) (6.8) (6.4) 7.5 16.8 25.6 35.1 41.2 48.6 52.4 57.2
Swaps / Discounting Curve (32.5) (32.5) (33.3) (29.8) (26.3) (25.1) (18.9) (13.1) (9.2) (3.6) 0.7 1.7 0.7
Instruments shocked by MV**
Other (32.5) (32.5) (33.3) (29.8) (26.3) (25.1) (18.9) (13.1) (9.2) (3.6) 0.7 1.7 0.7
AUD Basis Risks (Do not include the swap/discounting curve specified above)
OIS Basis
1m Basis
3m Basis
6m Basis
12m Basis
Other Basis
CAD Directional Risks
Governments 12.6 12.6 18.0 19.3 20.6 22.8 24.3 27.1 26.5 27.9 25.7 25.4 25.2
Agencies 12.6 12.6 18.0 19.3 20.6 22.8 24.3 27.1 26.5 27.9 25.7 25.4 25.2
Municipals 12.6 12.6 18.0 19.3 20.6 22.8 24.3 27.1 26.5 27.9 25.7 25.4 25.2
Swaps / Discounting Curve 22.7 22.7 22.8 24.9 27.0 31.2 33.2 36.1 36.0 36.4 37.3 37.0 34.9
Instruments shocked by MV**
Other 22.7 22.7 22.8 24.9 27.0 31.2 33.2 36.1 36.0 36.4 37.3 37.0 34.9
CAD Basis Risks (Do not include the swap/discounting curve specified above)
OIS Basis
1m Basis
3m Basis
6m Basis
12m Basis
Other Basis
CHF Directional Risks
Governments (1.3) (1.3) (1.6) (1.6) (1.7) (1.4) (1.2) (0.9) (0.7) (0.6) (0.4) (0.4) (0.3)
Agencies (1.3) (1.3) (1.6) (1.6) (1.7) (1.4) (1.2) (0.9) (0.7) (0.6) (0.4) (0.4) (0.3)
Municipals (1.3) (1.3) (1.6) (1.6) (1.7) (1.4) (1.2) (0.9) (0.7) (0.6) (0.4) (0.4) (0.3)
Swaps / Discounting Curve (1.6) (1.6) (1.8) (1.7) (1.6) (1.4) (1.3) (1.0) (0.8) (0.6) (0.5) (0.4) (0.4)
Instruments shocked by MV**
Other (1.6) (1.6) (1.8) (1.7) (1.6) (1.4) (1.3) (1.0) (0.8) (0.6) (0.5) (0.4) (0.4)
CHF Basis Risks (Do not include the swap/discounting curve specified above)
OIS Basis
1m Basis
3m Basis
6m Basis
12m Basis
Other Basis
M A T U R I T Y
Page 142
142 | P a g e
Rates DV01 (Continued)
DKK Directional Risks
Governments 9.2 9.2 9.2 9.0 8.9 5.4 5.5 5.4 6.2 7.5 9.9 10.8 9.8
Agencies 9.2 9.2 9.2 9.0 8.9 5.4 5.5 5.4 6.2 7.5 9.9 10.8 9.8
Municipals 9.2 9.2 9.2 9.0 8.9 5.4 5.5 5.4 6.2 7.5 9.9 10.8 9.8
Swaps / Discounting Curve 11.1 11.1 10.8 10.0 9.1 6.8 5.5 5.4 6.5 8.4 10.4 10.8 10.0
Instruments shocked by MV**
Other 11.1 11.1 10.8 10.0 9.1 6.8 5.5 5.4 6.5 8.4 10.4 10.8 10.0
DKK Basis Risks (Do not include the swap/discounting curve specified above)
OIS Basis
1m Basis
3m Basis
6m Basis
12m Basis
Other Basis
EUR Directional Risks
Governments: Austria (4.7) (4.7) (11.4) (14.8) (18.2) (24.7) (28.3) (33.0) (36.7) (41.3) (46.4) (50.5) (56.0)
Governments: Belgium (4.7) (4.7) (11.4) (14.8) (18.2) (24.7) (28.3) (33.0) (36.7) (41.3) (46.4) (50.5) (56.0)
Governments: Finland (4.7) (4.7) (11.4) (14.8) (18.2) (24.7) (28.3) (33.0) (36.7) (41.3) (46.4) (50.5) (56.0)
Governments: France (15.5) (15.5) (14.4) (13.8) (13.2) (7.5) (4.0) 1.5 4.8 8.9 13.2 16.1 19.4
Governments: Germany (4.7) (4.7) (11.4) (14.8) (18.2) (24.7) (28.3) (33.0) (36.7) (41.3) (46.4) (50.5) (56.0)
Governments: Greece 69.4 130.2 221.5 312.8 404.1 769.4 1,256.5 953.9 824.2 727.0 651.4 612.4 574.6
Governments: Ireland (4.7) (4.7) (11.4) (14.8) (18.2) (24.7) (28.3) (33.0) (36.7) (41.3) (46.4) (50.5) (56.0)
Governments: Italy (22.1) (22.1) (20.3) (17.1) (14.0) (4.7) 0.4 4.4 7.9 14.0 14.6 15.7 17.7
Governments: Netherlands (5.8) (5.8) (6.3) (4.6) (2.8) 1.1 3.4 6.2 7.4 9.2 10.3 11.3 12.1
Governments: Portugal (15.3) (15.3) (30.1) (45.3) (60.5) (100.4) (124.9) (122.8) (108.7) (75.9) (55.9) (33.4) (17.8)
Governments: Spain (19.7) (19.7) (18.5) (14.9) (11.2) (1.7) 4.4 12.2 18.9 26.1 31.4 33.9 37.3
Governments: Other (5.8) (5.8) (6.3) (4.6) (2.8) 1.1 3.4 6.2 7.4 9.2 10.3 11.3 12.1
Agencies (5.8) (5.8) (6.3) (4.6) (2.8) 1.1 3.4 6.2 7.4 9.2 10.3 11.3 12.1
Municipals (5.8) (5.8) (6.3) (4.6) (2.8) 1.1 3.4 6.2 7.4 9.2 10.3 11.3 12.1
Swaps / Discounting Curve (7.7) (7.7) (7.2) (4.4) (1.6) 4.5 7.5 11.6 14.8 18.9 23.2 25.4 27.1
Instruments shocked by MV**
Other (7.7) (7.7) (7.2) (4.4) (1.6) 4.5 7.5 11.6 14.8 18.9 23.2 25.4 27.1
EUR Basis Risks (Do not include the swap/discounting curve specified above)
OIS Basis (1.3) (1.1) (1.0) (0.9) (0.9) (0.7) (0.2) (0.2) (0.7) (1.5) (2.1) (2.3) (2.4)
1m Basis 0.1 0.1 0.1 0.1 0.1 0.1 0.0 0.0 0.0 0.1 0.1 0.1 0.1
3m Basis
6m Basis 1.9 1.5 1.4 1.3 1.3 0.8 0.2 0.1 0.4 0.6 0.7 0.7 0.5
12m Basis 5.1 4.0 3.7 3.5 3.4 1.9 0.5 0.3 0.9 1.4 1.5 1.4 1.0
Other Basis
GBP Directional Risks
Governments (4.3) (4.3) (1.8) 1.9 5.6 7.3 4.9 0.5 (4.8) (7.0) (10.3) (12.3) (13.0)
Agencies (4.3) (4.3) (1.8) 1.9 5.6 7.3 4.9 0.5 (4.8) (7.0) (10.3) (12.3) (13.0)
Municipals (4.3) (4.3) (1.8) 1.9 5.6 7.3 4.9 0.5 (4.8) (7.0) (10.3) (12.3) (13.0)
Swaps / Discounting Curve 23.4 23.4 16.9 18.2 19.6 18.1 14.9 8.5 3.6 (0.6) (3.3) (5.1) (7.2)
Instruments shocked by MV**
Other 23.4 23.4 16.9 18.2 19.6 18.1 14.9 8.5 3.6 (0.6) (3.3) (5.1) (7.2)
GBP Basis Risks (Do not include the swap/discounting curve specified above)
OIS Basis (0.7) (0.9) (1.0) (1.0) (1.0) (1.4) (1.4) (1.7) (2.1) (2.5) (2.8) (2.8) (2.9)
1m Basis (2.0) (2.7) (2.7) (2.8) (2.9) (3.0) (2.8) (2.8) (2.8) (2.8) (2.8) (2.6) (2.3)
3m Basis
6m Basis 1.8 2.4 2.4 2.5 2.5 2.3 2.0 1.9 2.0 2.1 2.2 2.2 2.2
12m Basis 3.9 5.2 5.3 5.4 5.5 6.0 5.9 5.5 5.4 5.3 5.1 4.9 4.5
Other Basis
Page 143
143 | P a g e
Rates DV01 (Continued)
JPY Directional Risks
Governments (5.6) (5.6) (6.3) (5.4) (4.4) (6.5) (10.6) (15.2) (21.7) (23.3) (29.9) (33.4) (35.2)
Agencies (5.6) (5.6) (6.3) (5.4) (4.4) (6.5) (10.6) (15.2) (21.7) (23.3) (29.9) (33.4) (35.2)
Municipals (5.6) (5.6) (6.3) (5.4) (4.4) (6.5) (10.6) (15.2) (21.7) (23.3) (29.9) (33.4) (35.2)
Swaps / Discounting Curve 4.2 4.2 4.2 2.6 1.0 (1.8) (2.3) (6.5) (11.8) (21.9) (31.1) (35.0) (39.5)
Instruments shocked by MV**
Other 4.2 4.2 4.2 2.6 1.0 (1.8) (2.3) (6.5) (11.8) (21.9) (31.1) (35.0) (39.5)
JPY Basis Risks (Do not include the swap/discounting curve specified above)
OIS Basis 0.00 0.00 0.00 0.00 0.00 0.00 0.00 0.00 0.00 0.00 0.00 0.00 0.00
1m TIBOR Basis 0.4 0.3 0.2 0.2 0.1 0.2 0.2 0.3 0.3 0.4 0.7 0.9 1.1
3m TIBOR Basis
6m TIBOR Basis 0.5 0.3 0.3 0.2 0.2 0.1 0.1 0.2 0.2 0.3 0.3 0.3 0.2
12m TIBOR Basis
1m LIBOR Basis 0.4 0.3 0.2 0.2 0.1 0.2 0.2 0.3 0.3 0.4 0.7 0.9 1.1
3m LIBOR Basis
6m LIBOR Basis 0.5 0.3 0.3 0.2 0.2 0.1 0.1 0.2 0.2 0.3 0.3 0.3 0.2
12m LIBOR Basis
Other Basis
NOK Directional Risks
Governments 43.4 43.4 42.0 39.5 37.0 19.7 19.9 13.7 11.9 11.3 12.4 12.9 12.9
Agencies 43.4 43.4 42.0 39.5 37.0 19.7 19.9 13.7 11.9 11.3 12.4 12.9 12.9
Municipals 43.4 43.4 42.0 39.5 37.0 19.7 19.9 13.7 11.9 11.3 12.4 12.9 12.9
Swaps / Discounting Curve 7.8 7.8 9.3 12.2 15.2 11.4 7.6 0.6 (5.0) (8.1) (9.6) (9.9) (10.7)
Instruments shocked by MV**
Other 7.8 7.8 9.3 12.2 15.2 11.4 7.6 0.6 (5.0) (8.1) (9.6) (9.9) (10.7)
NOK Basis Risks (Do not include the swap/discounting curve specified above)
OIS Basis
1m Basis
3m Basis
6m Basis
12m Basis
Other Basis
NZD Directional Risks
Governments 11.6 11.6 11.6 13.4 15.2 16.3 15.1 13.1 11.4 10.0 10.1 10.5 10.5
Agencies 11.6 11.6 11.6 13.4 15.2 16.3 15.1 13.1 11.4 10.0 10.1 10.5 10.5
Municipals 11.6 11.6 11.6 13.4 15.2 16.3 15.1 13.1 11.4 10.0 10.1 10.5 10.5
Swaps / Discounting Curve 11.6 11.6 11.6 13.4 15.2 16.3 15.1 13.1 11.4 10.0 10.1 10.5 10.5
Instruments shocked by MV**
Other 11.6 11.6 11.6 13.4 15.2 16.3 15.1 13.1 11.4 10.0 10.1 10.5 10.5
NZD Basis Risks (Do not include the swap/discounting curve specified above)
OIS Basis
1m Basis
3m Basis
6m Basis
12m Basis
Other Basis
SEK Directional Risks
Governments (15.7) (15.7) (14.5) (14.6) (14.7) (17.4) (20.0) (26.0) (32.2) (40.1) (51.1) (57.2) (58.2)
Agencies (15.7) (15.7) (14.5) (14.6) (14.7) (17.4) (20.0) (26.0) (32.2) (40.1) (51.1) (57.2) (58.2)
Municipals (15.7) (15.7) (14.5) (14.6) (14.7) (17.4) (20.0) (26.0) (32.2) (40.1) (51.1) (57.2) (58.2)
Swaps / Discounting Curve (21.9) (21.9) (25.8) (23.8) (21.8) (22.8) (25.0) (30.4) (35.3) (41.3) (48.4) (52.7) (55.5)
Instruments shocked by MV**
Other (21.9) (21.9) (25.8) (23.8) (21.8) (22.8) (25.0) (30.4) (35.3) (41.3) (48.4) (52.7) (55.5)
SEK Basis Risks (Do not include the swap/discounting curve specified above)
OIS Basis
1m Basis
3m Basis
6m Basis
12m Basis
Other Basis
Page 144
144 | P a g e
Rates DV01 (Continued)
USD Directional Risks
Governments (25.3) (25.3) (28.2) (35.2) (42.3) (38.3) (33.8) (19.6) (14.5) (18.2) (18.6) (21.6) (21.8)
Agencies (25.3) (25.3) (28.2) (35.2) (42.3) (38.3) (33.8) (19.6) (14.5) (18.2) (18.6) (21.6) (21.8)
Municipals (25.3) (25.3) (28.2) (35.2) (42.3) (38.3) (33.8) (19.6) (14.5) (18.2) (18.6) (21.6) (21.8)
Swaps / Discounting Curve (1.6) (1.6) (1.6) (5.6) (9.5) (12.6) (8.8) (3.7) (0.5) 2.2 3.7 3.2 1.8
Instruments shocked by MV**
Other (1.6) (1.6) (1.6) (5.6) (9.5) (12.6) (8.8) (3.7) (0.5) 2.2 3.7 3.2 1.8
USD Basis Risks (Do not include the swap/discounting curve specified above)
Prime Basis (11.9) (11.8) (11.2) (11.4) (11.6) (8.3) (5.2) (4.2) (1.2) (0.8) (0.8) (0.8) (0.8)
CP Basis (13.7) (13.5) (12.9) (13.0) (13.3) (9.7) (8.6) (5.6) (2.9) (4.0) (4.1) (4.2) (4.1)
OIS Basis (9.5) (9.4) (9.0) (9.1) (9.3) (6.5) (3.6) (2.8) (1.8) (1.8) (1.8) (1.8) (1.8)
1m Basis (26.6) (26.3) (15.6) (11.4) (10.2) (5.7) (3.8) (1.5) (0.4) 0.6 0.6 2.1 2.6
3m Basis
6m Basis 10.5 10.4 9.9 10.0 10.2 7.9 7.1 5.7 5.2 5.1 5.3 5.3 5.3
12m Basis 21.7 21.5 20.5 20.7 21.2 16.9 14.9 11.9 10.7 11.1 8.4 7.5 5.5
Other Basis
(31.4) 8.8 (2.5) 8.3 19.2 19.5 20.1 21.3 21.2 20.1 15.1 12.1 8.5
Other Advanced Economies Directional Risks
Governments (25.3) (25.3) (28.2) (35.2) (42.3) (38.3) (33.8) (19.6) (14.5) (18.2) (18.6) (21.6) (21.8)
Agencies (25.3) (25.3) (28.2) (35.2) (42.3) (38.3) (33.8) (19.6) (14.5) (18.2) (18.6) (21.6) (21.8)
Municipals (25.3) (25.3) (28.2) (35.2) (42.3) (38.3) (33.8) (19.6) (14.5) (18.2) (18.6) (21.6) (21.8)
Swaps / Discounting Curve (1.6) (1.6) (1.6) (5.6) (9.5) (12.6) (8.8) (3.7) (0.5) 2.2 3.7 3.2 1.8
Instruments shocked by MV**
Other (1.6) (1.6) (1.6) (5.6) (9.5) (12.6) (8.8) (3.7) (0.5) 2.2 3.7 3.2 1.8
Directional Risks: Emerging Europe
BGN (4.7) (4.7) (11.4) (14.8) (18.2) (24.7) (28.3) (33.0) (36.7) (41.3) (46.4) (50.5) (56.0)
CZK (4.7) (4.7) (11.4) (14.8) (18.2) (24.7) (28.3) (33.0) (36.7) (41.3) (46.4) (50.5) (56.0)
HRK (4.7) (4.7) (11.4) (14.8) (18.2) (24.7) (28.3) (33.0) (36.7) (41.3) (46.4) (50.5) (56.0)
HUF (4.7) (4.7) (11.4) (14.8) (18.2) (24.7) (28.3) (33.0) (36.7) (41.3) (46.4) (50.5) (56.0)
PLN (4.7) (4.7) (11.4) (14.8) (18.2) (24.7) (28.3) (33.0) (36.7) (41.3) (46.4) (50.5) (56.0)
RON (4.7) (4.7) (11.4) (14.8) (18.2) (24.7) (28.3) (33.0) (36.7) (41.3) (46.4) (50.5) (56.0)
RUB 100.0 99.4 98.6 97.8 96.9 93.6 90.3 83.6 76.9 66.9 50.1 33.4 0.0
Other Emerging Europe (4.7) (4.7) (11.4) (14.8) (18.2) (24.7) (28.3) (33.0) (36.7) (41.3) (46.4) (50.5) (56.0)
Directional Risks: Latin America & Caribbean
ARS 100.0 99.4 98.6 97.8 96.9 93.6 90.3 83.6 76.9 66.9 50.1 33.4 0.0
BRL 100.0 99.4 98.6 97.8 96.9 93.6 90.3 83.6 76.9 66.9 50.1 33.4 0.0
CLP 22.3 22.3 20.5 18.9 17.2 6.8 (1.2) (10.2) (17.8) (19.9) (25.1) (26.5) (31.9)
COP 100.0 99.4 98.6 97.8 96.9 93.6 90.3 83.6 76.9 66.9 50.1 33.4 0.0
MXN 100.0 99.4 98.6 97.8 96.9 93.6 90.3 83.6 76.9 66.9 50.1 33.4 0.0
PEN 22.3 22.3 20.5 18.9 17.2 6.8 (1.2) (10.2) (17.8) (19.9) (25.1) (26.5) (31.9)
VEF 100.0 99.4 98.6 97.8 96.9 93.6 90.3 83.6 76.9 66.9 50.1 33.4 0.0
Other Latam & Caribbean 100.0 99.4 98.6 97.8 96.9 93.6 90.3 83.6 76.9 66.9 50.1 33.4 0.0
Absolute increase in Muni SIFMA/Libor Ratio
(Pts)
Page 145
145 | P a g e
Rates DV01 (Continued)
Directional Risks: Asia Ex-Japan
CNY 22.3 22.3 20.5 18.9 17.2 6.8 (1.2) (10.2) (17.8) (19.9) (25.1) (26.5) (31.9)
HKD 22.3 22.3 20.5 18.9 17.2 6.8 (1.2) (10.2) (17.8) (19.9) (25.1) (26.5) (31.9)
IDR 400.3 405.8 403.4 468.7 534.0 426.6 383.0 342.9 345.0 303.3 286.6 269.9 236.5
INR 28.7 28.7 24.0 14.3 4.7 (12.8) (17.0) (44.3) (56.2) (66.2) (61.2) (66.1) (74.1)
KRW 3.7 3.7 3.7 2.6 1.6 (4.2) (7.8) (11.5) (12.6) (13.7) (14.1) (14.1) (14.1)
MYR 826.0 806.4 794.6 854.3 913.9 852.5 810.8 771.5 744.5 692.9 676.2 659.4 626.0
PHP 891.9 915.2 947.6 999.8 1,051.9 815.5 753.4 668.6 636.2 591.9 575.2 558.4 525.0
SGD 22.3 22.3 20.5 18.9 17.2 6.8 (1.2) (10.2) (17.8) (19.9) (25.1) (26.5) (31.9)
THB 35.8 35.8 35.8 35.8 35.8 41.2 44.9 49.6 51.5 53.8 54.1 56.9 56.9
TWD 28.7 28.7 24.0 14.3 4.7 (12.8) (17.0) (44.3) (56.2) (66.2) (61.2) (66.1) (74.1)
Other Asia Ex-Japan 22.3 22.3 20.5 18.9 17.2 6.8 (1.2) (10.2) (17.8) (19.9) (25.1) (26.5) (31.9)
Directional Risks: Middle East/North Africa
ILS (25.3) (25.3) (28.2) (35.2) (42.3) (38.3) (33.8) (19.6) (14.5) (18.2) (18.6) (21.6) (21.8)
TRY 1.8 1.8 (0.5) (11.0) (21.5) (20.4) (19.5) (19.2) (17.9) (17.3) (22.2) (22.2) (22.2)
Other Middle East/Africa (16.5) (16.5) (22.1) (30.4) (38.6) (61.9) (64.1) (62.5) (60.7) (59.5) (54.8) (51.9) (54.9)
Directional Risks: Sub-Saharan Africa
ZAR (16.5) (16.5) (22.1) (30.4) (38.6) (61.9) (64.1) (62.5) (60.7) (59.5) (54.8) (51.9) (54.9)
Other Sub-Saharan Africa (16.5) (16.5) (22.1) (30.4) (38.6) (61.9) (64.1) (62.5) (60.7) (59.5) (54.8) (51.9) (54.9)
Page 146
146 | P a g e
Relative Normal Interest Rate Shocks
Rates Vega
Relative Normal Interest Rate Shocks (%)
1M 3M 6M 9M 1Y 2Y 3Y 5Y 7Y 10Y 15Y 20Y 25Y 30Y
AUD
1M -70.9% -70.9% -70.9% -70.9% -70.9% -40.0% -26.5% -18.2% -17.8% -15.2% -14.4% -15.1% -15.4% -15.8%
3M -61.7% -61.7% -61.7% -61.7% -61.7% -39.4% -26.0% -18.7% -18.4% -16.2% -15.4% -16.1% -16.4% -16.9%
6M -47.7% -47.7% -47.7% -47.7% -47.7% -34.0% -24.0% -19.0% -17.6% -16.7% -16.0% -16.6% -16.7% -16.5%
9M -35.1% -35.1% -35.1% -35.1% -35.1% -28.5% -22.7% -19.4% -17.8% -17.1% -16.6% -17.0% -16.8% -15.9%
1Y -25.3% -25.3% -25.3% -25.3% -25.3% -23.6% -21.5% -19.7% -18.1% -17.6% -17.2% -17.5% -17.0% -15.3%
2Y -22.3% -22.3% -22.3% -22.3% -22.3% -21.6% -20.1% -20.0% -18.3% -16.7% -17.0% -17.3% -17.3% -16.1%
3Y -23.3% -23.3% -23.3% -23.3% -23.3% -21.4% -19.8% -20.6% -19.0% -16.0% -16.9% -17.2% -17.7% -17.0%
5Y -22.2% -22.2% -22.2% -22.2% -22.2% -23.6% -22.8% -22.8% -22.1% -18.9% -20.2% -21.2% -21.1% -20.5%
7Y -23.5% -23.5% -23.5% -23.5% -23.5% -23.7% -22.7% -23.0% -22.8% -23.1% -21.9% -22.7% -22.7% -21.0%
10Y -24.5% -24.5% -24.5% -24.5% -24.5% -25.0% -24.2% -23.8% -25.0% -25.3% -25.7% -24.8% -16.7% -22.8%
15Y -22.3% -22.3% -22.3% -22.3% -22.3% -47.5% -28.2% -21.2% -22.9% -31.1% -27.6% -24.6% -24.0% -22.3%
20Y -17.9% -17.9% -17.9% -17.9% -17.9% -17.0% -16.1% -16.9% -17.5% -31.3% -26.0% -20.6% -21.3% -18.8%
30Y -22.7% -22.7% -22.7% -22.7% -22.7% -22.9% -23.4% -18.0% -18.5% -19.4% -22.4% -24.6% -26.5% -28.0%
EUR
1M -92.6% -92.6% -92.6% -92.6% -92.6% -94.5% -58.9% -30.0% -25.2% -19.8% -19.9% -21.6% -22.2% -23.4%
3M -93.2% -93.2% -93.2% -93.2% -93.2% -91.9% -56.9% -29.4% -24.7% -19.4% -19.7% -21.3% -22.1% -23.6%
6M -94.1% -94.1% -94.1% -94.1% -94.1% -75.6% -50.7% -27.9% -24.9% -19.1% -19.6% -21.2% -21.9% -22.4%
9M -79.0% -79.0% -79.0% -79.0% -79.0% -59.8% -44.2% -27.2% -25.8% -18.9% -19.5% -21.0% -21.5% -20.9%
1Y -58.4% -58.4% -58.4% -58.4% -58.4% -47.7% -39.2% -26.6% -26.5% -18.9% -19.6% -20.8% -21.1% -19.4%
2Y -38.8% -38.8% -38.8% -38.8% -38.8% -33.1% -29.8% -22.7% -25.1% -16.9% -18.2% -19.3% -19.0% -18.7%
3Y -28.1% -28.1% -28.1% -28.1% -28.1% -24.9% -24.3% -20.3% -24.4% -15.4% -17.3% -18.0% -17.0% -18.0%
5Y -32.9% -32.9% -32.9% -32.9% -32.9% -21.4% -23.6% -19.2% -24.8% -15.9% -18.1% -20.1% -20.5% -20.9%
7Y -32.0% -32.0% -32.0% -32.0% -32.0% -20.9% -24.0% -29.7% -28.7% -18.7% -19.6% -21.3% -22.0% -21.5%
10Y -19.2% -19.2% -19.2% -19.2% -19.2% -19.8% -24.5% -20.3% -30.7% -18.6% -21.6% -22.6% -10.8% -23.5%
15Y -30.9% -30.9% -30.9% -30.9% -30.9% -33.2% -19.1% -28.2% -29.4% -19.8% -20.9% -22.7% -23.3% -22.1%
20Y -19.2% -19.2% -19.2% -19.2% -19.2% -13.3% -22.0% -18.5% -22.2% -19.7% -18.2% -20.7% -20.9% -19.0%
30Y -21.0% -21.0% -21.0% -21.0% -21.0% -20.5% -20.4% -13.0% -13.1% -13.4% -14.6% -15.7% -16.2% -16.7%
GBP
1M -88.0% -88.0% -88.0% -88.0% -88.0% -53.4% -30.0% -16.7% -14.2% -12.3% -11.8% -12.8% -13.3% -13.6%
3M -86.1% -86.1% -86.1% -86.1% -86.1% -48.0% -28.0% -16.6% -13.9% -12.3% -11.9% -12.9% -13.4% -13.7%
6M -60.2% -60.2% -60.2% -60.2% -60.2% -37.5% -24.3% -15.1% -12.7% -12.0% -11.7% -12.6% -12.9% -12.7%
9M -43.0% -43.0% -43.0% -43.0% -43.0% -30.6% -21.6% -14.4% -12.3% -11.7% -11.7% -12.5% -12.6% -12.0%
1Y -31.0% -31.0% -31.0% -31.0% -31.0% -25.0% -19.7% -13.7% -11.5% -11.5% -11.7% -12.5% -12.3% -11.2%
2Y -21.7% -21.7% -21.7% -21.7% -21.7% -19.1% -16.7% -13.9% -11.6% -10.7% -11.4% -12.1% -11.3% -11.1%
3Y -19.3% -19.3% -19.3% -19.3% -19.3% -17.3% -15.8% -14.7% -11.9% -10.0% -11.1% -11.8% -10.4% -11.1%
5Y -16.2% -16.2% -16.2% -16.2% -16.2% -15.1% -14.4% -13.6% -11.3% -10.2% -11.2% -12.0% -11.6% -12.2%
7Y -15.7% -15.7% -15.7% -15.7% -15.7% -16.7% -15.6% -12.9% -13.7% -13.4% -13.1% -13.7% -13.8% -13.4%
10Y -17.9% -17.9% -17.9% -17.9% -17.9% -18.4% -17.7% -15.8% -15.0% -14.8% -15.1% -15.1% -7.5% -14.7%
15Y -15.0% -15.0% -15.0% -15.0% -15.0% -23.6% -13.7% -15.9% -16.2% -15.7% -17.0% -15.5% -15.0% -14.2%
20Y -10.0% -10.0% -10.0% -10.0% -10.0% -10.6% -13.0% -14.7% -14.8% -15.9% -13.9% -15.2% -13.8% -11.6%
30Y -9.3% -9.3% -9.3% -9.3% -9.3% -9.6% -9.8% -10.0% -10.2% -10.5% -11.0% -11.5% -12.1% -12.6%
JPY
1M -85.3% -85.3% -85.3% -85.3% -85.3% -66.3% -53.7% -35.3% -40.2% -38.1% -26.8% -20.6% -18.6% -16.9%
3M -68.3% -68.3% -68.3% -68.3% -68.3% -58.3% -46.7% -30.0% -34.4% -33.1% -25.3% -20.4% -18.5% -16.9%
6M -57.7% -57.7% -57.7% -57.7% -57.7% -52.1% -44.5% -34.4% -37.4% -35.7% -28.2% -23.2% -21.1% -19.3%
9M -49.1% -49.1% -49.1% -49.1% -49.1% -47.2% -43.2% -38.8% -40.4% -38.3% -30.2% -24.1% -22.5% -21.1%
1Y -40.8% -40.8% -40.8% -40.8% -40.8% -42.5% -41.9% -43.2% -43.2% -40.8% -33.5% -26.5% -24.5% -22.9%
2Y -39.5% -39.5% -39.5% -39.5% -39.5% -40.0% -41.9% -51.4% -46.3% -39.3% -33.3% -27.3% -26.2% -25.1%
3Y -38.9% -38.9% -38.9% -38.9% -38.9% -38.9% -43.0% -57.3% -46.6% -37.7% -32.8% -27.5% -26.5% -25.5%
5Y -48.6% -48.6% -48.6% -48.6% -48.6% -51.1% -53.2% -52.6% -44.1% -37.5% -34.8% -30.6% -29.6% -28.7%
7Y -58.0% -58.0% -58.0% -58.0% -58.0% -56.1% -56.8% -46.4% -49.0% -43.0% -40.5% -36.8% -35.8% -34.8%
10Y -53.5% -53.5% -53.5% -53.5% -53.5% -50.9% -51.3% -46.6% -44.8% -38.3% -36.8% -35.5% -34.6% -33.7%
15Y -43.3% -43.3% -43.3% -43.3% -43.3% -48.2% -27.1% -41.8% -42.6% -38.4% -36.3% -34.7% -33.7% -32.9%
20Y -23.5% -23.5% -23.5% -23.5% -23.5% -25.2% -29.9% -28.7% -28.1% -36.3% -34.3% -32.5% -31.6% -30.8%
30Y -15.3% -15.3% -15.3% -15.3% -15.3% -16.2% -16.4% -15.5% -15.3% -15.1% -12.7% -11.9% -11.2% -10.5%
E X P
I R Y
M A T U R I T Y
E X P
I R Y
E X P
I R Y
E X P
I R Y
Page 147
147 | P a g e
Relative Normal Interest Rate Shocks (Continued)
USD
1M -91.8% -91.8% -91.8% -91.8% -91.8% -49.1% -33.2% -20.2% -20.4% -19.4% -19.7% -21.4% -22.1% -22.6%
3M -73.2% -73.2% -73.2% -73.2% -73.2% -40.1% -28.1% -18.3% -18.5% -17.8% -18.0% -19.5% -20.3% -20.9%
6M -51.1% -51.1% -51.1% -51.1% -51.1% -32.7% -22.8% -18.5% -18.1% -17.6% -17.9% -19.1% -19.5% -19.3%
9M -34.6% -34.6% -34.6% -34.6% -34.6% -27.7% -22.4% -18.8% -18.0% -17.7% -18.5% -19.8% -19.6% -18.3%
1Y -25.8% -25.8% -25.8% -25.8% -25.8% -23.1% -21.4% -18.9% -17.6% -17.9% -18.7% -19.7% -19.3% -17.3%
2Y -20.3% -20.3% -20.3% -20.3% -20.3% -19.0% -17.5% -18.4% -17.2% -16.3% -17.6% -18.6% -18.6% -17.2%
3Y -18.7% -18.7% -18.7% -18.7% -18.7% -17.8% -16.9% -18.3% -17.1% -14.9% -16.8% -17.7% -18.1% -17.3%
5Y -18.4% -18.4% -18.4% -18.4% -18.4% -19.7% -19.2% -19.3% -19.2% -16.5% -19.0% -20.4% -20.2% -19.5%
7Y -20.5% -20.5% -20.5% -20.5% -20.5% -21.1% -20.2% -20.2% -20.1% -20.4% -20.7% -21.8% -21.7% -20.0%
10Y -23.0% -23.0% -23.0% -23.0% -23.0% -24.0% -23.0% -22.3% -23.3% -23.6% -25.2% -24.8% -16.6% -22.3%
15Y -23.7% -23.7% -23.7% -23.7% -23.7% -51.2% -30.2% -22.2% -23.6% -31.4% -28.8% -26.5% -25.7% -22.7%
20Y -20.2% -20.2% -20.2% -20.2% -20.2% -19.3% -18.0% -18.2% -18.3% -31.9% -28.2% -22.0% -21.4% -17.9%
30Y -16.8% -16.8% -16.8% -16.8% -16.8% -17.0% -16.9% -19.6% -19.7% -19.8% -21.7% -20.8% -20.9% -21.1%
US MBS Vega
Other Advanced Economies1M -56.1% -56.1% -56.1% -56.1% -56.1% -31.7% -20.1% -13.2% -13.3% -11.5% -12.4% -13.9% -14.6% -15.9%
3M -48.8% -48.8% -48.8% -48.8% -48.8% -31.2% -19.8% -13.5% -13.8% -12.3% -13.2% -14.8% -15.6% -17.0%
6M -38.2% -38.2% -38.2% -38.2% -38.2% -26.7% -18.2% -13.8% -14.2% -12.7% -13.6% -15.0% -15.6% -16.2%
9M -28.6% -28.6% -28.6% -28.6% -28.6% -22.0% -17.3% -14.2% -15.5% -13.1% -13.9% -15.1% -15.5% -15.3%
1Y -21.0% -21.0% -21.0% -21.0% -21.0% -18.0% -16.4% -14.5% -16.9% -13.4% -14.2% -15.2% -15.4% -14.3%
2Y -17.9% -17.9% -17.9% -17.9% -17.9% -16.5% -16.1% -14.8% -18.1% -13.3% -14.3% -15.1% -14.8% -14.6%
3Y -18.1% -18.1% -18.1% -18.1% -18.1% -16.3% -16.6% -15.4% -19.9% -13.2% -14.5% -14.9% -14.1% -14.9%
5Y -27.3% -27.3% -27.3% -27.3% -27.3% -18.3% -20.3% -17.4% -22.9% -15.6% -16.8% -18.4% -18.6% -18.7%
7Y -29.0% -29.0% -29.0% -29.0% -29.0% -19.2% -22.3% -28.4% -28.1% -19.1% -18.7% -20.0% -20.2% -19.5%
10Y -18.1% -18.1% -18.1% -18.1% -18.1% -18.8% -23.7% -20.1% -30.9% -19.2% -21.0% -21.7% -10.1% -21.7%
15Y -26.8% -26.8% -26.8% -26.8% -26.8% -29.5% -17.2% -26.1% -28.3% -19.7% -19.7% -20.3% -20.2% -19.5%
20Y -16.5% -16.5% -16.5% -16.5% -16.5% -11.7% -19.8% -17.5% -21.7% -19.9% -16.9% -18.0% -18.6% -17.2%
30Y -26.9% -26.9% -26.9% -26.9% -26.9% -27.2% -27.7% -11.3% -11.7% -12.2% -14.1% -15.5% -16.7% -17.7%
Total Emerging Europe
1M -85.0% -85.0% -85.0% -85.0% -85.0% -84.8% -88.4% -78.9% -66.7% -48.9% -45.4% -45.2% -47.0% -50.5%
3M -83.4% -83.4% -83.4% -83.4% -83.4% -85.1% -89.0% -76.3% -64.7% -48.0% -44.8% -44.9% -46.8% -50.3%
6M -80.7% -80.7% -80.7% -80.7% -80.7% -86.0% -90.0% -74.1% -66.0% -47.4% -44.1% -43.8% -45.2% -46.4%
9M -81.6% -81.6% -81.6% -81.6% -81.6% -87.5% -91.0% -71.5% -66.9% -46.7% -43.5% -42.8% -43.6% -42.6%
1Y -83.4% -83.4% -83.4% -83.4% -83.4% -89.0% -92.0% -68.7% -67.3% -45.9% -42.8% -41.8% -42.1% -38.8%
2Y -91.8% -91.8% -91.8% -91.8% -91.8% -81.3% -69.9% -55.5% -58.6% -38.7% -37.4% -37.1% -36.3% -35.9%
3Y -69.9% -69.9% -69.9% -69.9% -69.9% -57.4% -55.7% -45.8% -53.4% -33.4% -33.2% -33.1% -31.1% -33.4%
5Y -81.4% -81.4% -81.4% -81.4% -81.4% -52.3% -52.3% -39.9% -51.2% -31.9% -31.4% -34.8% -35.0% -36.6%
7Y -62.7% -62.7% -62.7% -62.7% -62.7% -41.0% -46.0% -57.1% -54.3% -33.8% -32.0% -34.7% -35.7% -35.8%
10Y -37.5% -37.5% -37.5% -37.5% -37.5% -38.2% -46.4% -36.6% -52.7% -30.0% -34.1% -35.3% -17.3% -38.5%
15Y -44.6% -44.6% -44.6% -44.6% -44.6% -48.3% -27.5% -39.4% -44.3% -31.1% -31.6% -34.7% -36.2% -34.6%
20Y -33.8% -33.8% -33.8% -33.8% -33.8% -23.8% -39.8% -33.5% -39.7% -34.4% -31.6% -35.2% -35.5% -32.0%
30Y -43.5% -43.5% -43.5% -43.5% -43.5% -43.6% -43.9% -27.8% -28.1% -28.5% -29.3% -30.0% -30.6% -31.3%
Total Latam & Caribbean1M -21.5% -21.5% -21.5% -21.5% -21.5% -15.8% -12.3% -9.0% -9.4% -9.0% -8.8% -9.3% -9.4% -9.6%
3M -20.1% -20.1% -20.1% -20.1% -20.1% -15.0% -11.7% -8.6% -9.0% -8.7% -8.6% -9.1% -9.3% -9.5%
6M -17.3% -17.3% -17.3% -17.3% -17.3% -13.7% -11.3% -8.8% -8.9% -8.8% -8.7% -9.1% -9.1% -9.0%
9M -14.2% -14.2% -14.2% -14.2% -14.2% -12.3% -10.9% -9.0% -8.7% -8.6% -8.7% -9.0% -8.8% -8.3%
1Y -11.2% -11.2% -11.2% -11.2% -11.2% -10.9% -10.3% -9.1% -8.5% -8.5% -8.6% -8.8% -8.4% -7.6%
2Y -10.0% -10.0% -10.0% -10.0% -10.0% -9.6% -9.1% -8.9% -8.0% -7.0% -7.3% -7.4% -7.4% -6.9%
3Y -9.9% -9.9% -9.9% -9.9% -9.9% -9.1% -8.3% -8.5% -7.7% -6.3% -6.8% -6.8% -7.0% -6.8%
5Y -8.7% -8.7% -8.7% -8.7% -8.7% -9.1% -8.7% -8.3% -8.1% -6.8% -7.2% -7.4% -7.3% -7.2%
7Y -8.8% -8.8% -8.8% -8.8% -8.8% -8.9% -8.5% -8.1% -8.0% -7.8% -7.3% -7.4% -7.4% -7.1%
10Y -8.2% -8.2% -8.2% -8.2% -8.2% -8.5% -8.2% -8.1% -8.2% -8.1% -7.9% -7.5% -5.3% -7.4%
15Y -7.1% -7.1% -7.1% -7.1% -7.1% -15.5% -9.2% -7.0% -7.0% -9.1% -8.0% -7.7% -8.0% -7.4%
20Y -4.7% -4.7% -4.7% -4.7% -4.7% -4.5% -4.4% -4.6% -4.8% -8.5% -8.4% -7.4% -7.8% -7.0%
30Y -14.3% -14.3% -14.3% -14.3% -14.3% -14.6% -14.9% -18.0% -18.6% -19.3% -20.4% -21.4% -22.3% -23.2%
E X
P I R
YE
X P
I R Y
E X
P I R
YE
X P
I R Y
Page 148
148 | P a g e
Relative Normal Interest Rate Shocks (Continued)
Total Asia Ex-Japan1M 45.9% 45.9% 45.9% 45.9% 45.9% 39.3% 31.7% 24.7% 25.3% -24.0% -24.1% -27.8% -29.7% -31.4%
3M 46.2% 46.2% 46.2% 46.2% 46.2% 39.3% 31.5% 24.6% 25.2% -23.9% -24.1% -27.8% -29.7% -31.5%
6M 41.5% 41.5% 41.5% 41.5% 41.5% 36.6% 31.5% 26.6% 26.4% -25.0% -25.6% -29.2% -30.6% -31.1%
9M 34.9% 34.9% 34.9% 34.9% 34.9% 34.1% 31.6% 28.7% 27.3% -26.5% -27.6% -31.0% -31.9% -31.0%
1Y 28.7% 28.7% 28.7% 28.7% 28.7% 31.5% 31.5% 30.8% 28.2% -28.0% -29.5% -32.7% -33.1% -30.7%
2Y 30.9% 30.9% 30.9% 30.9% 30.9% 33.1% 32.2% 33.9% 31.4% -28.9% -32.2% -35.4% -36.7% -35.1%
3Y 33.6% 33.6% 33.6% 33.6% 33.6% 33.8% 32.2% 35.3% 33.0% -28.4% -33.3% -36.2% -38.6% -38.1%
5Y 36.3% 36.3% 36.3% 36.3% 36.3% 38.2% 39.1% 38.9% 38.6% -32.5% -39.2% -43.0% -43.9% -43.8%
7Y 37.7% 37.7% 37.7% 37.7% 37.7% 37.8% 37.3% 37.9% 37.8% -37.8% -39.5% -42.3% -43.4% -41.2%
10Y 43.0% 43.0% 43.0% 43.0% 43.0% 43.5% 43.0% 41.5% 43.6% -42.6% -44.4% -43.5% -29.9% -41.5%
15Y 57.7% 57.7% 57.7% 57.7% 57.7% 96.7% 73.5% 54.0% 52.2% -61.6% -53.4% -48.1% -47.3% -42.4%
20Y 43.8% 43.8% 43.8% 43.8% 43.8% 41.2% 38.5% 38.3% 36.5% -58.2% -49.4% -39.7% -39.2% -33.4%
30Y -38.0% -38.0% -38.0% -38.0% -38.0% -37.8% -37.8% -43.9% -42.2% -39.7% -40.8% -41.8% -42.8% -43.8%
Total ME/N. Africa1M -48.0% -48.0% -48.0% -48.0% -48.0% -39.3% -30.9% -23.3% -21.8% -18.3% -19.7% -22.6% -24.6% -26.4%
3M -31.3% -31.3% -31.3% -31.3% -31.3% -26.6% -22.0% -17.8% -17.7% -16.3% -17.7% -20.2% -22.0% -23.7%
6M -24.6% -24.6% -24.6% -24.6% -24.6% -21.4% -18.6% -15.7% -15.3% -14.5% -15.9% -18.1% -19.3% -20.0%
9M -19.5% -19.5% -19.5% -19.5% -19.5% -17.8% -16.2% -14.4% -13.5% -13.2% -14.7% -16.5% -17.3% -17.1%
1Y -15.0% -15.0% -15.0% -15.0% -15.0% -14.7% -14.0% -13.3% -12.3% -12.5% -14.0% -15.6% -16.1% -15.2%
2Y -15.7% -15.7% -15.7% -15.7% -15.7% -15.3% -14.8% -14.5% -13.3% -12.8% -14.9% -16.6% -17.6% -17.1%
3Y -16.8% -16.8% -16.8% -16.8% -16.8% -15.8% -14.7% -15.3% -14.0% -13.0% -15.7% -17.4% -19.0% -19.0%
5Y -16.9% -16.9% -16.9% -16.9% -16.9% -17.9% -17.5% -17.4% -19.1% -17.9% -21.6% -24.4% -25.5% -25.9%
7Y -16.9% -16.9% -16.9% -16.9% -16.9% -17.5% -16.8% -19.8% -21.4% -23.4% -24.6% -27.0% -28.3% -27.3%
10Y -25.7% -25.7% -25.7% -25.7% -25.7% -28.1% -27.7% -28.2% -30.5% -31.9% -33.8% -33.6% -23.5% -32.9%
15Y -28.3% -28.3% -28.3% -28.3% -28.3% -63.9% -38.7% -30.0% -32.7% -44.6% -40.3% -37.2% -37.3% -34.0%
20Y -25.2% -25.2% -25.2% -25.2% -25.2% -25.1% -24.2% -25.6% -26.5% -47.3% -40.8% -33.3% -33.3% -28.7%
30Y -24.0% -24.0% -24.0% -24.0% -24.0% -25.2% -25.9% -31.9% -33.1% -34.5% -35.9% -37.2% -38.5% -39.7%
Total Sub-Saharan Africa1M -48.2% -48.2% -48.2% -48.2% -48.2% -29.5% -22.1% -12.7% -12.3% -11.8% -11.4% -12.7% -13.9% -15.4%
3M -45.6% -45.6% -45.6% -45.6% -45.6% -25.0% -19.5% -11.9% -11.6% -11.2% -10.9% -12.1% -13.2% -14.7%
6M -29.5% -29.5% -29.5% -29.5% -29.5% -18.8% -15.7% -11.5% -10.9% -10.6% -10.5% -11.6% -12.4% -13.1%
9M -20.4% -20.4% -20.4% -20.4% -20.4% -15.8% -14.2% -11.4% -10.6% -10.5% -10.5% -11.5% -12.1% -12.3%
1Y -14.5% -14.5% -14.5% -14.5% -14.5% -13.4% -13.1% -11.3% -10.3% -10.4% -10.6% -11.5% -11.8% -11.4%
2Y -11.5% -11.5% -11.5% -11.5% -11.5% -11.7% -11.0% -10.6% -9.7% -9.1% -9.8% -10.4% -10.8% -10.4%
3Y -11.7% -11.7% -11.7% -11.7% -11.7% -10.5% -9.8% -10.1% -9.3% -8.0% -8.9% -9.4% -10.1% -10.0%
5Y -11.0% -11.0% -11.0% -11.0% -11.0% -10.9% -10.5% -10.1% -9.9% -8.3% -9.3% -10.1% -10.2% -10.1%
7Y -10.6% -10.6% -10.6% -10.6% -10.6% -10.7% -10.2% -10.0% -9.7% -9.5% -9.6% -10.2% -10.4% -9.7%
10Y -10.4% -10.4% -10.4% -10.4% -10.4% -10.7% -10.3% -9.9% -10.2% -10.0% -10.6% -10.5% -7.3% -10.1%
15Y -11.8% -11.8% -11.8% -11.8% -11.8% -23.9% -13.7% -10.2% -10.8% -13.9% -12.3% -11.5% -11.6% -10.6%
20Y -10.9% -10.9% -10.9% -10.9% -10.9% -9.8% -8.8% -8.8% -8.8% -14.6% -13.2% -11.1% -11.3% -9.9%
30Y -20.7% -20.7% -20.7% -20.7% -20.7% -20.5% -18.7% -19.9% -18.3% -16.4% -17.1% -17.9% -18.5% -19.2%
E X
P I
R Y
E X
P I
R Y
E X
P I
R Y
Page 149
149 | P a g e
Absolute Normal Interest Rate Shocks
Rates Vega
Absolute Normal Interest Rate Shocks (bps)
1M 3M 6M 9M 1Y 2Y 3Y 5Y 7Y 10Y 15Y 20Y 25Y 30Y
AUD1M (25.3) (25.3) (25.3) (25.3) (25.3) (22.0) (18.5) (15.4) (16.0) (15.4) (15.5) (16.8) (17.4) (17.9)
3M (25.3) (25.3) (25.3) (25.3) (25.3) (22.0) (18.5) (15.4) (16.0) (15.4) (15.5) (16.8) (17.4) (17.9)
6M (22.1) (22.1) (22.1) (22.1) (22.1) (20.4) (18.1) (15.8) (15.9) (15.6) (15.9) (16.9) (17.2) (17.0)
9M (18.9) (18.9) (18.9) (18.9) (18.9) (18.8) (17.6) (16.2) (15.8) (15.8) (16.2) (17.1) (17.0) (16.0)
1Y (15.7) (15.7) (15.7) (15.7) (15.7) (17.2) (17.2) (16.6) (15.7) (15.9) (16.5) (17.2) (16.8) (15.1)
2Y (16.6) (16.6) (16.6) (16.6) (16.6) (16.9) (16.4) (16.5) (15.5) (14.6) (15.5) (16.0) (16.0) (14.8)
3Y (17.5) (17.5) (17.5) (17.5) (17.5) (16.6) (15.5) (16.5) (15.4) (13.2) (14.5) (14.9) (15.2) (14.5)
5Y (17.3) (17.3) (17.3) (17.3) (17.3) (18.1) (17.6) (17.4) (17.1) (14.3) (15.6) (16.4) (16.1) (15.5)
7Y (18.3) (18.3) (18.3) (18.3) (18.3) (18.5) (17.6) (17.5) (17.1) (16.9) (16.1) (16.5) (16.3) (15.0)
10Y (18.7) (18.7) (18.7) (18.7) (18.7) (19.3) (18.4) (17.7) (18.2) (17.9) (17.9) (17.0) (11.3) (15.3)
15Y (17.4) (17.4) (17.4) (17.4) (17.4) (37.2) (21.8) (16.0) (16.7) (21.6) (18.5) (16.3) (15.7) (13.8)
20Y (13.4) (13.4) (13.4) (13.4) (13.4) (12.7) (11.8) (11.9) (11.8) (20.1) (16.5) (12.9) (12.5) (10.4)
30Y (10.0) (10.0) (10.0) (10.0) (10.0) (10.0) (10.0) (11.7) (11.7) (11.7) (11.7) (11.7) (11.7) (11.7)
EUR1M (12.5) (12.5) (12.5) (12.5) (12.5) (17.1) (14.1) (11.1) (11.9) (11.6) (13.3) (15.5) (16.5) (18.0)
3M (13.6) (13.6) (13.6) (13.6) (13.6) (17.5) (14.1) (11.1) (11.9) (11.6) (13.3) (15.5) (16.5) (18.0)
6M (15.9) (15.9) (15.9) (15.9) (15.9) (16.0) (13.7) (11.5) (12.8) (11.8) (13.4) (15.3) (16.1) (16.7)
9M (15.4) (15.4) (15.4) (15.4) (15.4) (14.6) (13.4) (11.8) (13.7) (12.0) (13.5) (15.1) (15.7) (15.4)
1Y (13.1) (13.1) (13.1) (13.1) (13.1) (13.1) (13.1) (12.2) (14.6) (12.2) (13.6) (15.0) (15.3) (14.1)
2Y (13.3) (13.3) (13.3) (13.3) (13.3) (12.9) (13.1) (12.2) (15.3) (11.6) (13.0) (13.9) (13.7) (13.4)
3Y (13.5) (13.5) (13.5) (13.5) (13.5) (12.6) (13.1) (12.3) (16.1) (10.9) (12.4) (12.9) (12.1) (12.7)
5Y (21.3) (21.3) (21.3) (21.3) (21.3) (14.0) (15.7) (13.3) (17.8) (11.8) (13.0) (14.2) (14.1) (14.2)
7Y (22.6) (22.6) (22.6) (22.6) (22.6) (15.0) (17.3) (21.6) (21.1) (14.0) (13.8) (14.6) (14.5) (13.9)
10Y (13.8) (13.8) (13.8) (13.8) (13.8) (14.5) (18.0) (14.9) (22.5) (13.6) (14.7) (14.8) (6.8) (14.5)
15Y (20.9) (20.9) (20.9) (20.9) (20.9) (23.1) (13.3) (19.7) (20.6) (13.7) (13.3) (13.5) (13.2) (12.1)
20Y (12.3) (12.3) (12.3) (12.3) (12.3) (8.7) (14.6) (12.3) (14.6) (12.7) (10.7) (11.3) (10.9) (9.5)
30Y (11.8) (11.8) (11.8) (11.8) (11.8) (11.8) (11.8) (7.4) (7.4) (7.4) (7.4) (7.4) (7.4) (7.4)
GBP1M (19.7) (19.7) (19.7) (19.7) (19.7) (16.2) (12.4) (10.2) (10.2) (10.3) (10.0) (10.8) (11.2) (11.4)
3M (19.7) (19.7) (19.7) (19.7) (19.7) (16.2) (12.4) (10.2) (10.2) (10.3) (10.0) (10.8) (11.2) (11.4)
6M (17.3) (17.3) (17.3) (17.3) (17.3) (15.0) (12.2) (10.1) (9.9) (10.1) (10.0) (10.7) (10.9) (10.8)
9M (14.9) (14.9) (14.9) (14.9) (14.9) (13.8) (11.9) (10.1) (9.5) (10.0) (10.0) (10.7) (10.7) (10.1)
1Y (12.5) (12.5) (12.5) (12.5) (12.5) (12.6) (11.6) (10.0) (9.2) (9.9) (10.0) (10.7) (10.5) (9.5)
2Y (13.3) (13.3) (13.3) (13.3) (13.3) (12.8) (12.0) (11.0) (9.6) (9.1) (9.6) (10.2) (9.5) (9.2)
3Y (14.0) (14.0) (14.0) (14.0) (14.0) (13.1) (12.4) (12.0) (9.9) (8.4) (9.2) (9.7) (8.4) (8.9)
5Y (13.5) (13.5) (13.5) (13.5) (13.5) (12.5) (11.9) (11.2) (9.2) (8.2) (8.9) (9.3) (8.9) (9.3)
7Y (13.4) (13.4) (13.4) (13.4) (13.4) (13.9) (12.9) (10.5) (11.0) (10.5) (10.0) (10.2) (10.1) (9.6)
10Y (14.8) (14.8) (14.8) (14.8) (14.8) (14.8) (14.0) (12.2) (11.4) (11.0) (10.8) (10.4) (5.0) (9.7)
15Y (11.4) (11.4) (11.4) (11.4) (11.4) (17.4) (9.9) (11.1) (11.1) (10.5) (10.9) (9.6) (8.9) (8.1)
20Y (7.0) (7.0) (7.0) (7.0) (7.0) (7.2) (8.7) (9.4) (9.3) (9.8) (8.2) (8.6) (7.4) (6.0)
30Y (5.9) (5.9) (5.9) (5.9) (5.9) (5.9) (5.9) (5.8) (5.8) (5.8) (5.8) (5.8) (5.8) (5.8)
JPY1M (12.0) (12.0) (12.0) (12.0) (12.0) (10.3) (8.6) (6.9) (8.4) (9.0) (9.0) (9.0) (9.0) (9.0)
3M (12.0) (12.0) (12.0) (12.0) (12.0) (10.3) (8.6) (6.9) (8.4) (9.0) (9.0) (9.0) (9.0) (9.0)
6M (10.5) (10.5) (10.5) (10.5) (10.5) (9.6) (8.4) (7.6) (8.9) (9.6) (9.6) (9.6) (9.6) (9.6)
9M (9.0) (9.0) (9.0) (9.0) (9.0) (8.8) (8.2) (8.2) (9.4) (10.2) (10.2) (10.2) (10.2) (10.2)
1Y (7.5) (7.5) (7.5) (7.5) (7.5) (8.0) (8.0) (8.9) (10.0) (10.7) (10.7) (10.7) (10.7) (10.7)
2Y (8.1) (8.1) (8.1) (8.1) (8.1) (8.3) (8.7) (11.0) (10.7) (10.7) (10.7) (10.7) (10.7) (10.7)
3Y (8.7) (8.7) (8.7) (8.7) (8.7) (8.6) (9.5) (13.1) (11.5) (10.7) (10.7) (10.7) (10.7) (10.7)
5Y (12.5) (12.5) (12.5) (12.5) (12.5) (13.1) (13.5) (13.8) (12.4) (12.0) (12.0) (12.0) (12.0) (12.0)
7Y (15.7) (15.7) (15.7) (15.7) (15.7) (15.3) (15.6) (12.9) (14.6) (14.3) (14.3) (14.3) (14.3) (14.3)
10Y (16.1) (16.1) (16.1) (16.1) (16.1) (15.8) (16.3) (15.3) (15.3) (13.9) (13.9) (13.9) (13.9) (13.9)
15Y (14.6) (14.6) (14.6) (14.6) (14.6) (16.3) (9.3) (14.9) (15.5) (14.5) (14.5) (14.5) (14.5) (14.5)
20Y (8.9) (8.9) (8.9) (8.9) (8.9) (9.3) (11.0) (11.1) (11.0) (14.5) (14.5) (14.5) (14.5) (14.5)
30Y (6.2) (6.2) (6.2) (6.2) (6.2) (6.2) (6.2) (6.2) (6.2) (6.2) (6.2) (6.2) (6.2) (6.2)
M A T U R I T Y
E X
P I R
YE
X P
I R Y
E X
P I R
YE
X P
I R Y
Page 150
150 | P a g e
Absolute Normal Interest Rate Shocks (Continued)
USD1M (25.3) (25.3) (25.3) (25.3) (25.3) (22.0) (18.5) (15.4) (16.0) (15.4) (15.5) (16.8) (17.4) (17.9)
3M (25.3) (25.3) (25.3) (25.3) (25.3) (22.0) (18.5) (15.4) (16.0) (15.4) (15.5) (16.8) (17.4) (17.9)
6M (22.1) (22.1) (22.1) (22.1) (22.1) (20.4) (18.1) (15.8) (15.9) (15.6) (15.9) (16.9) (17.2) (17.0)
9M (18.9) (18.9) (18.9) (18.9) (18.9) (18.8) (17.6) (16.2) (15.8) (15.8) (16.2) (17.1) (17.0) (16.0)
1Y (15.7) (15.7) (15.7) (15.7) (15.7) (17.2) (17.2) (16.6) (15.7) (15.9) (16.5) (17.2) (16.8) (15.1)
2Y (16.6) (16.6) (16.6) (16.6) (16.6) (16.9) (16.4) (16.5) (15.5) (14.6) (15.5) (16.0) (16.0) (14.8)
3Y (17.5) (17.5) (17.5) (17.5) (17.5) (16.6) (15.5) (16.5) (15.4) (13.2) (14.5) (14.9) (15.2) (14.5)
5Y (17.3) (17.3) (17.3) (17.3) (17.3) (18.1) (17.6) (17.4) (17.1) (14.3) (15.6) (16.4) (16.1) (15.5)
7Y (18.3) (18.3) (18.3) (18.3) (18.3) (18.5) (17.6) (17.5) (17.1) (16.9) (16.1) (16.5) (16.3) (15.0)
10Y (18.7) (18.7) (18.7) (18.7) (18.7) (19.3) (18.4) (17.7) (18.2) (17.9) (17.9) (17.0) (11.3) (15.3)
15Y (17.4) (17.4) (17.4) (17.4) (17.4) (37.2) (21.8) (16.0) (16.7) (21.6) (18.5) (16.3) (15.7) (13.8)
20Y (13.4) (13.4) (13.4) (13.4) (13.4) (12.7) (11.8) (11.9) (11.8) (20.1) (16.5) (12.9) (12.5) (10.4)
30Y (10.0) (10.0) (10.0) (10.0) (10.0) (10.0) (10.0) (11.7) (11.7) (11.7) (11.7) (11.7) (11.7) (11.7)
US MBS Vega
Other Advanced Economies1M (20.0) (20.0) (20.0) (20.0) (20.0) (17.5) (14.1) (11.1) (11.9) (11.6) (13.3) (15.5) (16.5) (18.0)
3M (20.0) (20.0) (20.0) (20.0) (20.0) (17.5) (14.1) (11.1) (11.9) (11.6) (13.3) (15.5) (16.5) (18.0)
6M (17.7) (17.7) (17.7) (17.7) (17.7) (16.0) (13.7) (11.5) (12.8) (11.8) (13.4) (15.3) (16.1) (16.7)
9M (15.4) (15.4) (15.4) (15.4) (15.4) (14.6) (13.4) (11.8) (13.7) (12.0) (13.5) (15.1) (15.7) (15.4)
1Y (13.1) (13.1) (13.1) (13.1) (13.1) (13.1) (13.1) (12.2) (14.6) (12.2) (13.6) (15.0) (15.3) (14.1)
2Y (13.3) (13.3) (13.3) (13.3) (13.3) (12.9) (13.1) (12.2) (15.3) (11.6) (13.0) (13.9) (13.7) (13.4)
3Y (13.5) (13.5) (13.5) (13.5) (13.5) (12.6) (13.1) (12.3) (16.1) (10.9) (12.4) (12.9) (12.1) (12.7)
5Y (21.3) (21.3) (21.3) (21.3) (21.3) (14.0) (15.7) (13.3) (17.8) (11.8) (13.0) (14.2) (14.1) (14.2)
7Y (22.6) (22.6) (22.6) (22.6) (22.6) (15.0) (17.3) (21.6) (21.1) (14.0) (13.8) (14.6) (14.5) (13.9)
10Y (13.8) (13.8) (13.8) (13.8) (13.8) (14.5) (18.0) (14.9) (22.5) (13.6) (14.7) (14.8) (6.8) (14.5)
15Y (20.9) (20.9) (20.9) (20.9) (20.9) (23.1) (13.3) (19.7) (20.6) (13.7) (13.3) (13.5) (13.2) (12.1)
20Y (12.3) (12.3) (12.3) (12.3) (12.3) (8.7) (14.6) (12.3) (14.6) (12.7) (10.7) (11.3) (10.9) (9.5)
30Y (11.8) (11.8) (11.8) (11.8) (11.8) (11.8) (11.8) (7.4) (7.4) (7.4) (7.4) (7.4) (7.4) (7.4)
Total Emerging Europe1M (5.7) (5.7) (5.7) (5.7) (5.7) (5.6) (7.6) (11.1) (11.9) (11.6) (13.3) (15.5) (16.5) (18.0)
3M (5.0) (5.0) (5.0) (5.0) (5.0) (5.7) (8.1) (11.1) (11.9) (11.6) (13.3) (15.5) (16.5) (18.0)
6M (4.2) (4.2) (4.2) (4.2) (4.2) (6.1) (9.0) (11.5) (12.8) (11.8) (13.4) (15.3) (16.1) (16.7)
9M (4.4) (4.4) (4.4) (4.4) (4.4) (7.0) (10.1) (11.8) (13.7) (12.0) (13.5) (15.1) (15.7) (15.4)
1Y (5.0) (5.0) (5.0) (5.0) (5.0) (8.1) (11.6) (12.2) (14.6) (12.2) (13.6) (15.0) (15.3) (14.1)
2Y (11.2) (11.2) (11.2) (11.2) (11.2) (12.9) (13.1) (12.2) (15.3) (11.6) (13.0) (13.9) (13.7) (13.4)
3Y (13.5) (13.5) (13.5) (13.5) (13.5) (12.6) (13.1) (12.3) (16.1) (10.9) (12.4) (12.9) (12.1) (12.7)
5Y (21.3) (21.3) (21.3) (21.3) (21.3) (14.0) (15.7) (13.3) (17.8) (11.8) (13.0) (14.2) (14.1) (14.2)
7Y (22.6) (22.6) (22.6) (22.6) (22.6) (15.0) (17.3) (21.6) (21.1) (14.0) (13.8) (14.6) (14.5) (13.9)
10Y (13.8) (13.8) (13.8) (13.8) (13.8) (14.5) (18.0) (14.9) (22.5) (13.6) (14.7) (14.8) (6.8) (14.5)
15Y (20.9) (20.9) (20.9) (20.9) (20.9) (23.1) (13.3) (19.7) (20.6) (13.7) (13.3) (13.5) (13.2) (12.1)
20Y (12.3) (12.3) (12.3) (12.3) (12.3) (8.7) (14.6) (12.3) (14.6) (12.7) (10.7) (11.3) (10.9) (9.5)
30Y (11.8) (11.8) (11.8) (11.8) (11.8) (11.8) (11.8) (7.4) (7.4) (7.4) (7.4) (7.4) (7.4) (7.4)
Total Latam & Caribbean1M (25.3) (25.3) (25.3) (25.3) (25.3) (22.0) (18.5) (15.4) (16.0) (15.4) (15.5) (16.8) (17.4) (17.9)
3M (25.3) (25.3) (25.3) (25.3) (25.3) (22.0) (18.5) (15.4) (16.0) (15.4) (15.5) (16.8) (17.4) (17.9)
6M (22.1) (22.1) (22.1) (22.1) (22.1) (20.4) (18.1) (15.8) (15.9) (15.6) (15.9) (16.9) (17.2) (17.0)
9M (18.9) (18.9) (18.9) (18.9) (18.9) (18.8) (17.6) (16.2) (15.8) (15.8) (16.2) (17.1) (17.0) (16.0)
1Y (15.7) (15.7) (15.7) (15.7) (15.7) (17.2) (17.2) (16.6) (15.7) (15.9) (16.5) (17.2) (16.8) (15.1)
2Y (16.6) (16.6) (16.6) (16.6) (16.6) (16.9) (16.4) (16.5) (15.5) (14.6) (15.5) (16.0) (16.0) (14.8)
3Y (17.5) (17.5) (17.5) (17.5) (17.5) (16.6) (15.5) (16.5) (15.4) (13.2) (14.5) (14.9) (15.2) (14.5)
5Y (17.3) (17.3) (17.3) (17.3) (17.3) (18.1) (17.6) (17.4) (17.1) (14.3) (15.6) (16.4) (16.1) (15.5)
7Y (18.3) (18.3) (18.3) (18.3) (18.3) (18.5) (17.6) (17.5) (17.1) (16.9) (16.1) (16.5) (16.3) (15.0)
10Y (18.7) (18.7) (18.7) (18.7) (18.7) (19.3) (18.4) (17.7) (18.2) (17.9) (17.9) (17.0) (11.3) (15.3)
15Y (17.4) (17.4) (17.4) (17.4) (17.4) (37.2) (21.8) (16.0) (16.7) (21.6) (18.5) (16.3) (15.7) (13.8)
20Y (13.4) (13.4) (13.4) (13.4) (13.4) (12.7) (11.8) (11.9) (11.8) (20.1) (16.5) (12.9) (12.5) (10.4)
30Y (10.0) (10.0) (10.0) (10.0) (10.0) (10.0) (10.0) (11.7) (11.7) (11.7) (11.7) (11.7) (11.7) (11.7)
E X
P I R
YE
X P
I R Y
E X
P I R
YE
X P
I R Y
Page 151
151 | P a g e
Absolute Normal Interest Rate Shocks (Continued)
Total Asia Ex-Japan1M 25.3 25.3 25.3 25.3 25.3 22.0 18.5 15.4 16.0 (15.4) (15.5) (16.8) (17.4) (17.9)
3M 25.3 25.3 25.3 25.3 25.3 22.0 18.5 15.4 16.0 (15.4) (15.5) (16.8) (17.4) (17.9)
6M 22.1 22.1 22.1 22.1 22.1 20.4 18.1 15.8 15.9 (15.6) (15.9) (16.9) (17.2) (17.0)
9M 18.9 18.9 18.9 18.9 18.9 18.8 17.6 16.2 15.8 (15.8) (16.2) (17.1) (17.0) (16.0)
1Y 15.7 15.7 15.7 15.7 15.7 17.2 17.2 16.6 15.7 (15.9) (16.5) (17.2) (16.8) (15.1)
2Y 16.6 16.6 16.6 16.6 16.6 16.9 16.4 16.5 15.5 (14.6) (15.5) (16.0) (16.0) (14.8)
3Y 17.5 17.5 17.5 17.5 17.5 16.6 15.5 16.5 15.4 (13.2) (14.5) (14.9) (15.2) (14.5)
5Y 17.3 17.3 17.3 17.3 17.3 18.1 17.6 17.4 17.1 (14.3) (15.6) (16.4) (16.1) (15.5)
7Y 18.3 18.3 18.3 18.3 18.3 18.5 17.6 17.5 17.1 (16.9) (16.1) (16.5) (16.3) (15.0)
10Y 18.7 18.7 18.7 18.7 18.7 19.3 18.4 17.7 18.2 (17.9) (17.9) (17.0) (11.3) (15.3)
15Y 17.4 17.4 17.4 17.4 17.4 29.0 21.8 16.0 16.7 (21.6) (18.5) (16.3) (15.7) (13.8)
20Y 13.4 13.4 13.4 13.4 13.4 12.7 11.8 11.9 11.8 (20.1) (16.5) (12.9) (12.5) (10.4)
30Y (10.0) (10.0) (10.0) (10.0) (10.0) (10.0) (10.0) (11.7) (11.7) (11.7) (11.7) (11.7) (11.7) (11.7)
Total ME/N. Africa1M (25.3) (25.3) (25.3) (25.3) (25.3) (22.0) (18.5) (15.4) (16.0) (15.4) (15.5) (16.8) (17.4) (17.9)
3M (25.3) (25.3) (25.3) (25.3) (25.3) (22.0) (18.5) (15.4) (16.0) (15.4) (15.5) (16.8) (17.4) (17.9)
6M (22.1) (22.1) (22.1) (22.1) (22.1) (20.4) (18.1) (15.8) (15.9) (15.6) (15.9) (16.9) (17.2) (17.0)
9M (18.9) (18.9) (18.9) (18.9) (18.9) (18.8) (17.6) (16.2) (15.8) (15.8) (16.2) (17.1) (17.0) (16.0)
1Y (15.7) (15.7) (15.7) (15.7) (15.7) (17.2) (17.2) (16.6) (15.7) (15.9) (16.5) (17.2) (16.8) (15.1)
2Y (16.6) (16.6) (16.6) (16.6) (16.6) (16.9) (16.4) (16.5) (15.5) (14.6) (15.5) (16.0) (16.0) (14.8)
3Y (17.5) (17.5) (17.5) (17.5) (17.5) (16.6) (15.5) (16.5) (15.4) (13.2) (14.5) (14.9) (15.2) (14.5)
5Y (17.3) (17.3) (17.3) (17.3) (17.3) (18.1) (17.6) (17.4) (17.1) (14.3) (15.6) (16.4) (16.1) (15.5)
7Y (18.3) (18.3) (18.3) (18.3) (18.3) (18.5) (17.6) (17.5) (17.1) (16.9) (16.1) (16.5) (16.3) (15.0)
10Y (18.7) (18.7) (18.7) (18.7) (18.7) (19.3) (18.4) (17.7) (18.2) (17.9) (17.9) (17.0) (11.3) (15.3)
15Y (17.4) (17.4) (17.4) (17.4) (17.4) (37.2) (21.8) (16.0) (16.7) (21.6) (18.5) (16.3) (15.7) (13.8)
20Y (13.4) (13.4) (13.4) (13.4) (13.4) (12.7) (11.8) (11.9) (11.8) (20.1) (16.5) (12.9) (12.5) (10.4)
30Y (10.0) (10.0) (10.0) (10.0) (10.0) (10.0) (10.0) (11.7) (11.7) (11.7) (11.7) (11.7) (11.7) (11.7)
Total Sub-Saharan Africa1M (25.3) (25.3) (25.3) (25.3) (25.3) (22.0) (18.5) (15.4) (16.0) (15.4) (15.5) (16.8) (17.4) (17.9)
3M (25.3) (25.3) (25.3) (25.3) (25.3) (22.0) (18.5) (15.4) (16.0) (15.4) (15.5) (16.8) (17.4) (17.9)
6M (22.1) (22.1) (22.1) (22.1) (22.1) (20.4) (18.1) (15.8) (15.9) (15.6) (15.9) (16.9) (17.2) (17.0)
9M (18.9) (18.9) (18.9) (18.9) (18.9) (18.8) (17.6) (16.2) (15.8) (15.8) (16.2) (17.1) (17.0) (16.0)
1Y (15.7) (15.7) (15.7) (15.7) (15.7) (17.2) (17.2) (16.6) (15.7) (15.9) (16.5) (17.2) (16.8) (15.1)
2Y (16.6) (16.6) (16.6) (16.6) (16.6) (16.9) (16.4) (16.5) (15.5) (14.6) (15.5) (16.0) (16.0) (14.8)
3Y (17.5) (17.5) (17.5) (17.5) (17.5) (16.6) (15.5) (16.5) (15.4) (13.2) (14.5) (14.9) (15.2) (14.5)
5Y (17.3) (17.3) (17.3) (17.3) (17.3) (18.1) (17.6) (17.4) (17.1) (14.3) (15.6) (16.4) (16.1) (15.5)
7Y (18.3) (18.3) (18.3) (18.3) (18.3) (18.5) (17.6) (17.5) (17.1) (16.9) (16.1) (16.5) (16.3) (15.0)
10Y (18.7) (18.7) (18.7) (18.7) (18.7) (19.3) (18.4) (17.7) (18.2) (17.9) (17.9) (17.0) (11.3) (15.3)
15Y (17.4) (17.4) (17.4) (17.4) (17.4) (37.2) (21.8) (16.0) (16.7) (21.6) (18.5) (16.3) (15.7) (13.8)
20Y (13.4) (13.4) (13.4) (13.4) (13.4) (12.7) (11.8) (11.9) (11.8) (20.1) (16.5) (12.9) (12.5) (10.4)
30Y (10.0) (10.0) (10.0) (10.0) (10.0) (10.0) (10.0) (11.7) (11.7) (11.7) (11.7) (11.7) (11.7) (11.7)
E X
P I
R Y
E X
P I
R Y
E X
P I
R Y
Page 152
152 | P a g e
Other Rates
Absolute Change in Inflation (bps)
Currency 1M 3M 6M 9M 1Y 2Y 3Y 5Y 7Y 10Y 15Y 20Y 30Y
AUD (94.1) (94.1) (94.1) (94.1) (94.1) (81.1) (81.4) (75.3) (66.6) (63.4) (59.6) (61.2) (59.5)
EUR (137.4) (137.4) (137.4) (137.4) (137.4) (133.0) (128.6) (116.2) (115.9) (111.0) (95.0) (97.8) (88.1)
GBP (203.6) (203.6) (203.6) (203.6) (203.6) (161.5) (150.9) (141.9) (133.7) (123.0) (117.3) (108.6) (104.2)
JPY (94.0) (94.0) (94.0) (94.0) (94.0) (108.6) (109.8) (127.3) (126.9) (117.4) (116.1) (109.4) (170.2)
USD (111.6) (111.6) (111.6) (111.6) (111.6) (118.7) (123.1) (126.8) (130.0) (114.8) (113.3) (109.8) (105.4)
Other (111.6) (111.6) (111.6) (111.6) (111.6) (118.7) (123.1) (126.8) (130.0) (114.8) (113.3) (109.8) (105.4)
Absolute Change in Cross-Currency vs. USD Basis (bps)(move in bps of spread on non-USD leg)
Currency 1M 3M 6M 9M 1Y 2Y 3Y 5Y 7Y 10Y 15Y 20Y 30Y
AUD 0.0 0.0 0.0 0.0 0.0 0.0 0.0 0.0 0.0 0.0 0.0 0.0 0.0
EUR 0.0 0.0 0.0 0.0 0.0 0.0 0.0 0.0 0.0 0.0 0.0 0.0 0.0
GBP 0.0 0.0 0.0 0.0 0.0 0.0 0.0 0.0 0.0 0.0 0.0 0.0 0.0
JPY 0.0 0.0 0.0 0.0 0.0 0.0 0.0 0.0 0.0 0.0 0.0 0.0 0.0
Other 0.0 0.0 0.0 0.0 0.0 0.0 0.0 0.0 0.0 0.0 0.0 0.0 0.0
M A T U R I T Y
M A T U R I T Y
Page 153
153 | P a g e
Appendix 11: Global Market Shock – Severely Adverse
Securitized Products
Trading, PE & Other Fair Value Assets
Securitized Products
Non-Agency
Prime Sub-prime Option ARMS Other AltA
Unspec Non-
Prime HELOC RMBS CDO RMBS CDS Credit Basket PrimeX ABX / TABX
Prime Whole
Loans
Non-Prime
Whole Loans European RMBS
Other /
Unspecified
Relative MV Shock Based on Current Rating (%)
AAA Total
Pre 2006 -12.8% -12.8% -12.8% -12.8% -12.8% -12.8% -12.8% -12.8% -12.8% -12.8% -12.8% -12.8% -12.8% -12.8% -12.8%
2006 -34.4% -34.4% -34.4% -34.4% -34.4% -34.4% -34.4% -34.4% -34.4% -34.4% -34.4% -34.4% -34.4% -34.4% -34.4%
2007 -31.5% -31.5% -31.5% -31.5% -31.5% -31.5% -31.5% -31.5% -31.5% -31.5% -31.5% -31.5% -31.5% -31.5% -31.5%
Post 2007 -31.5% -31.5% -31.5% -31.5% -31.5% -31.5% -31.5% -31.5% -31.5% -31.5% -31.5% -31.5% -31.5% -31.5% -31.5%
Unspecified Vintage -34.4% -34.4% -34.4% -34.4% -34.4% -34.4% -34.4% -34.4% -34.4% -34.4% -34.4% -34.4% -34.4% -34.4% -34.4%
AA Total
Pre 2006 -26.6% -26.6% -26.6% -26.6% -26.6% -26.6% -26.6% -26.6% -26.6% -26.6% -26.6% -26.6% -26.6% -26.6% -26.6%
2006 -71.5% -71.5% -71.5% -71.5% -71.5% -71.5% -71.5% -71.5% -71.5% -71.5% -71.5% -71.5% -71.5% -71.5% -71.5%
2007 -65.4% -65.4% -65.4% -65.4% -65.4% -65.4% -65.4% -65.4% -65.4% -65.4% -65.4% -65.4% -65.4% -65.4% -65.4%
Post 2007 -65.4% -65.4% -65.4% -65.4% -65.4% -65.4% -65.4% -65.4% -65.4% -65.4% -65.4% -65.4% -65.4% -65.4% -65.4%
Unspecified Vintage -71.5% -71.5% -71.5% -71.5% -71.5% -71.5% -71.5% -71.5% -71.5% -71.5% -71.5% -71.5% -71.5% -71.5% -71.5%
A Total
Pre 2006 -28.4% -28.4% -28.4% -28.4% -28.4% -28.4% -28.4% -28.4% -28.4% -28.4% -28.4% -28.4% -28.4% -28.4% -28.4%
2006 -76.5% -76.5% -76.5% -76.5% -76.5% -76.5% -76.5% -76.5% -76.5% -76.5% -76.5% -76.5% -76.5% -76.5% -76.5%
2007 -69.9% -69.9% -69.9% -69.9% -69.9% -69.9% -69.9% -69.9% -69.9% -69.9% -69.9% -69.9% -69.9% -69.9% -69.9%
Post 2007 -69.9% -69.9% -69.9% -69.9% -69.9% -69.9% -69.9% -69.9% -69.9% -69.9% -69.9% -69.9% -69.9% -69.9% -69.9%
Unspecified Vintage -76.5% -76.5% -76.5% -76.5% -76.5% -76.5% -76.5% -76.5% -76.5% -76.5% -76.5% -76.5% -76.5% -76.5% -76.5%
BBB Total
Pre 2006 -31.4% -31.4% -31.4% -31.4% -31.4% -31.4% -31.4% -31.4% -31.4% -31.4% -31.4% -31.4% -31.4% -31.4% -31.4%
2006 -84.6% -84.6% -84.6% -84.6% -84.6% -84.6% -84.6% -84.6% -84.6% -84.6% -84.6% -84.6% -84.6% -84.6% -84.6%
2007 -77.3% -77.3% -77.3% -77.3% -77.3% -77.3% -77.3% -77.3% -77.3% -77.3% -77.3% -77.3% -77.3% -77.3% -77.3%
Post 2007 -77.3% -77.3% -77.3% -77.3% -77.3% -77.3% -77.3% -77.3% -77.3% -77.3% -77.3% -77.3% -77.3% -77.3% -77.3%
Unspecified Vintage -84.6% -84.6% -84.6% -84.6% -84.6% -84.6% -84.6% -84.6% -84.6% -84.6% -84.6% -84.6% -84.6% -84.6% -84.6%
BB Total
Pre 2006 -40.5% -40.5% -40.5% -40.5% -40.5% -40.5% -40.5% -40.5% -40.5% -40.5% -40.5% -40.5% -40.5% -40.5% -40.5%
2006 -91.5% -91.5% -91.5% -91.5% -91.5% -91.5% -91.5% -91.5% -91.5% -91.5% -91.5% -91.5% -91.5% -91.5% -91.5%
2007 -91.5% -91.5% -91.5% -91.5% -91.5% -91.5% -91.5% -91.5% -91.5% -91.5% -91.5% -91.5% -91.5% -91.5% -91.5%
Post 2007 -91.5% -91.5% -91.5% -91.5% -91.5% -91.5% -91.5% -91.5% -91.5% -91.5% -91.5% -91.5% -91.5% -91.5% -91.5%
Unspecified Vintage -91.5% -91.5% -91.5% -91.5% -91.5% -91.5% -91.5% -91.5% -91.5% -91.5% -91.5% -91.5% -91.5% -91.5% -91.5%
B Total
Pre 2006 -40.5% -40.5% -40.5% -40.5% -40.5% -40.5% -40.5% -40.5% -40.5% -40.5% -40.5% -40.5% -40.5% -40.5% -40.5%
2006 -91.5% -91.5% -91.5% -91.5% -91.5% -91.5% -91.5% -91.5% -91.5% -91.5% -91.5% -91.5% -91.5% -91.5% -91.5%
2007 -91.5% -91.5% -91.5% -91.5% -91.5% -91.5% -91.5% -91.5% -91.5% -91.5% -91.5% -91.5% -91.5% -91.5% -91.5%
Post 2007 -91.5% -91.5% -91.5% -91.5% -91.5% -91.5% -91.5% -91.5% -91.5% -91.5% -91.5% -91.5% -91.5% -91.5% -91.5%
Unspecified Vintage -91.5% -91.5% -91.5% -91.5% -91.5% -91.5% -91.5% -91.5% -91.5% -91.5% -91.5% -91.5% -91.5% -91.5% -91.5%
<B Total
Pre 2006 -40.5% -40.5% -40.5% -40.5% -40.5% -40.5% -40.5% -40.5% -40.5% -40.5% -40.5% -40.5% -40.5% -40.5% -40.5%
2006 -91.5% -91.5% -91.5% -91.5% -91.5% -91.5% -91.5% -91.5% -91.5% -91.5% -91.5% -91.5% -91.5% -91.5% -91.5%
2007 -91.5% -91.5% -91.5% -91.5% -91.5% -91.5% -91.5% -91.5% -91.5% -91.5% -91.5% -91.5% -91.5% -91.5% -91.5%
Post 2007 -91.5% -91.5% -91.5% -91.5% -91.5% -91.5% -91.5% -91.5% -91.5% -91.5% -91.5% -91.5% -91.5% -91.5% -91.5%
Unspecified Vintage -91.5% -91.5% -91.5% -91.5% -91.5% -91.5% -91.5% -91.5% -91.5% -91.5% -91.5% -91.5% -91.5% -91.5% -91.5%
NR Total
Pre 2006 -40.5% -40.5% -40.5% -40.5% -40.5% -40.5% -40.5% -40.5% -40.5% -40.5% -40.5% -40.5% -40.5% -40.5% -40.5%
2006 -91.5% -91.5% -91.5% -91.5% -91.5% -91.5% -91.5% -91.5% -91.5% -91.5% -91.5% -91.5% -91.5% -91.5% -91.5%
2007 -91.5% -91.5% -91.5% -91.5% -91.5% -91.5% -91.5% -91.5% -91.5% -91.5% -91.5% -91.5% -91.5% -91.5% -91.5%
Post 2007 -91.5% -91.5% -91.5% -91.5% -91.5% -91.5% -91.5% -91.5% -91.5% -91.5% -91.5% -91.5% -91.5% -91.5% -91.5%
Unspecified Vintage -91.5% -91.5% -91.5% -91.5% -91.5% -91.5% -91.5% -91.5% -91.5% -91.5% -91.5% -91.5% -91.5% -91.5% -91.5%
RMBS
Page 154
154 | P a g e
Securitized Products
Trading, PE & Other Fair Value Assets
Securitized Products
Autos Credit Cards
Student
Loans ABS CDS Credit Basket
Index
Tranches
Other /
Unspecified
Cash Non-
Agency CMBS CMBS CDS CMBS CDO Credit Basket
Index
Tranches Whole Loans
Other /
Unspecified CLO
Other /
Unspecified Total Size
Total
Protection
Other /
Unspecified
Relative MV Shock Based on Current Rating (%)
AAA Total
Pre 2006 -4.3% -13.2% -10.8% -13.2% -13.2% -13.2% -13.2% -5.1% -3.1% -5.1% -3.1% -3.1% -5.1% -5.1% -6.1% -6.1% -18.4% 18.4% -2.7%
2006 -4.3% -13.2% -12.1% -13.2% -13.2% -13.2% -13.2% -2.7% -1.6% -2.7% -1.6% -1.6% -2.7% -2.7% -6.1% -6.1% -22.1% 22.1% -2.7%
2007 -4.3% -13.2% -14.4% -14.4% -14.4% -14.4% -14.4% -5.5% -3.3% -5.5% -3.3% -3.3% -5.5% -5.5% -6.1% -6.1% -22.1% 22.1% -2.7%
Post 2007 -4.3% -13.2% -11.7% -13.2% -13.2% -13.2% -13.2% -23.4% -14.1% -23.4% -14.1% -14.1% -23.4% -23.4% -17.7% -17.7% -18.4% 18.4% -2.7%
Unspecified Vintage -4.3% -13.2% -14.4% -14.4% -14.4% -14.4% -14.4% -23.4% -14.1% -23.4% -14.1% -14.1% -23.4% -23.4% -17.7% -17.7% -22.1% 22.1% -2.7%
AA Total
Pre 2006 -7.7% -20.1% -26.1% -26.1% -26.1% -26.1% -26.1% -12.7% -7.6% -12.7% -7.6% -7.6% -12.7% -12.7% -26.2% -26.2% -18.4% 18.4% -2.7%
2006 -7.7% -20.1% -29.0% -29.0% -29.0% -29.0% -29.0% -6.8% -4.1% -6.8% -4.1% -4.1% -6.8% -6.8% -26.2% -26.2% -22.1% 22.1% -2.7%
2007 -7.7% -20.1% -34.7% -34.7% -34.7% -34.7% -34.7% -13.6% -8.2% -13.6% -8.2% -8.2% -13.6% -13.6% -26.2% -26.2% -22.1% 22.1% -2.7%
Post 2007 -7.7% -20.1% -28.1% -28.1% -28.1% -28.1% -28.1% -58.4% -35.0% -58.4% -35.0% -35.0% -58.4% -58.4% -56.1% -56.1% -18.4% 18.4% -2.7%
Unspecified Vintage -7.7% -20.1% -34.7% -34.7% -34.7% -34.7% -34.7% -58.4% -35.0% -58.4% -35.0% -35.0% -58.4% -58.4% -56.1% -56.1% -22.1% 22.1% -2.7%
A Total
Pre 2006 -14.5% -20.1% -29.5% -29.5% -29.5% -29.5% -29.5% -16.2% -9.7% -16.2% -9.7% -9.7% -16.2% -16.2% -41.9% -41.9% -18.4% 18.4% -2.7%
2006 -14.5% -20.1% -32.8% -32.8% -32.8% -32.8% -32.8% -8.6% -5.2% -8.6% -5.2% -5.2% -8.6% -8.6% -41.9% -41.9% -22.1% 22.1% -2.7%
2007 -14.5% -20.1% -39.2% -39.2% -39.2% -39.2% -39.2% -17.3% -10.4% -17.3% -10.4% -10.4% -17.3% -17.3% -41.9% -41.9% -22.1% 22.1% -2.7%
Post 2007 -14.5% -20.1% -31.7% -31.7% -31.7% -31.7% -31.7% -74.4% -44.6% -74.4% -44.6% -44.6% -74.4% -74.4% -82.3% -82.3% -18.4% 18.4% -2.7%
Unspecified Vintage -14.5% -20.1% -39.2% -39.2% -39.2% -39.2% -39.2% -74.4% -44.6% -74.4% -44.6% -44.6% -74.4% -74.4% -82.3% -82.3% -22.1% 22.1% -2.7%
BBB Total
Pre 2006 -14.5% -37.9% -35.4% -37.9% -37.9% -37.9% -37.9% -18.7% -11.2% -18.7% -11.2% -11.2% -18.7% -18.7% -44.7% -44.7% -18.4% 18.4% -43.9%
2006 -14.5% -37.9% -39.4% -39.4% -39.4% -39.4% -39.4% -10.0% -6.0% -10.0% -6.0% -6.0% -10.0% -10.0% -44.7% -44.7% -22.1% 22.1% -43.9%
2007 -14.5% -37.9% -47.0% -47.0% -47.0% -47.0% -47.0% -20.1% -12.0% -20.1% -12.0% -12.0% -20.1% -20.1% -44.7% -44.7% -22.1% 22.1% -43.9%
Post 2007 -14.5% -37.9% -38.1% -38.1% -38.1% -38.1% -38.1% -86.2% -51.7% -86.2% -51.7% -51.7% -86.2% -86.2% -85.9% -85.9% -18.4% 18.4% -43.9%
Unspecified Vintage -14.5% -37.9% -47.0% -47.0% -47.0% -47.0% -47.0% -86.2% -51.7% -86.2% -51.7% -51.7% -86.2% -86.2% -85.9% -85.9% -22.1% 22.1% -43.9%
BB Total
Pre 2006 -18.8% -37.9% -35.4% -37.9% -37.9% -37.9% -37.9% -18.7% -11.2% -18.7% -11.2% -11.2% -18.7% -18.7% -47.7% -47.7% -18.4% 18.4% -43.9%
2006 -18.8% -37.9% -39.4% -39.4% -39.4% -39.4% -39.4% -10.0% -6.0% -10.0% -6.0% -6.0% -10.0% -10.0% -47.7% -47.7% -22.1% 22.1% -43.9%
2007 -18.8% -37.9% -47.0% -47.0% -47.0% -47.0% -47.0% -20.1% -12.0% -20.1% -12.0% -12.0% -20.1% -20.1% -47.7% -47.7% -22.1% 22.1% -43.9%
Post 2007 -18.8% -37.9% -38.1% -38.1% -38.1% -38.1% -38.1% -86.2% -51.7% -86.2% -51.7% -51.7% -86.2% -86.2% -87.4% -87.4% -18.4% 18.4% -43.9%
Unspecified Vintage -18.8% -37.9% -47.0% -47.0% -47.0% -47.0% -47.0% -86.2% -51.7% -86.2% -51.7% -51.7% -86.2% -86.2% -87.4% -87.4% -22.1% 22.1% -43.9%
B Total
Pre 2006 -18.8% -37.9% -35.4% -37.9% -37.9% -37.9% -37.9% -18.7% -11.2% -18.7% -11.2% -11.2% -18.7% -18.7% -47.7% -47.7% -18.4% 18.4% -43.9%
2006 -18.8% -37.9% -39.4% -39.4% -39.4% -39.4% -39.4% -10.0% -6.0% -10.0% -6.0% -6.0% -10.0% -10.0% -47.7% -47.7% -22.1% 22.1% -43.9%
2007 -18.8% -37.9% -47.0% -47.0% -47.0% -47.0% -47.0% -20.1% -12.0% -20.1% -12.0% -12.0% -20.1% -20.1% -47.7% -47.7% -22.1% 22.1% -43.9%
Post 2007 -18.8% -37.9% -38.1% -38.1% -38.1% -38.1% -38.1% -86.2% -51.7% -86.2% -51.7% -51.7% -86.2% -86.2% -87.4% -87.4% -18.4% 18.4% -43.9%
Unspecified Vintage -18.8% -37.9% -47.0% -47.0% -47.0% -47.0% -47.0% -86.2% -51.7% -86.2% -51.7% -51.7% -86.2% -86.2% -87.4% -87.4% -22.1% 22.1% -43.9%
<B Total
Pre 2006 -18.8% -37.9% -35.4% -37.9% -37.9% -37.9% -37.9% -18.7% -11.2% -18.7% -11.2% -11.2% -18.7% -18.7% -47.7% -47.7% -18.4% 18.4% -43.9%
2006 -18.8% -37.9% -39.4% -39.4% -39.4% -39.4% -39.4% -10.0% -6.0% -10.0% -6.0% -6.0% -10.0% -10.0% -47.7% -47.7% -22.1% 22.1% -43.9%
2007 -18.8% -37.9% -47.0% -47.0% -47.0% -47.0% -47.0% -20.1% -12.0% -20.1% -12.0% -12.0% -20.1% -20.1% -47.7% -47.7% -22.1% 22.1% -43.9%
Post 2007 -18.8% -37.9% -38.1% -38.1% -38.1% -38.1% -38.1% -86.2% -51.7% -86.2% -51.7% -51.7% -86.2% -86.2% -87.4% -87.4% -18.4% 18.4% -43.9%
Unspecified Vintage -18.8% -37.9% -47.0% -47.0% -47.0% -47.0% -47.0% -86.2% -51.7% -86.2% -51.7% -51.7% -86.2% -86.2% -87.4% -87.4% -22.1% 22.1% -43.9%
NR Total
Pre 2006 -18.8% -37.9% -35.4% -37.9% -37.9% -37.9% -37.9% -18.7% -11.2% -18.7% -11.2% -11.2% -18.7% -18.7% -47.7% -47.7% -18.4% 18.4% -43.9%
2006 -18.8% -37.9% -39.4% -39.4% -39.4% -39.4% -39.4% -10.0% -6.0% -10.0% -6.0% -6.0% -10.0% -10.0% -47.7% -47.7% -22.1% 22.1% -43.9%
2007 -18.8% -37.9% -47.0% -47.0% -47.0% -47.0% -47.0% -20.1% -12.0% -20.1% -12.0% -12.0% -20.1% -20.1% -47.7% -47.7% -22.1% 22.1% -43.9%
Post 2007 -18.8% -37.9% -38.1% -38.1% -38.1% -38.1% -38.1% -86.2% -51.7% -86.2% -51.7% -51.7% -86.2% -86.2% -87.4% -87.4% -18.4% 18.4% -43.9%
Unspecified Vintage -18.8% -37.9% -47.0% -47.0% -47.0% -47.0% -47.0% -86.2% -51.7% -86.2% -51.7% -51.7% -86.2% -86.2% -87.4% -87.4% -22.1% 22.1% -43.9%
WarehouseABS CMBS Corporate CDO / CLO
Page 155
155 | P a g e
Municipals
Trading, PE & Other Fair Value Assets
Munis
Spread Widening (bps)
Bonds
AAA 49.0
AA 70.0
A 136.0
BBB 344.0
BB 688.0
B 1,032.0
<B 1,376.0
NR 1,376.0
Loans
AAA 49.0
AA 70.0
A 136.0
BBB 344.0
BB 688.0
B 1,032.0
<B 1,376.0
NR 1,376.0
CDS
AAA 34.3
AA 49.0
A 95.2
BBB 240.8
BB 481.6
B 722.4
<B 963.2
NR 963.2
Indices
AAA 24.5
AA 35.0
A 68.0
BBB 172.0
BB 344.0
B 516.0
<B 688.0
NR 688.0
Other / Unspecified Munis
AAA 49.0
AA 70.0
A 136.0
BBB 344.0
BB 688.0
B 1,032.0
<B 1,376.0
NR 1,376.0
Page 156
156 | P a g e
Agencies
Trading, PE & Other Fair Value Assets
Agencies
OAS Widening (bps)
US Residential Agency ProductsIOs 1,687.0
POs 330.0
Other CMOs 177.0
Pass-Throughs 158.0
Agency Debt/Debentures 149.0
IOS Index 1,687.0
POS Index 330.0
MBX Index 158.0
Other Agency Derivatives 149.0
TBA's 133.0
Reverse Mortgages 177.0
Residential Other / Unspecified 158.0
US Commercial Agency ProductsCash Agency CMBS 205.0
Agency CMBS Derivatives 205.0
Commercial Other / Unspecified 205.0
Non-US Agency ProductsAAA 84.0
AA 235.0
A 271.0
BBB 307.0
BB 343.0
B 379.0
<B 415.0
NR 415.0
Page 157
157 | P a g e
Rates DV01
DFAST 2017 Market Shocks: Adverse Scenario
Rates DV01
Rates Shocks (bps) 1M 3M 6M 9M 1Y 2Y 3Y 5Y 7Y 10Y 15Y 20Y 30Y
AUD Directional Risks
Governments 4.1 4.1 1.4 (2.9) (7.2) (12.9) (11.8) (10.7) (10.7) (10.5) (11.5) (12.3) (13.0)
Agencies 4.1 4.1 1.4 (2.9) (7.2) (12.9) (11.8) (10.7) (10.7) (10.5) (11.5) (12.3) (13.0)
Municipals 4.1 4.1 1.4 (2.9) (7.2) (12.9) (11.8) (10.7) (10.7) (10.5) (11.5) (12.3) (13.0)
Swaps / Discounting Curve (17.5) (17.5) (20.1) (22.1) (24.2) (36.5) (37.4) (38.8) (40.3) (40.5) (40.0) (41.4) (46.5)
Instruments shocked by MV**
Other (17.5) (17.5) (20.1) (22.1) (24.2) (36.5) (37.4) (38.8) (40.3) (40.5) (40.0) (41.4) (46.5)
AUD Basis Risks (Do not include the swap/discounting curve specified above)
OIS Basis
1m Basis
3m Basis
6m Basis
12m Basis
Other Basis
CAD Directional Risks
Governments (7.4) (7.4) (10.1) (10.9) (11.6) (12.6) (14.1) (17.1) (17.9) (19.3) (18.3) (18.3) (18.1)
Agencies (7.4) (7.4) (10.1) (10.9) (11.6) (12.6) (14.1) (17.1) (17.9) (19.3) (18.3) (18.3) (18.1)
Municipals (7.4) (7.4) (10.1) (10.9) (11.6) (12.6) (14.1) (17.1) (17.9) (19.3) (18.3) (18.3) (18.1)
Swaps / Discounting Curve (15.0) (15.0) (13.8) (14.5) (15.3) (17.1) (18.7) (21.9) (22.8) (24.3) (25.5) (25.6) (24.6)
Instruments shocked by MV**
Other (15.0) (15.0) (13.8) (14.5) (15.3) (17.1) (18.7) (21.9) (22.8) (24.3) (25.5) (25.6) (24.6)
CAD Basis Risks (Do not include the swap/discounting curve specified above)
OIS Basis
1m Basis
3m Basis
6m Basis
12m Basis
Other Basis
CHF Directional Risks
Governments (1.0) (1.0) (1.1) (1.1) (1.1) (1.6) (1.6) (1.8) (2.0) (2.3) (2.4) (2.6) (3.1)
Agencies (1.0) (1.0) (1.1) (1.1) (1.1) (1.6) (1.6) (1.8) (2.0) (2.3) (2.4) (2.6) (3.1)
Municipals (1.0) (1.0) (1.1) (1.1) (1.1) (1.6) (1.6) (1.8) (2.0) (2.3) (2.4) (2.6) (3.1)
Swaps / Discounting Curve (1.4) (1.4) (1.5) (1.7) (1.8) (2.0) (2.1) (2.1) (2.3) (2.4) (2.7) (2.8) (3.1)
Instruments shocked by MV**
Other (1.4) (1.4) (1.5) (1.7) (1.8) (2.0) (2.1) (2.1) (2.3) (2.4) (2.7) (2.8) (3.1)
CHF Basis Risks (Do not include the swap/discounting curve specified above)
OIS Basis
1m Basis
3m Basis
6m Basis
12m Basis
Other Basis
M A T U R I T Y
Page 158
158 | P a g e
Rates DV01 (Continued)
DKK Directional Risks
Governments (5.8) (5.8) (6.1) (7.0) (7.8) (10.1) (11.9) (12.1) (12.3) (13.7) (14.4) (14.1) (14.1)
Agencies (5.8) (5.8) (6.1) (7.0) (7.8) (10.1) (11.9) (12.1) (12.3) (13.7) (14.4) (14.1) (14.1)
Municipals (5.8) (5.8) (6.1) (7.0) (7.8) (10.1) (11.9) (12.1) (12.3) (13.7) (14.4) (14.1) (14.1)
Swaps / Discounting Curve (4.3) (4.3) (4.8) (7.1) (9.4) (13.0) (13.7) (14.0) (14.4) (15.1) (16.2) (16.5) (16.8)
Instruments shocked by MV**
Other (4.3) (4.3) (4.8) (7.1) (9.4) (13.0) (13.7) (14.0) (14.4) (15.1) (16.2) (16.5) (16.8)
DKK Basis Risks (Do not include the swap/discounting curve specified above)
OIS Basis
1m Basis
3m Basis
6m Basis
12m Basis
Other Basis
EUR Directional Risks
Governments: Austria 1.1 1.1 (6.4) (9.0) (11.6) (14.7) (14.9) (15.4) (15.6) (15.0) (14.6) (13.6) (14.6)
Governments: Belgium 1.1 1.1 (6.4) (9.0) (11.6) (14.7) (14.9) (15.4) (15.6) (15.0) (14.6) (13.6) (14.6)
Governments: Finland 1.1 1.1 (6.4) (9.0) (11.6) (14.7) (14.9) (15.4) (15.6) (15.0) (14.6) (13.6) (14.6)
Governments: France (5.7) (5.7) (7.0) (7.7) (8.4) (10.4) (11.1) (12.2) (12.5) (13.3) (15.1) (17.0) (19.2)
Governments: Germany 1.1 1.1 (6.4) (9.0) (11.6) (14.7) (14.9) (15.4) (15.6) (15.0) (14.6) (13.6) (14.6)
Governments: Greece 269.4 399.8 595.4 791.1 986.7 1,769.4 1,923.1 1,353.9 1,109.9 927.0 784.7 712.4 641.3
Governments: Ireland 1.1 1.1 (6.4) (9.0) (11.6) (14.7) (14.9) (15.4) (15.6) (15.0) (14.6) (13.6) (14.6)
Governments: Italy 11.2 11.2 15.0 16.9 18.8 22.0 21.0 20.8 20.2 18.9 16.4 15.8 13.8
Governments: Netherlands (4.8) (4.8) (6.1) (7.2) (8.3) (10.8) (11.5) (12.4) (12.7) (13.9) (14.4) (15.3) (16.3)
Governments: Portugal 4.5 4.5 9.3 16.3 23.3 56.6 73.2 75.4 70.2 52.8 43.7 30.8 23.1
Governments: Spain (16.5) (16.5) (17.7) (17.3) (17.0) (18.0) (17.5) (16.9) (17.6) (19.2) (19.7) (19.7) (20.3)
Governments: Other (4.8) (4.8) (6.1) (7.2) (8.3) (10.8) (11.5) (12.4) (12.7) (13.9) (14.4) (15.3) (16.3)
Agencies (4.8) (4.8) (6.1) (7.2) (8.3) (10.8) (11.5) (12.4) (12.7) (13.9) (14.4) (15.3) (16.3)
Municipals (4.8) (4.8) (6.1) (7.2) (8.3) (10.8) (11.5) (12.4) (12.7) (13.9) (14.4) (15.3) (16.3)
Swaps / Discounting Curve (3.1) (3.1) (3.6) (5.5) (7.5) (10.4) (11.3) (12.0) (12.8) (14.2) (15.6) (16.5) (16.9)
Instruments shocked by MV**
Other (3.1) (3.1) (3.6) (5.5) (7.5) (10.4) (11.3) (12.0) (12.8) (14.2) (15.6) (16.5) (16.9)
EUR Basis Risks (Do not include the swap/discounting curve specified above)
OIS Basis (15.5) (15.5) (15.5) (15.5) (15.5) (14.4) (12.2) (11.6) (11.0) (10.6) (9.9) (9.4) (9.3)
1m Basis (0.1) (0.1) (0.1) (0.1) (0.1) (0.1) 0.0 0.0 0.0 0.1 0.1 0.1 0.1
3m Basis
6m Basis (1.9) (1.5) (1.4) (1.3) (1.3) (0.8) (0.2) 0.1 0.4 0.6 0.7 0.7 0.5
12m Basis (5.1) (4.0) (3.7) (3.5) (3.4) (1.9) (0.5) 0.3 0.9 1.4 1.5 1.4 1.0
Other Basis
GBP Directional Risks
Governments (18.9) (18.9) (18.8) (18.2) (17.6) (19.6) (19.0) (19.5) (21.0) (20.7) (20.1) (19.9) (18.2)
Agencies (18.9) (18.9) (18.8) (18.2) (17.6) (19.6) (19.0) (19.5) (21.0) (20.7) (20.1) (19.9) (18.2)
Municipals (18.9) (18.9) (18.8) (18.2) (17.6) (19.6) (19.0) (19.5) (21.0) (20.7) (20.1) (19.9) (18.2)
Swaps / Discounting Curve (3.3) (3.3) (6.2) (8.9) (11.5) (14.6) (16.3) (17.8) (18.3) (18.5) (17.7) (17.0) (15.3)
Instruments shocked by MV**
Other (3.3) (3.3) (6.2) (8.9) (11.5) (14.6) (16.3) (17.8) (18.3) (18.5) (17.7) (17.0) (15.3)
GBP Basis Risks (Do not include the swap/discounting curve specified above)
OIS Basis (15.5) (15.5) (15.5) (15.5) (15.5) (14.4) (12.2) (11.6) (11.0) (10.6) (9.9) (9.4) (9.3)
1m Basis (2.0) (2.7) (2.7) (2.8) (2.9) (3.0) (2.8) (2.8) (2.8) (2.8) (2.8) (2.6) (2.3)
3m Basis
6m Basis 1.8 2.4 2.4 2.5 2.5 2.3 2.0 1.9 2.0 2.1 2.2 2.2 2.2
12m Basis 3.9 5.2 5.3 5.4 5.5 6.0 5.9 5.5 5.4 5.3 5.1 4.9 4.5
Other Basis
Page 159
159 | P a g e
Rates DV01 (Continued)
JPY Directional Risks
Governments (15.5) (15.5) (14.7) (12.4) (10.1) (10.4) (11.6) (10.6) (7.7) (13.4) (18.6) (20.7) (20.2)
Agencies (15.5) (15.5) (14.7) (12.4) (10.1) (10.4) (11.6) (10.6) (7.7) (13.4) (18.6) (20.7) (20.2)
Municipals (15.5) (15.5) (14.7) (12.4) (10.1) (10.4) (11.6) (10.6) (7.7) (13.4) (18.6) (20.7) (20.2)
Swaps / Discounting Curve 4.6 4.6 5.0 4.9 4.9 3.3 2.9 2.0 (1.4) (3.8) (7.8) (9.8) (11.5)
Instruments shocked by MV**
Other 4.6 4.6 5.0 4.9 4.9 3.3 2.9 2.0 (1.4) (3.8) (7.8) (9.8) (11.5)
JPY Basis Risks (Do not include the swap/discounting curve specified above)
OIS Basis 0.00 0.00 0.00 0.00 0.00 0.00 0.00 0.00 0.00 0.00 0.00 0.00 0.00
1m TIBOR Basis (0.4) (0.3) (0.2) 0.2 0.1 0.2 0.2 0.3 0.3 0.4 0.7 0.9 1.1
3m TIBOR Basis
6m TIBOR Basis (0.5) (0.3) (0.3) 0.2 0.2 0.1 0.1 0.2 0.2 0.3 0.3 0.3 0.2
12m TIBOR Basis
1m LIBOR Basis (0.4) (0.3) (0.2) 0.2 0.1 0.2 0.2 0.3 0.3 0.4 0.7 0.9 1.1
3m LIBOR Basis
6m LIBOR Basis (0.5) (0.3) (0.3) 0.2 0.2 0.1 0.1 0.2 0.2 0.3 0.3 0.3 0.2
12m LIBOR Basis
Other Basis
NOK Directional Risks
Governments 14.7 14.7 13.4 10.1 6.8 (3.6) (14.0) (13.2) (12.5) (12.0) (11.7) (11.9) (12.2)
Agencies 14.7 14.7 13.4 10.1 6.8 (3.6) (14.0) (13.2) (12.5) (12.0) (11.7) (11.9) (12.2)
Municipals 14.7 14.7 13.4 10.1 6.8 (3.6) (14.0) (13.2) (12.5) (12.0) (11.7) (11.9) (12.2)
Swaps / Discounting Curve (29.1) (29.1) (32.6) (27.8) (22.9) (26.3) (25.5) (24.1) (24.6) (23.9) (23.8) (23.2) (25.0)
Instruments shocked by MV**
Other (29.1) (29.1) (32.6) (27.8) (22.9) (26.3) (25.5) (24.1) (24.6) (23.9) (23.8) (23.2) (25.0)
NOK Basis Risks (Do not include the swap/discounting curve specified above)
OIS Basis
1m Basis
3m Basis
6m Basis
12m Basis
Other Basis
NZD Directional Risks
Governments (9.3) (9.3) (11.0) (12.4) (13.8) (15.9) (16.6) (17.4) (17.6) (18.0) (18.1) (19.3) (19.3)
Agencies (9.3) (9.3) (11.0) (12.4) (13.8) (15.9) (16.6) (17.4) (17.6) (18.0) (18.1) (19.3) (19.3)
Municipals (9.3) (9.3) (11.0) (12.4) (13.8) (15.9) (16.6) (17.4) (17.6) (18.0) (18.1) (19.3) (19.3)
Swaps / Discounting Curve (9.3) (9.3) (11.0) (12.4) (13.8) (15.9) (16.6) (17.4) (17.6) (18.0) (18.1) (19.3) (19.3)
Instruments shocked by MV**
Other (9.3) (9.3) (11.0) (12.4) (13.8) (15.9) (16.6) (17.4) (17.6) (18.0) (18.1) (19.3) (19.3)
NZD Basis Risks (Do not include the swap/discounting curve specified above)
OIS Basis
1m Basis
3m Basis
6m Basis
12m Basis
Other Basis
Page 160
160 | P a g e
Rates DV01 (Continued)
SEK Directional Risks
Governments (4.4) (4.4) (4.3) (4.5) (4.7) (6.4) (7.7) (10.2) (12.8) (16.0) (20.3) (22.6) (23.1)
Agencies (4.4) (4.4) (4.3) (4.5) (4.7) (6.4) (7.7) (10.2) (12.8) (16.0) (20.3) (22.6) (23.1)
Municipals (4.4) (4.4) (4.3) (4.5) (4.7) (6.4) (7.7) (10.2) (12.8) (16.0) (20.3) (22.6) (23.1)
Swaps / Discounting Curve (5.4) (5.4) (6.5) (6.7) (6.9) (8.1) (9.3) (12.0) (14.2) (16.6) (19.4) (21.1) (22.2)
Instruments shocked by MV**
Other (5.4) (5.4) (6.5) (6.7) (6.9) (8.1) (9.3) (12.0) (14.2) (16.6) (19.4) (21.1) (22.2)
SEK Basis Risks (Do not include the swap/discounting curve specified above)
OIS Basis
1m Basis
3m Basis
6m Basis
12m Basis
Other Basis
USD Directional Risks
Governments (13.1) (13.1) (13.1) (26.1) (39.1) (33.6) (28.5) (12.7) (13.2) (23.9) (29.5) (35.4) (35.8)
Agencies (13.1) (13.1) (13.1) (26.1) (39.1) (33.6) (28.5) (12.7) (13.2) (23.9) (29.5) (35.4) (35.8)
Municipals (13.1) (13.1) (13.1) (26.1) (39.1) (33.6) (28.5) (12.7) (13.2) (23.9) (29.5) (35.4) (35.8)
Swaps / Discounting Curve 0.3 0.3 0.3 0.5 0.6 3.1 9.9 14.5 15.3 16.0 17.3 16.0 13.5
Instruments shocked by MV**
Other 0.3 0.3 0.3 0.5 0.6 3.1 9.9 14.5 15.3 16.0 17.3 16.0 13.5
USD Basis Risks (Do not include the swap/discounting curve specified above)
Prime Basis (11.9) (11.8) (11.2) (11.4) (11.6) (8.3) (5.2) (4.2) (1.2) (0.8) (0.8) (0.8) (0.8)
CP Basis (13.7) (13.5) (12.9) (13.0) (13.3) (9.7) (8.6) (5.6) (2.9) (4.0) (4.1) (4.2) (4.1)
OIS Basis (23.6) (23.6) (23.6) (23.6) (23.6) (15.4) (8.0) (6.0) (3.8) (3.5) (3.5) (3.5) (3.5)
1m Basis (26.6) (26.3) (15.6) (11.4) (10.2) (5.7) (3.8) (1.5) (0.4) 0.6 0.6 2.1 2.6
3m Basis
6m Basis 10.5 10.4 9.9 10.0 10.2 7.9 7.1 5.7 5.2 5.1 5.3 5.3 5.3
12m Basis 21.7 21.5 20.5 20.7 21.2 16.9 14.9 11.9 10.7 11.1 8.4 7.5 5.5
Other Basis
(31.4) 8.8 (2.5) 8.3 19.2 19.5 20.1 21.3 21.2 20.1 15.1 12.1 8.5
Other Advanced Economies Directional Risks
Governments (13.1) (13.1) (13.1) (26.1) (39.1) (33.6) (28.5) (12.7) (13.2) (23.9) (29.5) (35.4) (35.8)
Agencies (13.1) (13.1) (13.1) (26.1) (39.1) (33.6) (28.5) (12.7) (13.2) (23.9) (29.5) (35.4) (35.8)
Municipals (13.1) (13.1) (13.1) (26.1) (39.1) (33.6) (28.5) (12.7) (13.2) (23.9) (29.5) (35.4) (35.8)
Swaps / Discounting Curve 0.3 0.3 0.3 0.5 0.6 3.1 9.9 14.5 15.3 16.0 17.3 16.0 13.5
Instruments shocked by MV**
Other 0.3 0.3 0.3 0.5 0.6 3.1 9.9 14.5 15.3 16.0 17.3 16.0 13.5
Absolute increase in Muni SIFMA/Libor
Ratio (Pts)
Page 161
161 | P a g e
Rates DV01 (Continued)
Directional Risks: Emerging Europe
BGN 1.1 1.1 (6.4) (9.0) (11.6) (14.7) (14.9) (15.4) (15.6) (15.0) (14.6) (13.6) (14.6)
CZK 1.1 1.1 (6.4) (9.0) (11.6) (14.7) (14.9) (15.4) (15.6) (15.0) (14.6) (13.6) (14.6)
HRK 1.1 1.1 (6.4) (9.0) (11.6) (14.7) (14.9) (15.4) (15.6) (15.0) (14.6) (13.6) (14.6)
HUF 1.1 1.1 (6.4) (9.0) (11.6) (14.7) (14.9) (15.4) (15.6) (15.0) (14.6) (13.6) (14.6)
PLN 1.1 1.1 (6.4) (9.0) (11.6) (14.7) (14.9) (15.4) (15.6) (15.0) (14.6) (13.6) (14.6)
RON 1.1 1.1 (6.4) (9.0) (11.6) (14.7) (14.9) (15.4) (15.6) (15.0) (14.6) (13.6) (14.6)
RUB 200.0 198.9 197.2 195.5 193.9 187.2 180.5 167.1 153.8 133.7 100.3 66.9 0.0
Other Emerging Europe 1.1 1.1 (6.4) (9.0) (11.6) (14.7) (14.9) (15.4) (15.6) (15.0) (14.6) (13.6) (14.6)
Directional Risks: Latin America & Caribbean
ARS 200.0 198.9 197.2 195.5 193.9 187.2 180.5 167.1 153.8 133.7 100.3 66.9 0.0
BRL 200.0 198.9 197.2 195.5 193.9 187.2 180.5 167.1 153.8 133.7 100.3 66.9 0.0
CLP 5.6 5.6 4.5 3.3 2.1 (5.6) (12.2) (19.4) (25.2) (26.0) (31.6) (33.7) (39.0)
COP 200.0 198.9 197.2 195.5 193.9 187.2 180.5 167.1 153.8 133.7 100.3 66.9 0.0
MXN 200.0 198.9 197.2 195.5 193.9 187.2 180.5 167.1 153.8 133.7 100.3 66.9 0.0
PEN 5.6 5.6 4.5 3.3 2.1 (5.6) (12.2) (19.4) (25.2) (26.0) (31.6) (33.7) (39.0)
VEF 200.0 198.9 197.2 195.5 193.9 187.2 180.5 167.1 153.8 133.7 100.3 66.9 0.0
Other Latam & Caribbean 200.0 198.9 197.2 195.5 193.9 187.2 180.5 167.1 153.8 133.7 100.3 66.9 0.0
Directional Risks: Asia Ex-Japan
CNY 5.6 5.6 4.5 3.3 2.1 (5.6) (12.2) (19.4) (25.2) (26.0) (31.6) (33.7) (39.0)
HKD 5.6 5.6 4.5 3.3 2.1 (5.6) (12.2) (19.4) (25.2) (26.0) (31.6) (33.7) (39.0)
IDR 500.3 505.2 502.0 566.5 631.0 520.2 473.3 426.4 421.9 370.2 336.8 303.3 236.5
INR 79.7 79.7 78.5 69.6 60.7 43.6 35.3 17.1 10.8 9.6 8.5 (3.0) (4.5)
KRW (8.1) (8.1) (8.1) (9.8) (11.5) (14.2) (14.6) (14.6) (14.4) (14.2) (14.1) (14.1) (14.1)
MYR 926.0 905.9 893.2 952.0 1,010.9 946.1 901.0 855.1 821.4 759.7 726.3 692.9 626.0
PHP 991.9 1,014.7 1,046.2 1,097.5 1,148.9 909.1 843.7 752.1 713.1 658.7 625.3 591.9 525.0
SGD 5.6 5.6 4.5 3.3 2.1 (5.6) (12.2) (19.4) (25.2) (26.0) (31.6) (33.7) (39.0)
THB (13.8) (13.8) (13.8) (13.8) (13.8) (15.4) (15.9) (17.2) (17.5) (18.1) (18.9) (19.4) (19.4)
TWD 5.6 5.6 4.5 3.3 2.1 (5.6) (12.2) (19.4) (25.2) (26.0) (31.6) (33.7) (39.0)
Other Asia Ex-Japan 5.6 5.6 4.5 3.3 2.1 (5.6) (12.2) (19.4) (25.2) (26.0) (31.6) (33.7) (39.0)
Directional Risks: Middle East/North Africa
ILS (13.1) (13.1) (13.1) (26.1) (39.1) (33.6) (28.5) (12.7) (13.2) (23.9) (29.5) (35.4) (35.8)
TRY 5.8 5.8 5.2 11.4 17.5 17.7 18.0 18.7 18.9 20.2 17.0 17.0 17.0
Other Middle East/Africa (35.8) (35.8) (47.3) (54.9) (62.4) (57.9) (58.0) (59.0) (60.9) (64.0) (67.2) (61.8) (65.5)
Directional Risks: Sub-Saharan Africa
ZAR (35.8) (35.8) (47.3) (54.9) (62.4) (57.9) (58.0) (59.0) (60.9) (64.0) (67.2) (61.8) (65.5)
Other Sub-Saharan Africa (35.8) (35.8) (47.3) (54.9) (62.4) (57.9) (58.0) (59.0) (60.9) (64.0) (67.2) (61.8) (65.5)
Page 162
162 | P a g e
Relative Normal Interest Rate Shocks
Rates Vega
Relative Normal Interest Rate Shocks (%)
1M 3M 6M 9M 1Y 2Y 3Y 5Y 7Y 10Y 15Y 20Y 25Y 30Y
AUD1M 13.4% 13.4% 13.4% 13.4% 13.4% 7.9% 5.4% 4.3% 4.4% 3.7% 3.5% 3.7% 3.9% 3.8%
3M 11.7% 11.7% 11.7% 11.7% 11.7% 7.8% 5.3% 4.4% 4.5% 3.9% 3.7% 3.9% 4.2% 4.1%
6M 8.9% 8.9% 8.9% 8.9% 8.9% 6.8% 5.0% 4.4% 4.2% 4.0% 3.9% 4.1% 4.2% 4.0%
9M 6.4% 6.4% 6.4% 6.4% 6.4% 5.8% 4.7% 4.4% 4.2% 4.1% 4.0% 4.2% 4.2% 3.9%
1Y 4.5% 4.5% 4.5% 4.5% 4.5% 4.9% 4.5% 4.4% 4.1% 4.1% 4.2% 4.3% 4.2% 3.7%
2Y 4.4% 4.4% 4.4% 4.4% 4.4% 4.6% 4.3% 4.6% 4.1% 4.0% 4.1% 4.3% 4.3% 4.0%
3Y 5.0% 5.0% 5.0% 5.0% 5.0% 4.7% 4.3% 4.8% 4.3% 3.9% 4.1% 4.3% 4.4% 4.3%
5Y 5.2% 5.2% 5.2% 5.2% 5.2% 5.7% 5.5% 5.6% 5.5% 4.9% 5.1% 5.4% 5.5% 5.2%
7Y 5.8% 5.8% 5.8% 5.8% 5.8% 5.9% 5.6% 5.9% 5.8% 6.0% 5.6% 5.9% 5.9% 5.3%
10Y 6.3% 6.3% 6.3% 6.3% 6.3% 6.6% 6.2% 6.1% 6.6% 6.5% 6.8% 6.5% 5.6% 5.8%
15Y 5.4% 5.4% 5.4% 5.4% 5.4% 13.3% 8.7% 5.3% 5.8% 7.4% 6.9% 6.2% 6.0% 5.5%
20Y 4.4% 4.4% 4.4% 4.4% 4.4% 4.4% 4.2% 4.7% 4.9% 7.4% 6.5% 5.3% 5.5% 4.8%
30Y 7.0% 7.0% 7.0% 7.0% 7.0% 7.1% 7.2% 4.4% 4.6% 4.8% 5.5% 6.1% 6.5% 6.9%
EUR1M 23.9% 23.9% 23.9% 23.9% 23.9% 16.7% 10.5% 6.5% 5.8% 4.5% 4.7% 5.2% 5.6% 5.6%
3M 22.1% 22.1% 22.1% 22.1% 22.1% 15.8% 10.1% 6.4% 5.7% 4.4% 4.6% 5.1% 5.6% 5.7%
6M 16.7% 16.7% 16.7% 16.7% 16.7% 13.2% 9.1% 5.9% 5.7% 4.3% 4.6% 5.1% 5.5% 5.4%
9M 12.5% 12.5% 12.5% 12.5% 12.5% 10.5% 8.0% 5.6% 5.8% 4.2% 4.5% 5.1% 5.3% 5.0%
1Y 9.1% 9.1% 9.1% 9.1% 9.1% 8.5% 7.2% 5.3% 5.9% 4.1% 4.5% 5.0% 5.1% 4.7%
2Y 6.7% 6.7% 6.7% 6.7% 6.7% 6.2% 5.8% 4.7% 5.7% 3.8% 4.2% 4.6% 4.6% 4.5%
3Y 5.3% 5.3% 5.3% 5.3% 5.3% 4.9% 5.0% 4.3% 5.6% 3.6% 4.0% 4.3% 4.1% 4.4%
5Y 8.1% 8.1% 8.1% 8.1% 8.1% 4.8% 5.5% 4.4% 6.2% 4.0% 4.3% 4.9% 5.2% 5.2%
7Y 8.2% 8.2% 8.2% 8.2% 8.2% 4.9% 5.9% 7.8% 7.5% 4.7% 4.8% 5.4% 5.6% 5.4%
10Y 4.7% 4.7% 4.7% 4.7% 4.7% 4.9% 6.3% 5.0% 8.4% 4.5% 5.5% 5.8% 3.9% 6.0%
15Y 7.8% 7.8% 7.8% 7.8% 7.8% 8.8% 5.9% 7.3% 7.7% 4.0% 4.7% 5.4% 5.6% 5.2%
20Y 4.6% 4.6% 4.6% 4.6% 4.6% 3.1% 5.9% 5.2% 6.3% 3.9% 4.0% 5.1% 5.2% 4.7%
30Y 6.5% 6.5% 6.5% 6.5% 6.5% 6.3% 6.3% 2.8% 2.8% 2.9% 3.1% 3.3% 3.5% 3.6%
GBP1M 14.1% 14.1% 14.1% 14.1% 14.1% 8.7% 4.9% 3.5% 3.1% 2.7% 2.6% 2.8% 3.1% 2.9%
3M 13.8% 13.8% 13.8% 13.8% 13.8% 7.8% 4.6% 3.5% 3.1% 2.7% 2.6% 2.8% 3.2% 2.9%
6M 9.5% 9.5% 9.5% 9.5% 9.5% 6.2% 4.0% 3.0% 2.6% 2.5% 2.5% 2.8% 3.0% 2.7%
9M 6.6% 6.6% 6.6% 6.6% 6.6% 5.2% 3.6% 2.7% 2.4% 2.4% 2.5% 2.7% 2.8% 2.5%
1Y 4.6% 4.6% 4.6% 4.6% 4.6% 4.3% 3.4% 2.4% 2.1% 2.3% 2.4% 2.7% 2.7% 2.4%
2Y 3.7% 3.7% 3.7% 3.7% 3.7% 3.6% 3.1% 2.7% 2.1% 2.2% 2.4% 2.7% 2.4% 2.4%
3Y 3.7% 3.7% 3.7% 3.7% 3.7% 3.5% 3.2% 3.1% 2.2% 2.2% 2.3% 2.6% 2.2% 2.5%
5Y 3.5% 3.5% 3.5% 3.5% 3.5% 3.3% 3.1% 2.9% 2.3% 2.3% 2.4% 2.6% 2.6% 2.7%
7Y 3.5% 3.5% 3.5% 3.5% 3.5% 3.9% 3.6% 2.9% 3.1% 3.1% 2.9% 3.2% 3.3% 3.1%
10Y 4.4% 4.4% 4.4% 4.4% 4.4% 4.6% 4.3% 3.7% 3.6% 3.4% 3.6% 3.5% 2.8% 3.4%
15Y 3.2% 3.2% 3.2% 3.2% 3.2% 5.9% 4.3% 3.6% 3.7% 2.7% 3.6% 3.3% 3.2% 2.9%
20Y 1.9% 1.9% 1.9% 1.9% 1.9% 2.4% 3.2% 4.0% 4.0% 2.6% 2.7% 3.5% 3.1% 2.5%
30Y 2.9% 2.9% 2.9% 2.9% 2.9% 3.0% 3.1% 1.9% 1.9% 2.0% 2.1% 2.2% 2.3% 2.4%
JPY1M 6.1% 6.1% 6.1% 6.1% 6.1% 5.9% 5.7% 6.1% 8.2% 7.9% 5.6% 4.3% 3.9% 3.5%
3M 4.9% 4.9% 4.9% 4.9% 4.9% 5.2% 5.0% 5.2% 7.0% 6.9% 5.3% 4.3% 3.9% 3.5%
6M 3.9% 3.9% 3.9% 3.9% 3.9% 4.8% 4.8% 5.8% 7.5% 7.4% 5.9% 4.8% 4.4% 4.0%
9M 3.0% 3.0% 3.0% 3.0% 3.0% 4.6% 4.8% 6.5% 7.8% 7.9% 6.3% 5.0% 4.7% 4.4%
1Y 2.1% 2.1% 2.1% 2.1% 2.1% 4.4% 4.7% 7.2% 8.2% 8.4% 6.9% 5.5% 5.1% 4.7%
2Y 3.6% 3.6% 3.6% 3.6% 3.6% 5.1% 6.1% 10.1% 9.1% 8.7% 7.3% 6.0% 5.8% 5.5%
3Y 4.9% 4.9% 4.9% 4.9% 4.9% 5.8% 7.4% 12.5% 9.4% 8.8% 7.7% 6.4% 6.2% 6.0%
5Y 10.2% 10.2% 10.2% 10.2% 10.2% 11.2% 11.9% 12.1% 10.1% 9.4% 8.7% 7.6% 7.4% 7.2%
7Y 13.7% 13.7% 13.7% 13.7% 13.7% 13.3% 13.7% 11.0% 12.0% 10.8% 10.1% 9.2% 9.0% 8.7%
10Y 13.4% 13.4% 13.4% 13.4% 13.4% 12.9% 13.0% 11.7% 11.6% 9.4% 9.0% 8.7% 8.5% 8.2%
15Y 10.0% 10.0% 10.0% 10.0% 10.0% 11.9% 8.5% 10.2% 10.6% 8.0% 7.5% 7.2% 7.0% 6.8%
20Y 5.0% 5.0% 5.0% 5.0% 5.0% 6.1% 7.7% 7.9% 7.8% 7.6% 7.2% 6.8% 6.6% 6.4%
30Y 4.8% 4.8% 4.8% 4.8% 4.8% 5.1% 5.1% 4.8% 4.8% 4.7% 4.0% 3.7% 3.5% 3.3%
M A T U R I T Y
E X
P I R
YE
X P
I R Y
E X
P I R
YE
X P
I R Y
Page 163
163 | P a g e
Relative Normal Interest Rate Shocks (Continued)
USD1M 17.4% 17.4% 17.4% 17.4% 17.4% 9.7% 6.8% 4.8% 5.0% 4.7% 4.8% 5.2% 5.6% 5.4%
3M 13.9% 13.9% 13.9% 13.9% 13.9% 7.9% 5.8% 4.3% 4.5% 4.3% 4.4% 4.8% 5.2% 5.0%
6M 9.6% 9.6% 9.6% 9.6% 9.6% 6.5% 4.7% 4.3% 4.3% 4.2% 4.3% 4.7% 4.9% 4.7%
9M 6.4% 6.4% 6.4% 6.4% 6.4% 5.6% 4.7% 4.3% 4.2% 4.2% 4.5% 4.9% 4.9% 4.4%
1Y 4.6% 4.6% 4.6% 4.6% 4.6% 4.7% 4.5% 4.2% 4.0% 4.2% 4.5% 4.9% 4.7% 4.2%
2Y 4.0% 4.0% 4.0% 4.0% 4.0% 4.0% 3.8% 4.2% 3.9% 3.9% 4.3% 4.6% 4.6% 4.3%
3Y 4.0% 4.0% 4.0% 4.0% 4.0% 3.9% 3.7% 4.3% 3.9% 3.7% 4.1% 4.4% 4.5% 4.3%
5Y 4.3% 4.3% 4.3% 4.3% 4.3% 4.8% 4.6% 4.7% 4.8% 4.3% 4.8% 5.2% 5.2% 4.9%
7Y 5.0% 5.0% 5.0% 5.0% 5.0% 5.2% 5.0% 5.2% 5.1% 5.3% 5.3% 5.7% 5.7% 5.1%
10Y 5.9% 5.9% 5.9% 5.9% 5.9% 6.3% 5.9% 5.7% 6.2% 6.1% 6.7% 6.5% 5.6% 5.7%
15Y 5.7% 5.7% 5.7% 5.7% 5.7% 14.3% 9.3% 5.5% 5.9% 7.5% 7.2% 6.6% 6.5% 5.6%
20Y 4.9% 4.9% 4.9% 4.9% 4.9% 5.0% 4.7% 5.1% 5.1% 7.5% 7.0% 5.6% 5.5% 4.6%
30Y 5.2% 5.2% 5.2% 5.2% 5.2% 5.3% 5.2% 4.8% 4.8% 4.9% 5.3% 5.1% 5.2% 5.2%
US MBS Vega
Other Advanced Economies1M 9.1% 9.1% 9.1% 9.1% 9.1% 5.5% 3.6% 2.8% 3.1% 2.6% 2.9% 3.3% 3.7% 3.8%
3M 7.9% 7.9% 7.9% 7.9% 7.9% 5.4% 3.5% 2.9% 3.2% 2.8% 3.1% 3.5% 3.9% 4.1%
6M 6.1% 6.1% 6.1% 6.1% 6.1% 4.6% 3.3% 2.9% 3.2% 2.8% 3.2% 3.6% 3.9% 3.9%
9M 4.5% 4.5% 4.5% 4.5% 4.5% 3.9% 3.1% 2.9% 3.5% 2.9% 3.2% 3.6% 3.8% 3.7%
1Y 3.3% 3.3% 3.3% 3.3% 3.3% 3.2% 3.0% 2.9% 3.8% 2.9% 3.3% 3.7% 3.7% 3.4%
2Y 3.1% 3.1% 3.1% 3.1% 3.1% 3.1% 3.1% 3.0% 4.1% 3.0% 3.3% 3.6% 3.6% 3.5%
3Y 3.4% 3.4% 3.4% 3.4% 3.4% 3.2% 3.4% 3.3% 4.5% 3.1% 3.4% 3.6% 3.4% 3.6%
5Y 6.8% 6.8% 6.8% 6.8% 6.8% 4.1% 4.8% 4.0% 5.7% 3.9% 4.0% 4.5% 4.7% 4.6%
7Y 7.4% 7.4% 7.4% 7.4% 7.4% 4.5% 5.5% 7.5% 7.4% 4.8% 4.6% 5.1% 5.2% 4.9%
10Y 4.4% 4.4% 4.4% 4.4% 4.4% 4.7% 6.1% 5.0% 8.4% 4.7% 5.4% 5.5% 3.6% 5.5%
15Y 6.8% 6.8% 6.8% 6.8% 6.8% 7.8% 5.4% 6.8% 7.4% 4.0% 4.5% 4.8% 4.9% 4.6%
20Y 3.9% 3.9% 3.9% 3.9% 3.9% 2.8% 5.3% 4.9% 6.1% 3.9% 3.7% 4.5% 4.7% 4.3%
30Y 8.3% 8.3% 8.3% 8.3% 8.3% 8.4% 8.5% 2.4% 2.5% 2.6% 3.0% 3.3% 3.6% 3.8%
Total Emerging Europe1M 48.5% 48.5% 48.5% 48.5% 48.5% 45.8% 28.9% 17.0% 15.3% 11.1% 10.7% 10.8% 11.9% 12.2%
3M 53.6% 53.6% 53.6% 53.6% 53.6% 45.0% 27.5% 16.4% 14.8% 10.9% 10.5% 10.8% 11.8% 12.1%
6M 54.6% 54.6% 54.6% 54.6% 54.6% 39.0% 24.8% 15.6% 15.0% 10.6% 10.3% 10.5% 11.3% 11.2%
9M 44.7% 44.7% 44.7% 44.7% 44.7% 32.1% 21.9% 14.7% 15.0% 10.3% 10.1% 10.3% 10.7% 10.2%
1Y 33.6% 33.6% 33.6% 33.6% 33.6% 25.7% 19.2% 13.7% 15.0% 10.0% 9.9% 10.1% 10.2% 9.3%
2Y 18.8% 18.8% 18.8% 18.8% 18.8% 15.2% 13.6% 11.4% 13.2% 8.7% 8.7% 8.9% 8.7% 8.7%
3Y 13.1% 13.1% 13.1% 13.1% 13.1% 11.2% 11.4% 9.7% 12.2% 7.9% 7.7% 7.9% 7.4% 8.1%
5Y 20.1% 20.1% 20.1% 20.1% 20.1% 11.8% 12.2% 9.1% 12.8% 7.9% 7.5% 8.5% 8.9% 9.1%
7Y 16.1% 16.1% 16.1% 16.1% 16.1% 9.7% 11.3% 15.0% 14.3% 8.4% 7.9% 8.8% 9.2% 9.0%
10Y 9.1% 9.1% 9.1% 9.1% 9.1% 9.5% 12.0% 9.1% 14.4% 7.3% 8.8% 9.0% 6.2% 9.8%
15Y 11.3% 11.3% 11.3% 11.3% 11.3% 12.7% 8.6% 10.2% 11.6% 6.3% 7.2% 8.3% 8.7% 8.2%
20Y 8.1% 8.1% 8.1% 8.1% 8.1% 5.6% 10.7% 9.4% 11.2% 6.7% 7.0% 8.7% 8.9% 8.0%
30Y 13.4% 13.4% 13.4% 13.4% 13.4% 13.4% 13.5% 5.9% 6.0% 6.1% 6.2% 6.4% 6.5% 6.7%
Total Latam & Caribbean1M 4.1% 4.1% 4.1% 4.1% 4.1% 3.1% 2.5% 2.1% 2.3% 2.2% 2.1% 2.3% 2.4% 2.3%
3M 3.8% 3.8% 3.8% 3.8% 3.8% 3.0% 2.4% 2.0% 2.2% 2.1% 2.1% 2.2% 2.4% 2.3%
6M 3.2% 3.2% 3.2% 3.2% 3.2% 2.7% 2.3% 2.0% 2.1% 2.1% 2.1% 2.2% 2.3% 2.2%
9M 2.6% 2.6% 2.6% 2.6% 2.6% 2.5% 2.3% 2.0% 2.0% 2.1% 2.1% 2.2% 2.2% 2.0%
1Y 2.0% 2.0% 2.0% 2.0% 2.0% 2.2% 2.2% 2.1% 1.9% 2.0% 2.1% 2.2% 2.1% 1.9%
2Y 2.0% 2.0% 2.0% 2.0% 2.0% 2.0% 2.0% 2.0% 1.8% 1.7% 1.8% 1.8% 1.8% 1.7%
3Y 2.1% 2.1% 2.1% 2.1% 2.1% 2.0% 1.8% 2.0% 1.7% 1.6% 1.6% 1.7% 1.7% 1.7%
5Y 2.0% 2.0% 2.0% 2.0% 2.0% 2.2% 2.1% 2.0% 2.0% 1.7% 1.8% 1.9% 1.9% 1.8%
7Y 2.2% 2.2% 2.2% 2.2% 2.2% 2.2% 2.1% 2.1% 2.0% 2.0% 1.8% 1.9% 1.9% 1.8%
10Y 2.1% 2.1% 2.1% 2.1% 2.1% 2.2% 2.1% 2.1% 2.2% 2.1% 2.1% 2.0% 1.8% 1.9%
15Y 1.7% 1.7% 1.7% 1.7% 1.7% 4.3% 2.9% 1.7% 1.8% 2.2% 2.0% 1.9% 2.0% 1.8%
20Y 1.1% 1.1% 1.1% 1.1% 1.1% 1.2% 1.1% 1.3% 1.3% 2.0% 2.1% 1.9% 2.0% 1.8%
30Y 4.4% 4.4% 4.4% 4.4% 4.4% 4.5% 4.6% 4.4% 4.6% 4.8% 5.0% 5.3% 5.5% 5.7%
E X
P I R
YE
X P
I R Y
E X
P I R
YE
X P
I R Y
Page 164
164 | P a g e
Relative Normal Interest Rate Shocks (Continued)
Total Asia Ex-Japan1M 8.7% 8.7% 8.7% 8.7% 8.7% 7.8% 6.5% 5.8% 6.2% 5.8% 5.8% 6.8% 7.6% 7.6%
3M 8.8% 8.8% 8.8% 8.8% 8.8% 7.8% 6.5% 5.8% 6.2% 5.8% 5.9% 6.8% 7.6% 7.6%
6M 7.8% 7.8% 7.8% 7.8% 7.8% 7.3% 6.5% 6.2% 6.3% 6.0% 6.2% 7.2% 7.7% 7.5%
9M 6.4% 6.4% 6.4% 6.4% 6.4% 6.9% 6.6% 6.6% 6.4% 6.3% 6.7% 7.7% 8.0% 7.5%
1Y 5.1% 5.1% 5.1% 5.1% 5.1% 6.5% 6.6% 6.9% 6.4% 6.6% 7.1% 8.1% 8.2% 7.5%
2Y 6.1% 6.1% 6.1% 6.1% 6.1% 7.0% 6.9% 7.8% 7.1% 6.9% 7.8% 8.8% 9.1% 8.7%
3Y 7.1% 7.1% 7.1% 7.1% 7.1% 7.4% 7.1% 8.3% 7.4% 7.0% 8.1% 9.0% 9.7% 9.5%
5Y 8.5% 8.5% 8.5% 8.5% 8.5% 9.3% 9.4% 9.5% 9.6% 8.4% 9.8% 10.9% 11.4% 11.1%
7Y 9.3% 9.3% 9.3% 9.3% 9.3% 9.4% 9.2% 9.6% 9.6% 9.8% 10.1% 11.0% 11.4% 10.5%
10Y 11.1% 11.1% 11.1% 11.1% 11.1% 11.4% 11.1% 10.7% 11.6% 11.0% 11.8% 11.4% 10.1% 10.6%
15Y 14.0% 14.0% 14.0% 14.0% 14.0% 34.6% 22.7% 13.4% 13.2% 14.7% 13.3% 12.0% 11.9% 10.4%
20Y 10.7% 10.7% 10.7% 10.7% 10.7% 10.6% 10.0% 10.7% 10.2% 13.7% 12.3% 10.1% 10.1% 8.5%
30Y 11.7% 11.7% 11.7% 11.7% 11.7% 11.7% 11.7% 10.8% 10.4% 9.8% 10.0% 10.3% 10.5% 10.8%
Total ME/N. Africa1M 9.1% 9.1% 9.1% 9.1% 9.1% 7.8% 6.3% 5.5% 5.3% 4.4% 4.8% 5.5% 6.3% 6.4%
3M 5.9% 5.9% 5.9% 5.9% 5.9% 5.2% 4.5% 4.2% 4.3% 3.9% 4.3% 4.9% 5.6% 5.7%
6M 4.6% 4.6% 4.6% 4.6% 4.6% 4.3% 3.8% 3.6% 3.7% 3.5% 3.9% 4.4% 4.9% 4.8%
9M 3.6% 3.6% 3.6% 3.6% 3.6% 3.6% 3.4% 3.3% 3.2% 3.1% 3.6% 4.1% 4.3% 4.1%
1Y 2.7% 2.7% 2.7% 2.7% 2.7% 3.0% 2.9% 3.0% 2.8% 2.9% 3.4% 3.9% 4.0% 3.7%
2Y 3.1% 3.1% 3.1% 3.1% 3.1% 3.2% 3.2% 3.3% 3.0% 3.1% 3.6% 4.1% 4.4% 4.2%
3Y 3.6% 3.6% 3.6% 3.6% 3.6% 3.5% 3.2% 3.6% 3.2% 3.2% 3.8% 4.3% 4.8% 4.8%
5Y 4.0% 4.0% 4.0% 4.0% 4.0% 4.3% 4.2% 4.3% 4.7% 4.6% 5.4% 6.2% 6.6% 6.5%
7Y 4.1% 4.1% 4.1% 4.1% 4.1% 4.3% 4.2% 5.0% 5.4% 6.0% 6.3% 7.0% 7.4% 6.9%
10Y 6.6% 6.6% 6.6% 6.6% 6.6% 7.4% 7.2% 7.3% 8.1% 8.2% 9.0% 8.8% 7.9% 8.4%
15Y 6.9% 6.9% 6.9% 6.9% 6.9% 17.8% 11.9% 7.5% 8.2% 10.6% 10.0% 9.3% 9.4% 8.3%
20Y 6.2% 6.2% 6.2% 6.2% 6.2% 6.5% 6.3% 7.1% 7.4% 11.1% 10.2% 8.5% 8.5% 7.3%
30Y 7.4% 7.4% 7.4% 7.4% 7.4% 7.8% 8.0% 7.9% 8.1% 8.5% 8.8% 9.2% 9.5% 9.8%
Total Sub-Saharan Africa1M 9.2% 9.2% 9.2% 9.2% 9.2% 5.8% 4.5% 3.0% 3.0% 2.9% 2.8% 3.1% 3.5% 3.7%
3M 8.7% 8.7% 8.7% 8.7% 8.7% 4.9% 4.0% 2.8% 2.8% 2.7% 2.6% 3.0% 3.4% 3.5%
6M 5.5% 5.5% 5.5% 5.5% 5.5% 3.8% 3.2% 2.7% 2.6% 2.5% 2.5% 2.8% 3.1% 3.2%
9M 3.7% 3.7% 3.7% 3.7% 3.7% 3.2% 3.0% 2.6% 2.5% 2.5% 2.6% 2.8% 3.0% 3.0%
1Y 2.6% 2.6% 2.6% 2.6% 2.6% 2.8% 2.7% 2.5% 2.3% 2.5% 2.6% 2.8% 2.9% 2.8%
2Y 2.3% 2.3% 2.3% 2.3% 2.3% 2.5% 2.4% 2.4% 2.2% 2.2% 2.4% 2.6% 2.7% 2.6%
3Y 2.5% 2.5% 2.5% 2.5% 2.5% 2.3% 2.1% 2.4% 2.1% 2.0% 2.2% 2.3% 2.5% 2.5%
5Y 2.6% 2.6% 2.6% 2.6% 2.6% 2.6% 2.5% 2.5% 2.4% 2.1% 2.3% 2.5% 2.6% 2.6%
7Y 2.6% 2.6% 2.6% 2.6% 2.6% 2.7% 2.5% 2.5% 2.5% 2.5% 2.4% 2.6% 2.7% 2.5%
10Y 2.7% 2.7% 2.7% 2.7% 2.7% 2.8% 2.7% 2.5% 2.7% 2.6% 2.8% 2.7% 2.4% 2.6%
15Y 2.9% 2.9% 2.9% 2.9% 2.9% 6.7% 4.2% 2.5% 2.7% 3.3% 3.1% 2.9% 2.9% 2.6%
20Y 2.7% 2.7% 2.7% 2.7% 2.7% 2.5% 2.3% 2.4% 2.5% 3.4% 3.3% 2.8% 2.9% 2.5%
30Y 6.4% 6.4% 6.4% 6.4% 6.4% 6.3% 5.8% 4.9% 4.5% 4.0% 4.2% 4.4% 4.6% 4.7%
E X
P I
R Y
E X
P I
R Y
E X
P I
R Y
Page 165
165 | P a g e
Absolute Normal Interest Rate Shocks
Rates Vega
Absolute Normal Interest Rate Shocks (bps)
1M 3M 6M 9M 1Y 2Y 3Y 5Y 7Y 10Y 15Y 20Y 25Y 30Y
AUD1M 4.8 4.8 4.8 4.8 4.8 4.4 3.8 3.6 3.9 3.7 3.8 4.1 4.4 4.3
3M 4.8 4.8 4.8 4.8 4.8 4.4 3.8 3.6 3.9 3.7 3.8 4.1 4.4 4.3
6M 4.1 4.1 4.1 4.1 4.1 4.1 3.7 3.7 3.8 3.7 3.8 4.2 4.3 4.1
9M 3.5 3.5 3.5 3.5 3.5 3.8 3.7 3.7 3.7 3.7 3.9 4.2 4.2 3.9
1Y 2.8 2.8 2.8 2.8 2.8 3.5 3.6 3.7 3.6 3.8 4.0 4.3 4.1 3.7
2Y 3.3 3.3 3.3 3.3 3.3 3.6 3.5 3.8 3.5 3.5 3.8 4.0 4.0 3.7
3Y 3.7 3.7 3.7 3.7 3.7 3.6 3.4 3.9 3.5 3.3 3.5 3.7 3.8 3.6
5Y 4.1 4.1 4.1 4.1 4.1 4.4 4.2 4.3 4.2 3.7 3.9 4.1 4.2 3.9
7Y 4.5 4.5 4.5 4.5 4.5 4.6 4.4 4.5 4.4 4.4 4.1 4.3 4.3 3.8
10Y 4.8 4.8 4.8 4.8 4.8 5.1 4.8 4.5 4.8 4.6 4.8 4.4 3.8 3.9
15Y 4.2 4.2 4.2 4.2 4.2 10.4 6.7 4.0 4.2 5.2 4.6 4.1 4.0 3.4
20Y 3.3 3.3 3.3 3.3 3.3 3.3 3.1 3.3 3.3 4.7 4.1 3.3 3.2 2.6
30Y 3.1 3.1 3.1 3.1 3.1 3.1 3.1 2.9 2.9 2.9 2.9 2.9 2.9 2.9
EUR1M 3.2 3.2 3.2 3.2 3.2 3.0 2.5 2.4 2.7 2.6 3.1 3.7 4.2 4.3
3M 3.2 3.2 3.2 3.2 3.2 3.0 2.5 2.4 2.7 2.6 3.1 3.7 4.2 4.3
6M 2.8 2.8 2.8 2.8 2.8 2.8 2.5 2.4 2.9 2.6 3.1 3.7 4.0 4.0
9M 2.4 2.4 2.4 2.4 2.4 2.6 2.4 2.4 3.1 2.6 3.1 3.6 3.8 3.7
1Y 2.0 2.0 2.0 2.0 2.0 2.3 2.4 2.4 3.3 2.6 3.2 3.6 3.7 3.4
2Y 2.3 2.3 2.3 2.3 2.3 2.4 2.5 2.5 3.5 2.6 3.0 3.4 3.3 3.2
3Y 2.5 2.5 2.5 2.5 2.5 2.5 2.7 2.6 3.7 2.6 2.9 3.1 2.9 3.1
5Y 5.3 5.3 5.3 5.3 5.3 3.2 3.7 3.0 4.4 2.9 3.1 3.5 3.6 3.5
7Y 5.8 5.8 5.8 5.8 5.8 3.5 4.3 5.7 5.6 3.5 3.4 3.7 3.7 3.5
10Y 3.3 3.3 3.3 3.3 3.3 3.6 4.6 3.7 6.1 3.3 3.8 3.8 2.5 3.7
15Y 5.3 5.3 5.3 5.3 5.3 6.1 4.2 5.1 5.4 2.8 3.0 3.2 3.2 2.9
20Y 2.9 2.9 2.9 2.9 2.9 2.1 3.9 3.4 4.1 2.5 2.4 2.8 2.7 2.4
30Y 3.6 3.6 3.6 3.6 3.6 3.6 3.6 1.6 1.6 1.6 1.6 1.6 1.6 1.6
GBP1M 3.2 3.2 3.2 3.2 3.2 2.6 2.0 2.1 2.2 2.2 2.2 2.3 2.6 2.4
3M 3.2 3.2 3.2 3.2 3.2 2.6 2.0 2.1 2.2 2.2 2.2 2.3 2.6 2.4
6M 2.7 2.7 2.7 2.7 2.7 2.5 2.0 2.0 2.1 2.1 2.1 2.3 2.5 2.3
9M 2.3 2.3 2.3 2.3 2.3 2.3 2.0 1.9 1.9 2.1 2.1 2.3 2.4 2.2
1Y 1.9 1.9 1.9 1.9 1.9 2.2 2.0 1.8 1.7 2.0 2.1 2.3 2.3 2.0
2Y 2.3 2.3 2.3 2.3 2.3 2.4 2.2 2.2 1.8 1.9 2.0 2.2 2.0 2.0
3Y 2.7 2.7 2.7 2.7 2.7 2.6 2.5 2.5 1.8 1.8 1.9 2.1 1.8 2.0
5Y 2.9 2.9 2.9 2.9 2.9 2.7 2.5 2.4 1.9 1.9 1.9 2.0 2.0 2.0
7Y 3.0 3.0 3.0 3.0 3.0 3.2 2.9 2.4 2.5 2.4 2.2 2.4 2.4 2.2
10Y 3.7 3.7 3.7 3.7 3.7 3.7 3.4 2.9 2.8 2.5 2.6 2.5 1.9 2.2
15Y 2.4 2.4 2.4 2.4 2.4 4.4 3.1 2.5 2.5 1.8 2.3 2.0 1.9 1.7
20Y 1.3 1.3 1.3 1.3 1.3 1.6 2.1 2.6 2.5 1.6 1.6 2.0 1.7 1.3
30Y 1.8 1.8 1.8 1.8 1.8 1.8 1.8 1.1 1.1 1.1 1.1 1.1 1.1 1.1
JPY1M 0.9 0.9 0.9 0.9 0.9 0.9 0.9 1.2 1.7 1.9 1.9 1.9 1.9 1.9
3M 0.9 0.9 0.9 0.9 0.9 0.9 0.9 1.2 1.7 1.9 1.9 1.9 1.9 1.9
6M 0.7 0.7 0.7 0.7 0.7 0.9 0.9 1.3 1.8 2.0 2.0 2.0 2.0 2.0
9M 0.5 0.5 0.5 0.5 0.5 0.9 0.9 1.4 1.8 2.1 2.1 2.1 2.1 2.1
1Y 0.4 0.4 0.4 0.4 0.4 0.8 0.9 1.5 1.9 2.2 2.2 2.2 2.2 2.2
2Y 0.7 0.7 0.7 0.7 0.7 1.1 1.3 2.2 2.1 2.4 2.4 2.4 2.4 2.4
3Y 1.1 1.1 1.1 1.1 1.1 1.3 1.6 2.9 2.3 2.5 2.5 2.5 2.5 2.5
5Y 2.6 2.6 2.6 2.6 2.6 2.9 3.0 3.2 2.8 3.0 3.0 3.0 3.0 3.0
7Y 3.7 3.7 3.7 3.7 3.7 3.6 3.8 3.1 3.6 3.6 3.6 3.6 3.6 3.6
10Y 4.0 4.0 4.0 4.0 4.0 4.0 4.1 3.8 4.0 3.4 3.4 3.4 3.4 3.4
15Y 3.4 3.4 3.4 3.4 3.4 4.0 2.9 3.6 3.9 3.0 3.0 3.0 3.0 3.0
20Y 1.9 1.9 1.9 1.9 1.9 2.2 2.8 3.1 3.0 3.0 3.0 3.0 3.0 3.0
30Y 1.9 1.9 1.9 1.9 1.9 1.9 1.9 1.9 1.9 1.9 1.9 1.9 1.9 1.9
M A T U R I T Y
E X
P I R
YE
X P
I R Y
E X
P I R
YE
X P
I R Y
Page 166
166 | P a g e
Absolute Normal Interest Rate Shocks (Continued)
USD1M 4.8 4.8 4.8 4.8 4.8 4.4 3.8 3.6 3.9 3.7 3.8 4.1 4.4 4.3
3M 4.8 4.8 4.8 4.8 4.8 4.4 3.8 3.6 3.9 3.7 3.8 4.1 4.4 4.3
6M 4.1 4.1 4.1 4.1 4.1 4.1 3.7 3.7 3.8 3.7 3.8 4.2 4.3 4.1
9M 3.5 3.5 3.5 3.5 3.5 3.8 3.7 3.7 3.7 3.7 3.9 4.2 4.2 3.9
1Y 2.8 2.8 2.8 2.8 2.8 3.5 3.6 3.7 3.6 3.8 4.0 4.3 4.1 3.7
2Y 3.3 3.3 3.3 3.3 3.3 3.6 3.5 3.8 3.5 3.5 3.8 4.0 4.0 3.7
3Y 3.7 3.7 3.7 3.7 3.7 3.6 3.4 3.9 3.5 3.3 3.5 3.7 3.8 3.6
5Y 4.1 4.1 4.1 4.1 4.1 4.4 4.2 4.3 4.2 3.7 3.9 4.1 4.2 3.9
7Y 4.5 4.5 4.5 4.5 4.5 4.6 4.4 4.5 4.4 4.4 4.1 4.3 4.3 3.8
10Y 4.8 4.8 4.8 4.8 4.8 5.1 4.8 4.5 4.8 4.6 4.8 4.4 3.8 3.9
15Y 4.2 4.2 4.2 4.2 4.2 10.4 6.7 4.0 4.2 5.2 4.6 4.1 4.0 3.4
20Y 3.3 3.3 3.3 3.3 3.3 3.3 3.1 3.3 3.3 4.7 4.1 3.3 3.2 2.6
30Y 3.1 3.1 3.1 3.1 3.1 3.1 3.1 2.9 2.9 2.9 2.9 2.9 2.9 2.9
US MBS Vega
Other Advanced Economies1M 3.2 3.2 3.2 3.2 3.2 3.0 2.5 2.4 2.7 2.6 3.1 3.7 4.2 4.3
3M 3.2 3.2 3.2 3.2 3.2 3.0 2.5 2.4 2.7 2.6 3.1 3.7 4.2 4.3
6M 2.8 2.8 2.8 2.8 2.8 2.8 2.5 2.4 2.9 2.6 3.1 3.7 4.0 4.0
9M 2.4 2.4 2.4 2.4 2.4 2.6 2.4 2.4 3.1 2.6 3.1 3.6 3.8 3.7
1Y 2.0 2.0 2.0 2.0 2.0 2.3 2.4 2.4 3.3 2.6 3.2 3.6 3.7 3.4
2Y 2.3 2.3 2.3 2.3 2.3 2.4 2.5 2.5 3.5 2.6 3.0 3.4 3.3 3.2
3Y 2.5 2.5 2.5 2.5 2.5 2.5 2.7 2.6 3.7 2.6 2.9 3.1 2.9 3.1
5Y 5.3 5.3 5.3 5.3 5.3 3.2 3.7 3.0 4.4 2.9 3.1 3.5 3.6 3.5
7Y 5.8 5.8 5.8 5.8 5.8 3.5 4.3 5.7 5.6 3.5 3.4 3.7 3.7 3.5
10Y 3.3 3.3 3.3 3.3 3.3 3.6 4.6 3.7 6.1 3.3 3.8 3.8 2.5 3.7
15Y 5.3 5.3 5.3 5.3 5.3 6.1 4.2 5.1 5.4 2.8 3.0 3.2 3.2 2.9
20Y 2.9 2.9 2.9 2.9 2.9 2.1 3.9 3.4 4.1 2.5 2.4 2.8 2.7 2.4
30Y 3.6 3.6 3.6 3.6 3.6 3.6 3.6 1.6 1.6 1.6 1.6 1.6 1.6 1.6
Total Emerging Europe1M 3.2 3.2 3.2 3.2 3.2 3.0 2.5 2.4 2.7 2.6 3.1 3.7 4.2 4.3
3M 3.2 3.2 3.2 3.2 3.2 3.0 2.5 2.4 2.7 2.6 3.1 3.7 4.2 4.3
6M 2.8 2.8 2.8 2.8 2.8 2.8 2.5 2.4 2.9 2.6 3.1 3.7 4.0 4.0
9M 2.4 2.4 2.4 2.4 2.4 2.6 2.4 2.4 3.1 2.6 3.1 3.6 3.8 3.7
1Y 2.0 2.0 2.0 2.0 2.0 2.3 2.4 2.4 3.3 2.6 3.2 3.6 3.7 3.4
2Y 2.3 2.3 2.3 2.3 2.3 2.4 2.5 2.5 3.5 2.6 3.0 3.4 3.3 3.2
3Y 2.5 2.5 2.5 2.5 2.5 2.5 2.7 2.6 3.7 2.6 2.9 3.1 2.9 3.1
5Y 5.3 5.3 5.3 5.3 5.3 3.2 3.7 3.0 4.4 2.9 3.1 3.5 3.6 3.5
7Y 5.8 5.8 5.8 5.8 5.8 3.5 4.3 5.7 5.6 3.5 3.4 3.7 3.7 3.5
10Y 3.3 3.3 3.3 3.3 3.3 3.6 4.6 3.7 6.1 3.3 3.8 3.8 2.5 3.7
15Y 5.3 5.3 5.3 5.3 5.3 6.1 4.2 5.1 5.4 2.8 3.0 3.2 3.2 2.9
20Y 2.9 2.9 2.9 2.9 2.9 2.1 3.9 3.4 4.1 2.5 2.4 2.8 2.7 2.4
30Y 3.6 3.6 3.6 3.6 3.6 3.6 3.6 1.6 1.6 1.6 1.6 1.6 1.6 1.6
Total Latam & Caribbean1M 4.8 4.8 4.8 4.8 4.8 4.4 3.8 3.6 3.9 3.7 3.8 4.1 4.4 4.3
3M 4.8 4.8 4.8 4.8 4.8 4.4 3.8 3.6 3.9 3.7 3.8 4.1 4.4 4.3
6M 4.1 4.1 4.1 4.1 4.1 4.1 3.7 3.7 3.8 3.7 3.8 4.2 4.3 4.1
9M 3.5 3.5 3.5 3.5 3.5 3.8 3.7 3.7 3.7 3.7 3.9 4.2 4.2 3.9
1Y 2.8 2.8 2.8 2.8 2.8 3.5 3.6 3.7 3.6 3.8 4.0 4.3 4.1 3.7
2Y 3.3 3.3 3.3 3.3 3.3 3.6 3.5 3.8 3.5 3.5 3.8 4.0 4.0 3.7
3Y 3.7 3.7 3.7 3.7 3.7 3.6 3.4 3.9 3.5 3.3 3.5 3.7 3.8 3.6
5Y 4.1 4.1 4.1 4.1 4.1 4.4 4.2 4.3 4.2 3.7 3.9 4.1 4.2 3.9
7Y 4.5 4.5 4.5 4.5 4.5 4.6 4.4 4.5 4.4 4.4 4.1 4.3 4.3 3.8
10Y 4.8 4.8 4.8 4.8 4.8 5.1 4.8 4.5 4.8 4.6 4.8 4.4 3.8 3.9
15Y 4.2 4.2 4.2 4.2 4.2 10.4 6.7 4.0 4.2 5.2 4.6 4.1 4.0 3.4
20Y 3.3 3.3 3.3 3.3 3.3 3.3 3.1 3.3 3.3 4.7 4.1 3.3 3.2 2.6
30Y 3.1 3.1 3.1 3.1 3.1 3.1 3.1 2.9 2.9 2.9 2.9 2.9 2.9 2.9
E X
P I R
YE
X P
I R Y
E X
P I R
YE
X P
I R Y
Page 167
167 | P a g e
Absolute Normal Interest Rate Shocks (Continued)
Total Asia Ex-Japan1M 4.8 4.8 4.8 4.8 4.8 4.4 3.8 3.6 3.9 3.7 3.8 4.1 4.4 4.3
3M 4.8 4.8 4.8 4.8 4.8 4.4 3.8 3.6 3.9 3.7 3.8 4.1 4.4 4.3
6M 4.1 4.1 4.1 4.1 4.1 4.1 3.7 3.7 3.8 3.7 3.8 4.2 4.3 4.1
9M 3.5 3.5 3.5 3.5 3.5 3.8 3.7 3.7 3.7 3.7 3.9 4.2 4.2 3.9
1Y 2.8 2.8 2.8 2.8 2.8 3.5 3.6 3.7 3.6 3.8 4.0 4.3 4.1 3.7
2Y 3.3 3.3 3.3 3.3 3.3 3.6 3.5 3.8 3.5 3.5 3.8 4.0 4.0 3.7
3Y 3.7 3.7 3.7 3.7 3.7 3.6 3.4 3.9 3.5 3.3 3.5 3.7 3.8 3.6
5Y 4.1 4.1 4.1 4.1 4.1 4.4 4.2 4.3 4.2 3.7 3.9 4.1 4.2 3.9
7Y 4.5 4.5 4.5 4.5 4.5 4.6 4.4 4.5 4.4 4.4 4.1 4.3 4.3 3.8
10Y 4.8 4.8 4.8 4.8 4.8 5.1 4.8 4.5 4.8 4.6 4.8 4.4 3.8 3.9
15Y 4.2 4.2 4.2 4.2 4.2 10.4 6.7 4.0 4.2 5.2 4.6 4.1 4.0 3.4
20Y 3.3 3.3 3.3 3.3 3.3 3.3 3.1 3.3 3.3 4.7 4.1 3.3 3.2 2.6
30Y 3.1 3.1 3.1 3.1 3.1 3.1 3.1 2.9 2.9 2.9 2.9 2.9 2.9 2.9
Total ME/N. Africa1M 4.8 4.8 4.8 4.8 4.8 4.4 3.8 3.6 3.9 3.7 3.8 4.1 4.4 4.3
3M 4.8 4.8 4.8 4.8 4.8 4.4 3.8 3.6 3.9 3.7 3.8 4.1 4.4 4.3
6M 4.1 4.1 4.1 4.1 4.1 4.1 3.7 3.7 3.8 3.7 3.8 4.2 4.3 4.1
9M 3.5 3.5 3.5 3.5 3.5 3.8 3.7 3.7 3.7 3.7 3.9 4.2 4.2 3.9
1Y 2.8 2.8 2.8 2.8 2.8 3.5 3.6 3.7 3.6 3.8 4.0 4.3 4.1 3.7
2Y 3.3 3.3 3.3 3.3 3.3 3.6 3.5 3.8 3.5 3.5 3.8 4.0 4.0 3.7
3Y 3.7 3.7 3.7 3.7 3.7 3.6 3.4 3.9 3.5 3.3 3.5 3.7 3.8 3.6
5Y 4.1 4.1 4.1 4.1 4.1 4.4 4.2 4.3 4.2 3.7 3.9 4.1 4.2 3.9
7Y 4.5 4.5 4.5 4.5 4.5 4.6 4.4 4.5 4.4 4.4 4.1 4.3 4.3 3.8
10Y 4.8 4.8 4.8 4.8 4.8 5.1 4.8 4.5 4.8 4.6 4.8 4.4 3.8 3.9
15Y 4.2 4.2 4.2 4.2 4.2 10.4 6.7 4.0 4.2 5.2 4.6 4.1 4.0 3.4
20Y 3.3 3.3 3.3 3.3 3.3 3.3 3.1 3.3 3.3 4.7 4.1 3.3 3.2 2.6
30Y 3.1 3.1 3.1 3.1 3.1 3.1 3.1 2.9 2.9 2.9 2.9 2.9 2.9 2.9
Total Sub-Saharan Africa1M 4.8 4.8 4.8 4.8 4.8 4.4 3.8 3.6 3.9 3.7 3.8 4.1 4.4 4.3
3M 4.8 4.8 4.8 4.8 4.8 4.4 3.8 3.6 3.9 3.7 3.8 4.1 4.4 4.3
6M 4.1 4.1 4.1 4.1 4.1 4.1 3.7 3.7 3.8 3.7 3.8 4.2 4.3 4.1
9M 3.5 3.5 3.5 3.5 3.5 3.8 3.7 3.7 3.7 3.7 3.9 4.2 4.2 3.9
1Y 2.8 2.8 2.8 2.8 2.8 3.5 3.6 3.7 3.6 3.8 4.0 4.3 4.1 3.7
2Y 3.3 3.3 3.3 3.3 3.3 3.6 3.5 3.8 3.5 3.5 3.8 4.0 4.0 3.7
3Y 3.7 3.7 3.7 3.7 3.7 3.6 3.4 3.9 3.5 3.3 3.5 3.7 3.8 3.6
5Y 4.1 4.1 4.1 4.1 4.1 4.4 4.2 4.3 4.2 3.7 3.9 4.1 4.2 3.9
7Y 4.5 4.5 4.5 4.5 4.5 4.6 4.4 4.5 4.4 4.4 4.1 4.3 4.3 3.8
10Y 4.8 4.8 4.8 4.8 4.8 5.1 4.8 4.5 4.8 4.6 4.8 4.4 3.8 3.9
15Y 4.2 4.2 4.2 4.2 4.2 10.4 6.7 4.0 4.2 5.2 4.6 4.1 4.0 3.4
20Y 3.3 3.3 3.3 3.3 3.3 3.3 3.1 3.3 3.3 4.7 4.1 3.3 3.2 2.6
30Y 3.1 3.1 3.1 3.1 3.1 3.1 3.1 2.9 2.9 2.9 2.9 2.9 2.9 2.9
E X
P I
R Y
E X
P I
R Y
E X
P I
R Y
Page 168
168 | P a g e
Other Rates
Absolute Change in Inflation (bps)
Currency 1M 3M 6M 9M 1Y 2Y 3Y 5Y 7Y 10Y 15Y 20Y 30Y
AUD (55.6) (55.6) (55.6) (55.6) (55.6) (47.9) (48.1) (44.5) (39.3) (37.7) (35.1) (36.4) (35.4)
EUR (54.4) (54.4) (54.4) (54.4) (54.4) (52.9) (51.2) (46.2) (46.2) (44.4) (38.2) (39.4) (35.4)
GBP (105.2) (105.2) (105.2) (105.2) (105.2) (83.7) (78.3) (73.7) (69.5) (64.0) (61.2) (56.7) (54.5)
JPY (48.9) (48.9) (48.9) (48.9) (48.9) (56.8) (57.7) (66.5) (66.3) (61.4) (60.8) (57.4) (88.0)
USD (68.4) (68.4) (68.4) (68.4) (68.4) (72.2) (75.2) (78.2) (80.6) (71.3) (70.3) (68.1) (65.6)
Other (68.4) (68.4) (68.4) (68.4) (68.4) (72.2) (75.2) (78.2) (80.6) (71.3) (70.3) (68.1) (65.6)
Absolute Change in Cross-Currency vs. USD Basis (bps)(move in bps of spread on non-USD leg)
Currency 1M 3M 6M 9M 1Y 2Y 3Y 5Y 7Y 10Y 15Y 20Y 30Y
AUD 0.0 0.0 0.0 0.0 0.0 0.0 0.0 0.0 0.0 0.0 0.0 0.0 0.0
EUR 0.0 0.0 0.0 0.0 0.0 0.0 0.0 0.0 0.0 0.0 0.0 0.0 0.0
GBP 0.0 0.0 0.0 0.0 0.0 0.0 0.0 0.0 0.0 0.0 0.0 0.0 0.0
JPY 0.0 0.0 0.0 0.0 0.0 0.0 0.0 0.0 0.0 0.0 0.0 0.0 0.0
Other 0.0 0.0 0.0 0.0 0.0 0.0 0.0 0.0 0.0 0.0 0.0 0.0 0.0
M A T U R I T Y
M A T U R I T Y
Page 169
169 | P a g e
Appendix 12: Data Notes
Sources for data through 2016:Q4 (as released through
1/18/2017). The 2016:Q4 values of variables marked with an
asterisk (*) are projected.
U.S. real GDP growth*: Percent change in real Gross Domestic
Product in chained dollars, expressed at an annualized rate,
Bureau of Economic Analysis (NIPA table 1.1.6, line 1).
U.S. nominal GDP growth*: Percent change in nominal Gross
Domestic Product, expressed at an annualized rate, Bureau of
Economic Analysis (NIPA table 1.1.5, line 1).
U.S. real disposable income growth*: Percent change in
nominal disposable personal income, divided by the price index
for personal consumption expenditures, expressed at an
annualized rate, Bureau of Economic Analysis (NIPA table 1.2,
line 27, and NIPA table 1.1.4, line 2).
U.S. nominal disposable income growth*: Percent change in
nominal disposable personal income, expressed at an
annualized rate, Bureau of Economic Analysis (NIPA table 1.2,
line 27).
U.S. unemployment rate: Quarterly average of seasonally-
adjusted monthly data for the unemployment rate of the
civilian, noninstitutional population of age 16 years and older,
Bureau of Labor Statistics (series LNS14000000).
U.S. CPI inflation: Percent change in the quarterly average of
seasonally-adjusted monthly data for the Consumer Price
Index, expressed at an annualized rate, Bureau of Labor
Statistics (series CUSR0000SA0).
U.S. 3-month Treasury rate: Quarterly average of 3-month
Treasury bill secondary market rate on a discount basis, H.15
Release, Selected Interest Rates, Federal Reserve Board.
U.S. 5-year Treasury yield: Quarterly average of the yield on 5-
year U.S. Treasury bonds, constructed for the FRB/U.S. model
by Federal Reserve staff based on the Svensson smoothed term
structure model; see Lars E. O. Svensson (1995), “Estimating
Forward Interest Rates with the Extended Nelson-Siegel
Method,” Quarterly Review, no. 3, Sveriges Riksbank, pp. 13–
26.
U.S. 10-year Treasury yield: Quarterly average of the yield on
10-year U.S. Treasury bonds, constructed for the FRB/U.S.
model by Federal Reserve staff based on the Svensson
smoothed term structure model; see id.
U.S. BBB corporate yield: Quarterly average of the yield on 10-
year BBB-rated corporate bonds, constructed for the FRB/U.S.
model by Federal Reserve staff using a Nelson-Siegel smoothed
yield curve model; see Charles R. Nelson and Andrew F. Siegel
(1987), "Parsimonious Modeling of Yield Curves," Journal of
Business, vol. 60, pp. 473-89. Data prior to 1997 is based on
the WARGA database. Data after 1997 is based on the Merrill
Lynch database.
U.S. mortgage rate: Quarterly average of weekly series for the
interest rate of a conventional, conforming, 30-year fixed rate
mortgage, obtained from the Primary Mortgage Market Survey
of the Federal Home Loan Mortgage Corporation.
U.S. prime rate: Quarterly average of monthly series, H.15
Release, Selected Interest Rates, Federal Reserve Board.
U.S. Dow Jones Total Stock Market (Float Cap) Index: End of
quarter value, Dow Jones.
U.S. House Price Index*: CoreLogic, index level, seasonally
adjusted by Federal Reserve staff.
U.S. Commercial Real Estate Price Index*: From the Financial
Accounts of the United States, Federal Reserve Board (Z.1
release); the series corresponds to the data for price indexes:
Commercial Real Estate Price Index (series FL075035503.Q,
divided by 1000).
U.S. Market Volatility Index (VIX): Chicago Board Options
Exchange, converted to quarterly by using the maximum close-
of-day value in any quarter.
Euro area real GDP growth*: Percent change in real gross
domestic product at an annualized rate, staff calculations based
on Statistical Office of the European Communities via Haver,
extended back using ECB Area Wide Model dataset (ECB Working
Paper series no. 42).
Euro area inflation: Percent change in the quarterly average of
the harmonized index of consumer prices at an annualized rate,
staff calculations based on Statistical Office of the European
Communities via Haver.
Developing Asia real GDP growth*: Percent change in real gross
domestic product at an annualized rate, staff calculations based
on Bank of Korea via Haver; Chinese National Bureau of Statistics
via CEIC; Indian Central Statistical Organization via CEIC; Census
and Statistics Department of Hong Kong via CEIC; and Taiwan
Directorate-General of Budget, Accounting, and Statistics via
CEIC.
Developing Asia inflation*: Percent change in the quarterly
average of the consumer price index, or local equivalent, at an
annualized rate, staff calculations based on Chinese National
Bureau of Statistics via CEIC; Indian Ministry of Statistics and
Programme Implementation via Haver; Labour Bureau of India
via CEIC; National Statistical Office of Korea via CEIC; Census and
Statistic Department of Hong Kong via CEIC; and Taiwan
Directorate-General of Budget, Accounting, and Statistics via
CEIC.
Japan real GDP growth*: Percent change in gross domestic
product at an annualized rate, Cabinet Office via Haver.
Japan inflation*: Percent change in the quarterly average of the
Consumer Price Index at an annualized rate, Ministry of Internal
Affairs and Communications via Haver.
U.K. real GDP growth*: Percent change in gross domestic
product at an annualized rate, Office for National Statistics via
Haver.
U.K. inflation: Percent change in the quarterly average of the
Consumer Price Index at an annualized rate, Office for National
Statistics via Haver.
Exchange rates: Quarterly average of daily rates, Bloomberg.