Page 1
2017 Second Quarter Compliance Monitoring
&
Operational Performance Report
Blind River Refinery
Operating Licence
FFOL-3632.0/2022 328 Eldorado Road
Blind River, Ontario
P0R 1B0
Submitted to:
The Canadian Nuclear Safety Commission
P.O. Box 1046, Station B
280 Slater Street
Ottawa, Ontario
K1P 5S9
Submitted on: August 21, 2017
Page 2
2017 Second Quarter Compliance Monitoring and Operational Performance Report
Blind River Refinery
Page 2 of 45
Executive Summary
Cameco Corporation (Cameco) is a major supplier of uranium processing services required to
produce nuclear fuel for the generation of safe, clean and reliable electricity around the world.
Cameco’s Fuel Services Division (FSD) is comprised of the Blind River Refinery (BRR), the
Port Hope Conversion Facility (PHCF) Cameco Fuel Manufacturing Inc. (CFM) and a divisional
head office located in Port Hope Ontario.
BRR operates a Class IB nuclear facility in Blind River, Ontario under a Canadian Nuclear
Safety Commission (CNSC) operating licence and employs approximately 125 workers. In the
second quarter of 2017, Cameco operated under CNSC licence FFOL-3632.0/2022.
Cameco is committed to the safe, clean and reliable operations of all of its facilities and
continually strives to improve safety performance and processes to ensure the safety of both its
employees and local residents. Corporate policies and programs, including the Safety, Health,
Environment and Quality (SHEQ) policy provided guidance and direction for the development of
site-based programs and procedures. BRR also has a Facility Licensing Manual (FLM) that
describes the commitment by Cameco Corporation to operate a safe, efficient, nuclear facility
which meets the requirements of the CNSC.
As a result of these programs, plans and procedures, BRR’s operation maintained radiation
exposures well below the regulatory dose limits in the second quarter of 2017. Environmental
emissions are being controlled to levels that are a fraction of the regulatory limits, and public
radiation exposures are also well below the regulatory limits.
Page 3
2017 Second Quarter Compliance Monitoring and Operational Performance Report
Blind River Refinery
Page 3 of 45
Table of Contents
Executive Summary……………………………………………………………….…...2
1. INTRODUCTION…………………………………………………………………..…4
1.1 General Introduction…………..…………………………………………………….…..4
1.2 Facility Operation……………………………………………………………………......7
1.3 Production or Utilization…………………………………………………………….…..8
1.4 Facility Modification………………………………………………………………….....9
2. SAFETY AND CONTROL AREAS…………………………………………….…… 10
2.1 Management……………………………………………………………………….……10
2.1.1 Management Systems……………………………………………………………......10
2.1.2 Human Performance Management……………………………………………….….11
2.1.3 Operating Performance…………………………………………………….………...12
2.2 Facility and Equipment………………………………………………………………...13
2.2.1 Safety Analysis…………………………………………………………………..…..13
2.2.2 Physical Design………………………………………………………………………14
2.2.3 Fitness for Service……………………………………………………………………15
2.3 Core Control Processes…………………………………………………………………16
2.3.1 Radiation Protection………………………………………………………………….16
2.3.2 Conventional Health and Safety……………………………..………………………27
2.3.3 Environmental Protection……………………………………………………………28
2.3.4 Emergency Management and Response……………………………………………..36
2.3.5 Waste and By-product Management…………………………………………………37
2.3.6 Nuclear Security……………………………………………………………………...38
2.3.7 Safeguards and Non-proliferation……………………………………………………39
2.3.8 Packaging and Transport of Nuclear Substances…………………………………….40
3. OTHER MATTERS OF REGULATORY INTEREST……………………………..41
3.1.1 Public Information Program………………………..……………..…………………41
3.1.2 Site Specific………………………………………………………………………….42
3.1.3 Improvement Plans and Future Outlook……………………………………………..43
3.1.4 Safety Performance Objectives for Following Year…………………………………44
4. CONCLUDING REMARKS…………………………………………………………..45
Page 4
2017 Second Quarter Compliance Monitoring and Operational Performance Report
Blind River Refinery
Page 4 of 45
1. INTRODUCTION
1.1 General Introduction
Cameco Corporation (Cameco) is a major supplier of uranium processing services required to
produce nuclear fuel for the generation of safe, clean and reliable electricity around the world.
Cameco’s Fuel Services Division (FSD) is comprised of the Blind River Refinery (BRR), the
Port Hope Conversion Facility (PHCF), Cameco Fuel Manufacturing Inc. (CFM), and a
divisional head office located in Port Hope, Ontario.
BRR operates a Class IB nuclear facility in Blind River, Ontario under operating licence FFOL-
3632.0/2022. The current licence is valid until February 28, 2022. The licence includes an
increase in licensed production capacity from 18,000 tonnes of uranium as UO3 to 24,000 tonnes
of uranium as UO3, once certain conditions have been met. While located in Blind River, the
refinery is also situated adjacent to and south of the Mississauga First Nation.
BRR is the world’s largest commercial uranium refinery and has been in operation since 1983.
The refinery processes natural uranium ore concentrates into natural uranium trioxide (UO3).
Cameco receives uranium ore concentrates from mines and mills worldwide. The majority of the
UO3 produced at BRR is shipped to the PHCF, where it is converted to either uranium dioxide
(UO2) or uranium hexafluoride (UF6). BRR also prepares and ships UO3 to other customers
around the world who are licensed by an equivalent authority to the CNSC in another country.
BRR employs approximately 125 workers.
The refinery employs qualified personnel and has established a strong management system to
ensure compliance with other federal and provincial regulations. In addition to the CNSC, BRR
is regulated by federal and provincial regulators, such as the Ontario Ministry of the
Environment and Climate Change (MOECC), Environment and Climate Change Canada
(ECCC), Employment and Social Development Canada (ESDC) and Transport Canada (TC).
In the quarter the refinery did not exceed any CNSC regulatory limits with respect to radiation
exposure or environmental discharge limits.
The acronyms in the following table may be used in this report.
Page 5
2017 Second Quarter Compliance Monitoring and Operational Performance Report
Blind River Refinery
Page 5 of 45
Table 1
List of Acronyms
Acronym Description
ALARA As Low As Reasonably Achievable
BRFD Blind River Fire Department
BRR Blind River Refinery
CCM Contaminated Combustible Material
CED Committed Effective Dose
CFM Cameco Fuel Manufacturing
CNC Contaminated Non-combustible Material
CNSC Canadian Nuclear Safety Commission
DML Dust Mask Level
DRaff Dried Raffinate
DRL Derived Release Limit
ECCC Environment and Climate Change Canada
ECA Environmental Compliance Approval
ERAP Emergency Response Assistance Plan
ERP Emergency Response Plan
ERT Emergency Response Team
ESDC Employment and Social Development Canada
FAA First Aid Attendant
FFOL Fuel Facility Operating Licence
FHA Fire Hazard Analysis
FHSC Facility Health and Safety Committee
FLM Facility Licensing Manual
FPP Fire Protection Program
FSD Fuel Services Division
HAZOP Hazards and Operability
IAEA International Atomic Energy Agency
IAL Internal Administrative Level
ISI In-Service Inspection
Page 6
2017 Second Quarter Compliance Monitoring and Operational Performance Report
Blind River Refinery
Page 6 of 45
KPI Key performance indicator
LCH Licence Condition Handbook
MFN Mississauga First Nation
MOECC Ministry of the Environment and Climate Change
mSv millisievert
NEW Nuclear Energy Worker
NFPA National Fire Protection Association
NOx Nitrogen Oxides
NPRI National Pollutant Release Inventory
OHSAS Occupational Health and Safety Advisory Services
OSL Optically Stimulated Luminescence
PHCF Port Hope Conversion Facility
PIP Public Information Program
PIV Physical Inventory Verification
PM Preventive Maintenance
QA Quality Assurance
RL Respirator Limit
S&FP Sample & Feed Preparation
SAT Systematic Approach to Training
SHEQ Safety Health Environment and Quality
SNRI Short Notice Random Inspection
SSC Systems Structures and Components
TC Transport Canada
TED Total Effective Dose
TRA Toxics Reduction Act
UF6 Uranium Hexafluoride
ug U/L micrograms of uranium per litre
UOC Uranium Ore Concentrate
UO2 Uranium Dioxide
UO3 Uranium Trioxide
uSv microsievert
Page 7
2017 Second Quarter Compliance Monitoring and Operational Performance Report
Blind River Refinery
Page 7 of 45
1.2 Facility Operation
Cameco is committed to the safe, clean and reliable operations of all of its facilities and
continually strives to improve safety performance and processes to ensure the safety of both its
employees, and local residents.
At BRR changes to the physical design of equipment, processes and the facility with the
potential to impact safety are evaluated using an internal design control process from project
planning through to completion of the project. This review identifies potential impacts to the
environment as well as to health and safety of personnel. There were no significant
modifications carried out at the facility in the second quarter of 2017.
Page 8
2017 Second Quarter Compliance Monitoring and Operational Performance Report
Blind River Refinery
Page 8 of 45
1.3 Production or Utilization
Detailed plant production information is considered “protected proprietary” and is submitted to
CNSC staff on an annual basis under a separate cover.
Page 9
2017 Second Quarter Compliance Monitoring and Operational Performance Report
Blind River Refinery
Page 9 of 45
1.4 Facility Modification
There were no modifications affecting the safety analysis of BRR made in the second quarter of
2017 that required written approval of the Commission or a person authorized by the
Commission.
Page 10
2017 Second Quarter Compliance Monitoring and Operational Performance Report
Blind River Refinery
Page 10 of 45
2. SAFETY AND CONTROL AREAS
2.1 Management
2.1.1 Management System
This safety and control area covers the framework which establishes the processes and programs
required to ensure that the organization achieves its safety objectives and continuously monitors
its performance against these objectives, as well as fostering a healthy safety culture.
BRR’s operations quality assurance program identifies the controls required to ensure all
processes are conducted in a safe manner and that processes applying to licensed activities are
conducted in accordance with applicable CNSC QA requirements and other regulatory
requirements. The application of QA requirements is scaled according to the complexity and
hazard potential of a particular activity.
Starting in 2017 Cameco’s corporate SHEQ group assumed responsibility for completion of
required internal audits at Cameco licensed facilities, including the BRR. The internal audit
program encompasses all key areas of refinery operations including environmental protection,
radiation safety, occupational health and safety and quality management. Internal audits by the
corporate SHEQ group were carried out in the second quarter of 2017. There were no significant
findings.
All procedures that support licensed activities are subject to the site document control process.
Documents that support licensed activities are maintained in electronic format on a database
available to all site personnel. This includes, but is not limited to, procedures for operating and
maintaining the facility, as well as environmental, health and safety, radiation protection and
quality management documentation.
Page 11
2017 Second Quarter Compliance Monitoring and Operational Performance Report
Blind River Refinery
Page 11 of 45
2.1.2 Human Performance Management
This safety and control area covers activities that enable effective human performance, through
the development and implementation of processes that ensure that licensed staff members are
sufficient in numbers in all relevant job areas, and have the necessary knowledge, skills and tools
in place, in order to safely carry out their duties.
BRR has a sufficient number of qualified workers as well as the minimum number of responsible
people to carry on the licensed activities safely and in accordance with the Nuclear Safety and
Control Act and Regulations.
BRR has a number of programs, procedures and processes that combine to form the framework
for a safe environment and foster a sustainable safety culture. Management has focused on
enhancing the site’s safety culture by establishing comprehensive environmental, radiation and
health and safety programs. These programs have contributed to the development of processes
and practices such as the use of hazard recognition cards for maintenance activities and self-audit
hazard recognition cards for other types of work.
A range of programs are in place to ensure that employees are fit for duty. They cover human
resource matters such as a program for alcohol and substance abuse, violence in the workplace,
respectful workplace as well as addressing more general health matters such as medical
surveillance and radiation protection monitoring.
Cameco has an audit program that routinely looks at various aspects of the site training program.
Corrective actions are taken to address any issues identified during these audits.
Page 12
2017 Second Quarter Compliance Monitoring and Operational Performance Report
Blind River Refinery
Page 12 of 45
2.1.3 Operating Performance
This safety and control area includes an overall review of the conduct of the licensed activities
and the activities that enable effective facility performance.
In the quarter, BRR continued to operate in a manner that supports safe, clean and reliable
production and in compliance with applicable acts and regulations. Annual operating targets are
set and key performance indicators established for refinery operations.
As noted previously in this report, Cameco has an internal audit program that looks at various
aspects of site operations related to the licensed activities. All audits are documented in the
Cameco Incident Reporting System (CIRS) and corrective actions are taken to address any issues
identified.
Page 13
2017 Second Quarter Compliance Monitoring and Operational Performance Report
Blind River Refinery
Page 13 of 45
2.2 Facility and Equipment
2.2.1 Safety Analysis
This safety and control area covers the maintenance of the safety analysis which supports the
overall safety case for the facility. This safety analysis is a systematic evaluation of the potential
hazards associated with the conduct of a proposed activity or facility and considers the
effectiveness of preventative measures and strategies in reducing the effects of such hazards.
BRR has a safety report that documents the detailed safety analysis carried out for the facility.
The original analysis had been carried out using the Hazards and Operability (HAZOP) study
technique. Design reviews, which may include the completion of a HAZOP, are done prior to
making any plant modifications that may affect the safety case for the refinery, with the site
safety report updated periodically to include the findings from design reviews completed since
the last revision to the report.
There were no modifications made in the second quarter of 2017 that affected the safety case for
the refinery.
Page 14
2017 Second Quarter Compliance Monitoring and Operational Performance Report
Blind River Refinery
Page 14 of 45
2.2.2 Physical Design
This safety and control area relates to activities that impact on the ability of systems, structures
and components (SSCs) to meet and maintain their design basis, given new information arising
over time and taking into account changes in the external environment.
As part of the Cameco budgeting process for capital expenditures, plant improvements related to
physical design are identified and prioritized.
Changes to the physical design of equipment, processes and the facility with the potential to
impact safety are evaluated from project planning through to the completion of the project. This
review identifies impacts and potential impacts to the environment and health and safety. A
design control procedure is in place which ensures that any equipment changes or modifications
will not have an adverse effect on the environment or on the health and safety of employees or
members of the public.
Page 15
2017 Second Quarter Compliance Monitoring and Operational Performance Report
Blind River Refinery
Page 15 of 45
2.2.3 Fitness for Service
This safety and control area covers activities that impact on the physical conditions of systems,
structures and components (SSCs), to ensure that they remain effective over time. This includes
programs that ensure all equipment is available to perform its intended design function when
called upon to do so.
BRR has programs and procedures that ensure that the facility is operated in a safe, clean and
reliable manner. These programs and procedures address the following areas that comprise this
safety control area: a Preventative Maintenance program (PM), an in-service inspection program
and other testing and review systems.
Process monitoring is conducted through product and intermediate quality control testing (such
as chemical analysis) to ensure that the equipment is functioning within design specifications.
Page 16
2017 Second Quarter Compliance Monitoring and Operational Performance Report
Blind River Refinery
Page 16 of 45
2.3 Core Control Processes
2.3.1 Radiation Protection
This safety and control area covers the implementation of a radiation protection program, in
accordance with the Radiation Protection Regulations. This program must ensure that
contamination and radiation doses are monitored and controlled.
The refinery has an extensive Radiation Safety Program in place to meet the requirements of the
Nuclear and Safety Control Act and the Radiation Protection Regulations and ensure exposures
are kept to levels as low as reasonably achievable (ALARA). The program includes the
following aspects:
• external dosimetry – personal monitors for assessment of whole body and skin exposure;
• internal dosimetry – urinalysis and lung counting programs;
• workplace air sampling program;
• a respirator program; and
• radiation surveys and contamination surveys.
The CNSC regulatory limits for effective dose for nuclear energy workers (NEWs) are 50
milliSieverts (mSv) per year and 100 mSv over a five-year dosimetry period. The current five
year dosimetry period began on January 1, 2016.
For various radiological parameters, Cameco has established action levels, approved by the
CNSC that may be indicative of a potential loss of control for that specific parameter. These
action levels serve as an early warning of a condition that warrants further investigation. In
addition, as a continual improvement tool, Cameco has established lower-tier internal
administrative levels, which are set below the action levels and provide an even earlier warning
of a potential concern. A result above an internal administrative level is also investigated and
remedial actions taken if necessary.
In the quarter there were no CNSC regulatory limits exceeded with respect to radiation exposure.
There was one reported CNSC action level exceedance related to a whole body exposure in June.
An investigation into this exceedance is on-going and preliminary indications are that the
exposure may be non-personal in nature. A report is being prepared for submission to CNSC
staff.
The following tables and graphs summarize radiation exposure results. Note that in figures with
ranges on the horizontal axis, a range of 1 – 2, for example, means all results greater than (>) 1
and less than or equal to (≤) 2.
Page 17
2017 Second Quarter Compliance Monitoring and Operational Performance Report
Blind River Refinery
Page 17 of 45
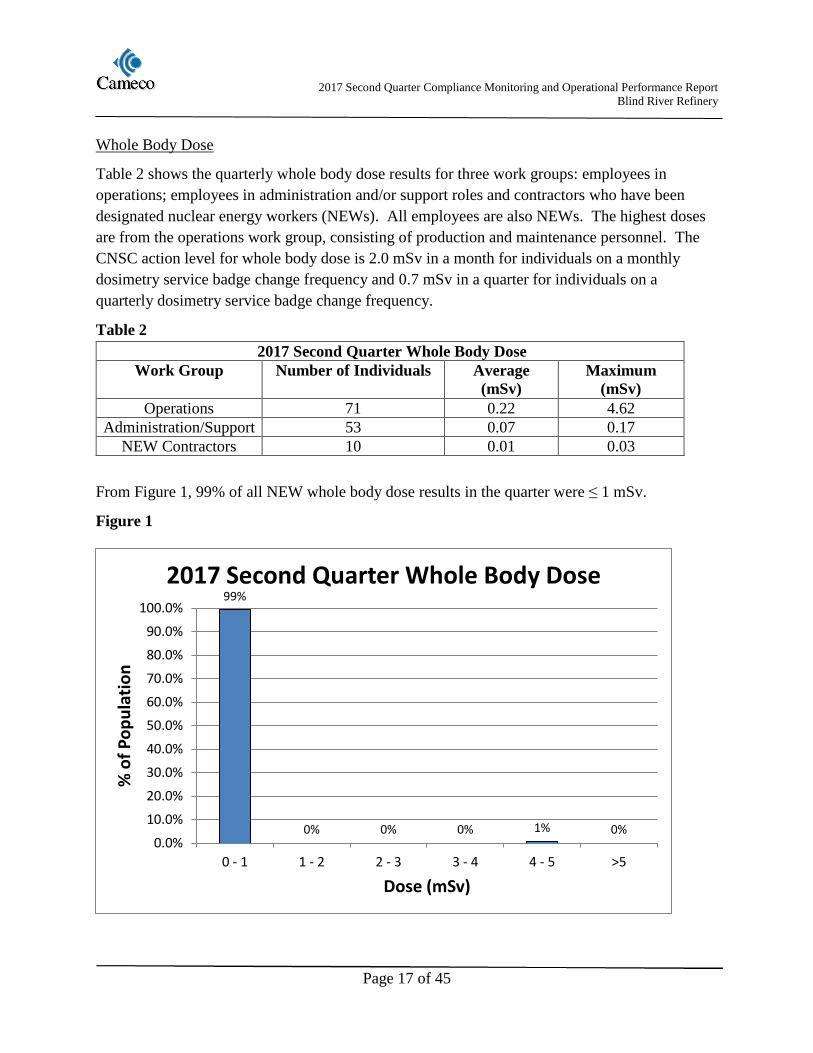
Whole Body Dose
Table 2 shows the quarterly whole body dose results for three work groups: employees in
operations; employees in administration and/or support roles and contractors who have been
designated nuclear energy workers (NEWs). All employees are also NEWs. The highest doses
are from the operations work group, consisting of production and maintenance personnel. The
CNSC action level for whole body dose is 2.0 mSv in a month for individuals on a monthly
dosimetry service badge change frequency and 0.7 mSv in a quarter for individuals on a
quarterly dosimetry service badge change frequency.
Table 2
2017 Second Quarter Whole Body Dose
Work Group Number of Individuals Average
(mSv)
Maximum
(mSv)
Operations 71 0.22 4.62
Administration/Support 53 0.07 0.17
NEW Contractors 10 0.01 0.03
From Figure 1, 99% of all NEW whole body dose results in the quarter were ≤ 1 mSv.
Figure 1
99%
0% 0% 0% 1% 0%0.0%
10.0%
20.0%
30.0%
40.0%
50.0%
60.0%
70.0%
80.0%
90.0%
100.0%
0 - 1 1 - 2 2 - 3 3 - 4 4 - 5 >5
% o
f P
op
ula
tio
n
Dose (mSv)
2017 Second Quarter Whole Body Dose
Page 18
2017 Second Quarter Compliance Monitoring and Operational Performance Report
Blind River Refinery
Page 18 of 45
Table 3 and Figure 2 show the average and maximum individual whole body results for the last
five quarters. The average individual whole body dose in the quarter is comparable to previous
quarters. Note that third quarter results are typically lower than results in other quarters due to
the summer shutdown and vacation period. As indicated previously, there was one reported
whole body dose (4.62 mSv) above the CNSC action level; assigned to a production engineer.
Some contractors and visitors may be issued dosimeter badges even though they are not NEWs.
The highest non-NEW whole body result in the quarter was 0.04 mSv.
Table 3
Quarterly Whole Body Dose
Work Group Number of Individuals Average
(mSv)
Maximum
(mSv)
Second Quarter 2016 143 0.14 0.94
Third Quarter 2016 137 0.07 0.41
Fourth Quarter 2016 135 0.12 0.69
First Quarter 2017 130 0.15 1.07
Second Quarter 2017 134 0.15 4.62
Figure 2
0.14 0.07 0.12 0.15 0.150.94 0.41 0.69 1.07
4.62
0
10
20
30
40
50
Q2 2016 Q3 2016 Q4 2016 Q1 2017 Q2 2017
Do
se (
mSv
)
Quarterly Whole Body Dose
Average Maximim
Page 19
2017 Second Quarter Compliance Monitoring and Operational Performance Report
Blind River Refinery
Page 19 of 45
Skin Dose
Table 4 shows the second quarter skin dose for three work groups: employees in operations;
employees in administration and/or support roles and contractors who have been made NEWs.
The highest doses are from the operations work group, consisting of production and maintenance
personnel. The CNSC action level for skin dose is 15.0 mSv in a month for individuals on a
monthly dosimetry service badge change frequency and 6.0 mSv in a quarter for individuals on a
quarterly badge change frequency.
Table 4
2017 Second Quarter Skin Dose
Work Group Number of Individuals Average
(mSv)
Maximum
(mSv)
Operations 71 1.56 7.15
Administration/Support 53 0.23 1.45
NEW Contractors 10 0.01 0.03
As shown in Figure 3, all individual skin dose results were ≤ 10 mSv.
Figure 3
100.0%
0.0% 0.0% 0.0% 0.0% 0.0%0.0%
10.0%
20.0%
30.0%
40.0%
50.0%
60.0%
70.0%
80.0%
90.0%
100.0%
0 - 10 10 - 20 20 - 30 30 - 40 40 - 50 >50
% o
f P
op
ula
tio
n
Dose (mSv)
2017 Second Quarter Skin Dose
Page 20
2017 Second Quarter Compliance Monitoring and Operational Performance Report
Blind River Refinery
Page 20 of 45
Table 5 and Figure 4 show the average and maximum individual skin dose results for the last
five quarters. Both the average and maximum individual skin dose in the second quarter are
comparable to previous quarters. As noted previously, results are typically lower in the third
quarter than in other quarters.
The maximum skin dose was 7.15 mSv to a maintenance employee. Some contractors and
visitors may be issued dosimeter badges even though they are not NEWs. The highest non-NEW
skin dose result in the quarter was 0.04 mSv.
Table 5
Quarterly Skin Dose
Work Group Number of Individuals Average
(mSv)
Maximum
(mSv)
Second Quarter 2016 143 1.09 12.80
Third Quarter 2016 137 0.47 4.08
Fourth Quarter 2016 135 0.80 5.12
First Quarter 2017 130 1.14 5.59
Second Quarter 2017 134 0.92 7.15
Figure 4
1.09 0.47 0.80 1.14 0.9212.80 4.08 5.12 5.59 7.15
0
100
200
300
400
500
600
Q2 2016 Q3 2016 Q4 2016 Q1 2017 Q2 2017
Do
se (
mSv
)
Quarterly Skin Dose
Average Maximim
Regulatory Limit is 500 mSv/a.
Page 21
2017 Second Quarter Compliance Monitoring and Operational Performance Report
Blind River Refinery
Page 21 of 45
Extremity Dose
Process operators working in the DRaff area and designated maintenance workers have
historically been issued ring dosimeters. These dosimeters are only required to be worn when
working in the DRaff area of the refinery. Table 6 shows the average and maximum ring
dosimeter result for employees over the last five quarters. The average dose in the quarter is
comparable to previous quarters, while the maximum individual dose was lower than in the
previous quarter but similar to earlier quarters. As noted previously, results are typically lower
in the third quarter than in other quarters. The annual equivalent dose limit for hands and feet is
500 mSv.
Table 6
Quarterly Extremity Dose
Work Group Number of Individuals Average
(mSv)
Maximum
(mSv)
Second Quarter 2016 39 0.4 4.5
Third Quarter 2016 38 0.1 2.2
Fourth Quarter 2016 38 0.2 2.1
First Quarter 2017 38 0.5 11.5
Second Quarter 2017 38 0.3 1.5
Urinalysis
Table 7 and Figure 5 show the distribution of urine results for the second quarter of 2017. The
majority of results (99%) are less than or equal to 5 µg U/L.
Table 7
2017 Second Quarter Urinalysis Results
Distribution of Results Number of Results
Number of Samples ≤ 5 µg U/L 970
Number of Samples >5 to ≤ 25 µg U/L 6
Number of Samples >25 to ≤ 50 µg U/L 0
Number of Samples ≥ 50 µg U/L 0
Number of Samples Analyzed 976
Page 22
2017 Second Quarter Compliance Monitoring and Operational Performance Report
Blind River Refinery
Page 22 of 45
Figure 5
Internal Dose (Urine)
The breakdown of internal urine dose for individuals in the second quarter of 2017 is shown in
Figure 6. The majority of the results (94%) were less than 0.2 mSv. The highest individual
urine dose in the quarter was 0.46 mSv.
Cameco has an Internal Dosimetry Licence (#11010-16-14.3) specific to the Fuel Services
Division, for both urinalysis and lung counting.
99.4%
0.6% 0.0% 0.0%0.0%
10.0%
20.0%
30.0%
40.0%
50.0%
60.0%
70.0%
80.0%
90.0%
100.0%
0 - 5 5 - 25 25 - 50 50 - More
% o
f P
op
ula
tio
n
Result (µg U/L)
2017 Second Quarter Urinalysis Results
Page 23
2017 Second Quarter Compliance Monitoring and Operational Performance Report
Blind River Refinery
Page 23 of 45
Figure 6
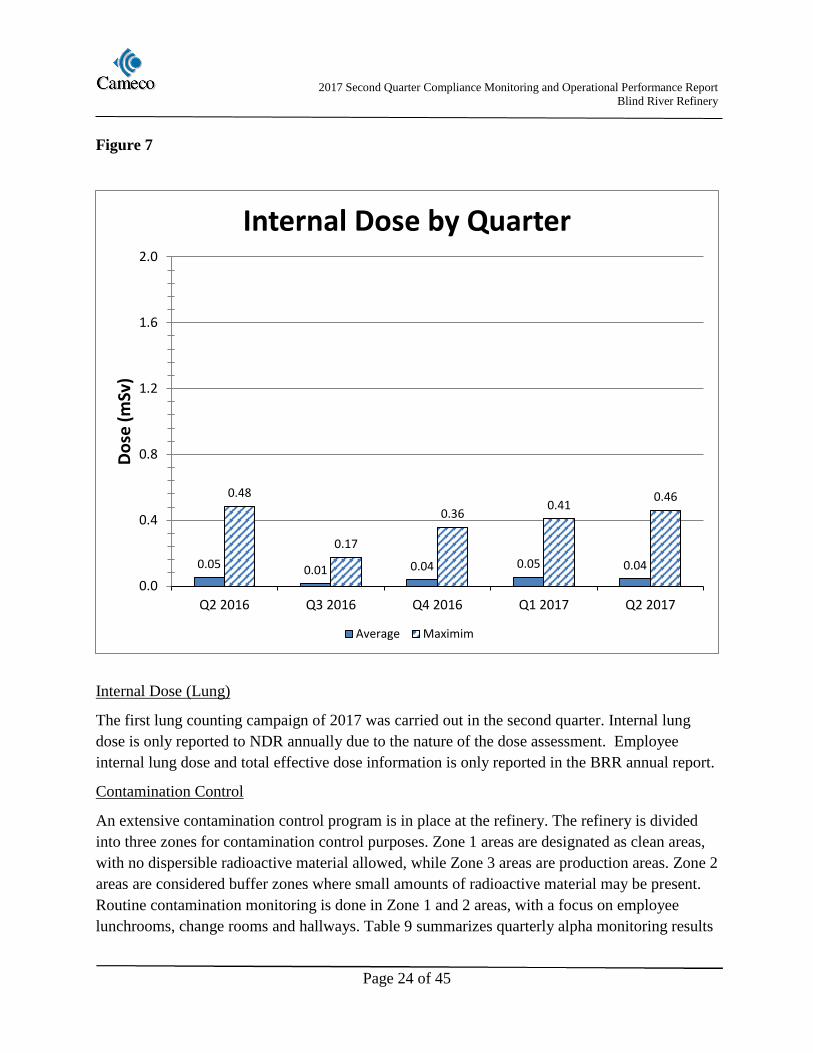
Table 8 and Figure 7 show the average and maximum individual assigned urine dose for the last
five quarters. Both the average and maximum individual urine dose results were comparable to
results from previous quarters. Third quarter results are typically lower than results in other
quarters due to the summer shutdown and vacation period. The highest maximum urine dose
this quarter was to a S&FP operator.
Table 8
Internal Urine Dose by Quarter
Year Number of Individuals Average Dose (mSv) Maximum Dose (mSv)
Q2 2016 135 0.05 0.48
Q3 2016 130 0.01 0.17
Q4 2016 128 0.04 0.36
Q1 2017 127 0.05 0.41
Q2 2017 125 0.04 0.46
93.6%
5.6% 0.8% 0.0% 0.0% 0.0%0.0%
10.0%
20.0%
30.0%
40.0%
50.0%
60.0%
70.0%
80.0%
90.0%
100.0%
0 - 0.2 0.2 - 0.4 0.4 - 0.6 0.6 - 0.8 0.8 - 1 <1
% o
f P
op
ula
tio
n
Result (mSv)
2017 Second Quarter Bioassay Dose Results
Page 24
2017 Second Quarter Compliance Monitoring and Operational Performance Report
Blind River Refinery
Page 24 of 45
Figure 7
Internal Dose (Lung)
The first lung counting campaign of 2017 was carried out in the second quarter. Internal lung
dose is only reported to NDR annually due to the nature of the dose assessment. Employee
internal lung dose and total effective dose information is only reported in the BRR annual report.
Contamination Control
An extensive contamination control program is in place at the refinery. The refinery is divided
into three zones for contamination control purposes. Zone 1 areas are designated as clean areas,
with no dispersible radioactive material allowed, while Zone 3 areas are production areas. Zone 2
areas are considered buffer zones where small amounts of radioactive material may be present.
Routine contamination monitoring is done in Zone 1 and 2 areas, with a focus on employee
lunchrooms, change rooms and hallways. Table 9 summarizes quarterly alpha monitoring results
0.05 0.01 0.04 0.05 0.04
0.48
0.17
0.360.41
0.46
0.0
0.4
0.8
1.2
1.6
2.0
Q2 2016 Q3 2016 Q4 2016 Q1 2017 Q2 2017
Do
se (
mSv
)
Internal Dose by Quarter
Average Maximim
Page 25
2017 Second Quarter Compliance Monitoring and Operational Performance Report
Blind River Refinery
Page 25 of 45
from Zone 1 and Zone 2 areas. Monitoring results include both swipe samples and direct contact
surface measurements. There were two contamination results above the administration level in
the quarter, compared to none in the previous quarter. Contamination readings above the
administration level if found, would generally not be considered a significant risk to people or to
the environment.
Table 9
2017 Second Quarter Alpha Contamination Monitoring Results
Area Total Number of
Measurements
Number of Readings Above Internal
Administrative Level1
Zone 1 424 0
Zone 2 4470 2 1 Administrative level for swipes is 0.15 Bq/cm2 and for direct contact readings is 0.37 Bq/cm2.
All plant clothing is laundered on site and clothing and work boots are routinely monitored for
contamination, with items contaminated above administrative levels disposed of via the on-site
incinerator.
Vehicles leaving the refinery are also checked for contamination. During the quarter no
contamination issues were identified related to vehicles leaving the site. Three whole body
monitors are located at the entrance to the facility to check individuals for contamination. All
employees and visitors are required to pass through one of these monitors prior to exiting the
refinery.
In-plant Air
A summary of in-plant air sampling results in the second quarter of 2017 is provided in Tables
10 and 11. There were only five uranium-in-air respirator level (RL) samples in the quarter,
compared to four samples in the previous quarter. There was also one thorium-in-air RL sample
in the quarter, compared to four in the previous quarter.
Page 26
2017 Second Quarter Compliance Monitoring and Operational Performance Report
Blind River Refinery
Page 26 of 45
Table 10
2017 Second Quarter Uranium In-plant Air Sampling Results
Plant Area # of Samples Average
(µg U/m3)
Maximum
(µg U/m3)
# of Samples
above RL1
Warehouse 804 1 35 0
UOC Lab 89 <1 2 0
Calcination 534 1 31 0
Main Aisle 89 <1 7 0
Maintenance Shop 3 0 0 0
Gravimetric Feeders 89 3 148 1
Digestion 178 <1 6 0
Solvent Extraction 3 0 0 0
Sump Treatment 89 1 43 0
Equipment
Decontamination
362 2 169 3
Aisle to Powerhouse 89 1 19 0
Boildown 12 0 0 0
Denitration 463 1 149 1
UO3 Lab 3 0 0 0
Raffinate/DRaff 868 <1 2 0
TOTAL 3675 1 169 5 1 Respirator Level (RL) is 90 µg U/m3
Table 11
2017 Quarterly Thorium-in-Air Sampling Results
Plant Area # of
Samples1
Average
Th-230
(Bq/m3)
Maximum
Th-230
(Bq/m3)
# of Samples
above RL2
First Quarter 378 <0.01 0.33 4
Second Quarter 352 <0.01 0.22 1
Third Quarter
Fourth Quarter
TOTAL 730 <0.01 0.33 5 1Total number of samples collected and analyzed in the raffinate area is shown in Table 9. Only samples above a pre-established
uranium-in-air concentration are normally analyzed for Th-230. 2 Respirator Level (RL) is 0.15 Bq/m3 Th-230.
Page 27
2017 Second Quarter Compliance Monitoring and Operational Performance Report
Blind River Refinery
Page 27 of 45
2.3.2 Conventional Health and Safety
This safety and control area covers BRR’s program to manage non-radiological workplace safety
hazards and to protect personnel and equipment.
A key element of a safe, clean and reliable operation is a comprehensive and well-established
worker protection program which is in place at the BRR. The foundation of the program is based
on the Nuclear Safety and Control Act and its regulations as well as Part II of the Canada Labour
Code. The regulations made pursuant to the Nuclear Safety and Control Act and the Canada
Labour Code prescribe specific health and safety requirements that are met by the BRR.
The site program sets out the requirements for management of health and safety aspects of the
operation consistent with Cameco’s corporate SHEQ policy, which is modeled on the OHSAS
18001 standard. Key components of the program include:
• compliance with all safety and health-related legal and regulatory requirements;
• the setting of site safety and health objectives;
• the implementation of corporate safety standards;
• the development and maintenance of a formal hazard recognition, risk assessment and
change control processes; and
• the documentation of health and safety significant incidents from the start through to the
verification of completion of corrective actions via the CIRS database.
Table 12 below lists the safety statistics for the refinery for the quarter and year-to-date.
Table 12 – Safety Statistics
2017 Safety Statistics
Year / Parameter Second Quarter Year To Date
First Aid Injuries 3 4
Medical Diagnostic Injuries 1 1
Medical Treatment Injuries 0 0
Lost Time Injuries (LTI) 0 0
Lost Time Injury Frequency 0 0
Lost Time Injury Severity 0 0
There were no lost time injuries in the quarter. The refinery reached eleven years without a lost
time accident in June.
Page 28
2017 Second Quarter Compliance Monitoring and Operational Performance Report
Blind River Refinery
Page 28 of 45
2.3.3 Environmental Protection
This safety and control area covers the programs that monitor and control all releases of nuclear
and hazardous substances into the environment, as well as their effects on the environment, as
the result of licensed activities.
There are both federal and provincial regulatory authorities that have legislative jurisdiction over
environmental protection at the facility. Cameco monitors air and liquid effluents discharges to
ensure that they meet applicable provincial and federal requirements.
The refinery’s Environmental Monitoring Program (EMP) is comprised of the following
components:
• sampling of water and air emissions;
• high-volume sampling of ambient air, both near the refinery and in the Town of Blind
River; and
• additional ambient sampling, including soil, surface water and groundwater monitoring
For key emission parameters, Cameco has established action levels accepted by the CNSC that
may be indicative of a potential loss of control for that specific parameter. As noted previously,
these action levels serve as an early warning of a condition that warrants further investigation. In
addition, as a continual improvement tool, Cameco has established some lower-tier internal
administrative levels, which are set below the action levels and provide very early warning of a
potential concern. A result above an internal administrative level is also investigated and
remedial actions taken if necessary.
Cameco Corporation is registered to the ISO 14001:2004 standard for environmental
management systems.
There were no exceedances of CNSC regulatory limits or action levels with respect to air or
liquid emissions in the second quarter of 2017.
Public Dose
The derived release limit (DRL) for a given radionuclide is defined as the release rate that would
cause an individual of the most highly exposed group to receive and be committed to a dose
equal to the regulatory annual dose limit due to release of the radionuclide to air or surface water
during normal operation of a nuclear facility over the period of a calendar year.
The DRL for the facility is based on three components: dose to the public from air emissions,
dose from water discharges and dose from gamma radiation. For the refinery, dose to the public
from air and water emissions is a very small fraction of the public dose limit (<0.001 mSv).
Therefore, the gamma component represents virtually all the estimated public dose.
Page 29
2017 Second Quarter Compliance Monitoring and Operational Performance Report
Blind River Refinery
Page 29 of 45
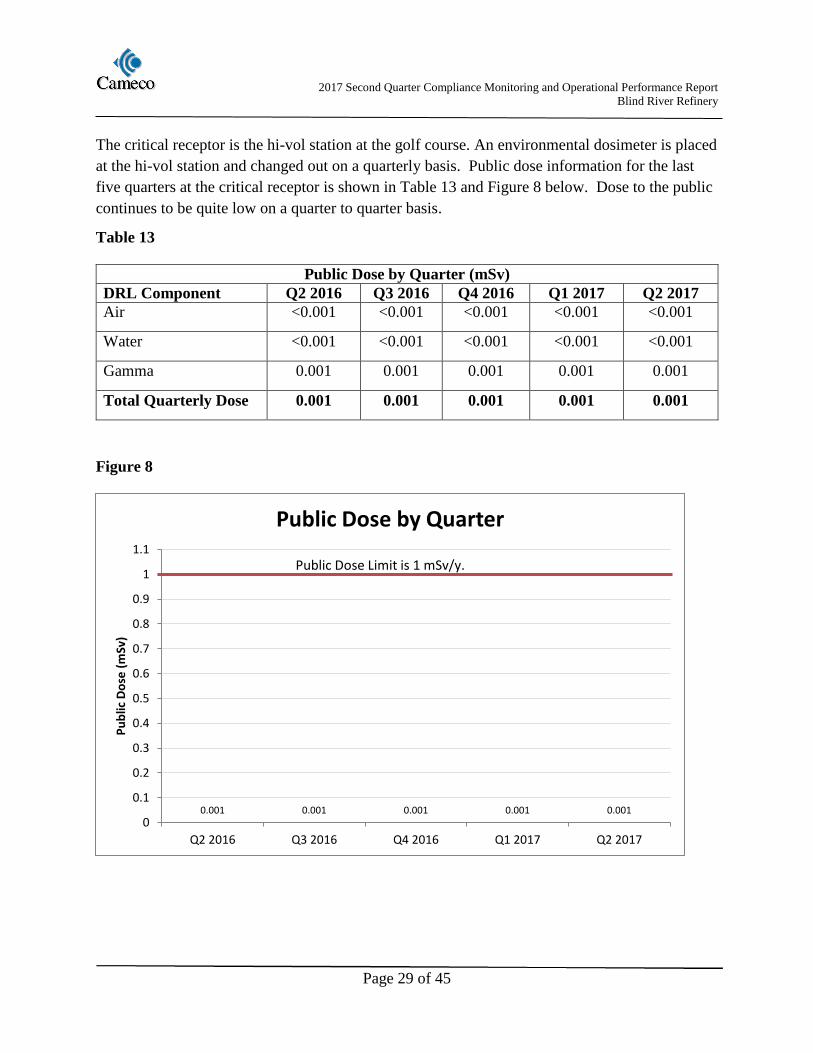
The critical receptor is the hi-vol station at the golf course. An environmental dosimeter is placed
at the hi-vol station and changed out on a quarterly basis. Public dose information for the last
five quarters at the critical receptor is shown in Table 13 and Figure 8 below. Dose to the public
continues to be quite low on a quarter to quarter basis.
Table 13
Public Dose by Quarter (mSv)
DRL Component Q2 2016 Q3 2016 Q4 2016 Q1 2017 Q2 2017
Air <0.001 <0.001 <0.001 <0.001 <0.001
Water <0.001 <0.001 <0.001 <0.001 <0.001
Gamma 0.001 0.001 0.001 0.001 0.001
Total Quarterly Dose 0.001 0.001 0.001 0.001 0.001
Figure 8
0.001 0.001 0.001 0.001 0.0010
0.1
0.2
0.3
0.4
0.5
0.6
0.7
0.8
0.9
1
1.1
Q2 2016 Q3 2016 Q4 2016 Q1 2017 Q2 2017
Pu
blic
Do
se (
mSv
)
Public Dose by Quarter
Public Dose Limit is 1 mSv/y.
Page 30
2017 Second Quarter Compliance Monitoring and Operational Performance Report
Blind River Refinery
Page 30 of 45
Gamma Monitoring
Environmental dosimeters are placed along each of the four perimeter fence lines; north, south,
east and west. The dosimeters are collected and replaced in the field monthly. Fence line results
for each month in the quarter are shown in Table 14.
Table 14
2017 Second Quarter Measured Fence Line Gamma Levels (µSv/h)
Fence Line April May June
East 0.31 0.29 0.40
North 0.23 0.24 0.25
South 0.45 0.50 0.56
West 1.08 0.94 1.00
The dose rate along the west fence line is typically higher than the dose rates along the other
three sides due to the proximity of the uranium concentrate storage pad along the west fence.
Radiation levels will vary from month to month depending on the amount of inventory in
storage. It should be noted that outside of the west fence line is a heavily forested area between
100 and 200 m wide. This forested area west of the refinery, which is owned and controlled by
Cameco, continues until it reaches the eastern bank of the Mississagi River.
There was minimal variation in the results from month-to-month this quarter. Overall, the
results were similar to the previous quarter.
A CNSC action level of 1 µSv/h is in effect at the north fence only. Results at the north fence
remained below the action level in the quarter.
Despite the fact that environmental dosimeters are being used along the fence line, the critical
receptor for the gamma component of dose to the public remains the hi-vol station at the golf
course; as the land immediately outside the perimeter fence on all four sides is owned and
controlled by Cameco. The golf course north of the refinery is the closest location where
members of the public can reasonably be expected to be in proximity to the refinery for any
significant period of time.
Page 31
2017 Second Quarter Compliance Monitoring and Operational Performance Report
Blind River Refinery
Page 31 of 45
Air Emissions
The refinery has two process stacks and an incinerator stack that are routinely monitored for
uranium and particulate emissions. The absorber stack also has an on-line NOx analyzer. Each
process area also has its own separate ventilation system. Uranium emissions from each of the
individual process area ventilation systems are determined through calculation. Third-party
sampling of some of the ventilation systems has been done in the past to verify uranium emission
estimates. A variety of pollution control equipment including bag houses, scrubbers and
activated carbon beds are used at the facility to control and reduce emissions to air.
Stack uranium emissions by quarter are shown in Table 15 and in Figure 9.
Stack sampling for uranium and particulate is done using TSI samplers, while NOx emissions are
measured by a continuous emission monitor. Uranium emissions from each of the three stacks
continue to be a fraction of their respective CNSC regulatory limits. All results are comparable
to results from the four prior quarters. Note that third quarter results are typically lower than
results in other quarters due to the summer shutdown and vacation period.
Overall results remain consistently below the regulatory limit from quarter to quarter.
Table 15
Daily Stack Emissions by Quarter
Source Parameter CNSC
Licensed
Limit
CNSC
Action
Level
Value Q2
2016
Q3
2016
Q4
2016
Q1
2017
Q2
2017
DCEV
Uranium
(g U/h)
100 10 Avg. 0.04 0.01 0.05 0.05 0.05
Max. 0.16 0.18 0.20 0.15 0.31
Absorber Uranium
(g U/h)
100 1 Avg. <0.01 <0.01 <0.01 <0.01 <0.01
Max. 0.02 0.04 0.03 0.02 0.03
Nitrogen
Oxides
(kg NO2/h)
56 12 Avg. 1.9 <0.1 1.7 2.6 1.5
Max. 4.4 0.3 4.0 4.4 5.0
Incinerator Uranium
(g U/h)
10 1.5 Avg. 0 0 <0.01 <0.01 <0.01
Max. 0 0 0.02 <0.01 <0.01
All stacks Particulate
(g/h)
11,000 NA Avg. 6.7 3.2 8.5 10 8.9
Max. 27 22 45 31 21 < denotes less than detection limit
Page 32
2017 Second Quarter Compliance Monitoring and Operational Performance Report
Blind River Refinery
Page 32 of 45
Figure 9
Liquid Discharges
The refinery has one liquid effluent discharge location into Lake Huron. All liquid effluent is
sampled and analyzed prior to discharge to ensure all federal and provincial regulatory discharge
parameter limits are met. An effluent treatment circuit and supplementary pollution control
equipment are installed in the UO3 plant to control and reduce emissions to water.
As indicated in Table 16 and Figure 10, concentrations of key parameters in liquid effluent
emissions remain well below regulatory limits. To allow for direct comparison to regulatory
reporting criteria, data for uranium, nitrate and radium-226 is reported as the monthly average of
the weekly composite results, while limits for pH are based on individual daily discharges. The
average results for all four parameters typically remain within a fairly narrow range from quarter
to quarter. Note that third quarter results for nitrate are typically lower than results in other
quarters due to the summer shutdown and vacation period.
There are no notable trends in the data as shown in Table 16.
Effluent parameters are analyzed either in-house, using conventional and appropriate analytical
instrumentation or completed by a third-party contract laboratory.
0.040.01
0.05 0.05 0.050.01 0.01 0.01 0.01 0.010 0 0.01 0.01 0.01
0
0.1
0.2
0.3
0.4
0.5
0.6
0.7
0.8
0.9
1
Q2 2016 Q3 2016 Q4 2016 Q1 2017 Q2 2017
g U/h
STACK URANIUM EMISSIONS BY QUARTER
DCEV Absorber Incinerator
Page 33
2017 Second Quarter Compliance Monitoring and Operational Performance Report
Blind River Refinery
Page 33 of 45
Table 16
Liquid Effluent Discharges by Quarter
Parameter Units of
Measure
CNSC
Licensed
Limit
CNSC
Action
Level
Value Q2
2016
Q3
2016
Q4
2016
Q1
2017
Q2
2017
Uranium
mg/l 2.0 0.2 Avg. 0.01 0.01 0.01 0.01 0.01
Max. 0.01 0.01 0.01 0.01 0.02
Nitrate
mg/l as
N
1000 80 Avg. 11.5 1.9 11.9 20.3 12.7
Max. 19.4 2.2 15.7 22.8 17.1
Radium –
226
Bq/l 1.0 0.05 Avg. <0.01 <0.01 0.01 0.01 0.01
Max. 0.01 <0.01 0.01 0.01 0.01
pH Min 6.0 Min. 6.5 Min. 7.5 7.9 7.6 7.4 7.6
Max 9.5 Max. 9.0 Max. 8.6 8.2 8.4 8.0 8.2
< denotes less than detection limit
Figure 10
0.01 0.01 0.01 0.01 0.01
0
0.02
0.04
0.06
0.08
0.1
0.12
0.14
0.16
0.18
0.2
Q2 2016 Q3 2016 Q4 2016 Q1 2017 Q2 2017
mg/
L
Uranium in Effluent Discharges by Quarter
Page 34
2017 Second Quarter Compliance Monitoring and Operational Performance Report
Blind River Refinery
Page 34 of 45
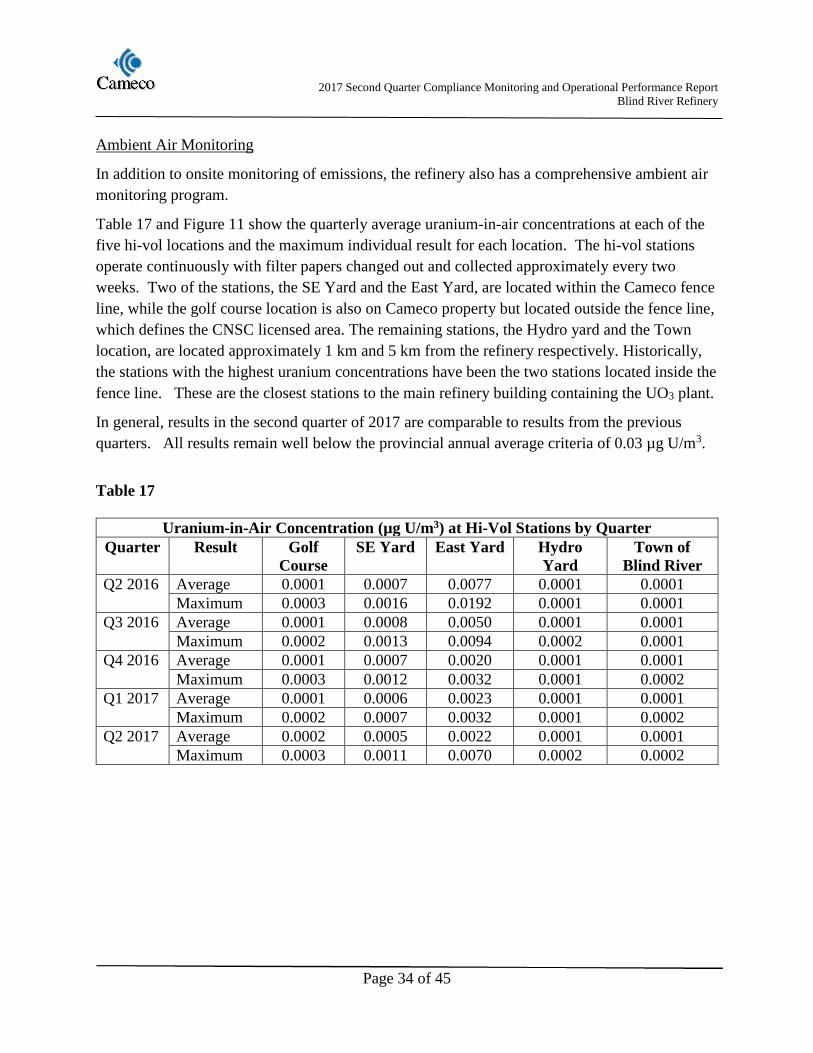
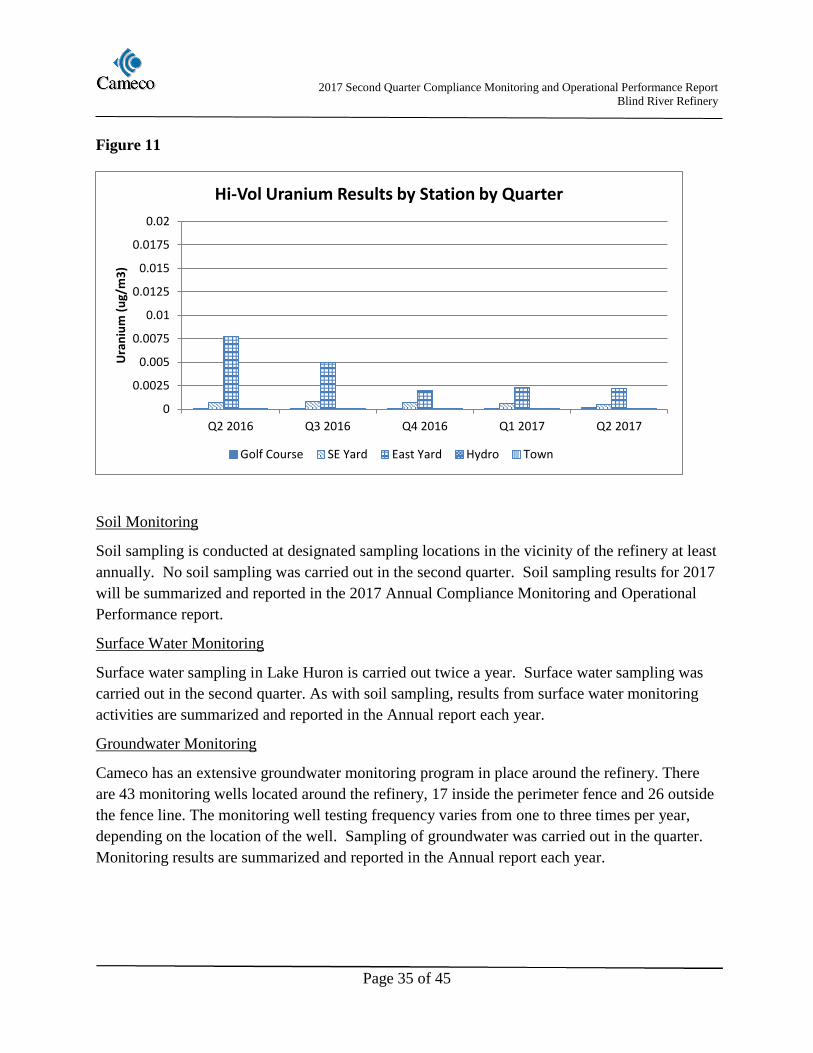
Ambient Air Monitoring
In addition to onsite monitoring of emissions, the refinery also has a comprehensive ambient air
monitoring program.
Table 17 and Figure 11 show the quarterly average uranium-in-air concentrations at each of the
five hi-vol locations and the maximum individual result for each location. The hi-vol stations
operate continuously with filter papers changed out and collected approximately every two
weeks. Two of the stations, the SE Yard and the East Yard, are located within the Cameco fence
line, while the golf course location is also on Cameco property but located outside the fence line,
which defines the CNSC licensed area. The remaining stations, the Hydro yard and the Town
location, are located approximately 1 km and 5 km from the refinery respectively. Historically,
the stations with the highest uranium concentrations have been the two stations located inside the
fence line. These are the closest stations to the main refinery building containing the UO3 plant.
In general, results in the second quarter of 2017 are comparable to results from the previous
quarters. All results remain well below the provincial annual average criteria of 0.03 µg U/m3.
Table 17
Uranium-in-Air Concentration (µg U/m3) at Hi-Vol Stations by Quarter
Quarter Result Golf
Course
SE Yard East Yard Hydro
Yard
Town of
Blind River
Q2 2016 Average 0.0001 0.0007 0.0077 0.0001 0.0001
Maximum 0.0003 0.0016 0.0192 0.0001 0.0001
Q3 2016 Average 0.0001 0.0008 0.0050 0.0001 0.0001
Maximum 0.0002 0.0013 0.0094 0.0002 0.0001
Q4 2016 Average 0.0001 0.0007 0.0020 0.0001 0.0001
Maximum 0.0003 0.0012 0.0032 0.0001 0.0002
Q1 2017 Average 0.0001 0.0006 0.0023 0.0001 0.0001
Maximum 0.0002 0.0007 0.0032 0.0001 0.0002
Q2 2017 Average 0.0002 0.0005 0.0022 0.0001 0.0001
Maximum 0.0003 0.0011 0.0070 0.0002 0.0002
Page 35
2017 Second Quarter Compliance Monitoring and Operational Performance Report
Blind River Refinery
Page 35 of 45
Figure 11
Soil Monitoring
Soil sampling is conducted at designated sampling locations in the vicinity of the refinery at least
annually. No soil sampling was carried out in the second quarter. Soil sampling results for 2017
will be summarized and reported in the 2017 Annual Compliance Monitoring and Operational
Performance report.
Surface Water Monitoring
Surface water sampling in Lake Huron is carried out twice a year. Surface water sampling was
carried out in the second quarter. As with soil sampling, results from surface water monitoring
activities are summarized and reported in the Annual report each year.
Groundwater Monitoring
Cameco has an extensive groundwater monitoring program in place around the refinery. There
are 43 monitoring wells located around the refinery, 17 inside the perimeter fence and 26 outside
the fence line. The monitoring well testing frequency varies from one to three times per year,
depending on the location of the well. Sampling of groundwater was carried out in the quarter.
Monitoring results are summarized and reported in the Annual report each year.
0
0.0025
0.005
0.0075
0.01
0.0125
0.015
0.0175
0.02
Q2 2016 Q3 2016 Q4 2016 Q1 2017 Q2 2017
Ura
niu
m (
ug/
m3
)
Hi-Vol Uranium Results by Station by Quarter
Golf Course SE Yard East Yard Hydro Town
Page 36
2017 Second Quarter Compliance Monitoring and Operational Performance Report
Blind River Refinery
Page 36 of 45
2.3.4 Emergency Management and Response
This safety and control area covers emergency plans and emergency preparedness programs.
These procedures must exist for emergencies and for non-routine conditions. This also includes
the fire protection program and any results of emergency exercise participation.
Effective emergency response is carried out through the refinery Emergency Response Plan
(ERP). The plan assigns specific accountabilities and sets out processes and procedures to protect
the health and safety of employees, contractors, the public and the environment in the case of an
emergency.
As the primary response provider for the facility, the refinery’s Emergency Response Team
(ERT) consists of approximately fifty designated members that are in place to respond to
emergencies at the facility. There were no incidents in the quarter that required formal activation
of the ERT.
To continually provide a high level of response capability, the refinery’s ERT regularly engages
in a number of training drills, exercises and courses. These include:
• evacuation drills
• emergency response team recall drills
• fire and medical response emergencies
• outside of core hours drills
• live fire training
• search and rescue
• hazardous materials response
• pump operations
Routine emergency response training continued in the second quarter of 2017.
Page 37
2017 Second Quarter Compliance Monitoring and Operational Performance Report
Blind River Refinery
Page 37 of 45
2.3.5 Waste and By-product Management
This safety and control area covers internal waste and by-product-related programs which form
part of the facility’s operations, up to the point where the waste is removed from the facility to a
separate waste and by-product management facility. This also covers the ongoing
decontamination and planning for decommissioning activities.
Solid wastes contaminated by uranium are reprocessed, recycled and re-used to the extent
possible. Waste materials that cannot be reprocessed, recycled or re-used are safely stored on site
pending final disposition.
Wastes generated at BRR are segregated at the point of generation into contaminated and non-
contaminated as appropriate. Non-contaminated waste can be recycled or disposed of at an
appropriate facility. A portion of the non-contaminated waste generated is incinerated on site.
While this increases the volume of contaminated ash generated marginally, it dramatically
decreases the amount of material sent to the local landfill. Contaminated combustible materials
are incinerated on site and the contaminated ash is recycled to recover uranium. Contaminated
non-combustible waste is stored in appropriate containers pending assessment of recycling or
other disposal options.
In the second quarter of 2017, a total of 585 kg of non-contaminated wastes were sent to the
local landfill from the BRR. A total of 9,720 kg of non-contaminated materials were sent to
appropriate recycling facilities for recovery.
BRR produces two secondary products at the facility. These are calcined product and
regeneration product, both of which are sent for uranium recovery to designated, licensed
uranium mills in North America. A total of 727 drums of calcined product were generated in the
quarter and 2,000 drums (230,776 kg) of calcined product were shipped. With respect to
regeneration product, a total of 25 drums were generated and 57 drums (12,143 kg) were
shipped.
The BRR incinerator processed 23,334 kg of contaminated combustible material. Also, there
were 83 drums of contaminated non-combustible materials (CNC) generated and no drums of
shredded metal processed.
Lastly, the BRR sent 384 empty drums back to various uranium mines for reuse. A total of 4,033
drums were decontaminated to unrestricted release criteria and shipped to an area metal recycle
operation.
Page 38
2017 Second Quarter Compliance Monitoring and Operational Performance Report
Blind River Refinery
Page 38 of 45
2.3.6 Nuclear Security
This safety and control area covers the programs necessary to implement and support the security
requirements stipulated in the regulations, in Nuclear Safety and Control Regulations, the
Nuclear Security Regulations and other CNSC requirements.
BRR’s security plan provides the basis for security operations at the facility and identifies the
systems and processes in place to meet security program objectives. Accordingly, the security
plan and related procedures are considered prescribed information, subject to the requirements of
the Nuclear Safety and Control Regulations.
Though the refinery’s security program is well managed and developed, the facility continues to
look for opportunities to enhance the existing program. There were no security related issues in
the quarter.
Page 39
2017 Second Quarter Compliance Monitoring and Operational Performance Report
Blind River Refinery
Page 39 of 45
2.3.7 Safeguards and Non-proliferation
This safety and control area covers the programs required for the successful implementation of
the obligations arising from the Canada/IAEA Safeguards and Non-proliferation Agreement.
There was one short notice random inspection (SNRI) in the second quarter. There was also an
IAEA physical inventory verification (PIV) and a design inventory verification (DIV) completed
at the end of the quarter.
The refinery is in compliance with the requirements in CNSC regulatory document, RD 336:
Accounting and Reporting of Nuclear Material.
Page 40
2017 Second Quarter Compliance Monitoring and Operational Performance Report
Blind River Refinery
Page 40 of 45
2.3.8 Packaging and Transport of Nuclear Substances
This safety and control area covers the packaging and transport of nuclear substances and other
nuclear materials to and from the licensed facility.
UO3 is produced and transported, in steel tote bins, by road from the refinery to Cameco’s
PHCF. As well, UO3 is transported in drums via road, rail and/or marine transport to customers
in the USA and, on occasion, other countries around the world. The tote bins and drums meet the
Type IP-1 package requirements as specified in the CNSC Packaging and Transport of Nuclear
Substances Regulations.
There was one reportable transportation event in the quarter related to a uranium concentrate
shipment received that included a few damaged drums. There was no loss of containment from
the damaged drums and no impact to people or to the environment.
Page 41
2017 Second Quarter Compliance Monitoring and Operational Performance Report
Blind River Refinery
Page 41 of 45
3. OTHER MATTERS OF REGULATORY INTEREST
3.1.1 Public Information Program
BRR continues to meet the requirements of its public information program as per the CNSC
regulatory document RD/GD-99.3: Public Information and Disclosure.
The communications team for Cameco’s fuel services division includes a director of public and
government affairs and communications specialists. The divisional communications team is part
of the corporate responsibilities and communications group, which is in turn part of the corporate
services department.
Cameco works to build and sustain the trust of local communities by acting as a good corporate
citizen in the communities where we operate. A key element of building and sustaining that trust
is a commitment to provide those in the community with accurate and transparent reporting of
our environmental practices and performance. These are central values for Cameco and it is these
values that drive the refinery’s Public Information Programs (PIP). Information about Cameco’s
operations, practices and performance, as well as the nuclear industry can also be found at
www.cameco.com.
In addition to the main corporate website, the website www.camecoblindriver.com provides
information about all three operations that comprise the FSD. This site can be accessed through a
number of URLs, including from the main Cameco website. The refinery prepares compliance
reports which outline the performance and operation of the facility. Cameco provides copies of
these CNSC reports to the Town of the Blind River, to the MFN, to the Serpent River First
Nation, to the Township of the North Shore and to all members of the Blind River Area
Environmental Monitoring Committee (BRAEMC). The reports are also posted on the Cameco
web site: www.camecoblindriver.com. Additional information such as public survey results and
information on any reportable environmental incident are also available from the website.
Cameco provides annual updates on our performance to our neighboring communities; the Town
of Blind River and the Mississauga First Nation, via presentations made at local council
meetings in each community. The general manager Blind River operations maintained routine
contact with both the Mayor of the Town and the Chief of the MFN during the quarter,
discussing issues of mutual interest.
There were three public tours provided in the quarter, involving thirty-three people.
Cameco provides financial and other forms of support to local organizations and charities as part
of its public outreach program. For example, in the second quarter Cameco held their annual
Community Appreciation Day, with employees working on projects in local communities.
Cameco also provided bursaries and sponsorship for graduation ceremonies at local elementary
and secondary schools. Lastly, Cameco provided sponsorship to a number of local area events.
Page 42
2017 Second Quarter Compliance Monitoring and Operational Performance Report
Blind River Refinery
Page 42 of 45
3.1.2 Site-Specific
The CNSC Nuclear Criticality Program is not applicable to the Blind River refinery operation.
Cameco has an approved PDP and financial guarantee for the refinery.
The refinery met all other site-specific reporting requirements.
Page 43
2017 Second Quarter Compliance Monitoring and Operational Performance Report
Blind River Refinery
Page 43 of 45
3.1.3 Improvement Plans and Future Outlook
Cameco remains committed to continual improvement and continues to look for opportunities to
make the site operate more efficiently, while minimizing risk to employees, the public and the
environment.
With respect to environment and waste management, Cameco plans to further reduce the
historical inventory of waste materials on site through shipment of drummed material to a
permitted waste disposal facility later this year.
There were also capital projects planned for later this year related to maintenance of aging
infrastructure.
A more detailed discussion on improvement plans and future outlook is provided in the Annual
Compliance Monitoring and Operational Performance Report.
Page 44
2017 Second Quarter Compliance Monitoring and Operational Performance Report
Blind River Refinery
Page 44 of 45
3.1.4 Safety Performance Objectives for Following Year
A discussion of safety performance objectives for the following year will be provided in the
Annual Compliance Monitoring and Operational Performance Report for 2017.
Page 45
2017 Second Quarter Compliance Monitoring and Operational Performance Report
Blind River Refinery
Page 45 of 45
4. CONCLUDING REMARKS
Cameco is committed to the safe, clean and reliable operations of all of its facilities and
continually strives to improve safety performance and processes to ensure the safety of both its
employees and the people in neighbouring communities.
Individual radiation exposures were maintained well below all applicable regulatory dose limits,
as a result of the effective programs, plans and procedures in place. In addition, environmental
emissions continued to be controlled to levels that are a fraction of the regulatory limits, and
public radiation exposures are also well below the regulatory limits.
Cameco’s relationship with our neighboring communities remains strong and we are committed
to maintaining these strong relationships.