12
ISSUED APRIL 2018 2017 STATE OF DOWNTOWN BALTIMORE REPORT

ISSUED APRIL 2018
2017 STATE OF DOWNTOWN BALTIMORE REPORT

SetonHill
HeritageCrossing
Pigtown/Washington
Village
Otterbein
Ridgely’sDelight/
Stadiums
FederalHillSharp-
Leadenhall
Fells Point
UpperFells
HarborPoint
HarborEast
LittleItaly
HistoricJonestown
Old Town
JohnstonSquare
StationNorth
BoltonHill
StateCenter
Upton
MountVernon
Bromo Arts District
PrestonGardens
InnerHarbor
CharlesCenter
Westport
SouthBaltimore
PortCovington
LocustPoint
University of MarylandMedical Center Midtown
UMB Bio ParkVA Hospital
of Maryland
Universityof Maryland
Medical Center
MercyMedicalCenter
JohnsHopkinsHospital
KennedyKrieger
Institute
Science + TechnologyPark at Johns Hopkins
University of Maryland,
Baltimore
Royal Farms Arena
Cross Street Market
Horseshoe Casino
ONE-MILE RADIUS MAP
Employment: 119,312
Residents: 42,626
Office Space: 28.2 M S.F.
Hotel Rooms: 8,875

1
1 New York 190,901
2 San Francisco 127,962
3 Chicago 95,635
4 Philadelphia 84,027
5 Los Angeles 75,127
6 Seattle 69,874
7 Boston 53,129
8 Washington 47,856
9 San Diego 43,874
10 Denver 42,730
11 Baltimore (10) 42,626
12 Miami 38,651
13 Minneapolis 37,133
14 Houston 27,775
15 Portland 25,198
16 Atlanta 22,681
17 Orlando 19,687
18 Charlotte 19,119
19 Dallas 18,664
20 Pittsburgh 18,537
21 Phoenix 16,099
22 St. Louis 12,162
23 Tampa 11,332
24 San Antonio 9,646
25 Detroit 6,855
1 New York $183,086
2 Chicago $153,396
3 Boston $142,154
4 Washington $134,949
5 Houston $118,836
6 Charlotte $118,566
7 Philadelphia $117,649
8 Dallas $116,521
9 San Francisco $109,236
10 Seattle $105,947
11 Tampa $104,663
12 San Diego $100,121
13 Miami $99,773
14 Baltimore (16) $91,706
15 Portland $90,710
16 Minneapolis $90,333
17 Denver $89,179
18 Orlando $83,155
19 Pittsburgh $81,950
20 San Antonio $71,345
21 Atlanta $71,312
22 St. Louis $68,187
23 Detroit $65,943
24 Los Angeles $64,524
25 Phoenix $53,688
1 New York 75,494
2 Chicago 38,798
3 San Francisco 30,735
4 Philadelphia 25,551
5 Seattle 22,016
6 Boston 16,441
7 Washington 15,917
8 Denver 11,708
9 San Diego 10,796
10 Los Angeles 10,113
11 Miami 9,175
12 Minneapolis 8,496
13 Baltimore (13) 7,677
14 Dallas 6,562
15 Portland 5,536
16 Charlotte 4,816
17 Orlando 4,086
18 Houston 4,056
19 Tampa 3,021
20 Atlanta 2,295
21 Pittsburgh 2,293
22 St. Louis 2,050
23 San Antonio 1,361
24 Phoenix 1,161
25 Detroit 1,126
1 New York 1,078,486
2 Chicago 360,413
3 Washington 323,810
4 Boston 298,683
5 Philadelphia 263,865
6 Seattle 222,892
7 Houston 190,854
8 Los Angeles 178,156
9 Minneapolis 169,499
10 San Francisco 166,586
11 Denver 140,356
12 Atlanta 128,863
13 Pittsburgh 123,088
14 Baltimore (14) 119,312
15 Dallas 107,096
16 Charlotte 83,804
17 Detroit 76,741
18 Miami 76,179
19 San Antonio 76,125
20 San Diego 74,753
21 Orlando 73,760
22 St. Louis 66,690
23 Phoenix 61,925
24 Tampa 44,196
25 Portland 41,373
Average Household Income
Households over $75,000
Employment
( ) = last year’s ranking
Population
Top 25 Largest U.S. Metro Areas: One-Mile Radius Statistics
Downtown Baltimore excels at striking a work/life balance, which is why it’s so good at attracting top talent. Pick any of our largest industry sectors— healthcare, finance, hospitality, technology, for example — and the trend of relocations to, and expansions in, Downtown Baltimore is undeniable. They’re here because the best and brightest employees want to work someplace cool.
They also know that work is not rewarding without a balance. Atop Downtown highrises, corporate names like M&T Bank, Transamerica, and Pandora now share the sky with expansive rooftop lounges, pools, and restaurants as apartment towers make Downtown the most densely packed residential neighborhood in the region. Back on the ground, the dining scene is exploding with restaurants using the bounty of our nearby farms and Chesapeake Bay, solidifying Baltimore’s place on the world’s culinary map. And though, at times, the restaurants seem to be coming and going, this is consistent with national trends. Our parks and plazas are filled with events from Spring to Fall. The Sandlot, the outdoor lounge in Harbor Point, offers a new way to watch the ships come in. And, the recent addition of bike lanes and an upgraded water taxi system offer even more pleasant ways to get to work without a car.
Though the data in this report is a crucial indicator of our city’s health, so is belief. The people who live and work in Downtown Baltimore believe in Downtown Baltimore. Our residents and employees genuinely like being here, and take great pride in their city. And it is this base that drives the economy for the entire city.
WORK/LIFE BALANCE
executive summary
Environics Analytics through Spotlight

2
housing
As developments like One Light (featured on our cover) and 414 Light Street race skyward, forever altering the Downtown skyline, many people have asked—“Can we sustain this?”
The answer is yes. In 2017, the occupancy rate rose to 93% as large-scale projects like 500 Park, 2 Hopkins Plaza, and Stadium Square came online. And, according to our Housing Demand Study: Outlook 2022, released in 2017 (which is outlined on page 4) Downtown is in a position to absorb nearly 7,000 new units over the next five years, including the two new Light Street towers and 225 N. Calvert, already in the pipeline.
Along with an improving occupancy rate, 2017 brought a healthy mix of conversion and ground-up development. Properties like 2 Hopkins Plaza and The Appraisers’ Building came online as stellar examples of converting office space to modern, stylish residences. Stadium Square and 500 Park completed construction and offer impressive amenities like private courtyards, pools, and fitness centers.
WELCOME, NEIGHBORS
2 Hopkins Plaza
414 Light StreetGoDowntownBaltimore.com

3
For-Sale Housing Market Summary
Housing Type Properties Sold Average Sale Price Median Sale Price
Condo 114 $514,619 $281,250
Townhome 248 $373,878 $314,250
Stadium Square/ 101 W. Cross Street New Construction Rental - Market Rate 299Hanover Cross Street
2 Hopkins Plaza 2 Hopkins Plaza Conversion Rental - Market Rate 182
The Appraisers’ Building 103 S. Gay Street Conversion Rental - Market Rate 137
Banner Hill 611 S. Charles Street New Construction Rental - Market Rate 349
300 St. Paul 300 St. Paul Conversion Rental - Market Rate 280
500 Park 500 Park Avenue New Construction Rental - Market Rate 153
Notable Residential Openings
Project Name Address Project Type Housing Type # of Units
Class A Apartment Building Rental Rates
Apartment Size Average Monthly Rent
Studio $1,285.35
1 Bedroom $1,511.62
2 Bedroom $2,028.85
3 Bedroom $3,150.83
All unit types $1,994.16
*Includes 23 buildings within the one mile radius defined by the followingcriteria: built after 1995; 100 units or greater; high-quality buildingamenities, and finishes in units.
Housing Occupancy Rates
93%YEAR END2017
Source: Downtown Partnership and Individual Developers
Stadium Square
225 N. Calvert Street
Source: Individual property managers and leasing agents.
“My work has taken me to cities all over, but no place I’ve visited has hit me like this one. I had no idea what I’d been missing. This city has its problems, don’t get me wrong. But in three days I didn’t meet a rude person, or see a dirty street, or talk to a single Baltimorean who wasn’t proud to live there.”
—Jay Heinrichs, Southwest: The Magazine, February 2018.
4
housing
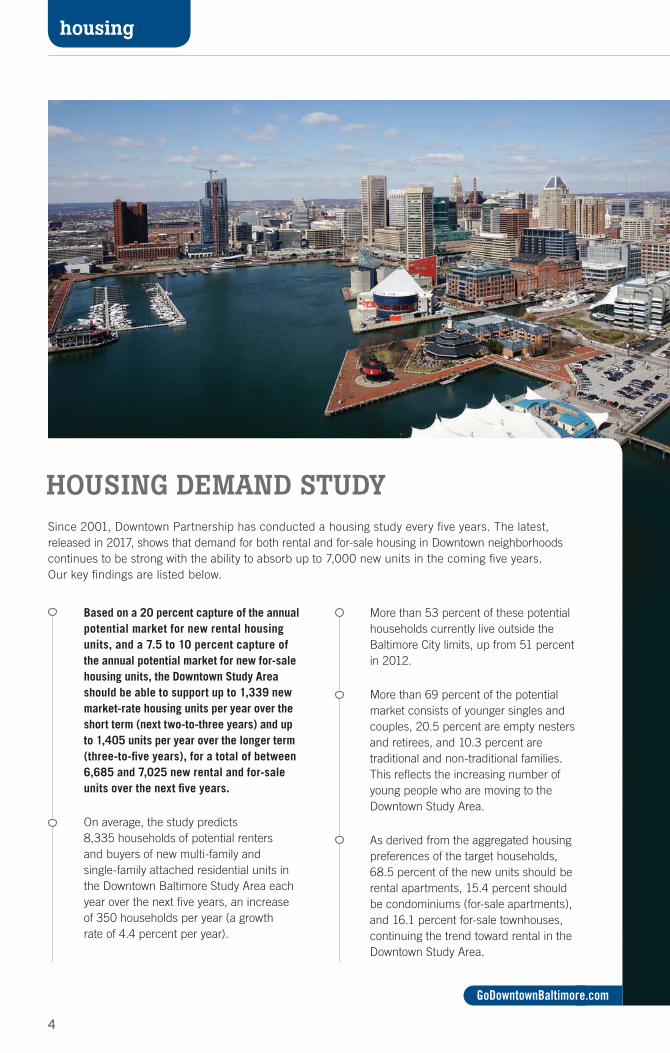
Since 2001, Downtown Partnership has conducted a housing study every five years. The latest, released in 2017, shows that demand for both rental and for-sale housing in Downtown neighborhoods continues to be strong with the ability to absorb up to 7,000 new units in the coming five years. Our key findings are listed below.
HOUSING DEMAND STUDY
Based on a 20 percent capture of the annual potential market for new rental housing units, and a 7.5 to 10 percent capture of the annual potential market for new for-sale housing units, the Downtown Study Area should be able to support up to 1,339 new market-rate housing units per year over the short term (next two-to-three years) and up to 1,405 units per year over the longer term (three-to-five years), for a total of between 6,685 and 7,025 new rental and for-sale units over the next five years.
On average, the study predicts 8,335 households of potential renters and buyers of new multi-family and single-family attached residential units in the Downtown Baltimore Study Area each year over the next five years, an increase of 350 households per year (a growth rate of 4.4 percent per year).
More than 53 percent of these potential households currently live outside the Baltimore City limits, up from 51 percent in 2012.
More than 69 percent of the potential market consists of younger singles and couples, 20.5 percent are empty nesters and retirees, and 10.3 percent are traditional and non-traditional families. This reflects the increasing number of young people who are moving to the Downtown Study Area.
As derived from the aggregated housing preferences of the target households, 68.5 percent of the new units should be rental apartments, 15.4 percent should be condominiums (for-sale apartments), and 16.1 percent for-sale townhouses, continuing the trend toward rental in the Downtown Study Area.
GoDowntownBaltimore.com

5
Multiple hotels came online in 2017, including La Quinta, Marriot Delta, and Staybridge Suites, bringing the total current inventory to 8,875. Visitation numbers rose slightly, and Downtown’s hotel performance continued to outrank the national average by nearly 2%.
HOSPITALITY & HOTELS
hospitality & hotels
Downtown (2017) 67.30% $160.69 $108.21
National (2017) 65.90% $126.72 $83.57
Total Number of Overnight Visitors 10.6 million 10.4 million
Total Number of Visitors 25.9 million 25.2 million
Total Overnight Visitor Spending $4.26 billion $3.94 billion
Total Visitor Spending $5.64 billion $5.44 billion
Hotel Pipeline Hotel Performance
Visitation Numbers
Occupancy ADR RevPAR
UNDER CONSTRUCTION
2017
CURRENT TOTAL INVENTORY
PLANNED THROUGH 2023
Year End 2016
Year End 2015
Staybridge Suites
488
8,875
718
Source: Smith Travel Research, Inc. / STR Global, Ltd. trading as “STR”
Source: Longwoods International and Tourism Economics, as provided by Visit Baltimore
Project Name Address Project Type Number of Rooms
Marriott Delta Hotel 1 E. Redwood Street Conversion 150
La Quinta Hotel 200 W. Saratoga Street Conversion 42
Staybridge Suites 17 Commerce Street Conversion 101
Notable Hotel Openings

6
retail
In 2017, food was the name of the retail game in Downtown Baltimore. As our city’s culinary star continued to rise, several new restaurants opened, diversifying and elevating our already impressive food scene. Downtown saw several new upscale spots debut, including The Bygone in the Four Seasons, Tagliata, and The Elk Room. Filicori Zecchini and Cilantro also opened, giving an international flair to Downtown employee lunch breaks.
It’s no secret that national retail trends are precarious, and Downtown Baltimore was certainly not immune to these changes in 2017. With the massive popularity of e-commerce, the entire retail world is readjusting. But with a 90.1% occupancy rate and large-scale development projects like the new 50,000-square-foot Whole Foods and Harborplace redesign, we’re optimistic about retail in Downtown.
DOWNTOWN RETAILThe Bygone at the
Four Seasons
Elite Secrets BridalGoDowntownBaltimore.com

7
Downtown Retail Sales Retail Occupancy Rates
Tagliata 1012 Fleet Street Restaurant Open
Cilantro 30 Light Street Restaurant Open
Kabul Grill 55 Market Place Restaurant Open
Elite Secrets Bridal Boutique 330 N. Charles Street Retail Open
Charm City Cakes 618 S. President Street Bakery Open
The Charles 1110 S. Charles Street Restaurant Open
The Bygone 200 International Drive Restaurant Open
Filicori Zecchini 1 E. Pratt Street Coffee Open
Elk Room 1010 Fleet Street Restaurant Open
Notable Retail Openings And Leases
Name Address Business Type Status
Baltimore Metro
Downtown* Multi-tenant Projects
94.2% 96.2% 90.1%
National
Source: (National and Baltimore Metro): CoStar, Integra Realty Resources, Marcus and Millichap, Mackenzie Commerical Source (Downtown): CoStar, Individual property owners, managers, and leasing agents
TOTAL DOWNTOWN SALES
$1.242BILLION
Echoing the national trend of retail uncertainty, Downtown saw a flurry of restaurant and shop closings. However, multiple high-end dining experiences opened in 2017, solidifying Baltimore’s new image as a food destination. Also of note, total Downtown sales rose to $1.242 billion, up from $1.168 in 2016.
Filicori Zecchini
Source: Spotlight, as provided by Baltimore Development Corporation

8
Downtown contains over one-third of the city’s jobs despite comprising less than four percent of its geographic area. Within that small footprint are 28.2 million square feet of office space housing the 119,312 people employed in Downtown. Given Mercy Medical Center, the University of Maryland, Baltimore, and our proximity to the Johns Hopkins medical campus, it’s no surprise that a quarter of these employees work in the healthcare and social assistance sector. Downtown also welcomed the expansion of Morgan Stanley to 100 South Charles, adding hundreds of new employees to the core. And, according to our Core Tech: The State of Downtown Baltimore Tech & Innovation Report, the rapidly growing technology sector is now responsible for seven percent of the Downtown workforce, with thriving outfits like R2i, Fearless Solutions, Jellyfish, Verizon, and Exit10.
THE BUSINESS OF DOWNTOWN
State of Downtown Tech Event, November 2017
GoDowntownBaltimore.com
office & employment

9
Morgan Stanley 100 S. Charles Street New Lease Financial Services 300,000
M&T Bank 1 Light Street Relocation Bank/Financial Services 155,000
Johns Hopkins Center for Communications 700 E. Pratt Street Relocation MedTech 78,718
Vitreon America 1100 Wicomico Street Relocation Biotanical Research 50,000
US Internal Revenue Service 100 S. Charles Street New Lease Government 43,121
PricewaterhouseCoopers 100 E. Pratt Street Relocation Accounting Firm 32,000
Merrill Lynch 100 E. Pratt Street Renewal Financial Services 32,000
Cushman and Wakefield 1 E. Pratt Street Relocation Real Estate/Brokerage Services 21,000
McGuire Woods, LLP 500 E. Pratt Street Relocation Law Firm 21,000
US Department of Housing 100 S. Charles Street Relocation Government 20,000and Urban Development
Notable Lease Transactions
Name Address Type of Lease Business Type Sq. Ft.
THE BUSINESSOF DOWNTOWN
Downtown Baltimore’s Core Tech & Innovation generates $830 million in annual compensation and $1.8 billion in annual output. Strong showings like this are why Cushman & Wakefield included Baltimore as top #12 in their Tech Cities 1.0 report released in 2017.
MAKING MOVES
Jellyfish Baltimore Offices
2017 Occupancy: National and Regional Standing
Downtown Baltimore 85.35%Baltimore City 87.78%
87.45%Baltimore Metro
National 86.35%
GoDowntownBaltimore.com
Downtown Baltimore, Baltimore City, and Baltimore Metro Vacancy Sources: CBRE, Cushman & Wakefield, JLL, MacKenzie, Newmark Knight Frank, and Transwestern
National Vacancy Sources: CBRE, Cushman & Wakefield, JLL, and Newmark Knight Frank
*This category consists of the following sectors: Arts, Entertainment, Recreation, Real Estate, Manufacturing, Utilities, Transportation, Construction, Wholesale trade, and other sectors comprising less than 3% of total employment.
Healthcare and Social Assistance 25%
Public Administration 15%
13%Professional, Scientific, and Technical Services
Accommodation and Food Services 9%
8%
6%
5%
4%
17%
Finance and Insurance
Information
Educational Services
Other Services (except Public Administration)
Other*
Employment by Industry Sector

GoDowntownBaltimore.com
Presenting Sponsor
Leadership Sponsors
Community Sponsors
This report is produced by Downtown Partnership of Baltimore, Inc., which is solely responsible for its content. Data is collected by, or on behalf of, Downtown Partnership from a variety of sources and covers activity within a one-mile radius of the intersection of Pratt and Light streets. Charts, graphs, maps, and images are the property of The Partnership unless otherwise noted.
Downtown Partnership of Baltimore is a 501(c)(6) non-profit incorporated in the State of Maryland. It has approximately 650 member firms throughout the mid-Atlantic region from dozens of industry sectors.
For more information about Downtown Partnership, its reports, or to become a member, please visit GoDowntownBaltimore.com, email [email protected], or call us at 410.244.1030.
You can also find Downtown Partnership of Baltimore on twitter @DowntownBalt.
Thanks to the Downtown Partnership staff who worked to compile this data and produce the 2017 State of Downtown Report.
Baltimore Development Corporation
First National Bank
Horseshoe Casino
PMS Parking
225 N. Calvert
Marks Thomas | Moseley Architects


