15
1 SYSTEX Profile CFO & Company Spokesman Larry Chung 2017.10.18

1
SY S T E X P ro f i leCFO & Company SpokesmanLarry Chung2017.10.18

2
Strategic Integration Milestone
Offered electronic wallet service for mobile payment market Cooperated with world leading Big Data service providers,
Managing DATA ecosystem
Kimo.com spun off from SYSWARE,and later acquired by Yahoo!
SYSWARE founded in 1997
SYSTEX IPO
Integrated with Pacific Computer’s team
Merged UIstek Corp, financial IT provider Merged UCOM, largest IT training center in Taiwan
Taiwan's two leading IT services Corporations "SYSWARE" and "SYSTEX" was consolidated
Invested in TEDPC, healthcare IT solution provider Merged Mega Times, financial quote system provider
Invested in Investment Media for providing in depth financial contents
Invested in FORMS SYNTRON for Banking business in China Taifon and Condord joined SYSTEX Group
Merged Rainbow Tech. and CK Tech. for expanding to China market Invested in SYSPOWER and SystemWeb Founded SoftMobile, developing mobile APPs
Merged NEXSYS to strengthen leading position in Taiwan payment market.Occupied over 70% EDC market place
Launched SBOX, the first Splunk enterprise powered appliance Launched Etu, innovative Hadoop based Big Data solutions
1997-2003
2003
2004
2005
2007
2008
2010
2011
2012
2013
2014
Cooperated with LINE to launch "LINE Gift Shop“fulfilled O2O business model SYSTEX launched Taiwan's first "Securities online account solutions “ integrated "video authentication"
and "CA certificate"2015
Cooperated with Far Eastern Group to provide "online marketplace" platform in friDay wallet for convenient shopping experiences.
Etu collaborated with U-CAR to launch "CarInsight” Innovative Car Comparison Service.2016
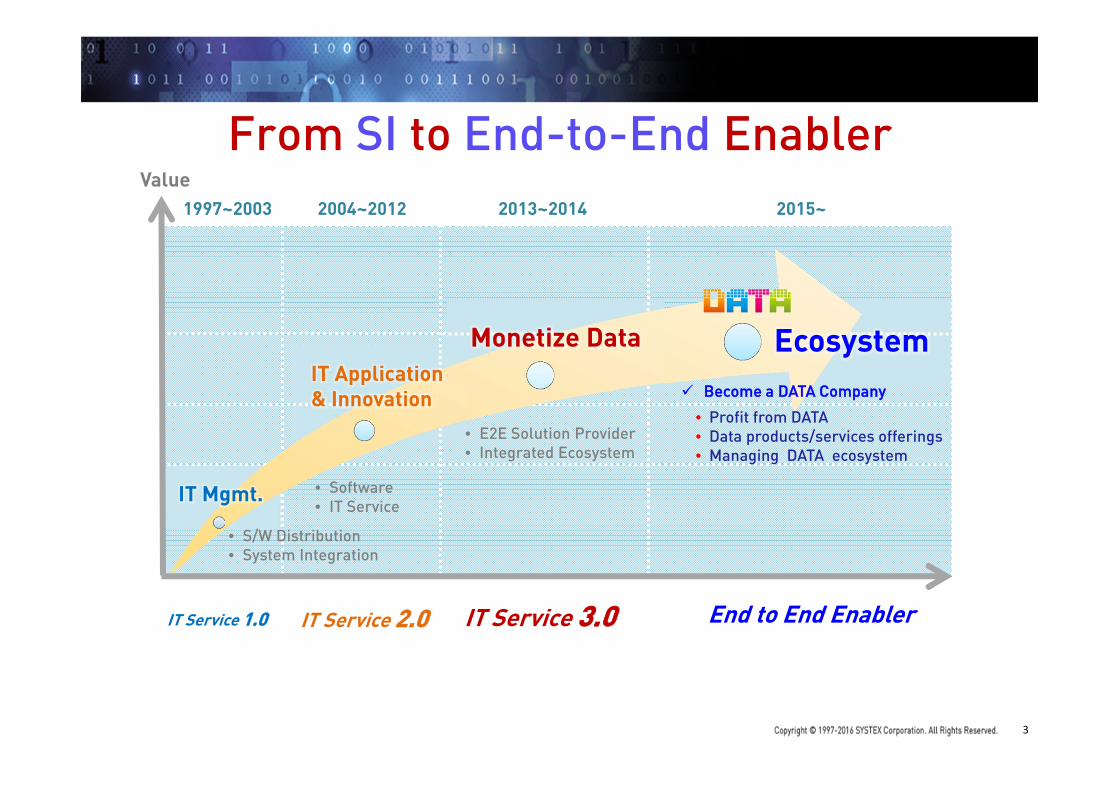
3
IT Mgmt.
IT Application & Innovation
Monetize Data Ecosystem
Value
IT Service 1.0 IT Service 2.0 IT Service 3.0
• E2E Solution Provider• Integrated Ecosystem
• Software • IT Service
• S/W Distribution• System Integration
2013~20141997~2003 2004~2012 2015~
Become a DATA Company
• Profit from DATA • Data products/services offerings• Managing DATA ecosystem
End to End Enabler
From SI to End-to-End Enabler

4
Harbin
Sian
Kunming
Changsha
Nanning
Haikou
Nanchang
Wuhang
Zhengzhou
Taiyuan
Shijiazuang
Tsinan
Huhehaote
Shenyang
Dalian
Guiyang
Changchun
TianjinBeijing
Chengdu
Xiamen
Hangchou
SuzhouShanghai
Hong Kong
ShenzhenDongguan
Guangzhou
Nanjing
Hsinchu
Taichung
Kaohsiung
Chongqing
Qingdao
Taipei
NingboService City
Fuzhou
Single Contact, One Stop Shopping
Certified with• ISO 9001 • ISO 27001• BS 25999 • BS 10012
TSE:6214 3,000 Employees 58 Operation
locations in GC and SE Asia
2016 Revenue:USD 502 Million
Cross Border Professional Services Offerings

5
Integration of world-class technologyInnovative products and services
End to EndSolution
Mobile payment
Security
Big Data Analytics
Mobile Marketing
Data Processing
Information
Trading
Operation
Management
Heterogeneous Platform
Integration
IT Maintenance
Industrial Applications

6
Business Organization
FBIFinancial
Biz. IntegrationStony Fan
CBIConsumer
Biz. IntegrationJones Yang
ChairmanT.J. Huang
ChinaD.Y. Cheng
DBIData Technology Biz. Integration
Frank Lin
PresidentFrank Lin
IT Solutions Covering Banking, Insurance, Securities, Futures & Options, Fund, Bonds, & Forex Markets
Cross Border Transaction Cloud Service
Customized Application Development
Investors Community Service
Data Driven Solutins for Enabling Corporate Mobility & AI
Payment & Acquiring Service
Mobile Payment Service
O2O Service
Data Processing Service
Precision Marketing
Interactive Website Design and Deployment
e- Commerce Platform & Business Process Outsourcing
Big Data Platform Development
Value-added Service
Commercial Software
Cloud Service
Cyber-security Solutions
IT Training & Certificate
Publishing Business
Commercial Software & Platform
System Integration & Value –added Service
Social Network Add on Service
Smart Hotel Solutions
Transaction Software & Serivice

7
FBI focus FSI
CBI focus Retail
DBI focus TMT
BPODT Operator
ITODT Enabler
DTOData as a Service
FBIIntelligent Finance
CBIPayment & Omni Channel
DBIData Technology
A Data Company

8
ITEM 2017/6/30 % 2016/12/31 % 2016/6/30 %Cash and cash equivalents 3,897 21% 4,245 22% 2,575 14%Current financial assets at fair value through profit or loss 2,853 15% 2,880 15% 3,115 17%Current available-for-sale financial assets 17 0% 19 0% 18 0%Debt investments with no active market 97 1% 102 1% 83 0%Trade and other current receivables 3,229 17% 3,590 19% 3,439 19%Inventories 2,831 15% 2,422 13% 2,415 13%Non-current assets held for sale 0 - 97 1% 0 - Other current assets 1,142 6% 1,115 6% 1,131 6%Total current assets 14,066 75% 14,471 76% 12,777 70%Held-to-maturity financial assets - non-current 0 - 0 - 61 0%Financial assets measured at cost - non-current 435 2% 433 2% 470 3%Debt investments with no active market- non-current 576 3% 548 3% 549 3%Investments accounted for using equity method 1,199 6% 1,191 6% 1,647 9%Property, plant and equipment 1,965 11% 2,010 11% 2,038 11%Intangible assets 64 0% 113 1% 442 2%Total other non-current assets 340 2% 317 2% 288 2%Total non-current assets 4,580 25% 4,612 24% 5,495 30%Total assets 18,646 100% 19,083 100% 18,271 100%
Short-term loans 1,260 7% 1,046 5% 777 4%Notes and accounts payable 2,485 13% 2,954 15% 2,370 13%Other current liabilities 2,974 16% 2,065 11% 2,948 16%Total current liabilities 6,719 36% 6,065 32% 6,096 33%Total non-current liabilities 250 1% 259 1% 262 1%Total liabilities 6,969 37% 6,323 33% 6,358 35%
Total share capital 2,694 14% 2,694 14% 2,694 15%Capital surplus 7,273 39% 7,635 40% 7,605 42%Retained earnings 3,100 17% 3,467 18% 2,638 14%Other equity (386) -2% (64) -0% (15) -0%Treasury shares (1,004) -5% (1,004) -5% (998) -5%Total equity attributable to owners of Corporation 11,677 63% 12,728 67% 11,924 65%Non-controlling interests 0 0% 31 0% (10) -0%Total liabilities and equity 18,646 100% 19,083 100% 18,271 100%Book Value Per Share 47.47 51.74 48.45
BALANCE SHEETS UNIT:NT$ million ,%

9
Historical INCOME STATEMENT UNIT:NT$ million ,%
Y2014 Y2015 Y2016 1H17Operating Revenues 15,809 16,313 16,210 7,788Gross Profit 4,219 4,300 4,332 2,154Gross Profit Margin 27% 26% 27% 28%Operating Expenses 3,784 3,881 4,053 1,869Operating Income 486 419 279 285Operating Income Margin 3% 3% 2% 4%Non-Operating Items 490 286 967 336Net Income, attributable to owners of parent 745 564 1,108 575Net Income Margin 5% 3% 7% 7%EPS 3.07 2.29 4.50 2.34
15,809 16,313 16,210
7,788
4,219 4,300 4,332
2,154
745 564 1,108 575
27% 26%27% 28%
5% 3%7%
7%
-
5%
10%
15%
20%
25%
30%
0
2,000
4,000
6,000
8,000
10,000
12,000
14,000
16,000
18,000
Y2014 Y2015 Y2016 1H17
Operating Revenues Gross ProfitNet Income, attributable to owners of parent Gross Profit MarginNet Income Margin
10
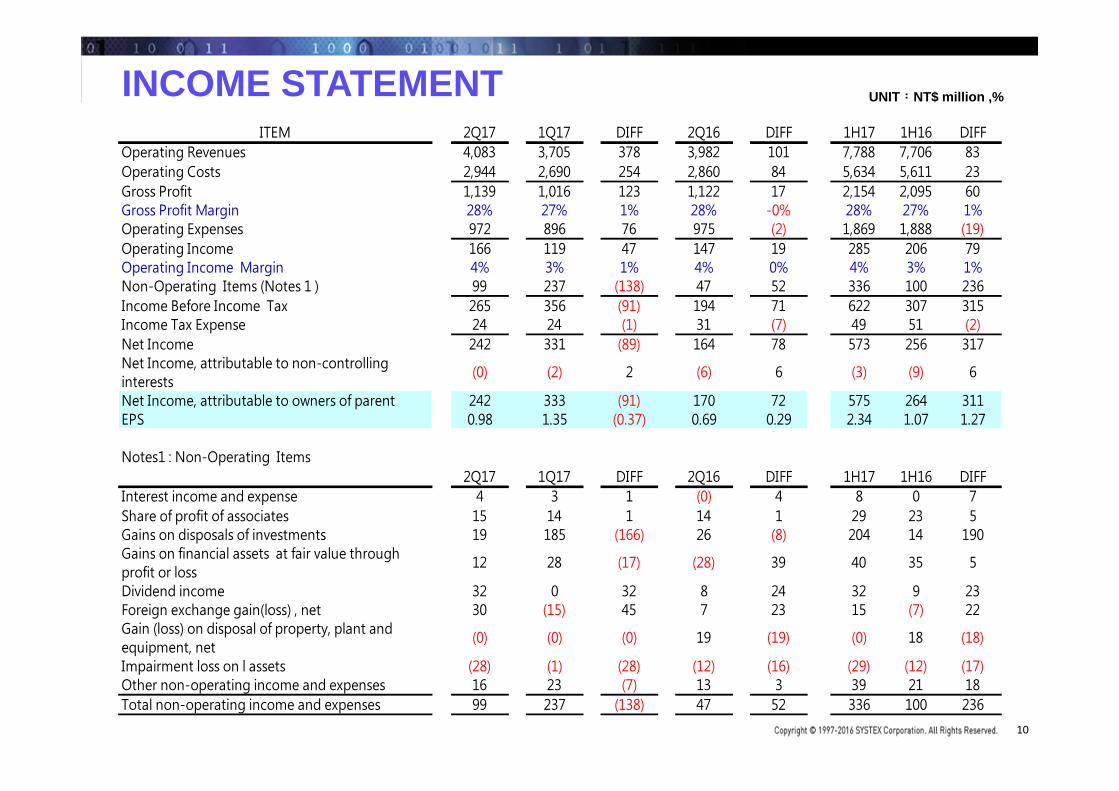
ITEM 2Q17 1Q17 DIFF 2Q16 DIFF 1H17 1H16 DIFFOperating Revenues 4,083 3,705 378 3,982 101 7,788 7,706 83Operating Costs 2,944 2,690 254 2,860 84 5,634 5,611 23Gross Profit 1,139 1,016 123 1,122 17 2,154 2,095 60Gross Profit Margin 28% 27% 1% 28% -0% 28% 27% 1%Operating Expenses 972 896 76 975 (2) 1,869 1,888 (19)Operating Income 166 119 47 147 19 285 206 79Operating Income Margin 4% 3% 1% 4% 0% 4% 3% 1%Non-Operating Items (Notes 1 ) 99 237 (138) 47 52 336 100 236Income Before Income Tax 265 356 (91) 194 71 622 307 315Income Tax Expense 24 24 (1) 31 (7) 49 51 (2)Net Income 242 331 (89) 164 78 573 256 317Net Income, attributable to non-controllinginterests
(0) (2) 2 (6) 6 (3) (9) 6
Net Income, attributable to owners of parent 242 333 (91) 170 72 575 264 311EPS 0.98 1.35 (0.37) 0.69 0.29 2.34 1.07 1.27
Notes1 : Non-Operating Items2Q17 1Q17 DIFF 2Q16 DIFF 1H17 1H16 DIFF
Interest income and expense 4 3 1 (0) 4 8 0 7Share of profit of associates 15 14 1 14 1 29 23 5Gains on disposals of investments 19 185 (166) 26 (8) 204 14 190Gains on financial assets at fair value throughprofit or loss
12 28 (17) (28) 39 40 35 5
Dividend income 32 0 32 8 24 32 9 23Foreign exchange gain(loss) , net 30 (15) 45 7 23 15 (7) 22Gain (loss) on disposal of property, plant andequipment, net
(0) (0) (0) 19 (19) (0) 18 (18)
Impairment loss on l assets (28) (1) (28) (12) (16) (29) (12) (17)Other non-operating income and expenses 16 23 (7) 13 3 39 21 18Total non-operating income and expenses 99 237 (138) 47 52 336 100 236
INCOME STATEMENT UNIT:NT$ million ,%

11
Operating Revenues by BIUNIT:NT$ million ,%
Y2014 Y2015 Y2016 1H17Amount % Amount % Amount % Amount %
Operating Revenues 15,809 100% 16,313 100% 16,210 100% 7,788 100%Operating Revenues(FBI) 2,390 15% 2,474 15% 2,481 15% 1,215 16%Operating Revenues(CBI) 2,958 19% 3,002 18% 2,952 18% 1,290 17%Operating Revenues(DBI) 6,788 43% 7,060 43% 6,860 42% 3,531 45%Operating Revenues(CN) 3,673 23% 3,777 23% 3,917 24% 1,752 22%
6,788 7,060 6,860
3,531 3,673 3,777 3,917
1,752
2,958 3,002 2,952
1,290 2,390 2,474 2,481
1,215
0
1,000
2,000
3,000
4,000
5,000
6,000
7,000
8,000
Y2014 Y2015 Y2016 1H17
NT$ million
Operating Revenues(DBI)
Operating Revenues(CN)
Operating Revenues(CBI)
Operating Revenues(FBI)

12
Gross Profit Margin by BI
Y2014 Y2015 Y2016 1H17Gross Profit Margin 27% 26% 27% 28%Gross Profit Margin (FBI) 42% 43% 45% 44%Gross Profit Margin (CBI) 39% 38% 39% 40%Gross Profit Margin (DBI) 19% 19% 18% 21%Gross Profit Margin (CN) 21% 21% 22% 20%
42%43%
45% 44%
39%
38%39%
40%
21% 21% 22%
20%19% 19% 18%
21%
-
5%
10%
15%
20%
25%
30%
35%
40%
45%
50%
Y2014 Y2015 Y2016 1H17
Gross Profit Margin (FBI)
Gross Profit Margin (CBI)
Gross Profit Margin (CN)
Gross Profit Margin (DBI)

13
Consolidated Operating Revenues & Gross Profit MarginUNIT:NT$ million ,%
3,967 3,563
3,791
4,487
3,787 3,923 3,856
4,747
3,724 3,982 3,892
4,612
3,705 4,083
989 1,023 1,029 1,178 954 1,063 1,010
1,274 973 1,122 985
1,253 1,016 1,139
25%
29%27%
26%25%
27%26% 27% 26%
28%
26%27% 27% 28%
-
5%
10%
15%
20%
25%
30%
35%
0
1,000
2,000
3,000
4,000
5,000
6,000
7,000
8,000
1Q14 2Q14 3Q14 4Q14 1Q15 2Q15 3Q15 4Q15 1Q16 2Q16 3Q16 4Q16 1Q17 2Q17
NT$ million
Operating Revenues Gross Profit Gross Profit Margin

14
Operating Expenses By Quarter UNIT:NT$ million ,%
864 913 920
1,087
880 945 939
1,117
913 975 1,003
1,162
896 972
22%
26%24% 24%
23%24% 24%
24%25% 24%
26% 25%24% 24%
-
5%
10%
15%
20%
25%
30%
0
200
400
600
800
1,000
1,200
1,400
1,600
1,800
2,000
1Q14 2Q14 3Q14 4Q14 1Q15 2Q15 3Q15 4Q15 1Q16 2Q16 3Q16 4Q16 1Q17 2Q17
NT$ million
Operating Expenses Operating Income Margin
15
Cloud, Mobile, Social, Analytics & CybersecurityEnd to End Ecosystem Enabler


