20
2017 Third Quarter Corporate Insights Dividends: When they matter and when they don’t

2017 Third Quarter
Corporate InsightsDividends: When they matter and when they don’t

Credit Suisse Corporate Insights2

Credit Suisse Corporate Insights 3
Introduction
Over the last two decades, the way companies allocate capital has meaningfully evolved. Twenty years ago, the percentage of capital being returned to shareholders was low – approximately 13% of total capital deployed, as shown below in Exhibit 1. Today, the amount of capital companies are returning to shareholders has more than doubled. In 2016, $408bn of corporate cash for companies in the US and Europe went to buying back shares and $552bn went towards dividends, meaning a whopping $960bn of total capital from public companies flowed back to investors. This compares to a mere $100bn twenty years ago.
We have written before about the – perhaps surprising – value that the current market ascribes to growth. So it is a bit of a puzzle as to why returning capital to shareholders remains so attractive relative to business investment.
Paying back your shareholders can of course be done via share buybacks or dividend distributions, although there are many differences between the two approaches. Both share buybacks and special dividends tend to be one-time events, whereas a dividend program tends to be more fixed and more
Capital deployment 20 years ago Capital deployment today
representative of an ongoing corporate policy - which we can assess and compare to other policy choices. Dividends have represented a significant portion of the way companies return capital to shareholders, accounting for more than half of the total spending allocated to buybacks and dividends. This paper, the eighth in our ongoing series of Credit Suisse Corporate Insights, focuses on dividends, evaluating the impact of dividends on valuation and investor perceptions and whether dividends can be considered a strategic lever for management to drive value creation.
Exhibit 11: Historical capital deployment of US and European companies
82%
5%
13%
$752m
Organic growth + M&ADividends + buybacksOther
67%
5%
28%
$3,440bn
Organic growth + M&ADividends + buybacksOther

Credit Suisse Corporate Insights4
Schools of thought on dividends: The good, the bad, and the indifferent
There is not a consensus viewpoint on the impact of dividends on valuation. There are essentially three schools of thought: dividends matter because they are a good thing, dividends matter because they are a bad thing and dividends don’t matter because they are irrelevant.
Those in the first school believe dividends are a good thing and point to the positive signal and certainty argument. Fischer Black and Myron Scholes explained this in 1973: “The feeling is that investors prefer a dollar of dividends to a dollar of capital gains, because a ‘bird in the hand is worth more than one in the bush’.” This bird-in-the-hand notion recognizes that some investors prefer the certainty of the cash proceeds that dividends provide in the near term over the uncertainty of the potential cash flow streams derived from the business in the future. However, since the capital distribution is a zero-sum event we should compare a dividend today versus price appreciation today. The stock price of a company drops as a result of dividend payments so the total value accruing to shareholders should be unchanged. Those that believe dividends are a good thing also cite their positive signal – a dividend commitment can indicate confidence and reliability in management’s ability to generate future cash flow. Initiating or increasing a dividend can be seen as a positive signal, as it communicates to investors the confidence management has in their ability to sustain a certain level of cash flows.
Those in the second school believe dividends are a bad thing due to the negative signaling impact and the big unknown of taxes. The perception of a dividend to some can be that committing to a dividend can crowd out other opportunities for investment and signal that a corporation doesn’t have any better way to allocate capital and, therefore, must be “low growth”. They also point to the complexity that taxes on dividends create – taxes on dividends lower after-tax returns to equity investors.
Also, the level of tax rate varies depending on who receives the dividend (e.g. individual investors are taxed differently than institutional investors, which further varies across pension funds, mutual funds, etc.). Some also point out the double taxation of these corporate profits, as the dividend cash comes from profits that are already taxed at the corporate level and then these same profits are again taxed again at the personal level when paid out to the individual investor.
Those in the third school who believe dividends don’t matter point to the “sell-off” argument. This is the idea that different investors have different demands for cash and investors can just recreate their desired payout stream by periodically selling a portion of their shares.2 Merton Miller and Franco Modigliani argued that if you ignore taxes and transaction costs and if the corporation does not let dividend policy impact its investment decisions, then in a perfect world, a company’s dividend policy should be irrelevant to share prices because investors can just recreate the cash flows they desire themselves.
Warren Buffett made much the same point in his 2012 Berkshire Hathaway shareholder letter, arguing that the sell-off alternative: “lets each shareholder make his own choice between cash receipts and capital build-up. One shareholder can elect to cash out, say, 60% of annual earnings while other shareholders can elect 20% or nothing at all.”3 This argument says what investors care about is their total shareholder return (dividend yield + share price appreciation) and, taxes aside, they don’t necessarily care whether the mix of that comes from capital appreciation or yield on dividends.
So how and when do dividends matter? Corporate finance theory is one thing, but what really happens in the market? How do you make an informed choice about your own dividend policy?

Credit Suisse Corporate Insights 5
Dividends in the real world
What really is the relationship between dividends and value creation? In one sense, the simple answer is “none”. But the nuances around that simplistic answer provide useful insights.
We looked at over 2,000 companies in the US and Europe and compared two key valuation measures to dividend yields. With r-squared results quite close to zero (Exhibit 2), we see that
So if dividend policy doesn’t explain market valuations - then what does? In a word: fundamentals.
Consider this: if we compare where companies should trade - in terms of share prices - based on their fundamentals versus where the market actually values them right now, then we see that the majority of market valuations are determined by their underlying fundamentals.
dividend yields offer no explanation as to why companies trade at higher or lower multiples or have higher or lower total shareholder returns (TSR). Across both regions, we see little evidence of explanatory power between dividend yield and valuations. Admittedly, when we look at Europe in isolation, the correlation of TSR to dividend yield is higher than the US at 13%, but that is still quite low.4
Exhibit 3 shows that four fundamental factors (profitability, growth, size and leverage) explain over 80% of current market valuations across our universe. So what explains the remaining 20%? The right side of this same exhibit makes clear dividends do not explain the difference. There are a number of other factors that may cause a company’s share price to deviate from its warranted fundamental valuation but, broadly speaking, dividend policy is not one of them.6
Exhibit 25: Are market valuations explained by dividend yield?
EV / EBITDA versus dividend yield Total shareholder return versus dividend yield
0x0% 5% 10% 15% 20%
10x
20x
30x
40x
50xExplanatory power: 3.1%
EV / next twelve months EBITDA
Dividend yield
0% 5% 10% 15% 20%
120%
80%
40%
0%
-40%
-80%
3YR TSR
Dividend yield
Explanatory power: 3.0%

Credit Suisse Corporate Insights6
Market share price vs. model-predicted share price based on company fundamentals
Can dividend payout ratio help explain the noise? Regression of dividend payout ratio vs. unexplained component
Exhibit 37: Explaining market valuations through fundamentals
1,000,000
100,000
10,000
1,000
100
Actual market cap ($ millions)
100 1,000 10,000 100,000 1,000,000
Model-predicted market cap ($ millions)
Model residuals = actual value - predicted value
82.9% of valuation explained(0.829 R-squared)
+1.0
-1.0
+0.5
-0.5
0.0
Valuation model residuals (log scale)
0% 200%50% 100% 150%
Dividend payout ratio
0.0% of valuation explained(0.000 R-squared)
There may be no explanatory relationship between dividends and market valuations, but do companies with different dividend policies actually perform differently in the market and if so, why?
To answer that question, let’s examine a broad universe of companies and split it into those companies that pay dividends
(“payers”) and those that don’t (“non-payers”). To evaluate market performance in the long-term, we focus on a measure of share-price appreciation, total shareholder return (TSR), for these companies. As shown in Exhibit 4, we see that non-payers have meaningfully outperformed payers by a factor of 2.39 times.8

Credit Suisse Corporate Insights 7
Exhibit 49: Total shareholder return over time – dividend payers vs. dividend non-payers
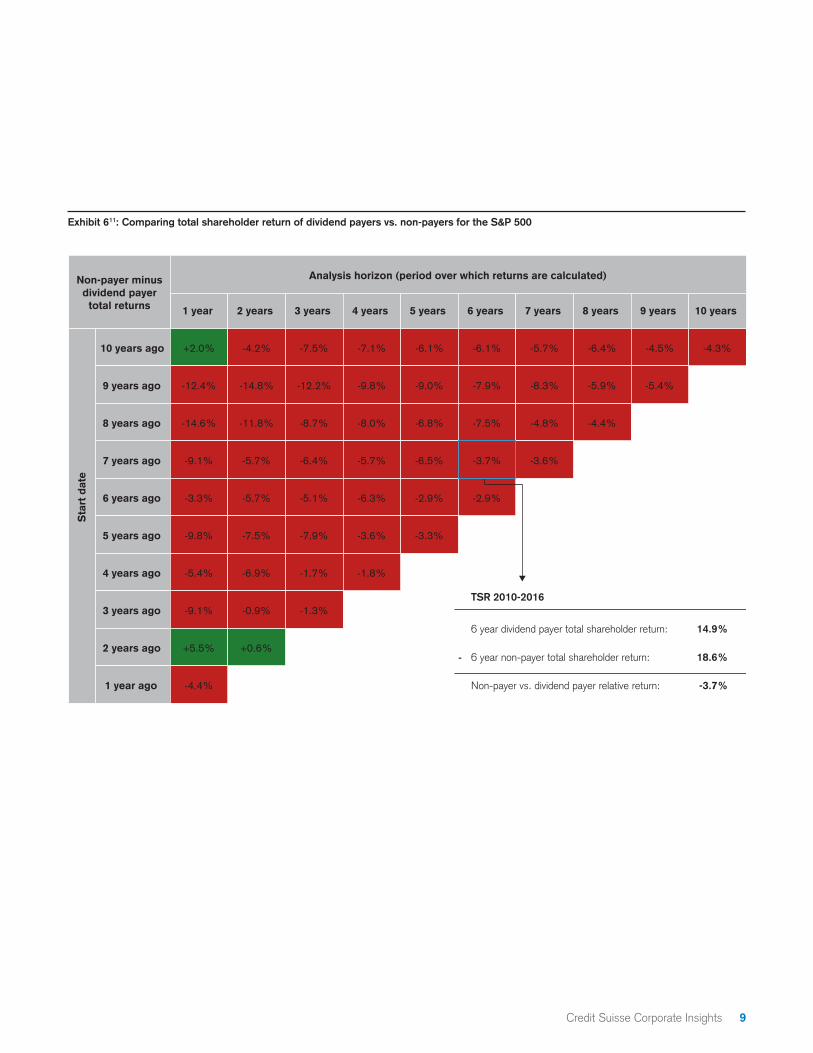
Does this conclusion hold up over time? Exhibit 5 and Exhibit 6 reveal that, over both short and long-term periods, dividend payers have underperformed. In the last five years, for example, dividend payers delivered a 3.3% lower TSR than
non-payers. Dividend payers seem to offset lower TSR with correspondingly lower volatility; which intuitively aligns with the notion that companies that pay dividends enjoy a perception of stable and consistent operating performance.
400
350
300
250
200
150
0
100
50
2007 2008 2009 2010 2011 2012 2013 2014 2015 2016 2017 YTD
Non-payers384
Dividend payers219
Payers: Companies in the S&P1500 and the STOXX Europe 600 that consistently paid a dividend in eight of the last ten yearsNon-payers: Companies in the S&P1500 and the STOXX Europe 600 that did not pay a dividend in eight of the last ten years

Credit Suisse Corporate Insights8
Exhibit 510: Total shareholder return of dividend payers vs. non-payers across S&P 500
Last twelve months
Average: +15.1% (-4.4%)
Volatility: 25.9% (-11.9%)
Average: +13.8% (-3.3%)
Volatility: 11.6% (-7.6%)
Non
-div
iden
d pa
yers
Div
iden
d pa
yers
Last five years Last ten years 2004-2007 (expansion) 2008-2009 (recession)
+100%+80%
-40%-60%-80%
-100%
+60%+40%+20%
0%-20%
+100%+80%+60%+40%+20%
0%-20%-40%-60%-80%
-100%
+100%+80%+60%+40%+20%
0%-20%-40%-60%-80%
-100%
+100%+80%+60%+40%+20%
0%-20%-40%-60%-80%
-100%
+100%+80%+60%+40%+20%
0%-20%-40%-60%-80%
-100%
+100%+80%+60%+40%+20%
0%-20%-40%-60%-80%
-100%
+100%+80%+60%+40%+20%
0%-20%-40%-60%-80%
-100%
+100%+80%+60%+40%+20%
0%-20%-40%-60%-80%
-100%
+100%+80%+60%+40%+20%
0%-20%-40%-60%-80%
-100%
+100%+80%
-40%-60%-80%
-100%
+60%+40%+20%
0%-20%
Average: +9.3% (-4.3%)
Volatility: 7.7% (-4.7%)
Average: +15.9% (-8.9%)
Volatility: 16.0% (-8.9%)
Average: +5.6% (-4.3%)
Volatility: 16.9% (-7.8%)
Average: +19.5%
Volatility: 37.8%
Average: +17.1%
Volatility: 19.2%
Average: +13.6%
Volatility: 12.4%
Average: 24.8%
Volatility: 24.9%
Average: -1.4%
Volatility: 24.7%
Average TSR of dividend payers is 4.4% lower than non-payers
And volatility is also lowerby ~11.9%
Credit Suisse Corporate Insights 9
Exhibit 611: Comparing total shareholder return of dividend payers vs. non-payers for the S&P 500
6 year dividend payer total shareholder return: 14.9%
6 year non-payer total shareholder return: 18.6%
Non-payer vs. dividend payer relative return: -3.7%
TSR 2010-2016
-
1 year
+2.0% -4.2% -7.5% -7.1% -6.1% -6.1% -5.7% -6.4% -4.5%
-12.4% -14.8% -12.2% -9.8% -9.0% -7.9% -8.3% -5.9%
-14.6% -11.8% -8.7% -8.0% -6.8% -7.5% -4.8%
-9.1% -5.7% -6.4% -5.7% -6.5%
-3.3% -5.7% -5.1% -6.3% -2.9%
-9.8% -7.5% -7.9% -3.6%
-5.4% -6.9% -1.7%
-9.1% -0.9%
+5.5%
-4.4%
+0.6%
-1.3%
-1.8%
-3.3%
-2.9%
-3.6%
-4.4%
-5.4%
-4.3%
2 years 3 years 4 years 5 years 6 years 7 years 8 years 9 years 10 years
10 years ago
9 years ago
8 years ago
7 years ago
6 years ago
5 years ago
4 years ago
3 years ago
2 years ago
1 year ago
Sta
rt d
ate
Non-payer minusdividend payer
total returns
Analysis horizon (period over which returns are calculated)
-3.7%

Credit Suisse Corporate Insights10
What is the relationship between dividends and growth?
So, companies that do not pay dividends generally seem to outperform those that do pay dividends. Why is that? We know dividend policy doesn’t explain either multiples or total shareholder
Notably, the relationship between growth and dividends holds up over time. We looked at expected sales growth forecasts between payers and non-payers over the last decade and found that there is a consistent gap between growth rates of payers and non-payers and that non-payers have consistently had higher growth expectations than dividend payers.
Investor perception plays a role in considering the relationship between growth and dividends – and in turn, market valuations. As we discussed earlier, some view dividend payments as a positive signal of cash flow stability, in other words, a perception of consistent cash flow generation. Others view it as a negative signal that implies a slowdown or lack of alternatives available for reinvestment; in other words, a perception of lower growth prospects. Which is right? Both views can be right, depending on the company and industry.
We do know there is a significant negative correlation between dividend yield and sales growth. It appears to us that companies without prospects for investing in growth are more likely to pay dividends than those with high growth prospects.
return so, we turn back to fundamentals. Over the last decade, as shown in Exhibit 7, non-payers have delivered higher growth than dividend payers: almost three times higher in fact, on a median basis.
How does valuation change across different levels of sales growth prospects? Exhibit 8 shows the valuation multiples – as measured by the ratio of enterprise value to forward-looking EBITDA - for payers versus non-payers, bucketed based on growth expectations. Companies with the highest growth prospects trade at higher multiples relative to companies with lower growth prospects, irrespective of whether they are payers or non-payers. It is not surprising, then, that companies with higher growth prospects trade at higher multiples.13
The delta in multiples between payers and non-payers across all ranges of growth is not dramatic – with the exception of the highest growth companies. The companies with the highest level of growth that choose to pay a dividend suffer an average multiple that is three times lower than that of ultra-high growth non-payers.
When a company has high growth prospects, choosing to pay a dividend should be considered carefully. When a company has low growth prospects, and limited avenues for deploying capital, returning capital can make excellent sense, and dividends can be a great means of doing so.
Non-payers Payers
Exhibit 712: Distribution of achieved sales growth of non-payers versus payers – historical sales growth over previous ten years
25th percentile Median 75th percentile
0%
5%
(5%)
10%
15%
20%
0.8%
9.5%
20.7%
25%
0%
5%
(5%)
10%
15%
20%
25%
25th percentile Median 75th percentile
(2.4%)
3.9%
10.7%

Credit Suisse Corporate Insights 11
Exhibit 814: Payers vs. non-payers EV / EBITDA in buckets of sales growth
All companies
Sales growthpercentile
Non-payer EV/ EBITDA Payer EV / EBITDA Non-payer minus payer
0%-10%
10%-20%
20%-30%
30%-40%
40%-50%
50%-60%
60%-70%
70%-80%
80%-90%
90%-100%
11.7x 11.5x +0.2x
9.8x 10.4x -0.6x
9.3x 10.3x -1.0x
9.7x 10.7x -1.0x
10.2x 10.9x -0.7x
10.8x 11.4x -0.6x
11.0x 12.0x -1.0x
12.2x 12.4x -0.2x
13.7x 12.1x +1.6x
13.0x 12.4x +0.5x
14.8x 11.8x +3.0x
Because high growth means different things in different sectors, we looked at dividend paying companies across sectors, focusing on the high and low ends of the distribution to discern if there is any benefit or penalty for being a high dividend payer. In other words - does it matter if you are the highest yielding company in your sector? And what happens to companies that choose to pay high dividend yields in high growth sectors?
Exhibit 9 ranks sectors by their sales growth expectations and then looks at the companies that have the highest dividend yields (the top quartile) and those that have the lowest yields (the bottom quartile) within their respective sector.
Across almost all sectors, companies that paid the highest dividend yields in their sectors (top quartile) earned a lower multiple than their sector average. This seems to suggest
that paying less in dividends than the herd may be beneficial for respective valuation multiples.
Why? We suspect underlying individual company growth prospects, and whether they were above or below the industry average growth, play a role in this. Let’s take Information technology as an example – this is a high growth sector where companies that choose to pay the highest dividend yields are “penalized” – earning lower multiples by 1.95x relative to the sector average.
We also see that companies that paid the lowest dividend yields in their respective sectors (bottom 25th quartile) earned a subtly higher market multiple than their sector average. Again, we point to the growth prospects of these businesses – across all sectors, the average level of growth for companies that paid the lowest dividend yields was higher than the respective sector average.

Credit Suisse Corporate Insights12
Exhibit 915: EV / EBITDA for top and bottom dividend payers by sector
10.8% +0.55x+4.6% -0.0% -1.02xEnergy
9.7% -1.93x-0.9% +0.8% +0.94xInformation technology
7.9% -0.39x-2.6% +2.5% +0.01xMaterials
6.6% -1.09x-3.5% +1.9% +0.05xIndustrials
8.4% -2.62x-6.1% +1.7% +0.65xHealth care
6.2% -3.87x-2.0% +2.4% +1.20xReal estate
5.2% -1.03x+1.8% +1.2% +0.22xConsumer staples
5.7% -2.56x-4.0% +1.6% +0.89xConsumer discretionary
4.9% -1.63x-1.8% +1.1% +0.59xUtilities
4.7% -1.02x-3.2% +2.2% +0.29xFinancials
2.9% -0.49x+1.4% +1.1% +1.18xTelecom
6.8% -0.59x-2.8% +2.1% +0.28xAll companies
Base linesales growth
Excessgrowth
Excessgrowth
ExcessEV / EBITDA
Top 25% dividend yield in sample Bottom 25% dividend yield in sample
ExcessEV / EBITDA
Our analysis suggests that the level of dividend paid may matter, depending on what industry you are in. This analysis supports the idea that dividends are indeed related to a company’s growth prospects. There is a difference in valuation multiples between dividend payers and non-payers, but it’s important to
recognize this difference seems due to underlying fundamentals of the business, particularly growth. Growth is a vital element that explains the delta in multiples across companies that pay dividends versus those that do not. High growth drives higher valuations, but also begets lower dividend yields…and vice versa.

Credit Suisse Corporate Insights 13
Should you align your dividend policy with your peers or sector?
In our discussions with clients, we often get asked to benchmark a company’s historical capital deployment activity (e.g. M&A spend, R&D spend, capex spend, buybacks, de-levering, dividends) against peers. Companies like to know what the guy next door is doing with his capital decision-making strategy. But should this really make a difference when it comes to determining your own?
Does it really matter what your peers are doing? We’ve established that dividends do not correlate to market multiples or total shareholder return. What about companies that are dividend payers in industries that are characterized as a high-dividend-paying sector? And is there a relative multiple benefit to being a dividend paying stock in a non-dividend paying sector?
Exhibit 10 compares the valuation multiple deviations between companies that pay dividends versus those that don’t pay dividends. The x axis shows the percentage of companies in each sector that pay dividends. The y axis shows the delta in the EV/EBITDA multiple between dividend payers and non-payers in
While there are differences across sectors, let’s not forget that some of these differences can be attributed back to differences in underlying fundamentals, e.g. growth prospects.
each specific industry – so the sectors above 0x are ones where dividend payers trade at a premium and the sectors below 0x are ones where they trade at a discount.
There are observable differences across sectors. For example, Real estate and Utilities are sectors where the great majority of the companies paying a dividend for industry-specific reasons earn a substantial premium against the companies in their respective sectors that do not pay dividends. Said differently, these are sectors where not paying a dividend appears to result in a valuation penalty.
On the other hand, other sectors display a negative valuation multiple delta between companies that pay dividends and those that do not. Health care and Information technology fall on this side of the spectrum. Companies that pay dividends in these two sectors trade at a discount to their sector medians as a whole. This analysis suggests that companies that pay dividends in sectors comprised primarily of non-payers get penalized with a lower valuation multiple.
Understanding the industry dynamics and your competition will help determine whether a dividend could be warranted or seen as an undesirable drag on valuation.
Exhibit 1016: EV / EBITDA delta of payers versus non-payers by sector
13.09x -
14.61x
% of companies that paid a dividend
+12x
40% 50% 60% 70% 80% 90% 100%
+10x
+8x
+6x
+4x
+2x
0x
-2x
-4x
-6x
Payer EV / EBITDA – non-payer EV / EBITDA
Materials
Financials
Utilities
Real estate
Energy Industrials
Consumerdiscretionary
Consumer staples
Health care Informationtechnology
Telecom
X-axis
Bubble size
Y-a
xis
50%
168
-1.52x
of health carecompaniescurrently paya dividend
companies in thehealth care industry 95 companies in the
real estate industry
99%of real estatecompaniescurrently paya dividend
X-axis
Median EV / EBITDA of dividend payers:
Median EV / EBITDA of non-dividend payers:
valuation deviation between payers and non-payers in the
health care industry
Y-a
xis
+9.81x
Median EV / EBITDA of dividend payers:
Median EV / EBITDA of non-dividend payers:
valuation deviation between payers and non-payers in the
real estate industry
19.43x -
9.62x
Bubble size

Credit Suisse Corporate Insights14
What influences investor preferences for dividends?
Let’s spend a moment looking at this from an investor perspective. What can help explain the recent focus towards dividends?
One key explanation of the observed phenomenon of investor preferences towards dividends can be explained by the substitution effect between low risk corporate bonds and dividend-yielding equities. Investors are more sensitive and tend to favor dividend-yielding companies when rates are low. Exhibit 11 shows S&P 500 dividend yield for the companies that do pay dividends
Exhibit 12 shows the announcement effect following a dividend announcement for both dividend increases and dividend cuts. Generally, as the interest rate level decreases, the positive effect of a dividend increase and the negative effect of a dividend cut
over the last decade in comparison to ten year treasury rates.
Up until 2009, average dividend yields were well below the yield earned on the low risk corporate bonds (looking at ten year treasury rates below as a proxy). But since 2009, that gap has converged as interest rates declined.17 While dividend yields have historically been well below the least risky corporate bond yields, interest rates near all-time lows have created a substitution effect for investors seeking yield.
are magnified. This implies that investor sensitivity to dividend announcements increases when interest rates are lower and decreases when interest rates are higher.
Exhibit 1118: Bond yield vs. S&P 500 dividend yield
9%
8%
7%
6%
5%
4%
3%
0%
2%
1%
2006 2007 2008 2009 2010 2011 2012 2013 2014 2015 2016
10-year US Treasury rateAverage dividend payer yield

Credit Suisse Corporate Insights 15
Exhibit 1219: Market reactions to dividend announcements by interest rate level – S&P 500
Treasuryyield
Average excess return
Dividend increases Dividend cuts
% positive % positiveAverage excess return
Less than 2.5%
2.5% to 3.0%
3.0% to 3.5%
3.5% to 4.0%
4.0% to 4.5%
4.5% to 5.0%
5.0% to 5.5%
5.5% to 6.0%
6.0% to 6.5%
Greater than 6.5%
60.9%
60.0%
58.7%
59.8%
58.3%
57.6%
56.4%
54.5%
51.4%
59.0%
+0.73%
+0.75%
+0.73%
+0.61%
+0.47%
+0.55%
+0.31%
+0.52%
+0.59%
+0.86%
+0.90%
-1.59%
-2.49%
-1.80%
-1.57%
-1.36%
-2.05%
-1.12%
-1.03%
-1.25%
41.9%
35.6%
39.8%
43.5%
41.2%
50.5%
43.9%
62.9%
44.6%
44.4%
While it is important to understand and recognize the fashion for dividends relative to the interest rate environment, we believe companies should resist such short term attraction. Instead, they should operate with an informed, long-term, value-creation focus. Issuing dividends shouldn’t be a default just based on
the current investor mood towards dividends. Over the long term, we see that dividends don’t drive valuations. What drives share prices the most in the long run is not market reactions to dividend increases or dividend cuts but rather underlying company fundamentals.

Credit Suisse Corporate Insights16
Concluding thoughts
So, when do dividends matter and are they a strategic lever for driving valuation? The answer, like most things, depends on the context.
Dividends can matter when deciphering valuation multiples, but as we showed, growth expectations and sector-specific circumstances must be taken into account as well. Companies that pay dividends tend to have lower growth prospects than those that do not, but once growth is blended into the equation, there are nuances in the way investors ascribe valuation premiums or discounts to dividend payers.
However, dividends don’t matter when it comes to setting strategy for long term value creation. The evidence we reviewed suggests that dividends do not drive valuation in the long term in any meaningful way. Dividends don’t drive total shareholder returns, and, as presented earlier, dividend payers actually tend to underperform non-payers. Fundamentals are the key drivers of long-term value; dividends are neither the cause nor the key driver of valuation differences.
To be clear, we are not suggesting dividend-yielding companies are doing the wrong thing. Returning excess capital to shareholders is an important part of capital deployment. Moreover, we do not propose that companies that have a long history of paying dividends should stop. While there is no relationship between dividend yield and market valuations in the broad market, the impact of dividends on the market valuation
of a specific company is not so black-and-white. Market psychology plays a big role in dividends: differences in investor perceptions and preferences towards dividends across sectors and in different interest rate environments can influence near term market reactions.
Sound investor communication on dividends is vital. To quote the “Oracle of Omaha”: “above all, dividend policy should always be clear, consistent and rational. A capricious policy will confuse owners and drive away would-be investors.” Moreover, decisions on dividend policy shouldn’t be made in a vacuum – they should be made in the context of growth prospects, reinvestment needs and overall capital deployment strategy. Choosing to issue a dividend and understanding how it can potentially impact valuation and investor preferences matters.
Our view is that dividend policy should not be thought of as a strategic lever to influence long term value creation but rather simply as a tactical decision on a mechanism to pay back shareholders. Dividends do not create value; they are a value distribution event. What matters the most in valuation are strategic decisions that companies make on investing in the business and on driving profitable growth.

Credit Suisse Corporate Insights 17
End notes
1 Sampleincludesover2,100companiesinUS(S&P1500)andEurope(STOXXEurope600).Organicgrowthisdefinedascapitalexpenditures+R&Dexpense+advertisingexpense+increaseinrentalexpense.M&Aisdefinedascapitalinvestedinacquisitionsnetofdivestitures.Sharebuybacksisdefinedascapitalusedtorepurchasesharesnetofanyadditionalequityissuance.Dividendsincludeonlycashdividendsdistributed.Otherisdefinedasbalancesheetstrengthening.
2 TheModigliani-Millertheoremstatesthatintheabsenceoftaxes,bankruptcyandagencycosts,decisionsoncapitalstructuredon’thaveanimpactonfirmvalue.“TheCostofCapital,CorporationFinanceandtheTheoryofInvestment”,FrancoModiglianiandMertonMiller,1958.
3 Source:BerkshireHathawaylettertoshareholders2012.WarrenE.Buffett(March2013).3 Source:“CorporateFinance:TheoryandPractice”,2ndEdition.AswathDamodaran(2001).4 Welookedatasub-sampleof600Europeancompanies(STOXXEurope600)andfoundthatthereisamorepronouncednegativecorrelation
(-0.148)betweenthevaluationmultiple-ratioofEnterpriseValuetonexttwelvemonthEBITDA-anddividendyield,withanr-squaredof2.2%.Wealsofoundanegativecorrelationof(-0.359)betweenthevaluationmultipleandthethreeyeartotalshareholderreturn,withanr-squaredof12.9%.
5 Sampleincludes2,100companiesinUS(S&P1500)andEurope(STOXXEurope600).RegressionanalysisisasofSeptember2017.ValuationMultipleisEnterpriseValuetonexttwelvemonthEBITDA.TotalShareholderReturnisathreeyearcumulativereturn.
6 FactorssuchasM&Arelatedpremiums,restructuring/bankruptcynoise,perceptionofmanagement,activismthreats,irrationalinvestorbehaviorwouldallaffectacompany’ssharepricebeyondthefourfundamentalfactorsdiscussedabove.
7 Sampleincludesallnon-financialS&P1500companieswithdataavailable.Explanatoryvariablesforsize,profitability,growth,andleveragereflectlogoftotalsales,EBITDAmargin,long-termgrowthestimateanddebt-to-EBITDArespectively.RegressionanalysisisasofSeptember2017.TheleftsideofExhibit3showsthemodel’spredictedmarketcapitalizationagainstactualmarketcapitalization.Thegapbetweentheactualvalueandthemodel-predictedvaluerepresentthemodel’sresiduals.Wefoundthatdividendshavenoexplanatorypowerfortheresiduals,ortheunexplainedcomponentinthemodel.Asanexample,ifacompanyistradingat$10inthemarket(yaxis),yetthefour-factormodelsaysitshouldtradeat$12(xaxis),therightsideoftheexhibitassesseswhetherthat$2valuegapisexplainedbydividends.Thelowr-squaredcloseto0%indicatesthatdividendsdon’tcontributeinexplainingdifferencesinlevelsofvaluation.
8 Overthelasttenyears,non-payersdeliveredaTSRtoinvestorsof384%whilepayershavedelivered219%9 Sampleincludes2,100companiesinUS(S&P1500)andEurope(STOXXEurope600).Dividendpayerdefinedascompanypayingdividendsinat
leasteightofthelasttenyears.Non-payerdefinedascompanynotpayingdividendsinatleasteightofthelasttenyears.Runningtheanalysisjustonasub-sampleofEuropeanpayersandnon-payersrendersresultsintheoppositedirection,showingdividendpayersoutperformingnon-payers.However,it’simportanttonotethissub-samplesuffersfromasamplesizeissue,asthenumberofEuropeannon-payersismeaningfullylow,makingithardtodrawanyrobustconclusionfromthiscutofthedata.
10 Sampleincludesallnon-financialS&P500companieswithdataavailableduringeachtimeperiodanalyzed.Dividendpayerdefinedascompanypayingdividendsinthelasttwelvemonthsleadingtoeachtimeperiodanalyzed.
11 Differenceinaveragereturnandreturnvolatilityreflectthedifferencesbetweendividend-payingstocksandnon-payers.Cellsareconditionallyformattedbasedondifferenceinaveragereturnsondividend-payingstocksminusaveragereturnsonnon-payers.
12 Sampleincludes2,100companiesinUS(S&P1500)andEurope(STOXXEurope600).Growthreferstotheachievedyear-on-yearsalesgrowthoverthelast10years.Dividendpayerdefinedascompanypayingdividendsinatleasteightofthelasttenyears.Non-payerdefinedascompanynotpayingdividendsinatleasteightofthelasttenyears.
13 Seeourpublication:“Managingthemultiple:Weighinggrowthagainstprofitability”.CreditSuisseCorporateInsights,2016FirstQuarter.14 Sampleincludes2,100companiesinUS(S&P1500)andEurope(STOXXEurope600).Dividendpayerdefinedascompanypayingdividendsin
thelasttwelvemonthsleadingtotheanalysis.Growthprospectsreferstoforecastedyear-on-yeargrowthinsales,(percentchangeinfiscaloneyearforwardsalesvs.fiscaltwoyearforwardsales).
15 Ibid.EBITDAusedinthecalculationofthevaluationmultipleisnexttwelvemonthEBITDA.Growthreferstoforecastedyear-on-yeargrowthinsales,(percentchangeinlasttwelvemonthsalesvs.nexttwelvemonthsales).EnterpriseValue(EV)/EBITDApremiumandexcessexpectedsalesgrowthrepresentthedifferencebetweenthesub-sample’saveragesvs.theaverageforallcompaniesinthegivensector.
16 Ibid.Dividendpayerdefinedasacompanypayingdividendinthelasttwelvemonthsleadingtotheanalysis.AnalysisisasofSeptember2017.17 Seeourpublication:“Theupsideofnegativerates:Opportunitiesforfinancingandgrowth”.CreditSuisseCorporateInsights,2016SecondQuarter.18 Sampleincludesallnon-financialS&P500companieswithdataavailablefromJanuary2006toSeptember2017.Bondyieldsreflect10-yearyields
basedonmediantradingspreadsbyrating.Averagedividendyieldiscalculatedbasedonjustdividendpayers(excludesnon-payersfromcalculationofaverage).
19 Ibid.Bondyieldsreflect10-yearyieldsbasedonmediantradingspreadsbyrating.Sharepricereactionisestimatedaspercentagechangeinshare price between one day prior and one day post announcement.

Credit Suisse Corporate Insights18
Authors from Credit Suisse Investment Banking and Capital Markets
Rick Faery, Managing Director Tom Steiner, Senior Advisor Charu Sharma, Vice President Santiago Garcia, AssociateRhys McDonald, AnalystLogan Grimes, Analyst
With thanks for their time, contributions and valuable insights:
Eric Rattner, Senior Advisor
About Investment Banking and Capital Markets
Credit Suisse Investment Banking and Capital Markets is a division of Credit Suisse, one of the world’s leading financial services providers. We offer a broad range of investment banking services to corporations, financial institutions, financial sponsors and ultra-high-net-worth individuals and sovereign clients. Our range of products and services includes advisory services related to mergers and acquisitions, divestitures, takeover defense mandates, business restructurings and spin-offs. The division also engages in debt and equity underwriting of public securities offerings and private placements.
Authors and acknowledgements

Credit Suisse Corporate Insights 19
Credit Suisse Corporate Insights
Our Credit Suisse Corporate Insights series provides our perspective on the key and critical corporate decision points many of you face, regarding corporate strategy, market valuation, debt and equity financing, capital deployment and M&A. For more information, please visit: credit-suisse.com/corporateinsights.
Latest papers

This material has been prepared by personnel of Credit Suisse Securities (USA) LLC and its affiliates (“CSSU”) and not by the CSSU research department. It is not investment research or a research recommendation, as it does not constitute substantive research or analysis. This document is not directed to, or intended for distribution to or use by, any person or entity who is a citizen or resident of or located in any locality, state, country or other jurisdiction where such distribution, publication, availability or use would be contrary to law or regulation or which would subject CSSU to any registration or licensing requirement within such jurisdiction. It is provided for informational purposes only, is intended for your use only, does not constitute an invitation or offer to subscribe for or purchase any of the products or services, and must not be forwarded or shared except as agreed with CSSU. The information provided is not intended to provide a sufficient basis on which to make an investment decision. It is intended only to provide observations and views of certain personnel, which may be different from, or inconsistent with, the observations and views of CSSU research department analysts, other CSSU personnel, or the proprietary positions of CSSU. Observations and views expressed herein may be changed by the personnel at any time without notice. This material may have previously been communicated to other CSSU clients.
The information provided, including any tools, services, strategies, methodologies and opinions, is expressed as of the date hereof and is subject to change. CSSU assumes no ob-ligation to update or otherwise revise these materials. The information presented in this document has been obtained from or based upon sources believed to be reliable, but CSSU does not represent or warrant its accuracy or completeness and is not responsible for losses or damages arising out of errors, omissions or changes or from the use of information presented in this document. This material does not purport to contain all of the information that an interested party may desire and, in fact, provides only a limited view. Any headings are for convenience of reference only and shall not be deemed to modify or influence the interpretation of the information contained.
Backtested, hypothetical or simulated performance results have inherent limitations. Simulated results are achieved by the retroactive application of a backtested model itself designed with the benefit of hindsight. The backtesting of performance differs from the actual account performance because the investment strategy may be adjusted at any time, for any reason and can continue to be changed until desired or better performance results are achieved. Alternative modeling techniques or assumptions might produce significantly different results and prove to be more appropriate. Past hypothetical backtest results are neither an indicator nor a guarantee of future returns. Actual results will vary from the analysis. Past performance should not be taken as an indication or guarantee of future performance, and no representation or warranty, expressed or implied is made regarding future performance.
CSSU may, from time to time, participate or invest in transactions with issuers of securities that participate in the markets referred to herein, perform services for or solicit business from such issuers, and/or have a position or effect transactions in the securities or derivatives thereof. To obtain a copy of the most recent CSSU research on any company mentioned please contact your sales representative or go to research-and-analytics.csfb.com. FOR IMPORTANT DISCLOSURES on companies covered in Credit Suisse Investment Banking Division research reports, please see www.credit-suisse.com/researchdisclosures
Nothing in this document constitutes investment, legal, accounting or tax advice or a representation that any investment strategy or service is suitable or appropriate to your individual circumstances. This document is not to be relied upon in substitution for the exercise of independent judgment. This document is not to be reproduced, in whole or part, without the written consent of CSSU.
The HOLT methodology does not assign ratings or a target price to a security. It is an analytical tool that involves use of a set of proprietary quantitative algorithms and warranted value calculations, collectively called the HOLT valuation model, that are consistently applied to all the companies included in its database. Third-party data (including consensus earnings estimates) are systematically translated into a number of default variables and incorporated into the algorithms available in the HOLT valuation model. The source financial statement, pricing, and earnings data provided by outside data vendors are subject to quality control and may also be adjusted to more closely measure the underlying economics of firm per-formance. These adjustments provide consistency when analyzing a single company across time, or analyzing multiple companies across industries or national borders. The default scenario that is produced by the HOLT valuation model establishes a warranted price for a security, and as the third-party data are updated, the warranted price may also change. The default variables may also be adjusted to produce alternative warranted prices, any of which could occur. The warranted price is an algorithmic output applied systematically across all companies based on historical levels and volatility of returns. Additional information about the HOLT methodology is available on request.
CSSU does not provide any tax advice. Any tax statement herein regarding any US federal tax is not intended or written to be used, and cannot be used, by any taxpayer for the purpose of avoiding any penalties. Any such statement herein was written to support the marketing or promotion of the transaction(s) or matter(s) to which the statement relates. Each taxpayer should seek advice based on the taxpayer’s particular circumstances from an independent tax advisor.
This document does not constitute an offer to sell, or a solicitation of an offer to purchase, any business or securities.
This communication does not constitute an invitation to consider entering into a derivatives transaction under U.S. CFTC Regulations §§ 1.71 and 23.605 or a binding offer to buy/sell any financial instrument.
CREDIT SUISSE SECURITIES (USA) LLCEleven Madison AvenueNew York, NY 10010credit-suisse.com


