12
Jérôme Contamine, Executive Vice President, Chief Financial Officer London – September 15, 2017 BofA-ML Global Healthcare Conference
| Date post: | 21-Jan-2018 |
| Category: |
Health & Medicine |
| Upload: | sanofi |
| View: | 239 times |
| Download: | 1 times |

Jérôme Contamine, Executive Vice President, Chief Financial Officer
London – September 15, 2017
BofA-ML Global Healthcare Conference
2
Forward Looking Statements
This presentation contains forward-looking statements as defined in the Private Securities Litigation Reform Act of
1995, as amended. Forward-looking statements are statements that are not historical facts. These statements include
projections and estimates and their underlying assumptions, statements regarding plans, objectives, intentions and
expectations with respect to future financial results, events, operations, services, product development and potential,
and statements regarding future performance. Forward-looking statements are generally identified by the words
“expects”, “anticipates”, “believes”, “intends”, “estimates”, “plans” and similar expressions. Although Sanofi’s
management believes that the expectations reflected in such forward-looking statements are reasonable, investors are
cautioned that forward-looking information and statements are subject to various risks and uncertainties, many of which
are difficult to predict and generally beyond the control of Sanofi, that could cause actual results and developments to
differ materially from those expressed in, or implied or projected by, the forward-looking information and statements.
These risks and uncertainties include among other things, the uncertainties inherent in research and development,
future clinical data and analysis, including post marketing, decisions by regulatory authorities, such as the FDA or the
EMA, regarding whether and when to approve any drug, device or biological application that may be filed for any such
product candidates as well as their decisions regarding labelling and other matters that could affect the availability or
commercial potential of such product candidates, the absence of guarantee that the product candidates if approved will
be commercially successful, the future approval and commercial success of therapeutic alternatives, Sanofi’s ability to
benefit from external growth opportunities and/or obtain regulatory clearances, risks associated with intellectual
property and any related pending or future litigation and the ultimate outcome of such litigation, trends in exchange
rates and prevailing interest rates, volatile economic conditions, the impact of cost containment initiatives and
subsequent changes thereto, the average number of shares outstanding as well as those discussed or identified in the
public filings with the SEC and the AMF made by Sanofi, including those listed under “Risk Factors” and “Cautionary
Statement Regarding Forward-Looking Statements” in Sanofi’s annual report on Form 20-F for the year ended
December 31, 2016. Other than as required by applicable law, Sanofi does not undertake any obligation to update or
revise any forward-looking information or statements.
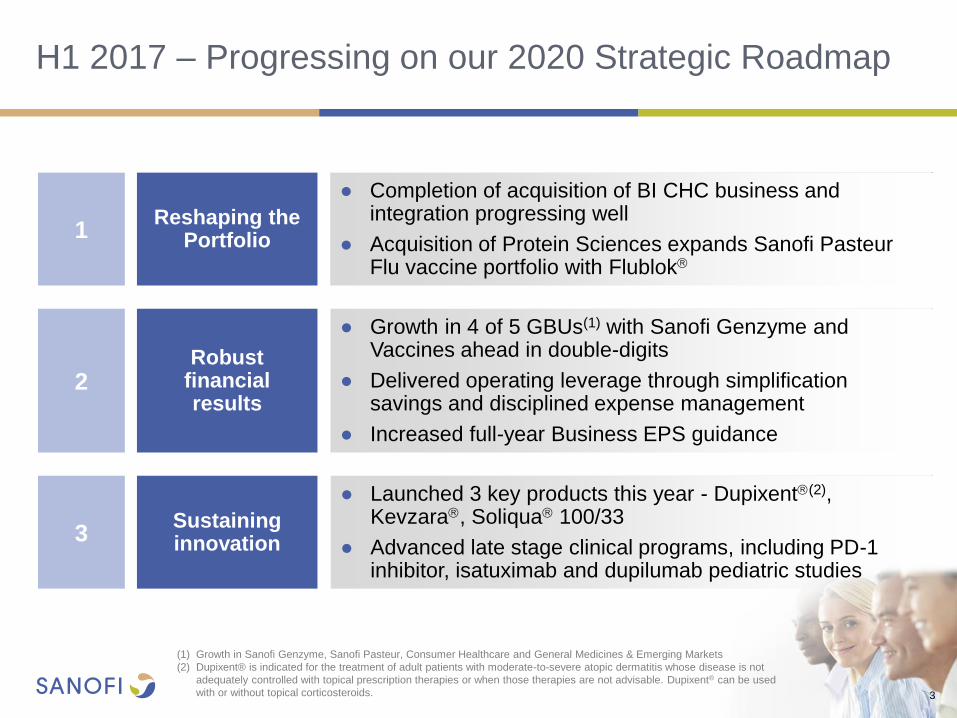
H1 2017 – Progressing on our 2020 Strategic Roadmap
3
1
● Completion of acquisition of BI CHC business and integration progressing well
● Acquisition of Protein Sciences expands Sanofi Pasteur Flu vaccine portfolio with Flublok
Reshaping the Portfolio
● Growth in 4 of 5 GBUs(1) with Sanofi Genzyme and Vaccines ahead in double-digits
● Delivered operating leverage through simplification savings and disciplined expense management
● Increased full-year Business EPS guidance
2 Robust
financial results
3
● Launched 3 key products this year - Dupixent(2), Kevzara, Soliqua 100/33
● Advanced late stage clinical programs, including PD-1 inhibitor, isatuximab and dupilumab pediatric studies
Sustaining innovation
(1) Growth in Sanofi Genzyme, Sanofi Pasteur, Consumer Healthcare and General Medicines & Emerging Markets
(2) Dupixent® is indicated for the treatment of adult patients with moderate-to-severe atopic dermatitis whose disease is not
adequately controlled with topical prescription therapies or when those therapies are not advisable. Dupixent® can be used
with or without topical corticosteroids.

H1 2017 Sales Benefited from Change in Structure and
Simplified Organization Supported Business EPS
4 CER : Constant Exchange Rates
Business EPS
H1 2017
€2.77
H1 2016
€2.64
+2.7% at CER
Company Sales
€15,926m €17,311m
H1 2016 H1 2017
+7.0% at CER
5
Growth
at CER/CS(1)
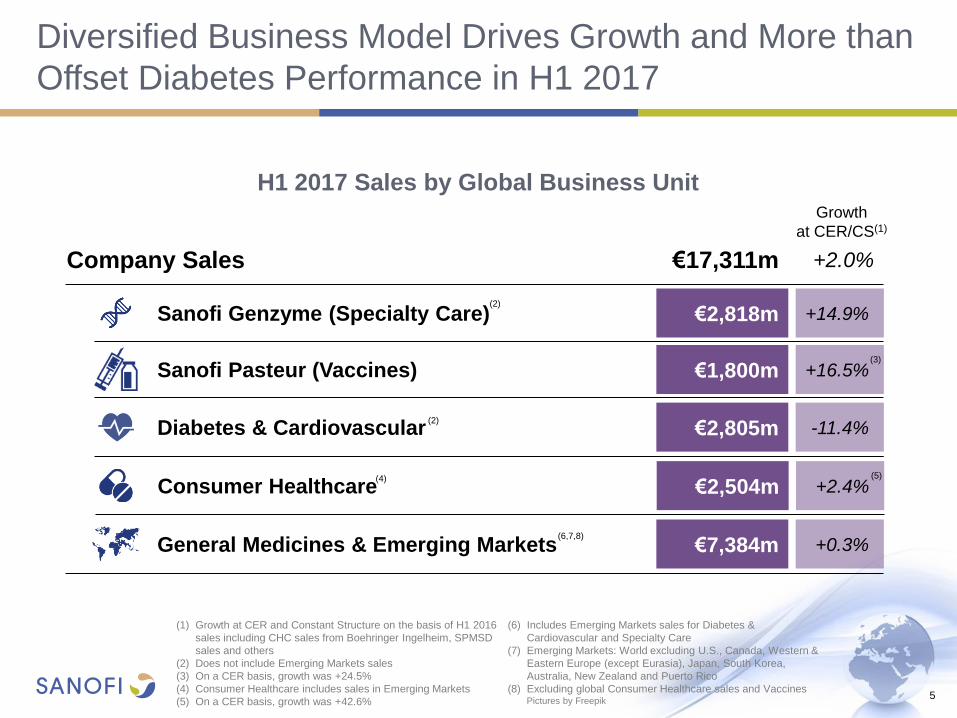
Diversified Business Model Drives Growth and More than
Offset Diabetes Performance in H1 2017
(1) Growth at CER and Constant Structure on the basis of H1 2016
sales including CHC sales from Boehringer Ingelheim, SPMSD
sales and others
(2) Does not include Emerging Markets sales
(3) On a CER basis, growth was +24.5%
(4) Consumer Healthcare includes sales in Emerging Markets
(5) On a CER basis, growth was +42.6%
(6) Includes Emerging Markets sales for Diabetes &
Cardiovascular and Specialty Care
(7) Emerging Markets: World excluding U.S., Canada, Western &
Eastern Europe (except Eurasia), Japan, South Korea,
Australia, New Zealand and Puerto Rico
(8) Excluding global Consumer Healthcare sales and Vaccines Pictures by Freepik
H1 2017 Sales by Global Business Unit
Company Sales €17,311m
+2.0%
€2,805m
Diabetes & Cardiovascular -11.4%
€2,818m
Sanofi Genzyme (Specialty Care) +14.9%
€1,800m
Sanofi Pasteur (Vaccines) +16.5%
€7,384m
General Medicines & Emerging Markets +0.3% (6,7,8)
(2)
(2)
(4) €2,504m
Consumer Healthcare +2.4% (5)
(3)
6
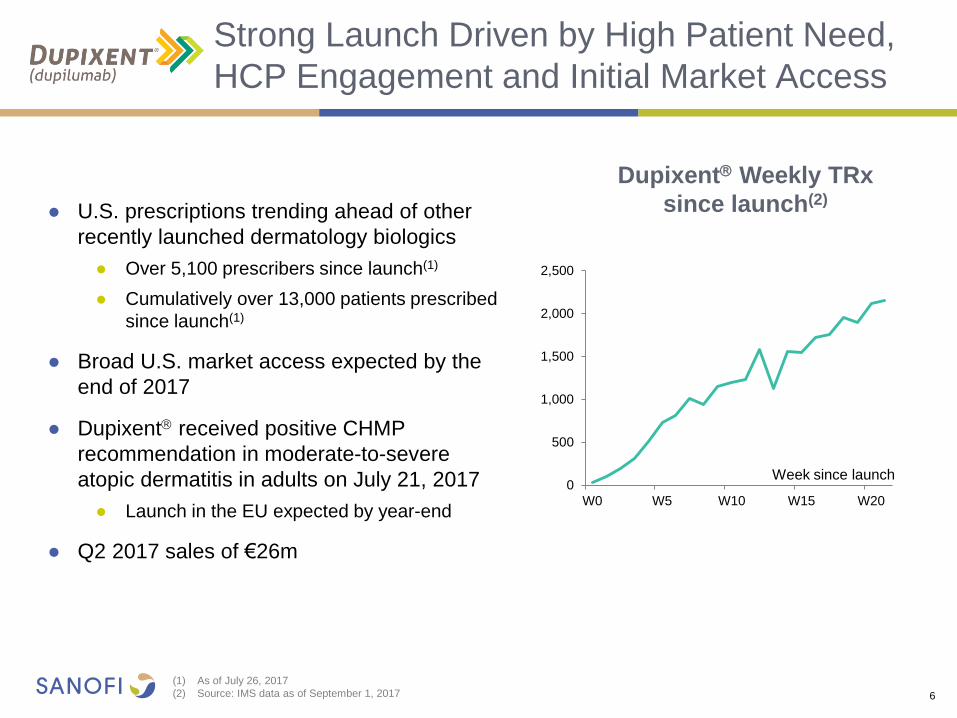
● U.S. prescriptions trending ahead of other
recently launched dermatology biologics
● Over 5,100 prescribers since launch(1)
● Cumulatively over 13,000 patients prescribed
since launch(1)
● Broad U.S. market access expected by the
end of 2017
● Dupixent received positive CHMP
recommendation in moderate-to-severe
atopic dermatitis in adults on July 21, 2017
● Launch in the EU expected by year-end
● Q2 2017 sales of €26m
(1) As of July 26, 2017
(2) Source: IMS data as of September 1, 2017
Strong Launch Driven by High Patient Need,
HCP Engagement and Initial Market Access
Dupixent Weekly TRx
since launch(2)
0
500
1,000
1,500
2,000
2,500
W0 W5 W10 W15 W20
Week since launch
7
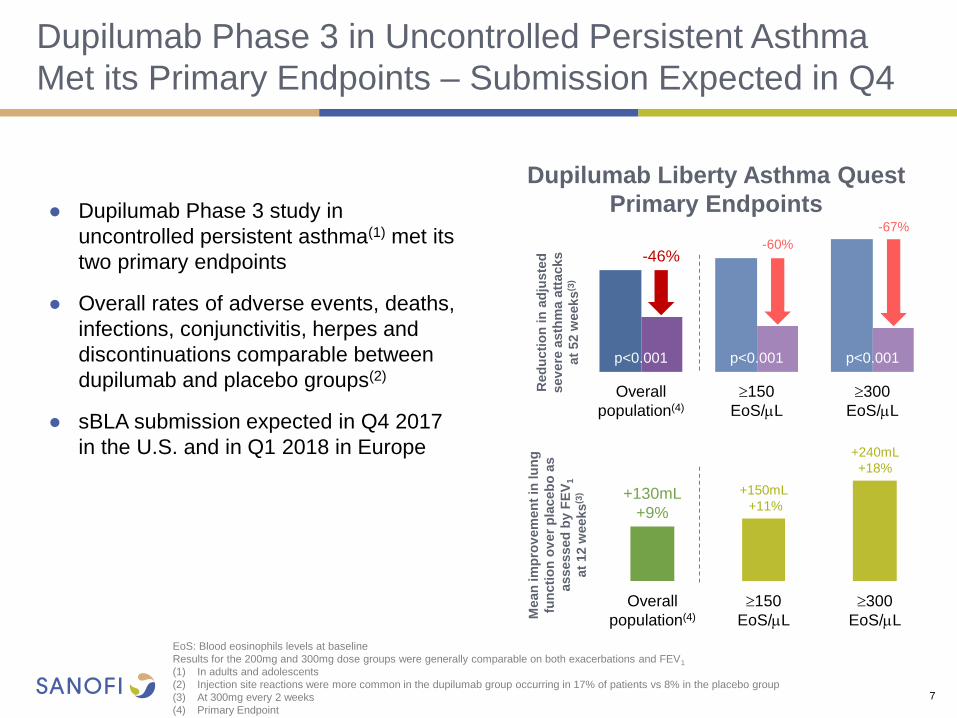
● Dupilumab Phase 3 study in
uncontrolled persistent asthma(1) met its
two primary endpoints
● Overall rates of adverse events, deaths,
infections, conjunctivitis, herpes and
discontinuations comparable between
dupilumab and placebo groups(2)
● sBLA submission expected in Q4 2017
in the U.S. and in Q1 2018 in Europe
EoS: Blood eosinophils levels at baseline
Results for the 200mg and 300mg dose groups were generally comparable on both exacerbations and FEV1
(1) In adults and adolescents
(2) Injection site reactions were more common in the dupilumab group occurring in 17% of patients vs 8% in the placebo group
(3) At 300mg every 2 weeks
(4) Primary Endpoint
Dupilumab Liberty Asthma Quest
Primary Endpoints
Dupilumab Phase 3 in Uncontrolled Persistent Asthma
Met its Primary Endpoints – Submission Expected in Q4
p<0.001
p<0.001 p<0.001
Red
ucti
on
in
ad
jus
ted
sev
ere
asth
ma a
ttacks
at
52 w
eeks
(3)
Overall
population(4)
150
EoS/L
300
EoS/L Mean
im
pro
vem
en
t in
lu
ng
fun
cti
on
ov
er
pla
ceb
o a
s
assessed
by F
EV
1
at
12 w
eeks
(3)
150
EoS/L
Overall
population(4)
300
EoS/L
p<0.001 p<0.001 p<0.001
-46% -60%
-67%
+130mL
+9%
+150mL
+11%
+240mL
+18%
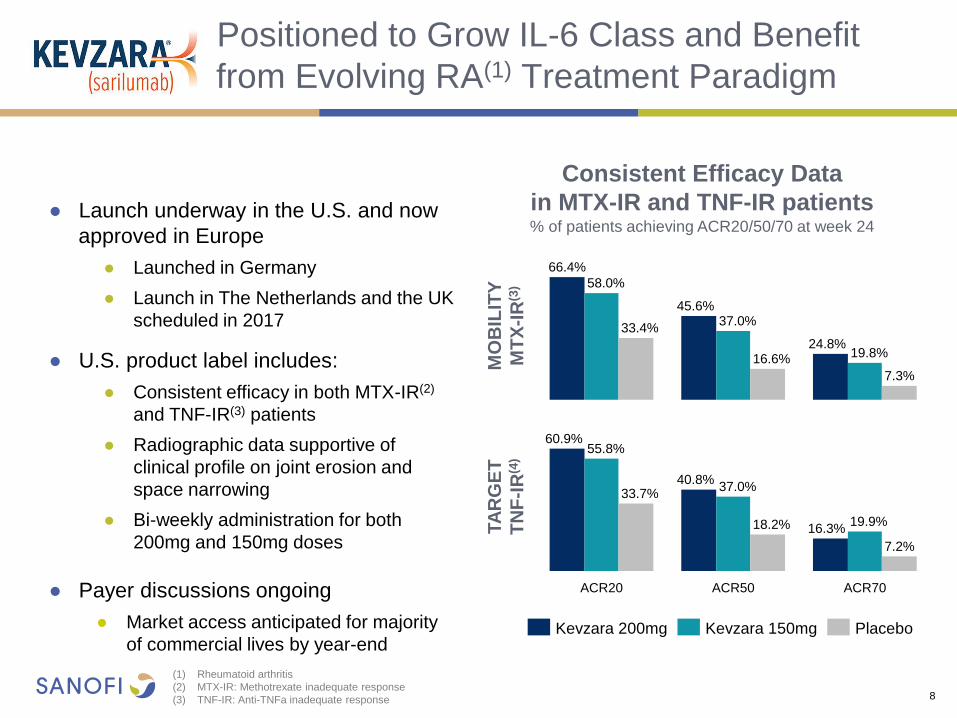
Positioned to Grow IL-6 Class and Benefit
from Evolving RA(1) Treatment Paradigm
8
● Launch underway in the U.S. and now
approved in Europe
● Launched in Germany
● Launch in The Netherlands and the UK
scheduled in 2017
● U.S. product label includes:
● Consistent efficacy in both MTX-IR(2)
and TNF-IR(3) patients
● Radiographic data supportive of
clinical profile on joint erosion and
space narrowing
● Bi-weekly administration for both
200mg and 150mg doses
● Payer discussions ongoing
● Market access anticipated for majority
of commercial lives by year-end
(1) Rheumatoid arthritis
(2) MTX-IR: Methotrexate inadequate response
(3) TNF-IR: Anti-TNFa inadequate response
Consistent Efficacy Data
in MTX-IR and TNF-IR patients % of patients achieving ACR20/50/70 at week 24
19.8% 24.8%
37.0% 45.6%
58.0%
66.4%
33.4%
16.6%
7.3%
Kevzara 150mg Kevzara 200mg Placebo
18.2%
ACR70
19.9% 16.3%
ACR50
37.0% 40.8%
ACR20
55.8% 60.9%
33.7%
7.2%
MO
BIL
ITY
MT
X-I
R(3
)
TA
RG
ET
TN
F-I
R(4
)

9
CHC Sales Grew in H1 2017 and BI Integration On Track
(1) Growth at CER and Constant Structure on the basis of H1 2016 sales including CHC sales from Boehringer Ingelheim and Others
(2) 42 countries have exited transitional distribution service agreement by early July 2017. Remaining 13 countries expected to exit transitional
distribution service agreement by April 2018.
● CHC sales up +2.4% at CER/CS(1)
● Europe was up +1.6% due to strong and
early cough and cold season
● U.S. sales increased +2.5%
● Emerging Markets up +3.0% with all core
categories growing
● BI integration progressing according to plan
● Over 95% of BI CHC sales will be recognized
by end of 2017(2)
9
H1 2017 Global CHC Sales at CER/CS
€669m +6.7%
€621m +4.1%
€468m -3.2%
€334m -1.2%
€412m +2.8%
Allergy, Cough & Cold
Pain
Other
Nutritional
Digestive

Accelerated Decline in Diabetes Sales
Partially Mitigated by Toujeo
10
● Diabetes sales declined -9.2% at CER in H1
2017 driven by anticipated U.S. challenges
● U.S. diabetes sales decline (-19% in H1 2017)
expected to accelerate in H2 2017
● Toujeo sales reached €402m (+60% at CER)
● Achieved 13% basal market share in Europe(1)
● Continued share gain in the U.S. Basal market(2)
● Reached 15.5% market share in Japan
● Soliqua 100/33 U.S. payer coverage
improving
● Access secured for 65% of commercial lives
● Comprehensive 2018 U.S. payer coverage
update to be provided with Q3 2017 results
(1) Based on latest available data in each country
(2) 7.9% based on IMS data as of July 14, 2017
(3) In other countries where Toujeo is launched, based on latest available monthly data
Toujeo Market Share(1) Top EU Countries, Japan, the U.S. and Other
0%
5%
10%
15%
20%
W0 W20 W40 W60 W80 W100
Germany Italy Spain
UK USA Japan
France Other(3)
Week since launch
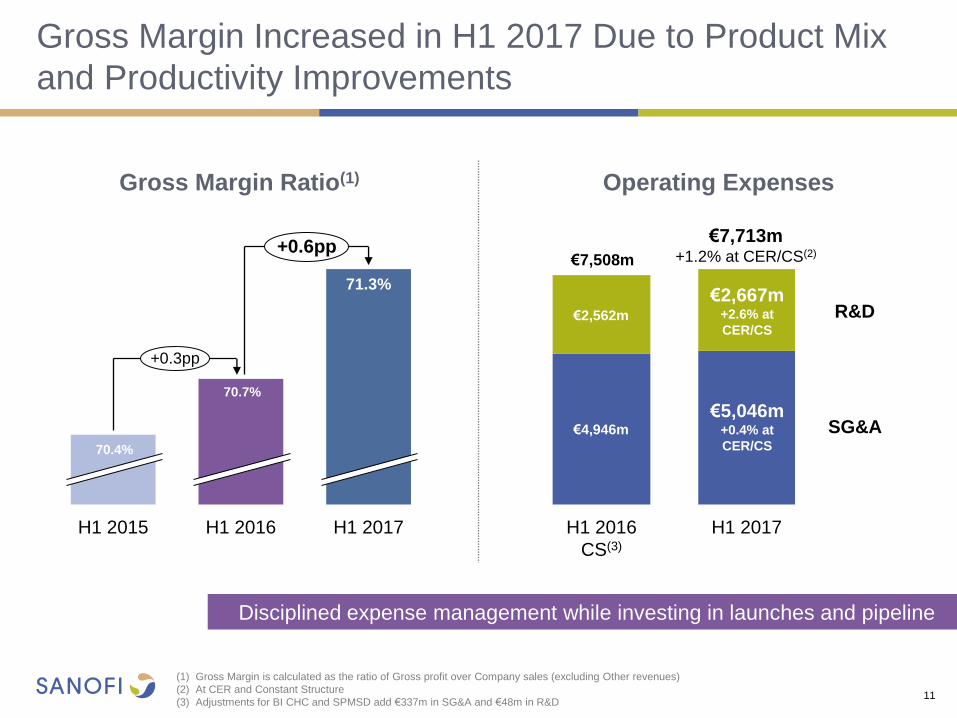
Gross Margin Increased in H1 2017 Due to Product Mix
and Productivity Improvements
11
(1) Gross Margin is calculated as the ratio of Gross profit over Company sales (excluding Other revenues)
(2) At CER and Constant Structure
(3) Adjustments for BI CHC and SPMSD add €337m in SG&A and €48m in R&D
Gross Margin Ratio(1)
SG&A
R&D
H1 2017 H1 2016
CS(3)
€2,667m +2.6% at
CER/CS
€5,046m +0.4% at
CER/CS
€7,713m +1.2% at CER/CS(2)
€7,508m
€2,562m
€4,946m
Disciplined expense management while investing in launches and pipeline
71.7%
+0.6pp
+0.3pp
H1 2017 H1 2016 H1 2015
Operating Expenses
71.3%
70.7%
70.4%

12
(1) Compared to FY2016 and barring major unforeseen adverse events
(2) FY 2016 Business EPS of €5.68
(3) Difference between variation on a reported basis and variation at CER
Raising Business EPS Guidance at CER
for H1 2017 Performance
Business EPS
+1%(3)
based on June 2017 average exchange rates
Broadly Stable at CER(1,2)
FY 2017
FX impact on Business EPS


