10 DEPARTMENT OF PRIMARY INDUSTRIES, PARKS, WATER AND ENVIRONMENT AGENCY OUTLINE The Department of Primary Industries, Parks, Water and Environment helps build a strong and economically vibrant State, by facilitating and supporting Tasmania’s competitive strengths across primary industries and the environment. The Department’s objectives are to: facilitate the sustainable development of Tasmania’s marine and freshwater resources; cultivate prosperity in Tasmania’s primary industries and food sectors; secure a healthy and productive environment for all Tasmanians; manage the sensitive and appropriate use and enjoyment of Tasmania’s National Parks and Reserves; protect, conserve and promote Tasmania’s Aboriginal, natural and historic heritage; build on and protect the Tasmanian brand credentials; oversee the integrity and viability of the racing industry; and deliver access to secure land tenure, land and resource information. The Department reports to: the Minister for Primary Industries and Water and the Minister for Racing, Hon Sarah Courtney MP; the Minister for Aboriginal Affairs, Hon Jacquie Petrusma MP; the Minister for the Environment, Hon Elise Archer MP; and the Minister for Heritage and the Minister for Parks, Hon Will Hodgman MP. Primary Industries, Parks, Water and Environment 235
Transcript
10 DEPARTMENT OF PRIMARY INDUSTRIES, PARKS, WATER AND ENVIRONMENT
AGENCY OUTLINEThe Department of Primary Industries, Parks, Water and Environment helps build a strong and economically vibrant State, by facilitating and supporting Tasmania’s competitive strengths across primary industries and the environment.The Department’s objectives are to: facilitate the sustainable development of Tasmania’s marine and freshwater
resources; cultivate prosperity in Tasmania’s primary industries and food sectors; secure a healthy and productive environment for all Tasmanians; manage the sensitive and appropriate use and enjoyment of Tasmania’s National
Parks and Reserves; protect, conserve and promote Tasmania’s Aboriginal, natural and historic heritage; build on and protect the Tasmanian brand credentials; oversee the integrity and viability of the racing industry; and deliver access to secure land tenure, land and resource information.The Department reports to: the Minister for Primary Industries and Water and the Minister for Racing, Hon
Sarah Courtney MP; the Minister for Aboriginal Affairs, Hon Jacquie Petrusma MP; the Minister for the Environment, Hon Elise Archer MP; and the Minister for Heritage and the Minister for Parks, Hon Will Hodgman MP.This chapter provides the Department’s financial information for 2018-19 and the Forward Estimates period (2019-20 to 2021-22). Further information on the Department is provided at www.dpipwe.tas.gov.au.
Primary Industries, Parks, Water and Environment 235
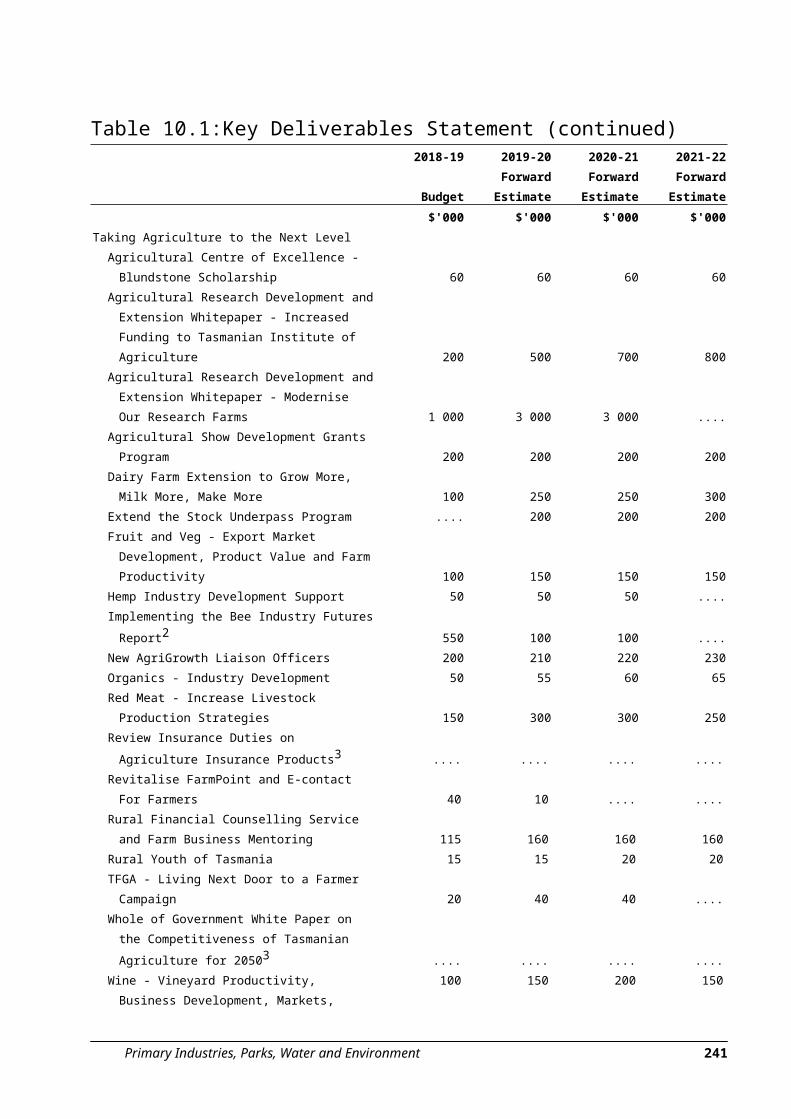
KEY DELIVERABLESTable 10.1 provides a summary of the Budget and Forward Estimate allocations for key deliverables within the Department.
Table 10.1: Key Deliverables Statement2018-19
Budget
2019-20ForwardEstimate
2020-21ForwardEstimate
2021-22ForwardEstimate
$'000 $'000 $'000 $'000
Election CommitmentsAdditional Support for Keep Australia Beautiful 15 15 15 15Bass Strait Islands Biosecurity Officers 90 120 130 140Biosecurity Emergency Response and
Research Fund1 2 478 1 045 1 045 1 045Biosecurity Risk Management and Truck and
Supporting TARfish 150 150 160 160Royal Tasmanian Botanical Gardens - New Visitor Centre 1 000 2 600 .... ....Save the Tasmanian Devil 450 450 450 450ShellMAP Industry Development - the
Revamped Shellfish Quality Assurance and Aquaculture Market Access Program 100 100 100 100
Supporting the Racing IndustryRemove Efficiency Dividend on Tasracing 300 300 300 300Thoroughbred and Harness Racing Breeding
Program 350 350 350 350
238 Primary Industries, Parks, Water and Environment
Primary Industries, Parks, Water and Environment 239
Ben Lomond Ski Patrol 30 30 30 ....Bushfire Management in the Tasmanian
Wilderness World Heritage Area - Bushfire Planning, Migration and Response
500 500 500 ....
Cradle Mountain Visitor Experience 17 650 3 000 .... ....Irrigation - Tranche 2 Increased Investment 10 000 .... .... ....Maria Island Rediscovered 1 080 .... .... ....Orange-bellied Parrot5 2 170 170 170 170Salmonid Aquaculture Regulation6 500 500 500 500Tamar Estuary and Esk Rivers Program 60 60 .... ....Three Capes Track - Stage 3 2 477 .... .... ....Tourism Infrastructure in Parks 4 000 .... .... ....Valuation and Information System of Tasmania
Redevelopment1 200 .... .... ....
Notes:1. The Tasmanian Government was successful in negotiations to secure Australian Government funding
for this initiative. 2. This project contains both capital and recurrent components. 3. This initiative is funded from within the Department’s existing budget allocation.4. These initiatives will be delivered via a grant to the Inland Fisheries Service.5. This project contains both capital and recurrent components. The capital cost will be offset by asset
sale proceeds from the current property at Taroona.6. This activity will be funded by Industry.
Additional Support for Keep Australia BeautifulThis initiative increases the Government support provided to Keep Australia Beautiful (Tasmania) from $30 000 to $45 000 per annum for four years. These additional funds will further support the work of Keep Australia Beautiful (Tasmania) to deliver programs including Tidy Towns, Sustainable Cities, Clean Beaches, School Environment Awards Program and the ongoing management and expansion of the Eco School environment program.
Primary Industries, Parks, Water and Environment 241
Bass Strait Islands Biosecurity OfficersThis initiative boosts biosecurity on Flinders Island and King Island by investing an extra $480 000 over four years. Funding of $225 000 for Flinders Island and $255 000 for King Island will provide for an additional part-time biosecurity officer for each island to support landholders to tackle weeds, pests and other issues affecting agricultural production.
242 Primary Industries, Parks, Water and Environment
Biosecurity Emergency Response and Research FundThe Australian Government has provided $20 million to establish a Biosecurity Emergency Response and Research Fund. The Fund will help meet the costs associated with the current eradication program for Queensland Fruit Fly. The Fund will also support additional operations staff and specialist advisors to work across the State to boost Tasmania’s capacity to respond to future threats from QFF by delivering biosecurity operations and services and assist with understanding future biosecurity and disease risks to Tasmania.
Biosecurity Risk Management and Truck and Machinery WashesRecurrent funding of $510 000 over four years will support Biosecurity Tasmania’s continued collaboration with industry groups and farmers, to plan for and manage post-border biosecurity risks and to support on-farm biosecurity hygiene strategies. This initiative will also provide capital funding of $2 million over four years for a network of truck and machinery wash down stations, delivered in partnerships with farmers, agribusinesses, non-government organisations and local government. The network of wash down stations will contribute to improvements in biosecurity and farm hygiene.
Commercial Fisheries
Extend East Coast Rock Lobster TranslocationThe extension, for a further four years, of funding for the East Coast rock lobster translocation program builds on the success of the existing Government program. The extension works towards achieving the biomass rebuilding strategy for the East Coast rock lobster fishery and will benefit both commercial and recreational fisheries.
Fisheries Integrated Licensing and Management SystemThe Government committed $1.2 million in 2016-17 to fund the ongoing development of the Fisheries Integrated Licensing and Management System to maximize the efficiencies for fisheries management and quota monitoring. This initiative provides a further $5 million over four years to support the transition of the commercial fisheries sector to the digital age. The funding will enable further enhancements to FILMS allowing digital licensing, real time transfer of fisheries data and streamlining of licence and quota management processes.
TSIC Maritime and Policy SupportThis initiative provides $150 000 over three years to assist the Tasmanian Seafood Industry Council to improve safety for the commercial fisheries and marine farming sectors.
Increase Funding for the Institute of Marine and Antarctic StudiesThe Government has committed to increase the level of ongoing funding provided by the State for the world class Institute of Marine and Antarctic Studies, by $1 million, to
Primary Industries, Parks, Water and Environment 243
$14 million over five years from 2019-20. This funding will provide for additional research into the fishing and marine farming industries and ongoing support for the assessment of new and sustainable fisheries opportunities.
Industry Led Abalone Productivity Improvement ProgramFunding of $5.1 million over five years to 2022-23 is provided to establish the Abalone Industry Reinvestment Fund. The Fund will be established by diverting a portion of existing royalties and will provide support for industry-led projects that assist in maintaining and enhancing the sustainability and value of the abalone fishery.
Maintain Funding of the Abalone Industry Development Trust FundThis initiative provides ongoing funding of $200 000 per annum for four years for the Abalone Industry Development Trust Fund. The funding is to be provided to the Tasmanian Abalone Council Ltd to undertake projects to assist with developing new markets, undertaking economic analysis and assisting in maintaining the sustainability of the abalone fishery.
Community Clean UpsA partnership will be developed between EPA Tasmania, Community Corrections and local government to mobilise offenders on Community Service Orders to assist in the removal of rubbish and litter in our parks, reserves and public areas.
Crack-down on Illegal Dumping - Litter ActTasmania has regulatory provisions regarding littering and dumping, but they are not well suited to more significant cases of dumping. This initiative will introduce a new category of offence for the Litter Act 2007, with stricter penalties, commensurate with the offence and the subsequent costs to the community for the proper, responsible disposal of waste.
Environmental Legislation Regulatory Review This initiative will make improvements to the State’s environmental regulatory settings to guarantee proper protection of our environment, while ensuring those proposing projects are clear on the process and their obligations. Legislative amendments will provide a more efficient framework for establishing and maintaining contemporary policy settings. Changes are also being considered to streamline the EPA’s regulatory framework to ensure its assessment, regulatory functions and processes are efficient and remain contemporary, making assessments more straight forward, transparent and timely, while not compromising strong environmental outcomes.
Fallow Deer CensusIn 2018-19 the Department and the new Tasmanian Game Council will work with stakeholders to develop a statewide Fallow Deer Census. This $150 000 initiative will
244 Primary Industries, Parks, Water and Environment
allow commencement of the census which will increase knowledge and understanding of the distribution of deer across Tasmania and those areas vulnerable to their spread, to support better management of deer in Tasmania.
Free Parks Passes for Tasmanian SeniorsIn 2018-19, this initiative will provide Seniors Card holders with free access to 19 national parks across Tasmania, by way of a free parks pass, in recognition that Tasmanian seniors have worked hard and often continue to support the environment through volunteering in many of our parks and reserves. This support will continue in future years by way of a 50 per cent reduction of the concession fee, for Seniors Card holders, for all parks passes across the State.
Growing Our World-Class Inland FisheriesA range of initiatives will be delivered in conjunction with the Inland Fisheries Service to support participation and growth in Tasmania’s trout fishery. The initiatives include:
Anglers Access ProgramFunding of $200 000 from 2019-20 to 2021-22 to expand the Inland Fisheries Service Anglers Access Program across priority lakes and rivers in the North West, North East and Derwent Catchments. This will be delivered in partnership with Anglers Alliance Tasmania and local angling clubs.
Anglers Alliance Tasmania - SupportFunding of $215 000 over four years from 2019-20 is provided to Anglers Alliance Tasmania, the peak group representing 26 000 trout anglers. The funding will support Anglers Alliance Tasmania in its work to improve trout fishery and support anglers.
Cheaper to Go Trout FishingThe cost of inland trout fishing licences will be frozen at 2017-18 prices for the next four years. This initiative will make it cheaper to go trout fishing. Funding of $300 000 will fully offset the revenue the Inland Fisheries Service would have otherwise received.
Marketing Angling TourismFunding of $30 000 is provided in 2018-19 to work with Trout Guides and Lodges Tasmania and Anglers Alliance Tasmania to market and promote angling tourism. This includes the Trout Expo and capitalising on the international profile the World Fly Fishing Championship 2019 will bring to Tasmania’s trout fisheries.
Upgrading Amenities at High Visitation Trout WatersFunding of $300 000 over two years for the Inland Fisheries Services, in collaboration with Anglers Alliance Tasmania and local authorities to build and upgrade existing and new community amenities to support high-visitation fishing locations.
Primary Industries, Parks, Water and Environment 245
Illegal Rubbish Disposal Smartphone AppPart of Safeguarding Tasmania’s unique natural environment is cracking down on illegal dumping. This initiative will provide $100 000 in 2018-19 to enable expansion of the current litter reporting mechanism through the development of a new online application. This application will provide the functionality for location of dumps to be recorded and hot spots identified.
Improved Racing Integrity and Animal Welfare
Greyhound Adoption Grant and Brightside GrantThe Greyhound Adoption Program focusses on finding permanent homes for greyhounds when they retire from racing. This initiative provides $100 000 of funding to the Greyhound Adoption Program in 2018-19 to assist in rehoming efforts. A grant of $30 000 will be provided to Brightside Farm Sanctuary in 2018-19 for veterinary costs associated with preparing greyhounds for adoption.
246 Primary Industries, Parks, Water and Environment
Racing Steward CadetshipsThis initiative provides $550 000 over four years for the employment of two steward cadetship positions. Steward cadets will learn the trade under the direction of highly qualified and experienced stewards and the Director of Racing, and development plans will be put in place to encourage cadets to consider stewarding as a long-term career, with clear future pathways within the Office of Racing Integrity.
Injured and Orphaned Wildlife Program CoordinationThis initiative will create a dedicated wildlife rehabilitation coordinator role in the Department, to coordinate the Injured and Orphaned Wildlife Program across the State.
Investing In Our National Parks and ReservesOur national parks and reserves are attracting increasing numbers of visitors each year and support a range of nature-based tourism operators. To protect our natural assets, future-proof our tourism infrastructure and enhance the parks experience for locals and visitors, around $31 million over four years will be invested in frontline services, improved statewide infrastructure, and boosting maintenance, in addition to the significant existing investment in national parks and reserves. A further $65 million over five years will be invested by the State and Australian Governments into the Cradle Mountain Experience initiative. This investment will be committed through the following initiatives:
Boosting National Parks Rangers and Frontline StaffThis initiative will fund 15 new positions within the Parks and Wildlife Service, to ensure that the services delivered match the growing numbers of domestic and international visitors, and, most importantly, the expectations of local commercial operators and the Tasmanian community.
Cradle Mountain ExperienceThe Government has a vision that will take iconic Cradle Mountain to the next level. The unprecedented investment in the region by the Tasmanian Government of $56.8 million, and Australian Government commitment of $30 million, will align with the Cradle Mountain Experience Master Plan 2016 and build on the popularity of Cradle Mountain as a destination through a new era in visitor experience that elevates the Cradle Mountain visitor experience to one that rivals World Heritage sites around the world. The $35 million commitment over five years by the Tasmanian Government, in addition to the previously allocated $21.8 million, as well as the $30 million Australian Government funding, will: revitalise visitor facilities at the existing “gateway” to Cradle Mountain, outside of
the national park, including a new visitor centre; commercial/retail precinct; car-parking, shuttle bus transit stations and significantly improved visitor facilities;
Primary Industries, Parks, Water and Environment 247
redevelop the existing carpark at the iconic Dove Lake, within the World Heritage Area, and develop a new viewing shelter to create an enhanced visitor experience; and
invest $30 million, matched by the Australian Government’s commitment of $30 million, to facilitate the development of a Cradle Mountain cable-way, ensuring visitors have all-year, all-weather access to Dove Lake.
As part of this commitment, funding of $5 million will support the development of a sensitive and appropriate iconic tourism experience in partnership with the private sector, on Crown Land adjacent to the World Heritage Area.These strategic investments will ensure the visitor experience at Cradle Mountain matches the spectacular natural beauty of the area. It will further build the Tasmanian brand and will increase investment in the Cradle Coast region, boost the visitor economy and create jobs.
Improved Statewide Visitor InfrastructureFunding of $16 million over four years to improve visitor infrastructure across the State will see significant investment in our iconic national parks experiences and heritage assets. Works include, but are not limited to: Maria Island: $4 million to further improve infrastructure and heritage sites; Overland Track: $3 million to renovate public huts on this world famous track; East Coast Camping: $1.5 million to upgrade popular camps including Diana’s basin
campingarea, Humbug Point camping area and camp areas in the wukalina/Mount William National Park;
Tasman National Park Gateway: $1 million to improve facilities such as viewing platforms, tracks, toilets and carparks at key locations such as the Devils Kitchen, Tasman Arch and Fortescue Bay;
Cockle Creek: $800 000 to improve the southern gateway to the Tasmanian Wilderness World Heritage Area;
The Nut: $450 000 to upgrade visitor infrastructure at the Stanley icon; Highfield House: $250 000 for visitor amenity improvements; Ben Lomond National Park: $400 000 to upgrade the shuttle bus car park below
Jacobs Ladder; Sarah Island: $450 000 to improve the visitor experience through track upgrades,
building conservation works and new interpretative signs; Corinna Boat Ramp: $50 000 to remediate damage to the boat ramp caused during
the 2016 floods; and Bond Store: $300 000 to revitalise the historic Bond Store ahead of opening an
expression of interest process for a tourism or community development.
248 Primary Industries, Parks, Water and Environment
National Parks - Maintenance BoostThe Parks and Wildlife Service manages in excess of $1 billion of assets which service visitor needs and experiences within our parks and reserves across the State. Ongoing maintenance of the asset portfolio is a critical part of the work undertaken by the Parks and Wildlife Service. This initiative will provide $8 million over four years to support essential asset repairs and maintenance work to ensure that our parks are safe and presented to a standard that visitors expect.
Primary Industries, Parks, Water and Environment 249
Move 100 DPIPWE Staff to NorthThe North and North West are key contributors to economic growth through primary industries such as agriculture, agribusiness and fisheries. The location of government offices and staff positions in the North and North West should reflect the important contribution these regions make to our economy. An initiative of $1.8 million over four years will facilitate the movement of 100 positions in DPIPWE from Hobart to the North and North West, through staff turnover and voluntary incentive programs. Additional capital funding of $600 000 over two years will support capital works and fit out of Prospect/Mount Pleasant and Stony Rise offices to support the move of the positions to the North and North West.
New Game Council and Game Services TasmaniaThis initiative is to modernise the management of game and browsing animals through a new independent Tasmanian Game Council, and establishment of the new Game Services Tasmania with a primary industries focus. It will provide support to landholders, farmers and hunters to sustainably manage all issues relating to game and browsing animals.
Next Iconic WalkThis initiative will invest up to $20 million over a five year period to deliver Tasmania’s next iconic multi-day, hut-based walk. Feasibility and survey works will be undertaken initially to determine a preferred location for this significant visitor attraction. It is anticipated that construction will commence in 2020-21 following detailed planning, design and approvals.
On-farm Energy and Irrigation AuditsThe On-farm Energy and Irrigation Audit Program of $750 000 over three years from 2018-19 will provide a subsidy to engage qualified professionals to review farm energy use, infrastructure and systems and identify savings strategies. This initiative will be led by the Department of State Growth.
Oyster and Shellfish Real Time Sensor MonitoringThis initiative of $400 000 over four years from 2018-19 is to enhance the real time monitoring sensor network. The program will involve the peak industry body Oysters Tasmania in determining the specifications for a sensor network, managing the acquisition of services and management of the network.
Putting the Land Back Into LandcareThe Landcare movement involves farmers and the community in practical works that sustain our productive soils and farm land, rivers, biodiversity and other natural resources. This new initiative will be delivered through the following initiatives:
250 Primary Industries, Parks, Water and Environment
Double Funding to Landcare TasmaniaAdditional funding of $480 000 will be provided over four years from 2018-19 to the Tasmanian Landcare Association. This doubles the funding to support grass roots Landcare groups to $960 000 over four years.
Landcare Action Fund - Competitive Grants/Cows out of Creeks ProjectA new $2 million Landcare Actions Grants Program over four years from 2018-19 to co-invest with farmers, Landcare and other community organisations on practical, on-ground works for sustainable agriculture and river care. This includes $200 000 for the DairyTas “Cows out of Creeks” project.
Regional Natural Resource Management Groups - Increase Core FundingFunding for Natural Resource Management will be increased to $4.2 million over four years from 2018-19 to enable NRM North, NRM South and Cradle Coast NRM to coordinate involvement in Landcare programs.
Raptor Refuge Reporting HotlineThe Raptor Refuge looks after injured Tasmanian birds of prey. It relies on volunteers for bird rehabilitation and on members of the public to report injured animals. This initiative provides $7 000 per annum for four years from 2018-19 to establish and run a dedicated telephone hotline for reporting of injured birds.
Recreational FisheriesThis group of initiatives will support recreational fisheries.
Improve Catch Opportunities - Fish Aggregation DevicesThis initiative will provide $450 000 over four years from 2018-19 to enable the purchase and installation of four new Fish Aggregation Devices. FADs are man-made devices that are tethered to the sea bed and are used to attract a wide variety of fish, providing a new fishing option for recreational fishers and charter operators. This initiative will be led by Marine and Safety Tasmania.
Recreational Fishing - Improved Boat and Trailer ParkingImprovements to parking facilities at a number of key locations for recreational fishing will be provided over three years from 2018-19. In conjunction with local councils, the Government will provide $2.2 million for upgrades to current parking facilities at key boat ramps and look to develop overflow parking opportunities for these sites. This initiative will be led by Marine and Safety Tasmania.
Supporting TARFishIn the 2017-18 Budget, $146 000 was provided in 2017-18 to the Tasmanian Association of Recreational Fishing Inc, the State’s peak body representing recreational marine fishers. This funding is to ensure the body has the capacity to deliver services to its members and the Government. Building on this, $620 000 in
Primary Industries, Parks, Water and Environment 251
additional funding will be provided over the next four years from 2018-19 to TARFish to ensure its ongoing viability, and improved provision of services to recreational fishers and the Government.
Royal Tasmanian Botanical Gardens - New Visitor CentreThis initiative of $1 million in 2018-19, and a further $2.6 million in 2019-20, will contribute to the construction of a new visitor centre at the Royal Tasmanian Botanical Gardens.
Save the Tasmanian DevilThis initiative of $450 000 per annum over four years from 2018-19 will ensure the delivery and evolution of the Save the Tasmanian Devil Program into the future, including building on the success of the Wild Devil Recovery trials.
ShellMAP Industry Development - the Revamped Shellfish Quality Assurance and Aquaculture Market Access ProgramThe Department will partner with the oyster and shellfish industry to coordinate industry development under the ShellMAP program. Funding of $400 000 over four years from 2018-19 will enable projects, proposed by Oysters Tasmania, that improve the capacity of the oyster industry to manage market access programs.
Supporting the Racing Industry
Remove Efficiency Dividend on TasracingThe Government has removed the efficiency dividend imposed on Tasracing, with an additional $300 000 per annum in funding from 2018-19 enabling Tasracing to further invest in and grow the racing industry.
Thoroughbred and Harness Racing Breeding ProgramFunding of $350 000 per annum over five years from 2018-19 is provided for a grant for thoroughbred and harness breeding programs to further strengthen the Tasmanian racing industry. This grant will provide incentive to increase breeding of racehorses in Tasmania, creating new jobs within breeding, racing and associated primary industries and increasing Tasmania’s presence in the national breeding market.
Taking Agriculture to the Next Level
Agricultural Centre of Excellence - Blundstone Scholarship The contribution to the Blundstone Scholarship of $60 000 per annum over six years from 2018-19 will assist students who would not otherwise access higher education, undertake an Associate Degree in Agribusiness at the University of Tasmania.
252 Primary Industries, Parks, Water and Environment
Agricultural Research Development and Extension Whitepaper - Increased Funding to Tasmanian Institute of Agriculture The Tasmanian Government’s additional contribution to the Tasmanian Institute of Agriculture of $3 million over five years from 2018-19 takes the total investment to $28 million. The increased funding will support the establishment of a new Agricultural Innovation Fund for specific industry-aligned priority research programs.
Agricultural Research Development and Extension Whitepaper - Modernise Our Research Farms This initiative provides $7 million over three years from 2018-19 to modernise Crown and TIA research farm assets and make our research farms the centre of excellence for practical research and demonstration.
Agricultural Show Development Grants ProgramFunding of $1 million over five years from 2018-19 will support an Agricultural Show Development Grants Program to enable rural and regional show societies, across Tasmania, to upgrade vital community infrastructure.
Dairy Farm Extension to Grow More, Milk More, Make More Funding of $900 000 over four years from 2018-19 has been provided for a dairy farm extension “grow more, milk more, make more” initiative, to work with dairy farmers. Areas of focus will be productivity, farm business and value-adding strategies to continue to grow production, improve farm profitability and meet processing and market demand for our milk and branded dairy products. This initiative will be co-managed by the Department of State Growth.
Extend the Stock Underpass ProgramAn additional $600 000 has been provided over three years commencing in 2019-20 to offset the costs associated with stock underpass infrastructure, improving farm and road safety and increasing farm efficiency. In addition to existing funding of $500 000 in the 2017-18 Budget for 2018-19, this brings the total initiative funding to $1.1 million over four years.
Fruit and Veg - Export Market Development, Product Value and Farm ProductivityA horticulture market and trade development initiative will provide $550 000 over four years from 2018-19 to work with fruit and vegetable growers and agribusiness. The initiative will exploit new collaborative market and export opportunities, drive increased trade, product value and farm productivity. This initiative will be co-managed by the Department of State Growth.
Primary Industries, Parks, Water and Environment 253
Hemp Industry Development SupportAn initiative of $150 000 over three years will support the Hemp Association of Tasmania with grower communications, product development, marketing and branding to support exponential growth in the hemp industry.
Implementing the Bee Industry Futures ReportFunding of $750 000 over three years from 2018-19 has been made to work closely with bee keepers and crop pollinators to implement the Government Bee Industry Futures Report. This initiative will focus on resource access, biosecurity, hive productivity, and crop pollination resilience. This commitment includes $500 000 for selected infrastructure upgrades to improve resource access.
New AgriGrowth Liaison OfficersAn additional two AgriGrowth Liaison Officers based in the North, combined with a new primary producers hotline, will provide easier access and a single contact point for primary producers. Funding of $860 000 over four years from 2018-19 will enable this initiative.
Organics - Industry DevelopmentThis initiative provides $230 000 over four years from 2018-19 to work with organic accrediting bodies and assist farmers, producers, and agri-food businesses, interested in transitioning to organic production methods with certification and market development.
Red Meat - Increase Livestock Production StrategiesAn initiative of $1 million over four years from 2018-19 to work with farmers and processors to increase trade, marketing, value and sales of Tasmanian red meat. This will complement practical strategies to increase local livestock production and throughput via effective pasture and grazing management, seasonal supply strategies, disease prevention, herd development and quality assurance.
Review Insurance Duties on Agriculture Insurance ProductsA review of agricultural insurance products utilised by farmers, including any impediments, to manage risks from natural events such as drought, floods, hail and fire will be undertaken. The final scope will be determined in consultation with the Tasmanian Farmers and Growers Association, farmers and insurance industry.
Revitalise FarmPoint and E-contact For FarmersThe FarmPoint website will be modernised and connected with contemporary social media platforms to become the e-contact point for primary producers through funding provision of $50 000 over two years from 2018-19.
254 Primary Industries, Parks, Water and Environment
Rural Financial Counselling Service and Farm Business MentoringAn additional $595 000 has been provided over four years from 2018-19 for Rural Financial Counselling Services and Farm Business Mentoring delivered by Rural Business Tasmania. RBT supports Tasmanian farmers with business skills, financial literacy, planning and debt mediation.
Rural Youth of TasmaniaRural Youth Tasmania develops young people in rural industries leadership programs. This commitment of $70 000 over four years from 2018-19 will enable their future work.
TFGA - Living Next Door to a Farmer CampaignThe TFGA will be provided with $100 000 over three years from 2018-19 towards a “living next door to a farmer” Campaign. This Campaign will support the TFGA to work with farmers, the real estate industry and local government to support good neighbourly relations, especially where farmland adjoins existing or new urban and peri-urban developments.
Whole of Government White Paper on the Competitiveness of Tasmanian Agriculture for 2050In consultation with farmers and agribusiness, the whole of government White Paper will consider policy improvements to address key issues impacting the cost of production, investment and the profitability of farmers and agribusiness.
Wine - Vineyard Productivity, Business Development, Markets, BrandingA wine market development and tourism initiative of $600 000 over four years from 2018-19 is designed to drive the value and reputation of Tasmanian wine. This funding will also help with industry initiatives in vineyard productivity research and winery small business skills support. The initiative will be co-managed by the Department of State Growth.
Women in AgricultureThis initiative provides $120 000 over four years from 2018-19 to Women in Agriculture to build capacity for more rural women to take leadership roles in Tasmanian primary industries.
Tasmanian Rural Water StrategyTo support the next phase of water development, a new Tasmanian Rural Water Strategy will guide our future water management arrangements; ensure integrated, fair and efficient water administration and compliance; deliver water security for farmers and irrigators; and manage our water assets to achieve sustainable outcomes in a changing climate for agricultural growth, the environment and rural communities.
Primary Industries, Parks, Water and Environment 255
Weeds Action FundA new Weed Action Fund of $5 million over five years from 2018-19 will be invested with farmers, Landcare and other community organisations to tackle weeds that are impacting on valuable agricultural and environmental assets. A Tasmanian Weed Advocate will be established to work in partnership with the Department to identify the strategic on-ground priorities across land tenures and coordinate the WAF.
Other Initiatives Other ongoing 2017-18 Budget Deliverables, identified in Table 10.1 and described in the 2017-18 Budget, will continue to be delivered concurrently with the 2018-19 Key Deliverables.
256 Primary Industries, Parks, Water and Environment
OUTPUT INFORMATIONOutputs of the Department of Primary Industries, Parks, Water and Environment are provided under the following Output Groups:Output Group 1 - Land Tasmania;Output Group 2 - Primary Industries;Output Group 3 - Natural and Cultural Heritage;Output Group 4 - Water Resources;Output Group 5 - Racing Regulation and Policy;Output Group 6 - Biosecurity Tasmania;Output Group 7 - Environment Protection and Analytical Services; andOutput Group 8 - Parks and Wildlife Management.Table 10.2 provides an Output Group Expense Summary for the Department of Primary Industries, Parks, Water and Environment.
Table 10.2: Output Group Expense Summary12017-18 2018-19 2019-20 2020-21 2021-22
Notes:1. Agency estimates do not include the indexation impact of any variations to agency expenditure that
have been made since the finalisation of the Revised Estimates Report 2017-18 (including December Quarterly Report). For further information see chapter 1 of this Budget Paper.
2. The increase in AgriGrowth Tasmania in 2018-19 reflects additional funding received primarily due to the Taking Agriculture to the Next Level initiatives and the transfer of Game Services Tasmania from Output Group 3.1 Resource Management and Conservation. The increase in 2019-20 reflects additional funding received for the Taking Agriculture to the Next Level initiatives. The decrease in 2021-22 reflects a reduction in funding for the Agri-food Plan.
3. The increase in Marine Resources in 2018-19 reflects additional funding received for the Industry Led Abalone Productivity Improvement Program and to Maintain Funding of the Abalone Industry Development Trust Fund.
4. The decrease in Resource Management and Conservation in 2018-19 reflects the cessation of the Acute Riparian Recovery Program, the Agri-food Plan Agricultural Landscapes Rehabilitation Scheme and the transfer of Game Services Tasmania to Output Group 2.1 AgriGrowth Tasmania. This is partially offset by additional funding received for the Regional Natural Resource Management Groups - Increase Core Funding and Landcare Action Fund - Competitive Grants and Double Funding to Landcare Tasmania initiatives.
5. The Australian Government has committed $25.5 million over five years from 2018-19 to contribute to the management of the Tasmanian Wilderness World Heritage Area from 2018-19. The new Funding Agreement will incorporate the existing baseline funding allocation (reflected in the current Forward Estimates) and additional TWWHA extension funding (not reflected in the Forward Estimates), totalling $25.5 million over five years.
Primary Industries, Parks, Water and Environment 259
6. The increase in Biosecurity in 2018-19 primarily reflects additional Australian Government funding received for the Biosecurity Emergency Response and Research Fund. The decrease in 2019-20 primarily reflects a partial reduction in funding for activities supported by the Biosecurity Emergency Response and Research Fund and reduced funding for the Pilchard Orthomyxovirus vaccine for Salmonids, partially offset by additional funding received for the Weeds Action Fund initiative.
7. The increase in Product Integrity in 2018-19 reflects additional funding for Oyster and Shellfish Real Time Sensor Monitoring, ShellMAP Industry Development, and a reassessment of overhead costs to better reflect the provision of expenditure for the Output.
8. The decrease in Aboriginal Heritage in 2018-19 reflects a reduction in Australian Government project funding for the Management of the TWWHA (refer to note 5). The impacts of the new TWWHA funding agreement is not reflected in the 2018-19 Budget and Forward Estimates for this Output.
9. The decrease in Historic Heritage Services in 2018-19 reflects the cessation of funding for the Development of the Woolmers Estate Visitor Centre initiative.
10. The increase in Royal Tasmanian Botanical Gardens in 2018-19 and 2019-20 reflects additional funding for a new visitor centre. The decrease in 2020-21 reflects the cessation of this funding.
11. The movements in Environmental Management and Pollution Control across the Forward Estimates reflect revised cash flows for the Nyrstar Ground Water Management Strategy.
12. The increase in Analytical Services in 2018-19 reflects additional Bio-toxin testing for the ShellMAP program.
13. The increase in Parks and Wildlife Management in 2018-19 reflects additional funding received for the Boosting National Parks Rangers and Frontline Staff initiative, and increased revenue to support the ongoing management of the State’s national parks. The decrease in 2019-20 reflects a reduction in funding for the current funding agreement with the Australian Government for Three Capes Track Stage 3 and the Management of the TWWHA (refer to note 5).
14. The increase in Racing Regulation and Policy in 2018-19 reflects additional funding received for the Thoroughbred and Harness Racing Breeding Program, Racing Steward Cadetships, Greyhound Adoption Grant and Brightside Grant.
Output Group 1: Land Tasmania1.1 Land Titles, Survey and Mapping ServicesThis Output provides a secure land titling system; an effective policy and legislative framework for land administration; and services that underpin land management and support the development of Tasmania’s spatial data infrastructure. This Output also produces, maintains and integrates a wide range of land information data sets, which are easily accessible through the Land Information System Tasmania web interface and TASMAP products.
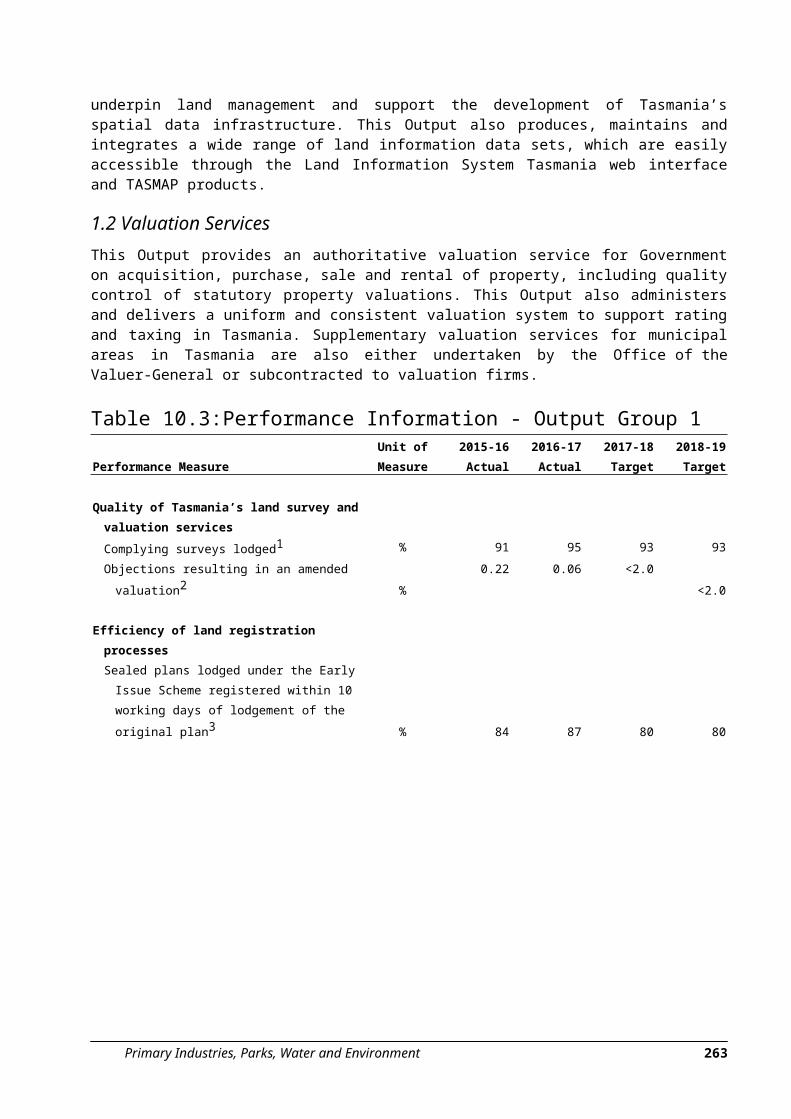
1.2 Valuation ServicesThis Output provides an authoritative valuation service for Government on acquisition, purchase, sale and rental of property, including quality control of statutory property valuations. This Output also administers and delivers a uniform and consistent valuation system to support rating and taxing in Tasmania. Supplementary valuation services for municipal areas in Tasmania are also either undertaken by the Office of the Valuer-General or subcontracted to valuation firms.
Table 10.3: Performance Information - Output Group 1
Performance MeasureUnit of
Measure2015-16
Actual2016-17
Actual2017-18
Target2018-19
Target
Quality of Tasmania’s land survey and valuation services
260 Primary Industries, Parks, Water and Environment
Performance MeasureUnit of
Measure2015-16
Actual2016-17
Actual2017-18
Target2018-19
Target
Complying surveys lodged1 % 91 95 93 93Objections resulting in an amended
valuation2 %0.22 0.06 <2.0
<2.0
Efficiency of land registration processesSealed plans lodged under the Early Issue
Scheme registered within 10 working days of lodgement of the original plan3 % 84 87 80 80
Primary Industries, Parks, Water and Environment 261
Table 10.3: Performance Information - Output Group 1 (continued)
Performance MeasureUnit of
Measure2015-16
Actual2016-17
Actual2017-18
Target2018-19
Target
Accessibility of quality land information to support decision making
Number of land related data sets available via the LIST4
Number of data sets 1 201 1 620 1 600 2 100
Number of land related data sets available under open data provisions5
Number of data sets 61 73 75 140
Level of government, industry and public use of LIST web service6
Number of requests (million) 457 745 650 840
Level of government, industry and public use of LIST website7
Number of sessions (million) 1.75 1.96 1.95 2.3
Notes:1. This performance measure was introduced in 2015-16 following revisions of the Surveyors Act 2002
and Surveyors Regulations 2014 that enabled the Surveyor-General to implement a targeted audit program.
2. This performance measure represents the percentage of total valuation notices issued in a financial year that have an amended valuation following the lodgement of an objection. It reflects the quality and consistency of valuations completed.
3. Sealed plans lodged under the Early Issue Scheme are examined before plans not lodged under that Scheme.
4. This measure reflects the number of layers available via LISTmap and includes layers secured and accessible by specific clients such as emergency service organisations.
5. Open data refers to data that is easily discoverable and usable by anyone, under the least restrictive and easy-to-understand use conditions. Land Tasmania wherever possible will also release such data at no cost in many formats via the LIST infrastructure.
6. This measure captures the volume of client transactions to the LIST web services.7. This measure captures the volume of client web sessions (i.e. numbers of times they access the LIST
website and its components) using standard web browsers.
Output Group 2: Primary Industries2.1 AgriGrowth TasmaniaThis Output supports the Government’s commitment to grow the value of the agricultural sector in Tasmania tenfold to $10 billion by 2050. It oversees the delivery of Cultivating Prosperity in Agriculture and Tasmania’s Sustainable Agri-Food Plan 2016-18. The majority of the agricultural research, development and extension services delivered via the Tasmanian Institute of Agriculture are reflected in this Output. It also includes Game Services Tasmania, which has been established to support landholders, farmers and hunters to effectively manage game and browsing animal issues relating to the hunting and primary industry sectors.
262 Primary Industries, Parks, Water and Environment
2.2 Marine ResourcesThis Output supports the orderly and sustainable development and management of the Tasmanian marine farming industry and develops and implements management policies and plans for Tasmania’s wild fisheries to ensure that both commercial and recreational fishing are sustainable. This Output also includes advice and direction to the Institute for Marine and Antarctic Studies to assist aquaculture and fisheries research.
2.3 Supervision of Poppy and Industrial Hemp CropsThis Output aims to maintain a securely regulated poppy industry through responsibility for the licensing, inspection, supervision and management of the poppy industry.This Output ensures that the cultivation of poppy crops is performed in accordance with the Poisons Act 1971, ensuring policy coordination and preparation of advice to the Government, liaison with private enterprise, government agencies, growers and other stakeholder bodies. The Output is also responsible for ensuring the licensing, inspection and testing of all industrial hemp crops is undertaken in accordance with the Industrial Hemp Act 2015 and Regulations.
Table 10.4: Performance Information - Output Group 2
Performance MeasureUnit of
Measure2015-16
Actual2016-17
Actual2017-18
Target2018-19
Target
Value of primary industries sectorGross value of agricultural and fish
productionWild fisheries1 $ million 180.7 175.9 175 175Aquaculture2 $ million 730.7 760.7 762 863.7Agriculture3 $ million 1 484.9 na 1 587 1 681
Food production value added4 $ million 4 078.7 na 4 350 4 600Exports of food, agriculture and fisheries
Overseas exports5 $ million 686.8 na 680 700Interstate food trade6 $ million 2 498.6 na 2 700 2 800
Efficiency of fishers' licensing processes
Fishers' licensing transaction times% completed in 3 working
days 97 97 95 95
External funds leveraged from Government investment in primary industries research7 External funds received by TIA8 $ million 8.2 7.1 8.0 8.0
Primary Industries, Parks, Water and Environment 263
Performance MeasureUnit of
Measure2015-16
Actual2016-17
Actual2017-18
Target2018-19
Target
External funds received by IMAS-SMRCA9 $ million 7.6 4.1 3.5 3.5
Accessibility of information to support farmers to run their businessesLinks to external websites provided via the
FarmPoint website10 Number 760 760 760 760Level of public use of FarmPoint11 Pages '000 75 56 55 55
Supervision of Poppy and Hemp Crops
Cost of Poppy Advisory Control Board per licence issued12 $ 857 1 021 1 037 1 229
264 Primary Industries, Parks, Water and Environment
Table 10.4: Performance Information - Output Group 2 (continued)
Performance MeasureUnit of
Measure2015-16
Actual2016-17
Actual2017-18
Target2018-19
Target
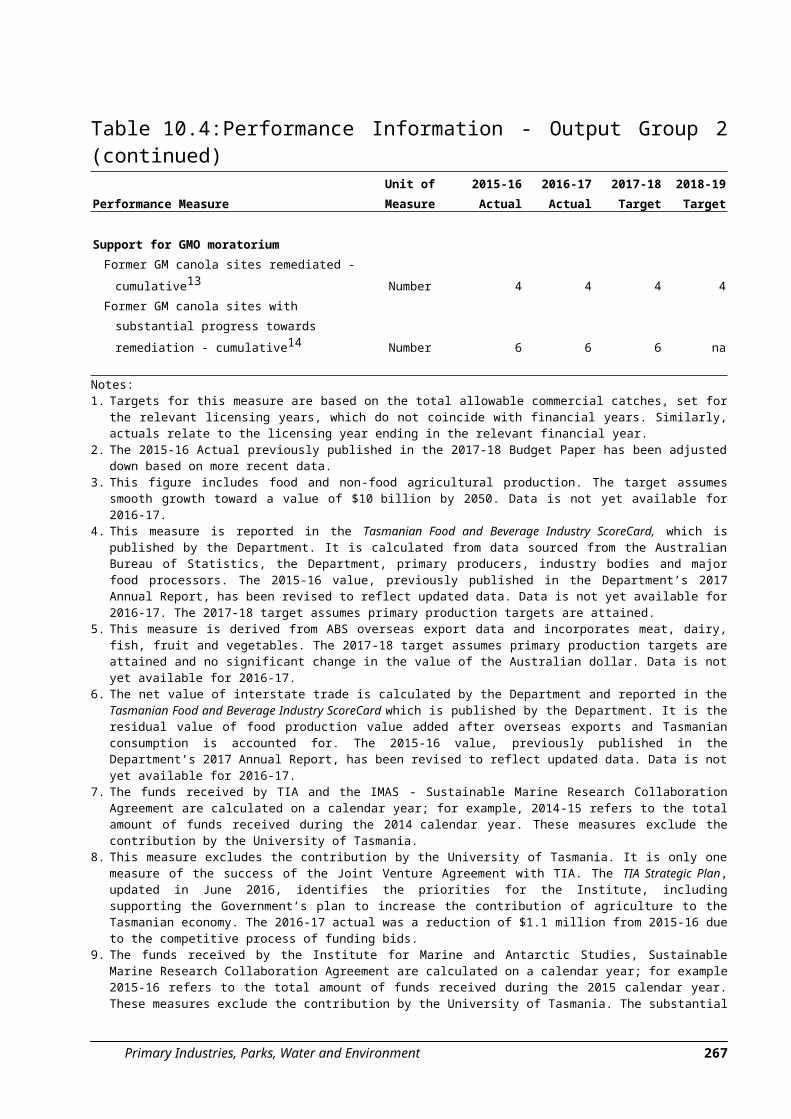
Support for GMO moratoriumFormer GM canola sites remediated -
cumulative13 Number 4 4 4 4Former GM canola sites with substantial
progress towards remediation - cumulative14 Number 6 6 6 na
Notes:1. Targets for this measure are based on the total allowable commercial catches, set for the relevant
licensing years, which do not coincide with financial years. Similarly, actuals relate to the licensing year ending in the relevant financial year.
2. The 2015-16 Actual previously published in the 2017-18 Budget Paper has been adjusted down based on more recent data.
3. This figure includes food and non-food agricultural production. The target assumes smooth growth toward a value of $10 billion by 2050. Data is not yet available for 2016-17.
4. This measure is reported in the Tasmanian Food and Beverage Industry ScoreCard, which is published by the Department. It is calculated from data sourced from the Australian Bureau of Statistics, the Department, primary producers, industry bodies and major food processors. The 2015-16 value, previously published in the Department’s 2017 Annual Report, has been revised to reflect updated data. Data is not yet available for 2016-17. The 2017-18 target assumes primary production targets are attained.
5. This measure is derived from ABS overseas export data and incorporates meat, dairy, fish, fruit and vegetables. The 2017-18 target assumes primary production targets are attained and no significant change in the value of the Australian dollar. Data is not yet available for 2016-17.
6. The net value of interstate trade is calculated by the Department and reported in the Tasmanian Food and Beverage Industry ScoreCard which is published by the Department. It is the residual value of food production value added after overseas exports and Tasmanian consumption is accounted for. The 2015-16 value, previously published in the Department’s 2017 Annual Report, has been revised to reflect updated data. Data is not yet available for 2016-17.
7. The funds received by TIA and the IMAS - Sustainable Marine Research Collaboration Agreement are calculated on a calendar year; for example, 2014-15 refers to the total amount of funds received during the 2014 calendar year. These measures exclude the contribution by the University of Tasmania.
8. This measure excludes the contribution by the University of Tasmania. It is only one measure of the success of the Joint Venture Agreement with TIA. The TIA Strategic Plan, updated in June 2016, identifies the priorities for the Institute, including supporting the Government’s plan to increase the contribution of agriculture to the Tasmanian economy. The 2016-17 actual was a reduction of $1.1 million from 2015-16 due to the competitive process of funding bids.
9. The funds received by the Institute for Marine and Antarctic Studies, Sustainable Marine Research Collaboration Agreement are calculated on a calendar year; for example 2015-16 refers to the total amount of funds received during the 2015 calendar year. These measures exclude the contribution by the University of Tasmania. The substantial reduction in 2016-17 resulted from the early withdrawal of the commercial partner’s funding in the Rock Lobster Aquaculture Hub. The targets reflect this impact. IMAS is currently seeking replacement funding from prospective partners. The reduction has no significant implications for the major commercial or recreational fisheries in Tasmania.
10. The FarmPoint website provides easy access to information required by farmers to run their business. A Project to modernise the FarmPoint website is scheduled for 2018-19.
11. The 2016-17 actual figure shows a decline in page hits from the previous year, but this is unlikely to reflect an actual decline in the use of FarmPoint information. There is now considerable overlap in content between the DPIPWE website and the FarmPoint site. Data shows hits on the equivalent DPIPWE pages have risen substantially while hits on FarmPoint have fallen. It is likely this adjustment in use will continue and the targets for this measure reflect this. The Project to modernise the FarmPoint website is expected to increase the level of use in future years.
Primary Industries, Parks, Water and Environment 265
12. The increase in the indicator in 2016-17 is primarily the result of a reduction in the number of licences issued to grow poppies in Tasmania in response to reduced global demand. Poppy cultivation licences are no longer issued annually, but rather for a period of up to five years. For this reason and to ensure consistency in reporting of this measure to date, the target for 2018-19 has been derived from the number of active poppy cultivation licences under issue during the 2017-18 season (450 licences issued of which 387 were active).
13. An audit program of former GM canola trial sites was implemented to monitor compliance with permits for the sites and assess them for release from management. Remediated sites are those that have been released, as monitoring evidence suggested that each could be considered clear of canola. Figures are cumulative, i.e. the total number of remediated sites as at the end of the financial year. After nearly 20 years in operation, a review of the audit program is underway with the aim of moving to a risk-based model.
14. All GM canola trial sites have been regularly audited in 2017-18 and no volunteer GM canola plants have been detected. The review of the audit program (see note 13) will lead to development of a more appropriate and useful performance measure to apply from 2018-19. Under the current program, substantial progress towards remediation requires demonstration that there has been no germination after two soil disturbances within 12 months and at least six months apart. This has proven inconsistent with contemporary farming practices and is no longer considered to provide helpful information.
Output Group 3: Natural and Cultural Heritage3.1 Resource Management and ConservationThis Output provides for the conservation and sustainable use of Tasmania’s natural values and land resources. The Output manages the State’s terrestrial and marine natural values to ensure their sustainable use and conservation.
3.2 Historic Heritage ServicesThis Output aims to recognise, protect and ensure the sound statutory management of places of State historic cultural heritage or significance to the whole of Tasmania; facilitate their sustainable use, development and adaptive reuse; foster understanding of its importance to local communities and the visitor economy; and assist local government to manage places and precincts of local significance.
3.3 Aboriginal HeritageThis Output aims to protect, conserve and promote Tasmania’s unique Aboriginal heritage. It seeks to increase community understanding and valuing of Aboriginal heritage by providing training, education and interpretation materials. The Output supports organisations and individuals in fulfilling their responsibilities, both culturally and environmentally. Aboriginal Heritage Tasmania provides administrative support to the Minister’s advisory body, the Aboriginal Heritage Council. The Cultural Management Group established within Aboriginal Heritage Tasmania oversees implementation of the cultural aspects of the Tasmanian Wilderness World Heritage Area Management Plan 2016.
3.4 Royal Tasmanian Botanical GardensThis Output represents the Government’s contribution towards the operation of the Gardens and supports the management, conservation and enhancement of the Gardens in accordance with the Royal Tasmanian Botanical Gardens Act 2002.
266 Primary Industries, Parks, Water and Environment
Further information on the Royal Tasmanian Botanical Gardens is provided in chapter 24 of this Budget Paper.
3.5 Threatened SpeciesThis Output provides for the management and protection of threatened species and whales. The Output aims to ensure that threatened species are protected and retained in the wild and to prevent further species becoming threatened.
Primary Industries, Parks, Water and Environment 267
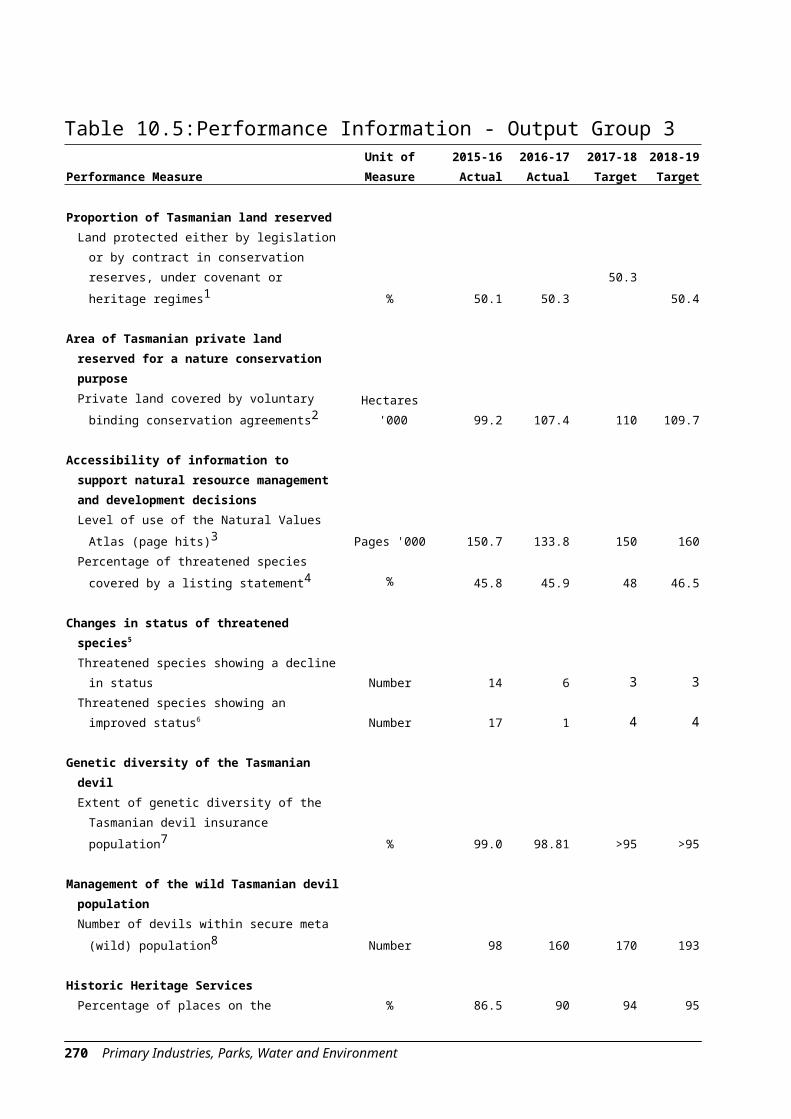
Table 10.5: Performance Information - Output Group 3
Performance MeasureUnit of
Measure2015-16
Actual2016-17
Actual2017-18
Target2018-19
Target
Proportion of Tasmanian land reservedLand protected either by legislation or by
contract in conservation reserves, under covenant or heritage regimes1 % 50.1 50.3 50.3 50.4
Area of Tasmanian private land reserved for a nature conservation purposePrivate land covered by voluntary binding
conservation agreements2Hectares
'000 99.2 107.4 110 109.7
Accessibility of information to support natural resource management and development decisionsLevel of use of the Natural Values Atlas
(page hits)3 Pages '000 150.7 133.8 150 160Percentage of threatened species covered
by a listing statement4 % 45.8 45.9 48 46.5
Changes in status of threatened species5
Threatened species showing a decline in status Number 14 6 3 3
Threatened species showing an improved status6 Number 17 1 4 4
Genetic diversity of the Tasmanian devilExtent of genetic diversity of the
Management of the wild Tasmanian devil populationNumber of devils within secure meta (wild)
population8 Number 98 160 170 193
Historic Heritage Services Percentage of places on the Tasmanian
Heritage Register likely to meet at least one registration criterion % 86.5 90 94 95
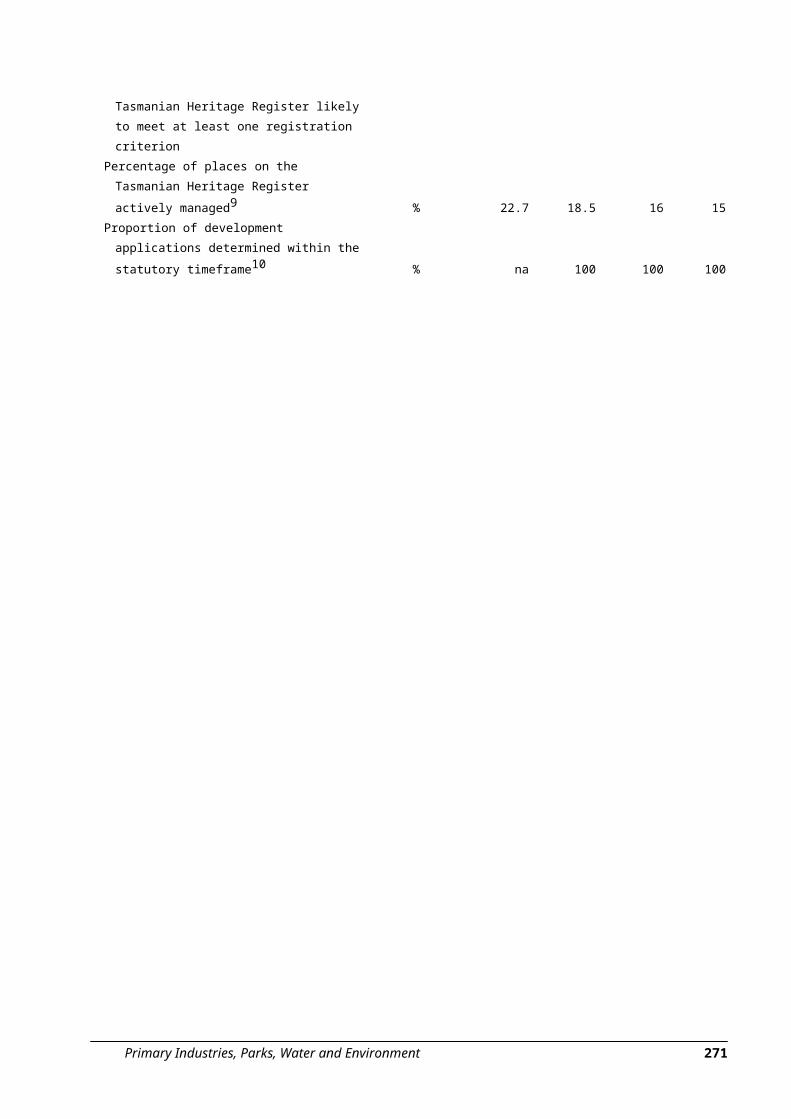
Percentage of places on the Tasmanian Heritage Register actively managed9 % 22.7 18.5 16 15
Proportion of development applications % na 100 100 100
268 Primary Industries, Parks, Water and Environment
determined within the statutory timeframe10
Primary Industries, Parks, Water and Environment 269
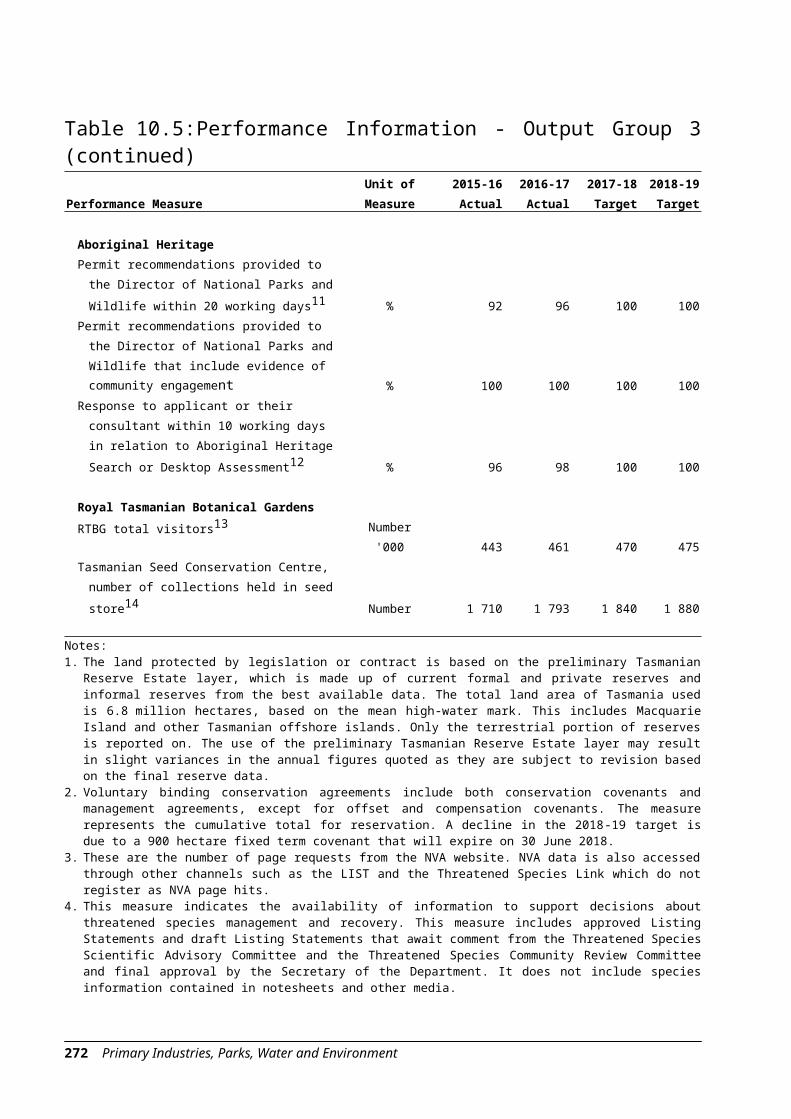
Table 10.5: Performance Information - Output Group 3 (continued)
Performance MeasureUnit of
Measure2015-16
Actual2016-17
Actual2017-18
Target2018-19
Target
Aboriginal HeritagePermit recommendations provided to the
Director of National Parks and Wildlife within 20 working days11 % 92 96 100 100
Permit recommendations provided to the Director of National Parks and Wildlife that include evidence of community engagement % 100 100 100 100
Response to applicant or their consultant within 10 working days in relation to Aboriginal Heritage Search or Desktop Assessment12 % 96 98 100 100
Royal Tasmanian Botanical Gardens RTBG total visitors13 Number
'000 443 461 470 475Tasmanian Seed Conservation Centre,
number of collections held in seed store14 Number 1 710 1 793 1 840 1 880
Notes:1. The land protected by legislation or contract is based on the preliminary Tasmanian Reserve Estate
layer, which is made up of current formal and private reserves and informal reserves from the best available data. The total land area of Tasmania used is 6.8 million hectares, based on the mean high-water mark. This includes Macquarie Island and other Tasmanian offshore islands. Only the terrestrial portion of reserves is reported on. The use of the preliminary Tasmanian Reserve Estate layer may result in slight variances in the annual figures quoted as they are subject to revision based on the final reserve data.
2. Voluntary binding conservation agreements include both conservation covenants and management agreements, except for offset and compensation covenants. The measure represents the cumulative total for reservation. A decline in the 2018-19 target is due to a 900 hectare fixed term covenant that will expire on 30 June 2018.
3. These are the number of page requests from the NVA website. NVA data is also accessed through other channels such as the LIST and the Threatened Species Link which do not register as NVA page hits.
4. This measure indicates the availability of information to support decisions about threatened species management and recovery. This measure includes approved Listing Statements and draft Listing Statements that await comment from the Threatened Species Scientific Advisory Committee and the Threatened Species Community Review Committee and final approval by the Secretary of the Department. It does not include species information contained in notesheets and other media.
5. Changing the status of threatened species requires the completion of the formal process detailed in the Threatened Species Protection Act 1995. In 2015-16, a number of listing processes begun in 2013-14 and 2014-15 were completed. This, combined with a series of taxonomic changes resulted in a relatively high number of changes in threatened species status during the period.
6. The formal process to improve the status for several threatened species was not concluded in 2016-17. These species were carried over into the following year and therefore the target for 2017-18 has been increased to reflect this. The original target of 1 was reported in the 2017-18 Budget.
270 Primary Industries, Parks, Water and Environment
7. This measure is aimed at assessing the extent of genetic variation within the devil insurance population. Maintaining 95 per cent genetic diversity is considered desirable to minimise the likelihood of inbreeding within the population and to ensure that animals remain fit for release at a later date, as and if required. The assessment is undertaken on an annual basis following the breeding season. It examines the genetic characteristics of the insurance population compared with the founder insurance animals. Note that the genetic diversity of the founder population does not currently reflect that of the wild population. This will be rectified via fresh founder intake planned over the next four years. The actual figures are sourced from the Zoo and Aquarium Association’s Annual Reports.
8. This performance measure provides information on the progress of establishing wild populations that are free from the devil facial tumour disease. The number of Tasmanian devils in the secure wild populations in 2015-16 relates to the population established on Maria Island. A new population was established on the Tasman and Forestier Peninsulas in 2015-16 and current targets and actuals include this. The figures are the best estimate from within a statistical range and include Tasman (35), Forestier (35) and Maria (103). Note that 33 devils were removed from Maria Island during 2016-17 and six were added to increase genetic diversity. The target for 2018-19 is based on an anticipated increase of the Forestier population by 20 devils.
9. This measure reflects the percentage of places on the Heritage Register for which Heritage Tasmania has had an active role in management. These are places where a statutory decision was made in the registration or works areas or where a grant is being managed by Heritage Tasmania.
10. This performance measure tracks the Tasmanian Heritage Council’s ability to determine a discretionary permit application within the 35 or 49 day timeframes prescribed in the Historic Cultural Heritage Act 1995.
11. The Department provides permit advice directly to the Director of National Parks and Wildlife for consideration by the Minister in accordance with the Aboriginal Heritage Act 1975.
12. This measure reports on Aboriginal Heritage Tasmania response time for providing relevant Aboriginal heritage site information to the applicant or their consultant prior to any field investigations, or providing determinations regarding the need for an Aboriginal heritage assessment. The Desktop Assessment is now referred to as the Desktop Review.
13. Visitation to the Gardens grew more than projected for 2016-17, corresponding to a general increase in tourism to Tasmania. This trend is expected to continue and therefore the target for 2017-18 has been increased from 450 000 to 470 000. The original 450 000 target was published in the 2017-18 Budget.
14. A collection is defined as a quantity of seeds collected for a particular species, from a particular location, in a particular year. The data records viable seed collections held in the seed store each year. Collections found to be non-viable or used up for conservation programs or research purposes are routinely removed from the collections list.
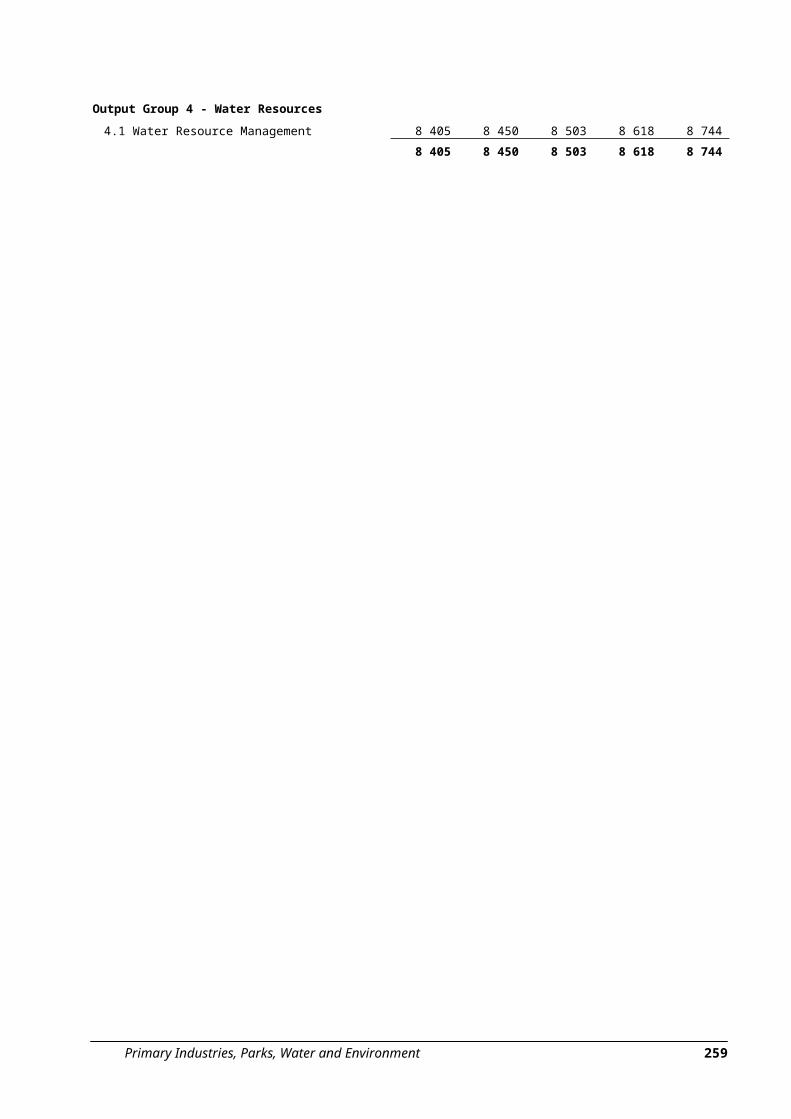
Output Group 4: Water Resources4.1 Water Resource ManagementThis Output develops and implements a range of legislation and policies for water management to ensure the equitable, efficient and sustainable allocation and use of surface and ground-water resources and the safety of dams. It supports the development and coordination of policies relating to the regulation of the urban water and sewerage industry. It also provides services to assess, monitor, report and provide advice on the health, condition and state of Tasmania’s water resources for the community, industry and government.
Table 10.6: Performance Information - Output Group 4
Performance MeasureUnit of
Measure2015-16
Actual2016-17
Actual2017-18
Target2018-19
Target
Amount of water available for irrigation
Total volume of water licensed for irrigation1Megalitres (ML) '000 755 794 780 825
Primary Industries, Parks, Water and Environment 271
Level of farm water development2
Division 3 dam works permits approved per annum
Numberna 39 30 30
Division 3 storage capacity approved per annum3 ML na 24 619 9 000 9 000
Division 4 dam works permits approved per annum
Numberna 8 10 15
Division 4 storage capacity approved per annum4 ML na 183 1 200 1 000
Efficiency of dam permit processing5
Average time for processing applications for Division dam works permit approvals Days na 62 84 84
Average time for processing applications for Division dam works permit approvals4 Days na 6 14 14
272 Primary Industries, Parks, Water and Environment
Table 10.6: Performance Information - Output Group 4 (continued)
Performance MeasureUnit of
Measure2015-16
Actual2016-17
Actual2017-18
Target2018-19
Target
Quality of water information Proportion of streamflow sites that meet
quality assurance standards6 % 98.9 98.8 95 95
Notes:1. This measure refers to the volume of water licensed and should be read as a cumulative total. A
further approximately 100 000 ML is available through other statutory water entitlements, which are not recorded on the Department’s register.
2. Legislative changes to the Water Management Act 1999 that came into effect on 1 January 2016 created Division 3 and Division 4 dam categories. No data is available for these categories or these measures prior to 2016-17.
3. The 2016-17 actual was much higher than expected, as a number of proposed dams were brought forward into the period in anticipation of funding becoming available. As a consequence, the target volumes for the ensuing years is set considerably lower.
4. The 2016-17 actual was well below what was expected as the number of landowners applying to create small on-farm buffer dams was lower than anticipated.
5. The statutory timeframe for processing dam applications under the Water Management Act is 84 days. Interpretation of this measure needs to take account of the introduction of an integrated process for dealing with environmental issues at proposed dam sites. Amendments to the Act that took effect on 1 January 2016 provide for a new process for low-risk dams under Division 4. The legislation provides 14 days for a decision on whether an application is required under Division 3.
6. The targets for this measure are set to the nationally accepted benchmark which is 95 per cent.
Output Group 5: Racing Regulation and Policy5.1 Racing Regulation and PolicyThis Output delivers probity and integrity services to the Tasmanian racing industry. This is achieved by: registering race clubs; licensing and registering industry participants and racing animals; providing handicapping and grading services; providing stipendiary stewards; enforcing national and local rules of racing for each racing code; registering and regulating on-course bookmakers and their agents; setting the integrity conditions applicable to all Tasmanian race field information
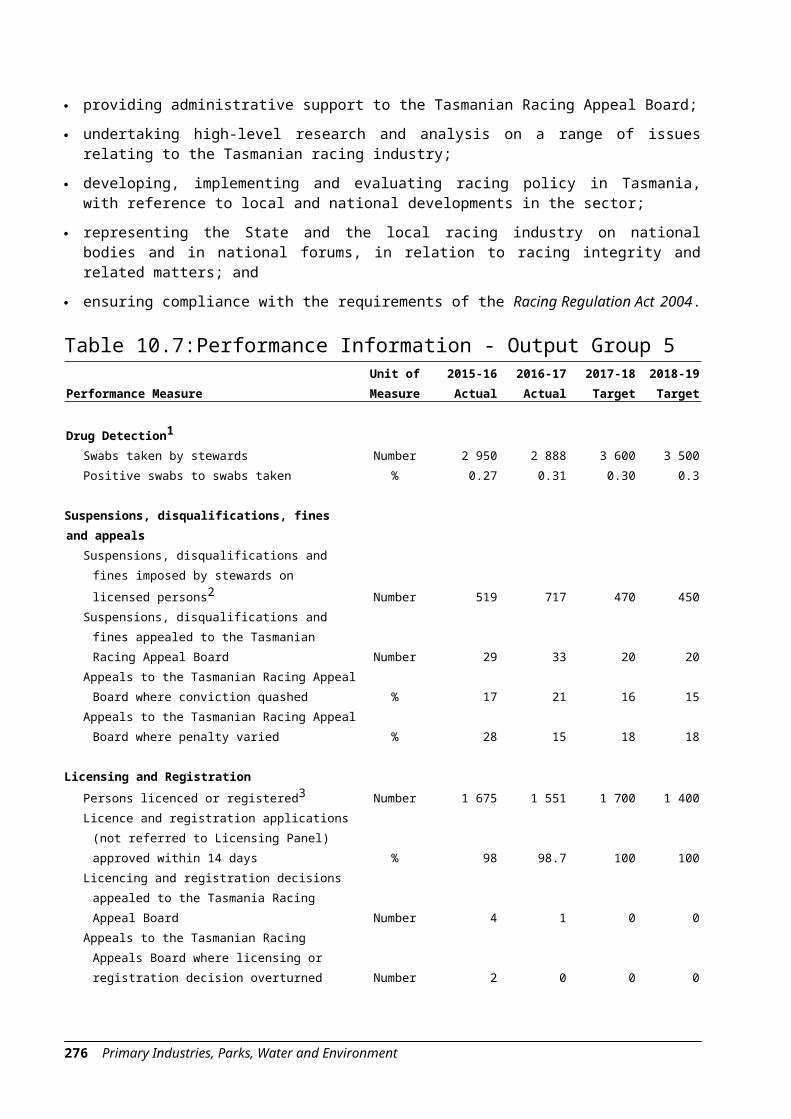
publication approvals; providing administrative support to the Tasmanian Racing Appeal Board; undertaking high-level research and analysis on a range of issues relating to the
Tasmanian racing industry;
Primary Industries, Parks, Water and Environment 273
developing, implementing and evaluating racing policy in Tasmania, with reference to local and national developments in the sector;
representing the State and the local racing industry on national bodies and in national forums, in relation to racing integrity and related matters; and
ensuring compliance with the requirements of the Racing Regulation Act 2004.
Table 10.7: Performance Information - Output Group 5
Performance MeasureUnit of
Measure2015-16
Actual2016-17
Actual2017-18
Target2018-19
Target
Drug Detection1
Swabs taken by stewards Number 2 950 2 888 3 600 3 500Positive swabs to swabs taken % 0.27 0.31 0.30 0.3
Suspensions, disqualifications, fines and appeals
Suspensions, disqualifications and fines imposed by stewards on licensed persons2 Number 519 717 470 450
Suspensions, disqualifications and fines appealed to the Tasmanian Racing Appeal Board Number 29 33 20 20
Appeals to the Tasmanian Racing Appeal Board where conviction quashed % 17 21 16 15
Appeals to the Tasmanian Racing Appeal Board where penalty varied % 28 15 18 18
Licensing and RegistrationPersons licenced or registered3 Number 1 675 1 551 1 700 1 400Licence and registration applications (not
referred to Licensing Panel) approved within 14 days % 98 98.7 100 100
Licencing and registration decisions appealed to the Tasmania Racing Appeal Board Number 4 1 0 0
Appeals to the Tasmanian Racing Appeals Board where licensing or registration decision overturned Number 2 0 0 0
Handicapping4 Races handicapped Number 699 668 770 770Races handicapped requiring a redraw after
publication of the fields, due to errors % 0.14 0.89 0 0
Grading4
Races graded Number 1 637 1 615 1 650 1 650Races graded requiring a redraw after % 0.43 0.49 0 0
274 Primary Industries, Parks, Water and Environment
Performance MeasureUnit of
Measure2015-16
Actual2016-17
Actual2017-18
Target2018-19
Targetpublication of the fields, due to errors
Notes:1. Under improved racing integrity measures since 2015-16, comprehensive testing is now occurring in a
more strategic and proactive way. Swabs include both animals and humans.2. This measure is difficult to forecast and largely beyond the control of the Office of Racing Integrity.3. The reduction in numbers in 2016-17 can be partly explained by a change in licence and registration
requirements. Some greyhound owners and syndicate members are no longer required to be licensed or registered. The 2018-19 Target has been revised to reflect this change.
4. The total number of races conducted is determined by Tasracing. The harness races are handicapped and the greyhound races are graded by the Office of Racing Integrity.
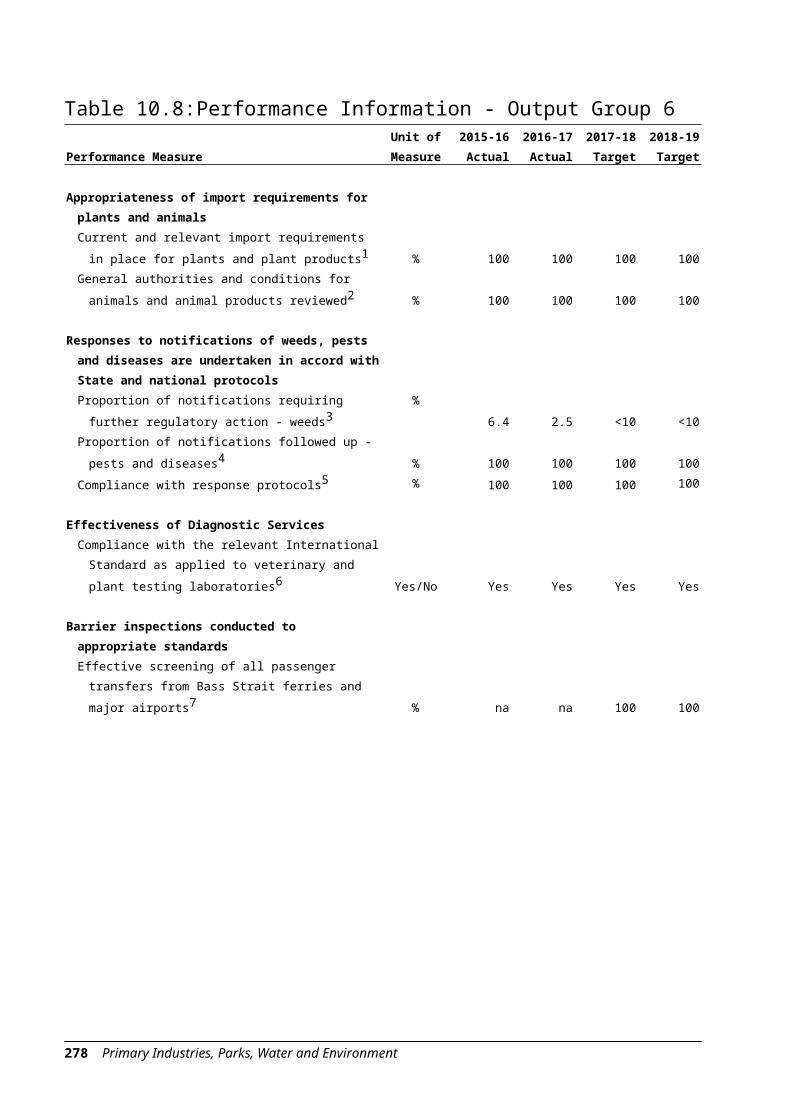
Output Group 6: Biosecurity Tasmania6.1 BiosecurityThis Output supports Tasmania’s Sustainable Agri-Food Plan 2016-18 by providing scientific risk-based systems to exclude, eradicate or effectively manage pests and diseases that jeopardise the relative pest and disease free status of Tasmania. The Output delivers diagnostic services to support sustainable pest and disease control measures and to validate the State’s relative pest and disease free status with scientific evidence. This Output also ensures animal welfare practices are consistent with legislative requirements and community expectations.
6.2 Product IntegrityThis Output provides a framework to regulate and manage food safety in the primary production and processing sector and to identify and trace the movement of livestock. This Output also includes services aimed at ensuring that agricultural chemical use is consistent with legislative requirements and community expectations.
Table 10.8: Performance Information - Output Group 6
Performance MeasureUnit of
Measure2015-16
Actual2016-17
Actual2017-18
Target2018-19
Target
Appropriateness of import requirements for plants and animalsCurrent and relevant import requirements in place
for plants and plant products1 % 100 100 100 100General authorities and conditions for animals and
animal products reviewed2 % 100 100 100 100
Responses to notifications of weeds, pests and diseases are undertaken in accord with State and national protocolsProportion of notifications requiring further
regulatory action - weeds3%
6.4 2.5 <10 <10
Primary Industries, Parks, Water and Environment 275
Proportion of notifications followed up - pests and diseases4 % 100 100 100 100
Compliance with response protocols5 % 100 100 100 100
Effectiveness of Diagnostic ServicesCompliance with the relevant International
Standard as applied to veterinary and plant testing laboratories6 Yes/No Yes Yes Yes Yes
Barrier inspections conducted to appropriate standards Effective screening of all passenger transfers from
Bass Strait ferries and major airports7 % na na 100 100
276 Primary Industries, Parks, Water and Environment
Table 10.8: Performance Information - Output Group 6 (continued)
Compliance with food safety standards by primary producers and processorsFood safety quality assurance plans/programs
approved annually by DPIPWE for eligible producers/processors - cumulative Number 197 208 210 210
Audits of high risk food safety areas without significant findings8 % 99 98 100 100
Compliance with animal welfare standardsAudits of high risk animal use undertaken without
significant findings9 % 100 100 100 100
Compliance with chemical usage legislationAudits of agricultural and veterinary chemical
usage without significant findings10 % na na 100 100
Notes:1. This measure refers to the percentage of import requirements that are current and relevant. The
requirements are reviewed within three years. 2. For this measure, requirements are reviewed within three years according to program specifications.3. The measure is calculated on the number of regulatory follow-ups (e.g. requirement notices,
infringement notices) required once a landowner has been formerly notified that they have a declared weed on their property and should begin action to control it. The lower the percentage of required follow-ups, the higher the proportion of compliance.
4. The biosecurity system includes processes to follow up notifications of quarantine plant pests and diseases and notifiable animal diseases. This occurs as a result of public or industry reports and detections and diagnostic investigations in the Tasmanian biosecurity laboratories.
5. Plant and animal biosecurity response protocols apply at state and national levels and are used in the event of a detection of a quarantine plant/animal pest or disease.
6. For plant health laboratories, this measure applies to the plant virology laboratory only. Entomology, plant pathology and molecular laboratories are currently working towards meeting the international standard.
7. This performance measure was introduced in 2017-18 to better describe contemporary biosecurity approaches to screening of passengers and goods. “Effective screening” may include both pre-border and border activities to reduce the risk of the introduction of pests and diseases via ferry and airplane passengers.
8. High risk areas relate to aspects of primary food production that, if not controlled adequately by the operator, are likely to present a food safety risk to consumers. A significant finding is a contravention on the part of a producer that presents an imminent and serious risk to the safety of primary produce intended for sale or that would cause significant unsuitability of primary produce intended for sale. During an audit, minor non-compliances may be detected and corrective action taken. Such non-compliances do not represent a serious risk to food safety.
9. High risk animal use refers to intensive farming activities that, if not controlled adequately and in accordance with standards, can present an animal welfare risk.
Primary Industries, Parks, Water and Environment 277
10. Routine audits were suspended in 2015-16 due to unprecedented biosecurity responses. A new risk-based audit program has since been under development to ensure controls on the handling and use of agricultural chemicals are being complied with. Pilot audits were conducted in 2016-17 as a prelude to a risk analysis that was completed in December 2017 which will inform the finalisation of a measured and targeted approach to risk-based auditing by mid-2018.
Output Group 7: Environment Protection and Analytical Services
7.1 Environmental Management and Pollution ControlThis Output undertakes activities to: develop high quality, contemporary policies and strategies for the protection of the environment; ensure development proposals meet appropriate guidelines and standards; regulate, via a risk based approach, environmental impacts of large industrial and municipal activities; and monitor environmental performance.
7.2 Analytical ServicesThis Output focuses on providing a range of scientific and analytical services in order to support the delivery of best practice environmental management and the management of environmental incidents.
Table 10.9: Performance Information - Output Group 7
Performance MeasureUnit of
Measure2015-16
Actual2016-17
Actual2017-18
Target2018-19
Target
Air quality1
Hobart - exceeds PM2.5 standard No. of days 1 1 0 0Hobart - exceeds PM10 standard No. of days 0 0 0 0Launceston - exceeds PM2.5 standard No. of days 12 9 0 0Launceston - exceeds PM10 standard No. of days 0 6 0 0Devonport - exceeds PM2.5 standard No. of days 0 8 0 0Devonport - exceeds PM10 standard No. of days 0 4 0 0
Assessment and Regulation of ActivitiesNumber of Environment Protection Notices
and Contaminated Sites Notices issued2 Number 71 69 70 70Percentage of assessments undertaken
within statutory timeframe3 % 96 88 100 100Percentage of planned audits of premises
undertaken within scheduled timeframe4 % 48 68 100 100
278 Primary Industries, Parks, Water and Environment
Performance MeasureUnit of
Measure2015-16
Actual2016-17
Actual2017-18
Target2018-19
Target
Jobs reported on time % 57 65.3 80 70
Notes:1. The ambient air quality measure is calculated on a calendar year basis; for example 2015-16 in the
above table refers to performance against the standard during the 2015 calendar year. The increased number of exceedances of the PM2.5 and PM10 standards in 2016-17 was due to smoke from the Tasmanian bushfires in 2016. All of the PM10 exceedances at Launceston and Devonport were due to bushfires. Six of the nine PM2.5 exceedances at Launceston and all of the PM2.5 exceedances at Devonport were also due to bushfires.
2. This measure identifies the number of key types of notices issued under the Environmental Management and Pollution Control Act 1994. These notices are issued as required and the target figure therefore represents an expected number based on current practice rather than a desirable target.
3. This measure indicates activity performance against section 27H of the Environmental Management and Pollution Control Act, which sets timeframes for the completion of the assessments.
4. This measure addresses planned audits only. A further 18 unplanned audits were undertaken during 2016-17 (equivalent to an additional 16 per cent).
5. The lower target for 2017-18 reflects a reduction in client demand which is subject to variation from year to year.
Output Group 8: Parks and Wildlife Management8.1 Parks and Wildlife ManagementThis Output aims to protect, promote and manage Tasmania’s world-renowned parks and reserve system. These areas provide significant environmental, social, cultural and economic benefits and experiences. This Output provides for their sustainable use through maintenance, appropriate infrastructure, high-quality visitor experiences and a culture that promotes visitor safety. It also manages significant biodiversity restoration programs complemented by the development and implementation of enhanced biosecurity measures.
8.2 Crown Land ServicesThis Output manages Crown land, ensuring its suitable use and development. It also provides specialist Crown property-related advice to government and the private sector.
Table 10.10: Performance Information - Output Group 8
Performance MeasureUnit of
Measure2015-16
Actual2016-17
Actual2017-18
Target2018-19
Target
Management Plans Protected land covered by approved
management plans1% 60 65 65 65
Level of volunteer supportRegistered volunteer partner organisations2 Number 102 105 105 110
Primary Industries, Parks, Water and Environment 279
Performance MeasureUnit of
Measure2015-16
Actual2016-17
Actual2017-18
Target2018-19
TargetWILDCARE Inc. registered members2 Number 7 146 6 124 7 500 8 000
Crown Land ServicesValue of sales completed per year4 $ million 0.53 0.78 0.7 0.7Number of lease and licence agreements
issued5 Number391 252 400
410
280 Primary Industries, Parks, Water and Environment
Notes:1. This measure refers to protected land managed under the National Parks and Reserves Management
Act 2002 by the PWS. It does not include private sanctuaries or private nature reserves. It also does not include the Port Arthur or Coal Mines Historic Sites, which have a management plan in place but are managed by another authority. Protected land includes both reserved inland and marine waters. The percentage of reserved area covered by management plans increased by five per cent in 2016-17 with the approval of the Tasmanian Wilderness World Heritage Area Management Plan in December 2016. The previously reported target for 2017-18 of 64 per cent was incorrect due to a rounding error.
2. The PWS maintains a Volunteer Partner Organisation register, listing organisations that work alongside the PWS on projects and programs. The majority of these partner organisations are branches of WILDCARE Inc, formed by WILDCARE Inc members to provide support to specific reserves or undertake activities such as whale stranding response. WILDCARE Inc maintains a member database, recording number of members, their interests and skills.
3. The PWS does not count visitors to every national park or reserve. An estimate is made of the number of visitors to selected sites, including those in the table. Data for the Gordon River is collected in the Tasmanian Visitor Survey (Tourism Tasmania) and therefore only includes visitors to Tasmania. The 2015-16 actuals for Cradle Mountain, Gordon River and Mount Field previously reported in the 2017-18 Budget were for the 12 months ending March 2016. The data presented above for these sites is for the 12 months ending June 2016. The 2016-17 actual for Cradle Mountain is for the 12 months ending March 2017 and is therefore a preliminary estimate for the reporting period.
4. Sales revenue fluctuates depending on market conditions and number of applications received.5. This measure includes lease and licence agreements that are either new, conversion, transfer,
renewal, variation, or transfer and conversion.
Primary Industries, Parks, Water and Environment 281
CAPITAL INVESTMENT PROGRAM Table 10.11 provides financial information for the Department’s Capital Investment Program. For more information on the Capital Investment Program, see chapter 6 of The Budget Budget Paper No 1.
Table 10.11: Capital Investment ProgramEstimate
d 2018-19 2019-20 2020-21 2021-22 Total Forward Forward Forward Cost Budget Estimate Estimate Estimate
$'000 $'000 $'000 $'000 $'000
New Infrastructure Commitments
Minister for ParksCradle Mountain Experience1 65 000 3 000 13 000 15 000 20 000 National Parks - Maintenance Boost2 8 000 2 000 2 000 2 000 2 000 Next Iconic Walk2 20 000 500 1 000 2 500 5 000
Minister for Primary Industries andWaterAgricultural Research Development and
Minister for Primary Industries andWaterCrown Land Services - Structural Asset
Upgrades Ongoing 556 556 556 556
Total CIP Allocations 42 143 29 656 30 156 33 656
Notes:1. This initiative is funded over five years. The total CIP funding includes Australian Government funding. 2. A description of this Project is provided in the Key Deliverables section at the commencement of this
chapter.3. The increase in estimated expenditure in 2018-19 from the estimates presented in the 2017-18
Budget reflects a reallocation of expenditure from 2017-18 to 2018-19.4. This excludes expenditure of $1.8 million that has been reimbursed through insurance claims paid
directly to the Department.
Orange-bellied Parrot FacilityThe Government has committed $2.5 million to enable the construction of a new fit for purpose facility including improved infrastructure for captive breeding. Construction of a new facility will support the preservation of the critically endangered Orange-bellied Parrot including the capacity to increase the captive-bred population and ensure a greater number of birds are available for release in the parrot’s breeding areas at Melaleuca in the Tasmanian Wilderness World Heritage Area. This capital cost will be offset by the proceeds of the sale of the existing property at Taroona in the State’s south, which will be surplus following the relocation of the captive population to new facilities.
Cradle Mountain Visitor Experience / Cradle Mountain Experience The Government has a vision that will take iconic Cradle Mountain to the next level. The unprecedented investment in the region by the Tasmanian Government of $56.8 million, and Australian Government commitment of $30 million, will align with the
Primary Industries, Parks, Water and Environment 283
Cradle Mountain Experience Master Plan 2016 and build on the popularity of Cradle Mountain as a destination through a new era in visitor experience that elevates the Cradle Mountain visitor experience to one that rivals World Heritage sites around the world.
284 Primary Industries, Parks, Water and Environment
June 2016 Floods - Parks InfrastructureInfrastructure assets within reserves managed by the Parks and Wildlife Service were significantly impacted by the flood and storm events that occurred in June and July 2016. Funding of $11.9 million is enabling repairs to Tasmania’s important roads and tourism infrastructure damaged in the floods, predominantly in the State’s North and North West. This is in addition to insurance reimbursements of $1.8 million received by the Department.
Maria Island RediscoveredThe initiative provides $1.7 million over two years from 2017-18 to support restoration of the World Heritage listed “Darlington” site and provide substantial improvements to the visitor services which will allow locals and tourists to re-discover Maria Island as a world class experience and iconic destination. The project protects the values that locals treasure and provide long term economic stimulus to the East Coast Region.
Three Capes Track - Stage 3The Three Capes Track on the Tasman Peninsula has attracted national recognition as one of the world’s great coastal walks after receiving the gold award at the Australian Tourism Awards. The Government has provided $4 million towards ongoing investment in this experience and construction of Stage 3 of the track has commenced. This stage of the development will provide improved access to Cape Raoul and Shipstern Bluff.
Tourism Infrastructure in ParksThe Tourism Infrastructure in Parks Program provides funding to continue the delivery of the renewal of visitor facilities in national parks and other reserves across the State. The TIIP focusses on the use and enjoyment of the parks estate by the public and commercial enterprises. In partnership with the tourism sectors, the Program ensures well planned, sustainable, visitor infrastructure and longer term jobs in construction and park maintenance.
Crown Land Services - Structural Asset UpgradesOngoing funding is provided for the removal or remediation of physical structures and land that present public liability risks, for statutory maintenance and for essential and preventive maintenance to buildings.
Primary Industries, Parks, Water and Environment 285
DETAILED BUDGET STATEMENTSTable 10.12: Statement of Comprehensive Income
Notes:1. The increase in Appropriation revenue - recurrent in 2018-19 primarily reflects funding being provided
for initiatives detailed in Table 10.1: Key Deliverables Statement.2. The increase in Appropriation revenue - works and services in 2018-19 reflects additional funding
received for the Cradle Mountain Visitor Experience, National Parks - Maintenance Boost and Improved Statewide Visitor Infrastructure. The reduction in 2019-20 reflects a reduction in funding for the Cradle Mountain Visitor Experience and Tourism Infrastructure in Parks. The decrease in 2020-21 reflects finalisation of initial projects relating to the Cradle Mountain Visitor Experience partially offset by additional funding for the Next Iconic Walk. The increase in 2021-22 reflects additional funding for the Cradle Mountain Experience and Next Iconic Walk initiatives, partially offset by the cessation of funding for the Agricultural Research and Development and Extension Whitepaper - Modernise Our Research Farms.
3. The movement in Grants reflects Australian Government funding for the Biosecurity Emergency Response and Research Fund, Cradle Mountain Experience, the Three Capes Track - Stage 3, and the Management of the TWWHA.
4. The decrease in Interest in 2018-19 reflects revised estimates of Special Deposit and Trust Fund account balances that attract interest.
5. The increase in Employee benefits in 2018-19 reflects additional funding received for Boosting National Parks Rangers and Frontline Staff, increased Australian Government revenue for the Biosecurity Emergency Response and Research Fund, and increased retained revenue for the ongoing management of the State’s national parks.
6. The increase in Supplies and consumables in 2018-19 reflects additional Australian Government funding received for the Biosecurity Emergency Response and Research Fund, Taking Agriculture to the Next Level initiatives, increased activity for the Three Capes Track Business Enterprise, and increased revenue to support the ongoing management of the State’s national parks.
7. The decrease in Grants and subsidies in 2018-19 reflects the completion of the Agricultural Landscapes Rehabilitation Program and the Acute Riparian Recovery Program. This is partially offset by additional funding provided for initiatives detailed in Table 10.1: Key Deliverables Statement. The decrease in 2021-22 reflects revised cash flows for the Nyrstar Ground Water Management Strategy.
8. The increase in Other expenses in 2018-19 reflects additional funding received for the Industry Led Abalone Productivity Improvement Program, Thoroughbred and Harness Racing Breeding Program, Maintain Funding of the Abalone Industry Development Trust Fund and On-farm Energy and Irrigation Audits. The increase in 2019-20 reflects additional funding received for the Industry Led Abalone Productivity Improvement Program.
9. The decrease in Net gain/(loss) on non-financial assets reflects the sale of a property at Taroona to be offset against the cost of developing the new Orange-bellied Parrot Facility.
Primary Industries, Parks, Water and Environment 287
Table 10.13: Statement of Comprehensive Income - Administered
292 Primary Industries, Parks, Water and Environment
Notes:1. The increase in AgriGrowth Tasmania in 2018-19 reflects additional funding received primarily due to
the Taking Agriculture to the Next Level initiatives, and the transfer of Game Services Tasmania from Resource Management and Conservation. The decrease in 2021-22 reflects a reduction in funding for the Agri-food Plan.
2. The increase in Marine Resources in 2018-19 reflects additional funding received for the Industry Led Abalone Productivity Improvement Program and to Maintain funding of the Abalone Industry Development Trust Fund initiative.
3. The decrease in Resource Management and Conservation in 2018-19 reflects the cessation of the Acute Riparian Recovery Program, the Agri-food Plan Agricultural Landscapes Rehabilitation Scheme, and the transfer of Game Services Tasmania to Output Group 2.1 AgriGrowth Tasmania. This is partially offset by additional funding received for the Increase Core Funding - Regional Natural Resource Management Groups, and Landcare Action Fund - competitive grants and Double Funding to Landcare Tasmania initiatives.
4. The increase in Product Integrity in 2018-19 reflects additional funding for Oyster and Shellfish Real Time Sensor Monitoring, ShellMAP Industry Development, and a reassessment of overhead costs to better reflect the provision of expenditure for the Output.
5. The increase in Crown Land Services in 2018-19 reflects additional funding received for Crown Land rates.
6. The increase in Capital Investment Program funding in 2018-19 reflects additional funding received for the Agricultural Research Development and Extension Whitepaper - Modernise our Research Farms, Recreational Fishing - Improved Boat and Trailer Parking, Fisheries Integrated Licensing and Management System, and Implementing the Bee Industry Futures Report. The increase in 2019-20 reflects additional funding received for the Agricultural Research Development and Extension Whitepaper - Modernise our Research Farms, and the Fisheries Integrated Licensing and Management System. The decrease in 2021-22 reflects the cessation of the Agricultural Research Development and Extension Whitepaper - Modernise our Research Farms, and the Biosecurity Risk Management and Truck and Machinery Washes.
7. The decrease in Historical Heritage Services in 2018-19 reflects to the cessation of the Woolmers Estate Visitor Centre initiative.
8. The increase in Royal Tasmanian Botanical Gardens in 2018-19 and 2019-20 reflects additional funding received to contribute to the construction of a new visitor centre. The decrease in 2020-21 reflects the cessation of this funding.
9. The movement in Environmental Management and Pollution Control across the Forward Estimates reflects revised cash flows for the Nyrstar Ground Water Management Strategy.
10. The decrease in Capital Investment Program in 2018-19 reflects the completion of the Biotoxin Testing Laboratory initiative and a reduction in funding for the Orange-bellied Parrot Facility. The decrease in 2019-20 reflects the completion of the Orange-bellied Parrot Facility.
11. The increase in Parks and Wildlife Management in 2018-19 reflects additional funding received for the Boosting National Parks Rangers and Frontline Staff initiative.
12. The increase in Capital Investment Program funding in 2018-19 primarily reflects additional funding received for the Cradle Mountain Experience, Improved Statewide Visitor Infrastructure, National Parks Maintenance Boost and Cradle Mountain Visitor Experience, partially offset by the cessation of June 2016 Floods - Parks Infrastructure. The decrease in 2019-20 reflects finalisation of initial projects relating to the Cradle Mountain Visitor Experience, Tourism Infrastructure in Parks, Three Capes Track - Stage 3, partially offset by additional funding received for the Cradle Mountain Experience. The increase in 2021-22 reflects additional funding received for the Cradle Mountain Experience and the Next Iconic Walk.
13. The increase in Racing Regulation and Policy in 2018-19 reflects additional funding received for the Thoroughbred and Harness Racing Breeding Program, Racing Steward Cadetships, and Greyhound Adoption Grant.
Primary Industries, Parks, Water and Environment 293
Notes:1. The increase in Abalone Licences in 2018-19 reflects the higher average beach price of abalone which
is based on the previous three years of data. 2. The decrease in Environment Fees in 2018-19 reflects the adjustment of fee revenue received under
the Environmental Management and Pollution Control Act 1994 to expected levels. This reduction reflects fees charged less Annual Fee Remissions and Special Fee Remissions granted for compliance.
3. The increase in Lands Titles Office Dealings in 2018-19 reflects an increase in dealings lodged, reflecting a stronger property market.
294 Primary Industries, Parks, Water and Environment
Notes:1. The increase in 2019-20 reflects additional funding for the Institute of Marine and Antarctic Studies to
provide for additional research into the fishing and marine farming industries and ongoing support for the assessment of new and sustainable fisheries opportunities.
2. The increase in 2018-19 primarily reflects additional funding for Upgrading Amenities at High Visitation Trout Waters, Anglers Alliance Tasmania Support, Marketing Angling Tourism and Cheaper to Go Trout Fishing.
Contribution to Commonwealth, State and Industry OrganisationsThis funding is the State’s contribution to cost sharing arrangements, as agreed at meetings of the Agriculture Ministers Forum and in relation to nationally agreed initiatives, particularly for biosecurity programs and projects. The funding contributes to activities under Output Group 2 Primary Industries, Output Group 3 Natural and Cultural Heritage and Output Group 6 Biosecurity Tasmania.
Grant to the Institute of Marine and Antarctic StudiesIn 2010, the Department entered into the Sustainable Marine Research Collaboration Agreement with the University of Tasmania’s Institute of Marine and Antarctic Studies, to assist aquaculture and fisheries research. The Government provides its contribution to the joint venture by way of an annual grant. Activities of IMAS contribute to Output Group 2 Primary Industries.
Primary Industries, Parks, Water and Environment 295
Grant to the Tasmanian Institute of AgricultureThe Department and the University of Tasmania have an agreement in place for the Tasmanian Institute of Agriculture to undertake agricultural research, development, extension and education. The activities of TIA contribute to Output Group 2 Primary Industries and the balance of Government funding is reflected in that Output.
Inland Fisheries Service - Government ContributionThis funding represents the community service functions of the Inland Fisheries Service in relation to the conservation, protection and management of Tasmania’s native freshwater fauna and the carp management program.
Port Arthur Historic Site Management AuthorityThis funding represents the Government’s contribution to the Port Arthur Historic Site Management Authority to support the agreed conservation funding program for the Port Arthur, Coal Mines and Cascade Female Factory Historic Sites.
Tasmanian Racing AssistanceThe Government separately funds the Tasmanian Racing Industry under a deed which provides secure funding and creates certainty for the Industry. The annual funding allocation allows Tasracing Pty Ltd to facilitate key administration roles and functions, including the responsibility for the corporate governance, strategic direction and funding of the Tasmanian Racing Industry, as well as ratification of national rules, the making of local rules and the setting of licence standards and criteria.
Wellington Park ContributionThe allocation represents the Government’s contribution to the cost of administering Wellington Park through a grant to the Wellington Park Management Trust.
296 Primary Industries, Parks, Water and Environment
Table 10.17: Statement of Financial Position as at 30 June 2018 2019 2020 2021 2022
Primary Industries, Parks, Water and Environment 297
Notes:1. The increase in these items in 2018-19 reflects updates based on the 30 June 2017 outcome.2. The increase in Infrastructure in 2018-19 primarily reflects the inclusion of additional road
infrastructure and the capitalisation of Capital Investment Program works.3. The decrease in Heritage and cultural assets reflects the transfer of two heritage assets to the
Tasmanian Museum and Art Gallery.4. The decrease in Payables in 2018-19 reflects the payment of accrued expenditure during 2016-17.5. The decrease in Other liabilities in 2018-19 reflects a reduction in Australian Government revenue
received in advance.6. The increase in Reserves in 2018-19 reflects the indexation of land and building asset classes and the
revaluation of the infrastructure asset category.7. The increase in Accumulated funds in 2018-19 reflects the identification of additional road
infrastructure and the capitalisation of Capital Investment Program works.
Table 10.18: Statement of Financial Position as at 30 June - Administered
Net cash from (used by) operating activities 23 172 40 048 29 460 30 511 35 431
Cash flows from investing activitiesPayments for acquisition of non-financial assets10 (24 591) (42 994) (30 232) (30 777) (34 212)Proceeds from the disposal of non-financial assets11 4 814 2 314 2 314 2 314 2 314
Net cash from (used by) investing activities (19 777) (40 680) (27 918) (28 463) (31 898)
Net increase (decrease) in cash and cash equivalents
held 3 395 (632) 1 542 2 048 3 533
Cash and deposits at the beginning of the 113 657 119 287 118 655 120 197 122 245
Primary Industries, Parks, Water and Environment 299
reportingperiod
Cash and deposits at the end of the reporting period 117 052 118 655 120 197 122 245 125 778
Notes:1. The increase in Appropriation receipts - recurrent in 2018-19 reflects additional funding being
provided for initiatives detailed in Table 10.1: Key Deliverables Statement.2. The increase in Appropriation receipts - capital in 2018-19 reflects additional funding received for the
Cradle Mountain Visitor Experience, National Parks - Maintenance Boost and Improved Statewide Visitor Infrastructure. The reduction in 2019-20 reflects a reduction in funding for the Cradle Mountain Visitor Experience and Tourism Infrastructure in Parks. The decrease in 2020-21 reflects a cessation in funding for the Cradle Mountain Visitor Experience, partially offset by additional funding received for the Next Iconic Walk. The increase in 2021-22 reflects additional funding received for the Cradle Mountain Experience, Next Iconic Walk initiative, partially offset by the cessation of funding for the Agricultural Research and Development and Extension Whitepaper - Modernise Our Research Farms.
3. The movement in Grants reflects Australian Government funding for the Biosecurity Emergency Response and Research Fund, the Cradle Mountain Experience, Three Capes Track - Stage 3 and the Management of the TWWHA.
4. The increase in Sales of goods and services in 2018-19 reflects additional revenue received from Park Entry fees, and from Parks and Wildlife Service Business Enterprises.
5. The decrease in Interest received in 2018-19 reflects revised estimates of Special Deposit and Trust Fund account balances that attract interest.
6. The increase in Employee benefits and Superannuation in 2018-19 reflects additional funding received for Boosting National Parks Rangers and Frontline Staff, increased Australian Government revenue for the Biosecurity Emergency Response and Research Fund, and increased retained revenue for the ongoing management of the State’s national parks.
7. The decrease in Grants and subsidies in 2018-19 reflects the completion of the Agricultural Landscapes Rehabilitation Program, and the Acute Riparian Recovery Program. This is partially offset by additional funding provided for initiatives detailed in Table 10.1: Key Deliverables Statement. The decrease in 2021-22 reflects revised cash flows for the Nyrstar Ground Water Management Strategy.
8. The increase in Supplies and consumables in 2018-19 reflects additional funding received for the Taking Agriculture to the Next Level initiatives, increased activity for the Three Capes Track Business Enterprise, and increased retained revenue for the ongoing management of the State’s national parks.
9. The increase in Other cash payments in 2018-19 reflects additional funding received for the Industry Led Abalone Productivity Improvement Program, Thoroughbred and Harness Racing Breeding Program, Maintain Funding of the Abalone Industry Development Trust Fund and On-farm Energy and Irrigation audits. The increase in 2019-20 reflects additional funding received for the Industry lead Abalone Productivity Improvement Program.
10. The increase in Payments for acquisition of non-financial assets in 2018-19 primarily reflects additional capital expenditure for the Cradle Mountain Visitor Experience, Cradle Mountain Experience, National Parks - Maintenance Boost and Improved Statewide Visitor Infrastructure. The reduction in 2019-20 reflects a reduction in funding for the Cradle Mountain Visitor Experience and Tourism Infrastructure in Parks, partially offset by an increase in funding for the Cradle Mountain Experience. The increase in 2020-21 reflects additional funding received for the Cradle Mountain Experience and Next Iconic Walk. The increase in 2021-22 reflects additional funding received for the Next Iconic Walk and Cradle Mountain Experience, partially offset by the cessation of funding for the Cradle Mountain Visitor Experience.
11. The decrease in Proceeds from the disposal of non-financial assets in 2018-19 reflects the sale of a property at Taroona to be offset against the cost of developing the new Orange-bellied Parrot Facility.
300 Primary Industries, Parks, Water and Environment