112
2018 Annual Report and Accounts Foxtons Group plc

2018Annual Report and AccountsFoxtons Group plc
Foxtons Group plc
Annual Report and A
ccounts 2018
STRATEGIC REPORT
02 Financial performance03 Chairman’s statement06 Chief Executive’s review08 Market overview10 Strategy & Business model12 Our people14 Our technology16 Our marketing18 Financial review22 Key performance indicators24 Principal risks29 Corporate and social responsibility
GOVERNANCE
34 Board of Directors36 Chairman’s introduction37 Corporate Governance statement42 Nomination Committee report44 Audit Committee report47 Directors’ Remuneration report60 Directors’ report63 Directors’ Responsibilities statement
FINANCIAL STATEMENTS
66 Consolidated statement of comprehensive income67 Consolidated statement of financial position68 Consolidated statement of changes in equity69 Consolidated cash flow statement70 Notes to the financial statements95 Parent Company statement of financial position96 Parent Company Statement of changes in equity97 Notes to the Company financial statements99 Independent Auditor’s report to the members of Foxtons Group plc107 Financial Calendar
CONTENTS
MOVERS NEED SHAKERS GET
FOXTONS ON IT
FOXTONS
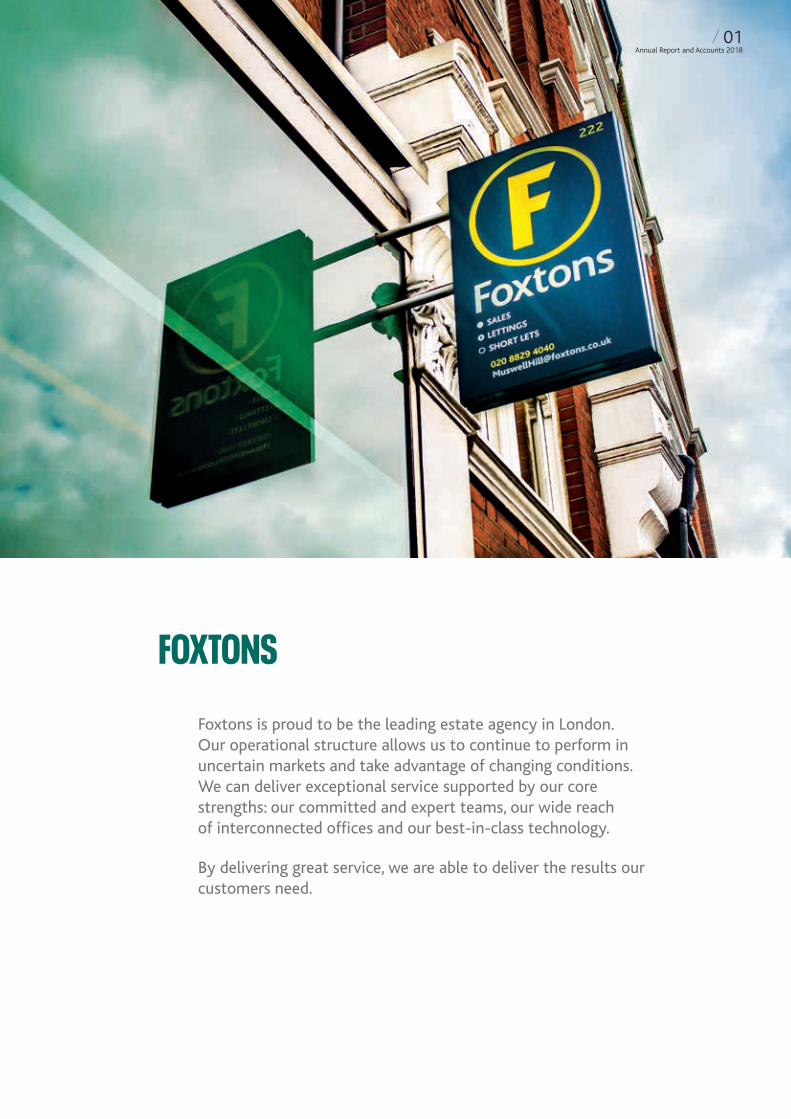
Foxtons is proud to be the leading estate agency in London. Our operational structure allows us to continue to perform in uncertain markets and take advantage of changing conditions. We can deliver exceptional service supported by our core strengths: our committed and expert teams, our wide reach of interconnected offices and our best-in-class technology.
By delivering great service, we are able to deliver the results our customers need.
/ 01Annual Report and Accounts 2018
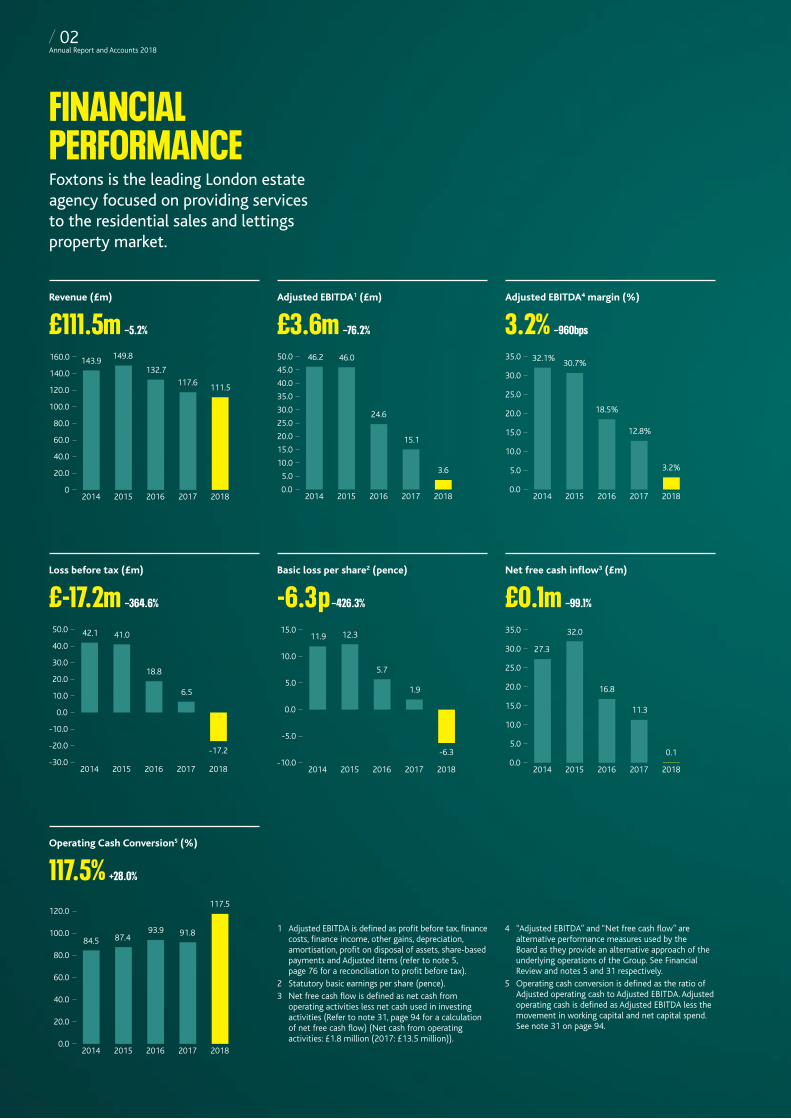
FINANCIAL PERFORMANCEFoxtons is the leading London estate agency focused on providing services to the residential sales and lettings property market.
Revenue (£m)
£111.5m −5.2%
Loss before tax (£m)
£-17.2m −364.6%
Operating Cash Conversion5 (%)
117.5% +28.0%
Adjusted EBITDA1 (£m)
£3.6m −76.2%
Basic loss per share2 (pence)
-6.3p −426.3%
Adjusted EBITDA4 margin (%)
3.2% −960bps
Net free cash inflow3 (£m)
£0.1m −99.1%
0
20.0
40.0
60.0
80.0
100.0
120.0
140.0
160.0
20182017201620152014
143.9149.8
132.7
117.6111.5
-30.0
-20.0
-10.0
0.0
10.0
20.0
30.0
40.0
50.0
20182017201620152014
42.1 41.0
18.8
6.5
-17.2
0.0
20.0
40.0
60.0
80.0
100.0
120.0
20182017201620152014
84.5 87.493.9 91.8
117.5
0.0
5.0
10.0
15.0
20.0
25.0
30.0
35.0
40.0
45.0
50.0
20182017201620152014
46.2 46.0
24.6
15.1
3.6
-10.0
-5.0
0.0
5.0
10.0
15.0
20182017201620152014
11.9 12.3
5.7
1.9
-6.3
0.0
5.0
10.0
15.0
20.0
25.0
30.0
35.0
20182017201620152014
32.1%30.7%
18.5%
12.8%
3.2%
0.0
5.0
10.0
15.0
20.0
25.0
30.0
35.0
20182017201620152014
27.3
32.0
16.8
11.3
0.1
1 Adjusted EBITDA is defined as profit before tax, finance costs, finance income, other gains, depreciation, amortisation, profit on disposal of assets, share-based payments and Adjusted items (refer to note 5, page 76 for a reconciliation to profit before tax).
2 Statutory basic earnings per share (pence).3 Net free cash flow is defined as net cash from
operating activities less net cash used in investing activities (Refer to note 31, page 94 for a calculation of net free cash flow) (Net cash from operating activities: £1.8 million (2017: £13.5 million)).
4 “Adjusted EBITDA” and “Net free cash flow” are alternative performance measures used by the Board as they provide an alternative approach of the underlying operations of the Group. See Financial Review and notes 5 and 31 respectively.
5 Operating cash conversion is defined as the ratio of Adjusted operating cash to Adjusted EBITDA. Adjusted operating cash is defined as Adjusted EBITDA less the movement in working capital and net capital spend. See note 31 on page 94.
/ 02Annual Report and Accounts 2018

Overview
Group revenues were £111.5 million (2017: £117.6 million), due to continued weakness in the London sales market with 2018 volumes at around record lows. Following the completion of our branch rollout we took the decision, in the first quarter of the year, to shift our investment from capex into other areas including people, brand and technology. We made a number of planned investments in the year, including launching a targeted brand advertising campaign. We are confident these investments will enhance the long term prospects of the business, however the net impact was to increase our cost base in the year. These actions, and the lower revenue in the sales business, resulted in a decline in Adjusted EBITDA to £3.6 million (2017: £15.1 million).
In addition, we recognised a non-recurring charge of £15.7 million: In the second half of the year we took further steps to maintain efficiency by ensuring our cost base reflects market conditions and recent technological advances. Following a review of all our sites we took the decision to close six branches, Beckenham, Enfield, Loughton, Ruislip, Park Lane and Barnes.
We continue to cover over 85% of London from 61 branches and have no current plans for further closures. This action resulted in a charge to the income statement of £5.9 million. The remaining £9.8 million of the charge comprised the write down of the sales business goodwill, which we consider to be an appropriate course of action given the prolonged nature of the current sales market downturn.
As a result the Loss before tax was £17.2 million (2017: Profit £6.5 million).
The branch closures and other cost saving initiatives undertaken are expected to deliver circa £3 million savings during 2019.
Board and governance
The Board places significant importance on corporate governance and compliance with the UK Corporate Governance Code. Full details are set out in the Corporate Governance section of our Annual Report and Accounts on pages 34 to 63.
Board update
Very sadly Andrew Adcock, a Non-Executive Director of the Company, passed away in January 2019 following a period of illness. Andrew joined Foxtons in August 2013 at the time of the Company’s flotation and was a very kind and thoughtful colleague and friend. Andrew made a significant contribution to the Foxtons Board and we will deeply miss his experience, guidance and humour. We send our sincere condolences to Andrew’s wife and family.
Michael Brown retired as a Non-Executive Director of the Company on 18 September 2018.
Michael made a significant contribution to Foxtons over a career which started in 2002 and included seven years as Chief Executive.
On behalf of the Board, I’d like to acknowledge Michael’s contribution to Foxtons and to thank him for his help and support as a fellow director. We wish him well for the future.
Dividend
We have a policy of returning 35% to 40% of profit after tax as an ordinary dividend but as the Company did not make a profit this period the Board has taken the decision to not pay a final dividend.
The Board’s priorities for free cash flow are unchanged: to fund investment in the future development of the business, maintain a strong balance sheet and return excess cash to shareholders.
Operating cash conversion in the year was 117% and we ended the year with £17.9 million cash.
Summary
The London sales market is in a prolonged downturn and the current uncertainty surrounding Brexit is clearly impacting consumer confidence. We are managing the business to reflect this and ensure we are well prepared for any change in market conditions. Foxtons retains a strong balance sheet with no debt and has a powerful, high service model, which is increasingly relevant to our clients who want an agent that delivers results. Technology is improving our business both by making it more efficient and enabling clients to interact in a way that is most convenient for them. We believe that close management of the agency process through personal relationships combined with excellent technology is the most successful and sustainable business model. We continue to have excellent coverage in London which, in the long-term, is a highly attractive property market. On behalf of the Board thank you to everyone at Foxtons for their hard work this year. Their passion, dedication and commitment is what differentiates us and is why our clients choose Foxtons.
Garry WattsChairman
CHAIRMAN’S STATEMENTFoxtons targets a balanced business through the cycle and is currently focused on the less cyclical lettings business, providing valuable protection against the cyclical sales market.
Garry Watts
/ 03Annual Report and Accounts 2018

/ 04Annual Report and Accounts 2018
A BRAND WITH STRENGTHHigh quality service in estate agency is core to our brand. We’re able to deliver the results our customers need due to the knowledge and expertise of our people, our reach across London and our best-in-class technology designed with our customers in mind.

/ 05Annual Report and Accounts 2018
1.
2.
3.
4.
DELIVERING EXCEPTIONAL SERVICE We believe it’s our service which makes us the best place to find your next property, and the best place to unlock what your property is truly worth.
REACHING MORE PEOPLEOur size, scale, reach and resources are what differentiate us. It gives people confidence that we can deliver.
A COMMITTED & EXPERT TEAMThe expertise and knowledge of our people, combined with industry-leading training, allows us to offer a premium level of service.
TECHNOLOGY TO SERVEOur technology provides support and transparency throughout the sales and lettings processes, serving our customers better.
Review of the year
2018 was one of the toughest sales markets we have ever had in London with transactions falling from last year’s historically low levels. Though our lettings business continues to provide a steady income stream the sales market remains weak. Low consumer confidence due to ongoing political uncertainty, the impact of stamp duty changes introduced in 2016 and affordability concerns in London have led to a sustained period of very low activity levels which have clearly impacted our business.
Foxtons 2018 Group revenue was £111.5 million (2017: £117.6 million) comprising lettings revenue of £67.0 million (2017: £66.3 million), sales revenue of £36.2 million (2017: £42.6 million) and mortgage broking revenue of £8.3 million (2017: £8.7 million).
Revenue from lettings grew 1% on the prior year as it continued to provide a resilient, less cyclical revenue stream which now represents 60% of Group revenue. The people investment we made earlier in the year was a success and enabled us to better manage demand particularly over the peak summer period. The 15% decrease in sales revenue is a result of continued market weakness which results in lower transaction volumes. Revenue at Alexander Hall, our mortgage broker, comprised a higher proportion of re-mortgage business, though decreased by 6% overall as the result of lower average revenue per deal.
For 2018, our Group Adjusted EBITDA reduced to £3.6 million (2017: £15.1 million) driven principally by lower revenues in the sales business and our planned investments in people, brand and technology. As expected these targeted investments have impacted profitability in the short term but are designed to enhance our differentiated model. We continue to review our cost base to reflect market conditions.
In addition, we recognised a non-recurring charge of £15.7 million in respect of Adjusted items in the year with £12.5 million of the charge being non-cash. £5.9 million of the charge related mainly to the closure of six branches, four of which were in the outskirts of our network. Having reviewed these areas closely we concluded that customers there could be served equally well from other nearby branches. The branches we have closed are in Loughton, Enfield, Beckenham and Ruislip and followed earlier closures in Barnes and Park Lane. Today we continue to cover over 85% of London with 61 branches and have no immediate plans for further closures. We remain focussed on driving efficiency and ensuring we have a cost base which reflects market conditions and accounts for the fact that technology now allows us to extend branch reach.
The remaining £9.8 million of the charge comprised the write down of the goodwill in the sales segment, which we consider to be an appropriate course of action given the prolonged nature of the current downturn in the sales market. The £3.2 million of the non-recurring charge which is cash related, all of which relates to branch closures, is expected to be spent over a three year period. The branch closures and other cost saving initiatives undertaken in the second half are expected to deliver circa £3 million of cost savings during 2019.
Overall the Loss before tax was £17.2 million (2017: £6.5 million profit before tax).
Despite the market backdrop, we have been able to maintain our sales infrastructure and have taken steps to ensure the business is best prepared for these conditions. The Group continued to be cash generative before dividend and tax payments made in respect of previous years. After allowing for these, net free cash inflow during the year was £0.1 million. At year-end the Group held a cash balance of £17.9 million and remains debt free.
CHIEF EXECUTIVE’S REVIEWAs the most recognised residential brand in London, we are well positioned to manage through market uncertainties and take advantage of any improvement in conditions.
Nic Budden
/ 06Annual Report and Accounts 2018
Property sales market
Our listings share remains at consistent levels and we are confident that our differentiated proposition is even more relevant in today’s challenging market. In the medium term we believe transaction levels will improve because London has strong fundamentals as a global hub, a growing population and structural demand driven by limited housing stock. We will continue to manage the business such that we are well placed to benefit from any improvements in market conditions.
Lettings market
Lettings continues to deliver a consistent and stable revenue stream for the Group. It is a market with good long-term fundamentals, particularly in London where more than one million households now rent. In the near term we believe we have a good opportunity to do more with existing landlords and in 2018 introduced enhanced dedicated account management to help target this group. In addition, we have upgraded the My Foxtons portal so it now incorporates a tenants’ issue tracker and app which enables tenants to easily log their property issues, and provides landlords with more visibility.
Our lettings business is the largest single brand portfolio in London and during 2018 the portfolio and the proportion of actively managed properties in the portfolio increased to 33% (2017: 32%).
Whilst demand for rental properties remains high, the year saw broadly flat average rental prices representing a stabilisation versus the prior year as the supply of rental properties has returned to more normal levels.
As the lettings market grows, landlords are faced with increased regulatory risk and seek an agent that can navigate this complexity, maximise the value of their property and secure high quality tenants. Foxtons reach, which covers nearly all of London, combined with our exceptional service offering positions us well to benefit from these trends over the longer term.
We anticipate the implementation of the Tenant Fees Bill in June 2019. Internally management has been focusing on working out how best to mitigate the impact of the ban in various scenarios and we will update the market in due course of the actions we propose to take.
Investing for future growth
Over the past four decades, Foxtons has built a distinctive business that covers nearly all of London with its leading brand, exceptional service and innovative application of technology. Our ambition is to build on this through selective investment in order to create the most resonant customer offering in the marketplace.
In February 2018 we laid out plans to shift investment away from branch roll outs and into other areas of our business including our brand. Foxtons is the most recognised estate agent in London and we feel our proposition – of excellent service which delivers results – is highly relevant in today’s market and yet not as well understood as it could be. To address this, in 2018 we embarked on a series of brand building initiatives to reinforce our proposition amongst potential customers, buyers and tenants.
Maintaining our leadership in technology is vital as it will play an increasingly important role in enabling us to deliver exceptional service to our customers. As part of our strategy to identify future growth areas within residential property, Foxtons regularly considers partnerships with companies that potentially offer diversified income streams, complementary technology, and access to new customer segments. In 2018 we made a strategic investment in Propoly, a young company providing business to business white label digital estate agency software services, currently focused on lettings. This investment gives us access to nascent technology, which we may potentially leverage in the future.
We also invested in a partnership with Zero Deposit, a service which offers an alternative to traditional cash deposits for tenants when renting a property. It gives renters greater choice and flexibility while helping landlords maximise the marketing of their properties.
Estate agency is a people-based industry and it is therefore important that we attract and retain the best talent, and that our agents stay motivated. In 2018 we invested more heavily in people, including new remuneration structures, a higher number of negotiators focused on lettings and additional property managers to enhance our service to landlords.
We believe our investment in technology, our people, and our brand over the last year has been a key driver of the improved performance in lettings and we expect to continue to see its benefit.
Outlook
Looking ahead, we expect trading conditions to remain challenging in 2019. Whilst our sales pipeline remains at a similar level to the same time last year, the sales market remains very subdued with less visibility on exchanges proceeding. Our less cyclical lettings business provides resilience against sales market cycles and we continue to target growth in this area. Enhanced operational focus, customer initiatives and utilisation of technology and data have already shown some progress; we aim to build on this going forward.
Foxtons remains in an attractive position with a robust balance sheet, good cash generation and with no debt. We will continue to review and optimise our business structure and leverage our proprietary technology and data, in order to make our agents as productive and competitive as possible.
In the longer term, whilst recent political events have produced uncertainty for buyers and sellers, we expect London to remain a highly attractive property market for sales and lettings. We have several initiatives underway to promote growth in our lettings business and remain focused on growing market share in our less mature branches. Our commitment to achieving the best result for our customers and powerful brand continue to be key differentiators. We have become accustomed to operating In these conditions, and are well placed to withstand them given our leaner cost base and continued strong balance sheet with no debt.
Nic BuddenChief Executive Officer
/ 07Annual Report and Accounts 2018
0
200,000
400,000
600,000
800,000
1,000,000
1,200,000
2004 2005 2006 2007 2008 2009 2010 2011 2012 2013 2014 2015 2016 2017 2018
Changing trends in property tenure preferences have been driven by a number of factors including a growing population, the broadening gap between house prices and buyer purchasing power in the sales market, as well as a change in attitudes with people viewing renting as a viable longer-term housing option and lifestyle choice as the population becomes increasingly mobile.
As demand rises for the lettings market, the supply side faces a growing set of challenges from increased regulation, changes to taxes and competition from new providers.
The past five years have seen over 150 new regulations introduced that affect landlords, from responsibility for checking tenants’ residency status to licensing requirements, enhanced maintenance criteria and increased financial sanctions. Changes to taxes including higher stamp duty have also reduced the attractiveness of investing in property to let.
The growing rental market has attracted new institutional operators who offer a professional rental experience at scale. Whilst small private landlords still own the vast majority of rented homes, there is now considerable financial and government impetus behind the institutional build to rent sector. Estimates of capital poised for investment range between £30 billion and £50 billion, and developers are supported by both the Government and the London mayor.
Foxtons maintains a long term focus on lettings, with our expertise and experience in the field giving us a significant competitive advantage. The Group is well placed to benefit from new lettings opportunities that arise from the changing marketplace.
One of the implications of the growth of large scale institutional build to rent developments outside central London, combined with tenant affordability concerns, is that tenants are widening their search areas to TFL Transport Zones 3-6.
Foxtons is in a strong position to meet this demand, given our broad network of branches in outer London and relationships with most build to rent operators in London. Our access to industry leading rental market data, focus on compliance and deep understanding of regulations leave the Group well placed to help landlords navigate the changing environment and professionalise their service offering to tenants.
The increasing demand for private rentals in London provides a solid base for the Group’s lettings business. Furthermore, London’s growing population maintains an upward pressure on long-term rental tenure rates. The lettings market continues to be a key element of Foxtons business strategy and it provides a steady, reliable income stream which now accounts for more than half of the Group’s business.
We anticipate the implementation of the Tenant Fees Bill in 2019. Internally management has been focusing on working out how best to mitigate the impact of the ban in various scenarios.
MARKET OVERVIEWLondon’s private rental sector market is growing as a result of higher population mobility, changing tenure preferences and structural shifts in the owner occupier market. Simultaneously, volumes in the sales market continue to fall due to economic and political uncertainty, a widening gap between London house prices and buyer purchasing power, and new regulations around property investment.
THE LETTINGS MARKET
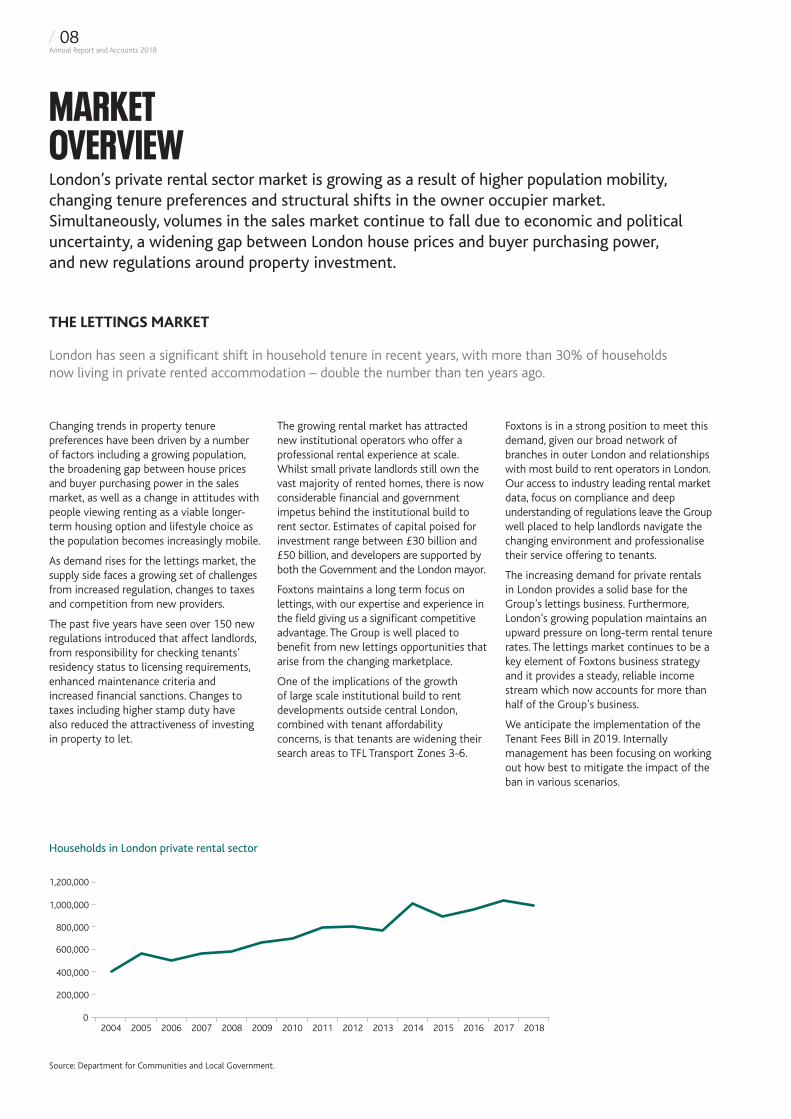
London has seen a significant shift in household tenure in recent years, with more than 30% of households now living in private rented accommodation – double the number than ten years ago.
Households in London private rental sector
Source: Department for Communities and Local Government.
/ 08Annual Report and Accounts 2018
4.05.06.07.08.09.0
10.011.012.013.014.015.0
201820172016201520142013201220112010200920082007200620052004
England & WalesLondon
Limited levels of new housing supply, a growing population and record low interest rates have contributed to the rapid pace of house price increases in London. This has not in turn been matched by wage growth in the capital, resulting in ever lower affordability rates and the prospect of buying a property unfeasible for many.
The ability of buyers to purchase houses has been further impacted by tighter mortgage lending criteria and high stamp duty rates, meaning they need larger deposits. This is even more pronounced for investment and additional property purchasers.
The political uncertainty, weakened UK economy and fall in consumer confidence since the 2016 Brexit referendum have resulted in homebuyers exercising greater caution. This is translating to lower transaction volumes in the London property market. We do not expect market conditions to improve significantly until the political and economic landscape becomes clearer.
In the prime central London area, transaction levels have been lower than that of 2009/10 for the last three years whilst volumes in outer London areas have been relatively strong. In the medium-term, the attraction of lower prices in outer London will continue to drive migration and housebuilding to these locations.
Foxtons now has over 50% of branches outside TFL zones 1 and 2, and is well placed to capture the growth and activities in these areas in both lettings and sales.
THE SALES MARKET
The London residential property sales market is experiencing multiple challenges including political uncertainty, low consumer confidence, an increasing gap between house prices and buyer purchasing power, and changes to taxes.
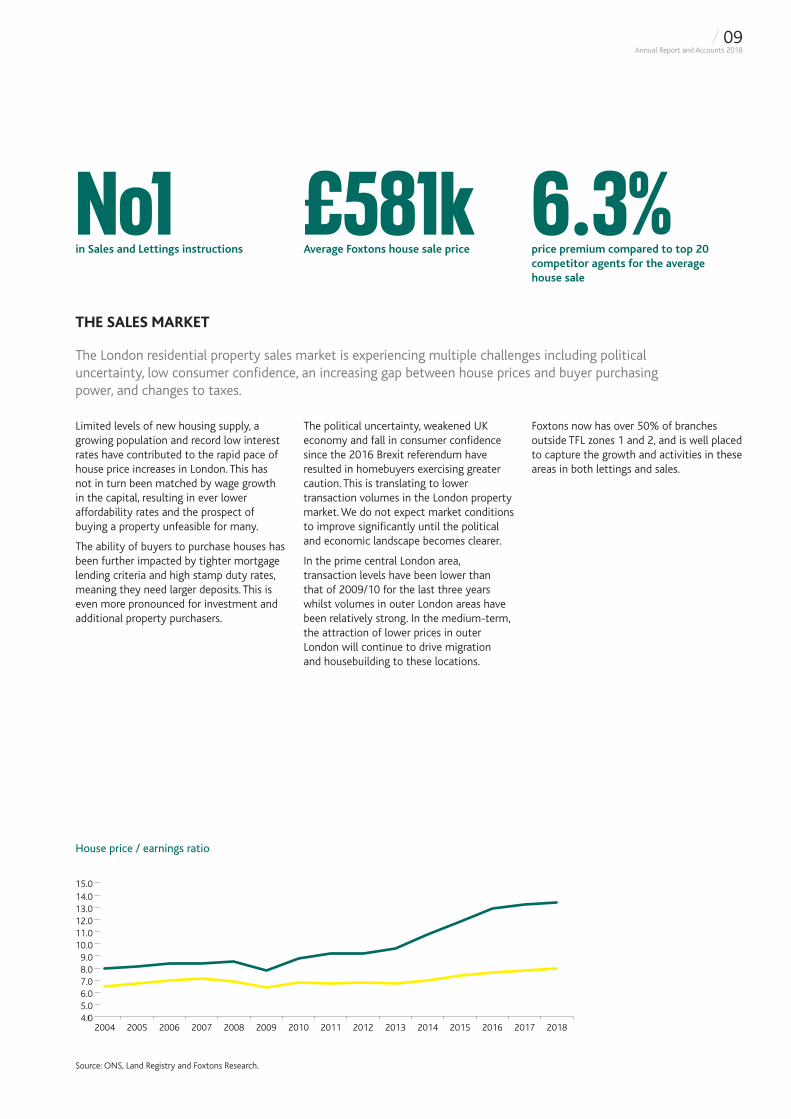
House price / earnings ratio
Source: ONS, Land Registry and Foxtons Research.
£581kAverage Foxtons house sale price
6.3%price premium compared to top 20 competitor agents for the average house sale
No1in Sales and Lettings instructions
/ 09Annual Report and Accounts 2018
STRATEGY & BUSINESS MODELEstate agency is fundamentally a people business and our proposition is based around knowledgeable, experienced and committed people who provide an excellent service for our customers throughout the complicated process of selling or letting a property.
OUR COMPETITIVE ADVANTAGE
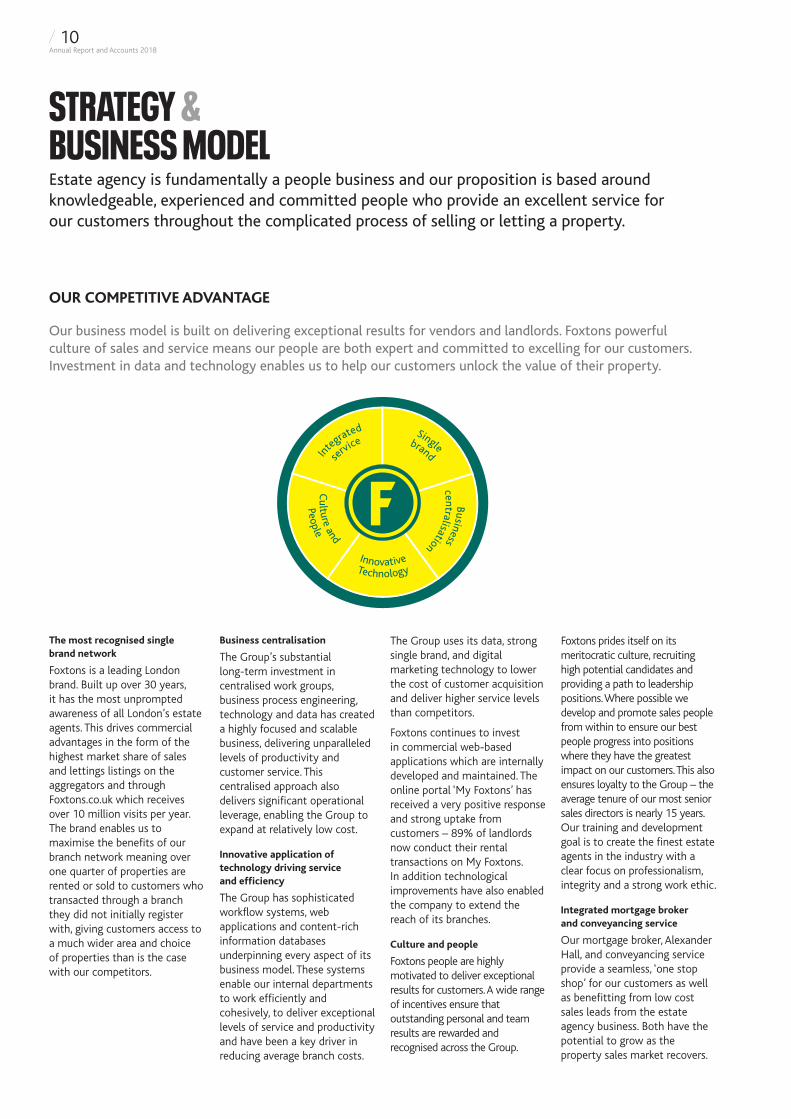
Our business model is built on delivering exceptional results for vendors and landlords. Foxtons powerful culture of sales and service means our people are both expert and committed to excelling for our customers. Investment in data and technology enables us to help our customers unlock the value of their property.
Single
In
tegrated
Businesscentralisation
service brand
TechnologyInnovative
Culture and
People
The most recognised single brand network
Foxtons is a leading London brand. Built up over 30 years, it has the most unprompted awareness of all London’s estate agents. This drives commercial advantages in the form of the highest market share of sales and lettings listings on the aggregators and through Foxtons.co.uk which receives over 10 million visits per year. The brand enables us to maximise the benefits of our branch network meaning over one quarter of properties are rented or sold to customers who transacted through a branch they did not initially register with, giving customers access to a much wider area and choice of properties than is the case with our competitors.
Business centralisation
The Group’s substantial long-term investment in centralised work groups, business process engineering, technology and data has created a highly focused and scalable business, delivering unparalleled levels of productivity and customer service. This centralised approach also delivers significant operational leverage, enabling the Group to expand at relatively low cost.
Innovative application of technology driving service and efficiency
The Group has sophisticated workflow systems, web applications and content-rich information databases underpinning every aspect of its business model. These systems enable our internal departments to work efficiently and cohesively, to deliver exceptional levels of service and productivity and have been a key driver in reducing average branch costs.
The Group uses its data, strong single brand, and digital marketing technology to lower the cost of customer acquisition and deliver higher service levels than competitors.
Foxtons continues to invest in commercial web-based applications which are internally developed and maintained. The online portal ‘My Foxtons’ has received a very positive response and strong uptake from customers – 89% of landlords now conduct their rental transactions on My Foxtons. In addition technological improvements have also enabled the company to extend the reach of its branches.
Culture and people
Foxtons people are highly motivated to deliver exceptional results for customers. A wide range of incentives ensure that outstanding personal and team results are rewarded and recognised across the Group.
Foxtons prides itself on its meritocratic culture, recruiting high potential candidates and providing a path to leadership positions. Where possible we develop and promote sales people from within to ensure our best people progress into positions where they have the greatest impact on our customers. This also ensures loyalty to the Group – the average tenure of our most senior sales directors is nearly 15 years. Our training and development goal is to create the finest estate agents in the industry with a clear focus on professionalism, integrity and a strong work ethic.
Integrated mortgage broker and conveyancing service
Our mortgage broker, Alexander Hall, and conveyancing service provide a seamless, ‘one stop shop’ for our customers as well as benefitting from low cost sales leads from the estate agency business. Both have the potential to grow as the property sales market recovers.
/ 10Annual Report and Accounts 2018
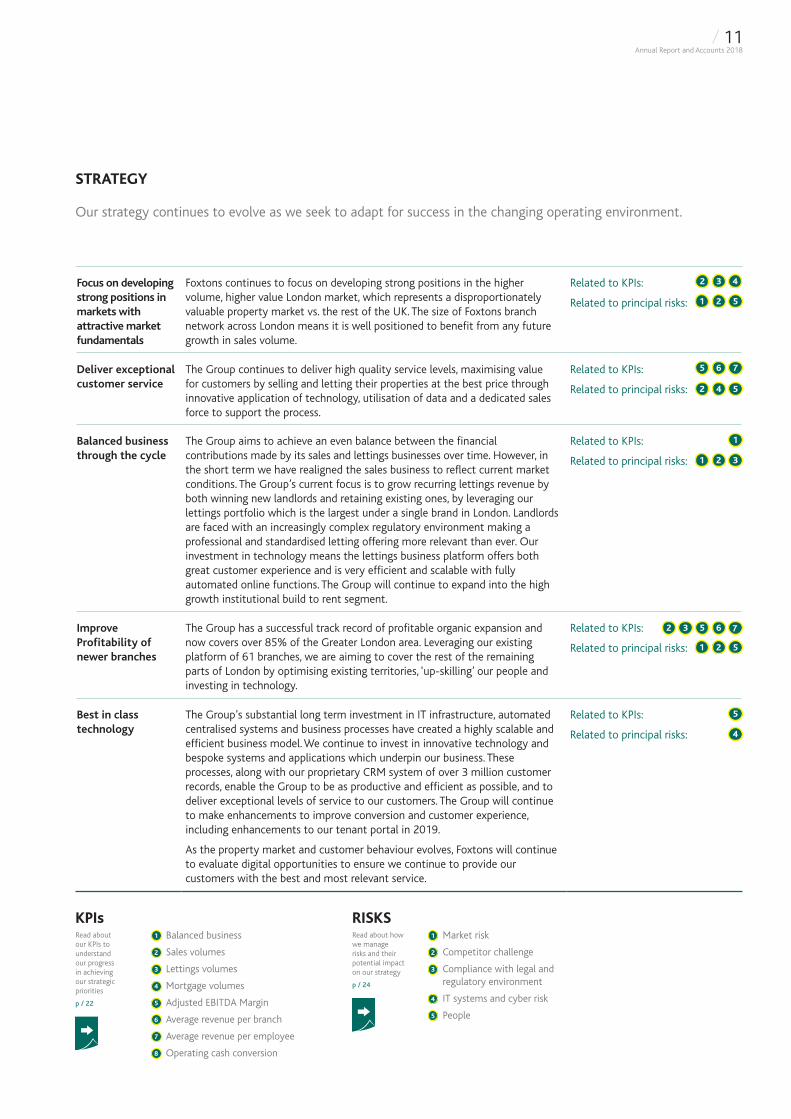
STRATEGY
Our strategy continues to evolve as we seek to adapt for success in the changing operating environment.
Focus on developing strong positions in markets with attractive market fundamentals
Foxtons continues to focus on developing strong positions in the higher volume, higher value London market, which represents a disproportionately valuable property market vs. the rest of the UK. The size of Foxtons branch network across London means it is well positioned to benefit from any future growth in sales volume.
Related to KPIs:
Related to principal risks:
Deliver exceptional customer service
The Group continues to deliver high quality service levels, maximising value for customers by selling and letting their properties at the best price through innovative application of technology, utilisation of data and a dedicated sales force to support the process.
Related to KPIs:
Related to principal risks:
Balanced business through the cycle
The Group aims to achieve an even balance between the financial contributions made by its sales and lettings businesses over time. However, in the short term we have realigned the sales business to reflect current market conditions. The Group’s current focus is to grow recurring lettings revenue by both winning new landlords and retaining existing ones, by leveraging our lettings portfolio which is the largest under a single brand in London. Landlords are faced with an increasingly complex regulatory environment making a professional and standardised letting offering more relevant than ever. Our investment in technology means the lettings business platform offers both great customer experience and is very efficient and scalable with fully automated online functions. The Group will continue to expand into the high growth institutional build to rent segment.
Related to KPIs:
Related to principal risks:
Improve Profitability of newer branches
The Group has a successful track record of profitable organic expansion and now covers over 85% of the Greater London area. Leveraging our existing platform of 61 branches, we are aiming to cover the rest of the remaining parts of London by optimising existing territories, ‘up-skilling’ our people and investing in technology.
Related to KPIs:
Related to principal risks:
Best in class technology
The Group’s substantial long term investment in IT infrastructure, automated centralised systems and business processes have created a highly scalable and efficient business model. We continue to invest in innovative technology and bespoke systems and applications which underpin our business. These processes, along with our proprietary CRM system of over 3 million customer records, enable the Group to be as productive and efficient as possible, and to deliver exceptional levels of service to our customers. The Group will continue to make enhancements to improve conversion and customer experience, including enhancements to our tenant portal in 2019.
As the property market and customer behaviour evolves, Foxtons will continue to evaluate digital opportunities to ensure we continue to provide our customers with the best and most relevant service.
Related to KPIs:
Related to principal risks:
5
32 4
51 2
4
5
6
2 31
1
2
2
3 7
1
5
4 5
6 7
2
5
KPIs1 Balanced business
2 Sales volumes
3 Lettings volumes
4 Mortgage volumes
5 Adjusted EBITDA Margin
6 Average revenue per branch
7 Average revenue per employee
8 Operating cash conversion
Read about our KPIs to understand our progress in achieving our strategic priorities
p / 22
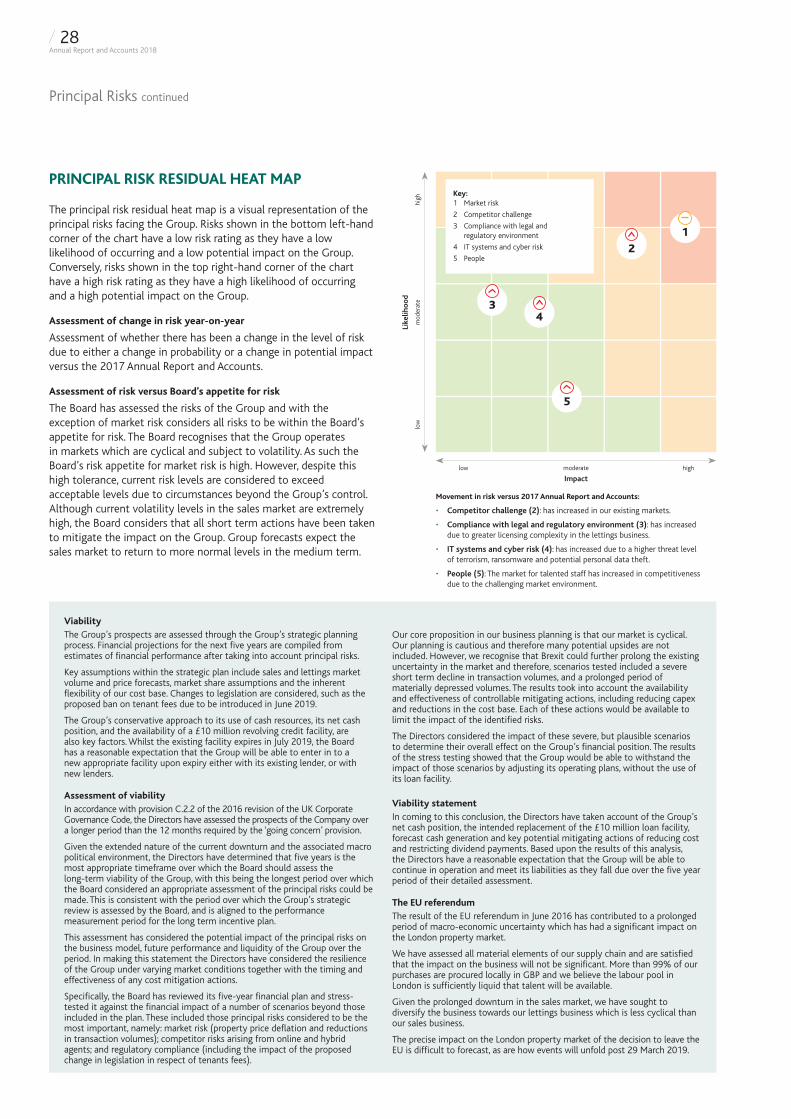
1 Market risk
2 Competitor challenge
3 Compliance with legal and regulatory environment
4 IT systems and cyber risk
5 People
RISKSRead about how we manage risks and their potential impact on our strategy
p / 24
/ 11Annual Report and Accounts 2018
OUR PEOPLEContinuous professional development, combined with industry-leading technology allows us to offer a unique proposition to our customers and set the standard for service in estate agency.
Powerful culture of sales and service
In order to offer exceptional service to our clients, it’s vital that our people are inspired, engaged and supported. That’s why Foxtons culture is energetic, sociable and rewarding. We are currently rated 4.2 out of 5 on Glassdoor, with our culture, senior management and career opportunities scoring highest on employee reviews. We provide the opportunity for talented and enthusiastic employees to thrive in an incentive-driven environment where outstanding work and customer service are recognised in both team and individual capacities, and employees are encouraged in every aspect of their development. Regular awards ceremonies ensure employees are acknowledged for their exceptional performance or contribution. This culture is a key competitive advantage for Foxtons, reinforced by recent research conducted with leading PR agency Teneo Blue Rubicon, which established that our customers viewed our people as one of our key differentiators.
Extensive training
In order to offer the best customer experience possible, we are committed to ensuring that our teams receive exceptional training and career development opportunities with a view to building a successful long-term career at Foxtons. Our Foxtons Training Academy comprises over 300 training modules. Starting from an intensive induction week made up of 86 tailored modules, the training continues with 120 more hours for Negotiators, followed by a similar number for new Valuers and Managers. This investment in training continues throughout our people’s careers irrespective of roles or levels. Our commitment to the highest standards of customer service and compliance is demonstrated by the consistently positive feedback provided by our customers.
Highlights
3diversity groups
61languages spoken
Over
120hours of training
With property industry regulation becoming increasingly complex, particularly in the lettings sector, customers are looking for estate agents to have the requisite knowledge and expertise to guide them on their property journey. We are currently rated ‘Excellent’ with five stars on Trustpilot and have a rating of 4.5 out of 5 stars from Google Reviews. Our advocacy scores are a validation of the confidence our customers have in us and the level of training we provide to our staff.
We are committed to career progression in order to promote loyalty and help our staff develop into genuine experts, making Foxtons a true meritocracy where we promote from within whenever possible. Anyone in the Company who demonstrates skill and hard work has the opportunity to reach the highest level and experience accelerated progression.
Diversity and inclusion
We are proud of our diversity throughout the Company and our working practices. We hire people from a multiplicity of backgrounds and our training takes a comprehensive and personal approach, allowing us to focus on matching the right people to the right roles. The diversity profile of our workforce reflects that of a multicultural society and our client base, with 61 foreign languages spoken by our employees. We are committed to providing equal opportunities, social mobility and an entirely non-discriminatory working environment and ensuring a level playing field approach to recruitment. In order to further support and encourage our teams we’re proud to have three diversity groups, established and run by employees from a variety of areas within Foxtons. Women at Foxtons, Foxtons LGBTQ+ and Afro Foxtons provide a forum to encourage open communication for people at any stage of their career, and from any part of the company. Over 200 Foxtons employees are currently members and allies of these groups, proving that diversity is valued and owned by our people.
/ 12Annual Report and Accounts 2018
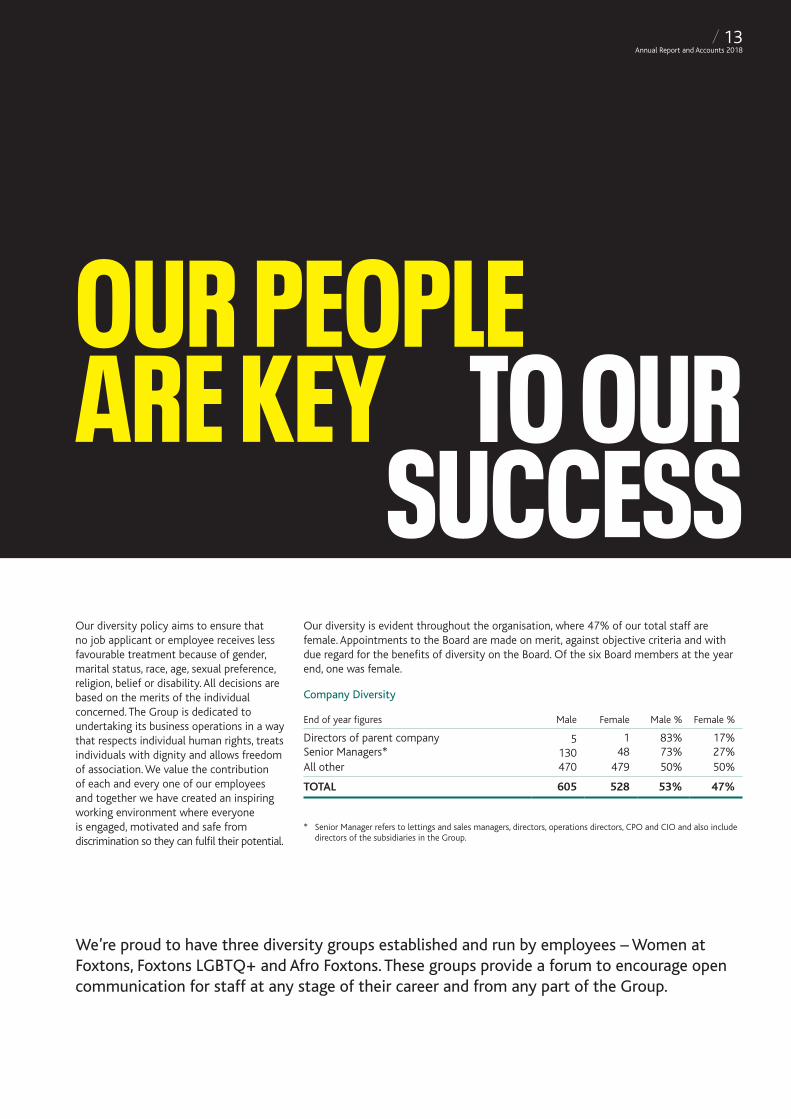
Our diversity policy aims to ensure that no job applicant or employee receives less favourable treatment because of gender, marital status, race, age, sexual preference, religion, belief or disability. All decisions are based on the merits of the individual concerned. The Group is dedicated to undertaking its business operations in a way that respects individual human rights, treats individuals with dignity and allows freedom of association. We value the contribution of each and every one of our employees and together we have created an inspiring working environment where everyone is engaged, motivated and safe from discrimination so they can fulfil their potential.
Our diversity is evident throughout the organisation, where 47% of our total staff are female. Appointments to the Board are made on merit, against objective criteria and with due regard for the benefits of diversity on the Board. Of the six Board members at the year end, one was female.
Company Diversity
End of year figures Male Female Male % Female %
Directors of parent company 5 1 83% 17%Senior Managers* 130 48 73% 27%All other 470 479 50% 50%
TOTAL 605 528 53% 47%
* Senior Manager refers to lettings and sales managers, directors, operations directors, CPO and CIO and also include directors of the subsidiaries in the Group.
TO OURSUCCESS
OUR PEOPLE ARE KEY
We’re proud to have three diversity groups established and run by employees – Women at Foxtons, Foxtons LGBTQ+ and Afro Foxtons. These groups provide a forum to encourage open communication for staff at any stage of their career and from any part of the Group.
/ 13Annual Report and Accounts 2018
OUR TECHNOLOGYWe’re passionate about delivering exceptional service for our clients through a combination of best-in-class technology and continuously developing the expertise of our people. Our focus remains on advancing ease, speed and transparency of sales and lettings transactions through our customer-centric online platforms.
Our proprietary Customer Relationship Management (CRM) system, BOS, continues to provide us with a competitive advantage. BOS connects our entire network of agents together allowing efficient processes and the ability to deliver our customers a higher level of service. We provide customers with a transparent way to manage their property transactions through their own personalised My Foxtons online portal – upgrading this service was a key priority in 2018. Currently, 711,080 people have My Foxtons accounts, with an average of 11,335 tenants and 8,100 landlords logging into My Foxtons each month. Complementing the experience customers receive from an upgraded My Foxtons, several new features added in 2018 were designed to streamline the property management process for landlords and tenants. Customers of My Foxtons continue to have a distinct advantage over those who haven’t registered, or who are searching on an aggregator or with a rival estate agent. Registered customers are able to steal a march on the competition by booking viewings on ‘sneak peek’ properties before they are published on Rightmove and Zoopla. Users can also see price reductions and register for email alerts for properties which match their criteria.
Key highlights
711,080My Foxtons accounts
485,000monthly website users
19,000 tenants and landlords using My Foxtons every month
As an extension of My Foxtons, our newly launched ‘Tenancy Tracker’ app provides a new level of control for our tenants, allowing them to access a suite of services once their tenancy has started. Among other services, all tenancy details and documents are hosted on the app, and any issues during the tenancy can be reported along with photo or video evidence for their landlord or property manager to identify and remedy.
We’ve curated offers from a variety of companies and services, allowing our tenants to benefit from partnerships designed to make their life easier. With a focus on further enhancing communication, a chat function was added, allowing tenants to quickly and simply message their landlord or property manager through the app. The chat function also alerts both landlords and tenants to any new activity within their My Foxtons account. All these changes, and more, were made in order to ensure that our technology best serves our customers throughout their transaction with us.
The Foxtons.co.uk website continues to be a key driver of brand engagement, with almost half a million visitors to the website each month. In 2018, we have further enhanced our A/B testing programme through Oracle Maxymiser to ensure that both potential and existing customers are served by a journey that encourages engagement and lead generation. Highlights included further optimization of our ‘book a valuation’ user flow, resulting in an increase in completion rates of 12%. Various other methods of lead capture were tested including the launch of a ‘chatbot’ style booking form. Finally a redesign of various landing pages increased self-registration rate of tenants and buyers by 47% compared to 2017. This increase in valuation leads combined with increased buyer and tenant registrations to directly impact the bottom line.
We remain committed to leveraging our business data to drive decision making, improve lead management and operational efficiency. Our investment into internal data science capabilities this year will allow us to accelerate improvements in 2019.
MY FOXTONS USAGE:
• On average, 1,218 Anti-Money Laundering documents are uploaded securely through My Foxtons every month
• In excess of 100 viewing requests are made through My Foxtons on a daily basis
• 44,081 tenancy agreements were signed online
• 85% of lettings monies were paid securely through My Foxtons
/ 14Annual Report and Accounts 2018

TECHNOLOGY PROVIDES US WITH A
COMPETITIVE EDGE
/ 15Annual Report and Accounts 2018
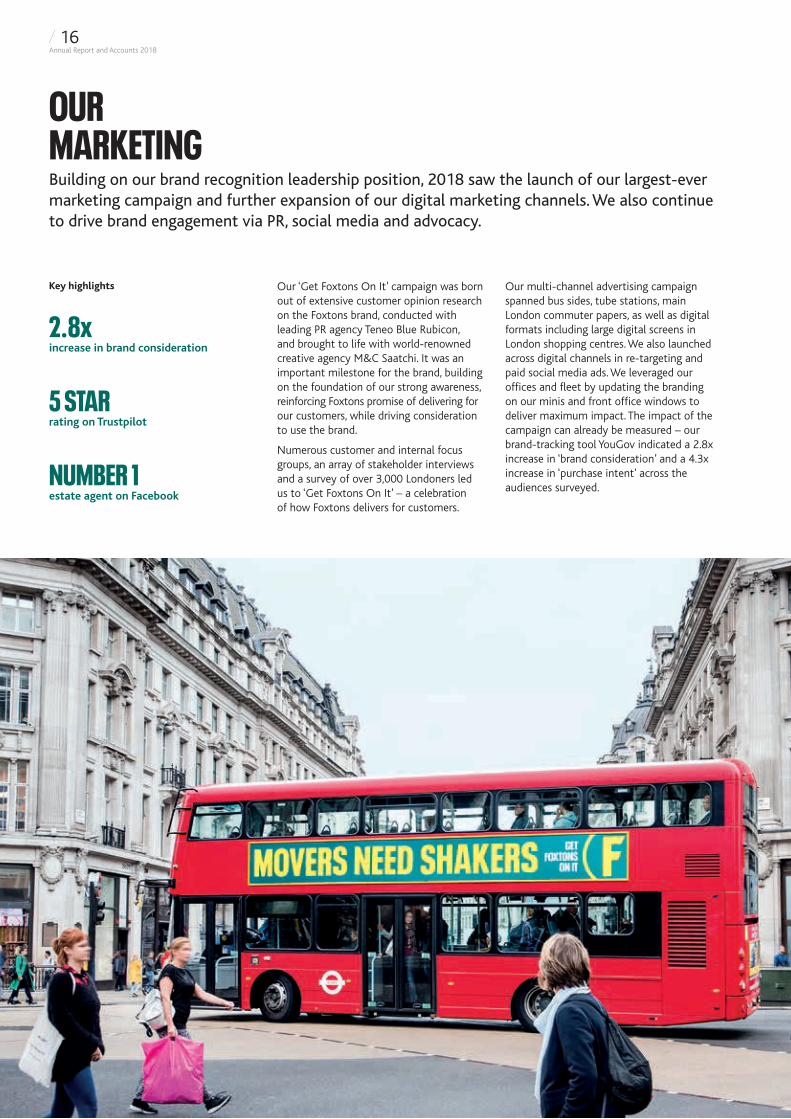
OUR MARKETINGBuilding on our brand recognition leadership position, 2018 saw the launch of our largest-ever marketing campaign and further expansion of our digital marketing channels. We also continue to drive brand engagement via PR, social media and advocacy.
Our ‘Get Foxtons On It’ campaign was born out of extensive customer opinion research on the Foxtons brand, conducted with leading PR agency Teneo Blue Rubicon, and brought to life with world-renowned creative agency M&C Saatchi. It was an important milestone for the brand, building on the foundation of our strong awareness, reinforcing Foxtons promise of delivering for our customers, while driving consideration to use the brand.
Numerous customer and internal focus groups, an array of stakeholder interviews and a survey of over 3,000 Londoners led us to ‘Get Foxtons On It’ – a celebration of how Foxtons delivers for customers.
Key highlights
2.8xincrease in brand consideration
5 STARrating on Trustpilot
NUMBER 1 estate agent on Facebook
Our multi-channel advertising campaign spanned bus sides, tube stations, main London commuter papers, as well as digital formats including large digital screens in London shopping centres. We also launched across digital channels in re-targeting and paid social media ads. We leveraged our offices and fleet by updating the branding on our minis and front office windows to deliver maximum impact. The impact of the campaign can already be measured – our brand-tracking tool YouGov indicated a 2.8x increase in ‘brand consideration’ and a 4.3x increase in ‘purchase intent’ across the audiences surveyed.
/ 16Annual Report and Accounts 2018
Our strategy of low-cost lead generation via digital channels such as PPC (pay-per-click), Facebook and programmatic display continued to yield positive results for us in 2018. These are dynamic channels, continuously optimised through changes to audience targeting, keywords, creative and landing pages. We continue to beta-test new products from Rightmove and Zoopla, ensuring we deliver cost effective lead generation as well as maximum exposure for our listings. Foxtons remains present across all major social media channels, while maintaining our status as the largest estate agent page on Facebook.
2018 saw substantial improvements in the effectiveness of our canvassing and direct mail campaigns. Half the number of letters were required to secure an enquiry, proving the value of traditional marketing techniques when supported by continual testing and optimisation. Customer Relationship Management (CRM) continued to be a strong focus for 2018. The further development of automated emails, SMS and digital messenger channels have enabled us to reinforce messages at crucial stages of our relationship with customers. Our multi-channel, data-driven approach has resulted in significant improvements in our marketing programmes, with further improvements planned for 2019.
The development of our PR activity via Teneo Blue Rubicon has resulted in significantly enhanced relationships with various important consumer titles, ensuring we maintain a positive share of voice. 2018 also saw the launch of a key campaign moment for Foxtons with the release of ‘How London Lives’ – a customer-facing report providing insight into how Londoners are buying and renting. The report was featured in the Daily Telegraph and was a top performing post on social media.
BUILDING ON OUR
BRAND
POSITION
Our data-driven multi-channel marketing programmes continue to deliver value for the business across lead generation and customer journey management. Having data at the heart of everything we do allows us to provide a more tailored and optimized experience for our customers.
/ 17Annual Report and Accounts 2018
Overview
Total revenue fell by 5% during the period and whilst our cost base remains under constant review, we made a number of planned investments in key areas during the period. These included increased targeted spend in marketing and branding; a new negotiator pay scheme to improve the incentivisation and retention of our best people; and specific investments to enhance our Lettings customer service offering. Each of these investments will enhance the long term prospects of the business, however the net impact was to increase our cost base in the short term.
Administrative expenses excluding Adjusted items in the period were £4.6 million higher than prior year with planned new investments and general cost inflation, being partially offset by lower net commissions and lower depreciation. Taken together with the lower sales revenue achieved in the period, this led to an £11.5 million fall in Adjusted EBITDA. The Group remains profitable at the Adjusted EBITDA level and remains debt-free with £17.9 million cash as at 31 December 2018 (31 December 2017: £18.6 million).
Summary income statement
Year ended 31 December 2018 2017 % change
Group revenue £111.5m £117.6m (5%)Group Adjusted EBITDA £3.6m £15.1m (76%)Depreciation, amortisation, share based payments and profit on disposal of fixed assets (£5.4m) (£6.2m) –Adjusted items (£15.7m) (£2.3m) –Other gains £0.3m – –(Loss)/Profit before tax (£17.2m) £6.5m –Net cash inflow from operating activities £1.8m £13.5m –Net free cash inflow £0.1m £11.3m –Basic (loss)/earnings per share (6.3p) 1.9p –Dividend per share – 0.7p –
In reporting financial information the Group presents Alternative Performance Measures (APMs) such as Adjusted EBITDA, Contribution and Net Free Cash Flow which are not defined or specified under the requirements of IFRS. The Group believes that the presentation of APMs provides stakeholders with additional helpful information on the performance of the business, but does not consider them to be a substitute for or superior to IFRS measures. Our APMs are aligned to our strategy and together are used to measure the performance of the business and form the basis of the performance measures for remuneration. Adjusted results exclude certain items because if included, these items could distort the understanding of our performance for the year and the comparability between periods.
Group Adjusted EBITDA, Net Cash Flow from operating activities and Net Free Cash Flow are APMs. See notes 5 and 31 respectively.
FINANCIAL REVIEWDuring the year we made key planned investments in technology, our people, and our brand for the long term benefit of the business. These investments, together with lower sales revenues, reduced profits in the year, but position us well for the future.
Mark Berry
Revenue
£111.5m-5%Adjusted EBITDA
£3.6m-76%Loss before tax
£17.2mNet cash
£17.9m-4%
/ 18Annual Report and Accounts 2018
Revenue
The Foxtons Group comprises three business segments: Sales, Lettings and Mortgage broking. The majority of operations are in the London area with two branches in the adjacent area of Surrey.
£m 2018 2017 % variance
Sales 36.2 42.6 (15%)Lettings 67.0 66.3 1%Mortgage broking 8.3 8.7 (6%)
Total revenue 111.5 117.6 (5%)
Sales
The London property sales market worsened year on year as continued market weakness generated lower transaction volumes. Revenues fell by 15% versus the prior year, reflecting a 15% fall in volumes to 2,529 (2017: 2,962). “Average revenue per transaction” decreased marginally versus the prior year to £14.3k. The decrease was a reflection of a combination of factors with a slightly higher proportion of higher value transactions in the period being offset by lower overall prices. The average price of a Foxtons property sale was £581k (2017: £582k).
Lettings
The Lettings segment continues to provide a consistent recurring revenue stream which comprises 60% of Group revenues. Lettings revenue was up 1% versus prior year driven by increased revenue per deal resulting from longer deal length and broadly flat deal volumes. The Lettings business is seasonal with the peak period occurring in the second half of the year.
Mortgage broking
Revenue at our Mortgage business, Alexander Hall, decreased by 6%. In the context of the wider London sales market, this was a solid performance driven by a higher proportion of re-mortgage deals which typically attract a lower margin. Overall volumes were 4,318 (2017: 4,243).
Balanced business
A key strategic priority for the Company is to maintain a balanced business. This balance across the sales and lettings segments enables the Group to withstand fluctuations in the property market.
% of total revenue 2018 2017
Sales 32% 36%Lettings 60% 57%Mortgage broking 8% 7%
Total revenue 100% 100%
Segmental Contribution and Adjusted EBITDA
A key metric for management is the contribution generated by the three business segments. Contribution is defined as revenue less direct salary costs of front office staff and costs of bad debt. Contribution margin and contribution margin % are used as APMs as they are both measures of the profitability and efficiency of the operating business segments. The Group contribution margin was lower than in the prior year mainly due to the fall in sales revenue.
We maintained headcount levels in the period in order to re-build our under offer sales pipeline with a view to increasing sales exchanges in the second half of the year. Our front office headcount remains under constant review.
Contribution2018
£m2018
margin2017
£m2017
margin
Sales 19.2 53.0% 25.1 59.0%Lettings 47.8 71.4% 48.6 73.3%Mortgage broking 3.9 47.1% 4.4 49.8%
Group contribution 70.9 63.6% 78.1 66.4%
Adjusted EBITDA comprises contribution less shared costs and before Adjusted items:
Adjusted EBITDA2018
£m2018
margin2017
£m2017
margin
Sales (4.5) (12.3%) 1.2 2.8%Lettings 6.7 10.0% 12.1 18.3%Mortgage broking 1.4 16.7% 1.8 20.0%
Group Adjusted EBITDA 3.6 3.2% 15.1 12.8%
The integrated nature of the business model means that a relatively large proportion of the cost base is shared between the sales and lettings segments.
Sales Adjusted EBITDA and margin reduced versus prior year driven primarily by lower revenue.
Lettings Adjusted EBITDA and margin reduced versus prior year driven primarily by an increased apportionment of shared costs, which for the purposes of segmental reporting are allocated between the sales and lettings segments according to headcount. As 2018 headcount was higher in the lettings business than in the sales business, a higher proportion of shared cost has been allocated to Lettings than in the prior year. A full reconciliation of these items to (Loss)/Profit before tax is included in note 5.
Adjusted items
We incurred a £15.7 million charge in respect of Adjusted items in the year, £12.5 million of which is non-cash.
£5.0 million of the charge related to the closure of six branches in the second half of the year. A further four branches had their net assets impaired by £0.9 million. The remaining £9.8 million of the charge comprised the write down of the goodwill in the sales segment, which we consider to be an appropriate course of action given the prolonged nature of the current downturn in the sales market. The £3.2 million of the non-recurring charge which is cash related is expected to be spent over a three-year period.
We remain focussed on driving efficiency and ensuring we have a cost base which reflects market conditions. The branch closures and other cost saving initiatives undertaken in the second half are expected to deliver circa £3 million of cost savings during 2019.
/ 19Annual Report and Accounts 2018
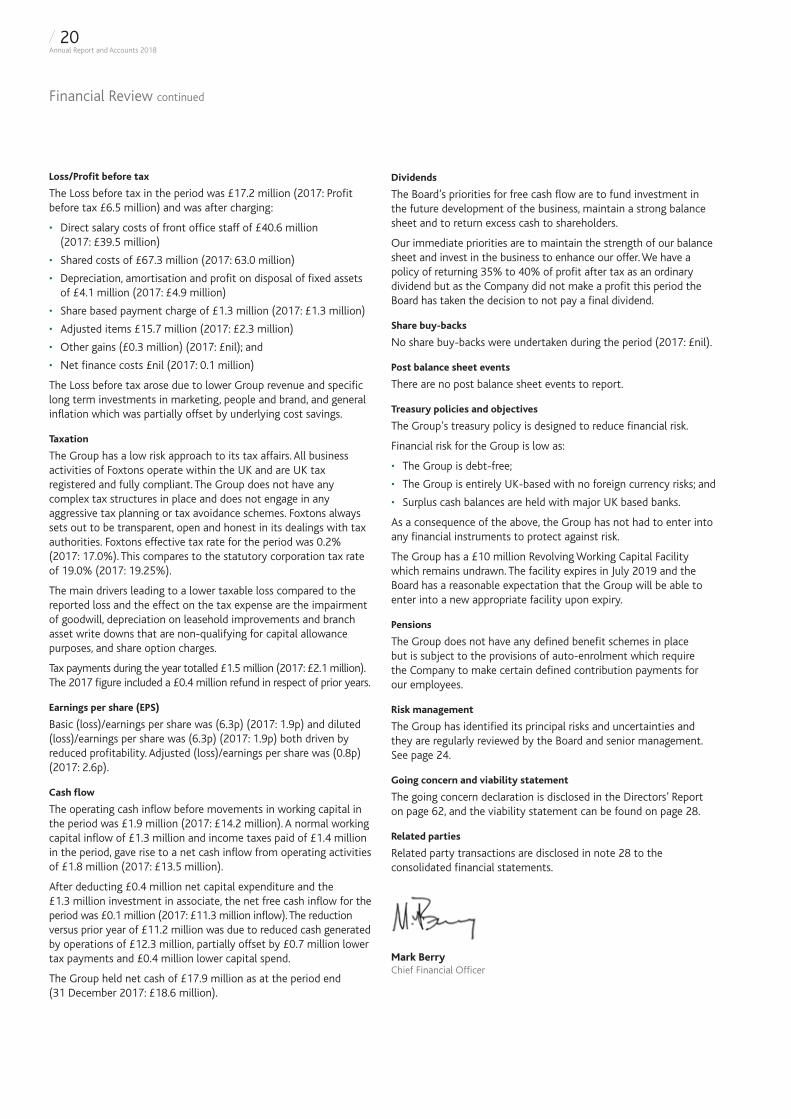
Loss/Profit before tax
The Loss before tax in the period was £17.2 million (2017: Profit before tax £6.5 million) and was after charging:
• Direct salary costs of front office staff of £40.6 million (2017: £39.5 million)
• Shared costs of £67.3 million (2017: 63.0 million)
• Depreciation, amortisation and profit on disposal of fixed assets of £4.1 million (2017: £4.9 million)
• Share based payment charge of £1.3 million (2017: £1.3 million)
• Adjusted items £15.7 million (2017: £2.3 million)
• Other gains (£0.3 million) (2017: £nil); and
• Net finance costs £nil (2017: 0.1 million)
The Loss before tax arose due to lower Group revenue and specific long term investments in marketing, people and brand, and general inflation which was partially offset by underlying cost savings.
Taxation
The Group has a low risk approach to its tax affairs. All business activities of Foxtons operate within the UK and are UK tax registered and fully compliant. The Group does not have any complex tax structures in place and does not engage in any aggressive tax planning or tax avoidance schemes. Foxtons always sets out to be transparent, open and honest in its dealings with tax authorities. Foxtons effective tax rate for the period was 0.2% (2017: 17.0%). This compares to the statutory corporation tax rate of 19.0% (2017: 19.25%).
The main drivers leading to a lower taxable loss compared to the reported loss and the effect on the tax expense are the impairment of goodwill, depreciation on leasehold improvements and branch asset write downs that are non-qualifying for capital allowance purposes, and share option charges.
Tax payments during the year totalled £1.5 million (2017: £2.1 million). The 2017 figure included a £0.4 million refund in respect of prior years.
Earnings per share (EPS)
Basic (loss)/earnings per share was (6.3p) (2017: 1.9p) and diluted (loss)/earnings per share was (6.3p) (2017: 1.9p) both driven by reduced profitability. Adjusted (loss)/earnings per share was (0.8p) (2017: 2.6p).
Cash flow
The operating cash inflow before movements in working capital in the period was £1.9 million (2017: £14.2 million). A normal working capital inflow of £1.3 million and income taxes paid of £1.4 million in the period, gave rise to a net cash inflow from operating activities of £1.8 million (2017: £13.5 million).
After deducting £0.4 million net capital expenditure and the £1.3 million investment in associate, the net free cash inflow for the period was £0.1 million (2017: £11.3 million inflow). The reduction versus prior year of £11.2 million was due to reduced cash generated by operations of £12.3 million, partially offset by £0.7 million lower tax payments and £0.4 million lower capital spend.
The Group held net cash of £17.9 million as at the period end (31 December 2017: £18.6 million).
Dividends
The Board’s priorities for free cash flow are to fund investment in the future development of the business, maintain a strong balance sheet and to return excess cash to shareholders.
Our immediate priorities are to maintain the strength of our balance sheet and invest in the business to enhance our offer. We have a policy of returning 35% to 40% of profit after tax as an ordinary dividend but as the Company did not make a profit this period the Board has taken the decision to not pay a final dividend.
Share buy-backs
No share buy-backs were undertaken during the period (2017: £nil).
Post balance sheet events
There are no post balance sheet events to report.
Treasury policies and objectives
The Group’s treasury policy is designed to reduce financial risk.
Financial risk for the Group is low as:
• The Group is debt-free;
• The Group is entirely UK-based with no foreign currency risks; and
• Surplus cash balances are held with major UK based banks.
As a consequence of the above, the Group has not had to enter into any financial instruments to protect against risk.
The Group has a £10 million Revolving Working Capital Facility which remains undrawn. The facility expires in July 2019 and the Board has a reasonable expectation that the Group will be able to enter into a new appropriate facility upon expiry.
Pensions
The Group does not have any defined benefit schemes in place but is subject to the provisions of auto-enrolment which require the Company to make certain defined contribution payments for our employees.
Risk management
The Group has identified its principal risks and uncertainties and they are regularly reviewed by the Board and senior management. See page 24.
Going concern and viability statement
The going concern declaration is disclosed in the Directors’ Report on page 62, and the viability statement can be found on page 28.
Related parties
Related party transactions are disclosed in note 28 to the consolidated financial statements.
Mark BerryChief Financial Officer
Financial Review continued
/ 20Annual Report and Accounts 2018
A BALANCED BUSINESS MODEL
SET UP
TO WITHSTAND
MARKET FLUCTUATIONS
/ 21Annual Report and Accounts 2018
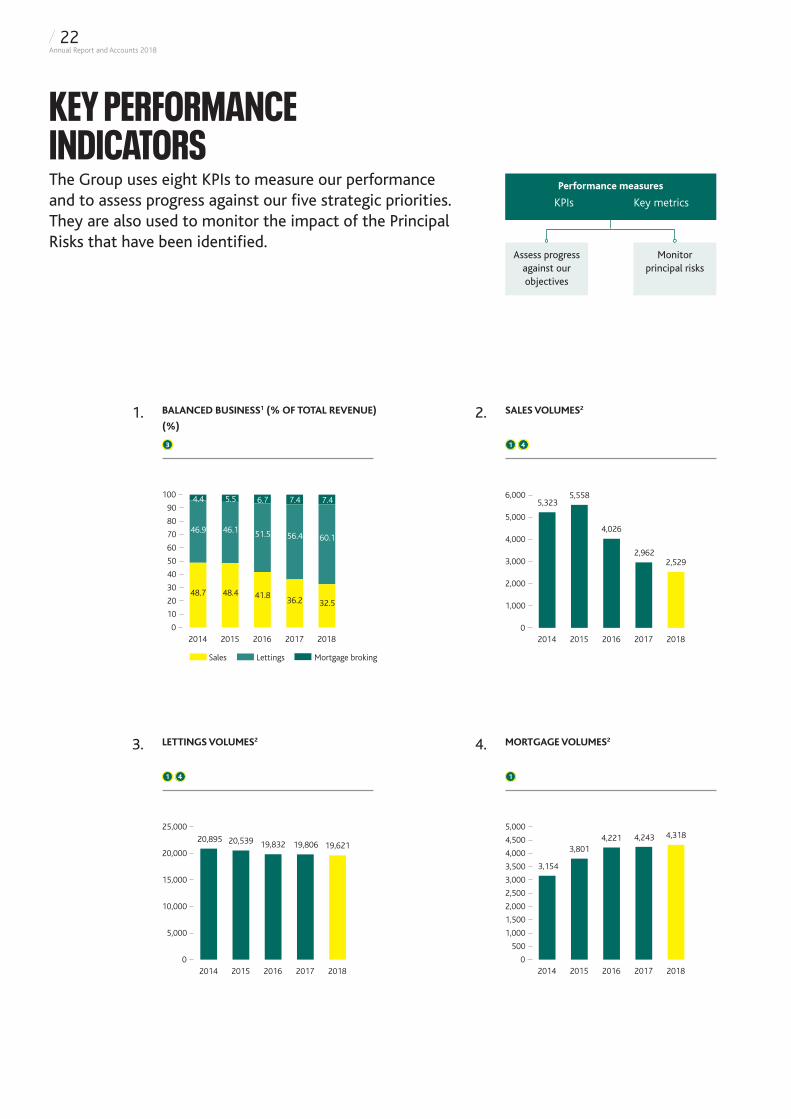
KEY PERFORMANCE INDICATORSThe Group uses eight KPIs to measure our performance and to assess progress against our five strategic priorities. They are also used to monitor the impact of the Principal Risks that have been identified.
Assess progress against our objectives
Monitor principal risks
Performance measures
KPIs Key metrics
0
10
20
30
40
50
60
70
80
90
100
20182017201620152014
46.9
4.4
48.7
46.1
5.5
48.4
51.5
6.7
41.8
56.4
7.4
36.2
60.1
7.4
32.5
Sales Lettings Mortgage broking
0
5,000
10,000
15,000
20,000
25,000
20182017201620152014
20,895 20,539 19,832 19,806 19,621
0
1,000
2,000
3,000
4,000
5,000
6,000
20182017201620152014
5,3235,558
4,026
2,9622,529
0
500
1,000
1,500
2,000
2,500
3,000
3,500
4,000
4,500
5,000
20182017201620152014
3,154
3,8014,221 4,243 4,318
BALANCED BUSINESS1 (% OF TOTAL REVENUE)
(%)
LETTINGS VOLUMES2
SALES VOLUMES2
MORTGAGE VOLUMES2
3
1 4
1 4
1
/ 22Annual Report and Accounts 2018
1.
3.
2.
4.
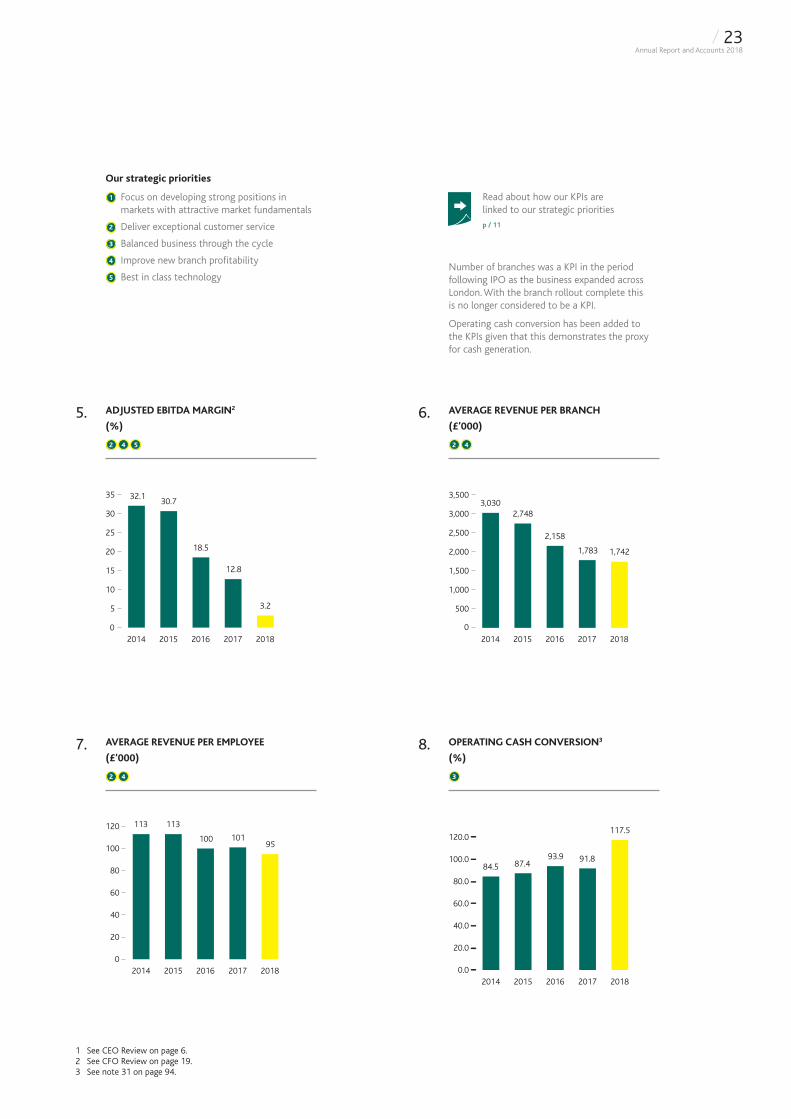
Our strategic priorities
1 Focus on developing strong positions in markets with attractive market fundamentals
2 Deliver exceptional customer service
3 Balanced business through the cycle
4 Improve new branch profitability
5 Best in class technology
0
5
10
15
20
25
30
35
20182017201620152014
32.130.7
18.5
12.8
3.2
0
500
1,000
1,500
2,000
2,500
3,000
3,500
20182017201620152014
3,0302,748
2,158
1,783 1,742
0.0
20.0
40.0
60.0
80.0
100.0
120.0
84.5 87.493.9 91.8
117.5
20182017201620152014
0
20
40
60
80
100
120
20182017201620152014
113 113
100 10195
ADJUSTED EBITDA MARGIN2
(%)
AVERAGE REVENUE PER BRANCH
(£’000)
OPERATING CASH CONVERSION3
(%)
AVERAGE REVENUE PER EMPLOYEE
(£’000)
2 54 2
3
4
2 4
Read about how our KPIs are linked to our strategic prioritiesp / 11
8.
1 See CEO Review on page 6.2 See CFO Review on page 19.3 See note 31 on page 94.
Number of branches was a KPI in the period following IPO as the business expanded across London. With the branch rollout complete this is no longer considered to be a KPI.
Operating cash conversion has been added to the KPIs given that this demonstrates the proxy for cash generation.
/ 23Annual Report and Accounts 2018
5.
7.
6.
PRINCIPAL RISKSThe Board is responsible for establishing and maintaining the Group’s system of risk management and internal control, with the aim of protecting its employees and customers and safeguarding the interests of the Company and its Shareholders in the constantly changing environment in which it operates.
Risk management
The Board regularly reviews the principal risks facing the Group together with the relevant mitigating controls and undertakes a robust assessment. In reviewing the principal risks the Board considers emerging risks and significant changes to existing risk ratings. In addition, the Board has set guidelines for risk appetite as part of the risk management process (see table overleaf) against which risks are monitored.
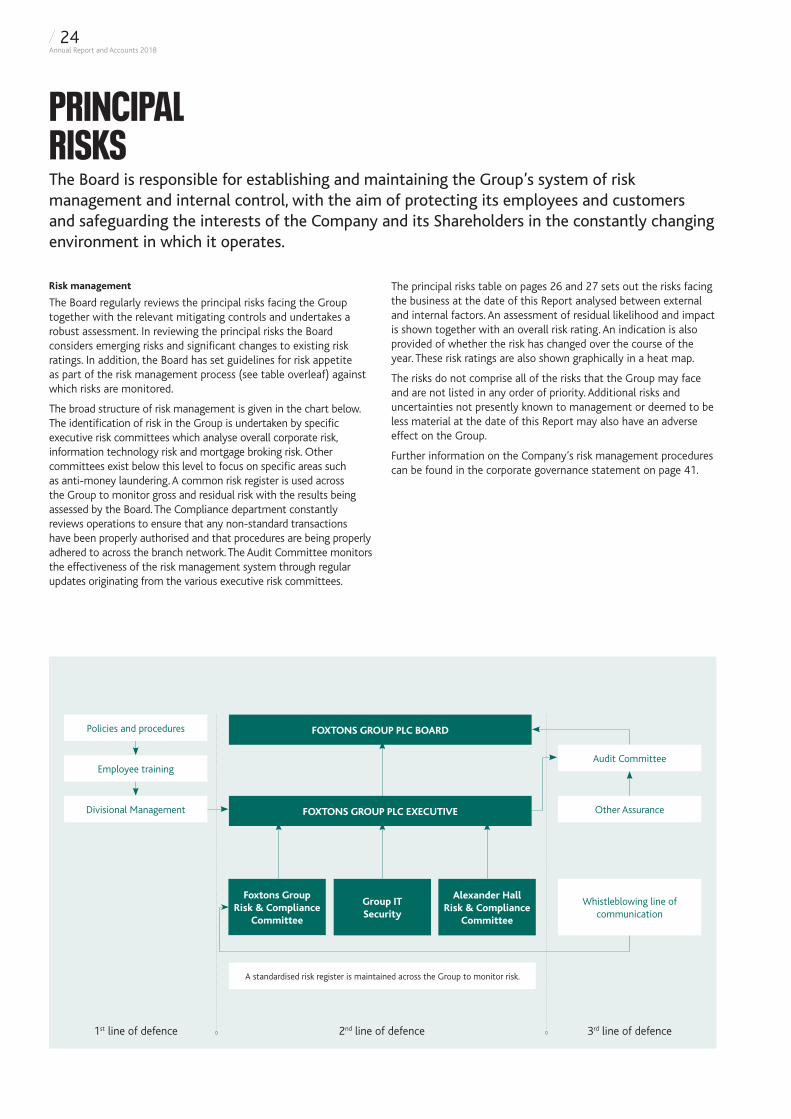
The broad structure of risk management is given in the chart below. The identification of risk in the Group is undertaken by specific executive risk committees which analyse overall corporate risk, information technology risk and mortgage broking risk. Other committees exist below this level to focus on specific areas such as anti-money laundering. A common risk register is used across the Group to monitor gross and residual risk with the results being assessed by the Board. The Compliance department constantly reviews operations to ensure that any non-standard transactions have been properly authorised and that procedures are being properly adhered to across the branch network. The Audit Committee monitors the effectiveness of the risk management system through regular updates originating from the various executive risk committees.
The principal risks table on pages 26 and 27 sets out the risks facing the business at the date of this Report analysed between external and internal factors. An assessment of residual likelihood and impact is shown together with an overall risk rating. An indication is also provided of whether the risk has changed over the course of the year. These risk ratings are also shown graphically in a heat map.
The risks do not comprise all of the risks that the Group may face and are not listed in any order of priority. Additional risks and uncertainties not presently known to management or deemed to be less material at the date of this Report may also have an adverse effect on the Group.
Further information on the Company’s risk management procedures can be found in the corporate governance statement on page 41.
2nd line of defence 3rd line of defence1st line of defence
Employee training
Whistleblowing line of communication
A standardised risk register is maintained across the Group to monitor risk.
Foxtons Group Risk & Compliance
Committee
Group IT Security
Alexander HallRisk & Compliance
Committee
Divisional Management
Audit Committee
Other Assurance
Policies and procedures FOXTONS GROUP PLC BOARD
FOXTONS GROUP PLC EXECUTIVE
/ 24Annual Report and Accounts 2018
RISK APPETITE
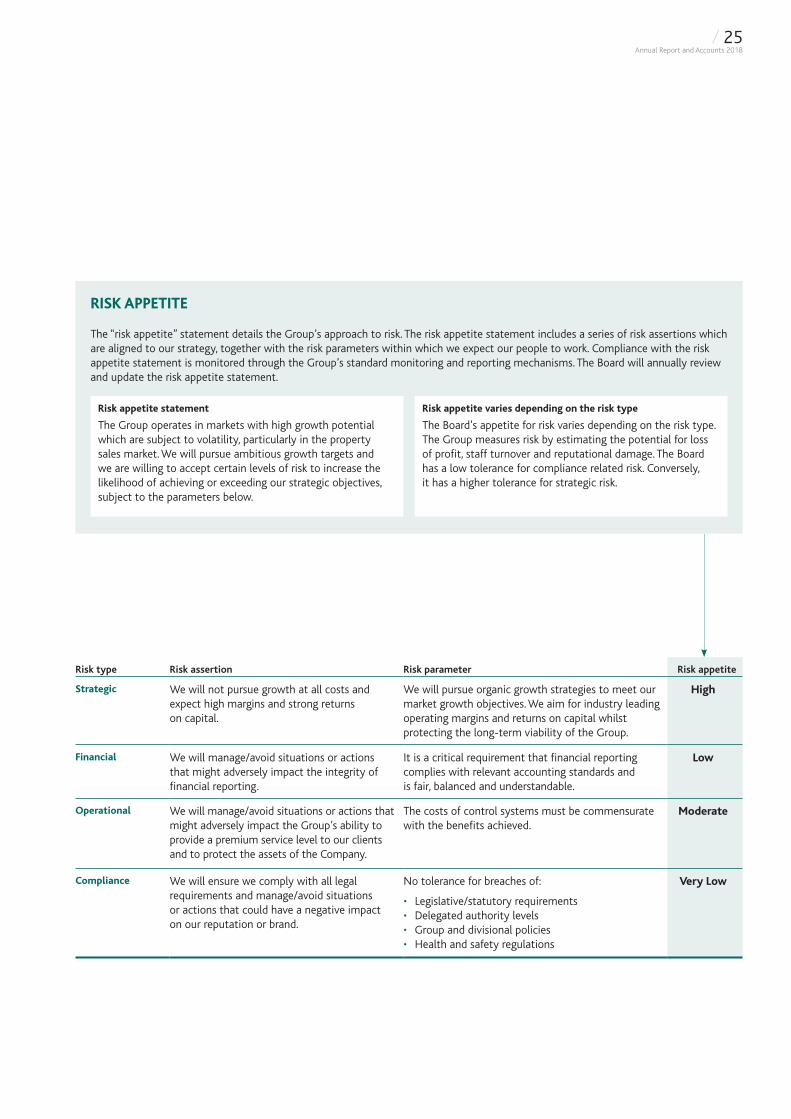
The “risk appetite” statement details the Group’s approach to risk. The risk appetite statement includes a series of risk assertions which are aligned to our strategy, together with the risk parameters within which we expect our people to work. Compliance with the risk appetite statement is monitored through the Group’s standard monitoring and reporting mechanisms. The Board will annually review and update the risk appetite statement.
Risk appetite statement
The Group operates in markets with high growth potential which are subject to volatility, particularly in the property sales market. We will pursue ambitious growth targets and we are willing to accept certain levels of risk to increase the likelihood of achieving or exceeding our strategic objectives, subject to the parameters below.
Risk appetite varies depending on the risk type
The Board’s appetite for risk varies depending on the risk type. The Group measures risk by estimating the potential for loss of profit, staff turnover and reputational damage. The Board has a low tolerance for compliance related risk. Conversely, it has a higher tolerance for strategic risk.
Risk type Risk assertion Risk parameter Risk appetite
Strategic We will not pursue growth at all costs and expect high margins and strong returns on capital.
We will pursue organic growth strategies to meet our market growth objectives. We aim for industry leading operating margins and returns on capital whilst protecting the long-term viability of the Group.
High
Financial We will manage/avoid situations or actions that might adversely impact the integrity of financial reporting.
It is a critical requirement that financial reporting complies with relevant accounting standards and is fair, balanced and understandable.
Low
Operational We will manage/avoid situations or actions that might adversely impact the Group’s ability to provide a premium service level to our clients and to protect the assets of the Company.
The costs of control systems must be commensurate with the benefits achieved.
Moderate
Compliance We will ensure we comply with all legal requirements and manage/avoid situations or actions that could have a negative impact on our reputation or brand.
No tolerance for breaches of:
• Legislative/statutory requirements• Delegated authority levels• Group and divisional policies• Health and safety regulations
Very Low
/ 25Annual Report and Accounts 2018
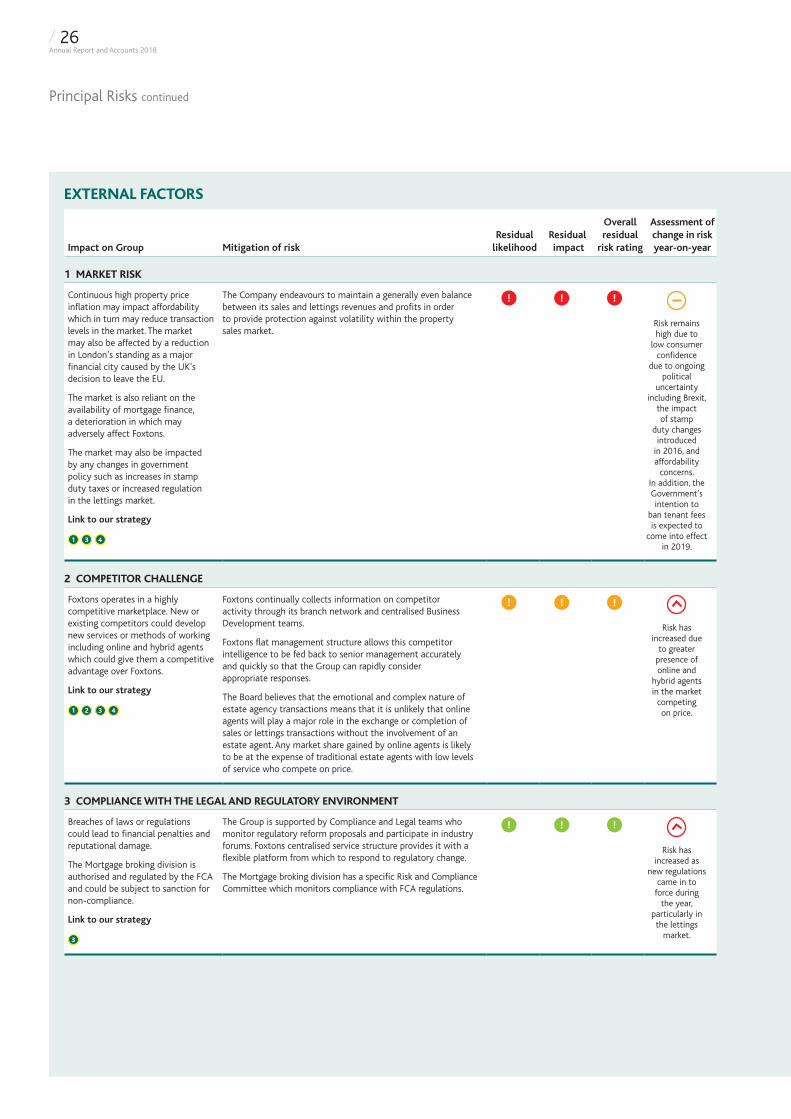
EXTERNAL FACTORS
Principal Risks continued
Impact on Group Mitigation of riskResidual
likelihoodResidual impact
Overall residual
risk rating
Assessment of change in risk year-on-year
1 MARKET RISK
Continuous high property price inflation may impact affordability which in turn may reduce transaction levels in the market. The market may also be affected by a reduction in London’s standing as a major financial city caused by the UK’s decision to leave the EU.
The market is also reliant on the availability of mortgage finance, a deterioration in which may adversely affect Foxtons.
The market may also be impacted by any changes in government policy such as increases in stamp duty taxes or increased regulation in the lettings market.
Link to our strategy
1 3 4
The Company endeavours to maintain a generally even balance between its sales and lettings revenues and profits in order to provide protection against volatility within the property sales market.
Risk remains high due to
low consumer confidence
due to ongoing political
uncertainty including Brexit,
the impact of stamp
duty changes introduced
in 2016, and affordability
concerns. In addition, the Government’s intention to
ban tenant fees is expected to
come into effect in 2019.
2 COMPETITOR CHALLENGE
Foxtons operates in a highly competitive marketplace. New or existing competitors could develop new services or methods of working including online and hybrid agents which could give them a competitive advantage over Foxtons.
Link to our strategy
1 2 3 4
Foxtons continually collects information on competitor activity through its branch network and centralised Business Development teams.
Foxtons flat management structure allows this competitor intelligence to be fed back to senior management accurately and quickly so that the Group can rapidly consider appropriate responses.
The Board believes that the emotional and complex nature of estate agency transactions means that it is unlikely that online agents will play a major role in the exchange or completion of sales or lettings transactions without the involvement of an estate agent. Any market share gained by online agents is likely to be at the expense of traditional estate agents with low levels of service who compete on price.
Risk has increased due
to greater presence of online and
hybrid agents in the market
competing on price.
3 COMPLIANCE WITH THE LEGAL AND REGULATORY ENVIRONMENT
Breaches of laws or regulations could lead to financial penalties and reputational damage.
The Mortgage broking division is authorised and regulated by the FCA and could be subject to sanction for non-compliance.
Link to our strategy
3
The Group is supported by Compliance and Legal teams who monitor regulatory reform proposals and participate in industry forums. Foxtons centralised service structure provides it with a flexible platform from which to respond to regulatory change.
The Mortgage broking division has a specific Risk and Compliance Committee which monitors compliance with FCA regulations.
Risk has increased as
new regulations came in to
force during the year,
particularly in the lettings
market.
/ 26Annual Report and Accounts 2018
EXTERNAL FACTORS
Our strategic priorities
1 Focus on developing strong positions in markets with attractive market fundamentals
2 Deliver exceptional customer service
3 Balanced business through the cycle
4 Improve profitability of newer branches
5 Best in class technology
Impact on Group Mitigation of riskResidual
likelihoodResidual impact
Overall residual
risk rating
Assessment of change in risk year-on-year
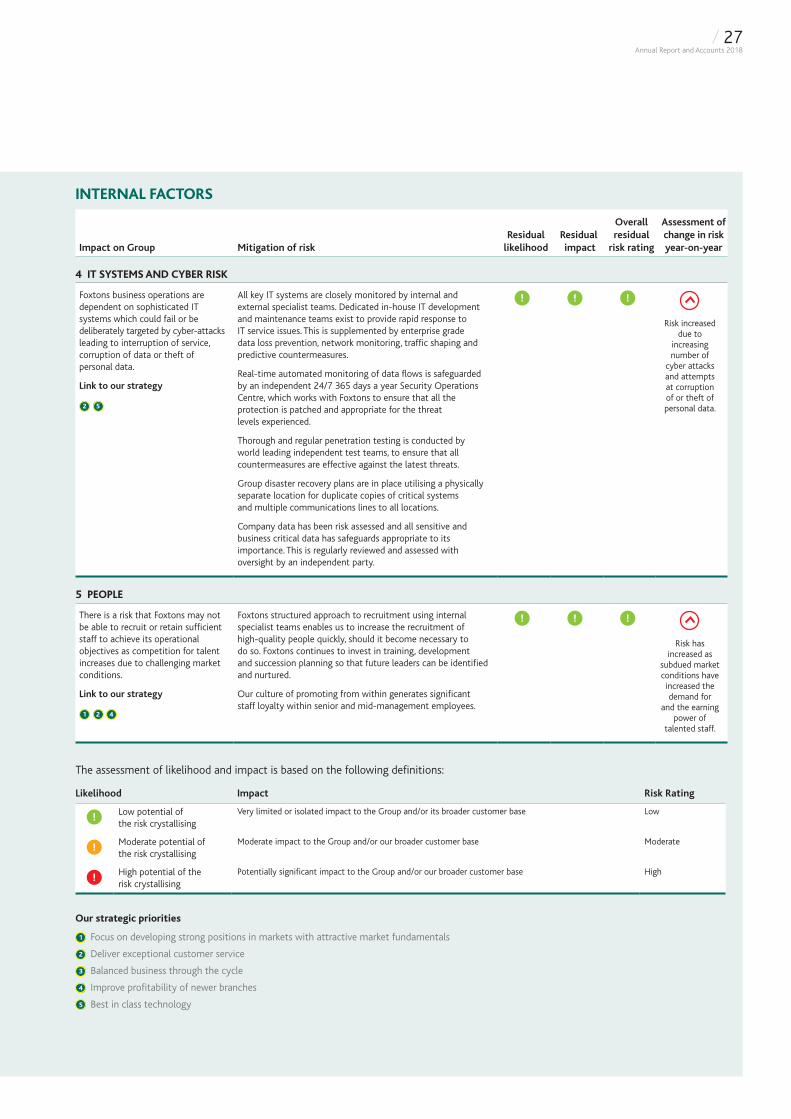
4 IT SYSTEMS AND CYBER RISK
Foxtons business operations are dependent on sophisticated IT systems which could fail or be deliberately targeted by cyber-attacks leading to interruption of service, corruption of data or theft of personal data.
Link to our strategy
2 5
All key IT systems are closely monitored by internal and external specialist teams. Dedicated in-house IT development and maintenance teams exist to provide rapid response to IT service issues. This is supplemented by enterprise grade data loss prevention, network monitoring, traffic shaping and predictive countermeasures.
Real-time automated monitoring of data flows is safeguarded by an independent 24/7 365 days a year Security Operations Centre, which works with Foxtons to ensure that all the protection is patched and appropriate for the threat levels experienced.
Thorough and regular penetration testing is conducted by world leading independent test teams, to ensure that all countermeasures are effective against the latest threats.
Group disaster recovery plans are in place utilising a physically separate location for duplicate copies of critical systems and multiple communications lines to all locations.
Company data has been risk assessed and all sensitive and business critical data has safeguards appropriate to its importance. This is regularly reviewed and assessed with oversight by an independent party.
Risk increased due to
increasing number of
cyber attacks and attempts at corruption of or theft of personal data.
5 PEOPLE
There is a risk that Foxtons may not be able to recruit or retain sufficient staff to achieve its operational objectives as competition for talent increases due to challenging market conditions.
Link to our strategy
1 2 4
Foxtons structured approach to recruitment using internal specialist teams enables us to increase the recruitment of high-quality people quickly, should it become necessary to do so. Foxtons continues to invest in training, development and succession planning so that future leaders can be identified and nurtured.
Our culture of promoting from within generates significant staff loyalty within senior and mid-management employees.
Risk has increased as
subdued market conditions have increased the demand for
and the earning power of
talented staff.
The assessment of likelihood and impact is based on the following definitions:
Likelihood Impact Risk Rating
Low potential of the risk crystallising
Very limited or isolated impact to the Group and/or its broader customer base Low
Moderate potential of the risk crystallising
Moderate impact to the Group and/or our broader customer base Moderate
High potential of the risk crystallising
Potentially significant impact to the Group and/or our broader customer base High
INTERNAL FACTORS
/ 27Annual Report and Accounts 2018
ViabilityThe Group’s prospects are assessed through the Group’s strategic planning process. Financial projections for the next five years are compiled from estimates of financial performance after taking into account principal risks.
Key assumptions within the strategic plan include sales and lettings market volume and price forecasts, market share assumptions and the inherent flexibility of our cost base. Changes to legislation are considered, such as the proposed ban on tenant fees due to be introduced in June 2019.
The Group’s conservative approach to its use of cash resources, its net cash position, and the availability of a £10 million revolving credit facility, are also key factors. Whilst the existing facility expires in July 2019, the Board has a reasonable expectation that the Group will be able to enter in to a new appropriate facility upon expiry either with its existing lender, or with new lenders.
Assessment of viabilityIn accordance with provision C.2.2 of the 2016 revision of the UK Corporate Governance Code, the Directors have assessed the prospects of the Company over a longer period than the 12 months required by the ‘going concern’ provision.
Given the extended nature of the current downturn and the associated macro political environment, the Directors have determined that five years is the most appropriate timeframe over which the Board should assess the long-term viability of the Group, with this being the longest period over which the Board considered an appropriate assessment of the principal risks could be made. This is consistent with the period over which the Group’s strategic review is assessed by the Board, and is aligned to the performance measurement period for the long term incentive plan.
This assessment has considered the potential impact of the principal risks on the business model, future performance and liquidity of the Group over the period. In making this statement the Directors have considered the resilience of the Group under varying market conditions together with the timing and effectiveness of any cost mitigation actions.
Specifically, the Board has reviewed its five-year financial plan and stress-tested it against the financial impact of a number of scenarios beyond those included in the plan. These included those principal risks considered to be the most important, namely: market risk (property price deflation and reductions in transaction volumes); competitor risks arising from online and hybrid agents; and regulatory compliance (including the impact of the proposed change in legislation in respect of tenants fees).
Our core proposition in our business planning is that our market is cyclical. Our planning is cautious and therefore many potential upsides are not included. However, we recognise that Brexit could further prolong the existing uncertainty in the market and therefore, scenarios tested included a severe short term decline in transaction volumes, and a prolonged period of materially depressed volumes. The results took into account the availability and effectiveness of controllable mitigating actions, including reducing capex and reductions in the cost base. Each of these actions would be available to limit the impact of the identified risks.
The Directors considered the impact of these severe, but plausible scenarios to determine their overall effect on the Group’s financial position. The results of the stress testing showed that the Group would be able to withstand the impact of those scenarios by adjusting its operating plans, without the use of its loan facility.
Viability statementIn coming to this conclusion, the Directors have taken account of the Group’s net cash position, the intended replacement of the £10 million loan facility, forecast cash generation and key potential mitigating actions of reducing cost and restricting dividend payments. Based upon the results of this analysis, the Directors have a reasonable expectation that the Group will be able to continue in operation and meet its liabilities as they fall due over the five year period of their detailed assessment.
The EU referendumThe result of the EU referendum in June 2016 has contributed to a prolonged period of macro-economic uncertainty which has had a significant impact on the London property market.
We have assessed all material elements of our supply chain and are satisfied that the impact on the business will not be significant. More than 99% of our purchases are procured locally in GBP and we believe the labour pool in London is sufficiently liquid that talent will be available.
Given the prolonged downturn in the sales market, we have sought to diversify the business towards our lettings business which is less cyclical than our sales business.
The precise impact on the London property market of the decision to leave the EU is difficult to forecast, as are how events will unfold post 29 March 2019.
Principal Risks continued
PRINCIPAL RISK RESIDUAL HEAT MAP
The principal risk residual heat map is a visual representation of the principal risks facing the Group. Risks shown in the bottom left-hand corner of the chart have a low risk rating as they have a low likelihood of occurring and a low potential impact on the Group. Conversely, risks shown in the top right-hand corner of the chart have a high risk rating as they have a high likelihood of occurring and a high potential impact on the Group.
Assessment of change in risk year-on-year
Assessment of whether there has been a change in the level of risk due to either a change in probability or a change in potential impact versus the 2017 Annual Report and Accounts.
Assessment of risk versus Board’s appetite for risk
The Board has assessed the risks of the Group and with the exception of market risk considers all risks to be within the Board’s appetite for risk. The Board recognises that the Group operates in markets which are cyclical and subject to volatility. As such the Board’s risk appetite for market risk is high. However, despite this high tolerance, current risk levels are considered to exceed acceptable levels due to circumstances beyond the Group’s control. Although current volatility levels in the sales market are extremely high, the Board considers that all short term actions have been taken to mitigate the impact on the Group. Group forecasts expect the sales market to return to more normal levels in the medium term.
Like
liho
od
Impact
Key:1 Market risk
2 Competitor challenge
3 Compliance with legal and regulatory environment
4 IT systems and cyber risk
5 People
mod
erat
elo
whi
gh
moderatelow high
5
43
2
1
Movement in risk versus 2017 Annual Report and Accounts:
• Competitor challenge (2): has increased in our existing markets.
• Compliance with legal and regulatory environment (3): has increased due to greater licensing complexity in the lettings business.
• IT systems and cyber risk (4): has increased due to a higher threat level of terrorism, ransomware and potential personal data theft.
• People (5): The market for talented staff has increased in competitiveness due to the challenging market environment.
/ 28Annual Report and Accounts 2018
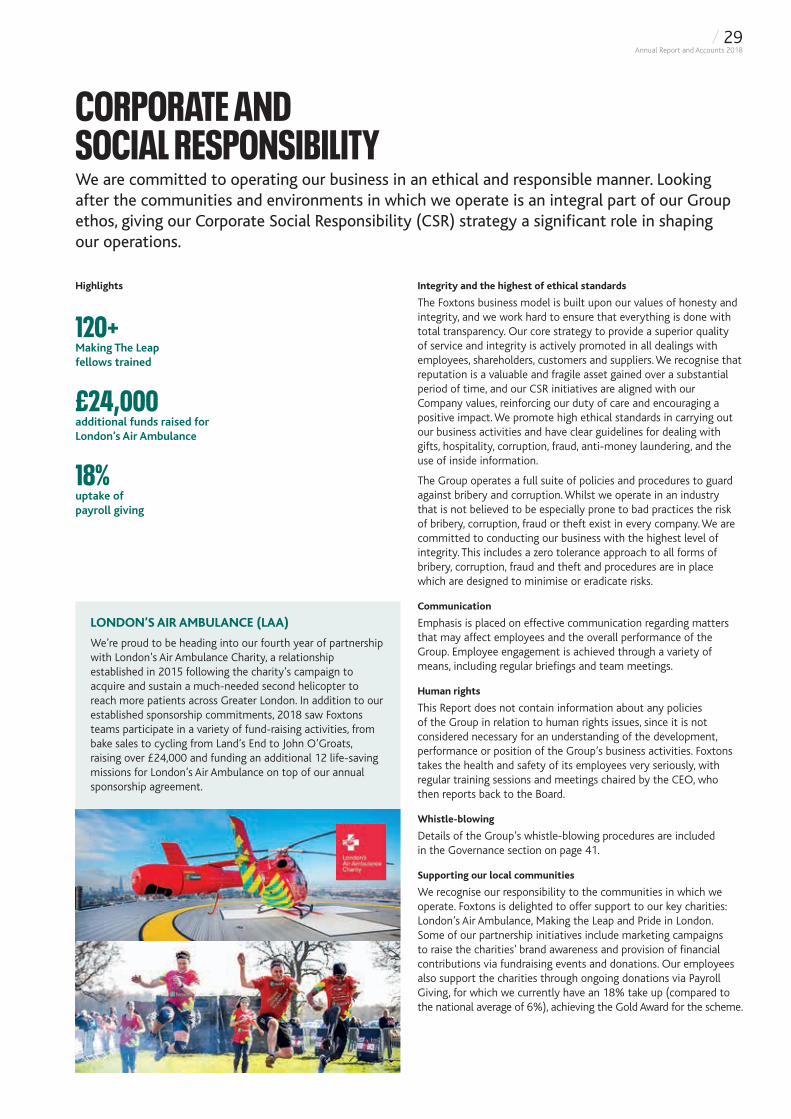
LONDON’S AIR AMBULANCE (LAA)
We’re proud to be heading into our fourth year of partnership with London’s Air Ambulance Charity, a relationship established in 2015 following the charity’s campaign to acquire and sustain a much-needed second helicopter to reach more patients across Greater London. In addition to our established sponsorship commitments, 2018 saw Foxtons teams participate in a variety of fund-raising activities, from bake sales to cycling from Land’s End to John O’Groats, raising over £24,000 and funding an additional 12 life-saving missions for London’s Air Ambulance on top of our annual sponsorship agreement.
CORPORATE AND SOCIAL RESPONSIBILITYWe are committed to operating our business in an ethical and responsible manner. Looking after the communities and environments in which we operate is an integral part of our Group ethos, giving our Corporate Social Responsibility (CSR) strategy a significant role in shaping our operations.
Integrity and the highest of ethical standards
The Foxtons business model is built upon our values of honesty and integrity, and we work hard to ensure that everything is done with total transparency. Our core strategy to provide a superior quality of service and integrity is actively promoted in all dealings with employees, shareholders, customers and suppliers. We recognise that reputation is a valuable and fragile asset gained over a substantial period of time, and our CSR initiatives are aligned with our Company values, reinforcing our duty of care and encouraging a positive impact. We promote high ethical standards in carrying out our business activities and have clear guidelines for dealing with gifts, hospitality, corruption, fraud, anti-money laundering, and the use of inside information.
The Group operates a full suite of policies and procedures to guard against bribery and corruption. Whilst we operate in an industry that is not believed to be especially prone to bad practices the risk of bribery, corruption, fraud or theft exist in every company. We are committed to conducting our business with the highest level of integrity. This includes a zero tolerance approach to all forms of bribery, corruption, fraud and theft and procedures are in place which are designed to minimise or eradicate risks.
Communication
Emphasis is placed on effective communication regarding matters that may affect employees and the overall performance of the Group. Employee engagement is achieved through a variety of means, including regular briefings and team meetings.
Human rights
This Report does not contain information about any policies of the Group in relation to human rights issues, since it is not considered necessary for an understanding of the development, performance or position of the Group’s business activities. Foxtons takes the health and safety of its employees very seriously, with regular training sessions and meetings chaired by the CEO, who then reports back to the Board.
Whistle-blowing
Details of the Group’s whistle-blowing procedures are included in the Governance section on page 41.
Supporting our local communities
We recognise our responsibility to the communities in which we operate. Foxtons is delighted to offer support to our key charities: London’s Air Ambulance, Making the Leap and Pride in London. Some of our partnership initiatives include marketing campaigns to raise the charities’ brand awareness and provision of financial contributions via fundraising events and donations. Our employees also support the charities through ongoing donations via Payroll Giving, for which we currently have an 18% take up (compared to the national average of 6%), achieving the Gold Award for the scheme.
Highlights
120+Making The Leap fellows trained
£24,000additional funds raised for London’s Air Ambulance
18%uptake of payroll giving
/ 29Annual Report and Accounts 2018
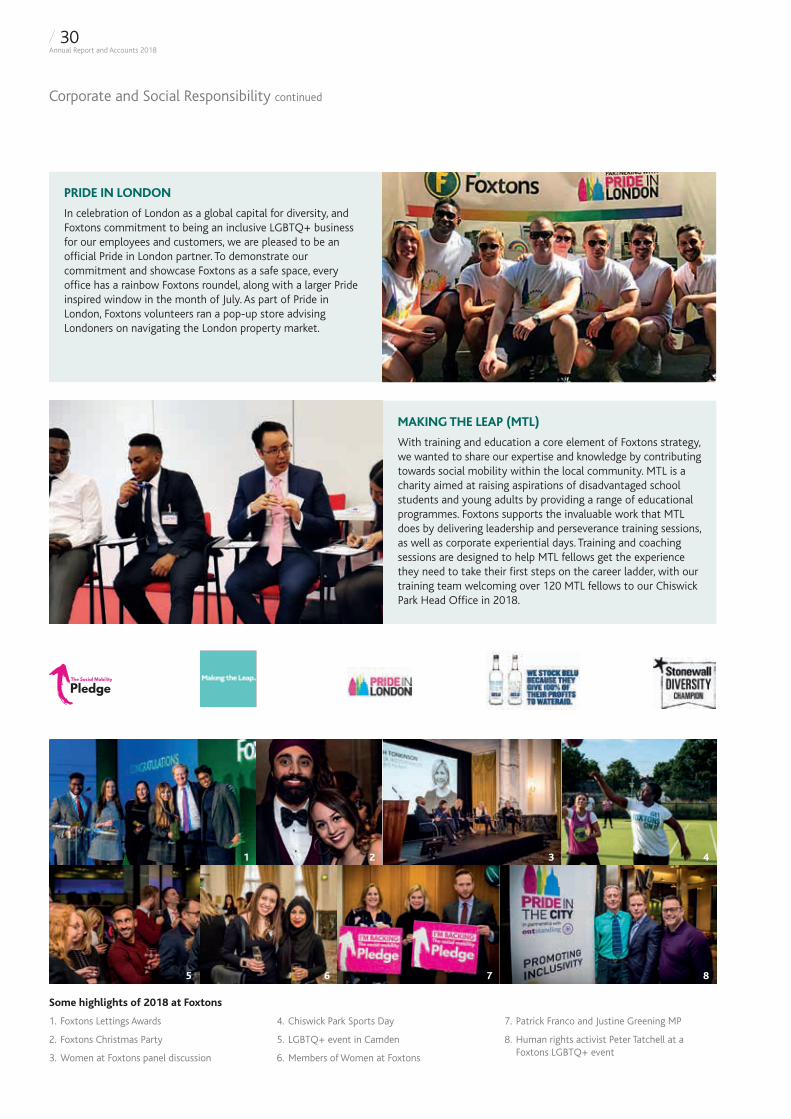
Corporate and Social Responsibility continued
PRIDE IN LONDON
In celebration of London as a global capital for diversity, and Foxtons commitment to being an inclusive LGBTQ+ business for our employees and customers, we are pleased to be an official Pride in London partner. To demonstrate our commitment and showcase Foxtons as a safe space, every office has a rainbow Foxtons roundel, along with a larger Pride inspired window in the month of July. As part of Pride in London, Foxtons volunteers ran a pop-up store advising Londoners on navigating the London property market.
MAKING THE LEAP (MTL)
With training and education a core element of Foxtons strategy, we wanted to share our expertise and knowledge by contributing towards social mobility within the local community. MTL is a charity aimed at raising aspirations of disadvantaged school students and young adults by providing a range of educational programmes. Foxtons supports the invaluable work that MTL does by delivering leadership and perseverance training sessions, as well as corporate experiential days. Training and coaching sessions are designed to help MTL fellows get the experience they need to take their first steps on the career ladder, with our training team welcoming over 120 MTL fellows to our Chiswick Park Head Office in 2018.
Some highlights of 2018 at Foxtons
1. Foxtons Lettings Awards
2. Foxtons Christmas Party
3. Women at Foxtons panel discussion
4. Chiswick Park Sports Day
5. LGBTQ+ event in Camden
6. Members of Women at Foxtons
7. Patrick Franco and Justine Greening MP
8. Human rights activist Peter Tatchell at a Foxtons LGBTQ+ event
4
8
3
6
21
5 7
/ 30Annual Report and Accounts 2018
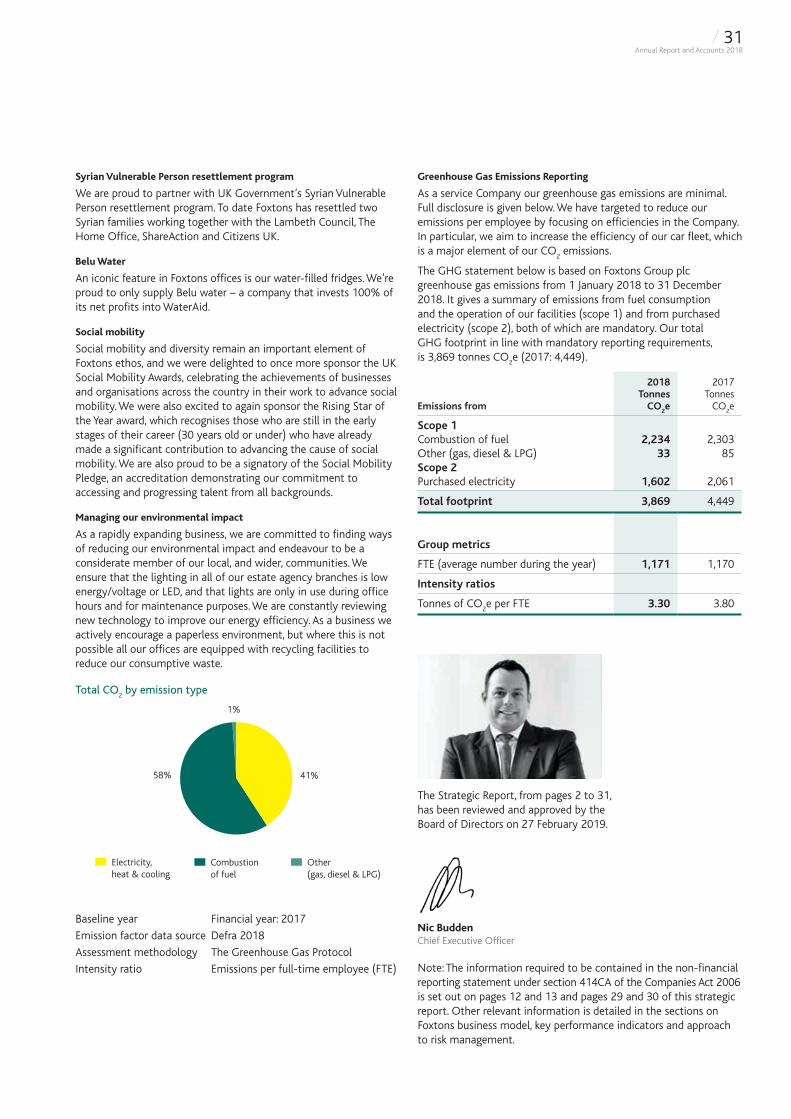
Syrian Vulnerable Person resettlement program
We are proud to partner with UK Government’s Syrian Vulnerable Person resettlement program. To date Foxtons has resettled two Syrian families working together with the Lambeth Council, The Home Office, ShareAction and Citizens UK.
Belu Water
An iconic feature in Foxtons offices is our water-filled fridges. We’re proud to only supply Belu water – a company that invests 100% of its net profits into WaterAid.
Social mobility
Social mobility and diversity remain an important element of Foxtons ethos, and we were delighted to once more sponsor the UK Social Mobility Awards, celebrating the achievements of businesses and organisations across the country in their work to advance social mobility. We were also excited to again sponsor the Rising Star of the Year award, which recognises those who are still in the early stages of their career (30 years old or under) who have already made a significant contribution to advancing the cause of social mobility. We are also proud to be a signatory of the Social Mobility Pledge, an accreditation demonstrating our commitment to accessing and progressing talent from all backgrounds.
Managing our environmental impact
As a rapidly expanding business, we are committed to finding ways of reducing our environmental impact and endeavour to be a considerate member of our local, and wider, communities. We ensure that the lighting in all of our estate agency branches is low energy/voltage or LED, and that lights are only in use during office hours and for maintenance purposes. We are constantly reviewing new technology to improve our energy efficiency. As a business we actively encourage a paperless environment, but where this is not possible all our offices are equipped with recycling facilities to reduce our consumptive waste.
Greenhouse Gas Emissions Reporting
As a service Company our greenhouse gas emissions are minimal. Full disclosure is given below. We have targeted to reduce our emissions per employee by focusing on efficiencies in the Company. In particular, we aim to increase the efficiency of our car fleet, which is a major element of our CO
2 emissions.
The GHG statement below is based on Foxtons Group plc greenhouse gas emissions from 1 January 2018 to 31 December 2018. It gives a summary of emissions from fuel consumption and the operation of our facilities (scope 1) and from purchased electricity (scope 2), both of which are mandatory. Our total GHG footprint in line with mandatory reporting requirements, is 3,869 tonnes CO
2e (2017: 4,449).
Emissions from
2018 Tonnes
CO2e
2017 Tonnes
CO2e
Scope 1Combustion of fuel 2,234 2,303Other (gas, diesel & LPG) 33 85Scope 2Purchased electricity 1,602 2,061
Total footprint 3,869 4,449
Group metrics
FTE (average number during the year) 1,171 1,170
Intensity ratios
Tonnes of CO2e per FTE 3.30 3.80
Total CO2 by emission type
1%
41%58%
Combustionof fuel
Other(gas, diesel & LPG)
Electricity,heat & cooling
Baseline year Financial year: 2017
Emission factor data source Defra 2018
Assessment methodology The Greenhouse Gas Protocol
Intensity ratio Emissions per full-time employee (FTE)
The Strategic Report, from pages 2 to 31, has been reviewed and approved by the Board of Directors on 27 February 2019.
Nic BuddenChief Executive Officer
Note: The information required to be contained in the non-financial reporting statement under section 414CA of the Companies Act 2006 is set out on pages 12 and 13 and pages 29 and 30 of this strategic report. Other relevant information is detailed in the sections on Foxtons business model, key performance indicators and approach to risk management.
/ 31Annual Report and Accounts 2018

/ 32Annual Report and Accounts 2018
GOVERNANCE
/ 33Annual Report and Accounts 2018
p / 34
p / 42
p / 44
p / 47
OUR EXPERIENCED LEADERSHIP TEAMWe have a balanced and experienced leadership team.
DIVERSITY & BALANCEThe Nomination Committee will be focusing on the succession planning of senior management.
EMBRACING CHANGEThe primary function of the Audit Committee is to assist the Board in fulfilling its responsibilities to protect the interests of the Shareholders.
AN OPEN & TRANSPARENT DIALOGUEThe Remuneration Committee are committed to maintaining an open and transparent dialogue with Shareholders.
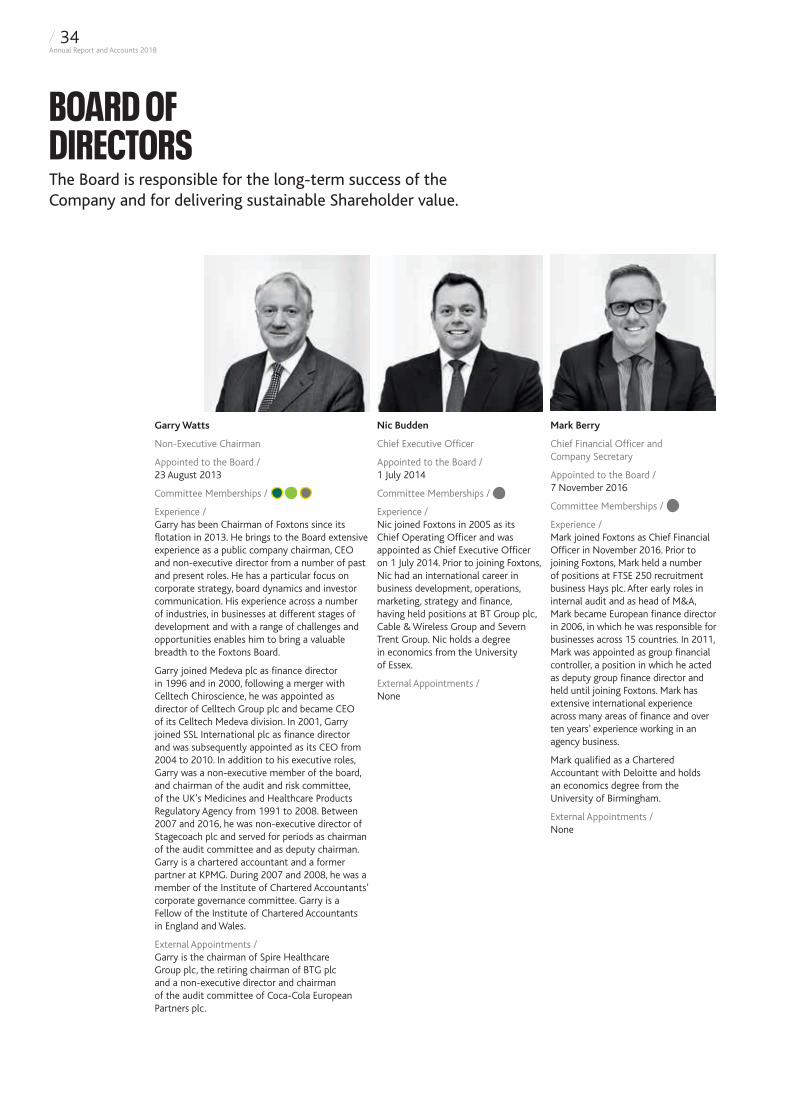
BOARD OF DIRECTORSThe Board is responsible for the long-term success of the Company and for delivering sustainable Shareholder value.
Mark Berry
Chief Financial Officer and Company Secretary
Appointed to the Board / 7 November 2016
Committee Memberships /
Experience / Mark joined Foxtons as Chief Financial Officer in November 2016. Prior to joining Foxtons, Mark held a number of positions at FTSE 250 recruitment business Hays plc. After early roles in internal audit and as head of M&A, Mark became European finance director in 2006, in which he was responsible for businesses across 15 countries. In 2011, Mark was appointed as group financial controller, a position in which he acted as deputy group finance director and held until joining Foxtons. Mark has extensive international experience across many areas of finance and over ten years’ experience working in an agency business.
Mark qualified as a Chartered Accountant with Deloitte and holds an economics degree from the University of Birmingham.
External Appointments / None
Nic Budden
Chief Executive Officer
Appointed to the Board / 1 July 2014
Committee Memberships /
Experience / Nic joined Foxtons in 2005 as its Chief Operating Officer and was appointed as Chief Executive Officer on 1 July 2014. Prior to joining Foxtons, Nic had an international career in business development, operations, marketing, strategy and finance, having held positions at BT Group plc, Cable & Wireless Group and Severn Trent Group. Nic holds a degree in economics from the University of Essex.
External Appointments / None
Garry Watts
Non-Executive Chairman
Appointed to the Board / 23 August 2013
Committee Memberships /
Experience / Garry has been Chairman of Foxtons since its flotation in 2013. He brings to the Board extensive experience as a public company chairman, CEO and non-executive director from a number of past and present roles. He has a particular focus on corporate strategy, board dynamics and investor communication. His experience across a number of industries, in businesses at different stages of development and with a range of challenges and opportunities enables him to bring a valuable breadth to the Foxtons Board.
Garry joined Medeva plc as finance director in 1996 and in 2000, following a merger with Celltech Chiroscience, he was appointed as director of Celltech Group plc and became CEO of its Celltech Medeva division. In 2001, Garry joined SSL International plc as finance director and was subsequently appointed as its CEO from 2004 to 2010. In addition to his executive roles, Garry was a non-executive member of the board, and chairman of the audit and risk committee, of the UK’s Medicines and Healthcare Products Regulatory Agency from 1991 to 2008. Between 2007 and 2016, he was non-executive director of Stagecoach plc and served for periods as chairman of the audit committee and as deputy chairman. Garry is a chartered accountant and a former partner at KPMG. During 2007 and 2008, he was a member of the Institute of Chartered Accountants’ corporate governance committee. Garry is a Fellow of the Institute of Chartered Accountants in England and Wales.
External Appointments / Garry is the chairman of Spire Healthcare Group plc, the retiring chairman of BTG plc and a non-executive director and chairman of the audit committee of Coca-Cola European Partners plc.
/ 34Annual Report and Accounts 2018
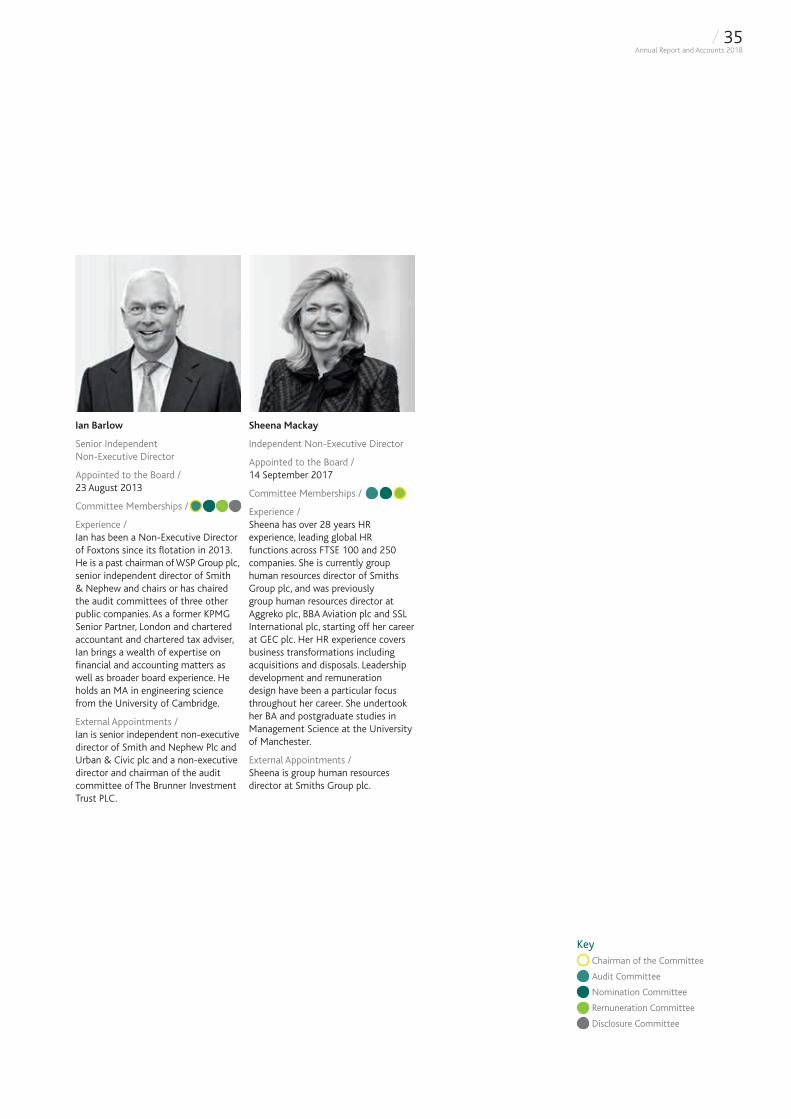
Sheena Mackay
Independent Non-Executive Director
Appointed to the Board / 14 September 2017
Committee Memberships /
Experience / Sheena has over 28 years HR experience, leading global HR functions across FTSE 100 and 250 companies. She is currently group human resources director of Smiths Group plc, and was previously group human resources director at Aggreko plc, BBA Aviation plc and SSL International plc, starting off her career at GEC plc. Her HR experience covers business transformations including acquisitions and disposals. Leadership development and remuneration design have been a particular focus throughout her career. She undertook her BA and postgraduate studies in Management Science at the University of Manchester.
External Appointments / Sheena is group human resources director at Smiths Group plc.
Ian Barlow
Senior Independent Non-Executive Director
Appointed to the Board / 23 August 2013
Committee Memberships /
Experience / Ian has been a Non-Executive Director of Foxtons since its flotation in 2013. He is a past chairman of WSP Group plc, senior independent director of Smith & Nephew and chairs or has chaired the audit committees of three other public companies. As a former KPMG Senior Partner, London and chartered accountant and chartered tax adviser, Ian brings a wealth of expertise on financial and accounting matters as well as broader board experience. He holds an MA in engineering science from the University of Cambridge.
External Appointments / Ian is senior independent non-executive director of Smith and Nephew Plc and Urban & Civic plc and a non-executive director and chairman of the audit committee of The Brunner Investment Trust PLC.
Key Chairman of the Committee
Audit Committee
Nomination Committee
Remuneration Committee
Disclosure Committee
/ 35Annual Report and Accounts 2018
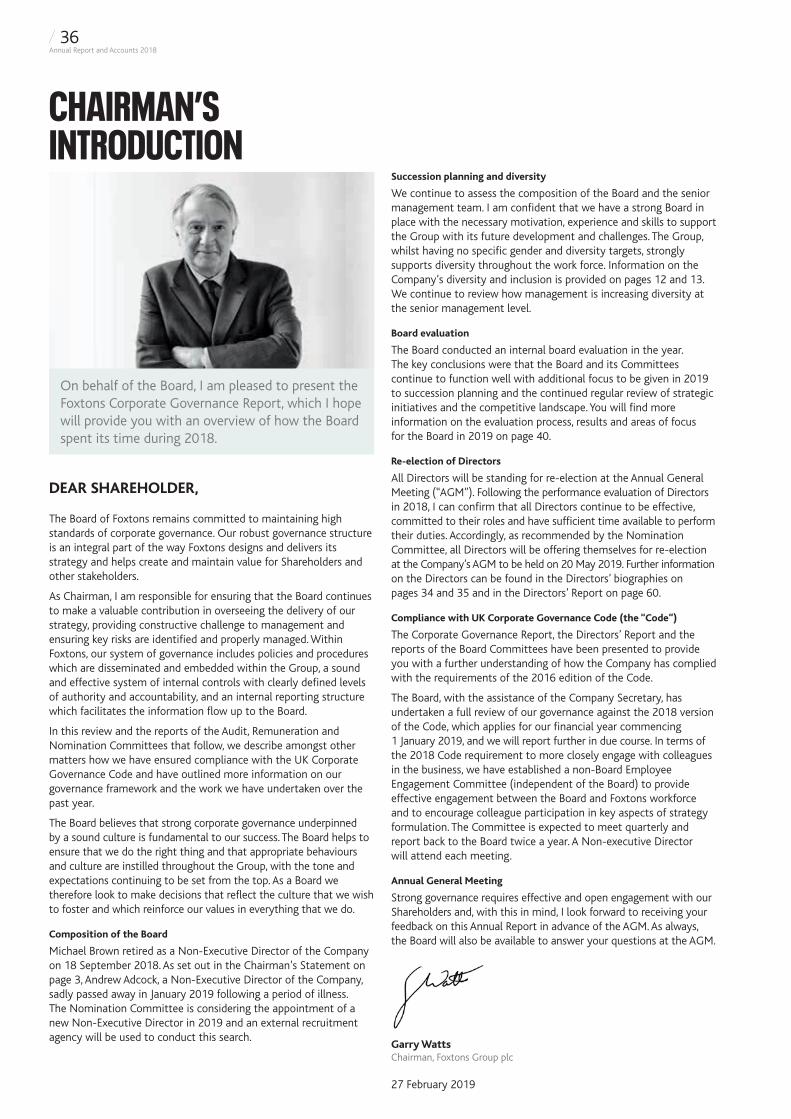
CHAIRMAN’S INTRODUCTION
DEAR SHAREHOLDER,
The Board of Foxtons remains committed to maintaining high standards of corporate governance. Our robust governance structure is an integral part of the way Foxtons designs and delivers its strategy and helps create and maintain value for Shareholders and other stakeholders.
As Chairman, I am responsible for ensuring that the Board continues to make a valuable contribution in overseeing the delivery of our strategy, providing constructive challenge to management and ensuring key risks are identified and properly managed. Within Foxtons, our system of governance includes policies and procedures which are disseminated and embedded within the Group, a sound and effective system of internal controls with clearly defined levels of authority and accountability, and an internal reporting structure which facilitates the information flow up to the Board.
In this review and the reports of the Audit, Remuneration and Nomination Committees that follow, we describe amongst other matters how we have ensured compliance with the UK Corporate Governance Code and have outlined more information on our governance framework and the work we have undertaken over the past year.
The Board believes that strong corporate governance underpinned by a sound culture is fundamental to our success. The Board helps to ensure that we do the right thing and that appropriate behaviours and culture are instilled throughout the Group, with the tone and expectations continuing to be set from the top. As a Board we therefore look to make decisions that reflect the culture that we wish to foster and which reinforce our values in everything that we do.
Composition of the Board
Michael Brown retired as a Non-Executive Director of the Company on 18 September 2018. As set out in the Chairman’s Statement on page 3, Andrew Adcock, a Non-Executive Director of the Company, sadly passed away in January 2019 following a period of illness. The Nomination Committee is considering the appointment of a new Non-Executive Director in 2019 and an external recruitment agency will be used to conduct this search.
Succession planning and diversity
We continue to assess the composition of the Board and the senior management team. I am confident that we have a strong Board in place with the necessary motivation, experience and skills to support the Group with its future development and challenges. The Group, whilst having no specific gender and diversity targets, strongly supports diversity throughout the work force. Information on the Company’s diversity and inclusion is provided on pages 12 and 13. We continue to review how management is increasing diversity at the senior management level.
Board evaluation
The Board conducted an internal board evaluation in the year. The key conclusions were that the Board and its Committees continue to function well with additional focus to be given in 2019 to succession planning and the continued regular review of strategic initiatives and the competitive landscape. You will find more information on the evaluation process, results and areas of focus for the Board in 2019 on page 40.
Re-election of Directors
All Directors will be standing for re-election at the Annual General Meeting (“AGM”). Following the performance evaluation of Directors in 2018, I can confirm that all Directors continue to be effective, committed to their roles and have sufficient time available to perform their duties. Accordingly, as recommended by the Nomination Committee, all Directors will be offering themselves for re-election at the Company’s AGM to be held on 20 May 2019. Further information on the Directors can be found in the Directors’ biographies on pages 34 and 35 and in the Directors’ Report on page 60.
Compliance with UK Corporate Governance Code (the “Code”)
The Corporate Governance Report, the Directors’ Report and the reports of the Board Committees have been presented to provide you with a further understanding of how the Company has complied with the requirements of the 2016 edition of the Code.
The Board, with the assistance of the Company Secretary, has undertaken a full review of our governance against the 2018 version of the Code, which applies for our financial year commencing 1 January 2019, and we will report further in due course. In terms of the 2018 Code requirement to more closely engage with colleagues in the business, we have established a non-Board Employee Engagement Committee (independent of the Board) to provide effective engagement between the Board and Foxtons workforce and to encourage colleague participation in key aspects of strategy formulation. The Committee is expected to meet quarterly and report back to the Board twice a year. A Non-executive Director will attend each meeting.
Annual General Meeting
Strong governance requires effective and open engagement with our Shareholders and, with this in mind, I look forward to receiving your feedback on this Annual Report in advance of the AGM. As always, the Board will also be available to answer your questions at the AGM.
Garry WattsChairman, Foxtons Group plc
27 February 2019
On behalf of the Board, I am pleased to present the Foxtons Corporate Governance Report, which I hope will provide you with an overview of how the Board spent its time during 2018.
/ 36Annual Report and Accounts 2018
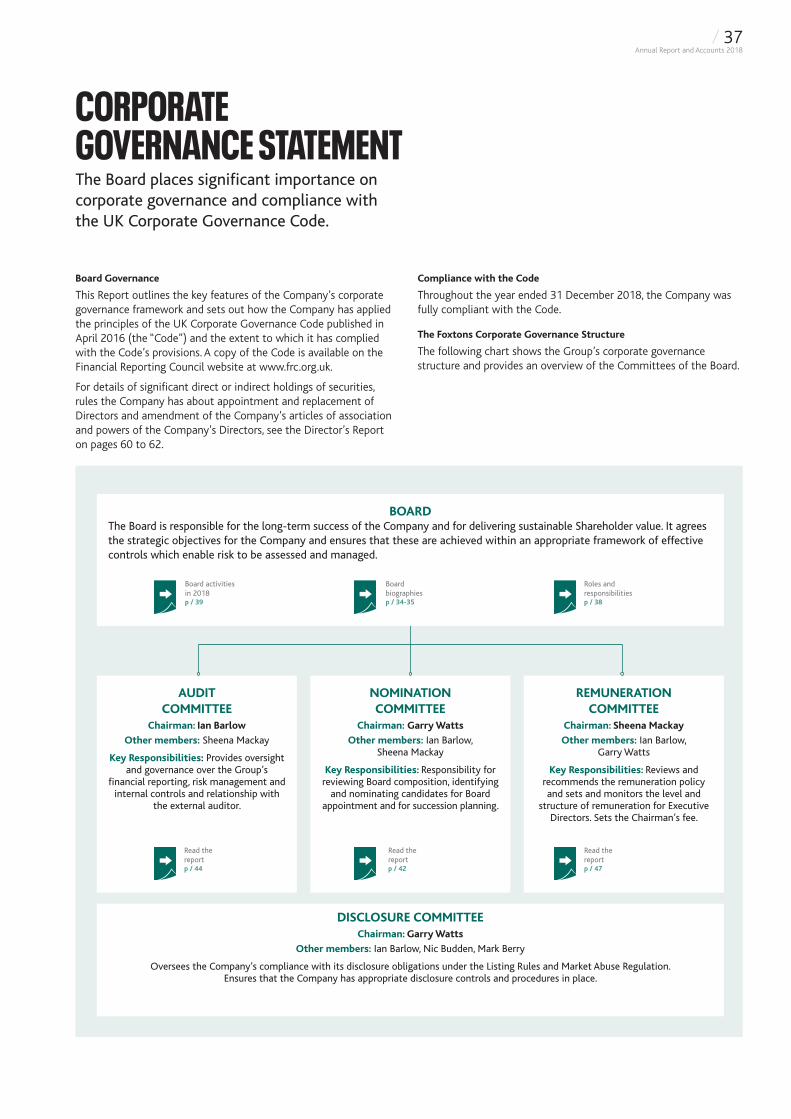
CORPORATE GOVERNANCE STATEMENTThe Board places significant importance on corporate governance and compliance with the UK Corporate Governance Code.
Board Governance
This Report outlines the key features of the Company’s corporate governance framework and sets out how the Company has applied the principles of the UK Corporate Governance Code published in April 2016 (the “Code”) and the extent to which it has complied with the Code’s provisions. A copy of the Code is available on the Financial Reporting Council website at www.frc.org.uk.
For details of significant direct or indirect holdings of securities, rules the Company has about appointment and replacement of Directors and amendment of the Company’s articles of association and powers of the Company’s Directors, see the Director’s Report on pages 60 to 62.
Compliance with the Code
Throughout the year ended 31 December 2018, the Company was fully compliant with the Code.
The Foxtons Corporate Governance Structure
The following chart shows the Group’s corporate governance structure and provides an overview of the Committees of the Board.
AUDIT COMMITTEE
Chairman: Ian Barlow
Other members: Sheena Mackay
Key Responsibilities: Provides oversight and governance over the Group’s
financial reporting, risk management and internal controls and relationship with
the external auditor.
DISCLOSURE COMMITTEEChairman: Garry Watts
Other members: Ian Barlow, Nic Budden, Mark Berry
Oversees the Company’s compliance with its disclosure obligations under the Listing Rules and Market Abuse Regulation.Ensures that the Company has appropriate disclosure controls and procedures in place.
NOMINATION COMMITTEE
Chairman: Garry Watts
Other members: Ian Barlow, Sheena Mackay
Key Responsibilities: Responsibility for reviewing Board composition, identifying
and nominating candidates for Board appointment and for succession planning.
REMUNERATION COMMITTEE
Chairman: Sheena Mackay
Other members: Ian Barlow, Garry Watts
Key Responsibilities: Reviews and recommends the remuneration policy and sets and monitors the level and
structure of remuneration for Executive Directors. Sets the Chairman’s fee.
BOARD The Board is responsible for the long-term success of the Company and for delivering sustainable Shareholder value. It agrees the strategic objectives for the Company and ensures that these are achieved within an appropriate framework of effective controls which enable risk to be assessed and managed.
Board activities in 2018p / 39
Board biographiesp / 34-35
Roles and responsibilitiesp / 38
Read the reportp / 44
Read the reportp / 42
Read the reportp / 47
/ 37Annual Report and Accounts 2018
Corporate Governance Statement continued
The Board and its responsibilities
The Board is responsible for the long-term success of the Company and for delivering sustainable Shareholder value. It agrees the strategic objectives for the Company and ensures that these are achieved within an appropriate framework of effective controls which enable risk to be assessed and managed. Responsibility for day-to-day operations is delegated by the Board to the Executive Directors within defined authority limits, which are regularly reviewed and updated by the Board. The Board maintains a schedule of matters reserved for decision by the Board, which details the key aspects of the affairs of the Company which the Board does not delegate to management or any Board Committees, though it may consider recommendations from them.
The Board’s specific responsibilities include:
• setting the strategic aims and approving the Group’s budget and financial plans;
• approval of capital expenditure, significant investments and acquisitions;
• approval of annual and interim results and trading updates;
• payment of interim dividends and recommendation of final dividends to shareholders;
• setting the Group’s risk appetite and oversight of the internal control, risk management and governance frameworks;
• monitoring management’s performance; and
• ensuring succession plans are in place.
Matters outside the schedule of matters reserved for decision by the Board or the Committee terms of reference fall within the responsibility and authority of the Executive Directors, including all executive management matters.
The Foxtons Corporate Governance Structure
The chart on page 37 shows the Group’s corporate governance structure and provides an overview of the Committees of the Board.
The Board comprises the Non-Executive Chairman, two independent Non-Executive Directors and two Executive Directors. A list of the Directors, with biographical details, is provided on pages 34 and 35.
There is a separation of responsibilities between the Chairman and the Chief Executive Officer, which is set out in writing. This division of responsibilities, together with the schedule of matters which are reserved for the Board, ensures that no individual has unfettered powers of decision-making.
By delegating specific responsibilities to its Committees (as shown on the previous page), the Board can ensure that it is operating effectively and efficiently with the right level of attention and consideration being given to relevant matters. The role and responsibilities of each Board Committee are set out in formal Terms of Reference which are determined by the Board and the Chairman ensures that the very significant work of the Committees feeds into, and is influenced by, the full Board. The Chair of each Committee reports to the Board after each Committee meeting on the matters discussed and minutes of each meeting are provided to the Board for information as appropriate. The terms of reference of the Committees are available at www.foxtonsgroup.co.uk.
Roles and Responsibilities
Chairman
Garry Watts
• Provides leadership and promotes a culture of openness and debate between Executive and Non-Executive Directors.
• Sets the Board agenda and ensures that Directors are provided with accurate, timely and clear information to enable the Board to operate effectively.
• Responsible for the integrity and effectiveness of the system of governance.
Chief Executive Officer
Nic Budden
• Responsible for leading the Group’s operating performance and day-to-day management and implementation of the strategic objectives agreed by the Board.
Chief Financial Officer
Mark Berry
• Responsible for the Group’s financial reporting, financial strategy and investor relations programme.
• Provides leadership of the finance function.
Non-Executive Directors
Ian Barlow, Sheena Mackay
• Provide a broad range of skills and experience to the Board to assist in formulating the Company’s strategy; and provide constructive challenge and support to the Executive Directors based on their breadth of knowledge and experience.
Senior Independent Director
Ian Barlow
• Available to Shareholders if they have concerns that cannot be addressed through normal channels, internal sounding board for the Chairman and acts as intermediary for the other Directors with the Chairman, if necessary.
All of the Non-Executive Directors are regarded by the Company as independent and are free from any business or other relationship which could materially interfere with the exercise of their independent judgement.
/ 38Annual Report and Accounts 2018
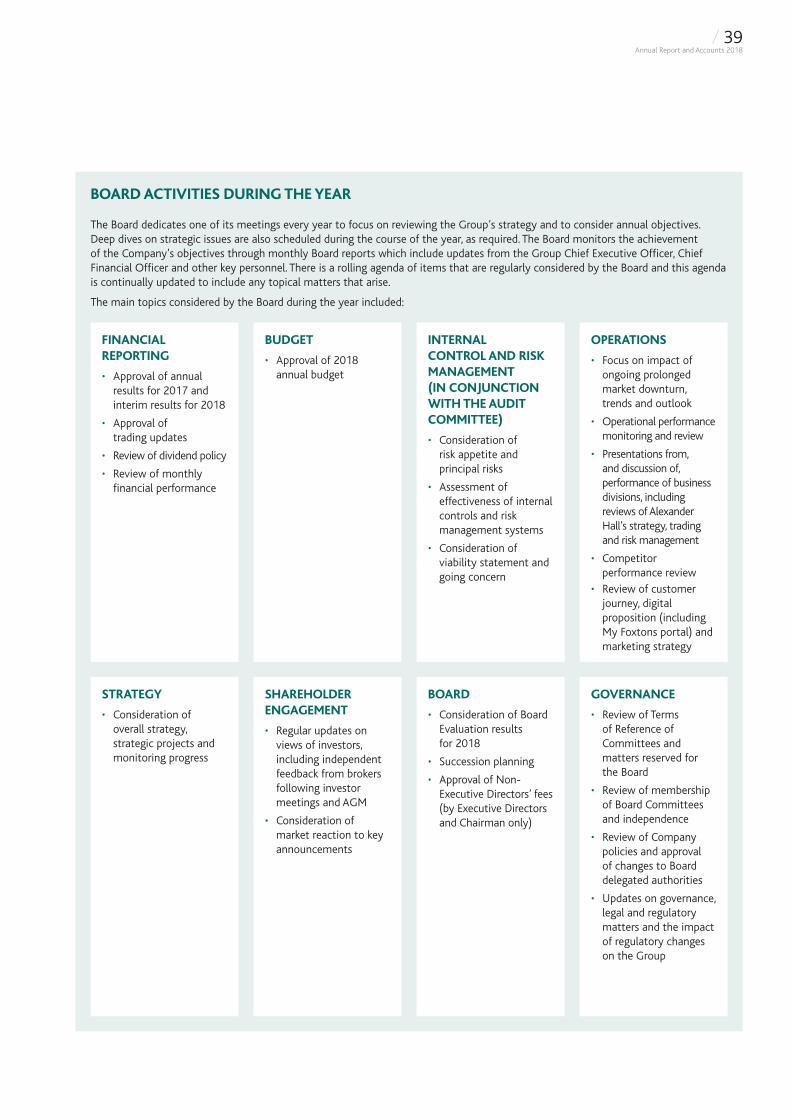
BOARD ACTIVITIES DURING THE YEAR
The Board dedicates one of its meetings every year to focus on reviewing the Group’s strategy and to consider annual objectives. Deep dives on strategic issues are also scheduled during the course of the year, as required. The Board monitors the achievement of the Company’s objectives through monthly Board reports which include updates from the Group Chief Executive Officer, Chief Financial Officer and other key personnel. There is a rolling agenda of items that are regularly considered by the Board and this agenda is continually updated to include any topical matters that arise.
The main topics considered by the Board during the year included:
FINANCIAL REPORTING
• Approval of annual results for 2017 and interim results for 2018
• Approval of trading updates
• Review of dividend policy
• Review of monthly financial performance
STRATEGY
• Consideration of overall strategy, strategic projects and monitoring progress
BUDGET
• Approval of 2018 annual budget
SHAREHOLDER ENGAGEMENT
• Regular updates on views of investors, including independent feedback from brokers following investor meetings and AGM
• Consideration of market reaction to key announcements
INTERNAL CONTROL AND RISK MANAGEMENT (IN CONJUNCTION WITH THE AUDIT COMMITTEE)
• Consideration of risk appetite and principal risks
• Assessment of effectiveness of internal controls and risk management systems
• Consideration of viability statement and going concern
BOARD
• Consideration of Board Evaluation results for 2018
• Succession planning
• Approval of Non-Executive Directors’ fees (by Executive Directors and Chairman only)
OPERATIONS
• Focus on impact of ongoing prolonged market downturn, trends and outlook
• Operational performance monitoring and review
• Presentations from, and discussion of, performance of business divisions, including reviews of Alexander Hall’s strategy, trading and risk management
• Competitor performance review
• Review of customer journey, digital proposition (including My Foxtons portal) and marketing strategy
GOVERNANCE
• Review of Terms of Reference of Committees and matters reserved for the Board
• Review of membership of Board Committees and independence
• Review of Company policies and approval of changes to Board delegated authorities
• Updates on governance, legal and regulatory matters and the impact of regulatory changes on the Group
/ 39Annual Report and Accounts 2018
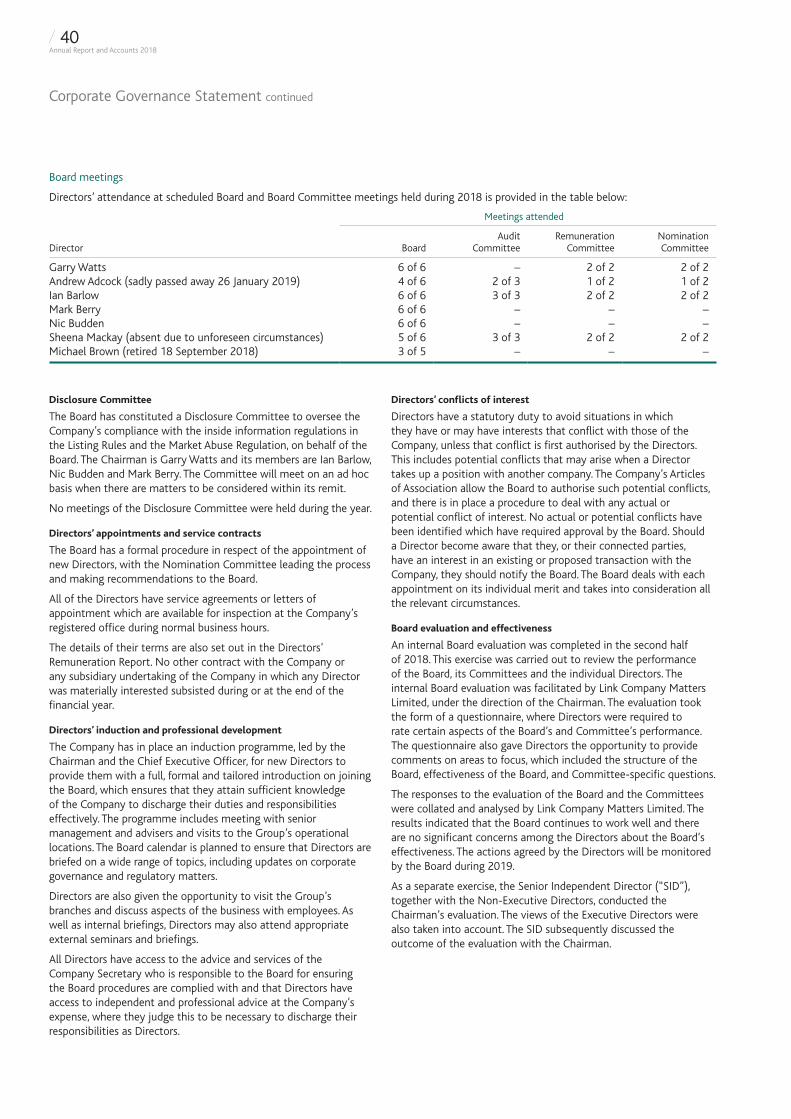
Corporate Governance Statement continued
Board meetings
Directors’ attendance at scheduled Board and Board Committee meetings held during 2018 is provided in the table below:
Meetings attended
Director
Board
Audit Committee
Remuneration Committee
Nomination Committee
Garry Watts 6 of 6 – 2 of 2 2 of 2 Andrew Adcock (sadly passed away 26 January 2019) 4 of 6 2 of 3 1 of 2 1 of 2 Ian Barlow 6 of 6 3 of 3 2 of 2 2 of 2 Mark Berry 6 of 6 – – –
Directors’ conflicts of interest
Directors have a statutory duty to avoid situations in which they have or may have interests that conflict with those of the Company, unless that conflict is first authorised by the Directors. This includes potential conflicts that may arise when a Director takes up a position with another company. The Company’s Articles of Association allow the Board to authorise such potential conflicts, and there is in place a procedure to deal with any actual or potential conflict of interest. No actual or potential conflicts have been identified which have required approval by the Board. Should a Director become aware that they, or their connected parties, have an interest in an existing or proposed transaction with the Company, they should notify the Board. The Board deals with each appointment on its individual merit and takes into consideration all the relevant circumstances.
Board evaluation and effectiveness
An internal Board evaluation was completed in the second half of 2018. This exercise was carried out to review the performance of the Board, its Committees and the individual Directors. The internal Board evaluation was facilitated by Link Company Matters Limited, under the direction of the Chairman. The evaluation took the form of a questionnaire, where Directors were required to rate certain aspects of the Board’s and Committee’s performance. The questionnaire also gave Directors the opportunity to provide comments on areas to focus, which included the structure of the Board, effectiveness of the Board, and Committee-specific questions.
The responses to the evaluation of the Board and the Committees were collated and analysed by Link Company Matters Limited. The results indicated that the Board continues to work well and there are no significant concerns among the Directors about the Board’s effectiveness. The actions agreed by the Directors will be monitored by the Board during 2019.
As a separate exercise, the Senior Independent Director (“SID”), together with the Non-Executive Directors, conducted the Chairman’s evaluation. The views of the Executive Directors were also taken into account. The SID subsequently discussed the outcome of the evaluation with the Chairman.
Nic Budden 6 of 6 – – –Sheena Mackay (absent due to unforeseen circumstances) 5 of 6 3 of 3 2 of 2 2 of 2Michael Brown (retired 18 September 2018) 3 of 5 – – –
Disclosure Committee
The Board has constituted a Disclosure Committee to oversee the Company’s compliance with the inside information regulations in the Listing Rules and the Market Abuse Regulation, on behalf of the Board. The Chairman is Garry Watts and its members are Ian Barlow, Nic Budden and Mark Berry. The Committee will meet on an ad hoc basis when there are matters to be considered within its remit.
No meetings of the Disclosure Committee were held during the year.
Directors’ appointments and service contracts
The Board has a formal procedure in respect of the appointment of new Directors, with the Nomination Committee leading the process and making recommendations to the Board.
All of the Directors have service agreements or letters of appointment which are available for inspection at the Company’s registered office during normal business hours.
The details of their terms are also set out in the Directors’ Remuneration Report. No other contract with the Company or any subsidiary undertaking of the Company in which any Director was materially interested subsisted during or at the end of the financial year.
Directors’ induction and professional development
The Company has in place an induction programme, led by the Chairman and the Chief Executive Officer, for new Directors to provide them with a full, formal and tailored introduction on joining the Board, which ensures that they attain sufficient knowledge of the Company to discharge their duties and responsibilities effectively. The programme includes meeting with senior management and advisers and visits to the Group’s operational locations. The Board calendar is planned to ensure that Directors are briefed on a wide range of topics, including updates on corporate governance and regulatory matters.
Directors are also given the opportunity to visit the Group’s branches and discuss aspects of the business with employees. As well as internal briefings, Directors may also attend appropriate external seminars and briefings.
All Directors have access to the advice and services of the Company Secretary who is responsible to the Board for ensuring the Board procedures are complied with and that Directors have access to independent and professional advice at the Company’s expense, where they judge this to be necessary to discharge their responsibilities as Directors.
/ 40Annual Report and Accounts 2018
ACCOUNTABILITY AND AUDIT
Financial reporting
The Group has in place a comprehensive financial review cycle, which includes a detailed annual financial planning process where budgets are prepared for approval by the Board. The Group uses a number of KPIs to measure both operational and financial activity within the business. Depending on the measure, these are reported and reviewed on a weekly or monthly basis. In addition, management receives a weekly and monthly pack of indicators which are the basis of regular operational meetings, where corrective action is taken if necessary. At a Group level, a well-developed comprehensive management accounts pack, including income statements, balance sheets, cash flow statements as well as key ratios, is reviewed monthly by management and at Board meetings. A re-forecast of the current year numbers is carried out quarterly. Management monitors the publication of new reporting standards and reports on any updates to the Board.
Risk management and internal controls
The Audit Committee, on behalf of the Board, keeps under review the effectiveness of the Group’s risk management and internal control systems to ensure that controls in place are effective in order to safeguard Shareholders’ investments and the Group’s assets. Such a system is designed to manage rather than eliminate the risk of failure to achieve business objectives and can only provide reasonable and not absolute assurance against material misstatement or loss.
The Board has defined its risk appetite for strategic, financial, operational and compliance risks. A standard methodology for risk assessment is applied across the Group to assist with monitoring gross and residual risk and comparing residual risk against the appropriate risk appetite. As required by the Code, the Board has carried out a robust assessment of the principal risks facing the Company, including those that could threaten its business model, future performance, solvency or liquidity. This is more fully described in the Risk Management section on pages 24 to 28.
The Group has the following key procedures in place to provide effective internal control:
• an ongoing process to identify, evaluate and manage significant risks, which is monitored and regularly reviewed by the Executive Team with significant issues presented to the Board and Audit Committee;
• the Group’s Compliance department continuously reviews operations to ensure that transactions have been properly authorised and procedures are adhered to across the Group;
• the Group’s controls include appropriate segregation of duties and are fully documented and embedded within the organisation;
• the Audit Committee reviews fraud, anti-bribery and whistle-blowing policies and procedures and considers any whistle-blowing incidents and; there have been no material instances of whistle-blowing or recorded instances of bribery or corruption during the period under review; and
• the Group has in place a system for planning, reporting and reviewing financial performance, including performance against strategy and the business plan as described under Financial reporting above.
On the basis of the above procedures and the monitoring processes employed, and having regard to the “Guidance on Risk Management, Internal Control and Related Financial and Business Reporting” issued by the Financial Reporting Council in September 2014, the Board, advised by the Audit Committee, has concluded that the systems of internal controls within the Group are effective. No significant control failings or weaknesses were identified during the period under review.
The Directors confirm that the processes described above have been in place during the 2018 financial year and up to the date of the approval of this Annual Report and Accounts.
Whistle-blowing
The Group believes that it is important to have a culture of openness and accountability in order to prevent situations relating to possible impropriety, financial or otherwise, from occurring or to address them when they do occur. The Company’s independent whistle-blowing hotline continues to be in operation and reports are provided to the Audit Committee if any matters are reported to the independent whistle-blower hotline. There have been no material instances of whistle-blowing during the period under review.
Fair, balanced and understandable
The Group has a comprehensive and thorough assurance process in respect of the preparation, verification and approval of periodic financial reports. The process involves:
• The involvement of qualified and appropriately experienced staff, under the direction of the CFO;
• A comprehensive review and verification process which deals with the factual content of the reports and ensures consistency across various sections;
• A common understanding amongst senior staff which ensures consistency and overall balance;
• A transparent process to ensure full disclosure of information to the external auditors;
• Engagement of a professional and experienced firm of external auditors who understand the Foxtons business and business model; and
• Oversight by the Audit Committee which, among other things, reviews:
− the key accounting judgements and key sources of estimation uncertainty;
− the consistency of, and any changes to, significant accounting policies and practices;
− significant adjustments arising from the external audit;
− the Company’s statement on risk management and internal control; and
− the going concern and viability assumptions.
The process outlined, together with the review and challenge of management by the Audit Committee and its recommendation to the Board, provides comfort to the Board that the Annual Report taken as a whole is fair, balanced and understandable and provides the information necessary for Shareholders to assess the Company’s business model, strategy, position and performance.
/ 41Annual Report and Accounts 2018
NOMINATION COMMITTEE REPORT
Role and responsibilities
The Committee’s main responsibilities, as outlined in its terms of reference, are:
• to keep under review the structure, size and composition (including the skills, knowledge, expertise and diversity) of the Board and the membership of its Committees;
• to consider succession planning for the Board and other senior executives; and
• to assist with the selection process for the appointment of new Directors, both Executive and Non-Executive, including the Chairman.
Terms of reference were reviewed during the year and set out in detail the Committee’s role and responsibilities. The terms of reference can be found on the Company’s website at: www.foxtonsgroup.co.uk/corporate/. The Company Secretary acts as Secretary to the Committee. There have been no changes in the membership of the Committee since the year end except that Andrew Adcock sadly passed away on 26 January 2019 and is no longer a member. Biographies of each Committee member are shown on pages 34 and 35.
Main activities during the year
The Committee met twice during the year. Attendance at the meetings is shown in the table on page 40. The main activities of the Committee are set out on page 43.
DEAR SHAREHOLDERS,
Welcome to the Company’s Nomination Committee Report for 2018.Garry WattsChairman, Foxtons Group plc
NOMINATION COMMITTEE
Chairman: Garry Watts
Membership during 2018: Ian Barlow, Andrew Adcock, Sheena Mackay (all independent Non-Executive Directors)
Relations with Shareholders
Responsibility for Shareholder relations rests with the Chairman, Chief Executive Officer and Chief Financial Officer. The Board receives regular updates at Board meetings on the views of its Shareholders and the SID is available to meet Shareholders if they wish to raise issues separately. The Chairman, Chief Executive Officer and Chief Financial Officer also ensure that there is effective communication with Shareholders on matters such as governance and strategy, and are responsible for ensuring that the Board understands the views of major Shareholders.
The Board believes that there were appropriate mechanisms in place during the year for the Board to understand the views of major Shareholders and to communicate with them. The Non-Executive Directors are available to meet with Shareholders if requested and would instigate such meetings if they became aware of issues or concerns through the procedures in place.
The Board aims to present a balanced and clear view of the Group in communications with Shareholders and believes that being transparent in describing how we see the market and the prospects for the business is extremely important. We communicate with Shareholders in a number of different ways. The formal reporting of our full and half-year results is a combination of presentations, group calls and one-to-one meetings. The full and half-year reporting are followed by investor meetings in a variety of locations where we have institutional Shareholders. We regularly meet with existing and prospective Shareholders to update them on our latest performance or to introduce them to the Company and periodically arrange a visit to the business to give analysts and major Shareholders a better understanding of how we manage our business. These visits and meetings are principally undertaken by the Chief Executive Officer, Chief Financial Officer and Chief Operating Officer and with any relevant material being uploaded to the Company’s corporate website to make it available to all Shareholders.
Corporate Governance Statement continued
/ 42Annual Report and Accounts 2018
Succession Planning
During the year, the Committee again considered succession planning for the Executive Directors and reviewed the Chief Executive Officer’s plan for senior management succession. The Company’s policy is to develop the talent pipeline and promote from within, wherever possible. Due to the nature of the Company’s operations and size it is not practicable for the Company to have an internal successor identified for all senior management roles, but where there is no obvious successor, the Committee is satisfied that the Company has a plan for appropriate short-term cover until a permanent successor can be recruited. Senior management succession planning will continue to be a focus for 2019.
The Committee also reviewed the size, composition and skill set of the Board during 2018 and concluded that there was an appropriate mix of experience, skills and knowledge to provide strong and effective leadership. With the sad passing of Andrew Adcock, Board succession planning will also continue to be a focus in the coming year and beyond in order to ensure that the Board retains the right balance of skills and experience to meet the requirements of the business as it evolves.
Board appointment criteria are considered automatically as part of the Committee’s review of succession planning. Currently, all the independent Non-Executive Directors and the Chairman have been appointed for less than six years. Non-Executive Directors are typically expected to serve a minimum of two three-year terms, and thereafter their appointment is reviewed on an annual basis.
Diversity
The Company believes that diversity throughout the business is important for the Group in order to reflect the varied nature of the communities that Foxtons operates in and its customer base. The Board’s policy on diversity is to ensure that the Directors on the Board have a broad range of experience, skills and knowledge, with diversity of thinking and perspective. Appointments to the Board are always made on merit against objective criteria, having regard to the benefits of diversity, including gender diversity and the current and future needs of the business. The Board has not set any specific gender or diversity targets. When identifying candidates for appointment to the Board, any search firm engaged will be instructed to include a range of candidates from diverse backgrounds for consideration.
As part of its ongoing review of succession planning, the Committee considers the diversity of the senior management team. The Committee is broadly satisfied with the diversity within the Company but aspires to improve the gender balance and ethnic diversity at the senior level. Management has in place a range of measures designed to address this, including coaching, mentoring, development programmes and flexible working, and the Committee will continue to monitor progress on behalf of the Board over the coming year. More information on Foxtons diversity policy and the diversity of its workforce is provided on pages 12 and 13.
Annual evaluation of the Nomination Committee’s performance
As part of the internal Board evaluation this year, the performance of the Nomination Committee was reviewed. I am pleased to report that there were no areas of significant concern and it was concluded that the Committee was operating effectively and provided robust challenge to the business on issues within its remit. Actions arising for the Committee from the evaluation of both the Board and the Committee are detailed on pages 36 and 40.
Directors’ Performance and Re-election
Following consideration, and taking into account the results of the recent Board evaluation, the Committee has concluded that each Director on the Board standing for re-election at the AGM continues to demonstrate the necessary skills, experience and commitment to contribute effectively and add value to the Board. Having considered the continuing effective performance of the Directors, the Committee has recommended to the Board that all Directors stand for re-election at the AGM.
No Director was able to vote in respect of their own re-election when consideration was given to Director re-election at the AGM. Information on the Directors’ service agreements, shareholdings and share options in the Company is set out in the Directors’ Remuneration Report on pages 47 to 59.
Priorities for 2019
During the forthcoming year, the Committee will be focusing on the succession planning of senior management, taking into account the challenges and opportunities facing Foxtons and the future skills and expertise needed by the business. Following the announcement that Andrew Adcock sadly passed away, the Committee is also in the process of searching for a new Non-Executive Director as well as considering succession planning for the Non-Executive Directors generally, given two of the three current Non-Executive Directors are approaching six years of service.
I will be available at the AGM to answer any questions about the work of the Committee.
Garry WattsChairman of the Nomination Committee
27 February 2019
/ 43Annual Report and Accounts 2018
AUDIT COMMITTEE REPORT
Role Tasks July 2018 Nov 2018 Feb 2019
Financial Reporting
Monitoring and reviewing the Group’s accounting policies, practices and significant accounting judgements.
Reviewing the plan for the production of the 2018 Annual Report and Accounts.
Receiving a report setting out the impact of new accounting standards including IFRS 9, 15 and 16.
Receiving the annual and half yearly financial statements and advising the Board on whether the Annual Report and Accounts are fair, balanced and understandable. In fulfilling this task the Audit Committee reviewed the process undertaken to produce the Annual Report and Accounts, which included guidance given to contributors, internal verification processes and content approval procedures.
The Committee also reviewed supporting papers to ensure the Annual Report and Accounts were factually correct.
Reviewing the going concern paper which analysed the profitability and cash generation of the Company and agreeing with the adoption of the going concern basis.
Considering and reviewing the viability statement and supporting sensitivity analysis which assessed the potential impact of the principal risks on the future performance and liquidity of the Group over a five year period. For each principal risk the Company assessed adverse scenarios and their potential impact.
The Committee held two meetings during the year with attendance disclosed on page 40. The Committee also met once following the year end.
Each member of the Committee is an independent Director and two of the three members are deemed to have recent and relevant financial experience with the Chairman, Ian Barlow, being a chartered accountant and chartered tax adviser.
Role, responsibilities and main activities
The primary function of the Audit Committee is to assist the Board in fulfilling its responsibilities to protect the interests of the Shareholders with regard to the integrity of the financial reporting, audit, risk management and internal controls and governing the relationship with the external auditor.
Terms of reference were reviewed during the year and set out in detail the Committee’s role and responsibilities. The terms of reference can be found on the Company’s website at: www.foxtonsgroup.co.uk/corporate/. The Company Secretary acts as Secretary to the Committee. There have been no changes in the membership of the Committee since the year end, except that Andrew Adcock sadly passed away on 26 January 2019 and is no longer a member. Biographies of each Committee member are shown on pages 34 and 35.
Since the last Audit Committee Report the Committee has held three meetings, with the principal work being:
DEAR SHAREHOLDERS,
I am pleased to report on the activities of the Audit Committee in 2018.
CURRENT MEMBERS OF THE AUDIT COMMITTEE
Chairman: Ian Barlow Senior Independent Non-Executive Director, Foxtons Group plc
Other members: Sheena Mackay Served during 2018: Andrew Adcock
/ 44Annual Report and Accounts 2018
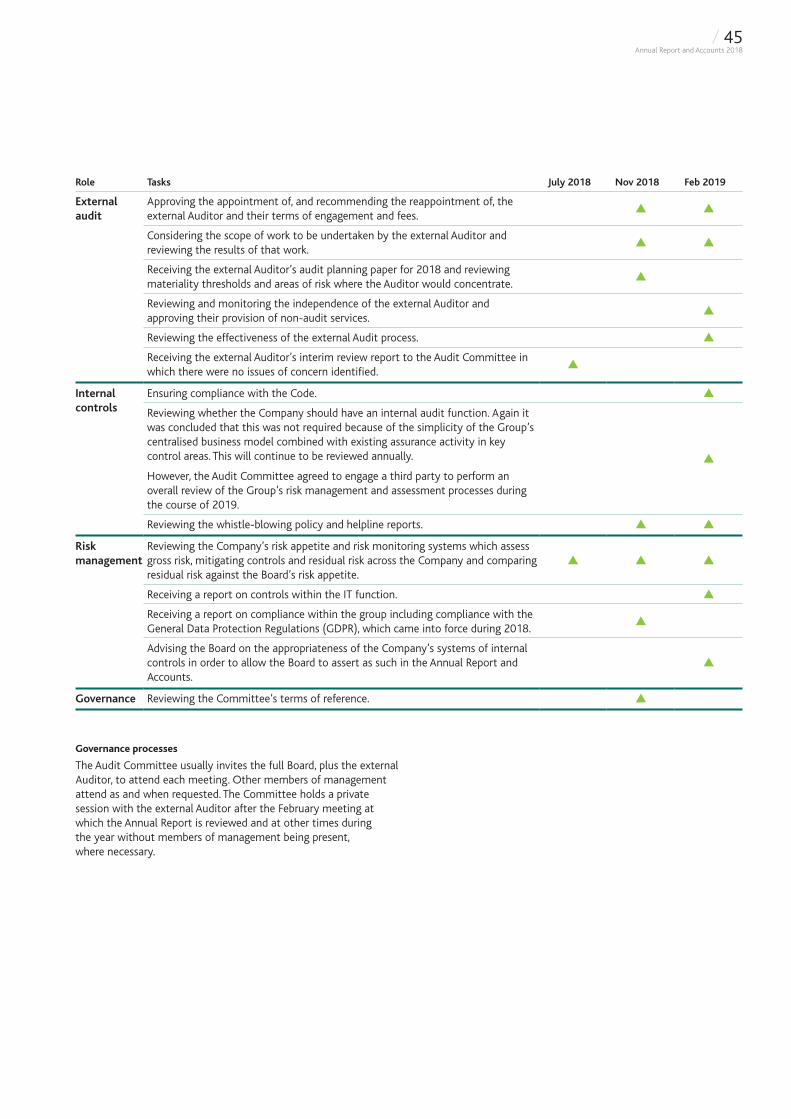
Role Tasks July 2018 Nov 2018 Feb 2019
External audit
Approving the appointment of, and recommending the reappointment of, the external Auditor and their terms of engagement and fees.
Considering the scope of work to be undertaken by the external Auditor and reviewing the results of that work.
Receiving the external Auditor’s audit planning paper for 2018 and reviewing materiality thresholds and areas of risk where the Auditor would concentrate.
Reviewing and monitoring the independence of the external Auditor and approving their provision of non-audit services.
Reviewing the effectiveness of the external Audit process.
Receiving the external Auditor’s interim review report to the Audit Committee in which there were no issues of concern identified.
Internal controls
Ensuring compliance with the Code.
Reviewing whether the Company should have an internal audit function. Again it was concluded that this was not required because of the simplicity of the Group’s centralised business model combined with existing assurance activity in key control areas. This will continue to be reviewed annually.
However, the Audit Committee agreed to engage a third party to perform an overall review of the Group’s risk management and assessment processes during the course of 2019.
Reviewing the whistle-blowing policy and helpline reports.
Risk management
Reviewing the Company’s risk appetite and risk monitoring systems which assess gross risk, mitigating controls and residual risk across the Company and comparing residual risk against the Board’s risk appetite.
Receiving a report on controls within the IT function.
Receiving a report on compliance within the group including compliance with the General Data Protection Regulations (GDPR), which came into force during 2018.
Advising the Board on the appropriateness of the Company’s systems of internal controls in order to allow the Board to assert as such in the Annual Report and Accounts.
Governance Reviewing the Committee’s terms of reference.
Governance processes
The Audit Committee usually invites the full Board, plus the external Auditor, to attend each meeting. Other members of management attend as and when requested. The Committee holds a private session with the external Auditor after the February meeting at which the Annual Report is reviewed and at other times during the year without members of management being present, where necessary.
/ 45Annual Report and Accounts 2018
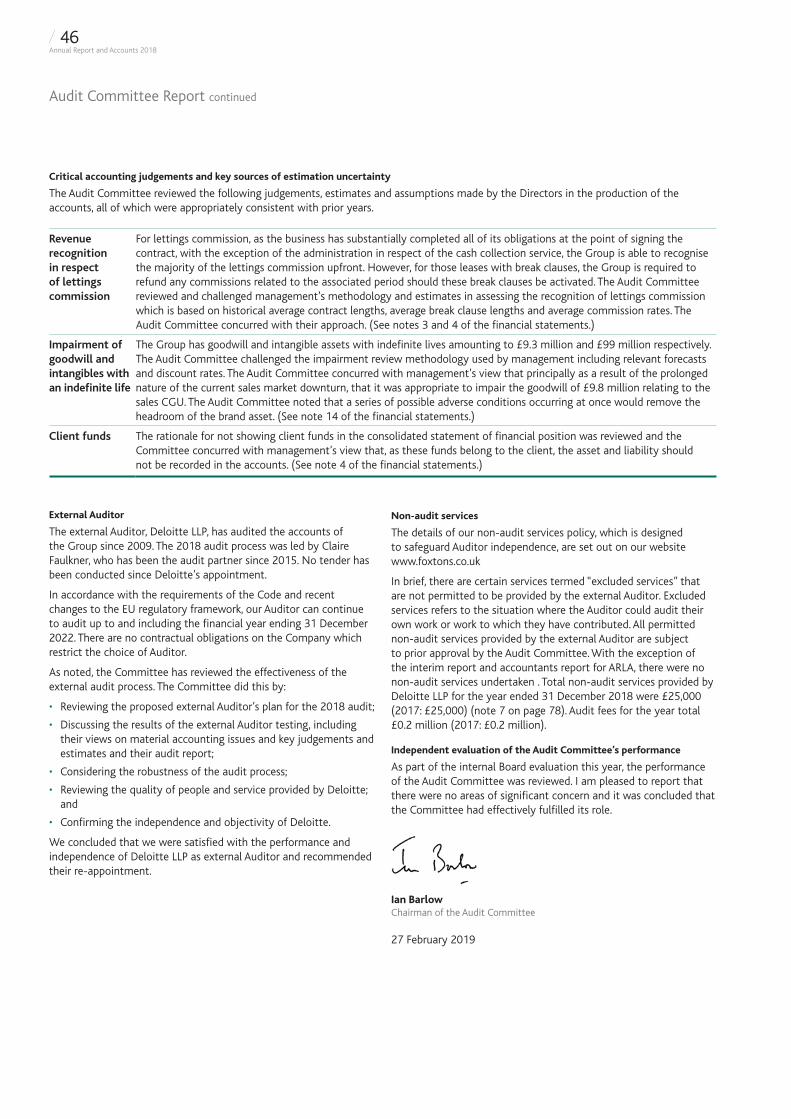
Revenue recognition in respect of lettings commission
For lettings commission, as the business has substantially completed all of its obligations at the point of signing the contract, with the exception of the administration in respect of the cash collection service, the Group is able to recognise the majority of the lettings commission upfront. However, for those leases with break clauses, the Group is required to refund any commissions related to the associated period should these break clauses be activated. The Audit Committee reviewed and challenged management’s methodology and estimates in assessing the recognition of lettings commission which is based on historical average contract lengths, average break clause lengths and average commission rates. The Audit Committee concurred with their approach. (See notes 3 and 4 of the financial statements.)
Impairment of goodwill and intangibles with an indefinite life
The Group has goodwill and intangible assets with indefinite lives amounting to £9.3 million and £99 million respectively. The Audit Committee challenged the impairment review methodology used by management including relevant forecasts and discount rates. The Audit Committee concurred with management’s view that principally as a result of the prolonged nature of the current sales market downturn, that it was appropriate to impair the goodwill of £9.8 million relating to the sales CGU. The Audit Committee noted that a series of possible adverse conditions occurring at once would remove the headroom of the brand asset. (See note 14 of the financial statements.)
Client funds The rationale for not showing client funds in the consolidated statement of financial position was reviewed and the Committee concurred with management’s view that, as these funds belong to the client, the asset and liability should not be recorded in the accounts. (See note 4 of the financial statements.)
External Auditor
The external Auditor, Deloitte LLP, has audited the accounts of the Group since 2009. The 2018 audit process was led by Claire Faulkner, who has been the audit partner since 2015. No tender has been conducted since Deloitte’s appointment.
In accordance with the requirements of the Code and recent changes to the EU regulatory framework, our Auditor can continue to audit up to and including the financial year ending 31 December 2022. There are no contractual obligations on the Company which restrict the choice of Auditor.
As noted, the Committee has reviewed the effectiveness of the external audit process. The Committee did this by:
• Reviewing the proposed external Auditor’s plan for the 2018 audit;
• Discussing the results of the external Auditor testing, including their views on material accounting issues and key judgements and estimates and their audit report;
• Considering the robustness of the audit process;
• Reviewing the quality of people and service provided by Deloitte; and
• Confirming the independence and objectivity of Deloitte.
We concluded that we were satisfied with the performance and independence of Deloitte LLP as external Auditor and recommended their re-appointment.
Non-audit services
The details of our non-audit services policy, which is designed to safeguard Auditor independence, are set out on our website www.foxtons.co.uk
In brief, there are certain services termed “excluded services” that are not permitted to be provided by the external Auditor. Excluded services refers to the situation where the Auditor could audit their own work or work to which they have contributed. All permitted non-audit services provided by the external Auditor are subject to prior approval by the Audit Committee. With the exception of the interim report and accountants report for ARLA, there were no non-audit services undertaken . Total non-audit services provided by Deloitte LLP for the year ended 31 December 2018 were £25,000 (2017: £25,000) (note 7 on page 78). Audit fees for the year total £0.2 million (2017: £0.2 million).
Independent evaluation of the Audit Committee’s performance
As part of the internal Board evaluation this year, the performance of the Audit Committee was reviewed. I am pleased to report that there were no areas of significant concern and it was concluded that the Committee had effectively fulfilled its role.
Ian BarlowChairman of the Audit Committee
27 February 2019
Audit Committee Report continued
Critical accounting judgements and key sources of estimation uncertainty
The Audit Committee reviewed the following judgements, estimates and assumptions made by the Directors in the production of the accounts, all of which were appropriately consistent with prior years.
/ 46Annual Report and Accounts 2018
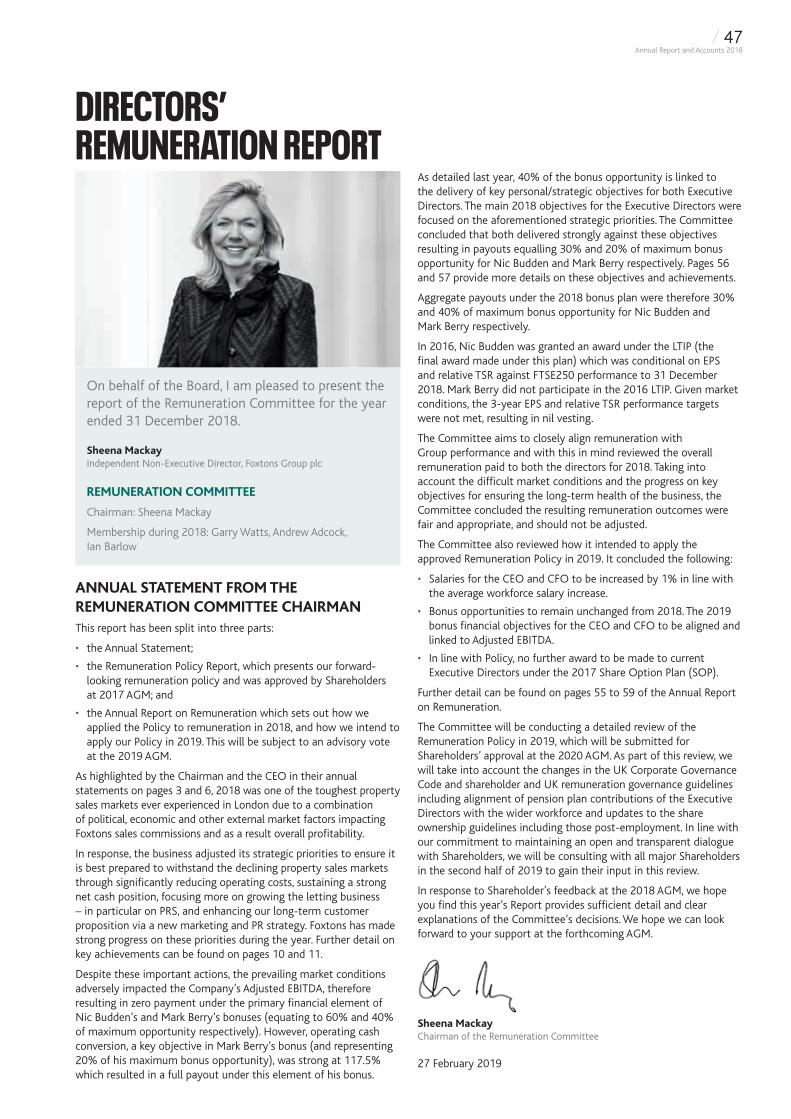
DIRECTORS’ REMUNERATION REPORT
As detailed last year, 40% of the bonus opportunity is linked to the delivery of key personal/strategic objectives for both Executive Directors. The main 2018 objectives for the Executive Directors were focused on the aforementioned strategic priorities. The Committee concluded that both delivered strongly against these objectives resulting in payouts equalling 30% and 20% of maximum bonus opportunity for Nic Budden and Mark Berry respectively. Pages 56 and 57 provide more details on these objectives and achievements.
Aggregate payouts under the 2018 bonus plan were therefore 30% and 40% of maximum bonus opportunity for Nic Budden and Mark Berry respectively.
In 2016, Nic Budden was granted an award under the LTIP (the final award made under this plan) which was conditional on EPS and relative TSR against FTSE250 performance to 31 December 2018. Mark Berry did not participate in the 2016 LTIP. Given market conditions, the 3-year EPS and relative TSR performance targets were not met, resulting in nil vesting.
The Committee aims to closely align remuneration with Group performance and with this in mind reviewed the overall remuneration paid to both the directors for 2018. Taking into account the difficult market conditions and the progress on key objectives for ensuring the long-term health of the business, the Committee concluded the resulting remuneration outcomes were fair and appropriate, and should not be adjusted.
The Committee also reviewed how it intended to apply the approved Remuneration Policy in 2019. It concluded the following:
• Salaries for the CEO and CFO to be increased by 1% in line with the average workforce salary increase.
• Bonus opportunities to remain unchanged from 2018. The 2019 bonus financial objectives for the CEO and CFO to be aligned and linked to Adjusted EBITDA.
• In line with Policy, no further award to be made to current Executive Directors under the 2017 Share Option Plan (SOP).
Further detail can be found on pages 55 to 59 of the Annual Report on Remuneration.
The Committee will be conducting a detailed review of the Remuneration Policy in 2019, which will be submitted for Shareholders’ approval at the 2020 AGM. As part of this review, we will take into account the changes in the UK Corporate Governance Code and shareholder and UK remuneration governance guidelines including alignment of pension plan contributions of the Executive Directors with the wider workforce and updates to the share ownership guidelines including those post-employment. In line with our commitment to maintaining an open and transparent dialogue with Shareholders, we will be consulting with all major Shareholders in the second half of 2019 to gain their input in this review.
In response to Shareholder’s feedback at the 2018 AGM, we hope you find this year’s Report provides sufficient detail and clear explanations of the Committee’s decisions. We hope we can look forward to your support at the forthcoming AGM.
Sheena MackayChairman of the Remuneration Committee
27 February 2019
ANNUAL STATEMENT FROM THE REMUNERATION COMMITTEE CHAIRMANThis report has been split into three parts:
• the Annual Statement;
• the Remuneration Policy Report, which presents our forward-looking remuneration policy and was approved by Shareholders at 2017 AGM; and
• the Annual Report on Remuneration which sets out how we applied the Policy to remuneration in 2018, and how we intend to apply our Policy in 2019. This will be subject to an advisory vote at the 2019 AGM.
As highlighted by the Chairman and the CEO in their annual statements on pages 3 and 6, 2018 was one of the toughest property sales markets ever experienced in London due to a combination of political, economic and other external market factors impacting Foxtons sales commissions and as a result overall profitability.
In response, the business adjusted its strategic priorities to ensure it is best prepared to withstand the declining property sales markets through significantly reducing operating costs, sustaining a strong net cash position, focusing more on growing the letting business – in particular on PRS, and enhancing our long-term customer proposition via a new marketing and PR strategy. Foxtons has made strong progress on these priorities during the year. Further detail on key achievements can be found on pages 10 and 11.
Despite these important actions, the prevailing market conditions adversely impacted the Company’s Adjusted EBITDA, therefore resulting in zero payment under the primary financial element of Nic Budden’s and Mark Berry’s bonuses (equating to 60% and 40% of maximum opportunity respectively). However, operating cash conversion, a key objective in Mark Berry’s bonus (and representing 20% of his maximum bonus opportunity), was strong at 117.5% which resulted in a full payout under this element of his bonus.
On behalf of the Board, I am pleased to present the report of the Remuneration Committee for the year ended 31 December 2018.
Sheena MackayIndependent Non-Executive Director, Foxtons Group plc
REMUNERATION COMMITTEE
Chairman: Sheena Mackay
Membership during 2018: Garry Watts, Andrew Adcock, Ian Barlow
/ 47Annual Report and Accounts 2018
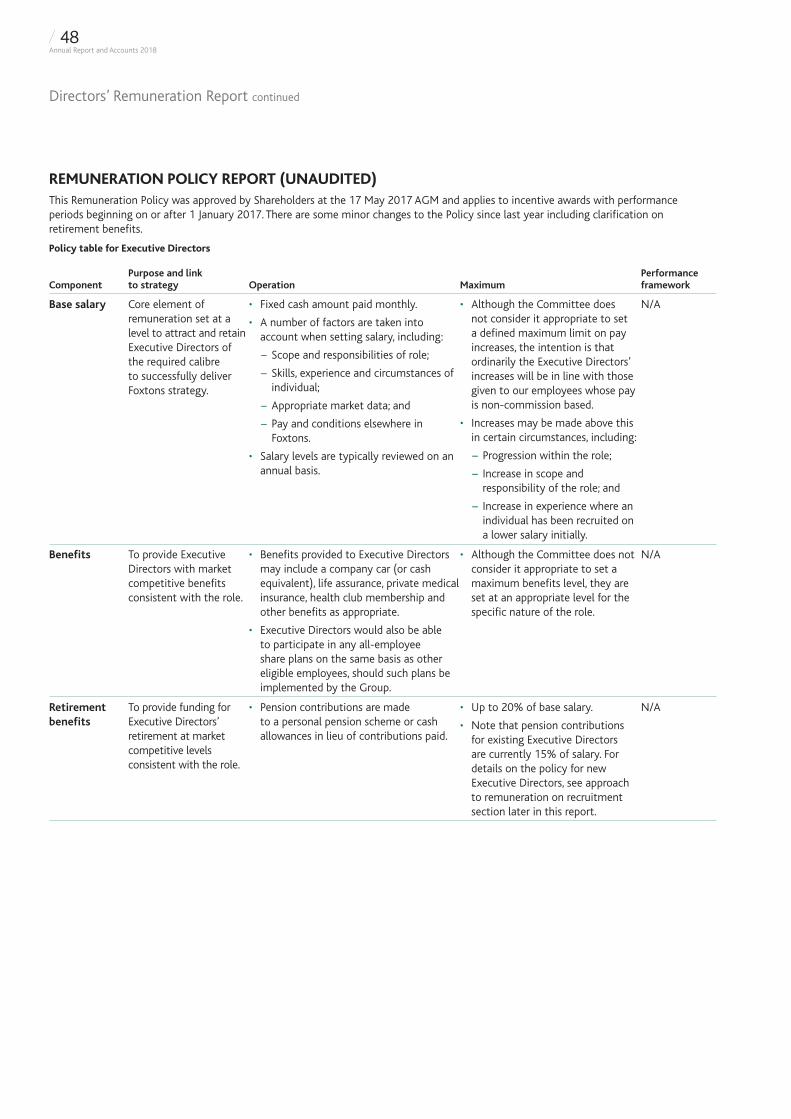
REMUNERATION POLICY REPORT (UNAUDITED)This Remuneration Policy was approved by Shareholders at the 17 May 2017 AGM and applies to incentive awards with performance periods beginning on or after 1 January 2017. There are some minor changes to the Policy since last year including clarification on retirement benefits.
Policy table for Executive Directors
ComponentPurpose and link to strategy Operation Maximum
Performance framework
Base salary Core element of remuneration set at a level to attract and retain Executive Directors of the required calibre to successfully deliver Foxtons strategy.
• Fixed cash amount paid monthly.
• A number of factors are taken into account when setting salary, including:
− Scope and responsibilities of role;
− Skills, experience and circumstances of individual;
− Appropriate market data; and
− Pay and conditions elsewhere in Foxtons.
• Salary levels are typically reviewed on an annual basis.
• Although the Committee does not consider it appropriate to set a defined maximum limit on pay increases, the intention is that ordinarily the Executive Directors’ increases will be in line with those given to our employees whose pay is non-commission based.
• Increases may be made above this in certain circumstances, including:
− Progression within the role;
− Increase in scope and responsibility of the role; and
− Increase in experience where an individual has been recruited on a lower salary initially.
N/A
Benefits To provide Executive Directors with market competitive benefits consistent with the role.
• Benefits provided to Executive Directors may include a company car (or cash equivalent), life assurance, private medical insurance, health club membership and other benefits as appropriate.
• Executive Directors would also be able to participate in any all-employee share plans on the same basis as other eligible employees, should such plans be implemented by the Group.
• Although the Committee does not consider it appropriate to set a maximum benefits level, they are set at an appropriate level for the specific nature of the role.
N/A
Retirement benefits
To provide funding for Executive Directors’ retirement at market competitive levels consistent with the role.
• Pension contributions are made to a personal pension scheme or cash allowances in lieu of contributions paid.
• Up to 20% of base salary.
• Note that pension contributions for existing Executive Directors are currently 15% of salary. For details on the policy for new Executive Directors, see approach to remuneration on recruitment section later in this report.
N/A
Directors’ Remuneration Report continued
/ 48Annual Report and Accounts 2018
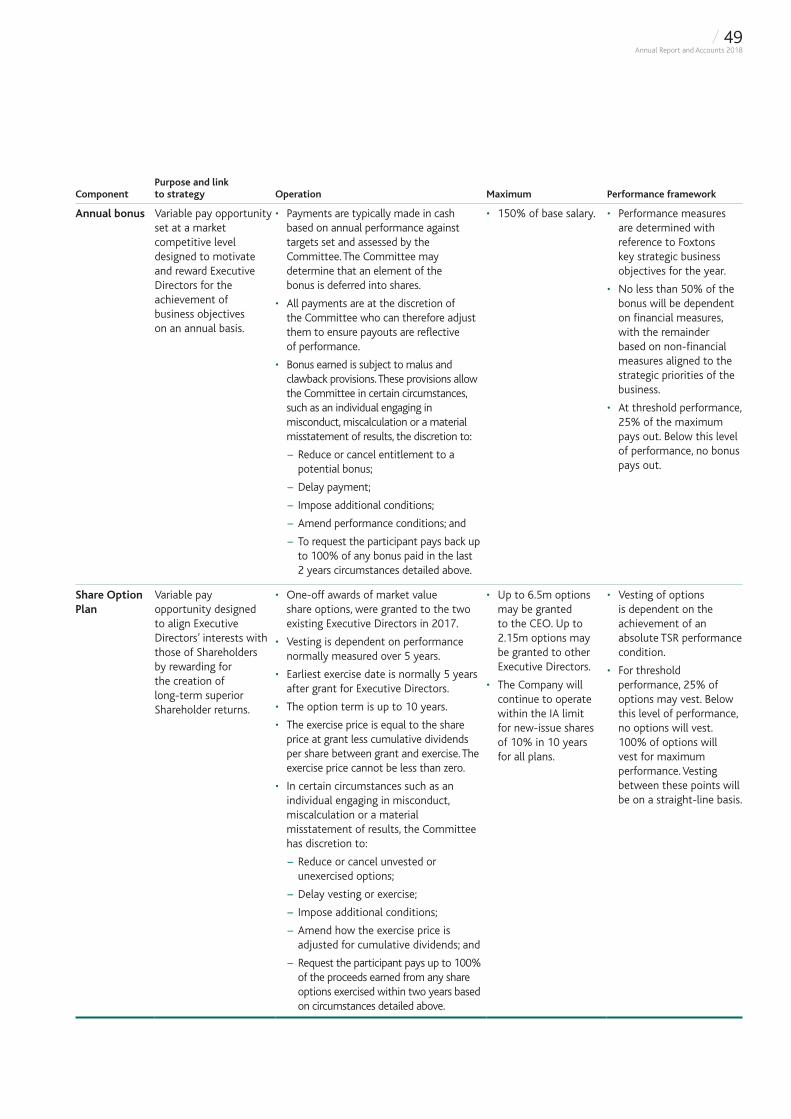
ComponentPurpose and link to strategy Operation Maximum Performance framework
Annual bonus Variable pay opportunity set at a market competitive level designed to motivate and reward Executive Directors for the achievement of business objectives on an annual basis.
• Payments are typically made in cash based on annual performance against targets set and assessed by the Committee. The Committee may determine that an element of the bonus is deferred into shares.
• All payments are at the discretion of the Committee who can therefore adjust them to ensure payouts are reflective of performance.
• Bonus earned is subject to malus and clawback provisions. These provisions allow the Committee in certain circumstances, such as an individual engaging in misconduct, miscalculation or a material misstatement of results, the discretion to:
− Reduce or cancel entitlement to a potential bonus;
− Delay payment;
− Impose additional conditions;
− Amend performance conditions; and
− To request the participant pays back up to 100% of any bonus paid in the last 2 years circumstances detailed above.
• 150% of base salary. • Performance measures are determined with reference to Foxtons key strategic business objectives for the year.
• No less than 50% of the bonus will be dependent on financial measures, with the remainder based on non-financial measures aligned to the strategic priorities of the business.
• At threshold performance, 25% of the maximum pays out. Below this level of performance, no bonus pays out.
Share Option Plan
Variable pay opportunity designed to align Executive Directors’ interests with those of Shareholders by rewarding for the creation of long-term superior Shareholder returns.
• One-off awards of market value share options, were granted to the two existing Executive Directors in 2017.
• Vesting is dependent on performance normally measured over 5 years.
• Earliest exercise date is normally 5 years after grant for Executive Directors.
• The option term is up to 10 years.
• The exercise price is equal to the share price at grant less cumulative dividends per share between grant and exercise. The exercise price cannot be less than zero.
• In certain circumstances such as an individual engaging in misconduct, miscalculation or a material misstatement of results, the Committee has discretion to:
− Reduce or cancel unvested or unexercised options;
− Delay vesting or exercise;
− Impose additional conditions;
− Amend how the exercise price is adjusted for cumulative dividends; and
− Request the participant pays up to 100% of the proceeds earned from any share options exercised within two years based on circumstances detailed above.
• Up to 6.5m options may be granted to the CEO. Up to 2.15m options may be granted to other Executive Directors.
• The Company will continue to operate within the IA limit for new-issue shares of 10% in 10 years for all plans.
• Vesting of options is dependent on the achievement of an absolute TSR performance condition.
• For threshold performance, 25% of options may vest. Below this level of performance, no options will vest. 100% of options will vest for maximum performance. Vesting between these points will be on a straight-line basis.
/ 49Annual Report and Accounts 2018
Directors’ Remuneration Report continued
Notes to the policy table
Outstanding LTIP awards
Following Shareholder approval at the 2017 AGM, a one-off award of market value share options was granted to Executive Directors under the new Share Option Plan and Executive Directors will not receive any further awards under the LTIP. The CEO held outstanding awards under the LTIP cycles granted in 2015 and 2016 which were due to vest in 2018 and 2019 respectively. Therefore, for ease of reference, detailed below is the section of the policy table for the LTIP disclosed in the previous Policy Report which was approved at the 2014 AGM.
ComponentPurpose and link to strategy Operation Maximum Performance framework
LTIP Variable pay opportunity set at a market competitive level designed to motivate and reward Executive Directors for the achievement of business objectives over the longer term.
• Usually a contingent award of shares or grant of nil cost options is made annually.
• Vesting of the award is dependent on the achievement of performance targets, typically measured over a three year period.
• In certain circumstances such as an individual engaging in misconduct, miscalculation or a material misstatement of results, the Committee has discretion to:
− Reduce or cancel unvested awards;
− Delay vesting;
− Impose additional conditions; and
− Amend performance conditions.
• LTIP awards granted after 2016 will also have clawback provisions which allow the Company within two years of any award vesting to claim back up to 100% of the award based on circumstances detailed above.
• Usual maximum of 150% of base salary.
• Absolute maximum of 200% of base salary provided for in plan rules.
• At least 50% of the LTIP will be based on financial measures with the remainder based on share price related measures.
• For threshold levels of performance, 25% of the award will vest. Below this level of performance, the award will not vest. 100% of the award will vest for maximum performance. Vesting between these points will be on a straight-line basis.
/ 50Annual Report and Accounts 2018
DISCRETIONThe Committee reserves the right to make any remuneration payments and payments for loss of office (including exercising any discretions available to it in connection with such payments) that are not in line with the Policy set out above where the terms of the payment were agreed:
i. before the Policy came into effect; or
ii. at a time when the relevant individual was not a Director of the Company and, in the opinion of the Committee, the payment was not in consideration for the individual becoming a Director of the Company.
For these purposes “payments” includes the Committee satisfying awards of variable remuneration and an award over shares is “agreed” at the time the award is granted.
The Committee will operate the annual bonus, the Share Option Plan and the LTIP in accordance with the relevant plan rules. The Committee retains discretion as to the operation and administration of these plans as follows:
Annual bonus
• The Committee may amend the performance targets applying to an award in exceptional circumstances if the new performance targets are considered fair and reasonable and are neither materially more nor materially less challenging than the original performance targets.
• The Committee may settle an award in cash or shares.
Share Option Plan
• The Committee may amend the performance conditions applying to an award in exceptional circumstances if the new performance conditions are considered fair and reasonable and are neither materially more nor materially less challenging than the original performance conditions.
• In the event of a variation of share capital, demerger, special dividend, distribution or any other corporate event which may affect the current or future value of an award, the Committee may adjust the number of share options or the option price.
• The expectation is settlement in shares. The Committee may however settle the gain in cash.
LTIP
• The Committee may amend the performance conditions applying to an award in exceptional circumstances if the new performance conditions are considered fair and reasonable and are neither materially more nor materially less challenging than the original performance conditions.
• In the event of a variation of share capital, demerger, special dividend, distribution or any other corporate event which may affect the current or future value of an award, the Committee may adjust the number of shares or the option price.
• The expectation is settlement in shares. The Committee may however settle in cash.
• Please note that the last cycle outstanding under the LTIP lapsed on 31 December 2018.
Any use of the above discretions would, where relevant, be explained in the Annual Report on Remuneration and may, as appropriate, be the subject of consultation with the Company’s major Shareholders.
Takeover or other corporate event
For share options, on a takeover or other corporate event, generally the vesting period will end on the date of the event. The Committee will determine the extent to which performance conditions have been achieved and any share options vesting will be immediately exercisable. Such early vesting would generally be on a time pro-rata basis.
For outstanding LTIP awards, on a takeover or other corporate event, generally the performance period will end on the date of the event. The Committee will determine the extent to which performance conditions have been achieved at this point taking into account relevant factors given the shortened period. Again, such early vesting would generally be on a time pro-rata basis.
Alternatively, in certain circumstances the Committee may allow awards to continue in line with the original terms of the SOP or LTIP.
The Committee has the discretion to take other action as appropriate if other events occur which may have an effect on awards.
In the event that all-employee plans are operated, they would be expected to vest on a takeover or other corporate event and those which have to meet requirements to benefit from tax benefits would vest in accordance with those requirements.
Minor changes
The Committee may make minor amendments to the Policy set out above (for regulatory, exchange control, tax or administrative purposes or to take account of a change in legislation) without obtaining Shareholder approval for that amendment.
Performance measures and target setting
The annual bonus is based on both financial and non-financial performance measures which are aligned with Foxtons annual strategic plan. Targets are set on an annual basis by the Committee and take into account a number of internal and external reference points including historic performance, internal expectations and broker forecasts.
The Committee considers that absolute TSR (under the SOP) helps align executives with shareholder interests and is a simple objective and transparent measure of the Company’s performance and Shareholder value creation. The vesting of options starts at 5-year TSR of 10% p.a with full vesting requiring 5-year TSR of 16% p.a. Performance targets are set to be stretching with regard to particular strategic priorities and the economic environment.
/ 51Annual Report and Accounts 2018
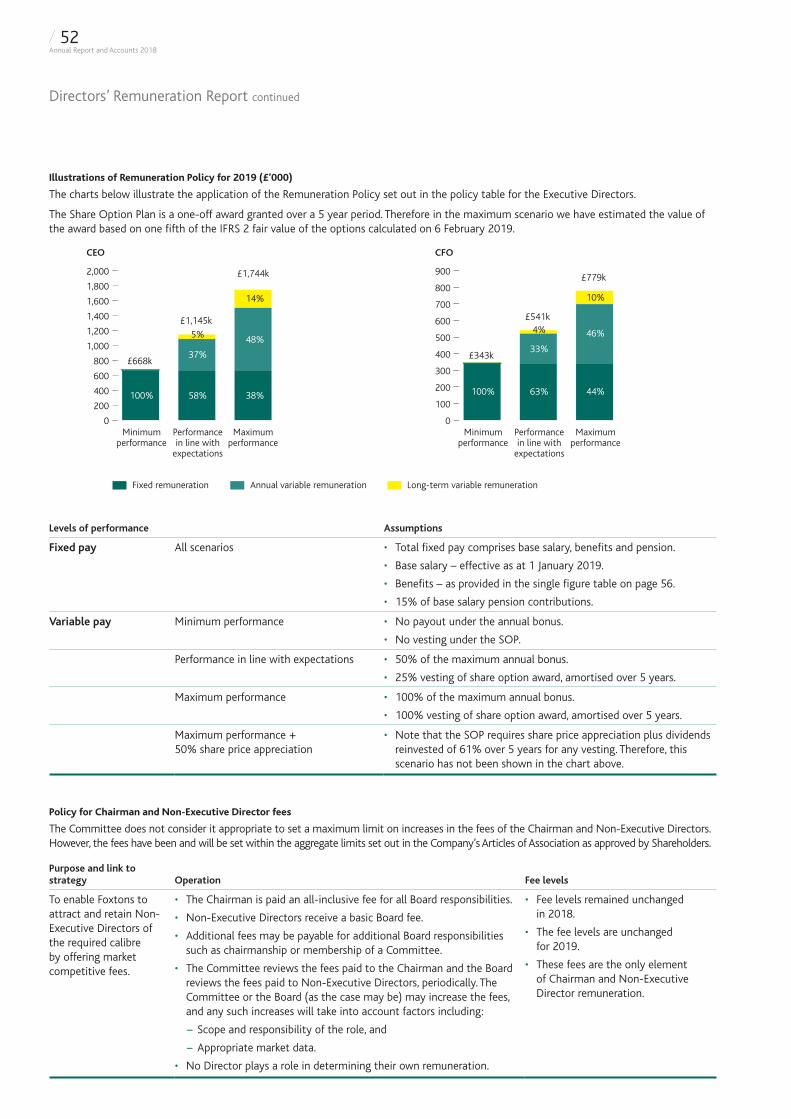
Directors’ Remuneration Report continued
Illustrations of Remuneration Policy for 2019 (£’000)
The charts below illustrate the application of the Remuneration Policy set out in the policy table for the Executive Directors.
The Share Option Plan is a one-off award granted over a 5 year period. Therefore in the maximum scenario we have estimated the value of the award based on one fifth of the IFRS 2 fair value of the options calculated on 6 February 2019.
0
200
400
600
800
1,000
1,200
1,400
1,600
1,800
2,000
0
100
200
300
400
500
600
700
800
900
Minimumperformance
Performancein line with
expectations
Minimumperformance
Performancein line with
expectations
Maximumperformance
£668k
£1,145k
100% 58%
37%
5%
Maximumperformance
£1,744k
38%
48%
14%
£343k
£541k
CEO CFO
100% 63%
33%
4%
£779k
44%
46%
10%
Fixed remuneration Long-term variable remunerationAnnual variable remuneration
Levels of performance Assumptions
Fixed pay All scenarios • Total fixed pay comprises base salary, benefits and pension.
• Base salary – effective as at 1 January 2019.
• Benefits – as provided in the single figure table on page 56.
• 15% of base salary pension contributions.
Variable pay Minimum performance • No payout under the annual bonus.
• No vesting under the SOP.
Performance in line with expectations • 50% of the maximum annual bonus.
• 25% vesting of share option award, amortised over 5 years.
Maximum performance • 100% of the maximum annual bonus.
• 100% vesting of share option award, amortised over 5 years.
Maximum performance + 50% share price appreciation
• Note that the SOP requires share price appreciation plus dividends reinvested of 61% over 5 years for any vesting. Therefore, this scenario has not been shown in the chart above.
Policy for Chairman and Non-Executive Director fees
The Committee does not consider it appropriate to set a maximum limit on increases in the fees of the Chairman and Non-Executive Directors. However, the fees have been and will be set within the aggregate limits set out in the Company’s Articles of Association as approved by Shareholders.
Purpose and link to strategy Operation Fee levels
To enable Foxtons to attract and retain Non-Executive Directors of the required calibre by offering market competitive fees.
• The Chairman is paid an all-inclusive fee for all Board responsibilities.
• Non-Executive Directors receive a basic Board fee.
• Additional fees may be payable for additional Board responsibilities such as chairmanship or membership of a Committee.
• The Committee reviews the fees paid to the Chairman and the Board reviews the fees paid to Non-Executive Directors, periodically. The Committee or the Board (as the case may be) may increase the fees, and any such increases will take into account factors including:
− Scope and responsibility of the role, and
− Appropriate market data.
• No Director plays a role in determining their own remuneration.
• Fee levels remained unchanged in 2018.
• The fee levels are unchanged for 2019.
• These fees are the only element of Chairman and Non-Executive Director remuneration.
/ 52Annual Report and Accounts 2018
Approach to remuneration on recruitment
Overarching principle
In order to maintain Foxtons competitive advantage, it is important that we are able to recruit and retain Directors of the calibre required to deliver successfully our strategic priorities.
Recruitment of Executive Directors
When determining the remuneration arrangements of a new appointment to the Board (including internal promotions), the Committee will seek to apply the following principles:
• Although we operate in a competitive market for talent, we are mindful to pay no more than is necessary to attract and retain high-quality talent;
• The maximum level of variable remuneration will be in line with individual limits set out in the policy table;
• It may be necessary to “buy-out” remuneration arrangements forfeited on leaving a previous employer on appointment. Such payments or awards could include cash as well as performance and non-performance related share awards, and would be in such form as the Committee considers appropriate taking into account all relevant factors such as the form, expected value, anticipated vesting and timing of the forfeited remuneration. The Committee’s intention is that the value awarded would be no more than the value forfeited;
• An Executive Director may initially be hired on a contract requiring 24 months’ notice, which then reduces pro-rata over the course of the first year of the contract to 12 months’ notice;
• Appropriate relocation costs and support may be provided and where an Executive Director is appointed from within the organisation, the normal policy of the Company is that any legacy arrangements would be honoured in line with the original terms and conditions. Similarly, if an Executive Director is appointed following Foxtons acquisition of or merger with another company, legacy terms and conditions would be honoured; and
• In relation to pensions, the Committee is aware of and will consider how best to take into account the latest recommendations in best practice guidelines to harmonise pensions percentage contributions across the workforce.
The Committee retains discretion to make appropriate remuneration decisions outside the standard Policy to meet the individual circumstances of recruitment when:
• An interim appointment is made to fill an Executive Director role on a short-term basis; and
• Exceptional circumstances require that the Chairman or a Non-Executive Director takes on an executive function on a short-term basis.
Recruitment of Chairman and Non-Executive Directors
On the appointment of a new Chairman or Non-Executive Director, the fee will normally be consistent with the Policy set out above. Where specific cash or share arrangements are delivered to the Chairman or Non-Executive Directors, these will not include share options or any other performance related elements.
Service contracts
The current service contracts of the CEO and CFO can be terminated by not less than 12 months’ notice respectively given in writing by either party to the contract.
The appointment of the Chairman and each of the Non-Executive Directors is for an initial period of three years, which is renewable, and is terminable by the Chairman/Non-Executive Director (as applicable) or the Company on three months’ notice. No contractual payments would be due on termination.
Policy on payment for loss of office
Where an Executive Director leaves employment, the Committee’s approach to determining any payment for loss of office will normally be based on the following principles:
• The Committee’s objective is to find an outcome which is in the best interests of both Foxtons and its Shareholders, while taking into account the specific circumstances of cessation of employment;
• The Committee must satisfy any contractual obligations agreed with the Executive Director. This is dependent on the contractual obligations (i) not being in contradiction with the Policy set out in this Report, or (ii) if so, not having been entered into on a date later than 27 June 2012, in accordance with the relevant legislation; and
• Other than in circumstances where the Company is entitled to terminate employment summarily, if the employment of an Executive Director is terminated with immediate effect, a payment in lieu of notice may be made which would not exceed 12 months’ base salary for the current CEO and CFO. This payment may be subject to mitigation if alternative employment is taken up during this period.
/ 53Annual Report and Accounts 2018
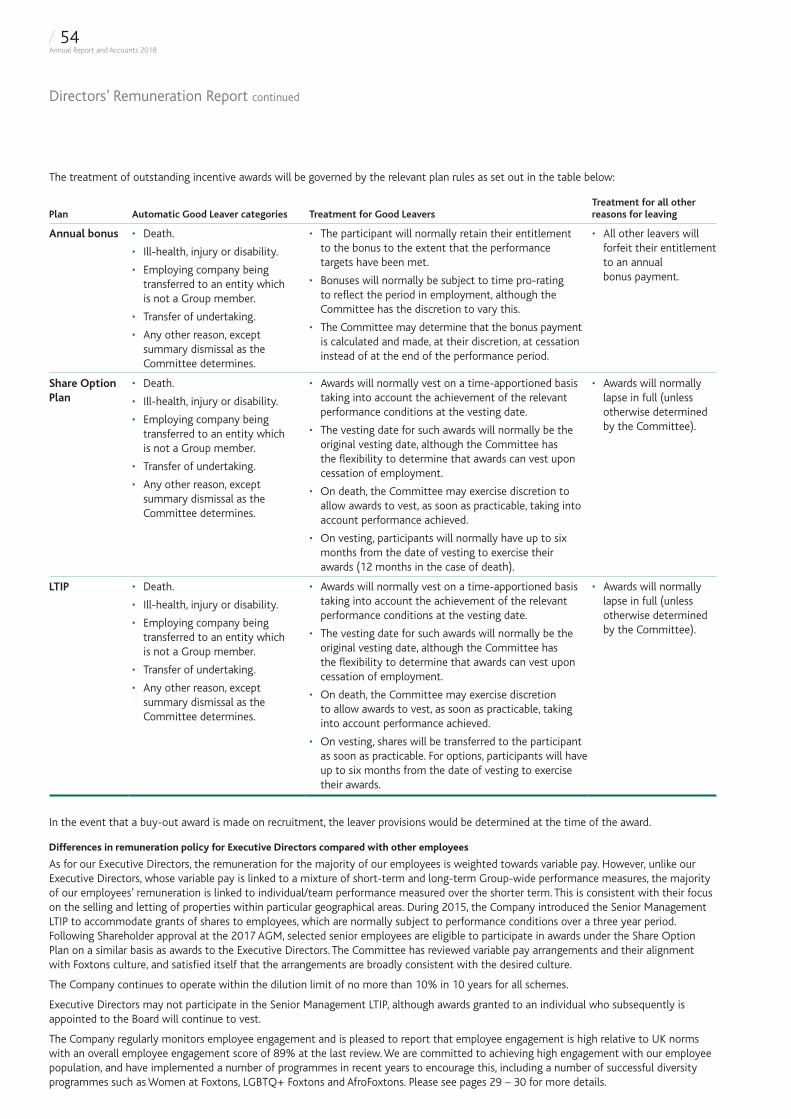
Directors’ Remuneration Report continued
The treatment of outstanding incentive awards will be governed by the relevant plan rules as set out in the table below:
Plan Automatic Good Leaver categories Treatment for Good LeaversTreatment for all other reasons for leaving
Annual bonus • Death.
• Ill-health, injury or disability.
• Employing company being transferred to an entity which is not a Group member.
• Transfer of undertaking.
• Any other reason, except summary dismissal as the Committee determines.
• The participant will normally retain their entitlement to the bonus to the extent that the performance targets have been met.
• Bonuses will normally be subject to time pro-rating to reflect the period in employment, although the Committee has the discretion to vary this.
• The Committee may determine that the bonus payment is calculated and made, at their discretion, at cessation instead of at the end of the performance period.
• All other leavers will forfeit their entitlement to an annual bonus payment.
Share Option Plan
• Death.
• Ill-health, injury or disability.
• Employing company being transferred to an entity which is not a Group member.
• Transfer of undertaking.
• Any other reason, except summary dismissal as the Committee determines.
• Awards will normally vest on a time-apportioned basis taking into account the achievement of the relevant performance conditions at the vesting date.
• The vesting date for such awards will normally be the original vesting date, although the Committee has the flexibility to determine that awards can vest upon cessation of employment.
• On death, the Committee may exercise discretion to allow awards to vest, as soon as practicable, taking into account performance achieved.
• On vesting, participants will normally have up to six months from the date of vesting to exercise their awards (12 months in the case of death).
• Awards will normally lapse in full (unless otherwise determined by the Committee).
LTIP • Death.
• Ill-health, injury or disability.
• Employing company being transferred to an entity which is not a Group member.
• Transfer of undertaking.
• Any other reason, except summary dismissal as the Committee determines.
• Awards will normally vest on a time-apportioned basis taking into account the achievement of the relevant performance conditions at the vesting date.
• The vesting date for such awards will normally be the original vesting date, although the Committee has the flexibility to determine that awards can vest upon cessation of employment.
• On death, the Committee may exercise discretion to allow awards to vest, as soon as practicable, taking into account performance achieved.
• On vesting, shares will be transferred to the participant as soon as practicable. For options, participants will have up to six months from the date of vesting to exercise their awards.
• Awards will normally lapse in full (unless otherwise determined by the Committee).
In the event that a buy-out award is made on recruitment, the leaver provisions would be determined at the time of the award.
Differences in remuneration policy for Executive Directors compared with other employees
As for our Executive Directors, the remuneration for the majority of our employees is weighted towards variable pay. However, unlike our Executive Directors, whose variable pay is linked to a mixture of short-term and long-term Group-wide performance measures, the majority of our employees’ remuneration is linked to individual/team performance measured over the shorter term. This is consistent with their focus on the selling and letting of properties within particular geographical areas. During 2015, the Company introduced the Senior Management LTIP to accommodate grants of shares to employees, which are normally subject to performance conditions over a three year period. Following Shareholder approval at the 2017 AGM, selected senior employees are eligible to participate in awards under the Share Option Plan on a similar basis as awards to the Executive Directors. The Committee has reviewed variable pay arrangements and their alignment with Foxtons culture, and satisfied itself that the arrangements are broadly consistent with the desired culture.
The Company continues to operate within the dilution limit of no more than 10% in 10 years for all schemes.
Executive Directors may not participate in the Senior Management LTIP, although awards granted to an individual who subsequently is appointed to the Board will continue to vest.
The Company regularly monitors employee engagement and is pleased to report that employee engagement is high relative to UK norms with an overall employee engagement score of 89% at the last review. We are committed to achieving high engagement with our employee population, and have implemented a number of programmes in recent years to encourage this, including a number of successful diversity programmes such as Women at Foxtons, LGBTQ+ Foxtons and AfroFoxtons. Please see pages 29 – 30 for more details.
/ 54Annual Report and Accounts 2018
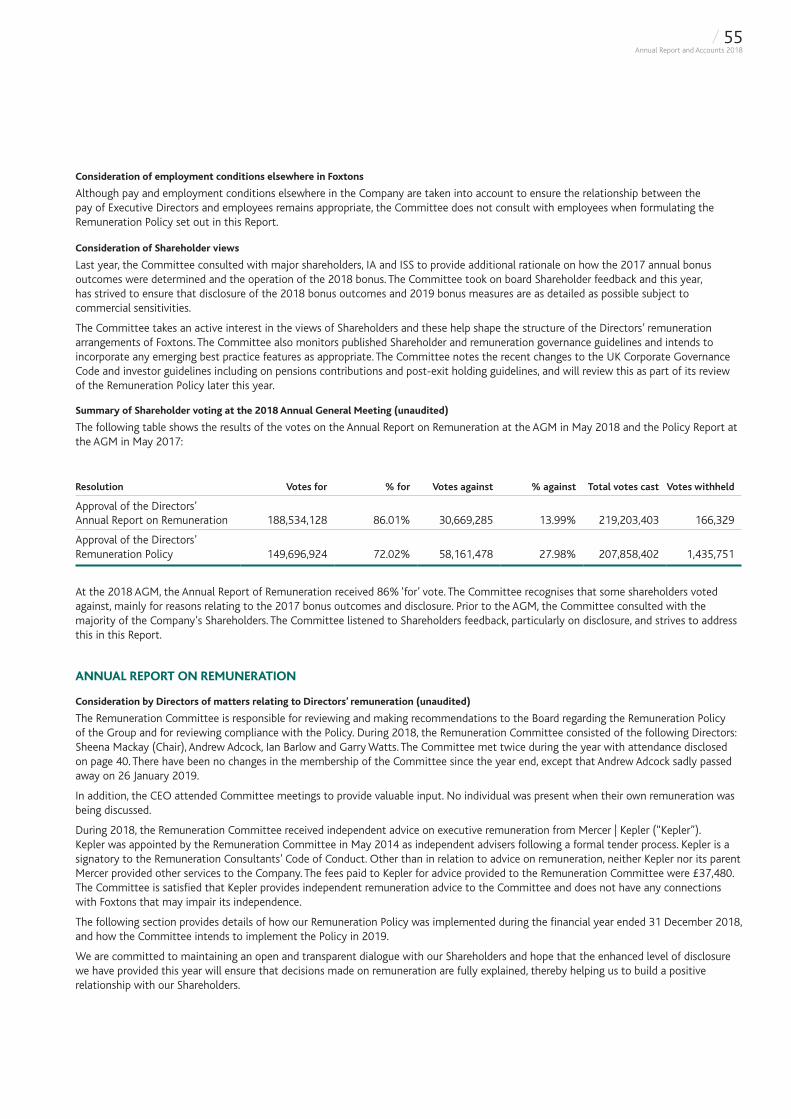
Consideration of employment conditions elsewhere in Foxtons
Although pay and employment conditions elsewhere in the Company are taken into account to ensure the relationship between the pay of Executive Directors and employees remains appropriate, the Committee does not consult with employees when formulating the Remuneration Policy set out in this Report.
Consideration of Shareholder views
Last year, the Committee consulted with major shareholders, IA and ISS to provide additional rationale on how the 2017 annual bonus outcomes were determined and the operation of the 2018 bonus. The Committee took on board Shareholder feedback and this year, has strived to ensure that disclosure of the 2018 bonus outcomes and 2019 bonus measures are as detailed as possible subject to commercial sensitivities.
The Committee takes an active interest in the views of Shareholders and these help shape the structure of the Directors’ remuneration arrangements of Foxtons. The Committee also monitors published Shareholder and remuneration governance guidelines and intends to incorporate any emerging best practice features as appropriate. The Committee notes the recent changes to the UK Corporate Governance Code and investor guidelines including on pensions contributions and post-exit holding guidelines, and will review this as part of its review of the Remuneration Policy later this year.
Summary of Shareholder voting at the 2018 Annual General Meeting (unaudited)
The following table shows the results of the votes on the Annual Report on Remuneration at the AGM in May 2018 and the Policy Report at the AGM in May 2017:
Resolution Votes for % for Votes against % against Total votes cast Votes withheld
Approval of the Directors’Annual Report on Remuneration 188,534,128 86.01% 30,669,285 13.99% 219,203,403 166,329
Approval of the Directors’ Remuneration Policy
149,696,924
72.02%
58,161,478
27.98%
207,858,402
1,435,751
At the 2018 AGM, the Annual Report of Remuneration received 86% ‘for’ vote. The Committee recognises that some shareholders voted against, mainly for reasons relating to the 2017 bonus outcomes and disclosure. Prior to the AGM, the Committee consulted with the majority of the Company’s Shareholders. The Committee listened to Shareholders feedback, particularly on disclosure, and strives to address this in this Report.
ANNUAL REPORT ON REMUNERATION
Consideration by Directors of matters relating to Directors’ remuneration (unaudited)
The Remuneration Committee is responsible for reviewing and making recommendations to the Board regarding the Remuneration Policy of the Group and for reviewing compliance with the Policy. During 2018, the Remuneration Committee consisted of the following Directors: Sheena Mackay (Chair), Andrew Adcock, Ian Barlow and Garry Watts. The Committee met twice during the year with attendance disclosed on page 40. There have been no changes in the membership of the Committee since the year end, except that Andrew Adcock sadly passed away on 26 January 2019.
In addition, the CEO attended Committee meetings to provide valuable input. No individual was present when their own remuneration was being discussed.
During 2018, the Remuneration Committee received independent advice on executive remuneration from Mercer | Kepler (“Kepler”). Kepler was appointed by the Remuneration Committee in May 2014 as independent advisers following a formal tender process. Kepler is a signatory to the Remuneration Consultants’ Code of Conduct. Other than in relation to advice on remuneration, neither Kepler nor its parent Mercer provided other services to the Company. The fees paid to Kepler for advice provided to the Remuneration Committee were £37,480. The Committee is satisfied that Kepler provides independent remuneration advice to the Committee and does not have any connections with Foxtons that may impair its independence.
The following section provides details of how our Remuneration Policy was implemented during the financial year ended 31 December 2018, and how the Committee intends to implement the Policy in 2019.
We are committed to maintaining an open and transparent dialogue with our Shareholders and hope that the enhanced level of disclosure we have provided this year will ensure that decisions made on remuneration are fully explained, thereby helping us to build a positive relationship with our Shareholders.
/ 55Annual Report and Accounts 2018
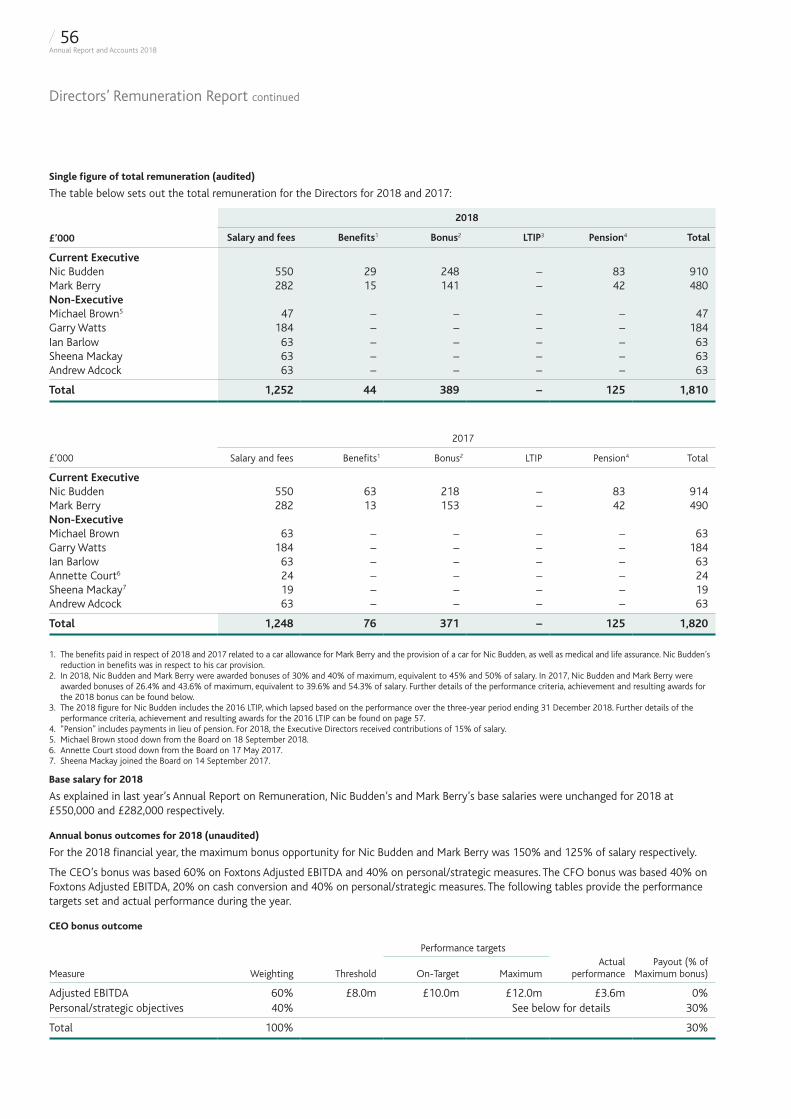
Directors’ Remuneration Report continued
Single figure of total remuneration (audited)
The table below sets out the total remuneration for the Directors for 2018 and 2017:
2018
£’000 Salary and fees Benefits1 Bonus2 LTIP3 Pension4 Total
Current ExecutiveNic Budden 550 29 248 – 83 910Mark Berry 282 15 141 – 42 480Non-ExecutiveMichael Brown5 47 – – – – 47Garry Watts 184 – – – – 184Ian Barlow 63 – – – – 63Sheena Mackay 63 – – – – 63Andrew Adcock 63 – – – – 63
Total 1,252 44 389 – 125 1,810
2017
£’000 Salary and fees Benefits1 Bonus2 LTIP Pension4 Total
Current ExecutiveNic Budden 550 63 218 – 83 914Mark Berry 282 13 153 – 42 490Non-ExecutiveMichael Brown 63 – – – – 63Garry Watts 184 – – – – 184Ian Barlow 63 – – – – 63Annette Court6 24 – – – – 24Sheena Mackay7 19 – – – – 19Andrew Adcock 63 – – – – 63
Total 1,248 76 371 – 125 1,820
1. The benefits paid in respect of 2018 and 2017 related to a car allowance for Mark Berry and the provision of a car for Nic Budden, as well as medical and life assurance. Nic Budden’s reduction in benefits was in respect to his car provision.
2. In 2018, Nic Budden and Mark Berry were awarded bonuses of 30% and 40% of maximum, equivalent to 45% and 50% of salary. In 2017, Nic Budden and Mark Berry were awarded bonuses of 26.4% and 43.6% of maximum, equivalent to 39.6% and 54.3% of salary. Further details of the performance criteria, achievement and resulting awards for the 2018 bonus can be found below.
3. The 2018 figure for Nic Budden includes the 2016 LTIP, which lapsed based on the performance over the three-year period ending 31 December 2018. Further details of the performance criteria, achievement and resulting awards for the 2016 LTIP can be found on page 57.
4. “Pension” includes payments in lieu of pension. For 2018, the Executive Directors received contributions of 15% of salary.5. Michael Brown stood down from the Board on 18 September 2018.6. Annette Court stood down from the Board on 17 May 2017.7. Sheena Mackay joined the Board on 14 September 2017.
Base salary for 2018
As explained in last year’s Annual Report on Remuneration, Nic Budden’s and Mark Berry’s base salaries were unchanged for 2018 at £550,000 and £282,000 respectively.
Annual bonus outcomes for 2018 (unaudited)
For the 2018 financial year, the maximum bonus opportunity for Nic Budden and Mark Berry was 150% and 125% of salary respectively.
The CEO’s bonus was based 60% on Foxtons Adjusted EBITDA and 40% on personal/strategic measures. The CFO bonus was based 40% on Foxtons Adjusted EBITDA, 20% on cash conversion and 40% on personal/strategic measures. The following tables provide the performance targets set and actual performance during the year.
CEO bonus outcome
Performance targets
Measure Weighting Threshold On-Target MaximumActual
performancePayout (% of
Maximum bonus)
Adjusted EBITDA 60% £8.0m £10.0m £12.0m £3.6m 0%Personal/strategic objectives 40% See below for details 30%
Total 100% 30%
/ 56Annual Report and Accounts 2018
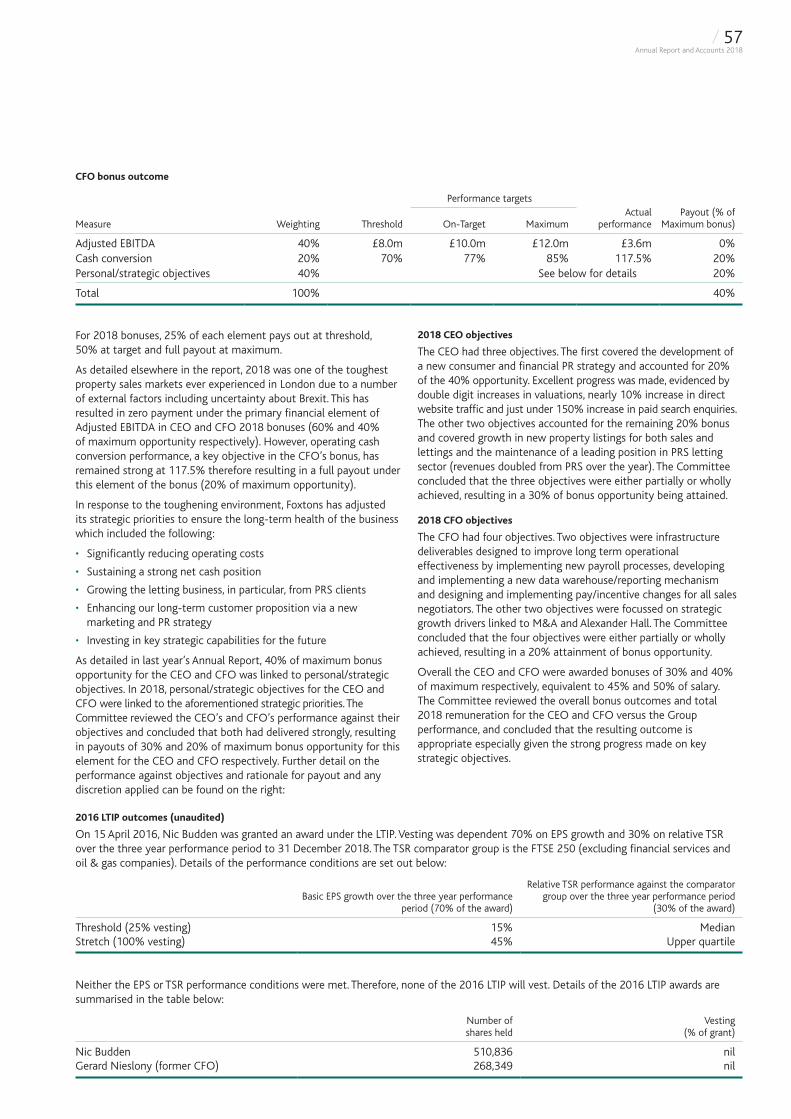
CFO bonus outcome
Performance targets
Measure Weighting Threshold On-Target MaximumActual
performancePayout (% of
Maximum bonus)
Adjusted EBITDA 40% £8.0m £10.0m £12.0m £3.6m 0%Cash conversion 20% 70% 77% 85% 117.5% 20%Personal/strategic objectives 40% See below for details 20%
Total 100% 40%
For 2018 bonuses, 25% of each element pays out at threshold, 50% at target and full payout at maximum.
As detailed elsewhere in the report, 2018 was one of the toughest property sales markets ever experienced in London due to a number of external factors including uncertainty about Brexit. This has resulted in zero payment under the primary financial element of Adjusted EBITDA in CEO and CFO 2018 bonuses (60% and 40% of maximum opportunity respectively). However, operating cash conversion performance, a key objective in the CFO’s bonus, has remained strong at 117.5% therefore resulting in a full payout under this element of the bonus (20% of maximum opportunity).
In response to the toughening environment, Foxtons has adjusted its strategic priorities to ensure the long-term health of the business which included the following:
• Significantly reducing operating costs
• Sustaining a strong net cash position
• Growing the letting business, in particular, from PRS clients
• Enhancing our long-term customer proposition via a new marketing and PR strategy
• Investing in key strategic capabilities for the future
As detailed in last year’s Annual Report, 40% of maximum bonus opportunity for the CEO and CFO was linked to personal/strategic objectives. In 2018, personal/strategic objectives for the CEO and CFO were linked to the aforementioned strategic priorities. The Committee reviewed the CEO’s and CFO’s performance against their objectives and concluded that both had delivered strongly, resulting in payouts of 30% and 20% of maximum bonus opportunity for this element for the CEO and CFO respectively. Further detail on the performance against objectives and rationale for payout and any discretion applied can be found on the right:
2018 CEO objectives
The CEO had three objectives. The first covered the development of a new consumer and financial PR strategy and accounted for 20% of the 40% opportunity. Excellent progress was made, evidenced by double digit increases in valuations, nearly 10% increase in direct website traffic and just under 150% increase in paid search enquiries. The other two objectives accounted for the remaining 20% bonus and covered growth in new property listings for both sales and lettings and the maintenance of a leading position in PRS letting sector (revenues doubled from PRS over the year). The Committee concluded that the three objectives were either partially or wholly achieved, resulting in a 30% of bonus opportunity being attained.
2018 CFO objectives
The CFO had four objectives. Two objectives were infrastructure deliverables designed to improve long term operational effectiveness by implementing new payroll processes, developing and implementing a new data warehouse/reporting mechanism and designing and implementing pay/incentive changes for all sales negotiators. The other two objectives were focussed on strategic growth drivers linked to M&A and Alexander Hall. The Committee concluded that the four objectives were either partially or wholly achieved, resulting in a 20% attainment of bonus opportunity.
Overall the CEO and CFO were awarded bonuses of 30% and 40% of maximum respectively, equivalent to 45% and 50% of salary. The Committee reviewed the overall bonus outcomes and total 2018 remuneration for the CEO and CFO versus the Group performance, and concluded that the resulting outcome is appropriate especially given the strong progress made on key strategic objectives.
2016 LTIP outcomes (unaudited)
On 15 April 2016, Nic Budden was granted an award under the LTIP. Vesting was dependent 70% on EPS growth and 30% on relative TSR over the three year performance period to 31 December 2018. The TSR comparator group is the FTSE 250 (excluding financial services and oil & gas companies). Details of the performance conditions are set out below:
Basic EPS growth over the three year performance period (70% of the award)
Relative TSR performance against the comparator group over the three year performance period
(30% of the award)
Threshold (25% vesting) 15% MedianStretch (100% vesting) 45% Upper quartile
Neither the EPS or TSR performance conditions were met. Therefore, none of the 2016 LTIP will vest. Details of the 2016 LTIP awards are summarised in the table below:
Number of shares held
Vesting (% of grant)
Nic Budden 510,836 nilGerard Nieslony (former CFO) 268,349 nil
/ 57Annual Report and Accounts 2018
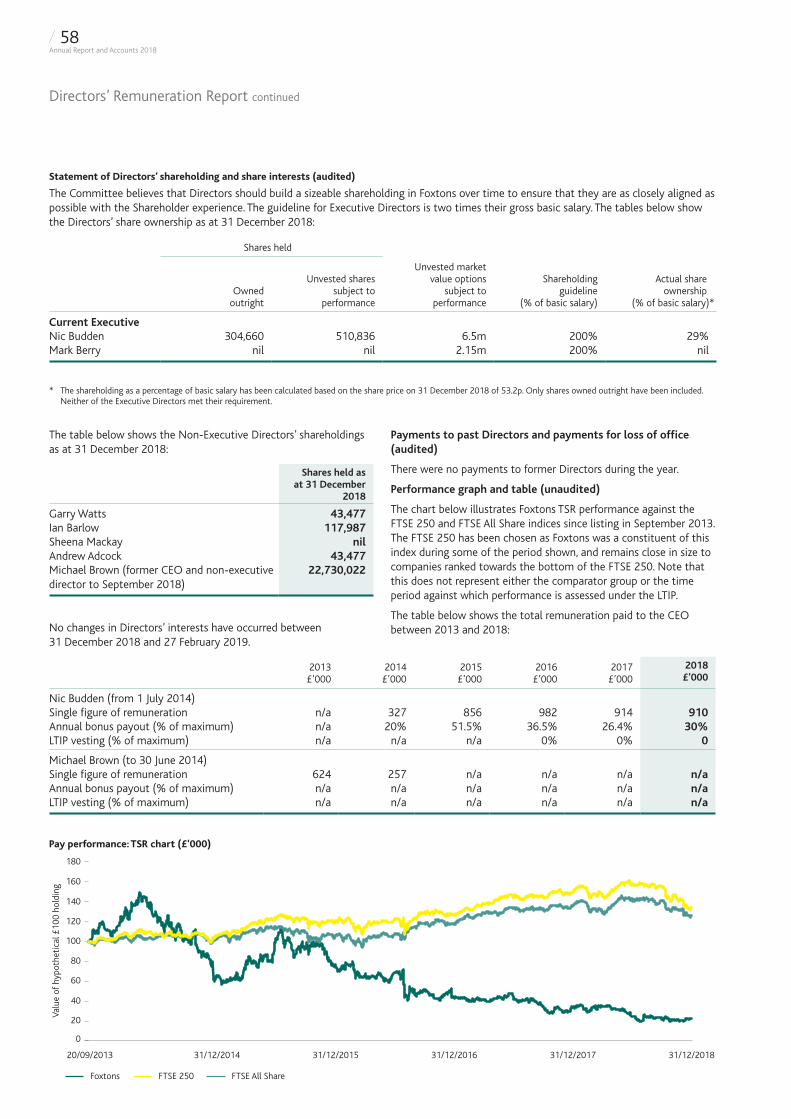
Directors’ Remuneration Report continued
Statement of Directors’ shareholding and share interests (audited)
The Committee believes that Directors should build a sizeable shareholding in Foxtons over time to ensure that they are as closely aligned as possible with the Shareholder experience. The guideline for Executive Directors is two times their gross basic salary. The tables below show the Directors’ share ownership as at 31 December 2018:
Shares held
Owned outright
Unvested shares subject to
performance
Unvested market value options
subject to performance
Shareholding guideline
(% of basic salary)
Actual share ownership
(% of basic salary)*
Current ExecutiveNic Budden 304,660 510,836 6.5m 200% 29%Mark Berry nil nil 2.15m 200% nil
* The shareholding as a percentage of basic salary has been calculated based on the share price on 31 December 2018 of 53.2p. Only shares owned outright have been included. Neither of the Executive Directors met their requirement.
The table below shows the Non-Executive Directors’ shareholdings as at 31 December 2018:
Shares held as at 31 December
2018
Garry Watts 43,477Ian Barlow 117,987Sheena Mackay nilAndrew Adcock 43,477Michael Brown (former CEO and non-executive director to September 2018)
22,730,022
No changes in Directors’ interests have occurred between 31 December 2018 and 27 February 2019.
Payments to past Directors and payments for loss of office (audited)
There were no payments to former Directors during the year.
Performance graph and table (unaudited)
The chart below illustrates Foxtons TSR performance against the FTSE 250 and FTSE All Share indices since listing in September 2013. The FTSE 250 has been chosen as Foxtons was a constituent of this index during some of the period shown, and remains close in size to companies ranked towards the bottom of the FTSE 250. Note that this does not represent either the comparator group or the time period against which performance is assessed under the LTIP.
The table below shows the total remuneration paid to the CEO between 2013 and 2018:
2013 £’000
2014 £’000
2015 £’000
2016 £’000
2017 £’000
2018 £’000
Nic Budden (from 1 July 2014) Single figure of remuneration n/a 327 856 982 914 910Annual bonus payout (% of maximum) n/a 20% 51.5% 36.5% 26.4% 30%LTIP vesting (% of maximum) n/a n/a n/a 0% 0% 0
Michael Brown (to 30 June 2014) Single figure of remuneration 624 257 n/a n/a n/a n/aAnnual bonus payout (% of maximum) n/a n/a n/a n/a n/a n/aLTIP vesting (% of maximum) n/a n/a n/a n/a n/a n/a
Pay performance: TSR chart (£’000)
20/09/2013 31/12/2014 31/12/2015 31/12/2016 31/12/2017 31/12/2018
0
20
40
60
80
100
120
140
180
160
FTSE 250 FTSE All ShareFoxtons
Valu
e of
hyp
othe
tica
l £10
0 ho
ldin
g
/ 58Annual Report and Accounts 2018
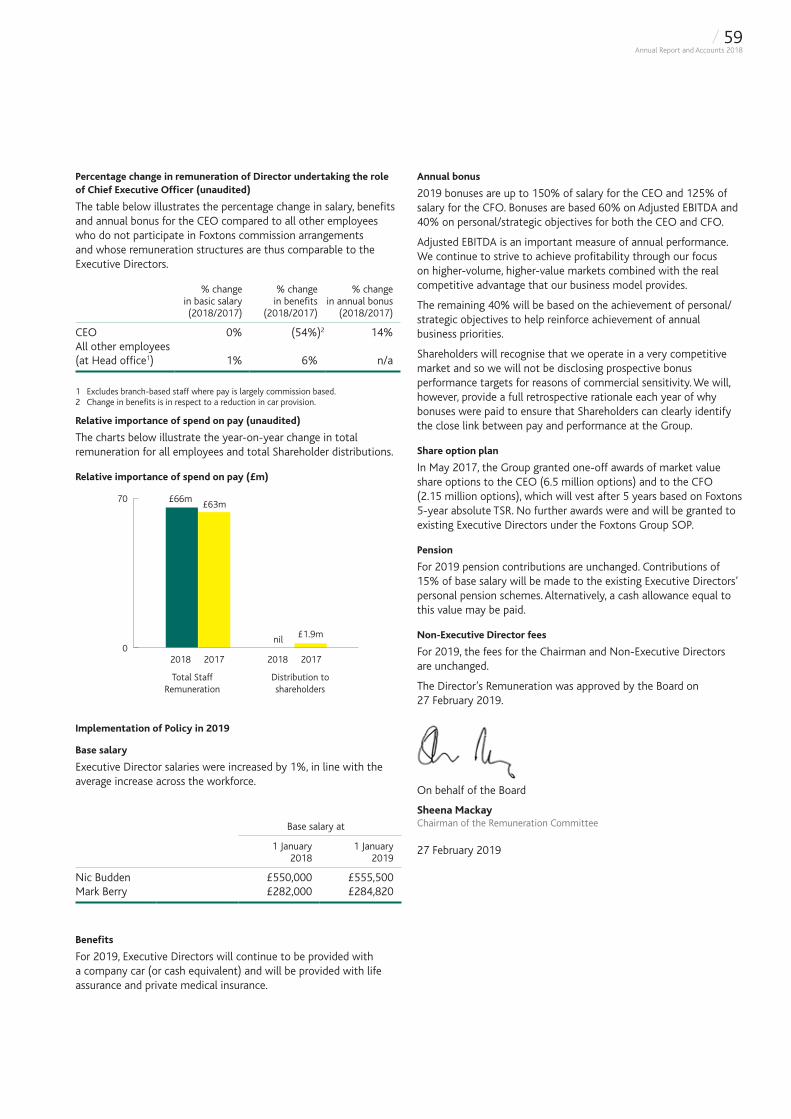
Percentage change in remuneration of Director undertaking the role of Chief Executive Officer (unaudited)
The table below illustrates the percentage change in salary, benefits and annual bonus for the CEO compared to all other employees who do not participate in Foxtons commission arrangements and whose remuneration structures are thus comparable to the Executive Directors.
% change in basic salary (2018/2017)
% change in benefits
(2018/2017)
% change in annual bonus
(2018/2017)
CEO 0% (54%)2 14%All other employees(at Head office1) 1% 6% n/a
1 Excludes branch-based staff where pay is largely commission based.2 Change in benefits is in respect to a reduction in car provision.
Relative importance of spend on pay (unaudited)
The charts below illustrate the year-on-year change in total remuneration for all employees and total Shareholder distributions.
Relative importance of spend on pay (£m)
0
70
2018 2017 2018 2017
Total StaffRemuneration
Distribution toshareholders
£63m£66m
£1.9mnil
Implementation of Policy in 2019
Base salary
Executive Director salaries were increased by 1%, in line with the average increase across the workforce.
Base salary at
1 January 2018
1 January 2019
Nic Budden £550,000 £555,500Mark Berry £282,000 £284,820
Benefits
For 2019, Executive Directors will continue to be provided with a company car (or cash equivalent) and will be provided with life assurance and private medical insurance.
Annual bonus
2019 bonuses are up to 150% of salary for the CEO and 125% of salary for the CFO. Bonuses are based 60% on Adjusted EBITDA and 40% on personal/strategic objectives for both the CEO and CFO.
Adjusted EBITDA is an important measure of annual performance. We continue to strive to achieve profitability through our focus on higher-volume, higher-value markets combined with the real competitive advantage that our business model provides.
The remaining 40% will be based on the achievement of personal/strategic objectives to help reinforce achievement of annual business priorities.
Shareholders will recognise that we operate in a very competitive market and so we will not be disclosing prospective bonus performance targets for reasons of commercial sensitivity. We will, however, provide a full retrospective rationale each year of why bonuses were paid to ensure that Shareholders can clearly identify the close link between pay and performance at the Group.
Share option plan
In May 2017, the Group granted one-off awards of market value share options to the CEO (6.5 million options) and to the CFO (2.15 million options), which will vest after 5 years based on Foxtons 5-year absolute TSR. No further awards were and will be granted to existing Executive Directors under the Foxtons Group SOP.
Pension
For 2019 pension contributions are unchanged. Contributions of 15% of base salary will be made to the existing Executive Directors’ personal pension schemes. Alternatively, a cash allowance equal to this value may be paid.
Non-Executive Director fees
For 2019, the fees for the Chairman and Non-Executive Directors are unchanged.
The Director’s Remuneration was approved by the Board on 27 February 2019.
On behalf of the Board
Sheena MackayChairman of the Remuneration Committee
27 February 2019
/ 59Annual Report and Accounts 2018
Corporate structure
Foxtons Group plc is the holding company of the Foxtons group of companies. It is a public company limited by shares, incorporated in England and Wales, and its shares are traded on the main market of the London Stock Exchange. The Company has no branches outside the UK.
Corporate governance
A report on corporate governance and the Company’s compliance with the UK Corporate Governance Code is set out on pages 34 to 46 and forms part of this report by reference.
The Board of Directors
The members of the Board of Directors and their biographical details are shown on pages 34 and 35 of this Annual Report and are incorporated into this report by reference. During the year, Michael Brown retired as a Director of the Company on 18 September 2018. Andrew Adcock sadly passed away and ceased to be a Director on 26 January 2019.
Appointment and replacement of Directors
The appointment and replacement of Directors is governed by the Company’s Articles of Association (the “Articles”), the Companies Act 2006 and related legislation. The Articles provide that the Directors may be appointed by ordinary resolution of the Shareholders or by the Board. The Company must have not less than two, or more than 12 Directors. Where Directors are appointed by the Board, they may only hold office until the next AGM of the Company where they will be eligible for election. Each Director must then retire from office at the third AGM after the AGM at which he was last elected. However, the Board has decided to comply with best practice corporate governance on a voluntary basis, and all Directors will seek re-election at each AGM. The Company may remove a Director by special resolution or by ordinary resolution where special notice has been given and the necessary statutory procedures are complied with.
Powers of Directors
Subject to the Articles, the Companies Act 2006 and related legislation, and any directions given by special resolution of the Shareholders, the business of the Company will be managed by the Board which may exercise all the powers of the Company.
Articles of Association
The Company may alter its Articles by special resolution at a general meeting of the Company. The Company’s Articles of Association are available on the Company’s website www.foxtonsgroup.co.uk.
Directors’ indemnity
The Company has granted a third party indemnity to each of its Directors against any liability that attaches to them in defending proceedings brought against them, to the extent permitted by English law, in connection with the discharge of their duties as a Director of the Company and its subsidiaries. In addition, Directors and Officers of the Company and its subsidiaries are covered by Directors’ and Officers’ liability insurance, which gives appropriate cover for legal action brought against the Directors.
Compensation for loss of office
The Company does not have arrangements with any Director that would provide compensation for loss of office or employment resulting from a takeover, except that provisions of the Company’s share plans may cause options and awards granted under such plans to vest on a takeover. Further information is provided in the Directors’ Remuneration Report on pages 47 to 59.
Dividends
The Directors are not recommending the payment of any dividend on its ordinary shares for the year ended 31 December 2018 (2017: 0.70p) but will consider future dividend policy in the light of results from the business going forward.
Post balance sheet events
There are no post balance sheet events to report.
Future developments in the business of the Company
Details of the Group’s business activities and the factors likely to affect its future development, performance and position are set out in the Strategic Report on pages 1 to 31 and form part of this report by reference.
Greenhouse gas emissions
Information on the Group’s greenhouse gas emissions is set out in the Corporate Social Responsibility statement on pages 29 to 31 and forms part of this report by reference.
Research and development
The Group does not undertake any material activities in the field of research and development.
Political donations
No political donations were made in 2018 (2017: nil).
Employee involvement and policy regarding disabled persons
The Group provides employees with information on the Group’s performance and on matters concerning them on a regular basis. Considerable value is placed on the involvement of employees, which is reflected in the principles of Foxtons Corporate Practice and its related guidance, which require regular, open, fair and respectful communication, zero tolerance for human rights violations, fair remuneration and, above all, a safe working environment.
Foxtons operates an equal opportunities policy that aims to treat individuals fairly and not to discriminate on the basis of sex, race, ethnic origin, disability or any other basis. The Company’s policy and procedures are designed to provide for full and fair consideration and selection of disabled applicants, to ensure they are properly trained to perform safely and effectively and to provide career opportunities that allow them to fulfil their potential. Where an employee becomes disabled in the course of their employment, the Company will actively seek to retain them wherever possible by making adjustments to their work content and environment or by retraining them to undertake new roles.
Further information on the Company’s policies on diversity, inclusion and career progression are contained in the Our People section on pages 12 and 13.
Directors’ interests
The beneficial interests of the Directors of the Company and their closely associated persons in the issued ordinary shares of the Company at 31 December 2018 are provided on page 58, within the Directors’ Remuneration Report. Details of any changes in those interests between 31 December 2018 and 27 February 2019 are also shown on page 58.
DIRECTORS’ REPORT
/ 60Annual Report and Accounts 2018
Directors’ Report continued
Share capital
At 31 December 2018, there were 275,104,391 ordinary shares of £0.01 each in issue. Each ordinary share carries one vote; therefore, the total votes in issue at 31 December 2018 were 275,104,391.
Details of the Company’s issued share capital can be found in note 23 to the financial statements on page 88.
Rights and obligations attaching to shares
The Company has a single class of ordinary shares in issue. Holders of the ordinary shares are entitled to receive dividends (when declared) and a copy of the Company’s Annual Report, attend and speak at general meetings of the Company and appoint proxies and exercise voting rights. At any general meeting, on a show of hands, every Shareholder present in person or by proxy shall have one vote and, on a poll, every Shareholder present in person or by proxy shall have one vote for every share of which they are the holder. Subject to certain thresholds being met, holders of ordinary shares may requisition the Board to convene a general meeting or propose resolutions at AGMs. On liquidation, holders of ordinary shares may share in the assets of the Company.
None of the ordinary shares carry any special rights with regard to control of the Company and there are no restrictions on voting rights. Major Shareholders have the same voting rights per share as all other Shareholders. The Company is not aware of any arrangements under which financial rights are held by a person other than the holder of the shares.
The Foxtons Group Employee Benefit Trust is an Employee Benefit Trust which holds ordinary shares in the Company in trust for employees within the Group. The Trustee of the Trust has the power to exercise the rights and powers incidental to, and to act in relation to, the ordinary shares subject to the Trust in such manner as the Trustee in its absolute discretion thinks fit. The Trustee of the Employee Benefit Trust has waived its rights to dividends on ordinary shares held by the Trust as these have not yet vested unconditionally in employees. Details of the ordinary shares held by the Trust can be found in note 24 to the financial statements on page 88.
Restrictions on transfers of securities
There are no restrictions on the transfer of securities in the Company and no requirement for any person to obtain the approval of the Company, or other holders of the Company’s securities, in order to transfer securities. The Company is not aware of any agreements between Shareholders that may result in restrictions on the transfer of securities or on voting rights.
Authority to allot shares
The Company was granted a general authority by its Shareholders at the 2018 AGM to allot shares up to 33.33% of the Company’s issued share capital as at 28 March 2018. The Company also received authority to allot shares for cash on a non pre-emptive basis up to 5% of the Company’s issued share capital as at 28 March 2018. As at the date of this Report, no shares have been issued under these authorities. These authorities will expire at the conclusion of the 2019 AGM. Resolutions will be proposed at the 2019 AGM to renew these authorities.
Major interests in shares
Information on major interests in shares provided to the Company under the Disclosure Guidance and Transparency Rules (DTRs) of the UK Listing Authority is published via a Regulatory Information Service and on the Company’s website www.foxtonsgroup.co.uk.
The table below shows notifications received by the Company in accordance with DTR 5. This information was correct at the date of notification. It should be noted that these holdings may have changed since notified to the Company. However, notification of any change is not required until the next applicable threshold is crossed.
InstitutionVoting rights at
31 December 2018% of capital at
31 December 2018
Nature of holding
Caledonia (Private) Investments Pty Ltd 61,381,354 22.31% DirectPlatinum Investment Management Limited 30,585,105 11.12% Direct – 11.03%
Indirect – 0.09%UBS Investment Bank – UBS AG 26,773,427* 9.73% Indirect – 5.26%Michael Brown 22,730,022 8.26% DirectThe Capital Group of Companies, Inc. 17,881,785 6.50% IndirectRussell Investments Group Ltd 17,723,934 6.44% IndirectInvesco Ltd 14,699,146 5.34% IndirectFranklin Templeton Institutional, LLC 14,149,800 5.14% IndirectHighclere International Investors 13,906,308 5.05% Indirect
* 165,835 shares (0.06%) are held as a right to recall lent shares at any time and 12,142,523 shares (4.41%) are held in equity swaps.
As at 27 February 2019, the date of this report, the Company had received notification that UBS Investment Bank (UBS AG) now holds 27,713,842 of the ordinary shares, being 10.07% of the issued shares (165,835 of these shares (0.06%) are held as a right to recall lent shares at any time and 12,743,226 (4.63%) are held in equity swaps). There have been no further changes to the above since 31 December 2018 as at the date of this report.
/ 61Annual Report and Accounts 2018
Authority for the company to purchase its own shares
The Company was granted authority by its Shareholders at the 2018 AGM to purchase up to 27,510,439 of its ordinary shares, being 10% of the issued share capital as at 28 March 2018. This authority will expire at the conclusion of the 2019 AGM. No shares have been bought under this authority.
The Company does not have any current intention to purchase any of its own ordinary shares, however, in order to retain flexibility, the Company will propose a resolution at the 2019 AGM to renew the Company’s authority to purchase up to approximately 10% of its ordinary shares at the Directors’ discretion. If the resolution is passed, the new authority will replace the existing authority, which will lapse at the conclusion of the AGM on 20 May 2019.
Significant agreements
The Company is not a party to any significant agreements that would take effect, alter or terminate on a change of control of the Company.
Principal Risks and Uncertainties
The Board have carried out a robust assessment of our current key risks and these are summarised in the Risk Management section of the Strategic Report on pages 24 to 28.
Financial risk management
The Group’s financial risk management objectives and policies, including its use of financial instruments, are set out in note 27 to the Group’s consolidated financial statements on pages 90 to 92.
Information presented in other sections
Certain information is required to be included in the Annual Financial Report by Listing Rule 9.8.4. The following table provides references to where this information can be found in this Annual Report. If a requirement is not shown, it is not applicable to the Company.
SectionListing Rule Requirement Location Page
4 Details of long-term incentive schemes
Directors’ Remuneration Report
50
12 and 13 Shareholder waivers of dividends and future dividends
Directors’ Report 61
Going concern
The financial position of the Group, its cash flows and liquidity position are set out in the Financial Statements section. Furthermore, note 27 on page 90 to the consolidated financial statements includes the Group’s objectives and policies for managing its capital, its financial risk management objectives, details of its financial instruments and its exposure to credit and liquidity risk.
The Directors believe the Group has adequate resources to continue in operation for the forseeable future due to its existing cash resources and its continued operating cash generation. For this reason, they continue to adopt the going concern basis in preparing the financial statements. The Directors have made this assessment after consideration of the Company’s budgeted cash flows and related assumptions and in accordance with the “Guidance on Risk Management, Internal Control and Related Financial and Business Reporting” published by the UK Financial Reporting Council in September 2014.
Auditor
Deloitte LLP has expressed its willingness to continue in office as auditors and a resolution to reappoint Deloitte LLP will be proposed at the forthcoming AGM.
Statement on disclosure to the auditor
Each of the persons who is a Director at the date of approval of this Annual Report confirms that:
a) so far as the Director is aware, there is no relevant audit information of which the Company’s auditor is unaware; and
b) the Director has taken all the steps that he/she ought to have taken as a Director in order to make himself/herself aware of any relevant audit information and to establish that the Company’s auditor is aware of that information.
This confirmation is given and should be interpreted in accordance with the provisions of section 418 of the Companies Act 2006.
AGM
The Company’s AGM will take place on 20 May 2019 at the Company’s registered office at Building One, Chiswick Park, 566 Chiswick High Road, London, W4 5BE. The Notice of Meeting, which sets out the resolutions to be proposed at the forthcoming AGM, accompanies this Annual Report and can also be found on the Company’s website at www.foxtonsgroup.co.uk.
The AGM is the Company’s principal forum for communication with Shareholders. The Chairman of the Board and the Chairs of the Committees, together with the other Directors, will be available to answer Shareholders’ questions at the meeting.
The Directors look forward to meeting Shareholders at the meeting.
On behalf of the Board
Nic BuddenChief Executive Officer
Mark BerryChief Financial Officer
27 February 2019
/ 62Annual Report and Accounts 2018
The Directors are responsible for preparing the Annual Report and the financial statements in accordance with applicable law and regulations.
Company law requires the Directors to prepare financial statements for each financial year. Under that law, the Directors are required to prepare the Group financial statements in accordance with International Financial Reporting Standards (IFRSs) as adopted by the European Union and Article 4 of the IAS Regulation and have elected to prepare the parent company financial statements in accordance with Financial Reporting Standard 101 Reduced Disclosure Framework. Under company law, the Directors must not approve the accounts unless they are satisfied that they give a true and fair view of the state of affairs of the Company and of the profit or loss of the Company for that period.
In preparing the parent Company financial statements, the Directors are required to:
• select suitable accounting policies and then apply them consistently;
• make judgements and accounting estimates that are reasonable and prudent;
• state whether Financial Reporting Standard 101 Reduced Disclosure Framework has been followed, subject to any material departures disclosed and explained in the financial statements; and
• prepare the financial statements on the going concern basis unless it is inappropriate to presume that the Company will continue in business.
In preparing the Group financial statements, International Accounting Standard 1 requires that Directors:
• properly select and apply accounting policies;
• present information, including accounting policies, in a manner that provides relevant, reliable, comparable and understandable information;
• provide additional disclosures when compliance with the specific requirements in IFRSs are insufficient to enable users to understand the impact of particular transactions, other events and conditions on the entity’s financial position and financial performance; and
• make an assessment of the Company’s ability to continue as a going concern.
The Directors are responsible for keeping adequate accounting records that are sufficient to show and explain the Company’s transactions and disclose with reasonable accuracy at any time the financial position of the Company and enable them to ensure that the financial statements comply with the Companies Act 2006. They are also responsible for safeguarding the assets of the Company and hence for taking reasonable steps for the prevention and detection of fraud and other irregularities.
The Directors are responsible for preparing the Directors’ Report, the Strategic Report, the Directors’ Remuneration Report and the Corporate Governance Statement in accordance with the Companies Act 2006 and applicable regulations, including the requirements of the Listing Rules and the Disclosure Guidance and Transparency Rules of the FCA.
The Directors are responsible for the maintenance and integrity of the corporate and financial information included on the Company’s website. Legislation in the United Kingdom governing the preparation and dissemination of financial statements may differ from legislation in other jurisdictions.
Responsibility statement
We confirm that to the best of our knowledge:
• the consolidated and Company financial statements, prepared in accordance with the relevant financial reporting framework, give a true and fair view of the assets, liabilities, financial position and loss of the Company and the undertakings included in the consolidation taken as a whole; and
• the Strategic Report and the Directors’ Report include a fair review of the development and performance of the business and the position of the Company and the undertakings included in the consolidation taken as a whole, together with a description of the principal risks and uncertainties that it faces.
The Directors consider that the Annual Report and financial statements, taken as a whole, are fair, balanced and understandable and provide the information necessary for Shareholders to assess the Company’s position and performance, business model and strategy.
This responsibility statement was approved by the Board of Directors on 27 February 2019 and was signed on its behalf by:
Nic BuddenChief Executive Officer
Mark BerryChief Financial Officer
27 February 2019
DIRECTORS’ RESPONSIBILITIES STATEMENT
/ 63Annual Report and Accounts 2018

RESILIENT IN TOUGH MARKET CONDITIONS
/ 64Annual Report and Accounts 2018
p / 66 CONSOLIDATED STATEMENTS
p / 99 INDEPENDENT AUDITOR’S REPORT
p / 70 NOTES TO THE FINANCIAL STATEMENTS
p / 97 NOTES TO THE COMPANY FINANCIAL STATEMENTS
/ 65Annual Report and Accounts 2018
p / 107 FINANCIAL CALENDAR
p / 95 PARENT COMPANY STATEMENTS
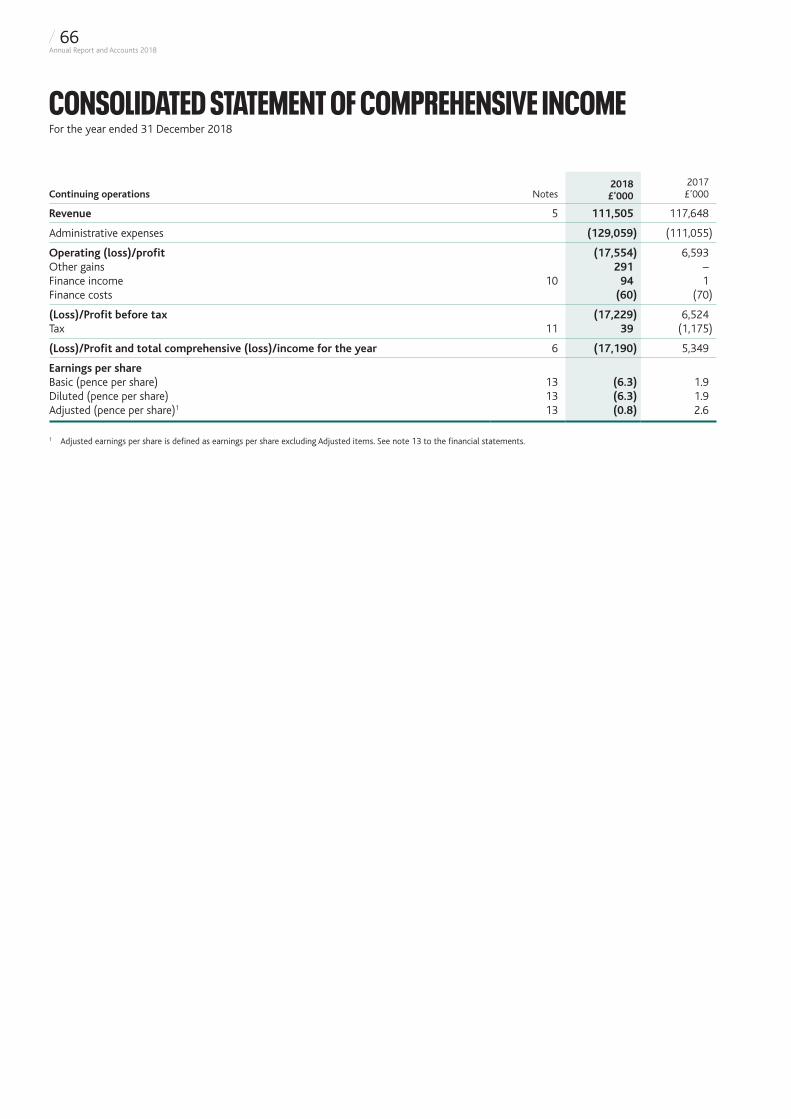
Continuing operations Notes2018 £’000
2017 £’000
Revenue 5 111,505 117,648
Administrative expenses (129,059) (111,055)
Operating (loss)/profit (17,554) 6,593Other gains 291 –Finance income 10 94 1Finance costs (60) (70)
(Loss)/Profit before tax (17,229) 6,524Tax 11 39 (1,175)
(Loss)/Profit and total comprehensive (loss)/income for the year 6 (17,190) 5,349
Earnings per shareBasic (pence per share) 13 (6.3) 1.9Diluted (pence per share) 13 (6.3) 1.9Adjusted (pence per share)1 13 (0.8) 2.6
1 Adjusted earnings per share is defined as earnings per share excluding Adjusted items. See note 13 to the financial statements.
CONSOLIDATED STATEMENT OF COMPREHENSIVE INCOMEFor the year ended 31 December 2018
/ 66Annual Report and Accounts 2018
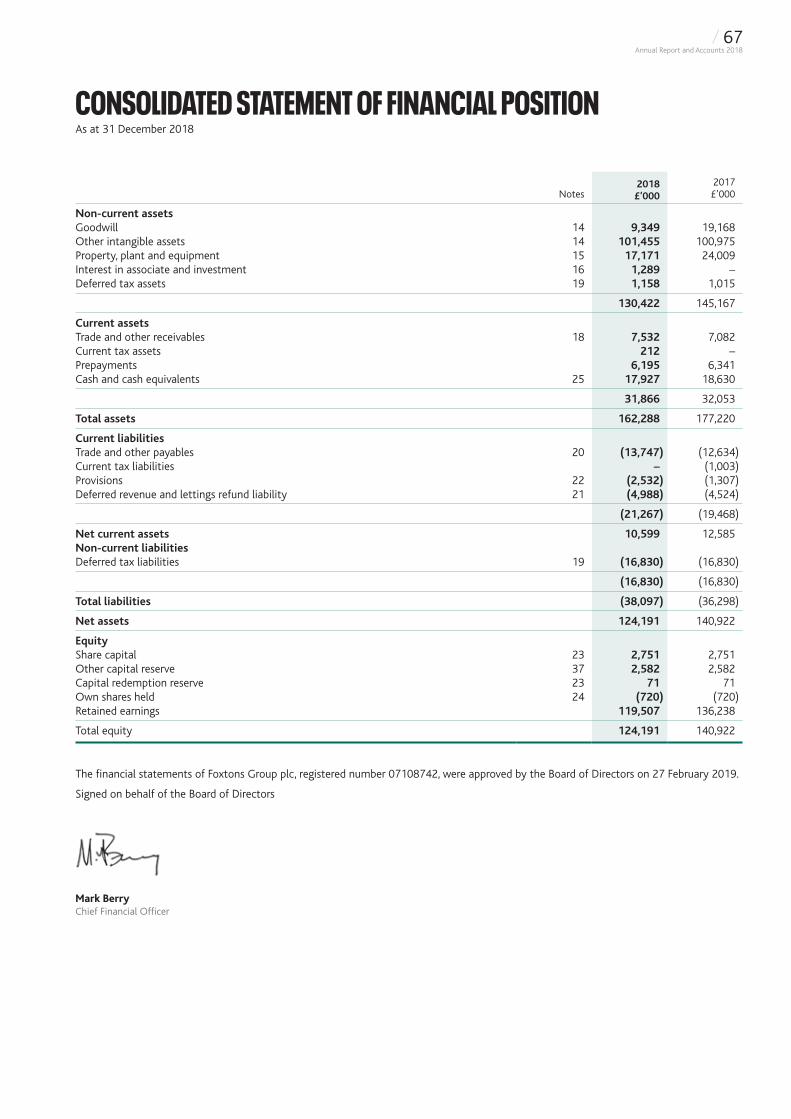
Notes2018 £’000
2017 £’000
Non-current assetsGoodwill 14 9,349 19,168Other intangible assets 14 101,455 100,975Property, plant and equipment 15 17,171 24,009Interest in associate and investment 16 1,289 –Deferred tax assets 19 1,158 1,015
130,422 145,167
Current assetsTrade and other receivables 18 7,532 7,082Current tax assets 212 –Prepayments 6,195 6,341Cash and cash equivalents 25 17,927 18,630
31,866 32,053
Total assets 162,288 177,220
Current liabilitiesTrade and other payables 20 (13,747) (12,634)Current tax liabilities – (1,003)Provisions 22 (2,532) (1,307)Deferred revenue and lettings refund liability 21 (4,988) (4,524)
(21,267) (19,468)
Net current assets 10,599 12,585Non-current liabilitiesDeferred tax liabilities 19 (16,830) (16,830)
(16,830) (16,830)
Total liabilities (38,097) (36,298)
Net assets 124,191 140,922
EquityShare capital 23 2,751 2,751Other capital reserve 37 2,582 2,582Capital redemption reserve 23 71 71Own shares held 24 (720) (720)Retained earnings 119,507 136,238
Total equity 124,191 140,922
The financial statements of Foxtons Group plc, registered number 07108742, were approved by the Board of Directors on 27 February 2019.
Signed on behalf of the Board of Directors
Mark BerryChief Financial Officer
CONSOLIDATED STATEMENT OF FINANCIAL POSITIONAs at 31 December 2018
/ 67Annual Report and Accounts 2018
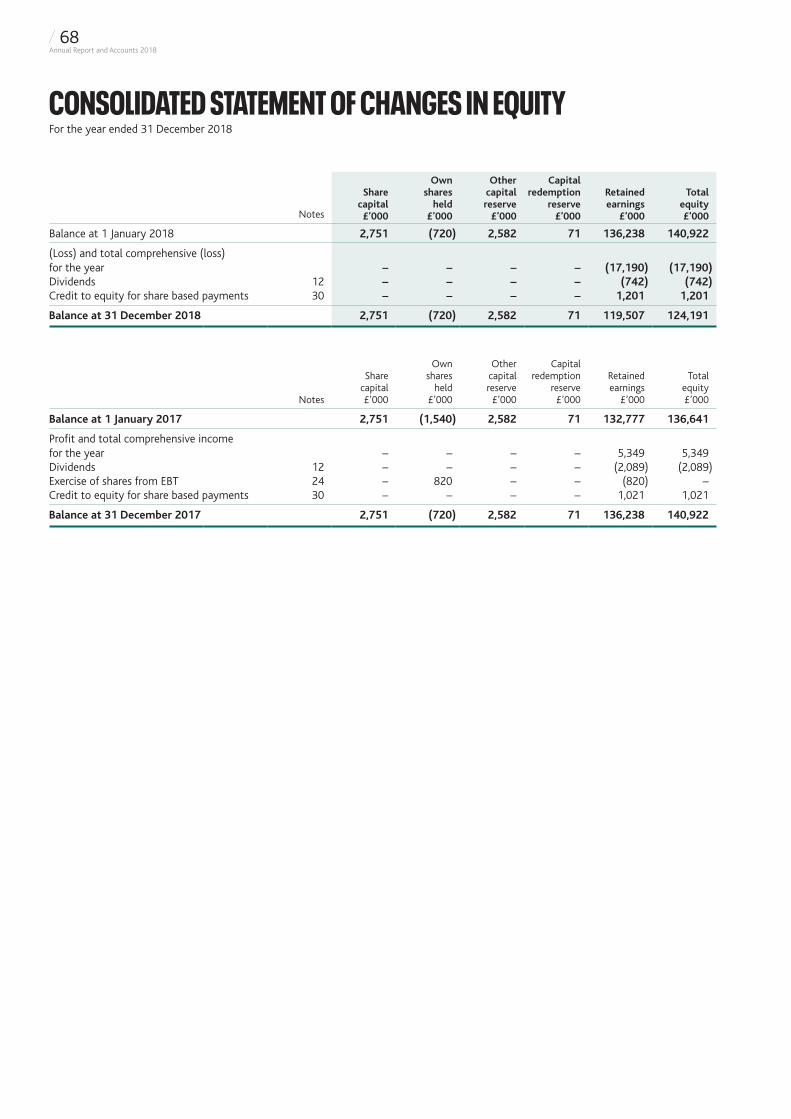
Notes
Share capital £’000
Own shares
held £’000
Other capital reserve
£’000
Capital redemption
reserve £’000
Retained earnings
£’000
Total equity £’000
Balance at 1 January 2018 2,751 (720) 2,582 71 136,238 140,922
(Loss) and total comprehensive (loss) for the year – – – – (17,190) (17,190)Dividends 12 – – – – (742) (742)Credit to equity for share based payments 30 – – – – 1,201 1,201
Balance at 31 December 2018 2,751 (720) 2,582 71 119,507 124,191
Notes
Share capital £’000
Own shares
held £’000
Other capital reserve
£’000
Capital redemption
reserve £’000
Retained earnings
£’000
Total equity £’000
Balance at 1 January 2017 2,751 (1,540) 2,582 71 132,777 136,641
Profit and total comprehensive income for the year – – – – 5,349 5,349Dividends 12 – – – – (2,089) (2,089)Exercise of shares from EBT 24 – 820 – – (820) –Credit to equity for share based payments 30 – – – – 1,021 1,021
Balance at 31 December 2017 2,751 (720) 2,582 71 136,238 140,922
CONSOLIDATED STATEMENT OF CHANGES IN EQUITYFor the year ended 31 December 2018
/ 68Annual Report and Accounts 2018
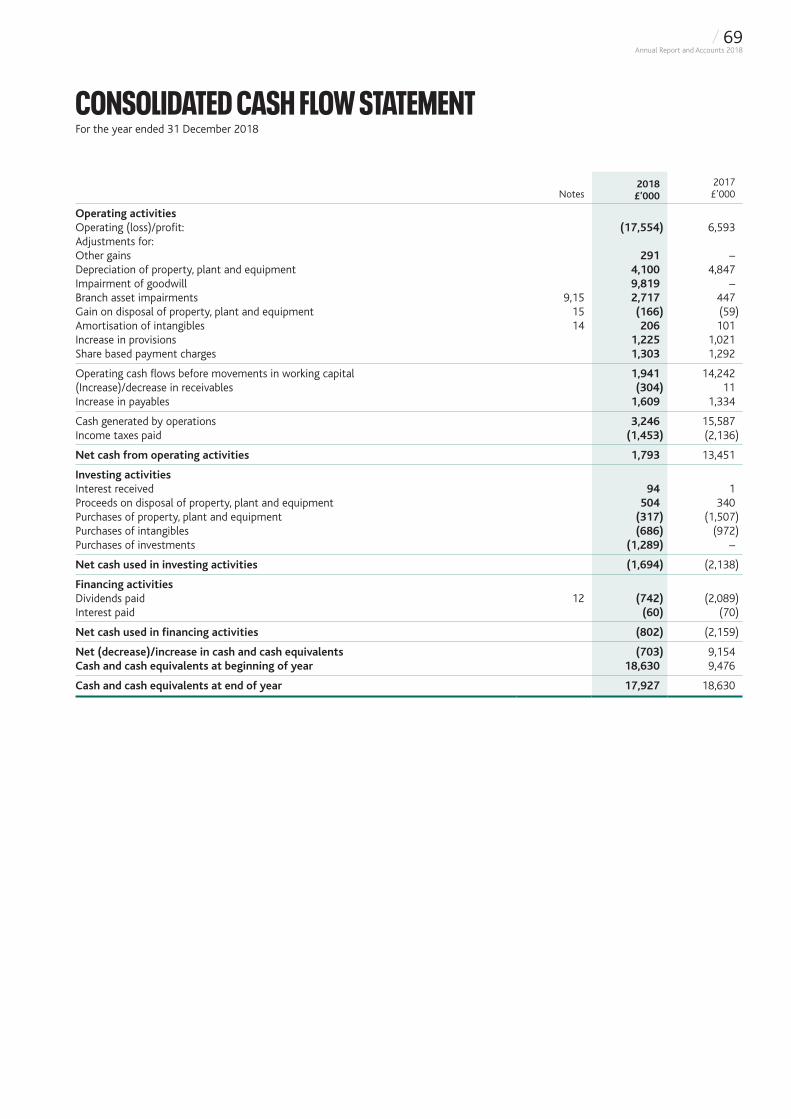
Notes2018 £’000
2017 £’000
Operating activitiesOperating (loss)/profit: (17,554) 6,593Adjustments for:Other gains 291 –Depreciation of property, plant and equipment 4,100 4,847Impairment of goodwill 9,819 –Branch asset impairments 9,15 2,717 447Gain on disposal of property, plant and equipment 15 (166) (59)Amortisation of intangibles 14 206 101Increase in provisions 1,225 1,021Share based payment charges 1,303 1,292
Operating cash flows before movements in working capital 1,941 14,242(Increase)/decrease in receivables (304) 11Increase in payables 1,609 1,334
Cash generated by operations 3,246 15,587Income taxes paid (1,453) (2,136)
Net cash from operating activities 1,793 13,451
Investing activitiesInterest received 94 1Proceeds on disposal of property, plant and equipment 504 340Purchases of property, plant and equipment (317) (1,507)Purchases of intangibles (686) (972)Purchases of investments (1,289) –
Net cash used in investing activities (1,694) (2,138)
Financing activitiesDividends paid 12 (742) (2,089)Interest paid (60) (70)
Net cash used in financing activities (802) (2,159)
Net (decrease)/increase in cash and cash equivalents (703) 9,154Cash and cash equivalents at beginning of year 18,630 9,476
Cash and cash equivalents at end of year 17,927 18,630
CONSOLIDATED CASH FLOW STATEMENTFor the year ended 31 December 2018
/ 69Annual Report and Accounts 2018
1. GENERAL INFORMATION
Foxtons Group plc (the “Company”) is a company incorporated in the United Kingdom under the Companies Act. The address of the Company’s registered office is Building One, Chiswick Park, 566 Chiswick High Road, London W4 5BE. The principal activity of the Company and its subsidiaries (collectively, the “Group”) is the provision of services to the residential property market in the UK.
These financial statements are presented in pounds sterling which is the currency of the primary economic environment in which the Group operates.
2. ADOPTION OF NEW AND REVISED STANDARDS
The Group has adopted the following Standards and Interpretations during the current year, which had no significant effect on the Group’s results:
IFRS 9 Financial instruments
IFRS 15 Revenue from Contracts with Customers
Annual Improvements to IFRSs (2014 – 2016) Cycle
At the date of authorisation of these financial statements, the following Standard and Interpretations which have not been applied in these financial statements were in issue but not yet effective:
IFRS 16 Leases
Annual Improvements to IFRSs (2015 – 2017) Cycle
The Directors of the Company (the “Directors”) have assessed the provisions of the above standards and concluded that the adoption of these standards will not have a material impact on the financial statements of the Group in future periods, with the exception of:
• IFRS 16 was issued in January 2016, endorsed by the EU in 2017 and is effective from 01 January 2019 – it will result in a material increase to both the assets and liabilities of the Group and will also impact the timing of recognition of operating costs, as more fully detailed below. IFRS 16 introduces a single on-balance sheet lease accounting model for lessees. A lessee recognises a right-of-use asset representing its right to use the underlying asset and a corresponding lease liability representing its obligation to make lease payments. There are optional exemptions for short term leases and leases of low value items. IFRS16 replaces existing leases guidance including IAS17 Leases, IFRIC 4 Determining whether an arrangement contains a lease, SIC-15 Operating lease incentives and SIC-27 Evaluating the substance of transactions involving the legal form.
The Group has completed a detailed assessment to quantify the impact on its reported assets and liabilities on adoption to IFRS 16. The Group will transition using the modified retrospective approach with no restatement of prior year comparatives. On 01 January 2019 the Group expects to recognise new right of use assets of approximately £62.0 million and lease liabilities of approximately £62.5 million with respect to its offices and company cars using an average discount rate of 4.25%, along with a £0.3 million opening adjustment to the statement of changes in equity. Short term leases and low value items have been excluded from these calculations.
The nature of expenses related to these leases will also change as the straight line operating lease expense will be replaced with a depreciation charge for the right-of-use assets and interest expense on lease liabilities. In the first year of adoption these are expected to be approximately £9.8 million and £2.4 million respectively against lease payments of approximately £11.1 million, thereby reducing profit before tax by £1.2 million.
Under IFRS 16, right-of-use assets will be tested for impairment in accordance with IAS 36 Impairment of Assets. This will replace the previous requirement to recognise a provision for onerous lease contracts.
The Group writes off a financial asset when there is information indicating that the debtor is in severe financial difficulty and there is no realistic prospect of recovery, for example when the debtor has entered into bankruptcy proceedings. Financial assets written off may still be subject to enforcement activity under the Group’s legal recovery procedures, taking into account legal advice where appropriate. Any recoveries made are recognised in profit or loss.
3. SIGNIFICANT ACCOUNTING POLICIES
Compliance with International Financial Reporting Standards
The financial statements have been prepared in accordance with International Financial Reporting Standards (IFRS) as adopted by the European Union (EU) and therefore the Group financial statements comply with Article 4 of the EU IAS Regulation. IFRS includes the standards and interpretations approved by the International Accounting Standards Board (IASB) including International Accounting Standards (IAS) and interpretations issued by the International Financial Reporting Interpretations Committee (IFRIC).
The accounting policies set out below have been applied in preparing the financial statements for the years ended 31 December 2017 and 2018, with the exception of note 2.
Basis of preparation
These financial statements have been prepared on the historical cost basis as modified by items held at fair value through Other Comprehensive Income (OCI). Historical cost is generally based on the fair value of the consideration given in exchange for the assets.
NOTES TO THE FINANCIAL STATEMENTS
/ 70Annual Report and Accounts 2018
3. SIGNIFICANT ACCOUNTING POLICIES (continued)
Basis of consolidation
The financial statements incorporate the financial statements of the Company and entities controlled by the Company (its subsidiaries) made up to 31 December each year. Control is achieved where the Company has the power over the investee; is exposed, or has rights, to variable return from its involvement with the investee; and has the ability to use its power to affect its returns.
An associate is an entity over which the Group has significant influence. Significant influence is the power to participate in the financial and operating policy decisions of the investee, but is not control or joint control over those policies. Under the equity method, the investment in an associate is initially recognised at cost. The carrying amount of the investment is adjusted to recognise changes in the Group’s share of net assets of the associate since the acquisition date.
All intra-group transactions, balances, income and expenses are eliminated on consolidation.
Going concern
After making enquiries, the Directors have a reasonable expectation that the Group has adequate resources to continue in operational existence for the foreseeable future, having considered the Group forecasts and projections, taking account of reasonably possible changes in trading performance and the current economic uncertainty. Accordingly, they have adopted the going concern basis in preparing the financial statements. Further detail is contained in the Directors’ Report on page 62.
Goodwill
Goodwill arising in a business combination is recognised as an asset at the date that control is acquired (the acquisition date). Goodwill is measured as the excess of the sum of the consideration transferred, the amount of any non-controlling interest in the acquiree and the fair value of the acquirer’s previously held equity interest (if any) in the entity over the net of the acquisition-date fair value of the identifiable assets acquired and the liabilities assumed.
Goodwill is not amortised but is reviewed for impairment at least annually. For the purpose of impairment testing, goodwill is allocated to each of the Group’s cash-generating units (CGUs) expected to benefit from the synergies of the combination. CGUs to which goodwill has been allocated are tested for impairment annually, or more frequently when there is an indication that the unit may be impaired. If the recoverable amount of the CGU is less than the carrying amount of the unit, the impairment loss is allocated first to reduce the carrying amount of any goodwill allocated to the unit and then to the other assets of the unit pro-rata on the basis of the carrying amount of each asset in the unit. An impairment loss recognised for goodwill is not reversed in a subsequent period.
During the year, the goodwill in respect of the sales business was impaired. Further details can be found in note 14.
Other intangible assets
Intangible assets other than goodwill that are acquired by the Group, representing the acquired Foxtons brand name, software and purchased contracts, are stated at cost less accumulated impairment losses. The brand name is considered to have an indefinite economic life because of the institutional nature of the brand name, its proven ability to maintain market leadership and profitable operations over long periods of time, and the Group’s commitment to develop and enhance its value. The carrying value of the brand is subject to an annual impairment review, and adjusted to its recoverable amount if required. Purchased contracts and software are amortised on a straight line basis over their estimated useful economic lives of five years. Amortisation is included within administrative expenses in the consolidated statement of comprehensive income.
Revenue recognition
Revenue is measured at the fair value of the consideration received or receivable and represents amounts receivable for services provided in the normal course of business, when performance obligations are met net of discounts (if any) and VAT. Revenue is generated from the Group’s operations which are wholly based in the UK.
Rendering of services
Commission earned on sales of residential property is recognised on exchange of contract.
In connection with lettings, the Group offers the following services:
(1) Securing the letting for the landlord including rent collection; and
(2) Managing the letting on behalf of the landlord.
Commissions earned on the above services are recognised as follows:
(1) Commissions on securing the letting are recognised immediately subject to the following:
(a) a percentage of contracts have break clauses and may require a refund if the tenant breaks early for which the Group recognise an estimated lettings refund liability (see note 21) based upon the historical experience of commission repayments over the last 12 months; and
(b) a deferral of revenue in recognition that the Group is contracted to provide a rent collection service for the estimated duration of the outstanding tenancies and the related revenue associated with the service is recognised on a straight-line basis over that period.
(2) The management fee is billed and recognised monthly at a fixed percentage of the monthly rental.
/ 71Annual Report and Accounts 2018
Notes to the Financial Statements continued
3. SIGNIFICANT ACCOUNTING POLICIES (continued)
Commission earned on financial services is recognised when insurance policies go on risk and when mortgage contracts complete. Income from other services is recognised in the period or periods when the services are provided. Commission is recognised at fair value which takes account of expected future cancellations.
Interest income
The Group deposits its cash with reputable financial institutions. Interest income is recognised when it is probable that the economic benefits will flow to the Group and the amount of revenue can be measured reliably. Interest income is accrued on a time basis, by reference to the principal outstanding and at the effective interest rate applicable. The Group earns interest income on own funds which is shown as finance income. It also earns interest on client funds which is included within Lettings revenue. See note 29.
Operating leases
Rentals payable under operating leases are charged to income on a straight-line basis over the term of the relevant lease. In the event that lease incentives are received to enter into operating leases, such incentives are recognised as a liability. The aggregate benefit of incentives is recognised as a reduction of rental expense on a straight-line basis.
Adjusted items
Adjusted items include costs or revenues which due to their size, incidence and departure from the Company’s strategy require disclosure in the financial statements to give a true representation of the underlying performance of the Group and allow comparability of performance from one period to another. Items include restructuring and impairment charges together with any particular significant one-off items.
Taxation
The tax expense represents the sum of the tax currently payable and deferred tax.
Current tax
The tax currently payable is based on taxable profit for the period. Taxable profit differs from net profit as reported in the income statement because it excludes items of income or expense that are taxable or deductible in other periods and it further excludes items that are never taxable or deductible. The Group’s current tax liability is calculated at the statutory rate for the period which in the year ended 31 December 2018 is a rate of 19% (2017: 19.25%).
Deferred tax
Deferred tax is the tax expected to be payable or recoverable on differences between the carrying amounts of assets and liabilities in the financial statements and the corresponding tax bases used in the computation of taxable profit, and is accounted for using the balance sheet liability method. Deferred tax liabilities are generally recognised for all taxable temporary differences and deferred tax assets are recognised to the extent that it is probable that taxable profits will be available against which deductible temporary differences can be utilised.
Such assets and liabilities are not recognised if the temporary difference arises from the initial recognition of goodwill or from the initial recognition (other than in a business combination) of other assets and liabilities in a transaction that affects neither the taxable profit nor the accounting profit.
Deferred tax liabilities are recognised for taxable temporary differences arising on investments except where the Group is able to control the reversal of the temporary difference and it is probable that the temporary difference will not reverse in the foreseeable future.
The carrying amount of deferred tax assets is reviewed at each balance sheet date and amended to the extent that it is probable that sufficient taxable profits will be available to allow all or part of the asset to be recovered.
Deferred tax is calculated at the tax rates that are expected to apply in the period when the liability is settled or the asset is realised based on tax laws and rates that have been enacted or substantively enacted at the balance sheet date. Deferred tax is charged or credited in the income statement, except when it relates to items charged or credited in other comprehensive income, in which case the deferred tax is also dealt with in other comprehensive income.
Deferred tax assets and liabilities are offset when there is a legally enforceable right to set off current tax assets against current tax liabilities and when they relate to income taxes levied by the same taxation authority and the Group intends to settle its current tax assets and liabilities on a net basis.
Property, plant and equipment
Property, plant and equipment are stated at cost less accumulated depreciation and any recognised impairment loss.
Depreciation is recognised so as to write off the cost of assets (other than land and assets under construction) less their residual values over their useful lives, using the straight-line method, on the following bases:
Leasehold improvements Over the term of the lease (lease terms remaining 0-13 years)
Fixtures, fittings and equipment Between 20% and 25% straight-line
Motor vehicles 25% straight-line
/ 72Annual Report and Accounts 2018
3. SIGNIFICANT ACCOUNTING POLICIES (continued)
The estimated useful lives, residual values and depreciation method are reviewed at the end of each reporting period, with the effect of any changes in estimate accounted for on a prospective basis.
The gain or loss arising on the disposal or scrappage of an asset is determined as the difference between the sales proceeds and the carrying amount of the asset and is recognised in the consolidated statement of comprehensive income.
Capitalisation of expenditure on branches totalled £108k (2017: £1,533k) and is reflected in leasehold improvements £103k (2017: £1,411k) and fixtures, fittings and equipment £5k (2017: £122k). For new branches, depreciation is charged on assets once the office set up is complete.
Impairment of tangible and intangible assets excluding goodwill
At each balance sheet date, the Group reviews the carrying amounts of its tangible and intangible assets to determine whether there is any indication that those assets have suffered an impairment loss. If any such indication exists, the recoverable amount of the asset is estimated to determine the extent of the impairment loss (if any). An intangible asset with an indefinite useful life is tested for impairment at least annually and whenever there is an indication that the asset may be impaired.
Recoverable amount is the higher of fair value less costs to sell and value in use. In assessing value in use, the estimated future cash flows are discounted to their present value using a pre-tax discount rate that reflects current market assessments of the time value of money and the risks specific to the asset for which the estimates of future cash flows have not been adjusted.
If the recoverable amount of an asset (or cash-generating unit) is estimated to be less than its carrying amount, the carrying amount of the asset (or cash-generating unit) is reduced to its recoverable amount. An impairment loss is recognised immediately in the consolidated statement of comprehensive income.
Financial instruments
Financial assets and financial liabilities are recognised in the Group’s consolidated statement of financial position when the Group becomes party to the contractual provisions of the instrument.
Financial assets
The financial assets held by the Group are classified, at initial recognition, and subsequently measured at amortised cost or fair value through other comprehensive income (OCI). All financial assets are recognised and derecognised on a trade date where the purchase or sale of the financial asset is under a contract whose terms require delivery of the financial asset within the timeframe established by the market concerned.
The classification of financial assets at initial recognition depends on the financial asset’s contractual cash flow characteristics and the Group’s business model for managing them. With the exception of trade receivables that do not contain a significant financing component, the Group initially measures a financial asset at its fair value plus transaction costs.
For purposes of subsequent measurement, the financial assets held by the Group are classified in two categories:
• Financial assets at amortised cost (debt instruments)
• Financial assets designated at fair value through OCI with no recycling of cumulative gains and losses upon derecognition (equity instruments)
All financial assets, other than cash and cash equivalents and investments classified as fair value through OCI, are classified as loans and receivables.
Loans and receivables
Trade receivables, loans, and other receivables that have fixed or determinable payments that are not quoted in an active market are classified as ‘loans and receivables’. Loans and receivables are measured at amortised cost using the effective interest (EIR) method, except for short-term receivables when the recognition of interest would be immaterial, and are subject to impairment.
Impairment of financial assets
The Group recognises a loss allowance for expected credit losses (ECLs) for all debt instruments not held at fair value through profit or loss. The amount of ECL is updated at each reporting date to reflect changes in credit risk since initial recognition of the respective financial instrument. ECLs are based on the difference between the contractual cash flows due in accordance with the contract and all the cash flows that the Group expects to receive, discounted at an approximation of the original effective interest rate.
ECLs are recognised in two stages. For credit exposures for which there has not been a significant increase in credit risk since initial recognition, ECLs are provided for credit losses that result from default events that are possible within the next 12-months (a 12-month ECL). For those credit exposures for which there has been a significant increase in credit risk since initial recognition, a loss allowance is required for credit losses expected over the remaining life of the exposure, irrespective of the timing of the default (a lifetime ECL). Changes in the ECL loss allowance are recognised in the consolidated statement of comprehensive income.
For trade receivables and contract assets, the Group applies a simplified approach in calculating ECLs. Therefore, the Group does not track changes in credit risk, but instead recognises a loss allowance based on lifetime ECLs at each reporting date. The Group has established an ECL model that is based on its historical credit loss experience, adjusted for forward-looking market factors specific to the debtors and the economic environment.
/ 73Annual Report and Accounts 2018
Notes to the Financial Statements continued
3. SIGNIFICANT ACCOUNTING POLICIES (continued)
Significant increase in credit risk
In assessing whether the credit risk on a financial instrument has increased significantly since initial recognition, the Group compares the risk of default occurring on the financial instrument at the reporting date with the risk of default occurring on the financial instrument at the date of initial recognition. In making this assessment, the Group considers both quantitative and qualitative information that is reasonable and supportable, including historical experience and forward-looking information that is available without undue cost or effort such as changes in external or internal credit ratings, deterioration of external market indicators, existing or forecast adverse changes in business, financial or economic conditions, actual or expected deterioration in the operating results of the debtor.
Derecognition of financial assets
A financial asset (or, where applicable, a part of a financial asset or part of a group of similar financial assets) is primarily derecognised when:
• the rights to receive cash flows from the asset have expired; or
• the Group has transferred its rights to receive cash flows from the asset or has assumed an obligation to pay the received cash flows in full without material delay to a third party under a ‘pass-through’ arrangement; and either (a) the Group has transferred substantially all the risks and rewards of the asset, or (b) the Group has neither transferred nor retained substantially all the risks and rewards of the asset, but has transferred control of the asset.
When the Group has transferred its rights to receive cash flows from an asset or has entered into a pass-through arrangement, it evaluates if, and to what extent, it has retained the risks and rewards of ownership. When it has neither transferred nor retained substantially all of the risks and rewards of the asset, nor transferred control of the asset, the Group continues to recognise the transferred asset to the extent of its continuing involvement.
Financial liabilities and equity
Debt and equity instruments are classified as either financial liabilities or as equity in accordance with the substance of the contractual arrangement.
Equity instruments
An equity instrument is any contract that evidences a residual interest in the assets of an entity after deducting all of its liabilities. Equity instruments issued by the Group are recognised at the proceeds received, net of direct issue costs.
Investments in unlisted shares
The Group holds investments in unlisted shares that are not traded in an active market. On initial recognition, the Group may make an irrevocable election to designate investments in equity instruments as fair value through OCI (unless held for trading). The classification is determined on an instrument-by-instrument basis. Gains and losses on these financial assets are never recycled to profit or loss.
Dividends on these investments are recognised as other income in the statement of profit or loss when the right of payment has been established, except when the Group benefits from such proceeds as a recovery of part of the cost of the financial asset, in which case, such gains are recorded in OCI. Equity instruments designated at fair value through OCI are not subject to impairment assessment.
The Group elected to designate its non-listed equity investments as fair value through OCI.
Other financial liabilities
Other financial liabilities are initially measured at fair value, net of transaction costs.
Other financial liabilities are subsequently measured at amortised cost using the effective interest method, with interest expense recognised on an effective yield basis.
Effective interest method
The effective interest method is used in calculating the amortised cost of a financial liability and of allocating interest expense over the relevant period. The effective interest rate is the rate that exactly discounts estimated future cash payments through the expected life of the financial liability, or, where appropriate, a shorter period, to the net carrying amount on initial recognition.
Derecognition of financial liabilities
The Group derecognises financial liabilities when, and only when, the Group’s obligations are discharged, cancelled or they expire.
/ 74Annual Report and Accounts 2018
3. SIGNIFICANT ACCOUNTING POLICIES (continued)
Provisions
Provisions are recognised when the Group has a present obligation (legal or constructive) as a result of a past event, it is probable that the Group will be required to settle that obligation and a reliable estimate can be made of the amount of the obligation.
The amount recognised as a provision is the best estimate of the consideration required to settle the present obligation at the balance sheet date, taking into account the risks and uncertainties surrounding the obligation. Where a provision is measured using the cash flows estimated to settle the present obligation, its carrying amount is the present value of those cash flows.
When some or all of the economic benefits required to settle a provision are expected to be recovered from a third party, a receivable is recognised as an asset if it is virtually certain that reimbursement will be received and the amount of the receivable can be measured reliably.
A provision for restructuring is recognised when management has a formal plan for the restructuring that identifies that portion of the business and principal locations that will be affected in detail and timing, and has raised an expectation among those affected that it will proceed with the restructuring
Valuation of share options
Equity-settled share-based payments to employees are measured at the fair value of the equity instruments at the grant date. The fair value excludes the effect of non-market-based vesting conditions. Details regarding the determination of the fair value of equity-settled share-based transactions are set out in note 30.
The fair value determined at the grant date of the equity-settled share-based payments is expensed on a straight-line basis over the vesting period, based on the Group’s estimate of equity instruments that will eventually vest. At each balance sheet date, the Group revises its estimate of the number of equity instruments expected to vest as a result of the effect of non-market-based vesting conditions. The impact of the revision of the original estimates, if any, is recognised in profit or loss such that the cumulative expense reflects the revised estimate, with a corresponding adjustment to equity reserves.
4. CRITICAL ACCOUNTING JUDGEMENTS AND KEY SOURCES OF ESTIMATION UNCERTAINTY
In the application of the Group’s accounting policies, which are described in note 3, the Directors are required to make judgements, estimates and assumptions about the carrying amounts of assets and liabilities that are not readily apparent from other sources. The estimates and associated assumptions are based on historical experience and other factors that are considered to be relevant. Actual results may differ from these estimates.
Critical judgements in applying the Group’s accounting policies
The estimates and underlying assumptions are reviewed on an ongoing basis. Revisions to accounting estimates are recognised in the period in which the estimate is revised if the revision affects only that period, or in the period of the revision and future periods if the revision affects both current and future periods.
The following are the critical judgements, apart from those involving estimations (which are dealt with separately below), that the Directors have made in the process of applying the Group’s accounting policies and that have the most significant effect on the amounts recognised in the financial statements.
Useful economic life of the brand
The Company completed the acquisition of 100% of the equity of Foxtons Intermediate Holdings on 30 March 2010. The Directors identified one material intangible asset: the Foxtons brand, which was deemed to have an indefinite life as there is no foreseeable limit to the period over which the asset is expected to generate cash inflows.
Client funds
Client monies and the associated liabilities are not shown on the consolidated balance sheet because the Company treats the monies as belonging to clients and not as its own funds, (note 29 refers). Client monies are held by the Company in specifically designated client accounts and, on that basis, the Company expects that, in the event of the Company becoming insolvent, such monies would be ring-fenced and not be available to the Company’s creditors as a whole. They are not available for offset against any other account held with the bank. Treatment of client monies are subject to Association of Residential Lettings Agency Rules.
/ 75Annual Report and Accounts 2018
Notes to the Financial Statements continued
4. CRITICAL ACCOUNTING JUDGEMENTS AND KEY SOURCES OF ESTIMATION UNCERTAINTY (continued)
Key sources of estimation uncertainty
The key assumptions concerning the future, and other key sources of estimation uncertainty at the balance sheet date, that have a significant risk of causing a material adjustment to the carrying amounts of assets and liabilities within the next financial period, are discussed below.
Revenue recognition – Estimate of lettings refund liability
For those contracts with break clauses, there is judgement involved in determining the appropriate refund liability to be recognized in relation to the potentially refundable portion of the commission. Since the Group uses standard terms for its letting contracts, and its lettings business is focused in one geographical area (London), management considers its lettings portfolio to be a homogenous population and estimates the amount of the commission that will be refunded based upon historical data for all lettings contracts, which is considered reliable evidence supporting this estimate. The Group maintains robust data which demonstrates that patterns of rental behaviour do not change significantly period by period, and thus the Group believes that historical data is a relatively accurate proxy for future trends and circumstances. Should future patterns of rental behaviour be demonstrably different from that predicted by historic data, such as an increase or decrease of c. 30% in actual refunds from break clause invocation versus our estimates, this could increase or decrease the refund lettings liability provision (which is disclosed in note 21) by c. £1 million.
Impairment of goodwill and intangible assets
Determining whether goodwill and intangible assets are impaired requires an estimation of the value in use of the CGUs to which goodwill has been allocated, and the group of CGUs to which intangible assets (i.e. the Foxtons brand) have been allocated. The value in use calculation requires the entity to estimate the future cash flows expected to arise from the CGU and a suitable discount rate in order to calculate present value. The carrying amount of goodwill and intangible assets at the balance sheet date was £110.8 million. During the current year, the sales CGU was impaired by £9.8 million. Given the prolonged nature of the current downturn in the sales market, the key source of estimation uncertainty is in relation to the lettings growth plan, sensitivity analysis in note 14.
5. BUSINESS AND GEOGRAPHICAL SEGMENTS
Products and services from which reportable segments derive their revenues
Management has determined the operating segments based on the monthly management pack reviewed by the Directors, which is used to assess both the performance of the business and to allocate resources within the entity. Management has identified that the Directors are the chief operating decision-makers in accordance with the requirements of IFRS 8 ‘Operating segments’.
The operating and reportable segments of the Group are (i) Sales, (ii) Lettings and (iii) Mortgage Broking.
The Sales segment generates commission on sales of residential property. The Lettings segment earns fees from the letting and management of residential properties and income from interest earned on tenants’ deposits. As these two segments operate out of the same premises and share support services, a significant proportion of costs have to be apportioned between the segments. The basis of apportionment used is headcount in each segment.
The Mortgage Broking segment receives commission from the arrangement of mortgages and related products under contracts with financial service providers and receives administration fees from clients.
The accounting policies of the operating segments are the same as the Group’s accounting policies described in note 3. Adjusted EBITDA represents the profit before tax for the period earned by each segment before allocation of finance costs, finance income, other gains, depreciation, amortisation, profit on disposal of fixed assets, share based payments and Adjusted items. This is the measure reported to the Directors for the purpose of resource allocation and assessment of segment performance.
Adjusted items include costs or revenues which due to their size, incidence and departure from the Group’s strategy require disclosure in the financial statements to give a true representation of the underlying performance of the Group and allow comparability of performance from one period to another.
All revenue for the Group is generated from within the UK and there is no intra-group revenue.
/ 76Annual Report and Accounts 2018
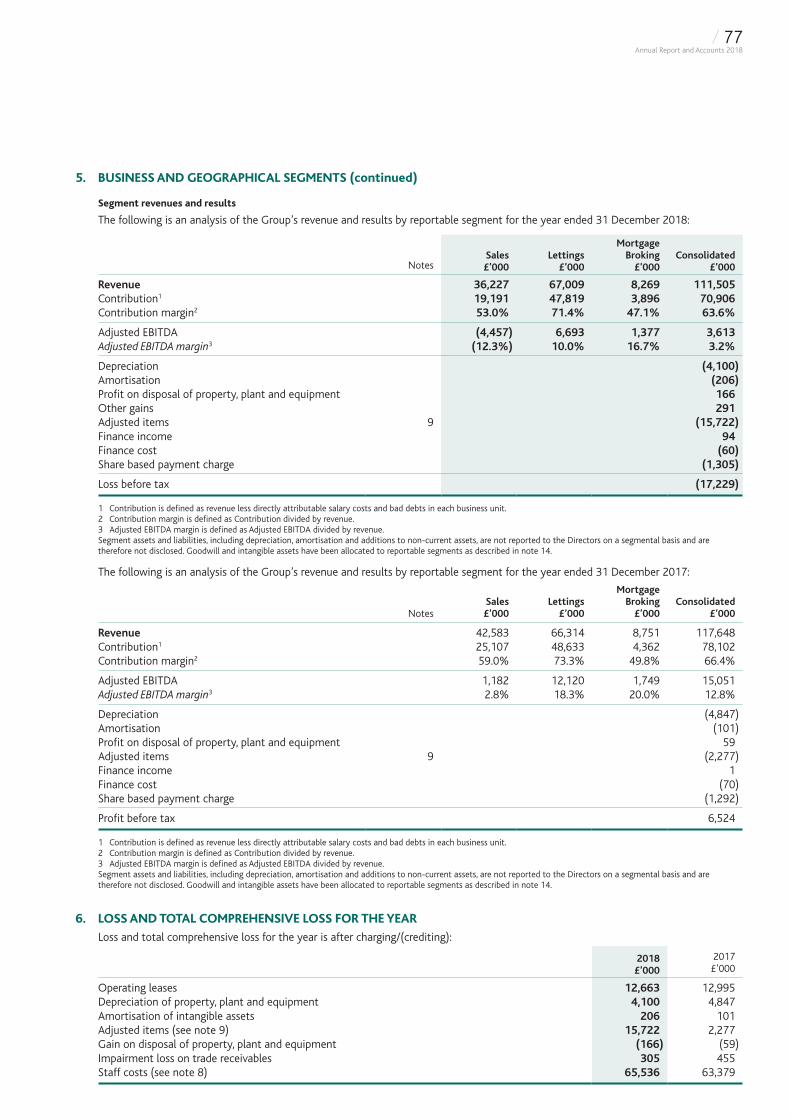
5. BUSINESS AND GEOGRAPHICAL SEGMENTS (continued)
Segment revenues and results
The following is an analysis of the Group’s revenue and results by reportable segment for the year ended 31 December 2018:
NotesSales £’000
Lettings £’000
Mortgage Broking
£’000Consolidated
£’000
Revenue 36,227 67,009 8,269 111,505Contribution1 19,191 47,819 3,896 70,906Contribution margin2 53.0% 71.4% 47.1% 63.6%
Adjusted EBITDA (4,457) 6,693 1,377 3,613Adjusted EBITDA margin3 (12.3%) 10.0% 16.7% 3.2%
Depreciation (4,100)Amortisation (206)Profit on disposal of property, plant and equipment 166Other gains 291Adjusted items 9 (15,722)Finance income 94Finance cost (60)Share based payment charge (1,305)
Loss before tax (17,229)
1 Contribution is defined as revenue less directly attributable salary costs and bad debts in each business unit.2 Contribution margin is defined as Contribution divided by revenue.3 Adjusted EBITDA margin is defined as Adjusted EBITDA divided by revenue.Segment assets and liabilities, including depreciation, amortisation and additions to non-current assets, are not reported to the Directors on a segmental basis and are therefore not disclosed. Goodwill and intangible assets have been allocated to reportable segments as described in note 14.
The following is an analysis of the Group’s revenue and results by reportable segment for the year ended 31 December 2017:
NotesSales £’000
Lettings £’000
Mortgage Broking
£’000Consolidated
£’000
Revenue 42,583 66,314 8,751 117,648Contribution1 25,107 48,633 4,362 78,102Contribution margin2 59.0% 73.3% 49.8% 66.4%
Adjusted EBITDA 1,182 12,120 1,749 15,051Adjusted EBITDA margin3 2.8% 18.3% 20.0% 12.8%
Depreciation (4,847)Amortisation (101)Profit on disposal of property, plant and equipment 59Adjusted items 9 (2,277)Finance income 1Finance cost (70)Share based payment charge (1,292)
Profit before tax 6,524
1 Contribution is defined as revenue less directly attributable salary costs and bad debts in each business unit.2 Contribution margin is defined as Contribution divided by revenue.3 Adjusted EBITDA margin is defined as Adjusted EBITDA divided by revenue.Segment assets and liabilities, including depreciation, amortisation and additions to non-current assets, are not reported to the Directors on a segmental basis and are therefore not disclosed. Goodwill and intangible assets have been allocated to reportable segments as described in note 14.
6. LOSS AND TOTAL COMPREHENSIVE LOSS FOR THE YEAR
Loss and total comprehensive loss for the year is after charging/(crediting):
2018 £’000
2017 £’000
Operating leases 12,663 12,995Depreciation of property, plant and equipment 4,100 4,847Amortisation of intangible assets 206 101Adjusted items (see note 9) 15,722 2,277Gain on disposal of property, plant and equipment (166) (59)Impairment loss on trade receivables 305 455Staff costs (see note 8) 65,536 63,379
/ 77Annual Report and Accounts 2018
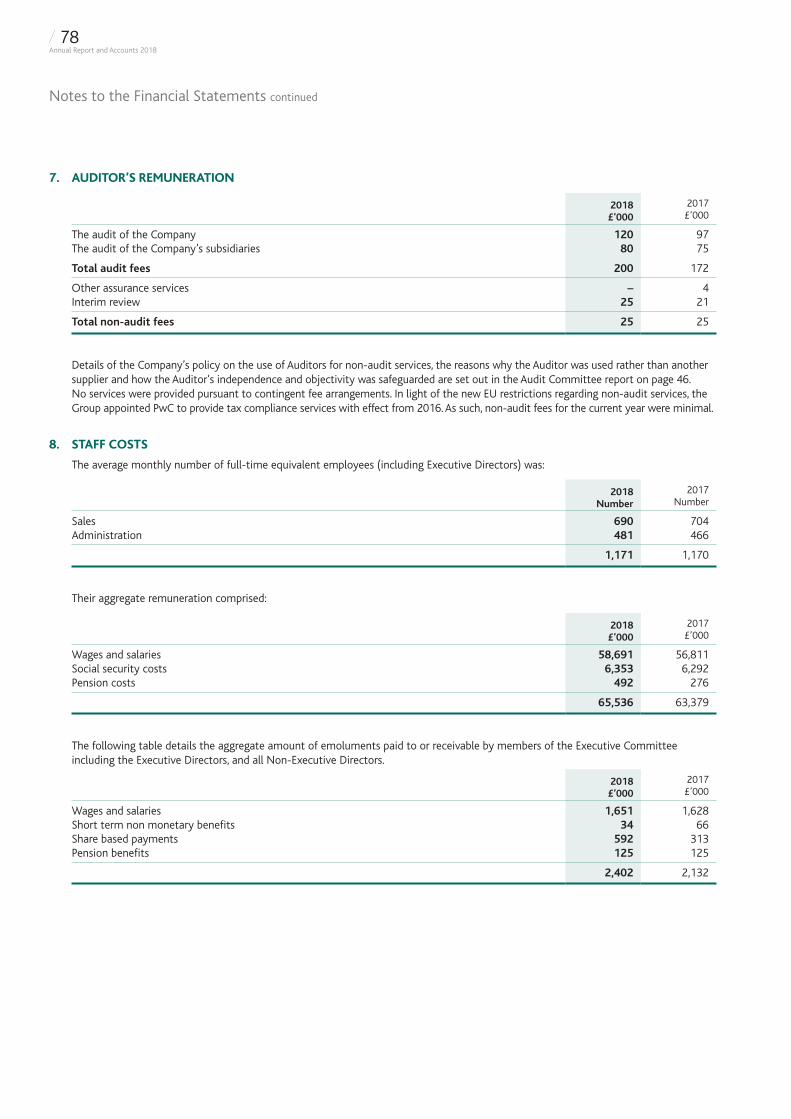
Notes to the Financial Statements continued
7. AUDITOR’S REMUNERATION
2018 £’000
2017 £’000
The audit of the Company 120 97The audit of the Company’s subsidiaries 80 75
Total audit fees 200 172
Other assurance services – 4Interim review 25 21
Total non-audit fees 25 25
Details of the Company’s policy on the use of Auditors for non-audit services, the reasons why the Auditor was used rather than another supplier and how the Auditor’s independence and objectivity was safeguarded are set out in the Audit Committee report on page 46. No services were provided pursuant to contingent fee arrangements. In light of the new EU restrictions regarding non-audit services, the Group appointed PwC to provide tax compliance services with effect from 2016. As such, non-audit fees for the current year were minimal.
8. STAFF COSTS
The average monthly number of full-time equivalent employees (including Executive Directors) was:
2018 Number
2017 Number
Sales 690 704Administration 481 466
1,171 1,170
Their aggregate remuneration comprised:
2018 £’000
2017 £’000
Wages and salaries 58,691 56,811Social security costs 6,353 6,292Pension costs 492 276
65,536 63,379
The following table details the aggregate amount of emoluments paid to or receivable by members of the Executive Committee including the Executive Directors, and all Non-Executive Directors.
2018 £’000
2017 £’000
Wages and salaries 1,651 1,628Short term non monetary benefits 34 66Share based payments 592 313Pension benefits 125 125
2,402 2,132
/ 78Annual Report and Accounts 2018
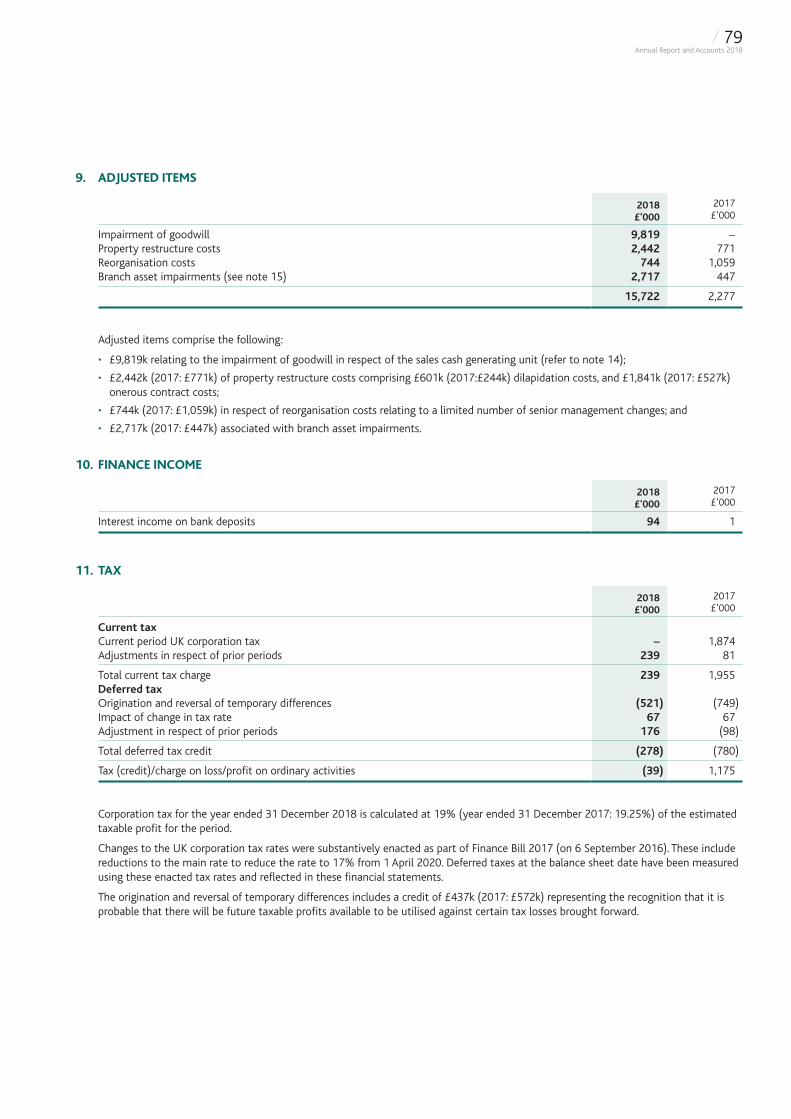
9. ADJUSTED ITEMS
2018 £’000
2017 £’000
Impairment of goodwill 9,819 –Property restructure costs 2,442 771Reorganisation costs 744 1,059Branch asset impairments (see note 15) 2,717 447
15,722 2,277
Adjusted items comprise the following:
• £9,819k relating to the impairment of goodwill in respect of the sales cash generating unit (refer to note 14);
• £2,442k (2017: £771k) of property restructure costs comprising £601k (2017:£244k) dilapidation costs, and £1,841k (2017: £527k) onerous contract costs;
• £744k (2017: £1,059k) in respect of reorganisation costs relating to a limited number of senior management changes; and
• £2,717k (2017: £447k) associated with branch asset impairments.
10. FINANCE INCOME
2018 £’000
2017 £’000
Interest income on bank deposits 94 1
11. TAX
2018 £’000
2017 £’000
Current taxCurrent period UK corporation tax – 1,874Adjustments in respect of prior periods 239 81
Total current tax charge 239 1,955Deferred taxOrigination and reversal of temporary differences (521) (749)Impact of change in tax rate 67 67Adjustment in respect of prior periods 176 (98)
Total deferred tax credit (278) (780)
Tax (credit)/charge on loss/profit on ordinary activities (39) 1,175
Corporation tax for the year ended 31 December 2018 is calculated at 19% (year ended 31 December 2017: 19.25%) of the estimated taxable profit for the period.
Changes to the UK corporation tax rates were substantively enacted as part of Finance Bill 2017 (on 6 September 2016). These include reductions to the main rate to reduce the rate to 17% from 1 April 2020. Deferred taxes at the balance sheet date have been measured using these enacted tax rates and reflected in these financial statements.
The origination and reversal of temporary differences includes a credit of £437k (2017: £572k) representing the recognition that it is probable that there will be future taxable profits available to be utilised against certain tax losses brought forward.
/ 79Annual Report and Accounts 2018
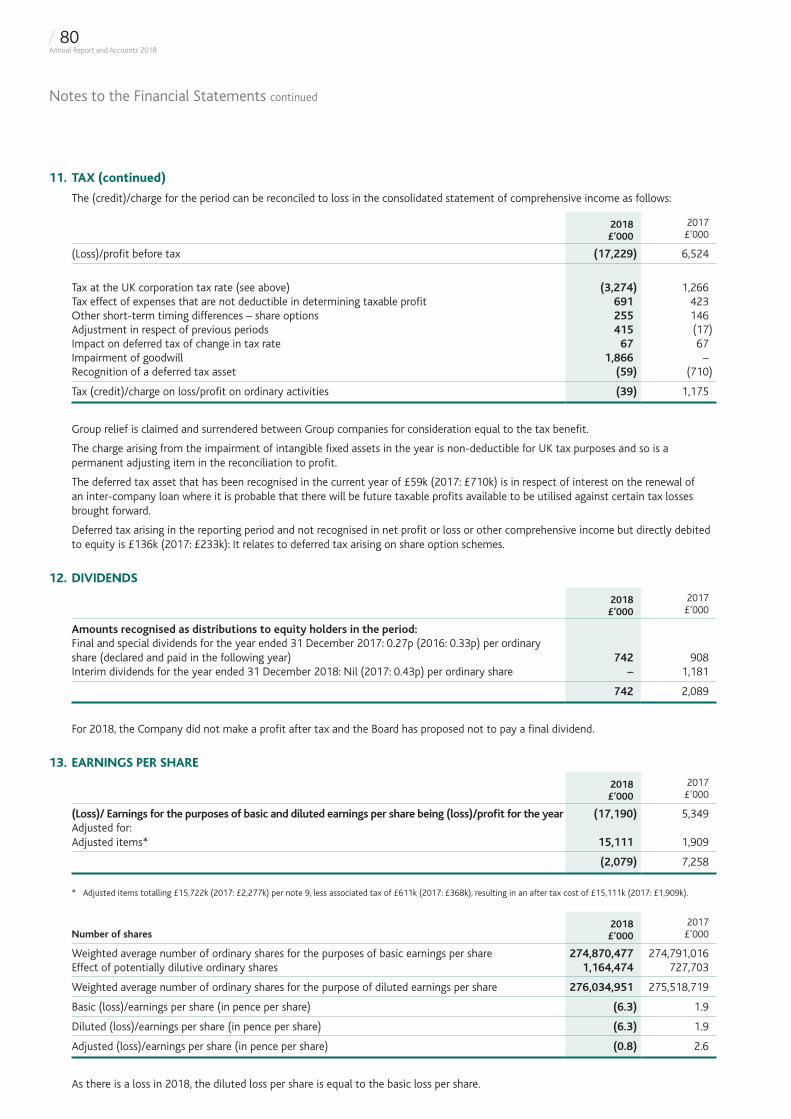
Notes to the Financial Statements continued
11. TAX (continued)
The (credit)/charge for the period can be reconciled to loss in the consolidated statement of comprehensive income as follows:
2018 £’000
2017 £’000
(Loss)/profit before tax (17,229) 6,524
Tax at the UK corporation tax rate (see above) (3,274) 1,266Tax effect of expenses that are not deductible in determining taxable profit 691 423Other short-term timing differences – share options 255 146Adjustment in respect of previous periods 415 (17)Impact on deferred tax of change in tax rate 67 67Impairment of goodwill 1,866 –Recognition of a deferred tax asset (59) (710)
Tax (credit)/charge on loss/profit on ordinary activities (39) 1,175
Group relief is claimed and surrendered between Group companies for consideration equal to the tax benefit.
The charge arising from the impairment of intangible fixed assets in the year is non-deductible for UK tax purposes and so is a permanent adjusting item in the reconciliation to profit.
The deferred tax asset that has been recognised in the current year of £59k (2017: £710k) is in respect of interest on the renewal of an inter-company loan where it is probable that there will be future taxable profits available to be utilised against certain tax losses brought forward.
Deferred tax arising in the reporting period and not recognised in net profit or loss or other comprehensive income but directly debited to equity is £136k (2017: £233k): It relates to deferred tax arising on share option schemes.
12. DIVIDENDS
2018 £’000
2017 £’000
Amounts recognised as distributions to equity holders in the period:Final and special dividends for the year ended 31 December 2017: 0.27p (2016: 0.33p) per ordinary share (declared and paid in the following year) 742 908Interim dividends for the year ended 31 December 2018: Nil (2017: 0.43p) per ordinary share – 1,181
742 2,089
For 2018, the Company did not make a profit after tax and the Board has proposed not to pay a final dividend.
13. EARNINGS PER SHARE
2018 £’000
2017 £’000
(Loss)/ Earnings for the purposes of basic and diluted earnings per share being (loss)/profit for the year (17,190) 5,349Adjusted for: Adjusted items* 15,111 1,909
(2,079) 7,258
* Adjusted items totalling £15,722k (2017: £2,277k) per note 9, less associated tax of £611k (2017: £368k), resulting in an after tax cost of £15,111k (2017: £1,909k).
Number of shares2018 £’000
2017 £’000
Weighted average number of ordinary shares for the purposes of basic earnings per share 274,870,477 274,791,016Effect of potentially dilutive ordinary shares 1,164,474 727,703
Weighted average number of ordinary shares for the purpose of diluted earnings per share 276,034,951 275,518,719
Basic (loss)/earnings per share (in pence per share) (6.3) 1.9
Diluted (loss)/earnings per share (in pence per share) (6.3) 1.9
Adjusted (loss)/earnings per share (in pence per share) (0.8) 2.6
As there is a loss in 2018, the diluted loss per share is equal to the basic loss per share.
/ 80Annual Report and Accounts 2018
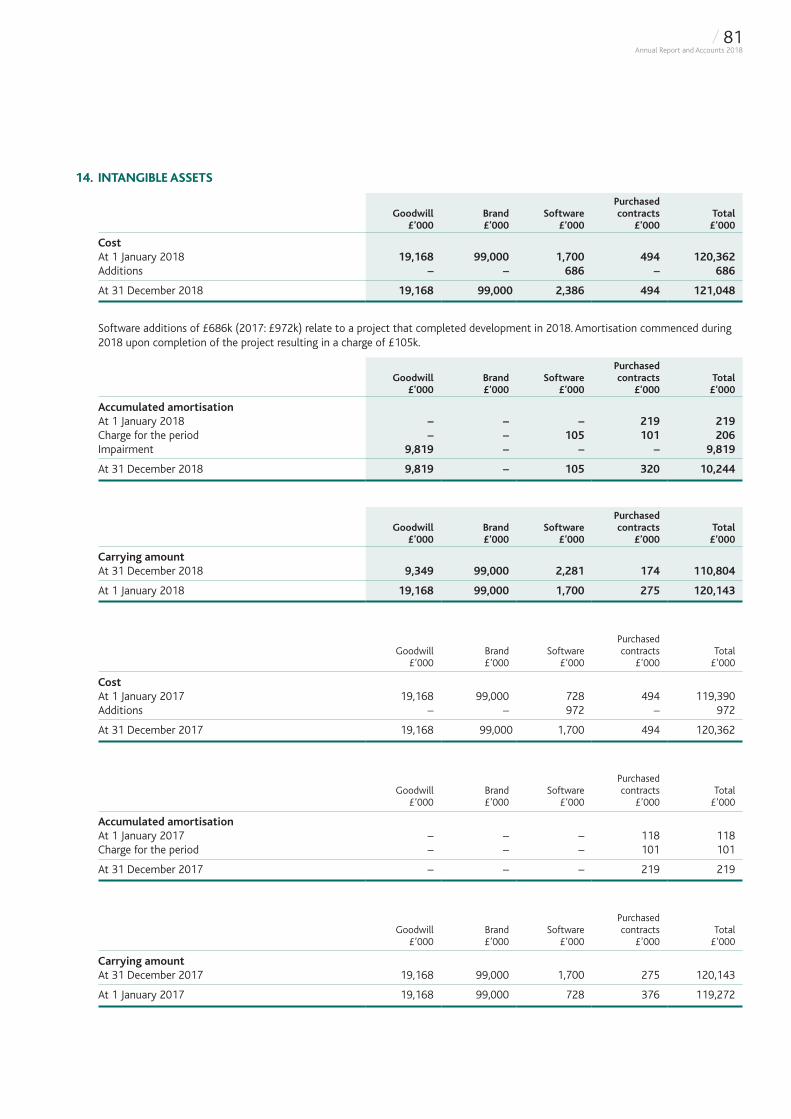
14. INTANGIBLE ASSETS
Goodwill £’000
Brand £’000
Software £’000
Purchased contracts
£’000Total
£’000
CostAt 1 January 2018 19,168 99,000 1,700 494 120,362Additions – – 686 – 686
At 31 December 2018 19,168 99,000 2,386 494 121,048
Software additions of £686k (2017: £972k) relate to a project that completed development in 2018. Amortisation commenced during 2018 upon completion of the project resulting in a charge of £105k.
Goodwill £’000
Brand £’000
Software £’000
Purchased contracts
£’000Total
£’000
Accumulated amortisationAt 1 January 2018 – – – 219 219Charge for the period – – 105 101 206Impairment 9,819 – – – 9,819
At 31 December 2018 9,819 – 105 320 10,244
Goodwill £’000
Brand £’000
Software £’000
Purchased contracts
£’000Total
£’000
Carrying amountAt 31 December 2018 9,349 99,000 2,281 174 110,804
At 1 January 2018 19,168 99,000 1,700 275 120,143
Goodwill £’000
Brand £’000
Software £’000
Purchased contracts
£’000Total
£’000
CostAt 1 January 2017 19,168 99,000 728 494 119,390Additions – – 972 – 972
At 31 December 2017 19,168 99,000 1,700 494 120,362
Goodwill £’000
Brand £’000
Software £’000
Purchased contracts
£’000Total
£’000
Accumulated amortisationAt 1 January 2017 – – – 118 118Charge for the period – – – 101 101
At 31 December 2017 – – – 219 219
Goodwill £’000
Brand £’000
Software £’000
Purchased contracts
£’000Total
£’000
Carrying amountAt 31 December 2017 19,168 99,000 1,700 275 120,143
At 1 January 2017 19,168 99,000 728 376 119,272
/ 81Annual Report and Accounts 2018
Notes to the Financial Statements continued
14. INTANGIBLE ASSETS (continued)
a) Carrying value of goodwill and other intangible assets
The components of goodwill and other intangible assets assessed for impairment comprise:
2018 £’000
2017 £’000
Sales goodwill – 9,819Lettings goodwill 9,349 9,349Brand asset – sales and lettings 99,000 99,000
108,349 118,168
b) Impairment review
Management has historically assessed the Group’s intangible assets for impairments using the Group’s three year business plan. However, given the extended nature of the current downturn and the associated political environment, the length of the forecast period has been extended from three to five years so as to recognize the potentially prolonged nature of the expected sales market recovery.
The impairment review has been undertaken using cash flow projections from formally approved budgets and forecasts covering a five-year period for each cash generating unit (CGU). The key assumptions in determining the cash flows are expected changes in sales and lettings volumes throughout the forecast period, together with likely changes to associated direct costs incurred during the forecast period. These assumptions are based upon a combination of past experience of recently observable trends and expectations of future changes in the market.
To evaluate the recoverable amounts of each CGU, a terminal value has been assumed after the fifth year and includes a long term growth rate in the cash flows of 2.0% (2017: 2%) into perpetuity. The discount rates used reflect the risks specific to the CGUs. The pre-tax rate used to discount cash flows from Sales is 10.1% (2017: 9.9%), from Lettings is 9.6% (2017: 9.4%) and from the aggregation of Sales and Lettings is 9.9% (2017: 9.7%).
The Brand asset has been tested for impairment by aggregating the value in use amounts computed in the goodwill impairment test for Sales and Lettings. The grouping of CGUs represents the lowest level at which management monitors the brand internally, and reflects the way in which the brand asset is viewed as relating to the Sales and Lettings segments as a whole, rather than being allocated to each segment on an arbitrary basis.
2018 was one of the toughest sales markets we have ever had in London with transactions falling further from previous years historically low levels. Low consumer confidence due to ongoing political uncertainty, the impact of stamp duty changes introduced in 2016 and affordability concerns in London have led to a sustained period of low activity levels. At the half year review we expected a gradual recovery in the sales market as being likely during full year 2019. Due to ongoing uncertainty, particularly surrounding macroeconomics and political events, we now view this as less likely and have impaired the full goodwill in the sales segment of £9.8 million. We consider this to be appropriate given the prolonged nature of the current downturn in the sales market.
c) Sensitivity analysis
We performed a detailed sensitivity analysis to assess the recoverable amounts of goodwill and other intangible assets, based on changes to key assumptions that we consider reasonably possible, and whether any changes in these assumptions would cause an impairment that would be material to the consolidated financial statements. The sensitivity analysis identified the Brand asset as the asset most sensitive to changes in key assumptions. The Lettings goodwill showed significant headroom against all scenarios in the sensitivity analysis.
Given the prolonged nature of the current downturn in the sales market the headroom on the Brand asset is lower meaning that the sensitivity to the lettings growth plan is greater. The key judgement in the impairment assessment relates to the expected lettings growth. The carrying value of the Brand asset is not highly sensitive to changes in discount rates or long term growth rates.
Under management’s plan, the headroom in the Brand is £55m. The plan assumes that lettings revenue growth throughout the plan period will be driven by a number of significant investments made over 2017 and 2018 in our service offering. Assuming no improvements in other elements of the plan, the headroom would reduce to zero if the CAGR for lettings over the five year plan period was 1%. If there was no growth in lettings revenue over the five year plan period, this would impair the Brand asset by £24m. Both these downside scenarios to the Plan include controllable cost mitigation in negotiator headcount and reduction in back office costs. Further mitigating actions would be available should these two scenarios arise.
We will continue to monitor the Brand for impairment indicators. It is management’s view however, that lettings continues to deliver a consistent and stable revenue stream for the Group with good long term fundamentals.
/ 82Annual Report and Accounts 2018
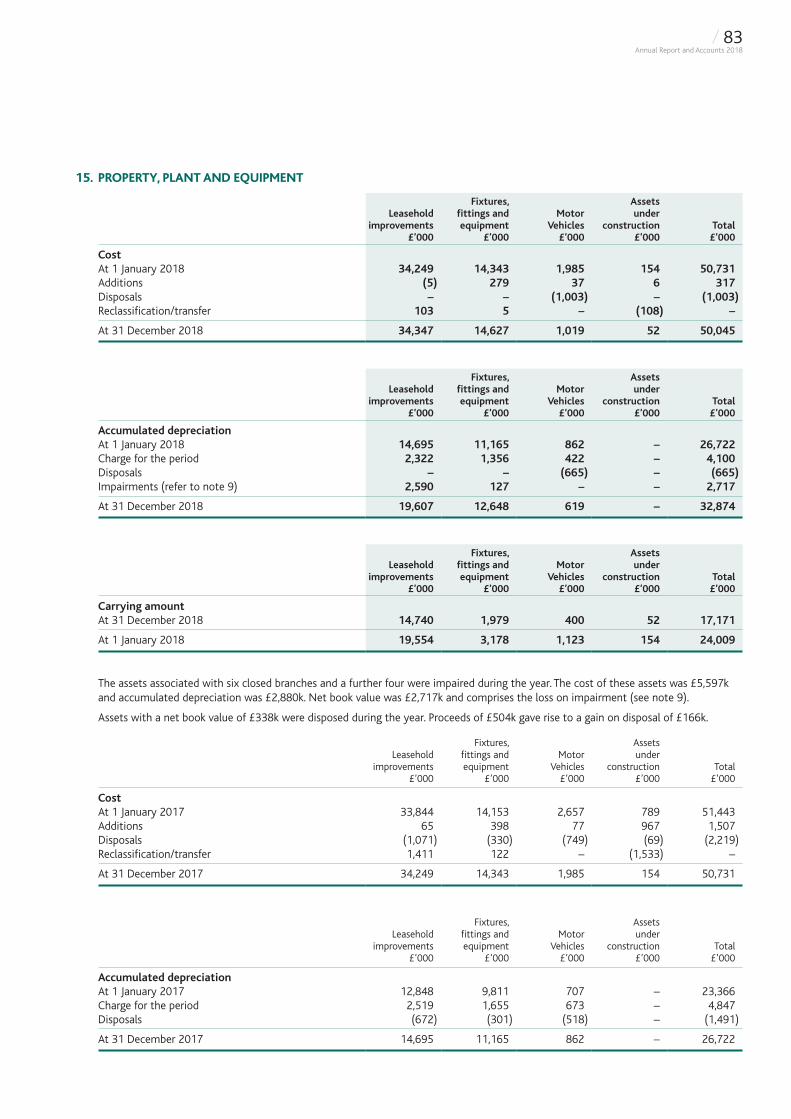
15. PROPERTY, PLANT AND EQUIPMENT
Leasehold improvements
£’000
Fixtures, fittings and equipment
£’000
Motor Vehicles
£’000
Assets under
construction £’000
Total £’000
CostAt 1 January 2018 34,249 14,343 1,985 154 50,731Additions (5) 279 37 6 317Disposals – – (1,003) – (1,003)Reclassification/transfer 103 5 – (108) –
At 31 December 2018 34,347 14,627 1,019 52 50,045
Leasehold improvements
£’000
Fixtures, fittings and equipment
£’000
Motor Vehicles
£’000
Assets under
construction £’000
Total £’000
Accumulated depreciationAt 1 January 2018 14,695 11,165 862 – 26,722Charge for the period 2,322 1,356 422 – 4,100Disposals – – (665) – (665)Impairments (refer to note 9) 2,590 127 – – 2,717
At 31 December 2018 19,607 12,648 619 – 32,874
Leasehold improvements
£’000
Fixtures, fittings and equipment
£’000
Motor Vehicles
£’000
Assets under
construction £’000
Total £’000
Carrying amountAt 31 December 2018 14,740 1,979 400 52 17,171
At 1 January 2018 19,554 3,178 1,123 154 24,009
The assets associated with six closed branches and a further four were impaired during the year. The cost of these assets was £5,597k and accumulated depreciation was £2,880k. Net book value was £2,717k and comprises the loss on impairment (see note 9).
Assets with a net book value of £338k were disposed during the year. Proceeds of £504k gave rise to a gain on disposal of £166k.
Leasehold improvements
£’000
Fixtures, fittings and equipment
£’000
Motor Vehicles
£’000
Assets under
construction £’000
Total £’000
CostAt 1 January 2017 33,844 14,153 2,657 789 51,443Additions 65 398 77 967 1,507Disposals (1,071) (330) (749) (69) (2,219)Reclassification/transfer 1,411 122 – (1,533) –
At 31 December 2017 34,249 14,343 1,985 154 50,731
Leasehold improvements
£’000
Fixtures, fittings and equipment
£’000
Motor Vehicles
£’000
Assets under
construction £’000
Total £’000
Accumulated depreciationAt 1 January 2017 12,848 9,811 707 – 23,366Charge for the period 2,519 1,655 673 – 4,847Disposals (672) (301) (518) – (1,491)
At 31 December 2017 14,695 11,165 862 – 26,722
/ 83Annual Report and Accounts 2018
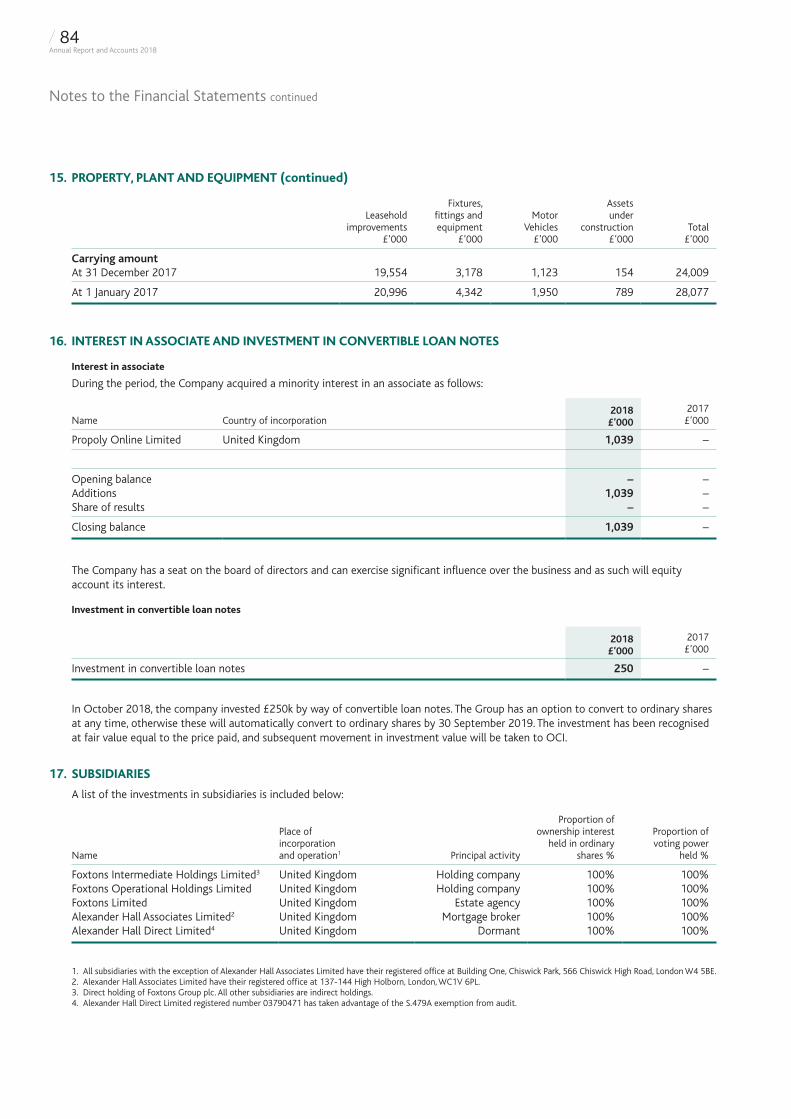
Notes to the Financial Statements continued
15. PROPERTY, PLANT AND EQUIPMENT (continued)
Leasehold improvements
£’000
Fixtures, fittings and equipment
£’000
Motor Vehicles
£’000
Assets under
construction £’000
Total £’000
Carrying amountAt 31 December 2017 19,554 3,178 1,123 154 24,009
At 1 January 2017 20,996 4,342 1,950 789 28,077
16. INTEREST IN ASSOCIATE AND INVESTMENT IN CONVERTIBLE LOAN NOTES
Interest in associate
During the period, the Company acquired a minority interest in an associate as follows:
Name Country of incorporation2018 £’000
2017 £’000
Propoly Online Limited United Kingdom 1,039 –
Opening balance – –Additions 1,039 –Share of results – –
Closing balance 1,039 –
The Company has a seat on the board of directors and can exercise significant influence over the business and as such will equity account its interest.
Investment in convertible loan notes
2018 £’000
2017 £’000
Investment in convertible loan notes 250 –
In October 2018, the company invested £250k by way of convertible loan notes. The Group has an option to convert to ordinary shares at any time, otherwise these will automatically convert to ordinary shares by 30 September 2019. The investment has been recognised at fair value equal to the price paid, and subsequent movement in investment value will be taken to OCI.
17. SUBSIDIARIES
A list of the investments in subsidiaries is included below:
Name
Place of incorporation and operation1 Principal activity
Proportion of ownership interest
held in ordinary shares %
Proportion of voting power
held %
Foxtons Intermediate Holdings Limited3 United Kingdom Holding company 100% 100%Foxtons Operational Holdings Limited United Kingdom Holding company 100% 100%Foxtons Limited United Kingdom Estate agency 100% 100%Alexander Hall Associates Limited2 United Kingdom Mortgage broker 100% 100%Alexander Hall Direct Limited4 United Kingdom Dormant 100% 100%
1. All subsidiaries with the exception of Alexander Hall Associates Limited have their registered office at Building One, Chiswick Park, 566 Chiswick High Road, London W4 5BE.2. Alexander Hall Associates Limited have their registered office at 137-144 High Holborn, London, WC1V 6PL.3. Direct holding of Foxtons Group plc. All other subsidiaries are indirect holdings.4. Alexander Hall Direct Limited registered number 03790471 has taken advantage of the S.479A exemption from audit.
/ 84Annual Report and Accounts 2018
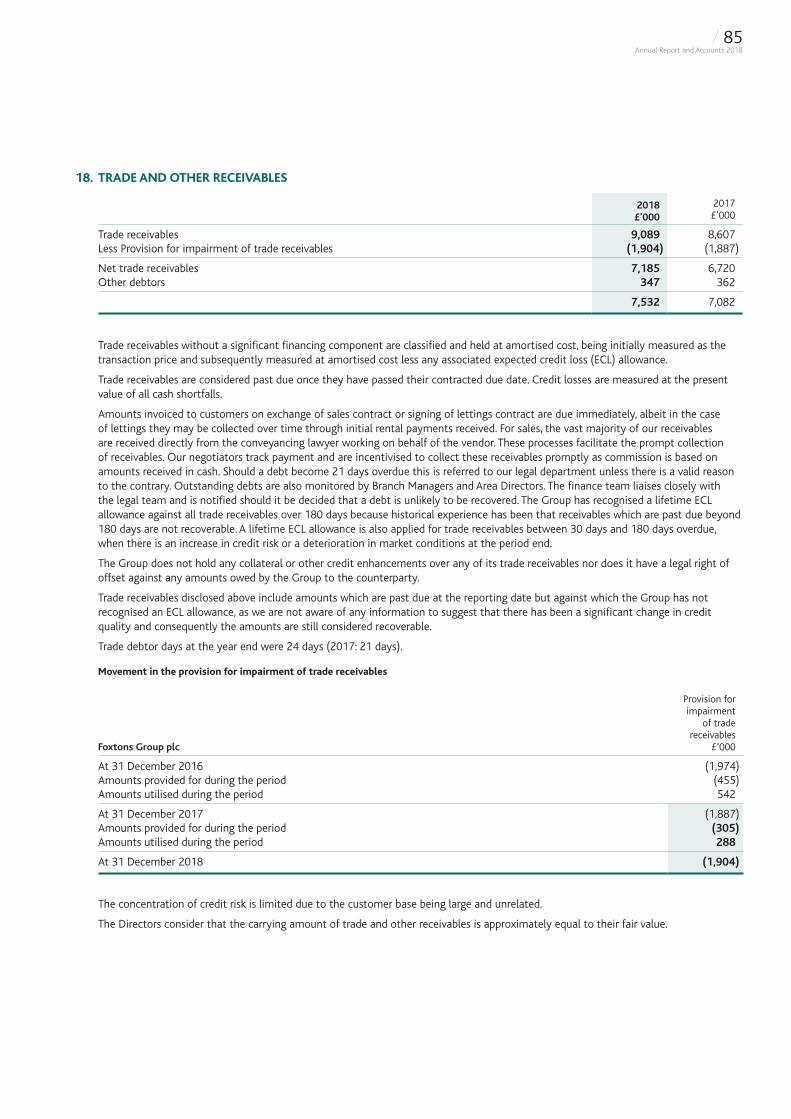
18. TRADE AND OTHER RECEIVABLES
2018 £’000
2017 £’000
Trade receivables 9,089 8,607Less Provision for impairment of trade receivables (1,904) (1,887)
Net trade receivables 7,185 6,720Other debtors 347 362
7,532 7,082
Trade receivables without a significant financing component are classified and held at amortised cost, being initially measured as the transaction price and subsequently measured at amortised cost less any associated expected credit loss (ECL) allowance.
Trade receivables are considered past due once they have passed their contracted due date. Credit losses are measured at the present value of all cash shortfalls.
Amounts invoiced to customers on exchange of sales contract or signing of lettings contract are due immediately, albeit in the case of lettings they may be collected over time through initial rental payments received. For sales, the vast majority of our receivables are received directly from the conveyancing lawyer working on behalf of the vendor. These processes facilitate the prompt collection of receivables. Our negotiators track payment and are incentivised to collect these receivables promptly as commission is based on amounts received in cash. Should a debt become 21 days overdue this is referred to our legal department unless there is a valid reason to the contrary. Outstanding debts are also monitored by Branch Managers and Area Directors. The finance team liaises closely with the legal team and is notified should it be decided that a debt is unlikely to be recovered. The Group has recognised a lifetime ECL allowance against all trade receivables over 180 days because historical experience has been that receivables which are past due beyond 180 days are not recoverable. A lifetime ECL allowance is also applied for trade receivables between 30 days and 180 days overdue, when there is an increase in credit risk or a deterioration in market conditions at the period end.
The Group does not hold any collateral or other credit enhancements over any of its trade receivables nor does it have a legal right of offset against any amounts owed by the Group to the counterparty.
Trade receivables disclosed above include amounts which are past due at the reporting date but against which the Group has not recognised an ECL allowance, as we are not aware of any information to suggest that there has been a significant change in credit quality and consequently the amounts are still considered recoverable.
Trade debtor days at the year end were 24 days (2017: 21 days).
Movement in the provision for impairment of trade receivables
Foxtons Group plc
Provision for impairment
of trade receivables
£’000
At 31 December 2016 (1,974)Amounts provided for during the period (455)Amounts utilised during the period 542
At 31 December 2017 (1,887)Amounts provided for during the period (305)Amounts utilised during the period 288
At 31 December 2018 (1,904)
The concentration of credit risk is limited due to the customer base being large and unrelated.
The Directors consider that the carrying amount of trade and other receivables is approximately equal to their fair value.
/ 85Annual Report and Accounts 2018
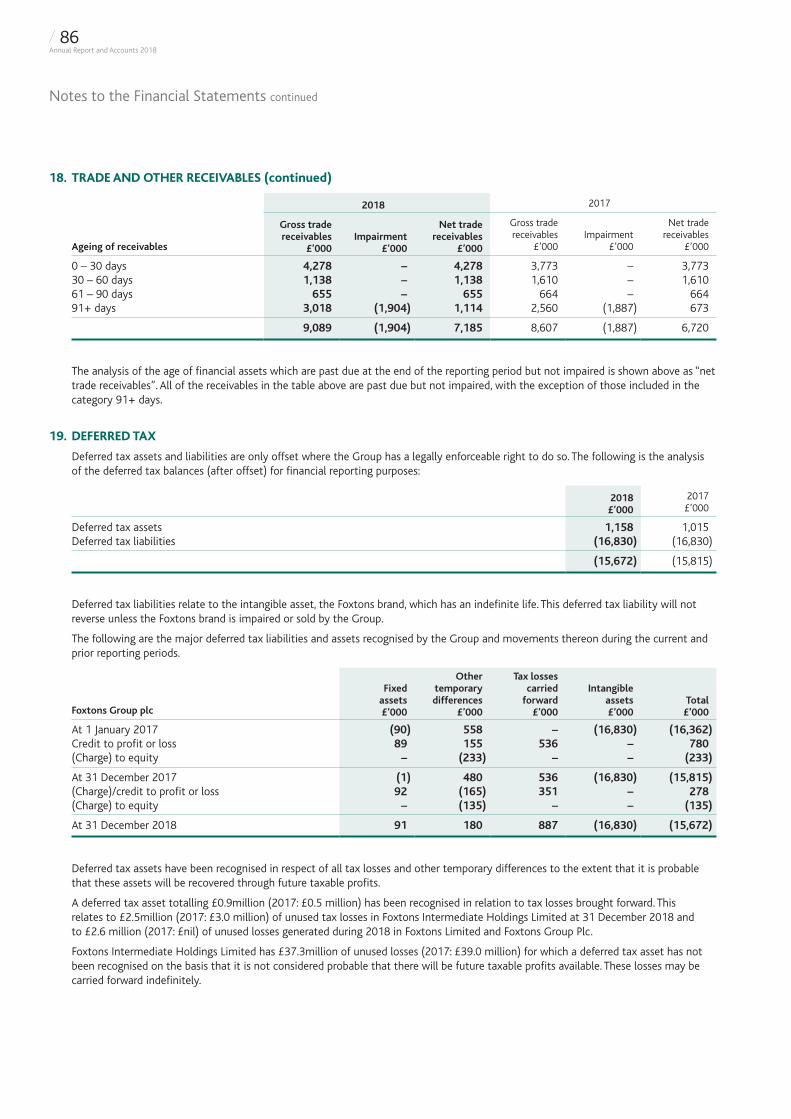
Notes to the Financial Statements continued
18. TRADE AND OTHER RECEIVABLES (continued)
2018 2017
Ageing of receivables
Gross trade receivables
£’000Impairment
£’000
Net trade receivables
£’000
Gross trade receivables
£’000Impairment
£’000
Net trade receivables
£’000
0 – 30 days 4,278 – 4,278 3,773 – 3,77330 – 60 days 1,138 – 1,138 1,610 – 1,61061 – 90 days 655 – 655 664 – 66491+ days 3,018 (1,904) 1,114 2,560 (1,887) 673
9,089 (1,904) 7,185 8,607 (1,887) 6,720
The analysis of the age of financial assets which are past due at the end of the reporting period but not impaired is shown above as “net trade receivables”. All of the receivables in the table above are past due but not impaired, with the exception of those included in the category 91+ days.
19. DEFERRED TAX
Deferred tax assets and liabilities are only offset where the Group has a legally enforceable right to do so. The following is the analysis of the deferred tax balances (after offset) for financial reporting purposes:
2018 £’000
2017 £’000
Deferred tax assets 1,158 1,015Deferred tax liabilities (16,830) (16,830)
(15,672) (15,815)
Deferred tax liabilities relate to the intangible asset, the Foxtons brand, which has an indefinite life. This deferred tax liability will not reverse unless the Foxtons brand is impaired or sold by the Group.
The following are the major deferred tax liabilities and assets recognised by the Group and movements thereon during the current and prior reporting periods.
Foxtons Group plc
Fixed assets £’000
Other temporary differences
£’000
Tax losses carried
forward £’000
Intangible assets £’000
Total £’000
At 1 January 2017 (90) 558 – (16,830) (16,362)Credit to profit or loss 89 155 536 – 780(Charge) to equity – (233) – – (233)
At 31 December 2017 (1) 480 536 (16,830) (15,815)(Charge)/credit to profit or loss 92 (165) 351 – 278(Charge) to equity – (135) – – (135)
At 31 December 2018 91 180 887 (16,830) (15,672)
Deferred tax assets have been recognised in respect of all tax losses and other temporary differences to the extent that it is probable that these assets will be recovered through future taxable profits.
A deferred tax asset totalling £0.9million (2017: £0.5 million) has been recognised in relation to tax losses brought forward. This relates to £2.5million (2017: £3.0 million) of unused tax losses in Foxtons Intermediate Holdings Limited at 31 December 2018 and to £2.6 million (2017: £nil) of unused losses generated during 2018 in Foxtons Limited and Foxtons Group Plc.
Foxtons Intermediate Holdings Limited has £37.3million of unused losses (2017: £39.0 million) for which a deferred tax asset has not been recognised on the basis that it is not considered probable that there will be future taxable profits available. These losses may be carried forward indefinitely.
/ 86Annual Report and Accounts 2018
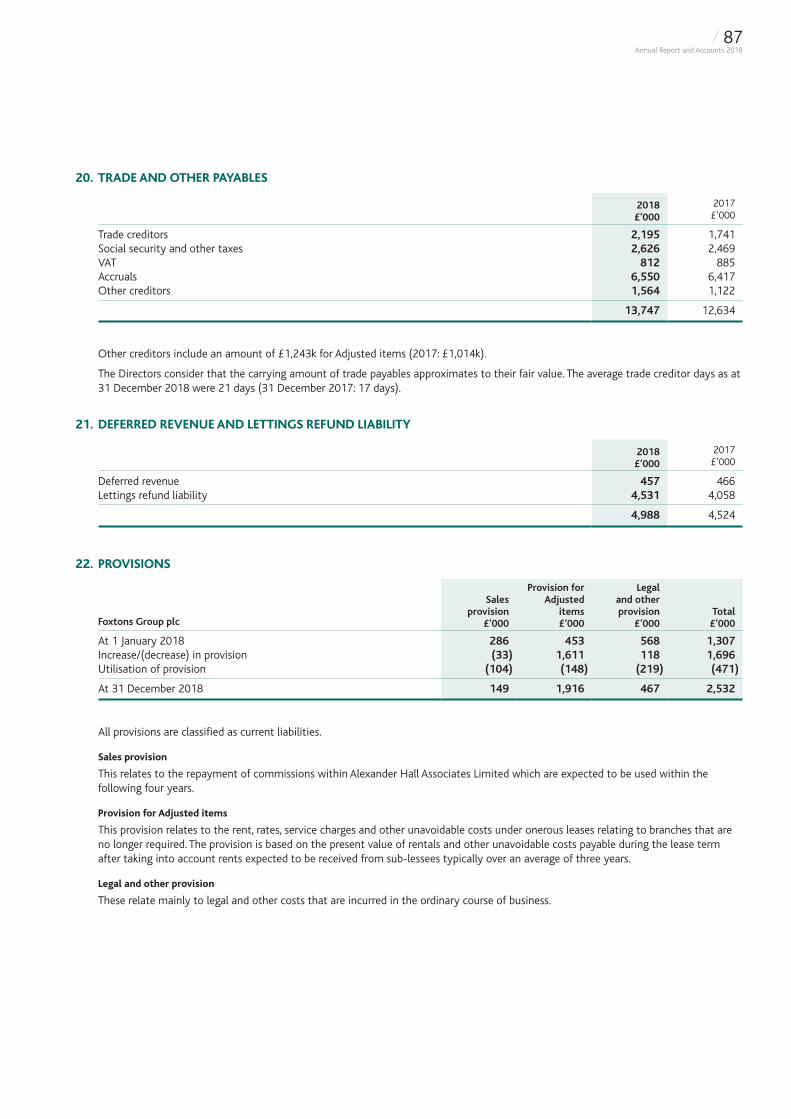
20. TRADE AND OTHER PAYABLES
2018 £’000
2017 £’000
Trade creditors 2,195 1,741Social security and other taxes 2,626 2,469VAT 812 885Accruals 6,550 6,417Other creditors 1,564 1,122
13,747 12,634
Other creditors include an amount of £1,243k for Adjusted items (2017: £1,014k).
The Directors consider that the carrying amount of trade payables approximates to their fair value. The average trade creditor days as at 31 December 2018 were 21 days (31 December 2017: 17 days).
21. DEFERRED REVENUE AND LETTINGS REFUND LIABILITY
2018 £’000
2017 £’000
Deferred revenue 457 466Lettings refund liability 4,531 4,058
4,988 4,524
22. PROVISIONS
Foxtons Group plc
Sales provision
£’000
Provision for Adjusted
items £’000
Legal and other provision
£’000Total
£’000
At 1 January 2018 286 453 568 1,307Increase/(decrease) in provision (33) 1,611 118 1,696Utilisation of provision (104) (148) (219) (471)
At 31 December 2018 149 1,916 467 2,532
All provisions are classified as current liabilities.
Sales provision
This relates to the repayment of commissions within Alexander Hall Associates Limited which are expected to be used within the following four years.
Provision for Adjusted items
This provision relates to the rent, rates, service charges and other unavoidable costs under onerous leases relating to branches that are no longer required. The provision is based on the present value of rentals and other unavoidable costs payable during the lease term after taking into account rents expected to be received from sub-lessees typically over an average of three years.
Legal and other provision
These relate mainly to legal and other costs that are incurred in the ordinary course of business.
/ 87Annual Report and Accounts 2018
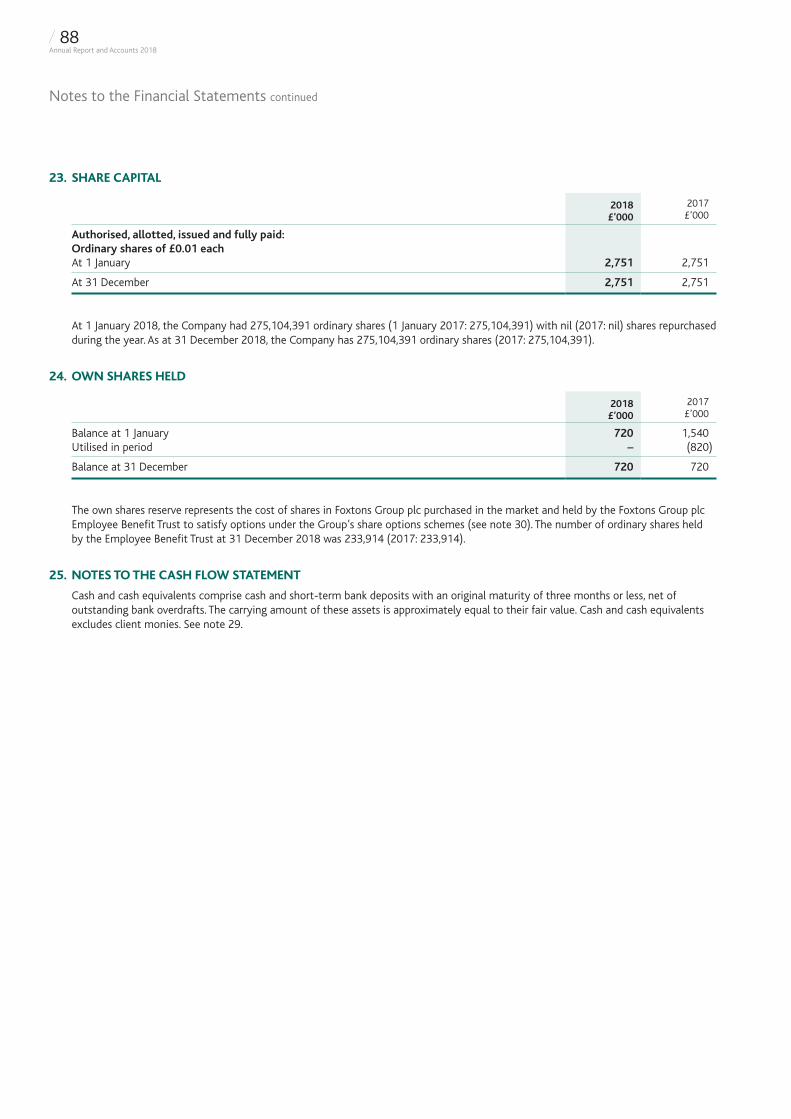
Notes to the Financial Statements continued
23. SHARE CAPITAL
2018 £’000
2017 £’000
Authorised, allotted, issued and fully paid:Ordinary shares of £0.01 eachAt 1 January 2,751 2,751
At 31 December 2,751 2,751
At 1 January 2018, the Company had 275,104,391 ordinary shares (1 January 2017: 275,104,391) with nil (2017: nil) shares repurchased during the year. As at 31 December 2018, the Company has 275,104,391 ordinary shares (2017: 275,104,391).
24. OWN SHARES HELD
2018 £’000
2017 £’000
Balance at 1 January 720 1,540Utilised in period – (820)
Balance at 31 December 720 720
The own shares reserve represents the cost of shares in Foxtons Group plc purchased in the market and held by the Foxtons Group plc Employee Benefit Trust to satisfy options under the Group’s share options schemes (see note 30). The number of ordinary shares held by the Employee Benefit Trust at 31 December 2018 was 233,914 (2017: 233,914).
25. NOTES TO THE CASH FLOW STATEMENT
Cash and cash equivalents comprise cash and short-term bank deposits with an original maturity of three months or less, net of outstanding bank overdrafts. The carrying amount of these assets is approximately equal to their fair value. Cash and cash equivalents excludes client monies. See note 29.
/ 88Annual Report and Accounts 2018
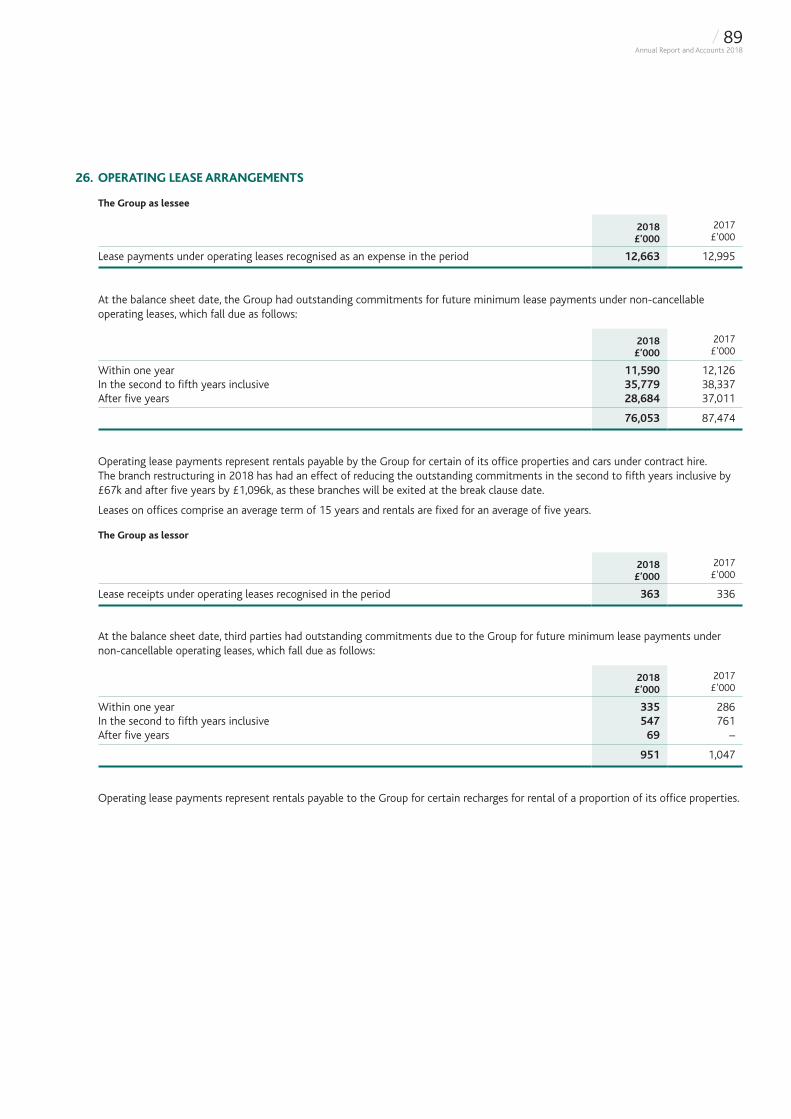
26. OPERATING LEASE ARRANGEMENTS
The Group as lessee
2018 £’000
2017 £’000
Lease payments under operating leases recognised as an expense in the period 12,663 12,995
At the balance sheet date, the Group had outstanding commitments for future minimum lease payments under non-cancellable operating leases, which fall due as follows:
2018 £’000
2017 £’000
Within one year 11,590 12,126In the second to fifth years inclusive 35,779 38,337After five years 28,684 37,011
76,053 87,474
Operating lease payments represent rentals payable by the Group for certain of its office properties and cars under contract hire. The branch restructuring in 2018 has had an effect of reducing the outstanding commitments in the second to fifth years inclusive by £67k and after five years by £1,096k, as these branches will be exited at the break clause date.
Leases on offices comprise an average term of 15 years and rentals are fixed for an average of five years.
The Group as lessor
2018 £’000
2017 £’000
Lease receipts under operating leases recognised in the period 363 336
At the balance sheet date, third parties had outstanding commitments due to the Group for future minimum lease payments under non-cancellable operating leases, which fall due as follows:
2018 £’000
2017 £’000
Within one year 335 286In the second to fifth years inclusive 547 761After five years 69 –
951 1,047
Operating lease payments represent rentals payable to the Group for certain recharges for rental of a proportion of its office properties.
/ 89Annual Report and Accounts 2018
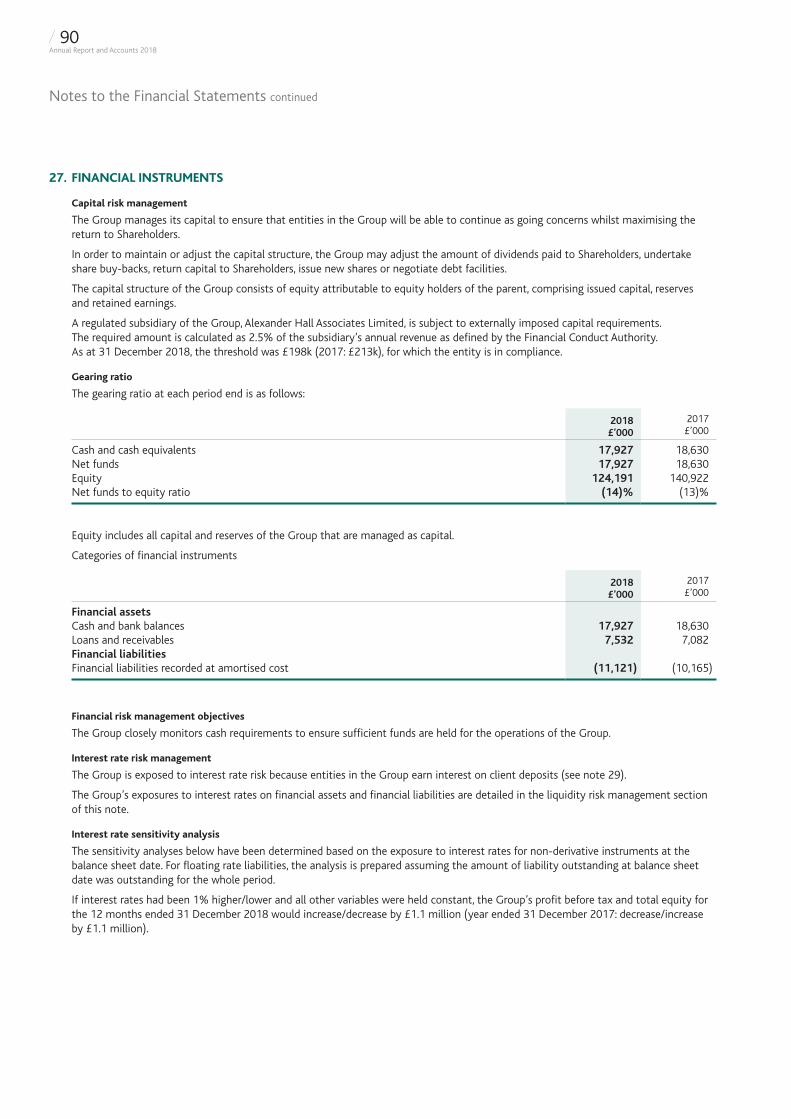
Notes to the Financial Statements continued
27. FINANCIAL INSTRUMENTS
Capital risk management
The Group manages its capital to ensure that entities in the Group will be able to continue as going concerns whilst maximising the return to Shareholders.
In order to maintain or adjust the capital structure, the Group may adjust the amount of dividends paid to Shareholders, undertake share buy-backs, return capital to Shareholders, issue new shares or negotiate debt facilities.
The capital structure of the Group consists of equity attributable to equity holders of the parent, comprising issued capital, reserves and retained earnings.
A regulated subsidiary of the Group, Alexander Hall Associates Limited, is subject to externally imposed capital requirements. The required amount is calculated as 2.5% of the subsidiary’s annual revenue as defined by the Financial Conduct Authority. As at 31 December 2018, the threshold was £198k (2017: £213k), for which the entity is in compliance.
Gearing ratio
The gearing ratio at each period end is as follows:
2018 £’000
2017 £’000
Cash and cash equivalents 17,927 18,630Net funds 17,927 18,630Equity 124,191 140,922Net funds to equity ratio (14)% (13)%
Equity includes all capital and reserves of the Group that are managed as capital.
Categories of financial instruments
2018 £’000
2017 £’000
Financial assetsCash and bank balances 17,927 18,630Loans and receivables 7,532 7,082Financial liabilitiesFinancial liabilities recorded at amortised cost (11,121) (10,165)
Financial risk management objectives
The Group closely monitors cash requirements to ensure sufficient funds are held for the operations of the Group.
Interest rate risk management
The Group is exposed to interest rate risk because entities in the Group earn interest on client deposits (see note 29).
The Group’s exposures to interest rates on financial assets and financial liabilities are detailed in the liquidity risk management section of this note.
Interest rate sensitivity analysis
The sensitivity analyses below have been determined based on the exposure to interest rates for non-derivative instruments at the balance sheet date. For floating rate liabilities, the analysis is prepared assuming the amount of liability outstanding at balance sheet date was outstanding for the whole period.
If interest rates had been 1% higher/lower and all other variables were held constant, the Group’s profit before tax and total equity for the 12 months ended 31 December 2018 would increase/decrease by £1.1 million (year ended 31 December 2017: decrease/increase by £1.1 million).
/ 90Annual Report and Accounts 2018
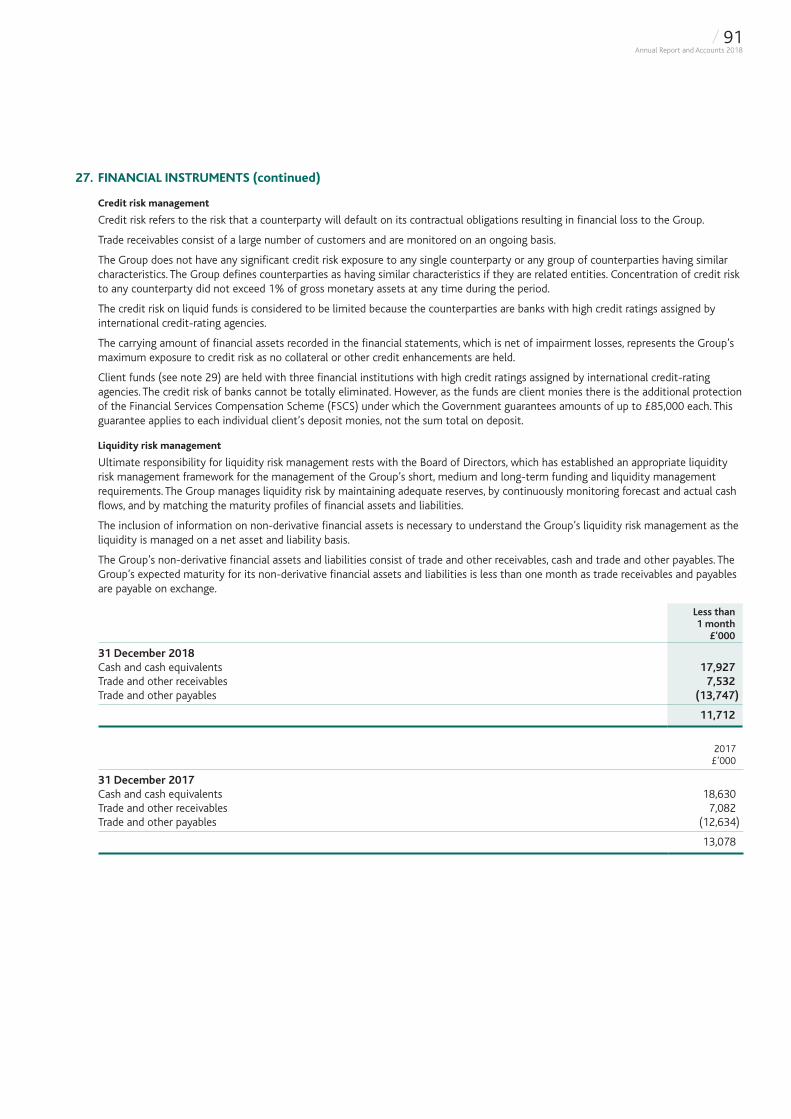
27. FINANCIAL INSTRUMENTS (continued)
Credit risk management
Credit risk refers to the risk that a counterparty will default on its contractual obligations resulting in financial loss to the Group.
Trade receivables consist of a large number of customers and are monitored on an ongoing basis.
The Group does not have any significant credit risk exposure to any single counterparty or any group of counterparties having similar characteristics. The Group defines counterparties as having similar characteristics if they are related entities. Concentration of credit risk to any counterparty did not exceed 1% of gross monetary assets at any time during the period.
The credit risk on liquid funds is considered to be limited because the counterparties are banks with high credit ratings assigned by international credit-rating agencies.
The carrying amount of financial assets recorded in the financial statements, which is net of impairment losses, represents the Group’s maximum exposure to credit risk as no collateral or other credit enhancements are held.
Client funds (see note 29) are held with three financial institutions with high credit ratings assigned by international credit-rating agencies. The credit risk of banks cannot be totally eliminated. However, as the funds are client monies there is the additional protection of the Financial Services Compensation Scheme (FSCS) under which the Government guarantees amounts of up to £85,000 each. This guarantee applies to each individual client’s deposit monies, not the sum total on deposit.
Liquidity risk management
Ultimate responsibility for liquidity risk management rests with the Board of Directors, which has established an appropriate liquidity risk management framework for the management of the Group’s short, medium and long-term funding and liquidity management requirements. The Group manages liquidity risk by maintaining adequate reserves, by continuously monitoring forecast and actual cash flows, and by matching the maturity profiles of financial assets and liabilities.
The inclusion of information on non-derivative financial assets is necessary to understand the Group’s liquidity risk management as the liquidity is managed on a net asset and liability basis.
The Group’s non-derivative financial assets and liabilities consist of trade and other receivables, cash and trade and other payables. The Group’s expected maturity for its non-derivative financial assets and liabilities is less than one month as trade receivables and payables are payable on exchange.
Less than 1 month
£’000
31 December 2018Cash and cash equivalents 17,927Trade and other receivables 7,532Trade and other payables (13,747)
11,712
2017 £’000
31 December 2017Cash and cash equivalents 18,630Trade and other receivables 7,082Trade and other payables (12,634)
13,078
/ 91Annual Report and Accounts 2018
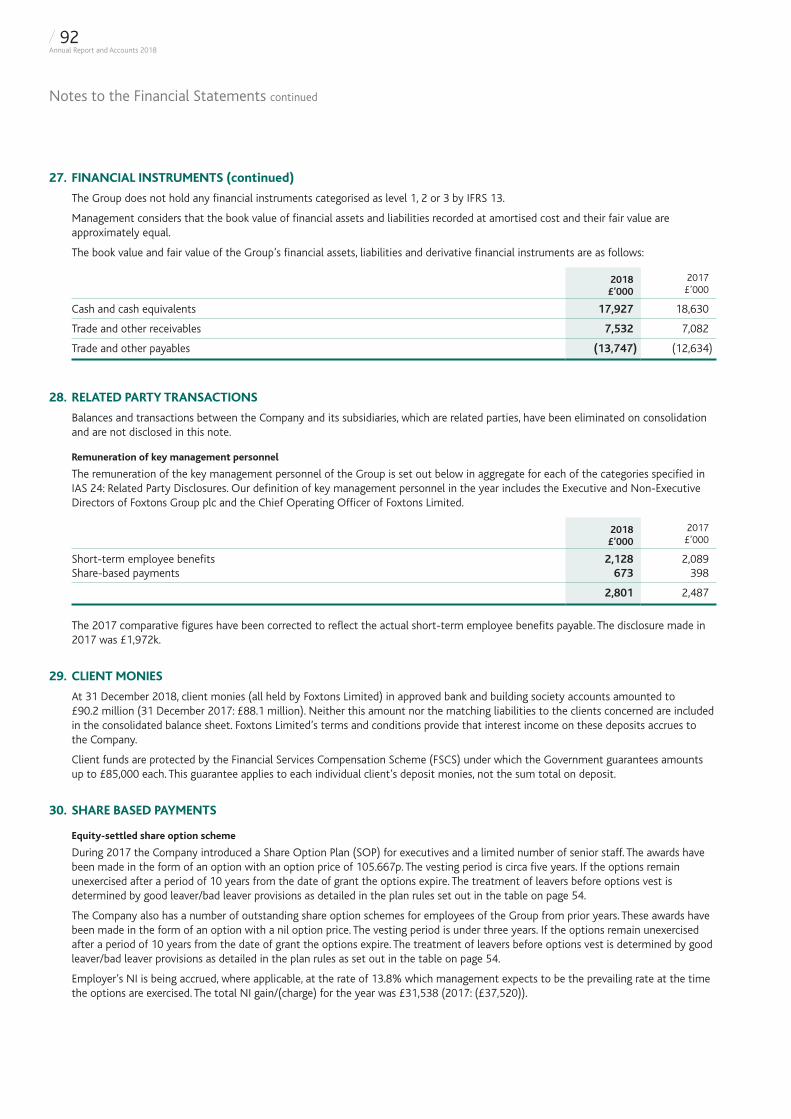
Notes to the Financial Statements continued
27. FINANCIAL INSTRUMENTS (continued)
The Group does not hold any financial instruments categorised as level 1, 2 or 3 by IFRS 13.
Management considers that the book value of financial assets and liabilities recorded at amortised cost and their fair value are approximately equal.
The book value and fair value of the Group’s financial assets, liabilities and derivative financial instruments are as follows:
2018 £’000
2017 £’000
Cash and cash equivalents 17,927 18,630
Trade and other receivables 7,532 7,082
Trade and other payables (13,747) (12,634)
28. RELATED PARTY TRANSACTIONS
Balances and transactions between the Company and its subsidiaries, which are related parties, have been eliminated on consolidation and are not disclosed in this note.
Remuneration of key management personnel
The remuneration of the key management personnel of the Group is set out below in aggregate for each of the categories specified in IAS 24: Related Party Disclosures. Our definition of key management personnel in the year includes the Executive and Non-Executive Directors of Foxtons Group plc and the Chief Operating Officer of Foxtons Limited.
2018 £’000
2017 £’000
Short-term employee benefits 2,128 2,089Share-based payments 673 398
2,801 2,487
The 2017 comparative figures have been corrected to reflect the actual short-term employee benefits payable. The disclosure made in 2017 was £1,972k.
29. CLIENT MONIES
At 31 December 2018, client monies (all held by Foxtons Limited) in approved bank and building society accounts amounted to £90.2 million (31 December 2017: £88.1 million). Neither this amount nor the matching liabilities to the clients concerned are included in the consolidated balance sheet. Foxtons Limited’s terms and conditions provide that interest income on these deposits accrues to the Company.
Client funds are protected by the Financial Services Compensation Scheme (FSCS) under which the Government guarantees amounts up to £85,000 each. This guarantee applies to each individual client’s deposit monies, not the sum total on deposit.
30. SHARE BASED PAYMENTS
Equity-settled share option scheme
During 2017 the Company introduced a Share Option Plan (SOP) for executives and a limited number of senior staff. The awards have been made in the form of an option with an option price of 105.667p. The vesting period is circa five years. If the options remain unexercised after a period of 10 years from the date of grant the options expire. The treatment of leavers before options vest is determined by good leaver/bad leaver provisions as detailed in the plan rules set out in the table on page 54.
The Company also has a number of outstanding share option schemes for employees of the Group from prior years. These awards have been made in the form of an option with a nil option price. The vesting period is under three years. If the options remain unexercised after a period of 10 years from the date of grant the options expire. The treatment of leavers before options vest is determined by good leaver/bad leaver provisions as detailed in the plan rules as set out in the table on page 54.
Employer’s NI is being accrued, where applicable, at the rate of 13.8% which management expects to be the prevailing rate at the time the options are exercised. The total NI gain/(charge) for the year was £31,538 (2017: (£37,520)).
/ 92Annual Report and Accounts 2018
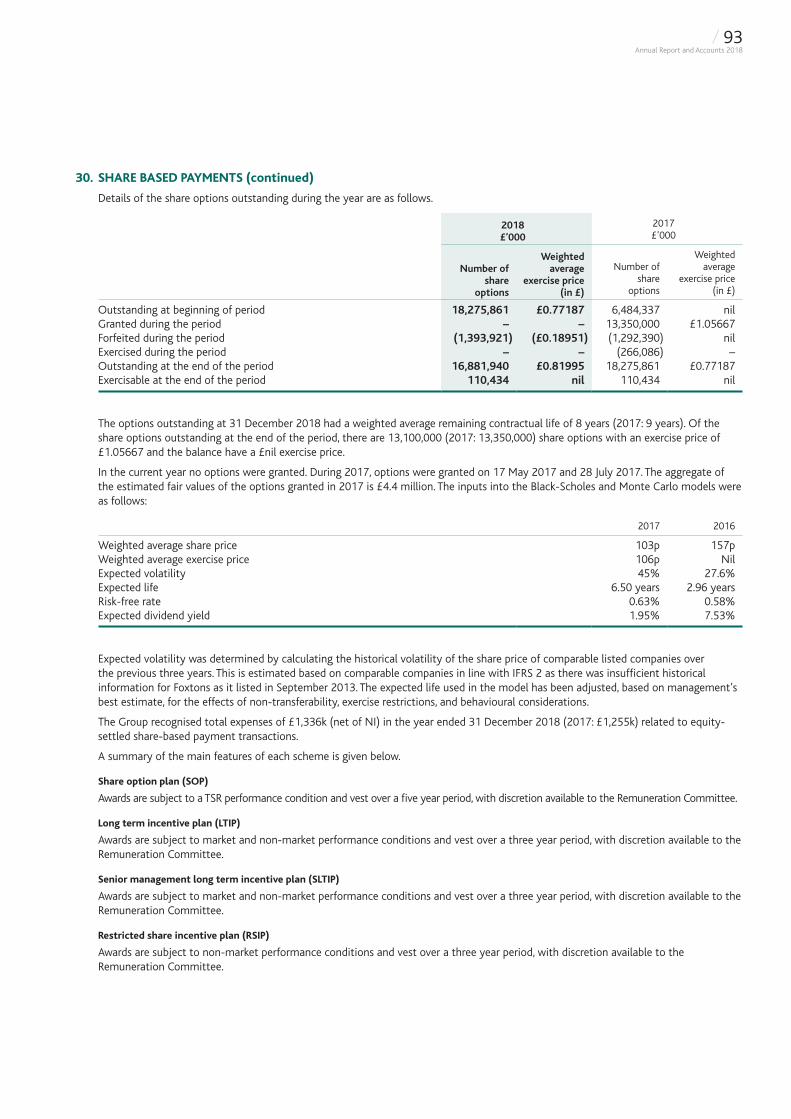
30. SHARE BASED PAYMENTS (continued)
Details of the share options outstanding during the year are as follows.
2018 £’000
2017 £’000
Number of share
options
Weighted average
exercise price (in £)
Number of share
options
Weighted average
exercise price (in £)
Outstanding at beginning of period 18,275,861 £0.77187 6,484,337 nilGranted during the period – – 13,350,000 £1.05667Forfeited during the period (1,393,921) (£0.18951) (1,292,390) nilExercised during the period – – (266,086) –Outstanding at the end of the period 16,881,940 £0.81995 18,275,861 £0.77187Exercisable at the end of the period 110,434 nil 110,434 nil
The options outstanding at 31 December 2018 had a weighted average remaining contractual life of 8 years (2017: 9 years). Of the share options outstanding at the end of the period, there are 13,100,000 (2017: 13,350,000) share options with an exercise price of £1.05667 and the balance have a £nil exercise price.
In the current year no options were granted. During 2017, options were granted on 17 May 2017 and 28 July 2017. The aggregate of the estimated fair values of the options granted in 2017 is £4.4 million. The inputs into the Black-Scholes and Monte Carlo models were as follows:
2017 2016
Weighted average share price 103p 157pWeighted average exercise price 106p NilExpected volatility 45% 27.6%Expected life 6.50 years 2.96 yearsRisk-free rate 0.63% 0.58%Expected dividend yield 1.95% 7.53%
Expected volatility was determined by calculating the historical volatility of the share price of comparable listed companies over the previous three years. This is estimated based on comparable companies in line with IFRS 2 as there was insufficient historical information for Foxtons as it listed in September 2013. The expected life used in the model has been adjusted, based on management’s best estimate, for the effects of non-transferability, exercise restrictions, and behavioural considerations.
The Group recognised total expenses of £1,336k (net of NI) in the year ended 31 December 2018 (2017: £1,255k) related to equity-settled share-based payment transactions.
A summary of the main features of each scheme is given below.
Share option plan (SOP)
Awards are subject to a TSR performance condition and vest over a five year period, with discretion available to the Remuneration Committee.
Long term incentive plan (LTIP)
Awards are subject to market and non-market performance conditions and vest over a three year period, with discretion available to the Remuneration Committee.
Senior management long term incentive plan (SLTIP)
Awards are subject to market and non-market performance conditions and vest over a three year period, with discretion available to the Remuneration Committee.
Restricted share incentive plan (RSIP)
Awards are subject to non-market performance conditions and vest over a three year period, with discretion available to the Remuneration Committee.
/ 93Annual Report and Accounts 2018
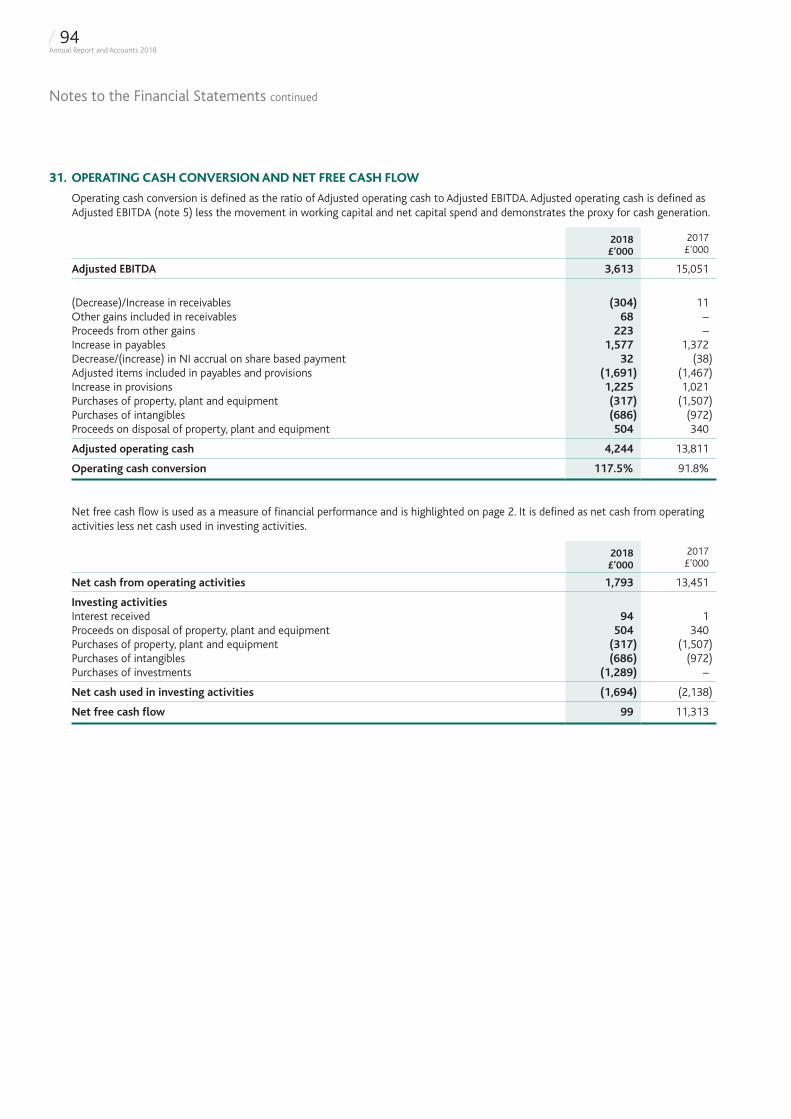
Notes to the Financial Statements continued
31. OPERATING CASH CONVERSION AND NET FREE CASH FLOW
Operating cash conversion is defined as the ratio of Adjusted operating cash to Adjusted EBITDA. Adjusted operating cash is defined as Adjusted EBITDA (note 5) less the movement in working capital and net capital spend and demonstrates the proxy for cash generation.
2018 £’000
2017 £’000
Adjusted EBITDA 3,613 15,051
(Decrease)/Increase in receivables (304) 11Other gains included in receivables 68 –Proceeds from other gains 223 –Increase in payables 1,577 1,372Decrease/(increase) in NI accrual on share based payment 32 (38)Adjusted items included in payables and provisions (1,691) (1,467)Increase in provisions 1,225 1,021Purchases of property, plant and equipment (317) (1,507)Purchases of intangibles (686) (972)Proceeds on disposal of property, plant and equipment 504 340
Adjusted operating cash 4,244 13,811
Operating cash conversion 117.5% 91.8%
Net free cash flow is used as a measure of financial performance and is highlighted on page 2. It is defined as net cash from operating activities less net cash used in investing activities.
2018 £’000
2017 £’000
Net cash from operating activities 1,793 13,451
Investing activitiesInterest received 94 1Proceeds on disposal of property, plant and equipment 504 340Purchases of property, plant and equipment (317) (1,507)Purchases of intangibles (686) (972)Purchases of investments (1,289) –
Net cash used in investing activities (1,694) (2,138)
Net free cash flow 99 11,313
/ 94Annual Report and Accounts 2018
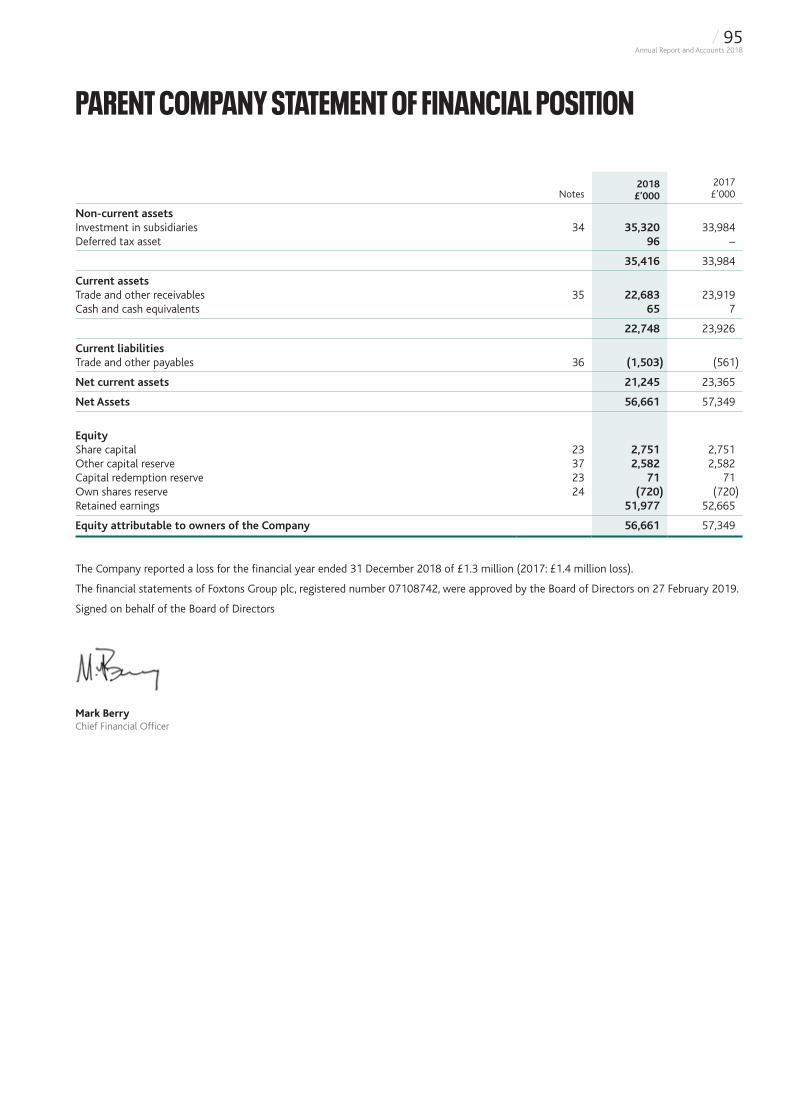
Notes2018 £’000
2017 £’000
Non-current assetsInvestment in subsidiaries 34 35,320 33,984Deferred tax asset 96 –
35,416 33,984
Current assetsTrade and other receivables 35 22,683 23,919Cash and cash equivalents 65 7
22,748 23,926
Current liabilitiesTrade and other payables 36 (1,503) (561)
Net current assets 21,245 23,365
Net Assets 56,661 57,349
EquityShare capital 23 2,751 2,751Other capital reserve 37 2,582 2,582Capital redemption reserve 23 71 71Own shares reserve 24 (720) (720)Retained earnings 51,977 52,665
Equity attributable to owners of the Company 56,661 57,349
The Company reported a loss for the financial year ended 31 December 2018 of £1.3 million (2017: £1.4 million loss).
The financial statements of Foxtons Group plc, registered number 07108742, were approved by the Board of Directors on 27 February 2019.
Signed on behalf of the Board of Directors
Mark BerryChief Financial Officer
PARENT COMPANY STATEMENT OF FINANCIAL POSITION
/ 95Annual Report and Accounts 2018
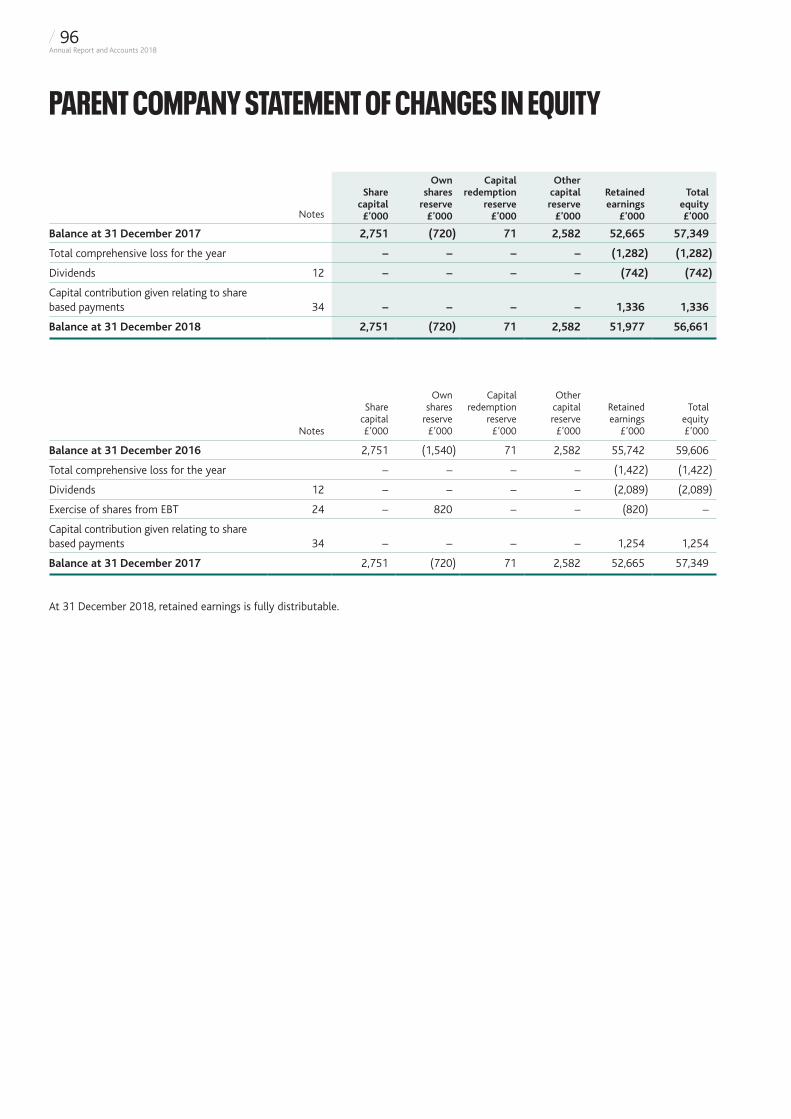
Notes
Share capital £’000
Own shares
reserve £’000
Capital redemption
reserve £’000
Other capital reserve
£’000
Retained earnings
£’000
Total equity £’000
Balance at 31 December 2017 2,751 (720) 71 2,582 52,665 57,349
Total comprehensive loss for the year – – – – (1,282) (1,282)
Dividends 12 – – – – (742) (742)
Capital contribution given relating to share based payments 34 – – – – 1,336 1,336
Balance at 31 December 2018 2,751 (720) 71 2,582 51,977 56,661
Notes
Share capital £’000
Own shares
reserve £’000
Capital redemption
reserve £’000
Other capital reserve
£’000
Retained earnings
£’000
Total equity £’000
Balance at 31 December 2016 2,751 (1,540) 71 2,582 55,742 59,606
Total comprehensive loss for the year – – – – (1,422) (1,422)
Dividends 12 – – – – (2,089) (2,089)
Exercise of shares from EBT 24 – 820 – – (820) –
Capital contribution given relating to share based payments 34 – – – – 1,254 1,254
Balance at 31 December 2017 2,751 (720) 71 2,582 52,665 57,349
At 31 December 2018, retained earnings is fully distributable.
PARENT COMPANY STATEMENT OF CHANGES IN EQUITY
/ 96Annual Report and Accounts 2018
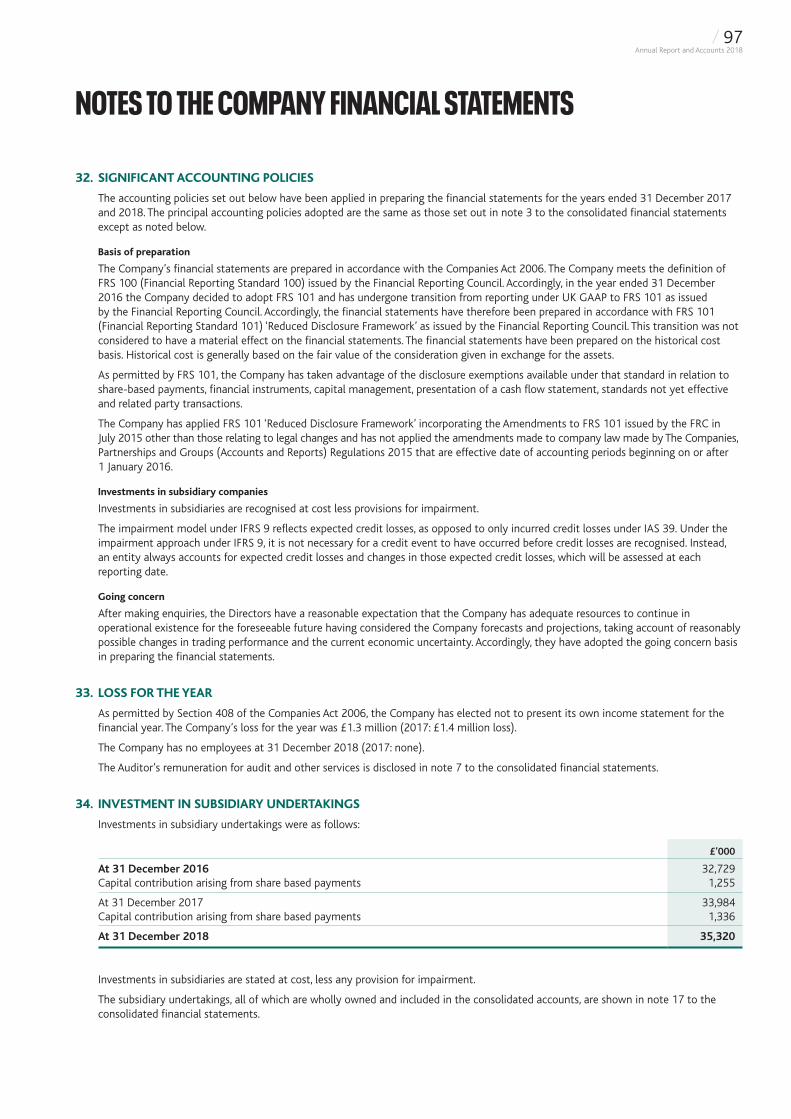
32. SIGNIFICANT ACCOUNTING POLICIES
The accounting policies set out below have been applied in preparing the financial statements for the years ended 31 December 2017 and 2018. The principal accounting policies adopted are the same as those set out in note 3 to the consolidated financial statements except as noted below.
Basis of preparation
The Company’s financial statements are prepared in accordance with the Companies Act 2006. The Company meets the definition of FRS 100 (Financial Reporting Standard 100) issued by the Financial Reporting Council. Accordingly, in the year ended 31 December 2016 the Company decided to adopt FRS 101 and has undergone transition from reporting under UK GAAP to FRS 101 as issued by the Financial Reporting Council. Accordingly, the financial statements have therefore been prepared in accordance with FRS 101 (Financial Reporting Standard 101) ‘Reduced Disclosure Framework’ as issued by the Financial Reporting Council. This transition was not considered to have a material effect on the financial statements. The financial statements have been prepared on the historical cost basis. Historical cost is generally based on the fair value of the consideration given in exchange for the assets.
As permitted by FRS 101, the Company has taken advantage of the disclosure exemptions available under that standard in relation to share-based payments, financial instruments, capital management, presentation of a cash flow statement, standards not yet effective and related party transactions.
The Company has applied FRS 101 ‘Reduced Disclosure Framework’ incorporating the Amendments to FRS 101 issued by the FRC in July 2015 other than those relating to legal changes and has not applied the amendments made to company law made by The Companies, Partnerships and Groups (Accounts and Reports) Regulations 2015 that are effective date of accounting periods beginning on or after 1 January 2016.
Investments in subsidiary companies
Investments in subsidiaries are recognised at cost less provisions for impairment.
The impairment model under IFRS 9 reflects expected credit losses, as opposed to only incurred credit losses under IAS 39. Under the impairment approach under IFRS 9, it is not necessary for a credit event to have occurred before credit losses are recognised. Instead, an entity always accounts for expected credit losses and changes in those expected credit losses, which will be assessed at each reporting date.
Going concern
After making enquiries, the Directors have a reasonable expectation that the Company has adequate resources to continue in operational existence for the foreseeable future having considered the Company forecasts and projections, taking account of reasonably possible changes in trading performance and the current economic uncertainty. Accordingly, they have adopted the going concern basis in preparing the financial statements.
33. LOSS FOR THE YEAR
As permitted by Section 408 of the Companies Act 2006, the Company has elected not to present its own income statement for the financial year. The Company’s loss for the year was £1.3 million (2017: £1.4 million loss).
The Company has no employees at 31 December 2018 (2017: none).
The Auditor’s remuneration for audit and other services is disclosed in note 7 to the consolidated financial statements.
34. INVESTMENT IN SUBSIDIARY UNDERTAKINGS
Investments in subsidiary undertakings were as follows:
£’000
At 31 December 2016 32,729Capital contribution arising from share based payments 1,255
At 31 December 2017 33,984Capital contribution arising from share based payments 1,336
At 31 December 2018 35,320
Investments in subsidiaries are stated at cost, less any provision for impairment.
The subsidiary undertakings, all of which are wholly owned and included in the consolidated accounts, are shown in note 17 to the consolidated financial statements.
NOTES TO THE COMPANY FINANCIAL STATEMENTS
/ 97Annual Report and Accounts 2018
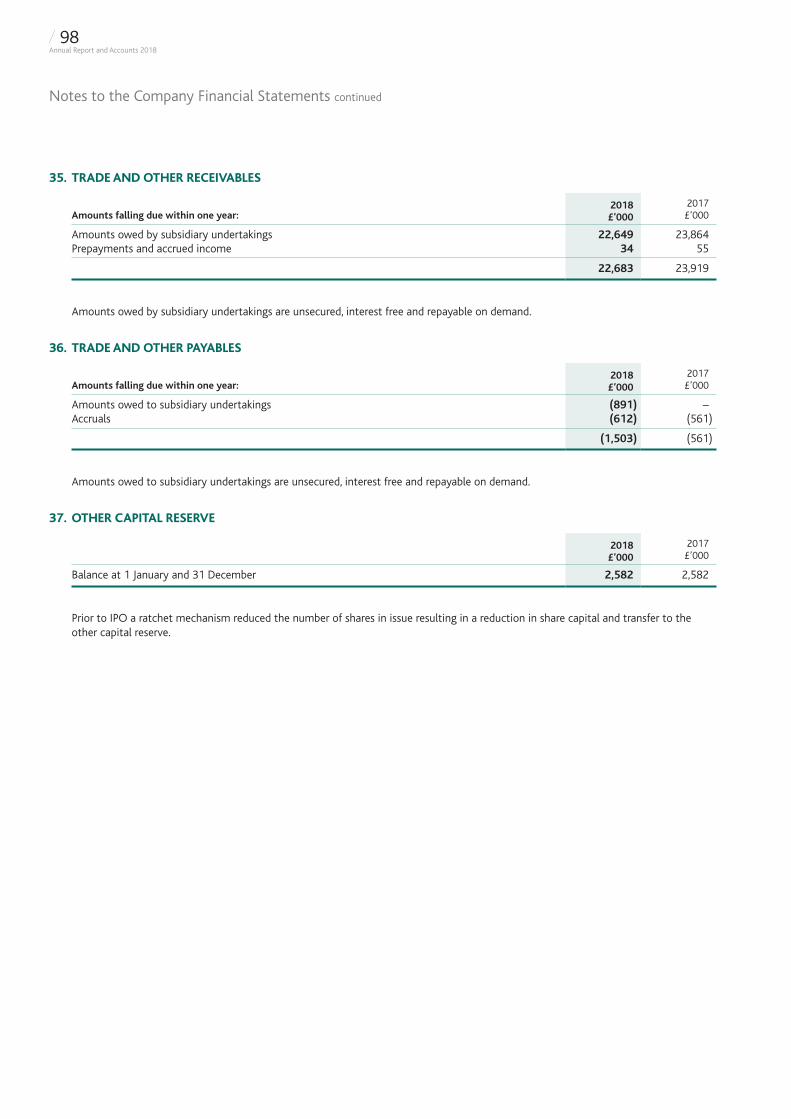
35. TRADE AND OTHER RECEIVABLES
Amounts falling due within one year:2018 £’000
2017 £’000
Amounts owed by subsidiary undertakings 22,649 23,864Prepayments and accrued income 34 55
22,683 23,919
Amounts owed by subsidiary undertakings are unsecured, interest free and repayable on demand.
36. TRADE AND OTHER PAYABLES
Amounts falling due within one year:2018 £’000
2017 £’000
Amounts owed to subsidiary undertakings (891) –Accruals (612) (561)
(1,503) (561)
Amounts owed to subsidiary undertakings are unsecured, interest free and repayable on demand.
37. OTHER CAPITAL RESERVE
2018 £’000
2017 £’000
Balance at 1 January and 31 December 2,582 2,582
Prior to IPO a ratchet mechanism reduced the number of shares in issue resulting in a reduction in share capital and transfer to the other capital reserve.
Notes to the Company Financial Statements continued
/ 98Annual Report and Accounts 2018
Report on the audit of the financial statements
Opinion
In our opinion:
• the financial statements of Foxtons Group plc (the ‘parent company’) and its subsidiaries (the ‘Group’) give a true and fair view of the state of the Group’s and of the parent company’s affairs as at 31 December 2018 and of the Group’s loss for the year then ended;
• the Group financial statements have been properly prepared in accordance with International Financial Reporting Standards (IFRSs) as adopted by the European Union;
• the parent company financial statements have been properly prepared in accordance with United Kingdom Generally Accepted Accounting Practice, including Financial Reporting Standard 101 “Reduced Disclosure Framework”; and
• the financial statements have been prepared in accordance with the requirements of the Companies Act 2006 and, as regards the Group financial statements, Article 4 of the IAS Regulation.
We have audited the financial statements which comprise:
• the consolidated statement of comprehensive income;
• the consolidated and parent company statements of financial position;
• the consolidated and parent company statements of changes in equity;
• the consolidated cash flow statement; and
• the related notes 1 to 37.
The financial reporting framework that has been applied in the preparation of the Group financial statements is applicable law and IFRSs as adopted by the European Union. The financial reporting framework that has been applied in the preparation of the parent company financial statements is applicable law and United Kingdom Accounting Standards, including FRS 101 “Reduced Disclosure Framework” (United Kingdom Generally Accepted Accounting Practice).
Basis for opinion
We conducted our audit in accordance with International Standards on Auditing (UK) (ISAs (UK)) and applicable law. Our responsibilities under those standards are further described in the auditor’s responsibilities for the audit of the financial statements section of our report.
We are independent of the Group and the parent company in accordance with the ethical requirements that are relevant to our audit of the financial statements in the UK, including the Financial Reporting Council’s (the ‘FRC’s’) Ethical Standard as applied to listed public interest entities, and we have fulfilled our other ethical responsibilities in accordance with these requirements. We confirm that the non-audit services prohibited by the FRC’s Ethical Standard were not provided to the Group or the parent company.
We believe that the audit evidence we have obtained is sufficient and appropriate to provide a basis for our opinion.
Summary of our audit approach
Key audit matters
The key audit matters that we identified in the current year were:
• Impairment of goodwill and other intangible assets ; and
• Adjusted items
Within this report, any new key audit matters are identified with and any key audit matters which are the same as the prior year identified with .
Materiality The materiality that we used for the Group financial statements was £1.1m which was determined on the basis of 5% of the Group’s average profit before tax, before non-adjusting items, over a five year period (2014 – 2018).
Scoping Our Group audit scope covers 100% of the Group companies, with each entity audited to a statutory materiality appropriate for the individual entity.
Significant changes in our approach
In the current year we have identified Adjusted Items as being a key audit matter due to heightened risk around these charges.
INDEPENDENT AUDITOR’S REPORT TO THE MEMBERS OF FOXTONS GROUP PLC
/ 99Annual Report and Accounts 2018
Independent Auditor’s Report to the Members of Foxtons Group plc continued
Conclusions relating to going concern, principal risks and viability statement
Going concern
We have reviewed the directors’ statement in note 3 to the financial statements about whether they considered it appropriate to adopt the going concern basis of accounting in preparing them and their identification of any material uncertainties to the Group’s and company’s ability to continue to do so over a period of at least twelve months from the date of approval of the financial statements.
We considered as part of our risk assessment the nature of the Group, its business model and related risks including where relevant the impact of Brexit, the requirements of the applicable financial reporting framework and the system of internal control. We evaluated the directors’ assessment of the Group’s ability to continue as a going concern, including challenging the underlying data and key assumptions used to make the assessment, and evaluated the directors’ plans for future actions in relation to their going concern assessment.
We are required to state whether we have anything material to add or draw attention to in relation to that statement required by Listing Rule 9.8.6R(3) and report if the statement is materially inconsistent with our knowledge obtained in the audit.
We confirm that we have nothing material to report, add or draw attention to in respect of these matters.
Principal risks and viability statement
Based solely on reading the directors’ statements and considering whether they were consistent with the knowledge we obtained in the course of the audit, including the knowledge obtained in the evaluation of the directors’ assessment of the Group’s and the company’s ability to continue as a going concern, we are required to state whether we have anything material to add or draw attention to in relation to:
• the disclosures on pages 24 to 27 that describe the principal risks and explain how they are being managed or mitigated;
• the directors’ confirmation on page 41 that they have carried out a robust assessment of the principal risks facing the Group, including those that would threaten its business model, future performance, solvency or liquidity; or
• the directors’ explanation on page 28 as to how they have assessed the prospects of the Group, over what period they have done so and why they consider that period to be appropriate, and their statement as to whether they have a reasonable expectation that the Group will be able to continue in operation and meet its liabilities as they fall due over the period of their assessment, including any related disclosures drawing attention to any necessary qualifications or assumptions.
We are also required to report whether the directors’ statement relating to the prospects of the Group required by Listing Rule 9.8.6R(3) is materially inconsistent with our knowledge obtained in the audit.
We confirm that we have nothing material to report, add or draw attention to in respect of these matters.
/ 100Annual Report and Accounts 2018
Key audit matters
Key audit matters are those matters that, in our professional judgement, were of most significance in our audit of the financial statements of the current period and include the most significant assessed risks of material misstatement (whether or not due to fraud) that we identified. These matters included those which had the greatest effect on: the overall audit strategy, the allocation of resources in the audit; and directing the efforts of the engagement team.
These matters were addressed in the context of our audit of the financial statements as a whole, and in forming our opinion thereon, and we do not provide a separate opinion on these matters.
Impairment of goodwill and other intangible assets
Key audit matter description
The carrying value of the Group’s goodwill and other intangible assets as at 31 December 2018 totalled £110.8m (2017: £120.1 million), of which £99.0 million (2017: £99.0 million) relates to the Foxtons brand. In combination, these assets represent 89% (2017: 85%) of the Group’s net asset value.
Assessment of impairment of goodwill and other intangible assets is a process involving key sources of estimation uncertainty, which requires consideration of the value in use of the cash generating units (the Sales and Lettings businesses). Calculating the value in use requires estimates of future cash flows of these businesses and associated discount rates and growth rates. Due to the extension in the expected timing of market recovery in the current economic environment, the length of the forecast period has been extended from three to five years.
As a result of the prolonged nature of the downturn in the sales market the goodwill allocated to the sales segment of £9.8m has been fully impaired.
The weak sales market has also resulted in a reduction in the headroom available on the brand asset and has increased the sensitivity of the headroom to the lettings growth plan.
Given the significant level of estimation uncertainty, we identified the assessment of impairment of goodwill and other intangible assets as a potential fraud risk area.
Further information in this area is discussed in the Audit Committee report on page 46, the significant accounting policies in note 3, critical accounting judgements and key sources of estimation uncertainty in note 4 and the disclosures in note 14.
How the scope of our audit responded to the key audit matter
We have challenged management’s key assumptions relating to the estimated future cash flows, growth rates and the discount rate applied through assessment of cash flow forecasts against historical performance and forecast accuracy and consideration of available third party market forecast data.
The assumptions that underpin management’s sales recovery and lettings growth plan are inherently judgemental. Our audit work therefore assessed the reasonableness of management’s key assumptions regarding growth rates and discount rates when calculating the headroom on the brand asset intangible.
Specifically our work included but was not limited to:
• benchmarking the five year forecast growth in sales and lettings through comparison to industry expert forecasts and historic external and internal data;
• testing whether the impact of recent legislation and economic uncertainty is appropriately included in the model;
• challenge of management to demonstrate the impact of the investments made in their service offering;
• consideration of the long term growth rate in light of historic and macro-economic trading performance in the UK;
• using our valuation specialists to produce an independent benchmark calculation of the discount rate against which we assessed management’s assumptions; and
• consideration of evidence of management bias in the assumptions used and the application of professional scepticism to address the risk of fraud.
We also considered the appropriateness of the sensitivities applied by management, recalculated the headroom available under the sensitised positions and assessed the associated disclosures in the financial statements in relation to the impairment review.
Key observations Based upon the work performed, we concur with the Directors’ conclusions that the carrying value of the sales goodwill is fully impaired and that the carrying values of the lettings goodwill and the brand asset are appropriate.
We are satisfied that the key assumptions management used to calculate the value in use of the brand asset fall within a reasonable range and that the value in use supports the carrying value. Whilst headroom exists over the carrying value of the brand asset, this is highly sensitive to the forecast growth and performance of the lettings business.
The disclosures made in this respect in Note 14 to the financial statements are appropriate.
/ 101Annual Report and Accounts 2018
Independent Auditor’s Report to the Members of Foxtons Group plc continued
Adjusted Items
Key audit matter description
The Group has recognised £15.7 million (2017: £2.3 million) of adjusted items, including the sales goodwill impairment of £9.8 million, which have been excluded from Adjusted EBITDA of £3.6 million (2017: £15.1 million).
In Q4 2018 management announced the closure of six branches which was completed by 31 December 2018. Property restructuring costs of £2.5 million have been recognised, based on the assumption that it will take an average of three years to exit the leases. A further £2.7 million of branch assets have been impaired, and an additional £0.7m of reorganisation costs have been incurred.
There continues to be challenge and focus by the FRC on the presentation of non-GAAP measures and adjusted performance measures (APMs). We have identified a key audit matter in relation to the valuation and classification of adjusted items, due to the quantum of the adjusted items in the current year and the level of management judgement required to estimate the costs associated with onerous leases. Given the level of management judgement involved, we identify this key audit matter as a potential fraud risk area.
Further information in this area is discussed in the significant accounting policies in note 3 and the disclosures in note 9.
How the scope of our audit responded to the key audit matter
We evaluated the Group’s accounting policy for Adjusted items against guidance issued by the FRC and European Securities and Markets Authority (ESMA) regarding the publication of transparent, unbiased and comparable financial information.
We considered management’s rationale for the treatment of Adjusted items and performed our own independent assessment of the selection and presentation of each item against the Group’s accounting policies and relevant regulatory guidance.
Our work on the valuation of the Adjusted items included but was not limited to:
• obtaining evidence of the value of termination payments and property costs;
• discussing the basis of the onerous lease provisions with a third party property consultant;
• challenging management as to the timing and cost of expected lease exits; and
• agreement to carrying value of assets written off including sales goodwill.
We reviewed the presentation and disclosure of these items in the Financial Statements to assess whether the disclosure is consistent with the Group’s policy, in line with FRC and ESMA guidance, and understandable to readers.
Key observations We are satisfied that the amounts presented as Adjusted items in the Financial Statements are in compliance with the Group’s accounting policies, which have been applied consistently with prior periods and that disclosure is appropriate.
/ 102Annual Report and Accounts 2018
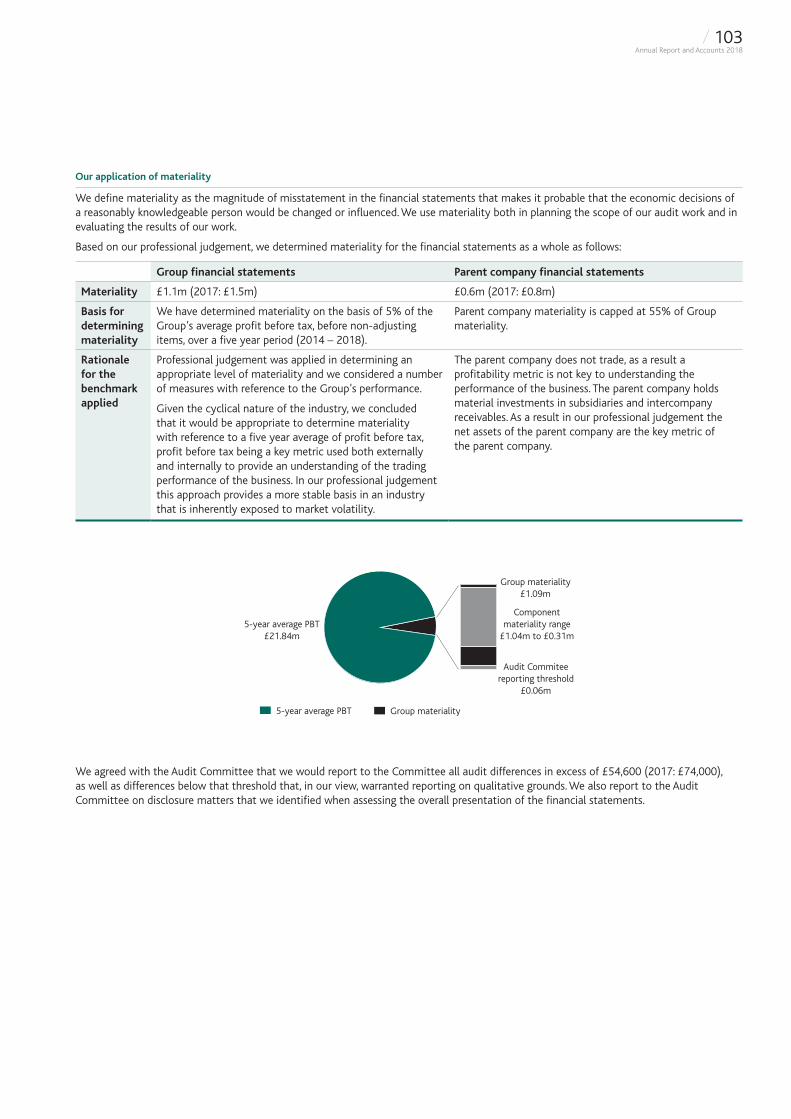
Our application of materiality
We define materiality as the magnitude of misstatement in the financial statements that makes it probable that the economic decisions of a reasonably knowledgeable person would be changed or influenced. We use materiality both in planning the scope of our audit work and in evaluating the results of our work.
Based on our professional judgement, we determined materiality for the financial statements as a whole as follows:
Group financial statements Parent company financial statements
Materiality £1.1m (2017: £1.5m) £0.6m (2017: £0.8m)
Basis for determining materiality
We have determined materiality on the basis of 5% of the Group’s average profit before tax, before non-adjusting items, over a five year period (2014 – 2018).
Parent company materiality is capped at 55% of Group materiality.
Rationale for the benchmark applied
Professional judgement was applied in determining an appropriate level of materiality and we considered a number of measures with reference to the Group’s performance.
Given the cyclical nature of the industry, we concluded that it would be appropriate to determine materiality with reference to a five year average of profit before tax, profit before tax being a key metric used both externally and internally to provide an understanding of the trading performance of the business. In our professional judgement this approach provides a more stable basis in an industry that is inherently exposed to market volatility.
The parent company does not trade, as a result a profitability metric is not key to understanding the performance of the business. The parent company holds material investments in subsidiaries and intercompany receivables. As a result in our professional judgement the net assets of the parent company are the key metric of the parent company.
Group materiality£1.09m
Componentmateriality range
£1.04m to £0.31m
Audit Commiteereporting threshold
£0.06m
5-year average PBT£21.84m
Group materiality5-year average PBT
We agreed with the Audit Committee that we would report to the Committee all audit differences in excess of £54,600 (2017: £74,000), as well as differences below that threshold that, in our view, warranted reporting on qualitative grounds. We also report to the Audit Committee on disclosure matters that we identified when assessing the overall presentation of the financial statements.
/ 103Annual Report and Accounts 2018
Independent Auditor’s Report to the Members of Foxtons Group plc continued
An overview of the scope of our audit
• Our Group audit scope covers 100% (2017: 100%) of the Group companies, all of which are UK legal entities, with the full scope of audit procedures performed entirely by the central audit team. We used a statutory materiality appropriate for each entity, which was lower than Group materiality and ranged from £0.3 million to £1.0 million (2017: £0.1 million to £1.4 million). At the parent company level, we also tested the consolidation process.
Other information
The directors are responsible for the other information. The other information comprises the information included in the annual report, other than the financial statements and our auditor’s report thereon.
Our opinion on the financial statements does not cover the other information and, except to the extent otherwise explicitly stated in our report, we do not express any form of assurance conclusion thereon.
In connection with our audit of the financial statements, our responsibility is to read the other information and, in doing so, consider whether the other information is materially inconsistent with the financial statements or our knowledge obtained in the audit or otherwise appears to be materially misstated.
If we identify such material inconsistencies or apparent material misstatements, we are required to determine whether there is a material misstatement in the financial statements or a material misstatement of the other information. If, based on the work we have performed, we conclude that there is a material misstatement of this other information, we are required to report that fact.
In this context, matters that we are specifically required to report to you as uncorrected material misstatements of the other information include where we conclude that:
• Fair, balanced and understandable – the statement given by the directors that they consider the annual report and financial statements taken as a whole is fair, balanced and understandable and provides the information necessary for shareholders to assess the Group’s position and performance, business model and strategy, is materially inconsistent with our knowledge obtained in the audit; or
• Audit committee reporting – the section describing the work of the audit committee does not appropriately address matters communicated by us to the audit committee; or
• Directors’ statement of compliance with the UK Corporate Governance Code – the parts of the directors’ statement required under the Listing Rules relating to the company’s compliance with the UK Corporate Governance Code containing provisions specified for review by the auditor in accordance with Listing Rule 9.8.10R(2) do not properly disclose a departure from a relevant provision of the UK Corporate Governance Code.
We have nothing to report in respect of these matters.
Responsibilities of directors
As explained more fully in the directors’ responsibilities statement, the directors are responsible for the preparation of the financial statements and for being satisfied that they give a true and fair view, and for such internal control as the directors determine is necessary to enable the preparation of financial statements that are free from material misstatement, whether due to fraud or error.
In preparing the financial statements, the directors are responsible for assessing the Group’s and the parent company’s ability to continue as a going concern, disclosing as applicable, matters related to going concern and using the going concern basis of accounting unless the directors either intend to liquidate the Group or the parent company or to cease operations, or have no realistic alternative but to do so.
/ 104Annual Report and Accounts 2018
Auditor’s responsibilities for the audit of the financial statements
Our objectives are to obtain reasonable assurance about whether the financial statements as a whole are free from material misstatement, whether due to fraud or error, and to issue an auditor’s report that includes our opinion. Reasonable assurance is a high level of assurance, but is not a guarantee that an audit conducted in accordance with ISAs (UK) will always detect a material misstatement when it exists. Misstatements can arise from fraud or error and are considered material if, individually or in the aggregate, they could reasonably be expected to influence the economic decisions of users taken on the basis of these financial statements.
Details of the extent to which the audit was considered capable of detecting irregularities, including fraud are set out below.
A further description of our responsibilities for the audit of the financial statements is located on the FRC’s website at: www.frc.org.uk/auditorsresponsibilities. This description forms part of our auditor’s report.
Extent to which the audit was considered capable of detecting irregularities, including fraud
We identify and assess the risks of material misstatement of the financial statements, whether due to fraud or error, and then design and perform audit procedures responsive to those risks, including obtaining audit evidence that is sufficient and appropriate to provide a basis for our opinion.
Identifying and assessing potential risks related to irregularities
In identifying and assessing risks of material misstatement in respect of irregularities, including fraud and non-compliance with laws and regulations, our procedures included the following:
• enquiring of management and the audit committee, including obtaining and reviewing supporting documentation, concerning the Group’s policies and procedures relating to:
− identifying, evaluating and complying with laws and regulations and whether they were aware of any instances of non-compliance;
− detecting and responding to the risks of fraud and whether they have knowledge of any actual, suspected or alleged fraud; and
− the internal controls established to mitigate risks related to fraud or non-compliance with laws and regulations.
• discussing among the engagement team and involving relevant internal specialists, including tax and IT, regarding how and where fraud might occur in the financial statements and any potential indicators of fraud. As part of this discussion, we identified potential for fraud in the following areas: Impairment of goodwill and other intangible assets and Adjusted items; and
• obtaining an understanding of the legal and regulatory frameworks that the Group operates in, focusing on those laws and regulations that had a direct effect on the financial statements or that had a fundamental effect on the operations of the Group. The key laws and regulations we considered in this context included the UK Companies Act 2006, the UK Corporate Governance Code, the Listing Rules of the UK Listing Authority, the relevant tax compliance regulations, compliance with Financial Conduct Authority regulations, the Estate Agents Act 1979, Money Laundering Regulations 2007 and Proceeds of Crime Act, the Data Protection Act 2018, and the newly established EU Insurance Distribution Directive.
Audit response to risks identified
As a result of performing the above, we identified Impairment of goodwill and other intangible assets and Adjusted items as key audit matters. The key audit matters section of our report explains the matters in more detail and also describes the specific procedures we performed in response to those key audit matters.
In addition to the above, our procedures to respond to risks identified included the following:
• reviewing the financial statement disclosures and testing to supporting documentation to assess compliance with relevant laws and regulations discussed above;
• enquiring of management, the audit committee and in-house legal counsel concerning actual and potential litigation and claims;
• performing analytical procedures to identify any unusual or unexpected relationships that may indicate risks of material misstatement due to fraud;
• reading minutes of meetings of those charged with governance and reviewing correspondence with HMRC and the FCA; and
• in addressing the risk of fraud through management override of controls, testing the appropriateness of journal entries and other adjustments; assessing whether the judgements made in making accounting estimates are indicative of a potential bias; and evaluating the business rationale of any significant transactions that are unusual or outside the normal course of business.
We also communicated relevant identified laws and regulations and potential fraud risks to all engagement team members including internal specialists, and remained alert to any indications of fraud or non-compliance with laws and regulations throughout the audit.
/ 105Annual Report and Accounts 2018
Independent Auditor’s Report to the Members of Foxtons Group plc continued
Report on other legal and regulatory requirements
Opinions on other matters prescribed by the Companies Act 2006
In our opinion the part of the directors’ remuneration report to be audited has been properly prepared in accordance with the Companies Act 2006.
In our opinion, based on the work undertaken in the course of the audit:
• the information given in the strategic report and the directors’ report for the financial year for which the financial statements are prepared is consistent with the financial statements; and
• the strategic report and the directors’ report have been prepared in accordance with applicable legal requirements.
In the light of the knowledge and understanding of the Group and of the parent company and their environment obtained in the course of the audit, we have not identified any material misstatements in the strategic report or the directors’ report.
Matters on which we are required to report by exception
Adequacy of explanations received and accounting records
Under the Companies Act 2006 we are required to report to you if, in our opinion:
• we have not received all the information and explanations we require for our audit; or
• adequate accounting records have not been kept by the parent company, or returns adequate for our audit have not been received from branches not visited by us; or
• the parent company financial statements are not in agreement with the accounting records and returns.
We have nothing to report in respect of these matters.
Directors’ remuneration
Under the Companies Act 2006 we are also required to report if in our opinion certain disclosures of directors’ remuneration have not been made or the part of the directors’ remuneration report to be audited is not in agreement with the accounting records and returns.
We have nothing to report in respect of these matters.
Other matters
Auditor tenure
Following the recommendation of the audit committee, we were appointed by the Company to audit the financial statements for the year ending 31 December 2009 and subsequent financial periods. The period of total uninterrupted engagement including previous renewals and reappointments of the firm is 10 years, covering the years ending 31 December 2009 to 31 December 2018.
Consistency of the audit report with the additional report to the audit committee
Our audit opinion is consistent with the additional report to the audit committee we are required to provide in accordance with ISAs (UK).
Use of our report
This report is made solely to the company’s members, as a body, in accordance with Chapter 3 of Part 16 of the Companies Act 2006. Our audit work has been undertaken so that we might state to the company’s members those matters we are required to state to them in an auditor’s report and for no other purpose. To the fullest extent permitted by law, we do not accept or assume responsibility to anyone other than the company and the company’s members as a body, for our audit work, for this report, or for the opinions we have formed.
Claire Faulkner (Senior statutory auditor)for and on behalf of Deloitte LLP Statutory Auditor London, United Kingdom
27 February 2018
/ 106Annual Report and Accounts 2018
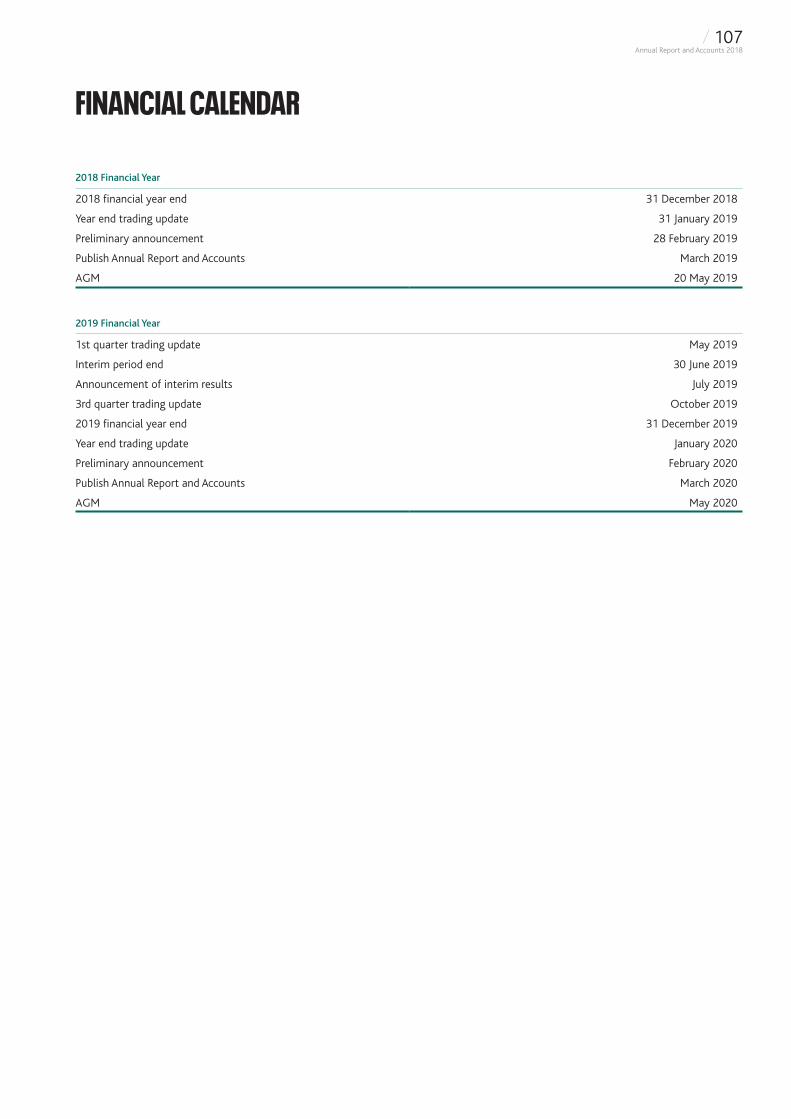
2018 Financial Year
2018 financial year end 31 December 2018
Year end trading update 31 January 2019
Preliminary announcement 28 February 2019
Publish Annual Report and Accounts March 2019
AGM 20 May 2019
2019 Financial Year
1st quarter trading update May 2019
Interim period end 30 June 2019
Announcement of interim results July 2019
3rd quarter trading update October 2019
2019 financial year end 31 December 2019
Year end trading update January 2020
Preliminary announcement February 2020
Publish Annual Report and Accounts March 2020
AGM May 2020
FINANCIAL CALENDAR
/ 107Annual Report and Accounts 2018

This report is printed on paper certified in accordance with the FSC® (Forest Stewardship Council®) and is recyclable and acid-free.
Pureprint Ltd is FSC certified and ISO 14001 certified showing that it is committed to all round excellence and improving environmental performance is an important part of this strategy.
Pureprint Ltd aims to reduce at source the effect its operations have on the environment and is committed to continual improvement, prevention of pollution and compliance with any legislation or industry standards.
Pureprint Ltd is a Carbon / Neutral® Printing Company.
Designed and produced by MAGEE www.magee.co.uk


London’s Estate Agent
Foxtons Group plc Building One Chiswick Park 566 Chiswick High Road London W4 5BE
Foxtons Group plc
Annual Report and A
ccounts 2018


