156
2018 Annual Activity Report Annexes DG Regional and Urban Policy Ref. Ares(2019)3439066 - 27/05/2019
2018
Annual Activity Report
Annexes
DG Regional and
Urban Policy
Ref. Ares(2019)3439066 - 27/05/2019
1
regio_aar_2018_annexes
AAR ANNEXES - Table of Contents
ANNEX 1: Statement of the Director(s) in charge of Risk Management and
Internal Control ........................................................................... 2
ANNEX 2: Reporting – Human Resources, Information Management and
External Communication ............................................................... 3
ANNEX 3: Draft annual accounts and financial reports..................................... 9
ANNEX 4: Materiality criteria ...................................................................... 20
ANNEX 5: Relevant Control Systems Templates for budget implementation ...... 24
ANNEX 6: Implementation through national or international public-sector
bodies and bodies governed by private law with a public sector
mission ..................................................................................... 28
ANNEX 7: EAMR of the Union Delegations..................................................... 29
ANNEX 8: Decentralised agencies ................................................................ 30
ANNEX 9: Evaluations and other studies finalised or cancelled during the year .. 31
ANNEX 10: Specific annexes related to Financial Management .......................... 39
1.1.1. Fraud prevention and detection .................................................... 54
1.1.2. Audit observations and recommendations ...................................... 55
A. European Court of Auditors .......................................................................... 55
B. Internal Audit Service (IAS) ......................................................................... 59
1.1.3. Conclusions as regards assurance ................................................. 62
ANNEX 10A: List of Reservations in the AAR 2018 and Targeted Actions ................ 63
ANNEX 10B: 2014-2020 ERDF / CF Operational Programmes: Audit Opinion and
Error Rates ................................................................................ 68
ANNEX 10C: 2014-2020 ERDF / CF Operational Programmes: Typologies of
irregularities reported by Member States with the 2016-2017
assurance packages .................................................................... 95
ANNEX 10D: 2007-2013 ERDF / CF Operational Programmes: Error Rates ............ 98
ANNEX 10E: 2007-2013 ERDF / CF Operational Programmes: Financial
Corrections, Withdrawals and Recoveries ..................................... 109
ANNEX 10F: Closure 2007-2013: Financial Engineering Instruments (FEI) ........... 112
ANNEX 10G: Details about cost of controls ..................................................... 120
ANNEX 11: Specific annexes related to "Assessment of the effectiveness of the
internal control systems" ........................................................... 122
ANNEX 12A: Performance against Operational Priorities as per Management Plan
2018 ....................................................................................... 125
ANNEX 12B: Performance Tables - Policy ....................................................... 140
General objective 1 - A New Boost for Jobs, Growth and Investment ................... 140
General objective 2 - A Connected Digital Single Market .................................... 146
General objective 3 - A Resilient Energy Union with a Forward-Looking Climate
Change Policy .......................................................................... 147
General objective 4 - A Deeper and Fairer Internal Market with a Strengthened
Industrial Base ......................................................................... 149
General objective 8 - Towards a New Policy on Migration ................................... 152
ANNEX 13: Contribution of Cohesion Policy to Sustainable Development Goals
(SDGs) .................................................................................... 153
2 regio_aar_2018_annexes
ANNEX 1: Statement of the Director(s) in charge of Risk
Management and Internal Control
I declare that in accordance with the Commission’s communication on the internal control
framework1, I have reported my advice and recommendations on the overall state of internal
control in the DG to the Director-General.
I hereby certify that the information provided in the present Annual Activity Report and in its
annexes is, to the best of my knowledge, accurate and complete.
Brussels, 25 April 2019
Dana Spinant
“Signed”
1 C(2017)2373 of 19.04.2017.
regio_aar_2018_annexes
3
ANNEX 2: Reporting – Human Resources, Information
Management and External Communication
This annex is the annex of section 2.2 "Other organisational management dimensions".
Human resources
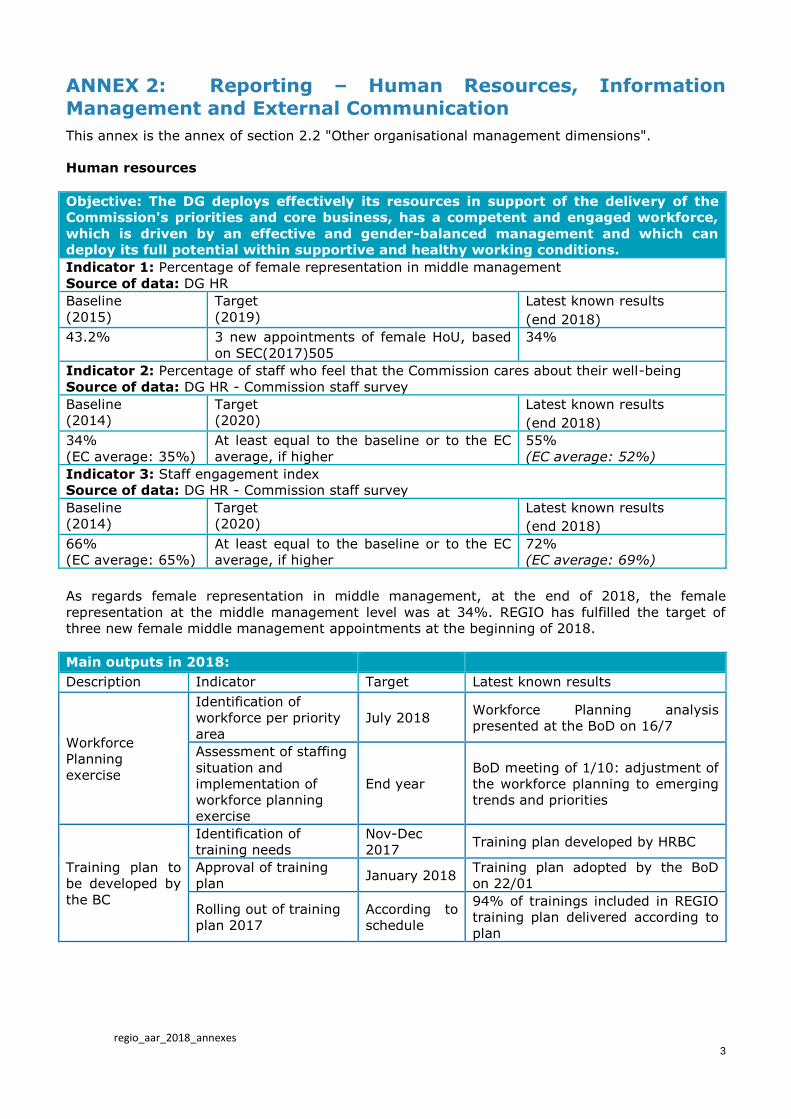
Objective: The DG deploys effectively its resources in support of the delivery of the
Commission's priorities and core business, has a competent and engaged workforce,
which is driven by an effective and gender-balanced management and which can
deploy its full potential within supportive and healthy working conditions.
Indicator 1: Percentage of female representation in middle management
Source of data: DG HR
Baseline
(2015)
Target
(2019)
Latest known results
(end 2018)
43.2% 3 new appointments of female HoU, based
on SEC(2017)505
34%
Indicator 2: Percentage of staff who feel that the Commission cares about their well-being
Source of data: DG HR - Commission staff survey
Baseline
(2014)
Target
(2020)
Latest known results
(end 2018)
34%
(EC average: 35%)
At least equal to the baseline or to the EC
average, if higher
55%
(EC average: 52%)
Indicator 3: Staff engagement index
Source of data: DG HR - Commission staff survey
Baseline
(2014)
Target
(2020)
Latest known results
(end 2018)
66%
(EC average: 65%)
At least equal to the baseline or to the EC
average, if higher
72%
(EC average: 69%)
As regards female representation in middle management, at the end of 2018, the female
representation at the middle management level was at 34%. REGIO has fulfilled the target of
three new female middle management appointments at the beginning of 2018.
Main outputs in 2018:
Description Indicator Target Latest known results
Workforce
Planning
exercise
Identification of
workforce per priority
area
July 2018 Workforce Planning analysis
presented at the BoD on 16/7
Assessment of staffing
situation and
implementation of
workforce planning
exercise
End year
BoD meeting of 1/10: adjustment of
the workforce planning to emerging
trends and priorities
Training plan to
be developed by
the BC
Identification of
training needs
Nov-Dec
2017 Training plan developed by HRBC
Approval of training
plan January 2018
Training plan adopted by the BoD
on 22/01
Rolling out of training
plan 2017
According to
schedule
94% of trainings included in REGIO
training plan delivered according to
plan
regio_aar_2018_annexes
4
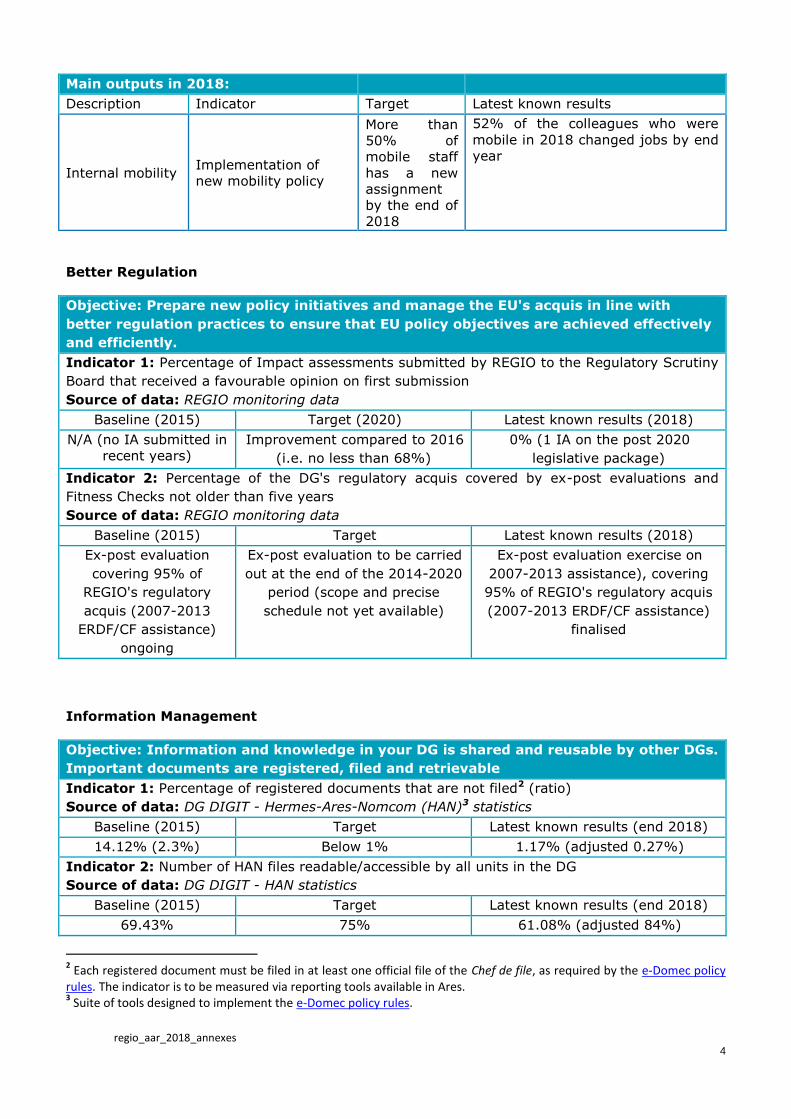
Main outputs in 2018:
Description Indicator Target Latest known results
Internal mobility Implementation of
new mobility policy
More than
50% of
mobile staff
has a new
assignment
by the end of
2018
52% of the colleagues who were
mobile in 2018 changed jobs by end
year
Better Regulation
Objective: Prepare new policy initiatives and manage the EU's acquis in line with
better regulation practices to ensure that EU policy objectives are achieved effectively
and efficiently.
Indicator 1: Percentage of Impact assessments submitted by REGIO to the Regulatory Scrutiny
Board that received a favourable opinion on first submission
Source of data: REGIO monitoring data
Baseline (2015) Target (2020) Latest known results (2018)
N/A (no IA submitted in
recent years)
Improvement compared to 2016
(i.e. no less than 68%)
0% (1 IA on the post 2020
legislative package)
Indicator 2: Percentage of the DG's regulatory acquis covered by ex-post evaluations and
Fitness Checks not older than five years
Source of data: REGIO monitoring data
Baseline (2015) Target Latest known results (2018)
Ex-post evaluation
covering 95% of
REGIO's regulatory
acquis (2007-2013
ERDF/CF assistance)
ongoing
Ex-post evaluation to be carried
out at the end of the 2014-2020
period (scope and precise
schedule not yet available)
Ex-post evaluation exercise on
2007-2013 assistance), covering
95% of REGIO's regulatory acquis
(2007-2013 ERDF/CF assistance)
finalised
Information Management
Objective: Information and knowledge in your DG is shared and reusable by other DGs.
Important documents are registered, filed and retrievable
Indicator 1: Percentage of registered documents that are not filed2 (ratio)
Source of data: DG DIGIT - Hermes-Ares-Nomcom (HAN)3 statistics
Baseline (2015) Target Latest known results (end 2018)
14.12% (2.3%) Below 1% 1.17% (adjusted 0.27%)
Indicator 2: Number of HAN files readable/accessible by all units in the DG
Source of data: DG DIGIT - HAN statistics
Baseline (2015) Target Latest known results (end 2018)
69.43% 75% 61.08% (adjusted 84%)
2 Each registered document must be filed in at least one official file of the Chef de file, as required by the e-Domec policy
rules. The indicator is to be measured via reporting tools available in Ares. 3 Suite of tools designed to implement the e-Domec policy rules.
regio_aar_2018_annexes
5
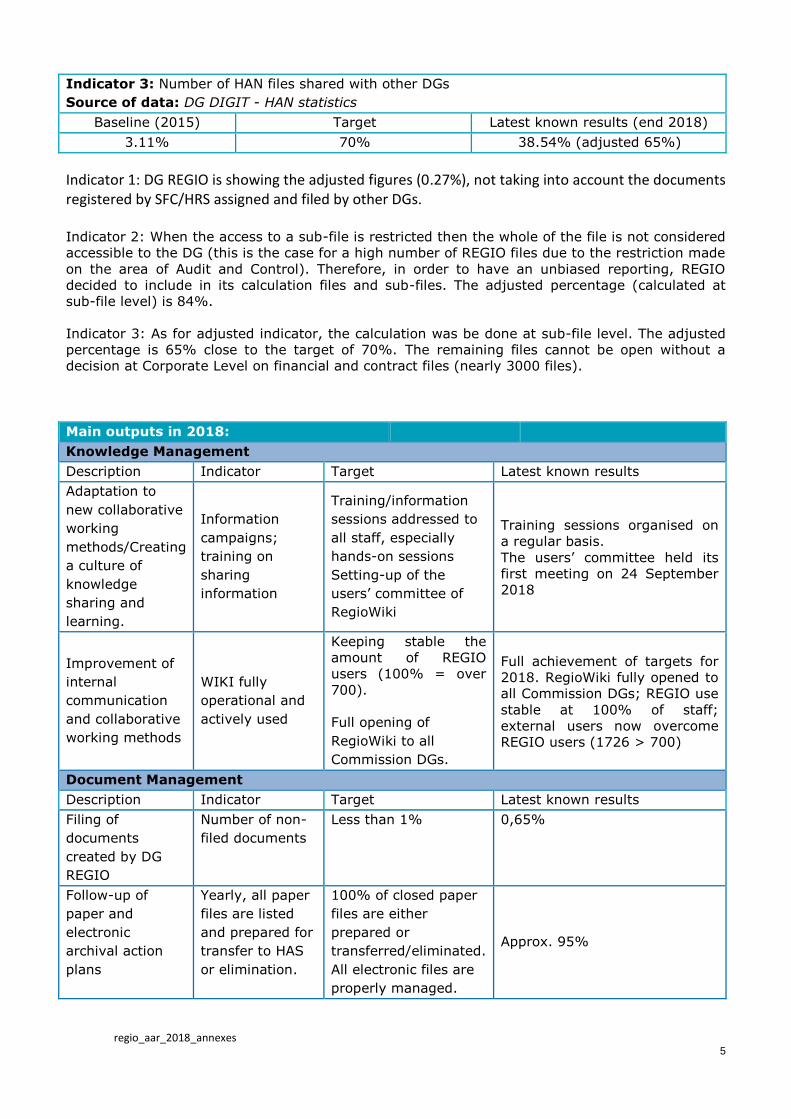
Indicator 3: Number of HAN files shared with other DGs
Source of data: DG DIGIT - HAN statistics
Baseline (2015) Target Latest known results (end 2018)
3.11% 70% 38.54% (adjusted 65%)
Indicator 1: DG REGIO is showing the adjusted figures (0.27%), not taking into account the documents registered by SFC/HRS assigned and filed by other DGs. Indicator 2: When the access to a sub-file is restricted then the whole of the file is not considered
accessible to the DG (this is the case for a high number of REGIO files due to the restriction made
on the area of Audit and Control). Therefore, in order to have an unbiased reporting, REGIO
decided to include in its calculation files and sub-files. The adjusted percentage (calculated at
sub-file level) is 84%.
Indicator 3: As for adjusted indicator, the calculation was be done at sub-file level. The adjusted
percentage is 65% close to the target of 70%. The remaining files cannot be open without a
decision at Corporate Level on financial and contract files (nearly 3000 files).
Main outputs in 2018:
Knowledge Management
Description Indicator Target Latest known results
Adaptation to
new collaborative
working
methods/Creating
a culture of
knowledge
sharing and
learning.
Information
campaigns;
training on
sharing
information
Training/information
sessions addressed to
all staff, especially
hands-on sessions
Setting-up of the
users’ committee of
RegioWiki
Training sessions organised on
a regular basis.
The users’ committee held its
first meeting on 24 September
2018
Improvement of
internal
communication
and collaborative
working methods
WIKI fully
operational and
actively used
Keeping stable the
amount of REGIO
users (100% = over
700).
Full opening of
RegioWiki to all
Commission DGs.
Full achievement of targets for
2018. RegioWiki fully opened to
all Commission DGs; REGIO use
stable at 100% of staff;
external users now overcome
REGIO users (1726 > 700)
Document Management
Description Indicator Target Latest known results
Filing of
documents
created by DG
REGIO
Number of non-
filed documents
Less than 1% 0,65%
Follow-up of
paper and
electronic
archival action
plans
Yearly, all paper
files are listed
and prepared for
transfer to HAS
or elimination.
100% of closed paper
files are either
prepared or
transferred/eliminated.
All electronic files are
properly managed.
Approx. 95%
regio_aar_2018_annexes
6
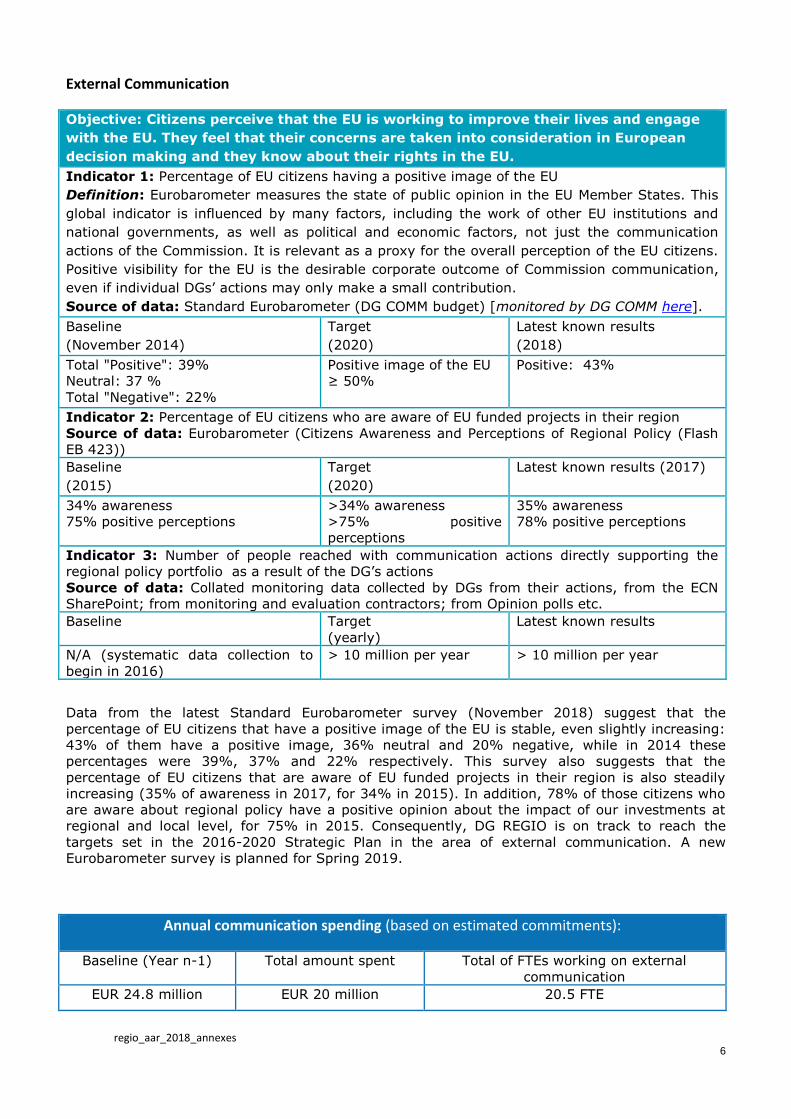
External Communication
Objective: Citizens perceive that the EU is working to improve their lives and engage
with the EU. They feel that their concerns are taken into consideration in European
decision making and they know about their rights in the EU.
Indicator 1: Percentage of EU citizens having a positive image of the EU
Definition: Eurobarometer measures the state of public opinion in the EU Member States. This
global indicator is influenced by many factors, including the work of other EU institutions and
national governments, as well as political and economic factors, not just the communication
actions of the Commission. It is relevant as a proxy for the overall perception of the EU citizens.
Positive visibility for the EU is the desirable corporate outcome of Commission communication,
even if individual DGs’ actions may only make a small contribution.
Source of data: Standard Eurobarometer (DG COMM budget) [monitored by DG COMM here].
Baseline
(November 2014)
Target
(2020)
Latest known results
(2018)
Total "Positive": 39%
Neutral: 37 %
Total "Negative": 22%
Positive image of the EU
≥ 50%
Positive: 43%
Indicator 2: Percentage of EU citizens who are aware of EU funded projects in their region
Source of data: Eurobarometer (Citizens Awareness and Perceptions of Regional Policy (Flash
EB 423))
Baseline
(2015)
Target
(2020)
Latest known results (2017)
34% awareness
75% positive perceptions
>34% awareness
>75% positive
perceptions
35% awareness
78% positive perceptions
Indicator 3: Number of people reached with communication actions directly supporting the
regional policy portfolio as a result of the DG’s actions
Source of data: Collated monitoring data collected by DGs from their actions, from the ECN
SharePoint; from monitoring and evaluation contractors; from Opinion polls etc.
Baseline Target
(yearly)
Latest known results
N/A (systematic data collection to
begin in 2016)
> 10 million per year > 10 million per year
Data from the latest Standard Eurobarometer survey (November 2018) suggest that the
percentage of EU citizens that have a positive image of the EU is stable, even slightly increasing:
43% of them have a positive image, 36% neutral and 20% negative, while in 2014 these
percentages were 39%, 37% and 22% respectively. This survey also suggests that the
percentage of EU citizens that are aware of EU funded projects in their region is also steadily
increasing (35% of awareness in 2017, for 34% in 2015). In addition, 78% of those citizens who
are aware about regional policy have a positive opinion about the impact of our investments at
regional and local level, for 75% in 2015. Consequently, DG REGIO is on track to reach the
targets set in the 2016-2020 Strategic Plan in the area of external communication. A new
Eurobarometer survey is planned for Spring 2019.
Annual communication spending (based on estimated commitments):
Baseline (Year n-1) Total amount spent Total of FTEs working on external
communication
EUR 24.8 million EUR 20 million 20.5 FTE

regio_aar_2018_annexes
7
Achievements:
Main communication actions in 2018:
Description Indicator Target Result
Open call for media Audience reach To be disclosed
after completion of
the selection
procedure
N/A
EU delivers in the
regions
Sum of the audiences
reached
10 million 10 million (campaign
rolled out in 2018-19)
Local debates Nr of debates 60 60
Many Think – Youth
Campaign
Nr of video views To be disclosed
after completion of
the selection
procedure
30 million
Cohesion at 30
(21 March):
N° participants
Media reach
180
>50,000
180
>50,000
Europe in My Region
“campaign”
(Europe-wide, May)
N° participating
countries
N° projects open to
visits
N° visitors of the
projects
N° members of the
College visiting projects
Media reach
>20
>2,500
>400,000
>5
>3 million
25
>2,500
>450,000
>5
>3 million
Europe in My Region
photo competition
(May-July)
N° photos submitted
N° votes cast
Visits to competition
app/site
>800
>5,000
>50,000
>800
>5,000
>50,000
Macro Regional
Strategies
N° participants
N° journalists attending
Media reach
3.500
50
>500.000
3.500
50
>500.000
European Week of
Regions and Cities
(Brussels, 8-12
October)
N° participants
N° journalists attending
Media reach
>5,500
>200
>5 million
>7,000
>200
>5 million
RegioStars Awards
(Brussels, October)
N° of submitted projects
N° participants Awards
ceremony
N° views of videos
(winning projects)
Media reach
>120
>1,500
>300,000
>1 million
102
1,200 present; 5490
views via EBS
>300,000
>1 million
Euronews – Smart
Regions (6 Episodes,
+12 in 2019)
Reached Audience
Social media reach
>5 million
6,5 million
>5 million
6,5 million
Publications (incl. 4
issues of Panorama
magazine)
Number of contributions
from the stakeholders
(for panorama, for each
issue)
Number of subscribers
>6
>30,000
>10
>30,000
Regio Flash
Number of Flash sent
Number of subscribers
>50
>30,000
>50
>30,000
Social media
activities
Reach:
190 million
66,200 followers
on Twitter
190 million
73,300 followers on
regio_aar_2018_annexes
8
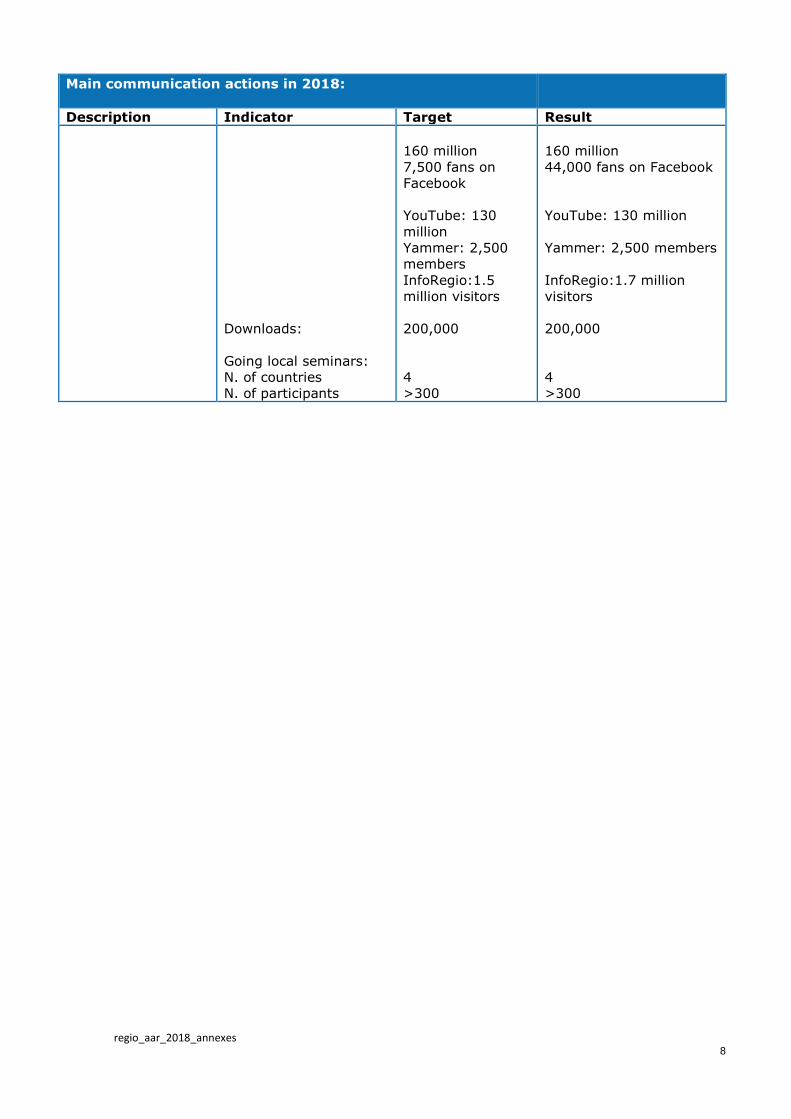
Main communication actions in 2018:
Description Indicator Target Result
Downloads:
Going local seminars:
N. of countries
N. of participants
160 million
7,500 fans on
YouTube: 130
million
Yammer: 2,500
members
InfoRegio:1.5
million visitors
200,000
4
>300
160 million
44,000 fans on Facebook
YouTube: 130 million
Yammer: 2,500 members
InfoRegio:1.7 million
visitors
200,000
4
>300

regio_aar_2018_annexes
9
ANNEX 3: Draft annual accounts and financial reports
Table 14 : Contracts declared Secret
Table 15 : FPA duration exceeds 4 years
Table 1 : Commitments
Table 2 : Payments
Table 3 : Commitments to be settled
Table 8 : Recovery of undue Payments
Table 9 : Ageing Balance of Recovery Orders
Table 10 : Waivers of Recovery Orders
Table 11 : Negotiated Procedures (excluding Building Contracts)
Table 12 : Summary of Procedures (excluding Building Contracts)
Table 4 : Balance Sheet
Table 5 : Statement of Financial Performance
Table 5 Bis: Off Balance Sheet
Table 6 : Average Payment Times
Table 7 : Income
AAR 2018 Version 1
Annex 3 Financial Reports - DG REGIO - Financial Year 2018
Table 13 : Building Contracts
regio_aar_2018_annexes
10
Commitment
appropriations
authorised
Commitments
made%
1 2 3=2/1
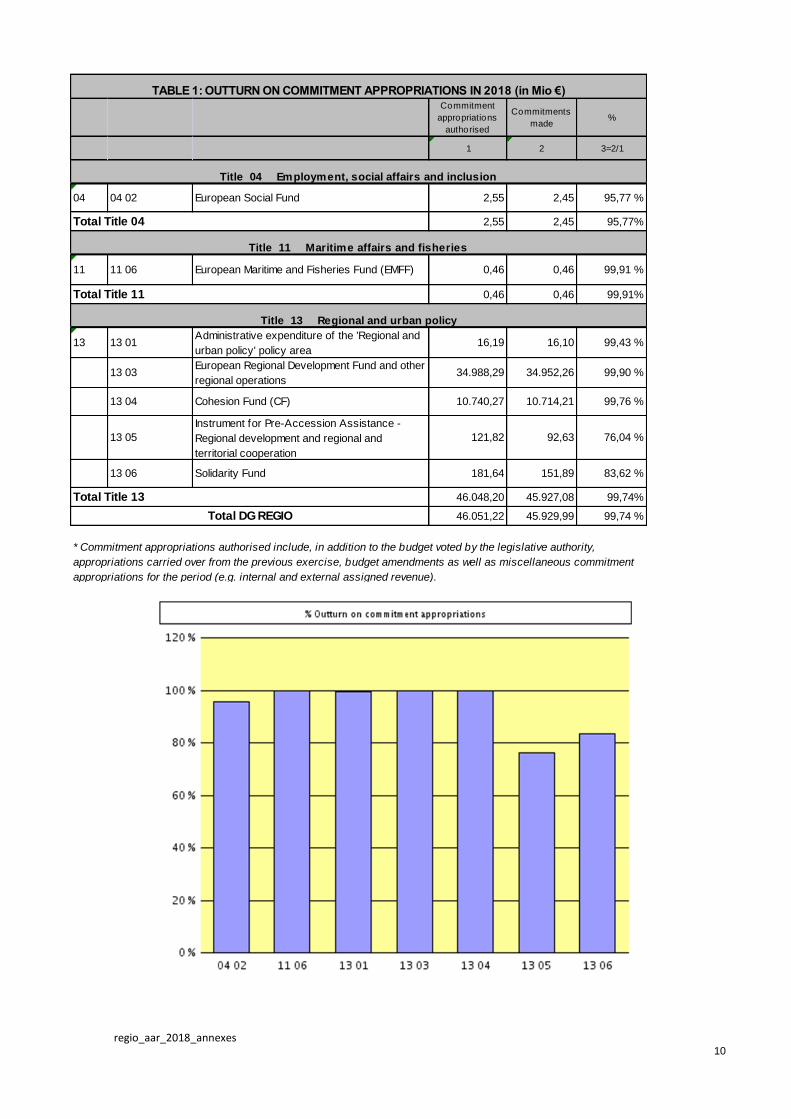
04 04 02 European Social Fund 2,55 2,45 95,77 %
2,55 2,45 95,77%
11 11 06 European Maritime and Fisheries Fund (EMFF) 0,46 0,46 99,91 %
0,46 0,46 99,91%
13 13 01Administrative expenditure of the 'Regional and
urban policy' policy area16,19 16,10 99,43 %
13 03European Regional Development Fund and other
regional operations34.988,29 34.952,26 99,90 %
13 04 Cohesion Fund (CF) 10.740,27 10.714,21 99,76 %
13 05
Instrument for Pre-Accession Assistance -
Regional development and regional and
territorial cooperation
121,82 92,63 76,04 %
13 06 Solidarity Fund 181,64 151,89 83,62 %
46.048,20 45.927,08 99,74%
46.051,22 45.929,99 99,74 %
TABLE 1: OUTTURN ON COMMITMENT APPROPRIATIONS IN 2018 (in Mio €)
Title 04 Employment, social affairs and inclusion
Total Title 04
Title 11 Maritime affairs and fisheries
Total Title 11
Title 13 Regional and urban policy
Total Title 13
Total DG REGIO
* Commitment appropriations authorised include, in addition to the budget voted by the legislative authority,
appropriations carried over from the previous exercise, budget amendments as well as miscellaneous commitment
appropriations for the period (e.g. internal and external assigned revenue).
regio_aar_2018_annexes
11
P ayment
appro priat io n
s autho rised
*
P ayments
made%
1 2 3=2/ 1
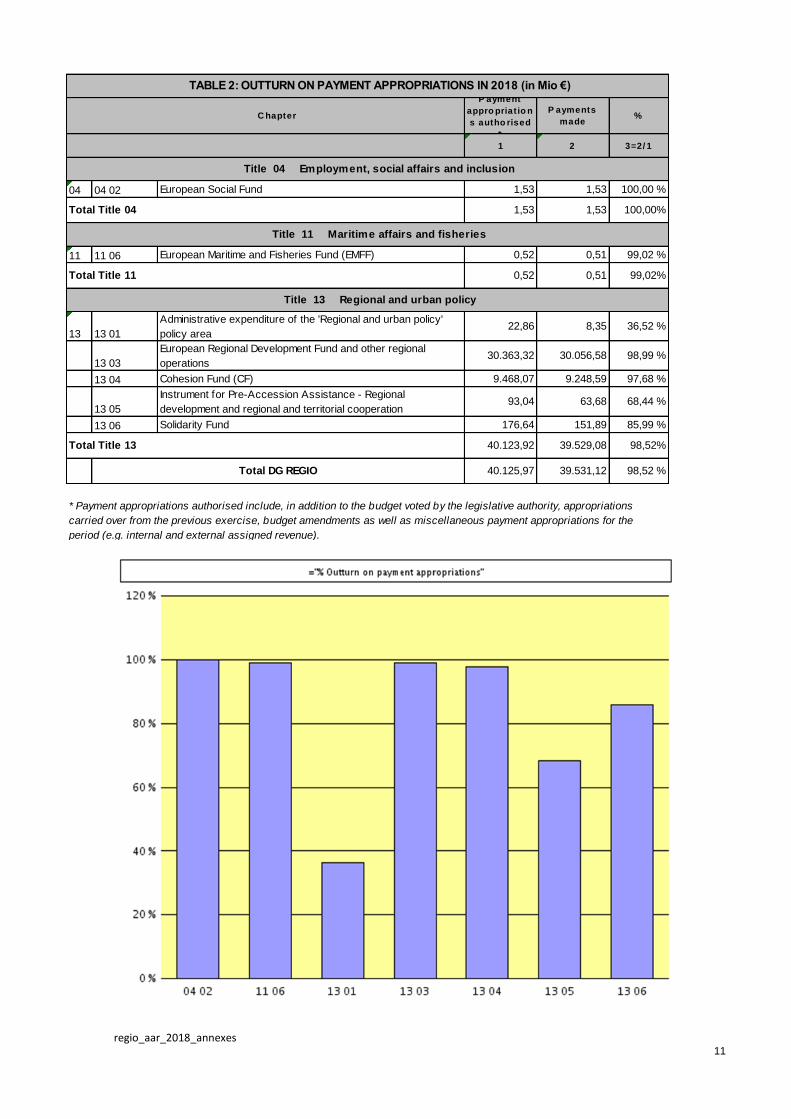
04 04 02 European Social Fund 1,53 1,53 100,00 %
1,53 1,53 100,00%
11 11 06 European Maritime and Fisheries Fund (EMFF) 0,52 0,51 99,02 %
0,52 0,51 99,02%
13 13 01
Administrative expenditure of the 'Regional and urban policy'
policy area22,86 8,35 36,52 %
13 03
European Regional Development Fund and other regional
operations30.363,32 30.056,58 98,99 %
13 04 Cohesion Fund (CF) 9.468,07 9.248,59 97,68 %
13 05
Instrument for Pre-Accession Assistance - Regional
development and regional and territorial cooperation93,04 63,68 68,44 %
13 06 Solidarity Fund 176,64 151,89 85,99 %
40.123,92 39.529,08 98,52%
40.125,97 39.531,12 98,52 %
TABLE 2: OUTTURN ON PAYMENT APPROPRIATIONS IN 2018 (in Mio €)
C hapter
Title 04 Employment, social affairs and inclusion
Title 11 Maritime affairs and fisheries
Total Title 11
Total Title 13
Total Title 04
Title 13 Regional and urban policy
Total DG REGIO
* Payment appropriations authorised include, in addition to the budget voted by the legislative authority, appropriations
carried over from the previous exercise, budget amendments as well as miscellaneous payment appropriations for the
period (e.g. internal and external assigned revenue).

regio_aar_2018_annexes
12
Commitments to
be settled from
Total of commitments
to be sett led at end
Total of
commitments to
be sett led at end
Commitments
2018Payments 2018 RAL 2018 % to be settled financial years
previous to 2018of f inancial year 2018
of f inancial year
2017
1 2 3=1-2 4=1-2/1 5 6=3+5 7
04 04 02 2,45 0,97 1,48 60,50 % 1,34 2,82 4,93
04 03 0,00 0,00 0,00 0,00 % 1,92 1,92 2,20
2,45 0,97 1,48 60,50% 3,26 4,74 7,12
11 11 06 0,46 0,04 0,42 91,32 % 0,02 0,44 0,50
0,46 0,04 0,42 91,32% 0,02 0,44 0,50
13 13 01 15,97 8,68 7,29 45,66 % 0,00 7,29 7,63
13 03 34.952,26 321,62 34.630,64 99,08 % 59.706,83 94.337,47 89.573,16
13 04 10.714,21 26,44 10.687,77 99,75 % 15.181,59 25.869,35 24.415,50
13 05 92,63 1,05 91,57 98,86 % 400,50 492,07 504,67
13 06 151,89 151,89 0,00 0,00 % 0,00 0,00 0,00
45.926,96 509,68 45.417,27 98,89% 75.288,92 120.706,19 114.500,96
45.929,86 510,69 45.419,17 98,89 % 75.292,20 120.711,37 114.508,58
2018 Commitments to be settled
Total Title 11
Total Title 13
Total Title 04
Title 11 : Maritime affairs and fisheries
Title 13 : Regional and urban policy
TABLE 3 : BREAKDOWN OF COMMITMENTS TO BE SETTLED AT 31/12/2018 (in Mio €)
Total DG REGIO
Chapter
Title 04 : Employment, social affairs and inclusion
European Maritime and Fisheries Fund
(EMFF)
Administrative expenditure of the 'Regional
and urban policy' policy area
European Regional Development Fund and
other regional operations
Cohesion Fund (CF)
Instrument for Pre-Accession Assistance -
Regional development and regional and
territorial cooperation
Solidarity Fund
European Social Fund
Employment, Social Affairs and Inclusion
regio_aar_2018_annexes
13
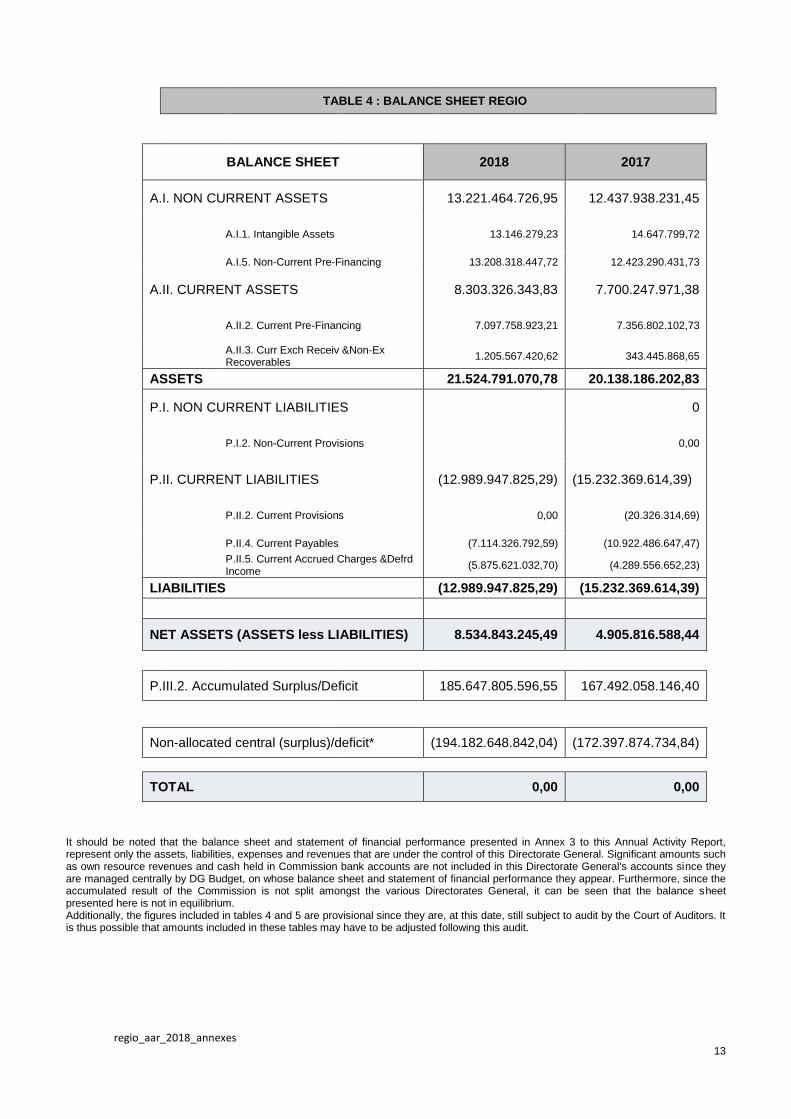
TABLE 4 : BALANCE SHEET REGIO
BALANCE SHEET 2018 2017
A.I. NON CURRENT ASSETS 13.221.464.726,95 12.437.938.231,45
A.I. NON CURRENT ASSETS
A.I.1. Intangible Assets 13.146.279,23 14.647.799,72
A.I.5. Non-Current Pre-Financing 13.208.318.447,72 12.423.290.431,73
A.II. CURRENT ASSETS 8.303.326.343,83 7.700.247.971,38
A.II. CURRENT ASSETS
A.II.2. Current Pre-Financing 7.097.758.923,21 7.356.802.102,73
A.II.3. Curr Exch Receiv &Non-Ex Recoverables
1.205.567.420,62 343.445.868,65
ASSETS 21.524.791.070,78 20.138.186.202,83
P.I. NON CURRENT LIABILITIES 0
P.I. NON CURRENT LIABILITIES
P.I.2. Non-Current Provisions 0,00
P.II. CURRENT LIABILITIES (12.989.947.825,29) (15.232.369.614,39)
P.II. CURRENT LIABILITIES
P.II.2. Current Provisions 0,00 (20.326.314,69)
P.II.4. Current Payables (7.114.326.792,59) (10.922.486.647,47)
P.II.5. Current Accrued Charges &Defrd Income
(5.875.621.032,70) (4.289.556.652,23)
LIABILITIES (12.989.947.825,29) (15.232.369.614,39)
NET ASSETS (ASSETS less LIABILITIES) 8.534.843.245,49 4.905.816.588,44
P.III.2. Accumulated Surplus/Deficit 185.647.805.596,55 167.492.058.146,40
Non-allocated central (surplus)/deficit* (194.182.648.842,04) (172.397.874.734,84)
TOTAL 0,00 0,00
It should be noted that the balance sheet and statement of financial performance presented in Annex 3 to this Annual Activity Report, represent only the assets, liabilities, expenses and revenues that are under the control of this Directorate General. Significant amounts such as own resource revenues and cash held in Commission bank accounts are not included in this Directorate General's accounts since they are managed centrally by DG Budget, on whose balance sheet and statement of financial performance they appear. Furthermore, since the accumulated result of the Commission is not split amongst the various Directorates General, it can be seen that the balance sheet presented here is not in equilibrium. Additionally, the figures included in tables 4 and 5 are provisional since they are, at this date, still subject to audit by the Court of Auditors. It is thus possible that amounts included in these tables may have to be adjusted following this audit.
regio_aar_2018_annexes
14
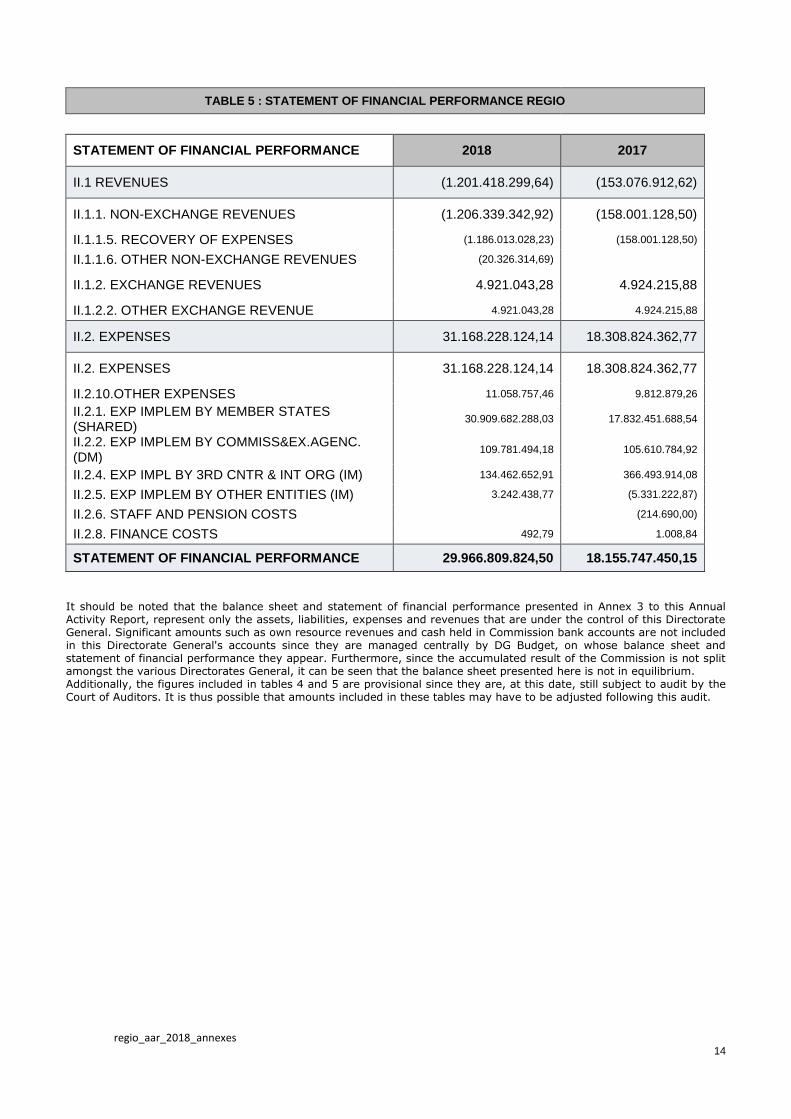
TABLE 5 : STATEMENT OF FINANCIAL PERFORMANCE REGIO
STATEMENT OF FINANCIAL PERFORMANCE 2018 2017
II.1 REVENUES (1.201.418.299,64) (153.076.912,62)
II.1.1. NON-EXCHANGE REVENUES (1.206.339.342,92) (158.001.128,50)
II.1.1.5. RECOVERY OF EXPENSES (1.186.013.028,23) (158.001.128,50)
II.1.1.6. OTHER NON-EXCHANGE REVENUES (20.326.314,69)
II.1.2. EXCHANGE REVENUES 4.921.043,28 4.924.215,88
II.1.2.2. OTHER EXCHANGE REVENUE 4.921.043,28 4.924.215,88
II.2. EXPENSES 31.168.228.124,14 18.308.824.362,77
II.2. EXPENSES 31.168.228.124,14 18.308.824.362,77
II.2.10.OTHER EXPENSES 11.058.757,46 9.812.879,26
II.2.1. EXP IMPLEM BY MEMBER STATES (SHARED)
30.909.682.288,03 17.832.451.688,54
II.2.2. EXP IMPLEM BY COMMISS&EX.AGENC. (DM)
109.781.494,18 105.610.784,92
II.2.4. EXP IMPL BY 3RD CNTR & INT ORG (IM) 134.462.652,91 366.493.914,08
II.2.5. EXP IMPLEM BY OTHER ENTITIES (IM) 3.242.438,77 (5.331.222,87)
II.2.6. STAFF AND PENSION COSTS (214.690,00)
II.2.8. FINANCE COSTS 492,79 1.008,84
STATEMENT OF FINANCIAL PERFORMANCE 29.966.809.824,50 18.155.747.450,15
It should be noted that the balance sheet and statement of financial performance presented in Annex 3 to this Annual Activity Report, represent only the assets, liabilities, expenses and revenues that are under the control of this Directorate General. Significant amounts such as own resource revenues and cash held in Commission bank accounts are not included in this Directorate General's accounts since they are managed centrally by DG Budget, on whose balance sheet and statement of financial performance they appear. Furthermore, since the accumulated result of the Commission is not split amongst the various Directorates General, it can be seen that the balance sheet presented here is not in equilibrium. Additionally, the figures included in tables 4 and 5 are provisional since they are, at this date, still subject to audit by the Court of Auditors. It is thus possible that amounts included in these tables may have to be adjusted following this audit.
regio_aar_2018_annexes
15
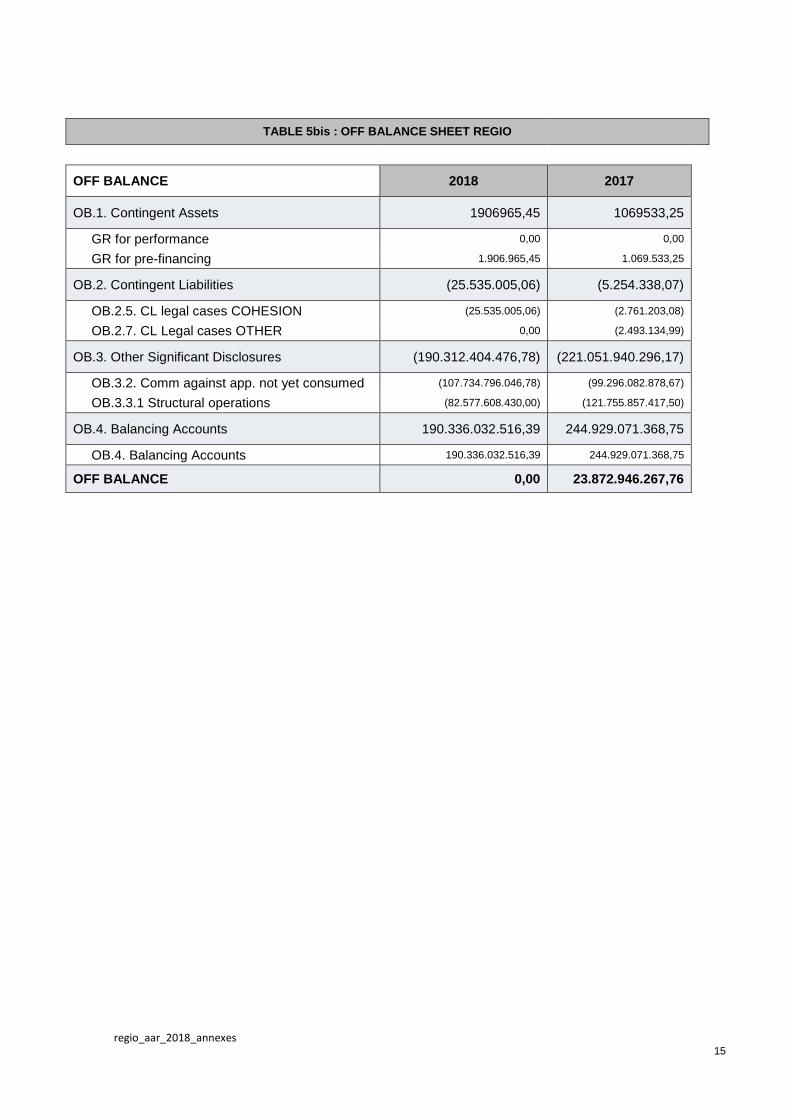
TABLE 5bis : OFF BALANCE SHEET REGIO
OFF BALANCE 2018 2017
OB.1. Contingent Assets 1906965,45 1069533,25
GR for performance 0,00 0,00
GR for pre-financing 1.906.965,45 1.069.533,25
OB.2. Contingent Liabilities (25.535.005,06) (5.254.338,07)
OB.2.5. CL legal cases COHESION (25.535.005,06) (2.761.203,08)
OB.2.7. CL Legal cases OTHER 0,00 (2.493.134,99)
OB.3. Other Significant Disclosures (190.312.404.476,78) (221.051.940.296,17)
OB.3.2. Comm against app. not yet consumed (107.734.796.046,78) (99.296.082.878,67)
OB.3.3.1 Structural operations (82.577.608.430,00) (121.755.857.417,50)
OB.4. Balancing Accounts 190.336.032.516,39 244.929.071.368,75
OB.4. Balancing Accounts 190.336.032.516,39 244.929.071.368,75
OFF BALANCE 0,00 23.872.946.267,76
regio_aar_2018_annexes
16
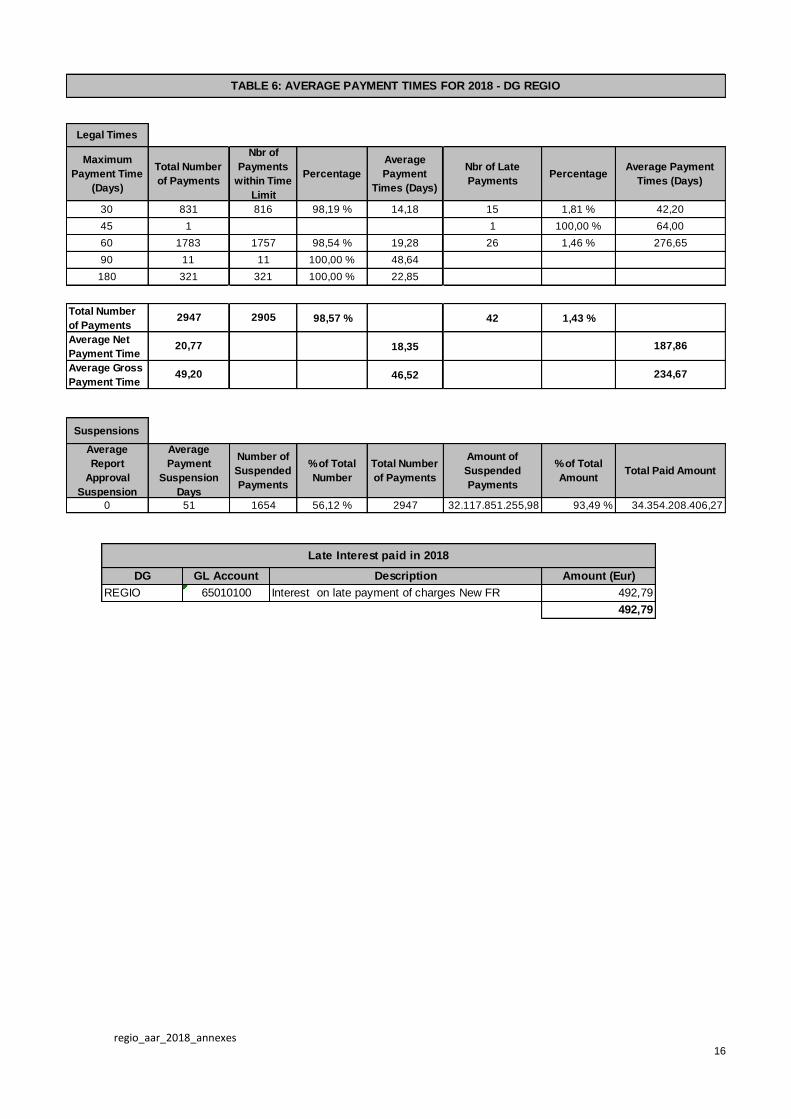
Percentage
Average
Payment
Times (Days)
Nbr of Late
PaymentsPercentage
98,19 % 14,18 15 1,81 %
1 100,00 %
98,54 % 19,28 26 1,46 %
100,00 % 48,64
100,00 % 22,85
98,57 % 42 1,43 %
18,35
46,52
% of Total
Number
Total Number
of Payments
Amount of
Suspended
Payments
% of Total
Amount
56,12 % 2947 32.117.851.255,98 93,49 %
Total Paid Amount
34.354.208.406,27
Average Payment
Times (Days)
42,20
64,00
276,65
187,86
234,67
1757
11
Description
Interest on late payment of charges New FR
GL Account
65010100
321
2905
Number of
Suspended
Payments
1654
Late Interest paid in 2018
DG
REGIO
2947
20,77
49,20
11
492,79
Suspensions
Average
Report
Approval
Suspension
0
180
Total Number
of Payments
Average Net
Payment Time
Average Gross
Payment Time
Average
Payment
Suspension
Days
51
Amount (Eur)
492,79
321
TABLE 6: AVERAGE PAYMENT TIMES FOR 2018 - DG REGIO
Legal Times
Maximum
Payment Time
(Days)
30
Nbr of
Payments
within Time
Limit
816
45
60
90
Total Number
of Payments
831
1
1783

regio_aar_2018_annexes
17
Outstanding
Chapter Current year RO Carried over RO Total Current Year RO Carried over RO Total balance
1 2 3=1+2 4 5 6=4+5 7=3-6
61 REPAYMENT OF MISCELLANEOUS EXPENDITURE 5.921.069.337,10 18.811.563,44 5.939.880.900,54 5.906.134.074,42 18.811.563,44 5.924.945.637,86 14.935.262,68
65 FINANCIAL CORRECTIONS 1.505.735,99 6.634.810,38 8.140.546,37 1.505.735,99 6.634.810,38 8.140.546,37 0,00
5.922.575.073,09 25.446.373,82 5.948.021.446,91 5.907.639.810,41 25.446.373,82 5.933.086.184,23 14.935.262,68
TABLE 7 : SITUATION ON REVENUE AND INCOME IN 2018
Total DG REGIO
Revenue and income recognized Revenue and income cashed from
TABLE 8 : RECOVERY OF PAYMENTS
(Number of Recovery Contexts and corresponding Transaction Amount)
INCOME BUDGET
RECOVERY ORDERS
ISSUED IN 2018
Year of Origin
(commitment)Nbr RO Amount Nbr RO Amount Nbr RO Amount Nbr RO Amount RO Amount
1998 4,00 73.063,15
1999 1,00 1.230.588,10 1,00 1.230.588,10 4,00 1.830.724,10 67,22%
2000 1,00 5.055.531,14
2001 1,00 1.123.019,43 1,00 1.123.019,43 2,00 5.603.571,69 20,04%
2002 1,00 13.801.163,00
2004 1,00 1.266.175,76
2005 1,00 3.500,55
2006 3,00 487.614,48
2007 17,00 30.409.766,59
2008 1,00 571.369,36
2009 1,00 2.806,64
2010 2,00 15.941,52
2011 4,00 1.535.358,09
2013 1,00 1.103,84 1,00 1.103,84 4,00 44.833,34 2,46%
2014 145,00 1.555.879.984,73
2015 263,00 4.158.450.090,95
2016 23,00 123.889.762,44
2017 9,00 4.292.917,37
No Link 2,00 177.989,74 2,00 177.989,74 22,00 19.137.577,77 0,93%
Sub-Total 2,00 1.124.123,27 3,00 1.408.577,84 5,00 2.532.701,11 508,00 5.922.351.752,67 0,04%
50,00%
9,09%
0,98%
25,00%
Irregularity OLAF notifiedTotal undue
payments recovered
Total transactions in
recovery context (incl.
non-qualified)
% Qualified/Total RC
Nbr
25,00%
EXPENSES BUDGET
Nbr Amount Nbr Amount Nbr Amount Nbr Amount Nbr Nbr Amount
INCOME LINES IN
INVOICES
NON ELIGIBLE IN COST
CLAIMS1,00 197.709,57 1,00 197.709,57 463,00 0,22% 0,07%
CREDIT NOTES 44,00
Sub-Total 1,00 197.709,57 1,00 197.709,57 507,00 0,20% 0,07%
% Qualified/Total RC
Amount
303.408.053,11
318.984,22
Total transactions in
recovery context (incl.
non-qualified)
303.727.037,33
Error Irregularity OLAF NotifiedTotal undue payments
recovered
regio_aar_2018_annexes
18
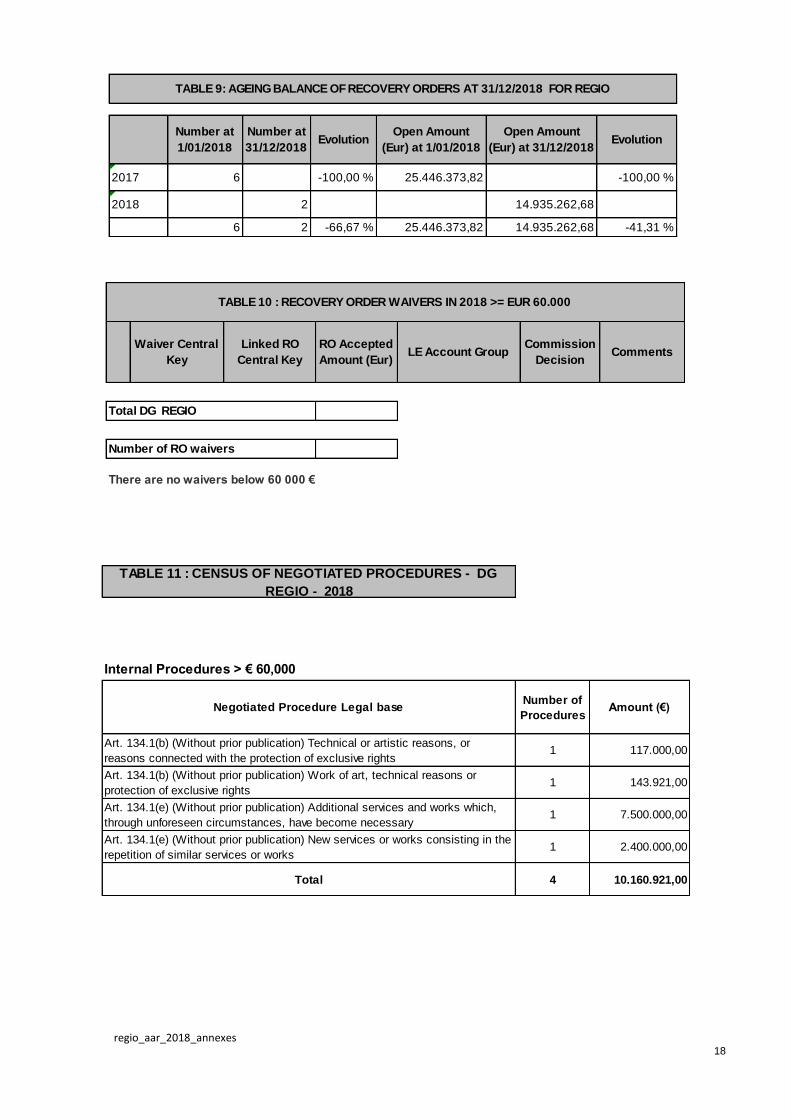
Number at
1/01/2018
2017 6
2018
6 -66,67 %
Open Amount
(Eur) at 1/01/2018
25.446.373,82
25.446.373,82
Open Amount
(Eur) at 31/12/2018
14.935.262,68
14.935.262,68
TABLE 9: AGEING BALANCE OF RECOVERY ORDERS AT 31/12/2018 FOR REGIO
Number at
31/12/2018
2
Evolution
-100,00 %
-41,31 %2
Evolution
-100,00 %
Waiver Central
Key
Linked RO
Central KeyComments
TABLE 10 : RECOVERY ORDER WAIVERS IN 2018 >= EUR 60.000
Total DG REGIO
Number of RO waivers
There are no waivers below 60 000 €
RO Accepted
Amount (Eur)LE Account Group
Commission
Decision
TABLE 11 : CENSUS OF NEGOTIATED PROCEDURES - DG
REGIO - 2018
Internal Procedures > € 60,000
Negotiated Procedure Legal baseNumber of
ProceduresAmount (€)
Art. 134.1(b) (Without prior publication) Technical or artistic reasons, or
reasons connected with the protection of exclusive rights1 117.000,00
Art. 134.1(b) (Without prior publication) Work of art, technical reasons or
protection of exclusive rights1 143.921,00
Art. 134.1(e) (Without prior publication) Additional services and works which,
through unforeseen circumstances, have become necessary1 7.500.000,00
Art. 134.1(e) (Without prior publication) New services or works consisting in the
repetition of similar services or works1 2.400.000,00
Total 4 10.160.921,00
regio_aar_2018_annexes
19
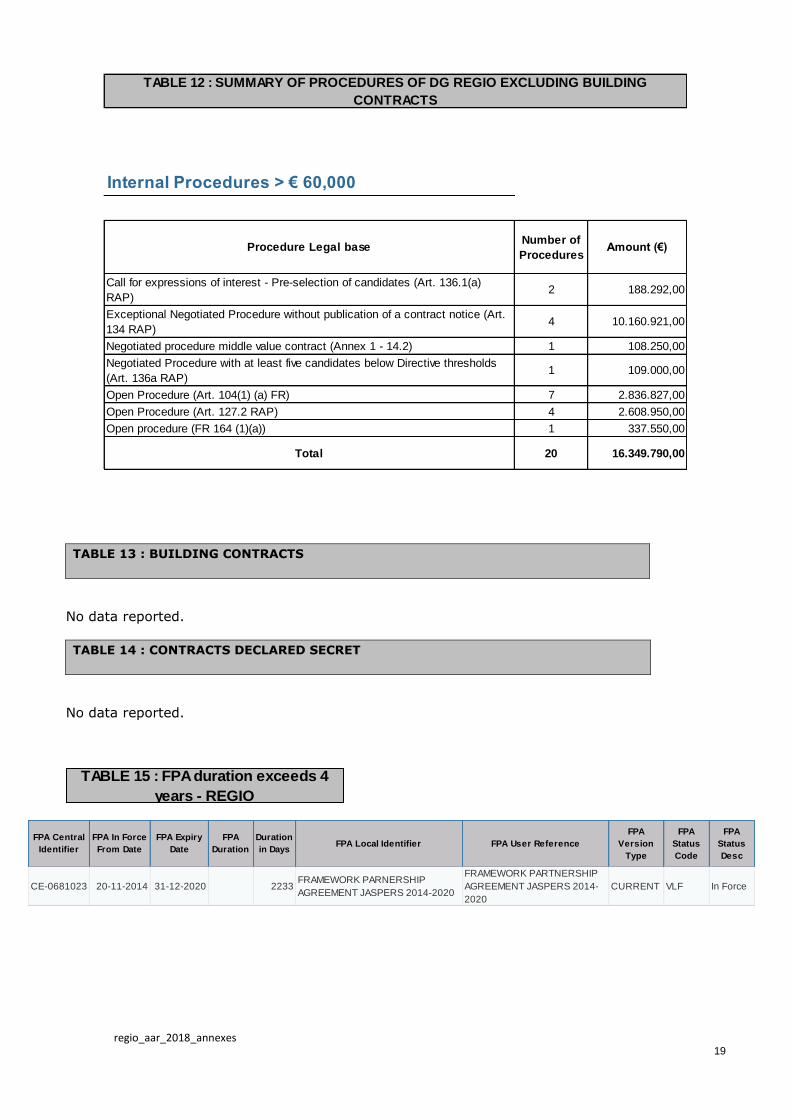
TABLE 13 : BUILDING CONTRACTS
No data reported.
TABLE 14 : CONTRACTS DECLARED SECRET
No data reported.
Internal Procedures > € 60,000
Procedure Legal baseNumber of
ProceduresAmount (€)
Call for expressions of interest - Pre-selection of candidates (Art. 136.1(a)
RAP)2 188.292,00
Exceptional Negotiated Procedure without publication of a contract notice (Art.
134 RAP)4 10.160.921,00
Negotiated procedure middle value contract (Annex 1 - 14.2) 1 108.250,00
Negotiated Procedure with at least five candidates below Directive thresholds
(Art. 136a RAP)1 109.000,00
Open Procedure (Art. 104(1) (a) FR) 7 2.836.827,00
Open Procedure (Art. 127.2 RAP) 4 2.608.950,00
Open procedure (FR 164 (1)(a)) 1 337.550,00
Total 20 16.349.790,00
TABLE 12 : SUMMARY OF PROCEDURES OF DG REGIO EXCLUDING BUILDING
CONTRACTS
TABLE 15 : FPA duration exceeds 4
years - REGIO
FPA Central
Identifier
FPA In Force
From Date
FPA Expiry
Date
FPA
Duration
Duration
in DaysFPA Local Identifier FPA User Reference
FPA
Version
Type
FPA
Status
Code
FPA
Status
Desc
CE-0681023 20-11-2014 31-12-2020 2233FRAMEWORK PARNERSHIP
AGREEMENT JASPERS 2014-2020
FRAMEWORK PARTNERSHIP
AGREEMENT JASPERS 2014-
2020
CURRENT VLF In Force

regio_aar_2018_annexes
20
ANNEX 4: Materiality criteria
I. For shared management (ERDF/CF/IPA-CBC)
Assessment of management and control systems in the Member States and for the programming period 2007-13
The assessment at closure
At closure the Annual Control Reports were submitted as part of the closure packages. For each programme, the Directorate General carried out an in depth assessment of the information provided (in particular the audit opinion, the projected error rate covering the 2015 and 2016 expenditure and the residual risk rate).
As the audit authorities were required to disclose a residual risk rate calculated on the basis of the expenditure certified during the whole programming period, the residual risk rate is used as this is the best estimate of the expenditure which is not in full conformity with contractual or regulatory provisions over the lifetime of the programme.
The assessment of the relevant reports, data and other information available requires the application of professional judgement, namely when weighting contradictory information or considering abnormal statistical results. When taking into account reported corrections, the authorising officer by delegation also assesses that they are reliable based on all audit information and in particular the validation made at closure by the audit authorities and that they effectively mitigate the risks identified and that they result in a reduction in the level of the error that remains uncorrected in the population.
Materiality criteria and reservations
Final payments are made for the closure of the programme only when all issues are cleared.
Following the in-depth assessment of closure documents, a non-quantified reservation is made for those programmes, where either additional audit work is requested or financial corrections may need to be applied exceeding the retention (5% or less for underspent programmes of the overall allocation made at programme level)4.
Exceptions, if any, are clearly reported and explained in the body of the Annual Activity Report. In some cases, reservations may be made at sub-programme level (priority axis or implementing bodies) when the systemic deficiencies only affect a specific component of the management and control system, not used for the other activities under the same programme.
To calculate the amount at risk for programmes under reservation, the residual risk rate is applied to the payments made during the year. For a reservation made at sub-programme level, a flat rate depending on the deficiencies identified is applied to the relevant expenditure5. No financial corrections are taken into account for the quantification of the reservation, as the financial corrections already implemented are mainly linked to expenditure declared in previous years.
Estimation of the amounts at risk at payment and at closure
For the 2017 AAR and onwards, the risk "at payment" is estimated by applying the residual risk rate communicated by the audit authorities as part of the closure documents and validated by the Commission services to the "relevant expenditure" (i.e. payments and the cleared pre-financing made during the reporting year).
For the estimation of the amount at risk at closure, the estimated future corrections -if any- are deducted from the amount at risk at payment.
4 The decision on whether to issue reservation will be made taking into account the cumulative residual risk.
5 i.e. paid in the relevant year in relation to the concerned sub-programme
regio_aar_2018_annexes
21
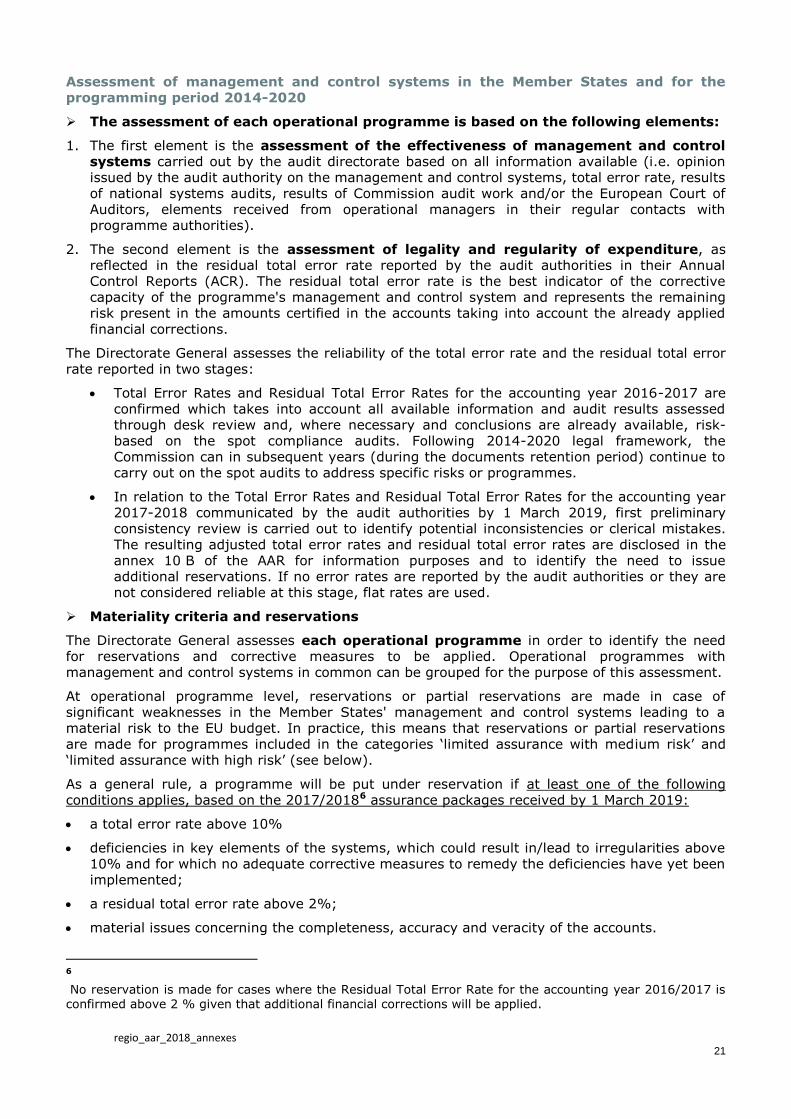
Assessment of management and control systems in the Member States and for the programming period 2014-2020
The assessment of each operational programme is based on the following elements:
1. The first element is the assessment of the effectiveness of management and control systems carried out by the audit directorate based on all information available (i.e. opinion issued by the audit authority on the management and control systems, total error rate, results of national systems audits, results of Commission audit work and/or the European Court of Auditors, elements received from operational managers in their regular contacts with programme authorities).
2. The second element is the assessment of legality and regularity of expenditure, as reflected in the residual total error rate reported by the audit authorities in their Annual Control Reports (ACR). The residual total error rate is the best indicator of the corrective capacity of the programme's management and control system and represents the remaining risk present in the amounts certified in the accounts taking into account the already applied financial corrections.
The Directorate General assesses the reliability of the total error rate and the residual total error rate reported in two stages:
Total Error Rates and Residual Total Error Rates for the accounting year 2016-2017 are confirmed which takes into account all available information and audit results assessed through desk review and, where necessary and conclusions are already available, risk-based on the spot compliance audits. Following 2014-2020 legal framework, the Commission can in subsequent years (during the documents retention period) continue to carry out on the spot audits to address specific risks or programmes.
In relation to the Total Error Rates and Residual Total Error Rates for the accounting year 2017-2018 communicated by the audit authorities by 1 March 2019, first preliminary consistency review is carried out to identify potential inconsistencies or clerical mistakes. The resulting adjusted total error rates and residual total error rates are disclosed in the annex 10 B of the AAR for information purposes and to identify the need to issue additional reservations. If no error rates are reported by the audit authorities or they are not considered reliable at this stage, flat rates are used.
Materiality criteria and reservations
The Directorate General assesses each operational programme in order to identify the need for reservations and corrective measures to be applied. Operational programmes with management and control systems in common can be grouped for the purpose of this assessment.
At operational programme level, reservations or partial reservations are made in case of significant weaknesses in the Member States' management and control systems leading to a material risk to the EU budget. In practice, this means that reservations or partial reservations are made for programmes included in the categories ‘limited assurance with medium risk’ and ‘limited assurance with high risk’ (see below).
As a general rule, a programme will be put under reservation if at least one of the following conditions applies, based on the 2017/20186 assurance packages received by 1 March 2019:
a total error rate above 10%
deficiencies in key elements of the systems, which could result in/lead to irregularities above 10% and for which no adequate corrective measures to remedy the deficiencies have yet been implemented;
a residual total error rate above 2%;
material issues concerning the completeness, accuracy and veracity of the accounts.
6 No reservation is made for cases where the Residual Total Error Rate for the accounting year 2016/2017 is confirmed above 2 % given that additional financial corrections will be applied.

regio_aar_2018_annexes
22
Exceptions, if any, are clearly reported and explained in the body of the AAR. In some cases, reservations may be made at sub-programme level (priority axis or implementing bodies) when the systemic deficiencies only affect a specific component of the management and control system, not used for the other activities under the same programme.
In case there is no financial impact for the reporting year (e.g. no expenditure paid) for a programme under reservation, a non-quantified reservation is made.
In addition, reputational reservations are made for deficiencies of a qualitative nature (e.g. significant systemic deficiencies or major control failures) which have a significant impact on the reputation of the Commission.
The operational programmes are classified in four categories:
Operational programmes not in reservation:
o Reasonable assurance means that there is no material deficiency affecting key elements of the systems (only minor improvements may be needed in some cases) and there are no material issues concerning either conformity of expenditure (residual total error rate < 2%) or the accounts;
o Reasonable assurance with low risk of irregularities covers programmes with the existence of some deficiencies in key elements of the systems without material impact on the EU Budget; and where there are no material issues with either the legality and regularity of the expenditure (residual total error rate < 2%) or the accounts.
o Limited assurance with medium risk of irregularities covers programmes with deficiencies in key elements of the systems with no material risk for the EU budget (e.g. programme with a total error rate between 5% and 10% and where adequate financial corrections have been implemented);
Operational programmes in reservation:
o Limited assurance with medium risk of irregularities covers:
programmes with deficiencies in key elements of the systems with a material risk for the EU budget (e.g. programme with a total error rate between 5% and 10% and where no adequate financial corrections have been implemented yet); and/or
programmes with material legality and regularity issues and insufficient financial corrections implemented ("residual total error rate" remains above 2%); and/or
programmes with material issues concerning the completeness, accuracy and veracity of the accounts.
o Limited assurance with high risk of irregularities covers:
programmes with widespread deficiencies in key elements of the systems with a material risk for the EU budget (e.g. programme with a total error rate above 10% and no adequate corrective measures to remedy the deficiencies have yet been implemented); and/or
programmes with widespread material legality and regularity issues and insufficient financial corrections implemented ("residual total error rate" remains above 2%); and/or
programmes with widespread material issues concerning the completeness, accuracy and veracity of the accounts.
For the calculation of the amounts impacted by a reservation7, where the reservation is due to a risk estimated to be above 10%, the estimated risk rate is applied to the expenditure of the second semester while the residual total error rate is applied to the expenditure of the first semester, if applicable.
Where there is no financial impact for the reporting year in question (e.g. no expenditure paid)
7 No rate will be calculated
regio_aar_2018_annexes
23
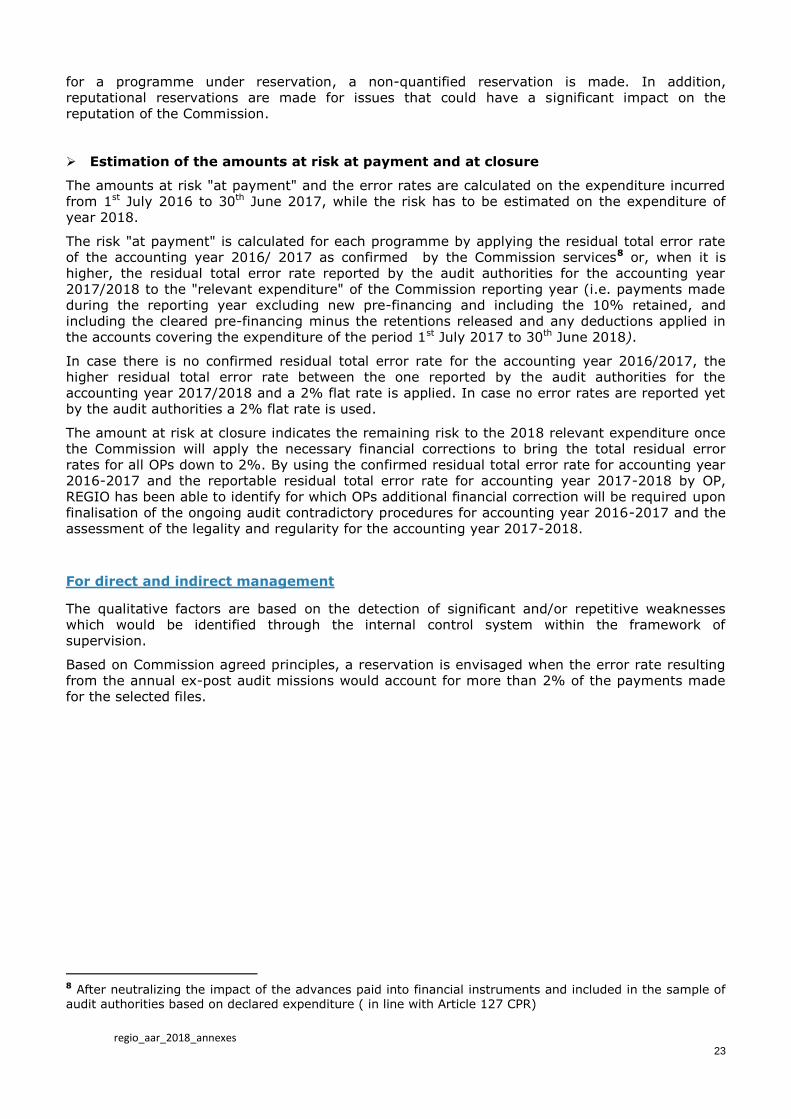
for a programme under reservation, a non-quantified reservation is made. In addition, reputational reservations are made for issues that could have a significant impact on the reputation of the Commission.
Estimation of the amounts at risk at payment and at closure
The amounts at risk "at payment" and the error rates are calculated on the expenditure incurred from 1st July 2016 to 30th June 2017, while the risk has to be estimated on the expenditure of year 2018.
The risk "at payment" is calculated for each programme by applying the residual total error rate of the accounting year 2016/ 2017 as confirmed by the Commission services8 or, when it is higher, the residual total error rate reported by the audit authorities for the accounting year 2017/2018 to the "relevant expenditure" of the Commission reporting year (i.e. payments made during the reporting year excluding new pre-financing and including the 10% retained, and including the cleared pre-financing minus the retentions released and any deductions applied in the accounts covering the expenditure of the period 1st July 2017 to 30th June 2018).
In case there is no confirmed residual total error rate for the accounting year 2016/2017, the higher residual total error rate between the one reported by the audit authorities for the accounting year 2017/2018 and a 2% flat rate is applied. In case no error rates are reported yet by the audit authorities a 2% flat rate is used.
The amount at risk at closure indicates the remaining risk to the 2018 relevant expenditure once the Commission will apply the necessary financial corrections to bring the total residual error rates for all OPs down to 2%. By using the confirmed residual total error rate for accounting year 2016-2017 and the reportable residual total error rate for accounting year 2017-2018 by OP, REGIO has been able to identify for which OPs additional financial correction will be required upon finalisation of the ongoing audit contradictory procedures for accounting year 2016-2017 and the assessment of the legality and regularity for the accounting year 2017-2018.
For direct and indirect management
The qualitative factors are based on the detection of significant and/or repetitive weaknesses which would be identified through the internal control system within the framework of supervision.
Based on Commission agreed principles, a reservation is envisaged when the error rate resulting from the annual ex-post audit missions would account for more than 2% of the payments made for the selected files.
8 After neutralizing the impact of the advances paid into financial instruments and included in the sample of audit authorities based on declared expenditure ( in line with Article 127 CPR)
24 regio_aar_2018_annexes
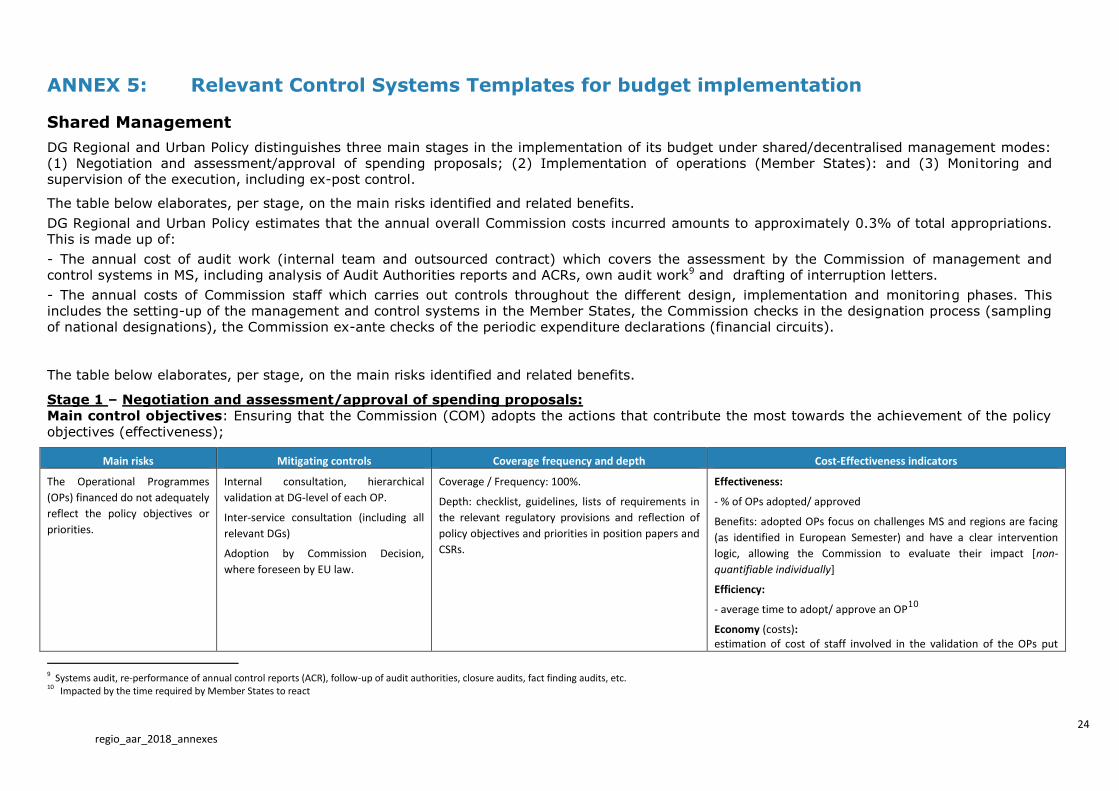
ANNEX 5: Relevant Control Systems Templates for budget implementation
Shared Management
DG Regional and Urban Policy distinguishes three main stages in the implementation of its budget under shared/decentralised management modes: (1) Negotiation and assessment/approval of spending proposals; (2) Implementation of operations (Member States): and (3) Monitoring and supervision of the execution, including ex-post control.
The table below elaborates, per stage, on the main risks identified and related benefits.
DG Regional and Urban Policy estimates that the annual overall Commission costs incurred amounts to approximately 0.3% of total appropriations. This is made up of:
- The annual cost of audit work (internal team and outsourced contract) which covers the assessment by the Commission of management and control systems in MS, including analysis of Audit Authorities reports and ACRs, own audit work9 and drafting of interruption letters.
- The annual costs of Commission staff which carries out controls throughout the different design, implementation and monitoring phases. This includes the setting-up of the management and control systems in the Member States, the Commission checks in the designation process (sampling of national designations), the Commission ex-ante checks of the periodic expenditure declarations (financial circuits).
The table below elaborates, per stage, on the main risks identified and related benefits.
Stage 1 – Negotiation and assessment/approval of spending proposals:
Main control objectives: Ensuring that the Commission (COM) adopts the actions that contribute the most towards the achievement of the policy
objectives (effectiveness);
Main risks Mitigating controls Coverage frequency and depth Cost-Effectiveness indicators
The Operational Programmes
(OPs) financed do not adequately
reflect the policy objectives or
priorities.
Internal consultation, hierarchical
validation at DG-level of each OP.
Inter-service consultation (including all
relevant DGs)
Adoption by Commission Decision,
where foreseen by EU law.
Coverage / Frequency: 100%.
Depth: checklist, guidelines, lists of requirements in
the relevant regulatory provisions and reflection of
policy objectives and priorities in position papers and
CSRs.
Effectiveness:
- % of OPs adopted/ approved
Benefits: adopted OPs focus on challenges MS and regions are facing
(as identified in European Semester) and have a clear intervention
logic, allowing the Commission to evaluate their impact [non-
quantifiable individually]
Efficiency:
- average time to adopt/ approve an OP10
Economy (costs): estimation of cost of staff involved in the validation of the OPs put
9 Systems audit, re-performance of annual control reports (ACR), follow-up of audit authorities, closure audits, fact finding audits, etc. 10 Impacted by the time required by Member States to react

regio_aar_2018_annexes
25
Main risks Mitigating controls Coverage frequency and depth Cost-Effectiveness indicators
forward by the Member States.
Stage 2 – Implementation of operations (Member States):
A. Setting up of the systems
Main control objectives: ensuring that the management and control systems are adequately designed
Main risks Mitigating controls Coverage, frequency and depth Cost-Effectiveness indicators
The process of designation of
national authorities in the
Member States (MS) is not
effective and, as a result, the
management and control
systems are not compliant with
the applicable rules.
Supervision by Commission (for 2014-
2020):
- Commission review (and audits) of a
sample of national designations
- submission of MS Audit Strategies to
the Commission (on request)
Coverage / Frequency: fixed in sector-specific rules
Depth: verification (desk review + audit missions
where necessary) of description of management and
control systems communicated by MS. Designation
audits are generally done on the spot.
For 2014-2020:
Effectiveness:
- % of authorities designated
Benefits: (part of) the amounts associated with unreliable systems for
which the Commission audit work revealed substantial compliance
problems (for 2014-2020) [not quantifiable]
Efficiency:
- number of authorities for which serious weaknesses found by
designation reviews/audits (% of total checked) Economy (costs): estimation of cost of COM staff involved in the audits of samples of national designations
B. MS controls to prevent detect and correct errors within the declared certified expenditure
Main control objectives: ensuring that the periodic expenditure declarations submitted to the Commission for each action are legal and regular
Main risks Mitigating controls Coverage, frequency and depth Cost-Effectiveness indicators
Periodic expenditure
declarations submitted to the
Commission include
expenditure, which is irregular
Management verifications: first level
checks by Management Authorities
(MA).
Certification, audit opinion and annual
Coverage: fixed in sector-specific rules
Depth:
- management verifications: performance of first-level checks
(administrative and on the spot controls).
- certification: additional verification (desk checks and on the spot).
Effectiveness: error rates as reported by the Member States., annual audit opinions (or certificate opinions) of the Member States, MS recoveries (if applicable)
Efficiency: time to lift interruption of payments11
11 impacted by the complexity of the issues and the time required by MS to react.
regio_aar_2018_annexes
26
or non-compliant with EU
and/or national eligibility rules
and legislation.
report by the relevant authorities
designated/accredited.
- audit opinion: system audits on the checks already carried out,
where necessary with re-performance of on-the-spot checks; where
applicable, audits of operations (on a statistical basis) and additional
substantive testing on expenditure.
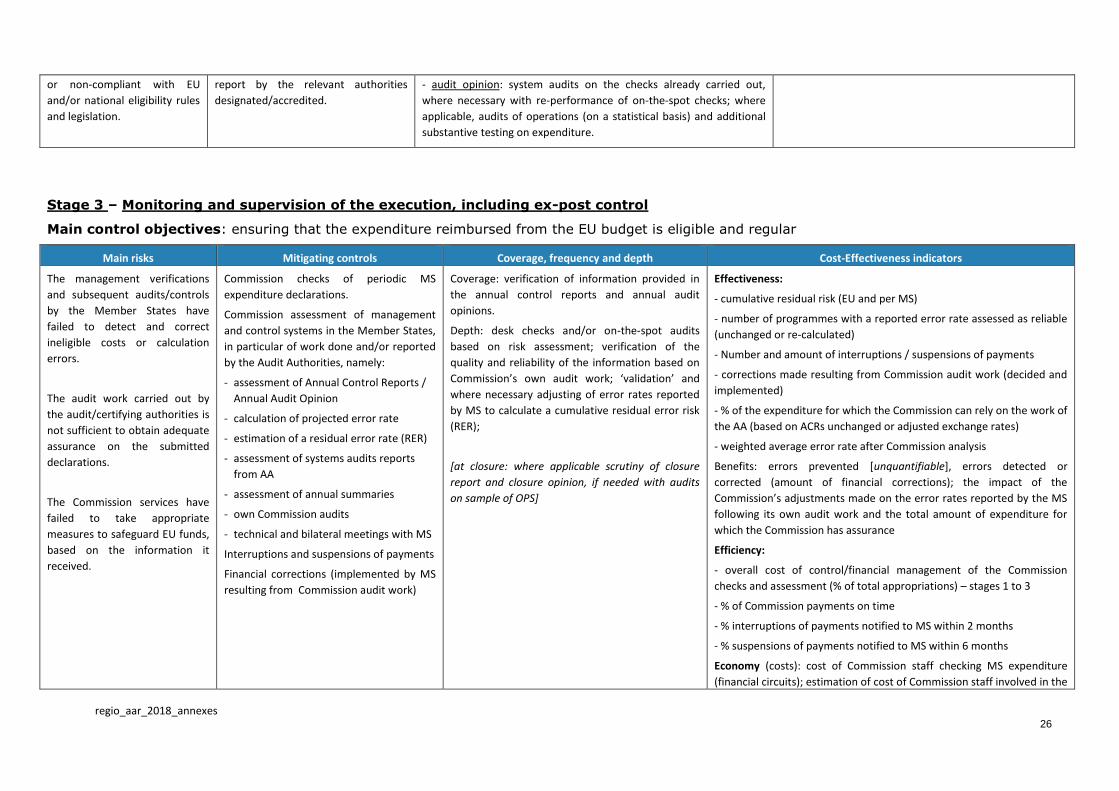
Stage 3 – Monitoring and supervision of the execution, including ex-post control
Main control objectives: ensuring that the expenditure reimbursed from the EU budget is eligible and regular
Main risks Mitigating controls Coverage, frequency and depth Cost-Effectiveness indicators
The management verifications
and subsequent audits/controls
by the Member States have
failed to detect and correct
ineligible costs or calculation
errors.
The audit work carried out by
the audit/certifying authorities is
not sufficient to obtain adequate
assurance on the submitted
declarations.
The Commission services have
failed to take appropriate
measures to safeguard EU funds,
based on the information it
received.
Commission checks of periodic MS
expenditure declarations.
Commission assessment of management
and control systems in the Member States,
in particular of work done and/or reported
by the Audit Authorities, namely:
- assessment of Annual Control Reports /
Annual Audit Opinion
- calculation of projected error rate
- estimation of a residual error rate (RER)
- assessment of systems audits reports
from AA
- assessment of annual summaries
- own Commission audits
- technical and bilateral meetings with MS
Interruptions and suspensions of payments
Financial corrections (implemented by MS
resulting from Commission audit work)
Coverage: verification of information provided in
the annual control reports and annual audit
opinions.
Depth: desk checks and/or on-the-spot audits
based on risk assessment; verification of the
quality and reliability of the information based on
Commission’s own audit work; ‘validation’ and
where necessary adjusting of error rates reported
by MS to calculate a cumulative residual error risk
(RER);
[at closure: where applicable scrutiny of closure
report and closure opinion, if needed with audits
on sample of OPS]
Effectiveness:
- cumulative residual risk (EU and per MS)
- number of programmes with a reported error rate assessed as reliable
(unchanged or re-calculated)
- Number and amount of interruptions / suspensions of payments
- corrections made resulting from Commission audit work (decided and
implemented)
- % of the expenditure for which the Commission can rely on the work of
the AA (based on ACRs unchanged or adjusted exchange rates)
- weighted average error rate after Commission analysis
Benefits: errors prevented [unquantifiable], errors detected or
corrected (amount of financial corrections); the impact of the
Commission’s adjustments made on the error rates reported by the MS
following its own audit work and the total amount of expenditure for
which the Commission has assurance
Efficiency:
- overall cost of control/financial management of the Commission
checks and assessment (% of total appropriations) – stages 1 to 3
- % of Commission payments on time
- % interruptions of payments notified to MS within 2 months
- % suspensions of payments notified to MS within 6 months
Economy (costs): cost of Commission staff checking MS expenditure
(financial circuits); estimation of cost of Commission staff involved in the
regio_aar_2018_annexes
27
Main risks Mitigating controls Coverage, frequency and depth Cost-Effectiveness indicators
assessment of management and control systems in MS, including
analysis of Annual Control Reports / Annual Audit Opinion, own audit
work, and drafting of interruption/suspension/financial correction
letters
28 regio_aar_2018_annexes
ANNEX 6: Implementation through national or
international public-sector bodies and bodies governed by private law with a public sector mission
Not applicable.
29 regio_aar_2018_annexes
ANNEX 7: EAMR of the Union Delegations
Not applicable.

regio_aar_2018_annexes
30
ANNEX 8: Decentralised agencies
Not applicable.
31 regio_aar_2018_annexes
ANNEX 9: Evaluations and other studies finalised or cancelled during the year
Project ID
Title Internal ID Overview Reason
12 (in terms of type of
measure / initiative evaluated: FC; E; R; C; I; O)
Associated
services Cost Notes
13 Title of the deliverable
14
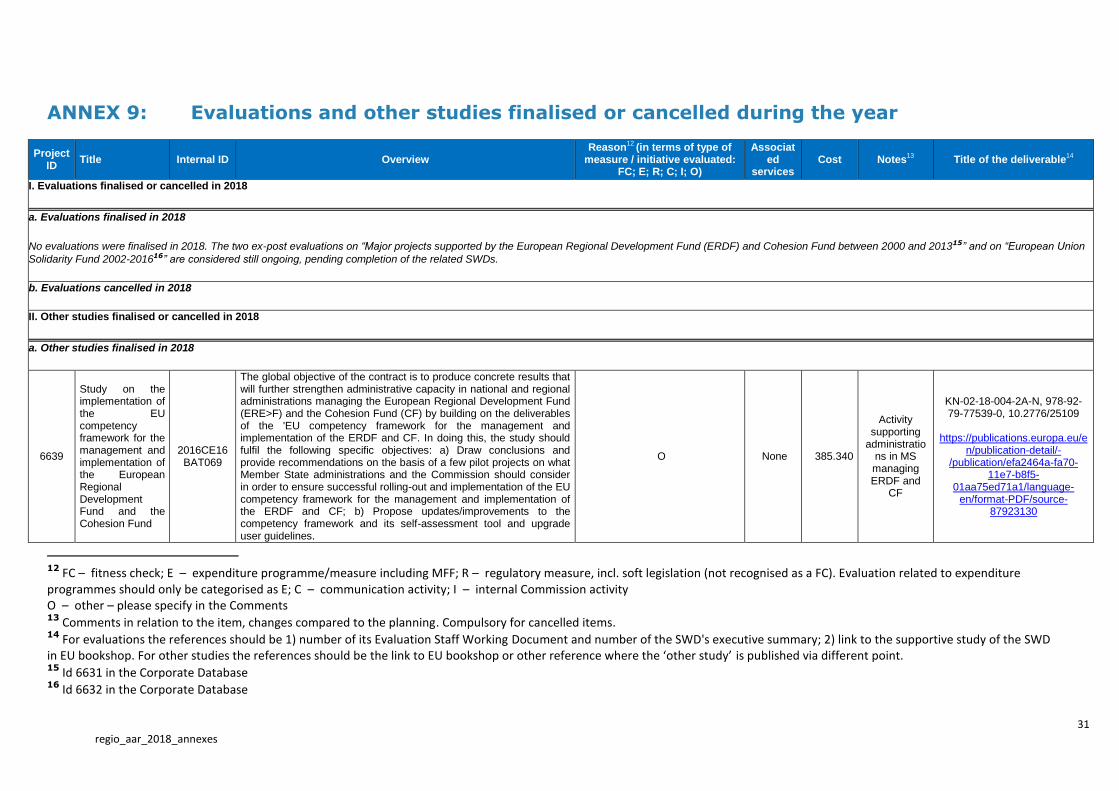
I. Evaluations finalised or cancelled in 2018
a. Evaluations finalised in 2018
No evaluations were finalised in 2018. The two ex-post evaluations on “Major projects supported by the European Regional Development Fund (ERDF) and Cohesion Fund between 2000 and 201315” and on “European Union
Solidarity Fund 2002-201616” are considered still ongoing, pending completion of the related SWDs.
b. Evaluations cancelled in 2018
II. Other studies finalised or cancelled in 2018
a. Other studies finalised in 2018
6639
Study on the implementation of the EU competency framework for the management and implementation of the European Regional Development Fund and the Cohesion Fund
2016CE16BAT069
The global objective of the contract is to produce concrete results that will further strengthen administrative capacity in national and regional administrations managing the European Regional Development Fund (ERE>F) and the Cohesion Fund (CF) by building on the deliverables of the 'EU competency framework for the management and implementation of the ERDF and CF. In doing this, the study should fulfil the following specific objectives: a) Draw conclusions and provide recommendations on the basis of a few pilot projects on what Member State administrations and the Commission should consider in order to ensure successful rolling-out and implementation of the EU competency framework for the management and implementation of the ERDF and CF; b) Propose updates/improvements to the competency framework and its self-assessment tool and upgrade user guidelines.
O None 385.340
Activity supporting
administrations in MS managing ERDF and
CF
KN-02-18-004-2A-N, 978-92-79-77539-0, 10.2776/25109
https://publications.europa.eu/e
n/publication-detail/-/publication/efa2464a-fa70-
11e7-b8f5-01aa75ed71a1/language-
en/format-PDF/source-87923130
12 FC – fitness check; E – expenditure programme/measure including MFF; R – regulatory measure, incl. soft legislation (not recognised as a FC). Evaluation related to expenditure programmes should only be categorised as E; C – communication activity; I – internal Commission activity O – other – please specify in the Comments 13 Comments in relation to the item, changes compared to the planning. Compulsory for cancelled items. 14 For evaluations the references should be 1) number of its Evaluation Staff Working Document and number of the SWD's executive summary; 2) link to the supportive study of the SWD in EU bookshop. For other studies the references should be the link to EU bookshop or other reference where the ‘other study’ is published via different point. 15 Id 6631 in the Corporate Database 16 Id 6632 in the Corporate Database
regio_aar_2018_annexes
32
Project ID
Title Internal ID Overview Reason
12 (in terms of type of
measure / initiative evaluated: FC; E; R; C; I; O)
Associated
services Cost Notes
13 Title of the deliverable
14
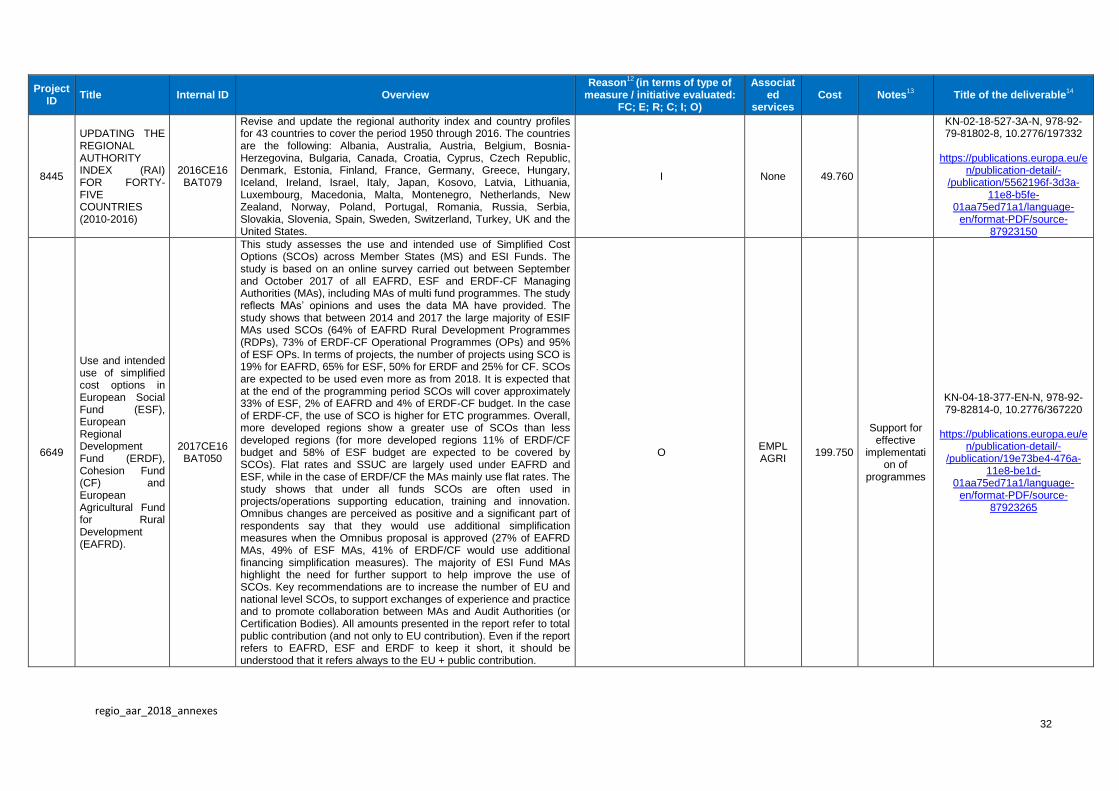
8445
UPDATING THE REGIONAL AUTHORITY INDEX (RAI) FOR FORTY-FIVE COUNTRIES (2010-2016)
2016CE16BAT079
Revise and update the regional authority index and country profiles for 43 countries to cover the period 1950 through 2016. The countries are the following: Albania, Australia, Austria, Belgium, Bosnia-Herzegovina, Bulgaria, Canada, Croatia, Cyprus, Czech Republic, Denmark, Estonia, Finland, France, Germany, Greece, Hungary, Iceland, Ireland, Israel, Italy, Japan, Kosovo, Latvia, Lithuania, Luxembourg, Macedonia, Malta, Montenegro, Netherlands, New Zealand, Norway, Poland, Portugal, Romania, Russia, Serbia, Slovakia, Slovenia, Spain, Sweden, Switzerland, Turkey, UK and the United States.
I None 49.760
KN-02-18-527-3A-N, 978-92-79-81802-8, 10.2776/197332
https://publications.europa.eu/e
n/publication-detail/-/publication/5562196f-3d3a-
11e8-b5fe-01aa75ed71a1/language-
en/format-PDF/source-87923150
6649
Use and intended use of simplified cost options in European Social Fund (ESF), European Regional Development Fund (ERDF), Cohesion Fund (CF) and European Agricultural Fund for Rural Development (EAFRD).
2017CE16BAT050
This study assesses the use and intended use of Simplified Cost Options (SCOs) across Member States (MS) and ESI Funds. The study is based on an online survey carried out between September and October 2017 of all EAFRD, ESF and ERDF-CF Managing Authorities (MAs), including MAs of multi fund programmes. The study reflects MAs’ opinions and uses the data MA have provided. The study shows that between 2014 and 2017 the large majority of ESIF MAs used SCOs (64% of EAFRD Rural Development Programmes (RDPs), 73% of ERDF-CF Operational Programmes (OPs) and 95% of ESF OPs. In terms of projects, the number of projects using SCO is 19% for EAFRD, 65% for ESF, 50% for ERDF and 25% for CF. SCOs are expected to be used even more as from 2018. It is expected that at the end of the programming period SCOs will cover approximately 33% of ESF, 2% of EAFRD and 4% of ERDF-CF budget. In the case of ERDF-CF, the use of SCO is higher for ETC programmes. Overall, more developed regions show a greater use of SCOs than less developed regions (for more developed regions 11% of ERDF/CF budget and 58% of ESF budget are expected to be covered by SCOs). Flat rates and SSUC are largely used under EAFRD and ESF, while in the case of ERDF/CF the MAs mainly use flat rates. The study shows that under all funds SCOs are often used in projects/operations supporting education, training and innovation. Omnibus changes are perceived as positive and a significant part of respondents say that they would use additional simplification measures when the Omnibus proposal is approved (27% of EAFRD MAs, 49% of ESF MAs, 41% of ERDF/CF would use additional financing simplification measures). The majority of ESI Fund MAs highlight the need for further support to help improve the use of SCOs. Key recommendations are to increase the number of EU and national level SCOs, to support exchanges of experience and practice and to promote collaboration between MAs and Audit Authorities (or Certification Bodies). All amounts presented in the report refer to total public contribution (and not only to EU contribution). Even if the report refers to EAFRD, ESF and ERDF to keep it short, it should be understood that it refers always to the EU + public contribution.
O EMPL AGRI
199.750
Support for effective
implementation of
programmes
KN-04-18-377-EN-N, 978-92-79-82814-0, 10.2776/367220
https://publications.europa.eu/e
n/publication-detail/-/publication/19e73be4-476a-
11e8-be1d-01aa75ed71a1/language-
en/format-PDF/source-87923265
regio_aar_2018_annexes
33
Project ID
Title Internal ID Overview Reason
12 (in terms of type of
measure / initiative evaluated: FC; E; R; C; I; O)
Associated
services Cost Notes
13 Title of the deliverable
14
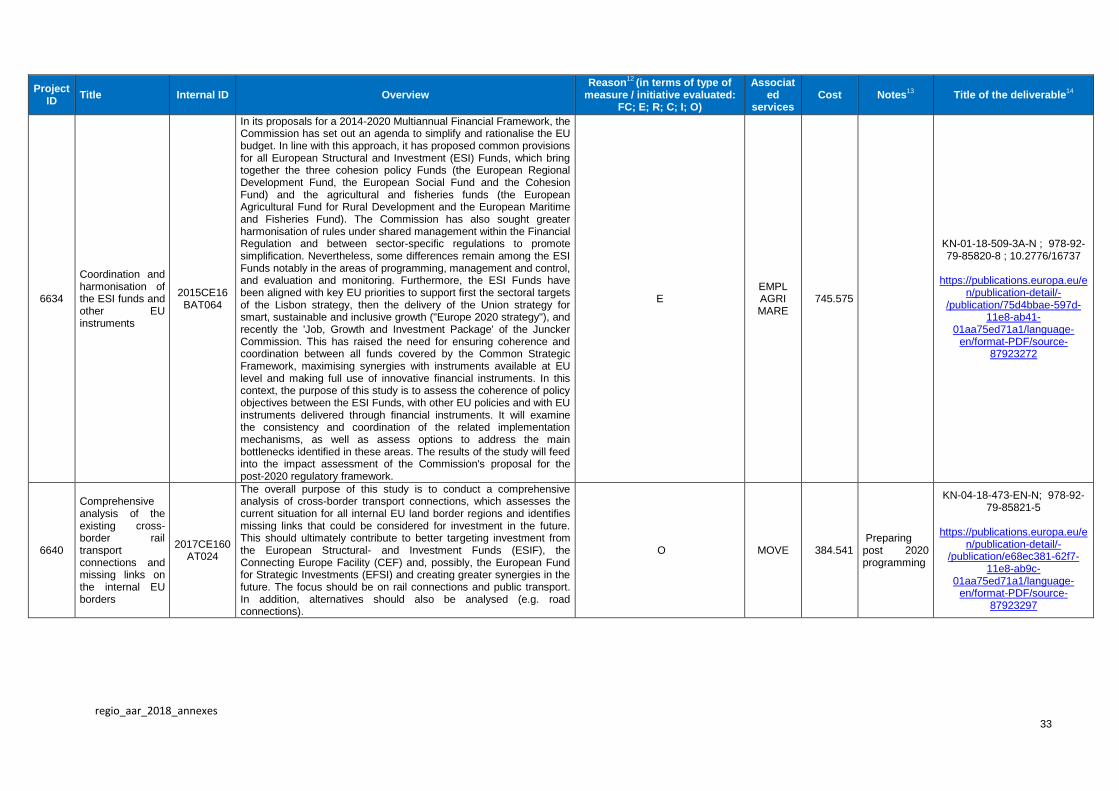
6634
Coordination and harmonisation of the ESI funds and other EU instruments
2015CE16BAT064
In its proposals for a 2014-2020 Multiannual Financial Framework, the Commission has set out an agenda to simplify and rationalise the EU budget. In line with this approach, it has proposed common provisions for all European Structural and Investment (ESI) Funds, which bring together the three cohesion policy Funds (the European Regional Development Fund, the European Social Fund and the Cohesion Fund) and the agricultural and fisheries funds (the European Agricultural Fund for Rural Development and the European Maritime and Fisheries Fund). The Commission has also sought greater harmonisation of rules under shared management within the Financial Regulation and between sector-specific regulations to promote simplification. Nevertheless, some differences remain among the ESI Funds notably in the areas of programming, management and control, and evaluation and monitoring. Furthermore, the ESI Funds have been aligned with key EU priorities to support first the sectoral targets of the Lisbon strategy, then the delivery of the Union strategy for smart, sustainable and inclusive growth ("Europe 2020 strategy"), and recently the 'Job, Growth and Investment Package' of the Juncker Commission. This has raised the need for ensuring coherence and coordination between all funds covered by the Common Strategic Framework, maximising synergies with instruments available at EU level and making full use of innovative financial instruments. In this context, the purpose of this study is to assess the coherence of policy objectives between the ESI Funds, with other EU policies and with EU instruments delivered through financial instruments. It will examine the consistency and coordination of the related implementation mechanisms, as well as assess options to address the main bottlenecks identified in these areas. The results of the study will feed into the impact assessment of the Commission's proposal for the post-2020 regulatory framework.
E EMPL AGRI MARE
745.575
KN-01-18-509-3A-N ; 978-92-79-85820-8 ; 10.2776/16737
https://publications.europa.eu/e
n/publication-detail/-/publication/75d4bbae-597d-
11e8-ab41-01aa75ed71a1/language-
en/format-PDF/source-87923272
6640
Comprehensive analysis of the existing cross-border rail transport connections and missing links on the internal EU borders
2017CE160AT024
The overall purpose of this study is to conduct a comprehensive analysis of cross-border transport connections, which assesses the current situation for all internal EU land border regions and identifies missing links that could be considered for investment in the future. This should ultimately contribute to better targeting investment from the European Structural- and Investment Funds (ESIF), the Connecting Europe Facility (CEF) and, possibly, the European Fund for Strategic Investments (EFSI) and creating greater synergies in the future. The focus should be on rail connections and public transport. In addition, alternatives should also be analysed (e.g. road connections).
O MOVE 384.541 Preparing post 2020 programming
KN-04-18-473-EN-N; 978-92-79-85821-5
https://publications.europa.eu/e
n/publication-detail/-/publication/e68ec381-62f7-
11e8-ab9c-01aa75ed71a1/language-
en/format-PDF/source-87923297
regio_aar_2018_annexes
34
Project ID
Title Internal ID Overview Reason
12 (in terms of type of
measure / initiative evaluated: FC; E; R; C; I; O)
Associated
services Cost Notes
13 Title of the deliverable
14
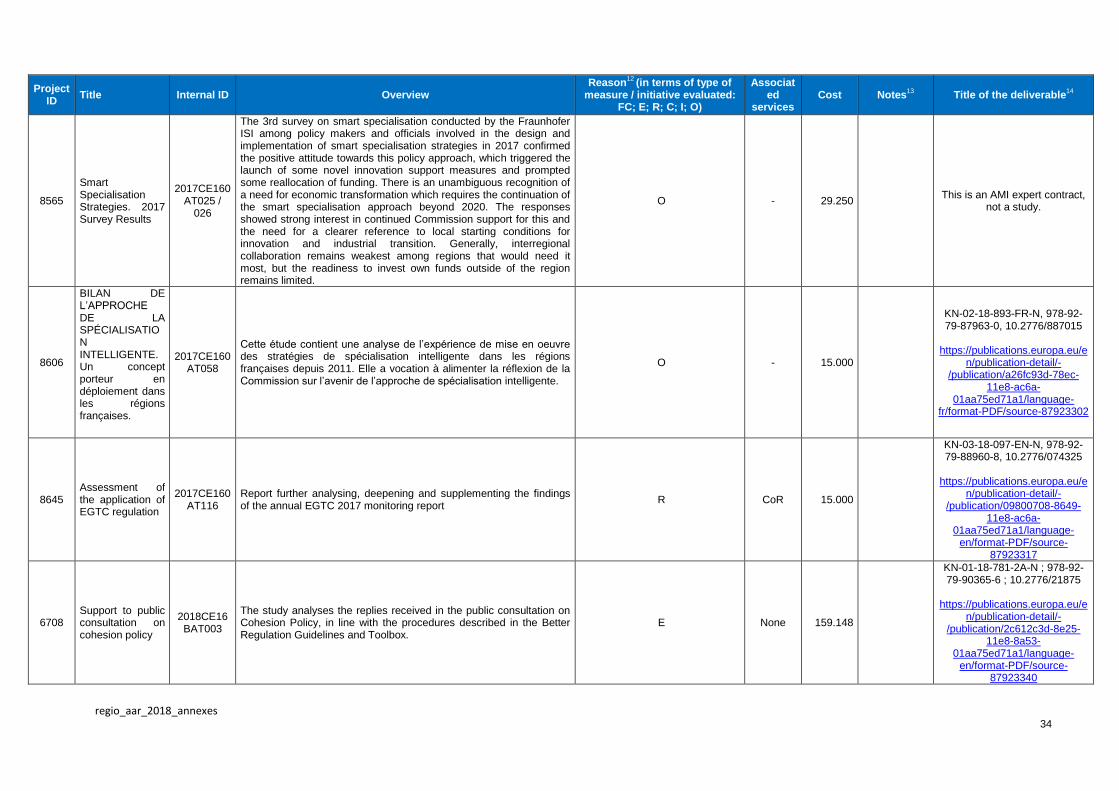
8565
Smart Specialisation Strategies. 2017 Survey Results
2017CE160AT025 /
026
The 3rd survey on smart specialisation conducted by the Fraunhofer ISI among policy makers and officials involved in the design and implementation of smart specialisation strategies in 2017 confirmed the positive attitude towards this policy approach, which triggered the launch of some novel innovation support measures and prompted some reallocation of funding. There is an unambiguous recognition of a need for economic transformation which requires the continuation of the smart specialisation approach beyond 2020. The responses showed strong interest in continued Commission support for this and the need for a clearer reference to local starting conditions for innovation and industrial transition. Generally, interregional collaboration remains weakest among regions that would need it most, but the readiness to invest own funds outside of the region remains limited.
O - 29.250
This is an AMI expert contract, not a study.
8606
BILAN DE L’APPROCHE DE LA SPÉCIALISATION INTELLIGENTE. Un concept porteur en déploiement dans les régions françaises.
2017CE160AT058
Cette étude contient une analyse de l’expérience de mise en oeuvre des stratégies de spécialisation intelligente dans les régions françaises depuis 2011. Elle a vocation à alimenter la réflexion de la Commission sur l’avenir de l’approche de spécialisation intelligente.
O - 15.000
KN-02-18-893-FR-N, 978-92-79-87963-0, 10.2776/887015
https://publications.europa.eu/e
n/publication-detail/-/publication/a26fc93d-78ec-
11e8-ac6a-01aa75ed71a1/language-
fr/format-PDF/source-87923302
8645 Assessment of the application of EGTC regulation
2017CE160AT116
Report further analysing, deepening and supplementing the findings of the annual EGTC 2017 monitoring report
R CoR 15.000
KN-03-18-097-EN-N, 978-92-79-88960-8, 10.2776/074325
https://publications.europa.eu/e
n/publication-detail/-/publication/09800708-8649-
11e8-ac6a-01aa75ed71a1/language-
en/format-PDF/source-87923317
6708 Support to public consultation on cohesion policy
2018CE16BAT003
The study analyses the replies received in the public consultation on Cohesion Policy, in line with the procedures described in the Better Regulation Guidelines and Toolbox.
E None 159.148
KN-01-18-781-2A-N ; 978-92-79-90365-6 ; 10.2776/21875
https://publications.europa.eu/e
n/publication-detail/-/publication/2c612c3d-8e25-
11e8-8a53-01aa75ed71a1/language-
en/format-PDF/source-87923340
regio_aar_2018_annexes
35
Project ID
Title Internal ID Overview Reason
12 (in terms of type of
measure / initiative evaluated: FC; E; R; C; I; O)
Associated
services Cost Notes
13 Title of the deliverable
14
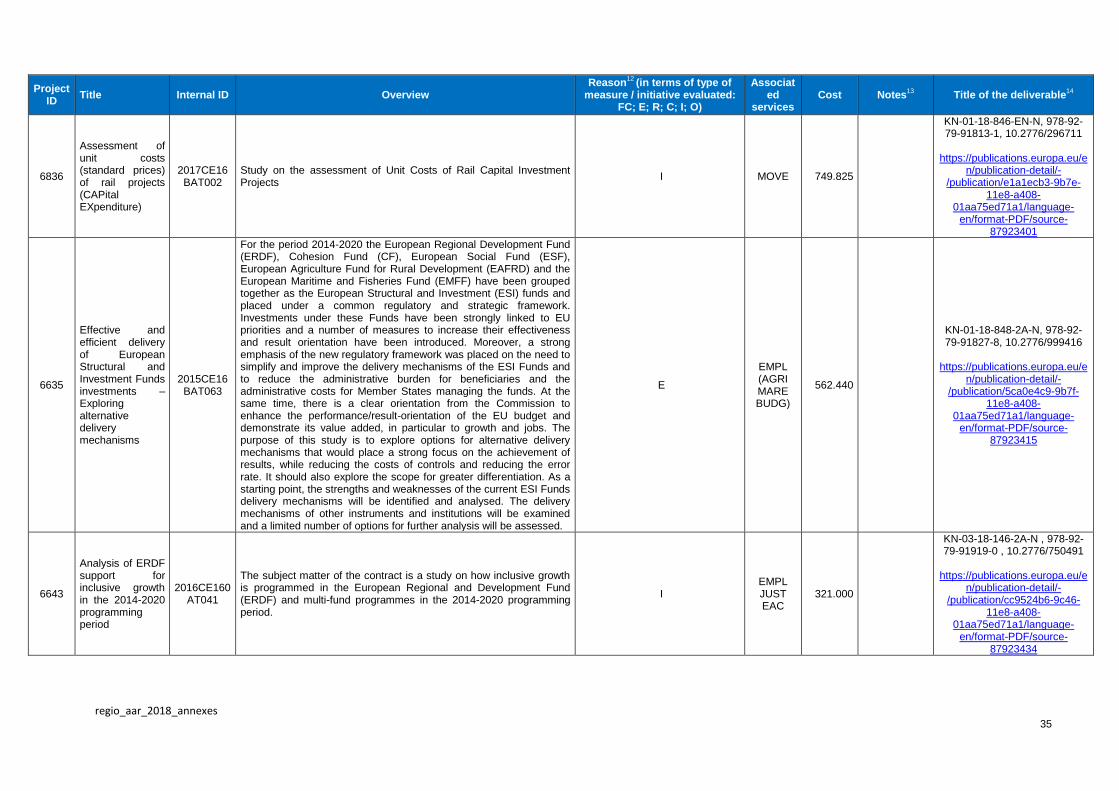
6836
Assessment of unit costs (standard prices) of rail projects (CAPital EXpenditure)
2017CE16BAT002
Study on the assessment of Unit Costs of Rail Capital Investment Projects
I MOVE 749.825
KN-01-18-846-EN-N, 978-92-79-91813-1, 10.2776/296711
https://publications.europa.eu/e
n/publication-detail/-/publication/e1a1ecb3-9b7e-
11e8-a408-01aa75ed71a1/language-
en/format-PDF/source-87923401
6635
Effective and efficient delivery of European Structural and Investment Funds investments – Exploring alternative delivery mechanisms
2015CE16BAT063
For the period 2014-2020 the European Regional Development Fund (ERDF), Cohesion Fund (CF), European Social Fund (ESF), European Agriculture Fund for Rural Development (EAFRD) and the European Maritime and Fisheries Fund (EMFF) have been grouped together as the European Structural and Investment (ESI) funds and placed under a common regulatory and strategic framework. Investments under these Funds have been strongly linked to EU priorities and a number of measures to increase their effectiveness and result orientation have been introduced. Moreover, a strong emphasis of the new regulatory framework was placed on the need to simplify and improve the delivery mechanisms of the ESI Funds and to reduce the administrative burden for beneficiaries and the administrative costs for Member States managing the funds. At the same time, there is a clear orientation from the Commission to enhance the performance/result-orientation of the EU budget and demonstrate its value added, in particular to growth and jobs. The purpose of this study is to explore options for alternative delivery mechanisms that would place a strong focus on the achievement of results, while reducing the costs of controls and reducing the error rate. It should also explore the scope for greater differentiation. As a starting point, the strengths and weaknesses of the current ESI Funds delivery mechanisms will be identified and analysed. The delivery mechanisms of other instruments and institutions will be examined and a limited number of options for further analysis will be assessed.
E
EMPL (AGRI MARE BUDG)
562.440
KN-01-18-848-2A-N, 978-92-79-91827-8, 10.2776/999416
https://publications.europa.eu/e
n/publication-detail/-/publication/5ca0e4c9-9b7f-
11e8-a408-01aa75ed71a1/language-
en/format-PDF/source-87923415
6643
Analysis of ERDF support for inclusive growth in the 2014-2020 programming period
2016CE160AT041
The subject matter of the contract is a study on how inclusive growth is programmed in the European Regional and Development Fund (ERDF) and multi-fund programmes in the 2014-2020 programming period.
I EMPL JUST EAC
321.000
KN-03-18-146-2A-N , 978-92-79-91919-0 , 10.2776/750491
https://publications.europa.eu/e
n/publication-detail/-/publication/cc9524b6-9c46-
11e8-a408-01aa75ed71a1/language-
en/format-PDF/source-87923434
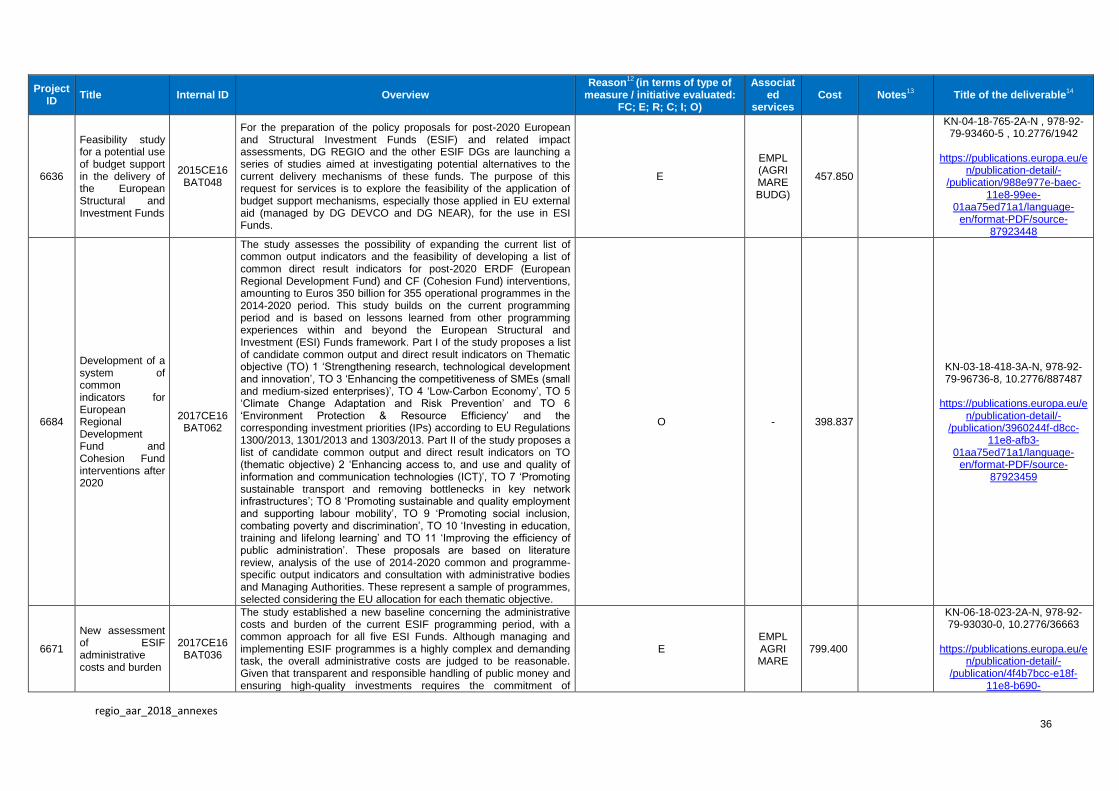
regio_aar_2018_annexes
36
Project ID
Title Internal ID Overview Reason
12 (in terms of type of
measure / initiative evaluated: FC; E; R; C; I; O)
Associated
services Cost Notes
13 Title of the deliverable
14
6636
Feasibility study for a potential use of budget support in the delivery of the European Structural and Investment Funds
2015CE16BAT048
For the preparation of the policy proposals for post-2020 European and Structural Investment Funds (ESIF) and related impact assessments, DG REGIO and the other ESIF DGs are launching a series of studies aimed at investigating potential alternatives to the current delivery mechanisms of these funds. The purpose of this request for services is to explore the feasibility of the application of budget support mechanisms, especially those applied in EU external aid (managed by DG DEVCO and DG NEAR), for the use in ESI Funds.
E
EMPL (AGRI MARE BUDG)
457.850
KN-04-18-765-2A-N , 978-92-79-93460-5 , 10.2776/1942
https://publications.europa.eu/e
n/publication-detail/-/publication/988e977e-baec-
11e8-99ee-01aa75ed71a1/language-
en/format-PDF/source-87923448
6684
Development of a system of common indicators for European Regional Development Fund and Cohesion Fund interventions after 2020
2017CE16BAT062
The study assesses the possibility of expanding the current list of common output indicators and the feasibility of developing a list of common direct result indicators for post-2020 ERDF (European Regional Development Fund) and CF (Cohesion Fund) interventions, amounting to Euros 350 billion for 355 operational programmes in the 2014-2020 period. This study builds on the current programming period and is based on lessons learned from other programming experiences within and beyond the European Structural and Investment (ESI) Funds framework. Part I of the study proposes a list of candidate common output and direct result indicators on Thematic objective (TO) 1 ‘Strengthening research, technological development and innovation’, TO 3 ‘Enhancing the competitiveness of SMEs (small and medium-sized enterprises)’, TO 4 ‘Low-Carbon Economy’, TO 5 ‘Climate Change Adaptation and Risk Prevention’ and TO 6 ‘Environment Protection & Resource Efficiency’ and the corresponding investment priorities (IPs) according to EU Regulations 1300/2013, 1301/2013 and 1303/2013. Part II of the study proposes a list of candidate common output and direct result indicators on TO (thematic objective) 2 ‘Enhancing access to, and use and quality of information and communication technologies (ICT)’, TO 7 ‘Promoting sustainable transport and removing bottlenecks in key network infrastructures’; TO 8 ‘Promoting sustainable and quality employment and supporting labour mobility’, TO 9 ‘Promoting social inclusion, combating poverty and discrimination’, TO 10 ‘Investing in education, training and lifelong learning’ and TO 11 ‘Improving the efficiency of public administration’. These proposals are based on literature review, analysis of the use of 2014-2020 common and programme-specific output indicators and consultation with administrative bodies and Managing Authorities. These represent a sample of programmes, selected considering the EU allocation for each thematic objective.
O - 398.837
KN-03-18-418-3A-N, 978-92-79-96736-8, 10.2776/887487
https://publications.europa.eu/e
n/publication-detail/-/publication/3960244f-d8cc-
11e8-afb3-01aa75ed71a1/language-
en/format-PDF/source-87923459
6671
New assessment of ESIF administrative costs and burden
2017CE16BAT036
The study established a new baseline concerning the administrative costs and burden of the current ESIF programming period, with a common approach for all five ESI Funds. Although managing and implementing ESIF programmes is a highly complex and demanding task, the overall administrative costs are judged to be reasonable. Given that transparent and responsible handling of public money and ensuring high-quality investments requires the commitment of
E EMPL AGRI MARE
799.400
KN-06-18-023-2A-N, 978-92-79-93030-0, 10.2776/36663
https://publications.europa.eu/e
n/publication-detail/-/publication/4f4b7bcc-e18f-
11e8-b690-

regio_aar_2018_annexes
37
Project ID
Title Internal ID Overview Reason
12 (in terms of type of
measure / initiative evaluated: FC; E; R; C; I; O)
Associated
services Cost Notes
13 Title of the deliverable
14
considerable administrative resources, 4% of administrative costs (average aggregated costs, taking into account the weighted allocation of Funds) that are some 26 billion EUR or 610 000 FTE over a programming period handling 646 billion EUR are not considered excessive. This corresponds to 40 300 EUR respectively 0.95 person years per million Euro of eligible budget including national co-financing. These costs are also consistent with the volume of support granted under technical assistance. Overall, there are considerable variations in administrative costs between ESI Funds and types of Operational Programmes. The programme characteristics influencing administrative costs the most are the financial volume, the number of beneficiaries and the thematic focus of the programme. Clear reductions of administrative costs and burden resulting from regulatory innovations found in the post-2020 CPR proposal are expected. The most effective simplifications are the reduction of the number of verifications and the increased uptake of Simplified Cost Options (SCOs).
01aa75ed71a1/language-en/format-PDF/source-
87923468
9061 Border Region Data collection
2016CE16BAT105
Result of a pilot project ‘Cross-border data collection’ carried out by a consortium of statistical institutes. The objective was to develop methodology to produce cross-border information. The project took the theme of labour market as the focus of the attention as a case study to show what is possible. The project investigated the potential of three types of data sources in parallel: the Labour Force Survey (LFS), Administrative data and Mobile phone data
I None 249.941
KN-05-18-050-EN-N, 978-92-79-96916-4, 10.2776/182672
https://publications.europa.eu/e
n/publication-detail/-/publication/7c09078b-e308-
11e8-b690-01aa75ed71a1/language-
en/format-PDF/source-87923484
6688 Study on complaints-handling systems
2016CE16BAT102 / 2017CE16BAT061
The Study provides information about the complaints-handling arrangements in the EU Member States. Based on Regulation (EU) 1303/2013 laying down common provisions on the European Structural and Investment Funds, the Member States should ensure that effective arrangements for examination of complaints are in place. According to the Study, in most cases the Member States have standardised complaints-handling arrangements based on national laws or programme documents. The arrangements among the EU Member States are effective overall. Moreover, the complaints-handling arrangements are more developed in the 2014-2020 programming period compared to the arrangements in the 2007-2013 period. In comparison to the national funding programmes, the arrangements for the ESIF in 2014-2020 period are generally more developed. Lastly, the Study presents the good examples of complaints-handling arrangements within the Member States. The Study includes general description of the arrangements on the EU level and provides further details about each Member State.
R - 337.000
KN-06-18-052-2A-N; 978-92-79-93461-2, 10.2776/769863
https://publications.europa.eu/e
n/publication-detail/-/publication/92edbbd7-e888-
11e8-b690-01aa75ed71a1/language-
en/format-PDF/source-87923505
9492 Climate change adaptation of major
2016CE16BAT088
This study reviewed the availability of resource materials that can support infrastructure project developers to take into account climate change adaptation. It provides an overall stock-taking of available
I CLIMA 750.000 KN-06-18-115-EN-N , 978-92-
79-94166-5

regio_aar_2018_annexes
38
Project ID
Title Internal ID Overview Reason
12 (in terms of type of
measure / initiative evaluated: FC; E; R; C; I; O)
Associated
services Cost Notes
13 Title of the deliverable
14
infrastructure projects. A stock-taking of available resources to assist the development of climate resilient infrastructure
resources that contribute to the preparedness of all Member States with regards to applying the climate change requirements of the European Structural and Investment Funds programming period 2014-2020. Finally, it identifies some of the ongoing good practices of Member States in adapting to climate change.
https://publications.europa.eu/en/publication-detail/-
/publication/f0f94799-db2d-11e8-afb3-
01aa75ed71a1/language-en/format-PDF/source-
87923525
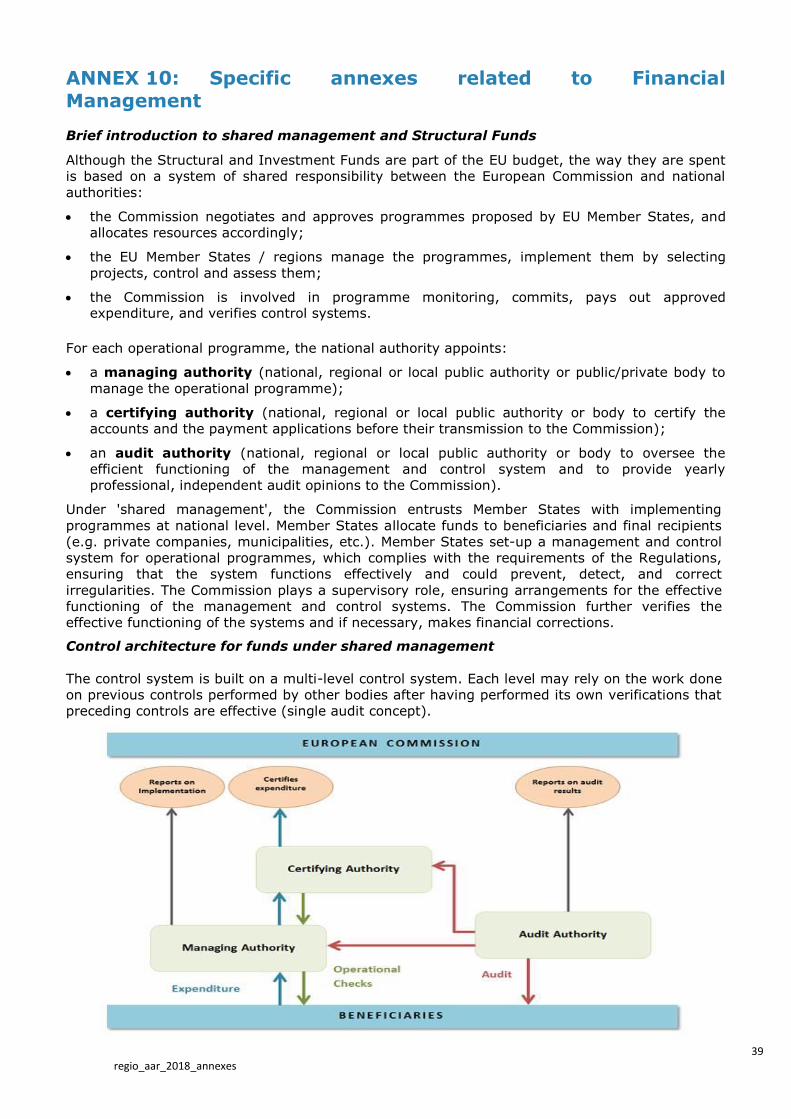
39 regio_aar_2018_annexes
ANNEX 10: Specific annexes related to Financial
Management
Brief introduction to shared management and Structural Funds
Although the Structural and Investment Funds are part of the EU budget, the way they are spent
is based on a system of shared responsibility between the European Commission and national
authorities:
the Commission negotiates and approves programmes proposed by EU Member States, and
allocates resources accordingly;
the EU Member States / regions manage the programmes, implement them by selecting
projects, control and assess them;
the Commission is involved in programme monitoring, commits, pays out approved expenditure, and verifies control systems.
For each operational programme, the national authority appoints:
a managing authority (national, regional or local public authority or public/private body to
manage the operational programme);
a certifying authority (national, regional or local public authority or body to certify the
accounts and the payment applications before their transmission to the Commission);
an audit authority (national, regional or local public authority or body to oversee the
efficient functioning of the management and control system and to provide yearly
professional, independent audit opinions to the Commission).
Under 'shared management', the Commission entrusts Member States with implementing
programmes at national level. Member States allocate funds to beneficiaries and final recipients
(e.g. private companies, municipalities, etc.). Member States set-up a management and control
system for operational programmes, which complies with the requirements of the Regulations,
ensuring that the system functions effectively and could prevent, detect, and correct
irregularities. The Commission plays a supervisory role, ensuring arrangements for the effective
functioning of the management and control systems. The Commission further verifies the
effective functioning of the systems and if necessary, makes financial corrections.
Control architecture for funds under shared management
The control system is built on a multi-level control system. Each level may rely on the work done
on previous controls performed by other bodies after having performed its own verifications that
preceding controls are effective (single audit concept).
regio_aar_2018_annexes
40
The assurance on legality and regularity of operations is built on work carried out at two levels:
1. At Member States level, the daily control framework is the following:
The Managing Authority performs management verifications before declaring
expenditure, ex-ante documentary checks on all payment claims and ex-ante or ex-post
on-the-spot checks on a sample of operations;
The Certifying Authority17 relies on this first level of verification before declaring
statements of expenditure to the Commission and certifying the legality and regularity of
expenditure entered into the programme annual accounts transmitted. It takes steps to
satisfy itself that adequate controls have been made by the Managing Authority, including
carrying out its own checks when necessary;
The Audit Authority designs an audit strategy in order to perform audits of the
management and control systems and ex-post audits of a representative sample of
operations, as well as complementary audits on high-risk operations where necessary. It
provides the Commission with its results in an Annual Control Report. This report includes
an annual audit opinion on the functioning of the management and control system and on
legality and regularity. For 2014-2020, the audit authority also provides an audit opinion
on the accuracy of the accounts as well as an estimation of the residual risk of error based
on the total error rate resulting from its audit of a representative sample of operations and
the financial corrections applied before submitting the accounts.
2. At Commission level, the way in which REGIO defines its assurance for the management and
control systems for each operational program is a process based on internal control and audit
procedures carried out by audit, financial and operational units. The analysis and evaluation of
information acquired through various sources.
a) The following audit sources are used based on the application of the single audit approach
with programme audit authorities and mutualisation of audit results with other EU audit
sources in line with the single audit strategy and risk-assessment in place:
Audit authorities' work and results on both systems and operations, reported to REGIO
throughout the year (systems audit reports) or at year end (annual control reports and
audit opinions);
REGIO's desk and on-the-spot review of the work of audit authorities;
REGIO's on-the-spot system audits including at the level of operations where necessary;
Relevant audit information received from other ESIF directorates general (EMPL, MARE
and possibly AGRI)
Audits from the European Court of Auditors;
OLAF final case reports.
b) Any other source of information, formal or informal, acquired by the geographical units in
the context of their day-to-day management of the programmes are also contributing to the
assurance process, for example:
Annual Implementation Reports from the Member States;
Monitoring committees and annual meetings;
Contacts with regional and national programme managers.
Through the single audit approach, we can rely each year on audit work and opinions carried
out by audit authorities for each operational programme each year, complemented by REGIO's
risk-based audits, all programmes are covered each year. The assessment of all available audit
sources result in an Annual Audit Opinion of the Directorate General for each operational
programme. This forms the basis for management opinions by the Authorising Officers by Sub-
Delegation.
17
For the 2014-2020 period, certifying authorities can be merged with managing authorities.
regio_aar_2018_annexes
41
These combined elements allow the Directorate General to establish a level of assurance for
payments and performance of each programme.
Shared Management - ERDF and CF: A strong control framework for the 2014-2020 programming period
The Regulation for the 2014-2020 programming period introduces some major changes compared to the previous ones:
- the Commission shall reimburse as interim payments 90 % of the amount resulting from applying the co-financing rate to the eligible expenditure included in a payment application;
- in addition to the initial pre-financing, an annual pre-financing is paid before 1 July in the years 2016 to 2023;
- annual accounts have to be set up by the certifying authorities for each operational programme covering the period from 1 July to 30 June;
- an assurance package must be provided each year by 15 February by the national/regional authorities from 2016 until and including 2025:
Management Declaration and Annual Summary, prepared by the Managing Authority;
Certified Accounts, prepared by the Certifying Authority, which according to Art 137(1) of the CPR must include: a) the total amount of eligible expenditure for the accounting year concerned, the total amount of corresponding public expenditure incurred and the total amount of corresponding payments made to beneficiaries; b) the amounts withdrawn and recovered during the accounting year, the amounts to be recovered as at the end of the accounting year and the irrecoverable amounts; c) the amounts of programme contributions paid to financial instruments under Article 41(1) and the advances of State aid under Article 131(4); d) for each priority, a reconciliation between the expenditure stated in the accounts and the expenditure declared in the same accounting year, with an explanation of any differences;
Annual Control Report and Audit Opinion, prepared by the Audit Authority, based on the main findings of the system audits carried out on the functioning of the management and control system and on an appropriate sample of operations based on the declared expenditure, as well as on the accounts prepared by the certifying authority.
- The Commission shall carry out an examination of the assurance package and shall accept the accounts where it is able to conclude that the accounts are complete, accurate and true by the 31 May. If the accounts are accepted, the Commission shall pay/recover the balance within 30 days taking into account the amount declared in the annual accounts, the interim payments made during the reference period and clearing of the annual pre-financing.
When preparing the annual accounts, the certifying authorities should exclude from the accounts established irregularities resulting from the audit work and/or from adjustments made by the managing and/or the certifying authority related to declared expenditure during the accounting year as well as expenditure still subject to an ongoing assessment of its legality and regularity.
Therefore, the Management and Control System (MCS) will function as follows:
For the accounting year (1 July N-1 to 30 June N)
The managing authority/intermediate body carries out verifications until the submission of the programme accounts. It verifies that the co-financed products have been delivered, that the expenditure declared by the beneficiaries has been paid and that it complies with the applicable law, the operational programme and the conditions for support of the operation.
The verifications shall include:
a) Administrative verifications in respect of each application for reimbursement from beneficiaries;
b) On the spot verifications of operations on a sample basis.
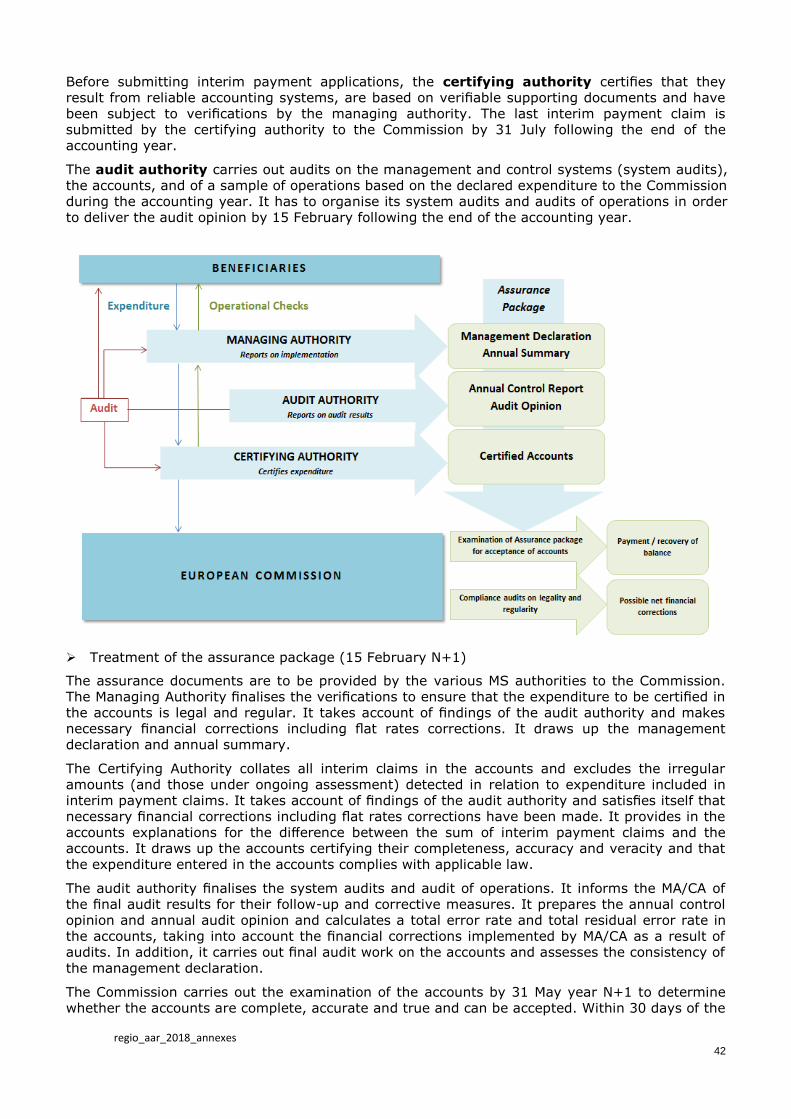
regio_aar_2018_annexes
42
Before submitting interim payment applications, the certifying authority certifies that they result from reliable accounting systems, are based on verifiable supporting documents and have been subject to verifications by the managing authority. The last interim payment claim is submitted by the certifying authority to the Commission by 31 July following the end of the accounting year.
The audit authority carries out audits on the management and control systems (system audits), the accounts, and of a sample of operations based on the declared expenditure to the Commission during the accounting year. It has to organise its system audits and audits of operations in order to deliver the audit opinion by 15 February following the end of the accounting year.
Treatment of the assurance package (15 February N+1)
The assurance documents are to be provided by the various MS authorities to the Commission. The Managing Authority finalises the verifications to ensure that the expenditure to be certified in the accounts is legal and regular. It takes account of findings of the audit authority and makes necessary financial corrections including flat rates corrections. It draws up the management declaration and annual summary.
The Certifying Authority collates all interim claims in the accounts and excludes the irregular amounts (and those under ongoing assessment) detected in relation to expenditure included in interim payment claims. It takes account of findings of the audit authority and satisfies itself that necessary financial corrections including flat rates corrections have been made. It provides in the accounts explanations for the difference between the sum of interim payment claims and the accounts. It draws up the accounts certifying their completeness, accuracy and veracity and that the expenditure entered in the accounts complies with applicable law.
The audit authority finalises the system audits and audit of operations. It informs the MA/CA of the final audit results for their follow-up and corrective measures. It prepares the annual control opinion and annual audit opinion and calculates a total error rate and total residual error rate in the accounts, taking into account the financial corrections implemented by MA/CA as a result of audits. In addition, it carries out final audit work on the accounts and assesses the consistency of the management declaration.
The Commission carries out the examination of the accounts by 31 May year N+1 to determine whether the accounts are complete, accurate and true and can be accepted. Within 30 days of the
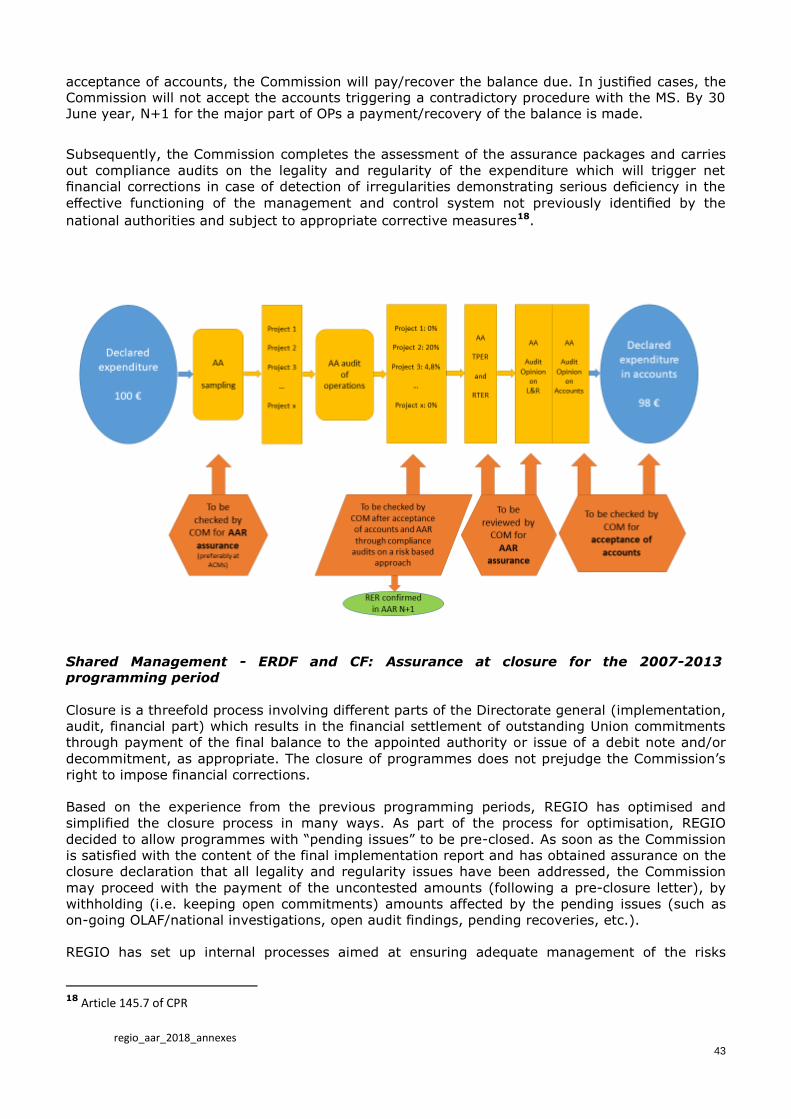
regio_aar_2018_annexes
43
acceptance of accounts, the Commission will pay/recover the balance due. In justified cases, the Commission will not accept the accounts triggering a contradictory procedure with the MS. By 30 June year, N+1 for the major part of OPs a payment/recovery of the balance is made.
Subsequently, the Commission completes the assessment of the assurance packages and carries
out compliance audits on the legality and regularity of the expenditure which will trigger net
financial corrections in case of detection of irregularities demonstrating serious deficiency in the
effective functioning of the management and control system not previously identified by the
national authorities and subject to appropriate corrective measures18.
Shared Management - ERDF and CF: Assurance at closure for the 2007-2013 programming period
Closure is a threefold process involving different parts of the Directorate general (implementation,
audit, financial part) which results in the financial settlement of outstanding Union commitments
through payment of the final balance to the appointed authority or issue of a debit note and/or
decommitment, as appropriate. The closure of programmes does not prejudge the Commission’s
right to impose financial corrections.
Based on the experience from the previous programming periods, REGIO has optimised and
simplified the closure process in many ways. As part of the process for optimisation, REGIO
decided to allow programmes with “pending issues” to be pre-closed. As soon as the Commission
is satisfied with the content of the final implementation report and has obtained assurance on the
closure declaration that all legality and regularity issues have been addressed, the Commission
may proceed with the payment of the uncontested amounts (following a pre-closure letter), by
withholding (i.e. keeping open commitments) amounts affected by the pending issues (such as
on-going OLAF/national investigations, open audit findings, pending recoveries, etc.).
REGIO has set up internal processes aimed at ensuring adequate management of the risks
18 Article 145.7 of CPR

regio_aar_2018_annexes
44
related to the legality and regularity of underlying transactions, taking into account the
multiannual character of programmes as well as the nature of the payments concerned. In this
respect, the control objective is to ensure that the residual risk of each programme does not
exceed 2% on a cumulative basis at closure and that, where this is the case, the necessary
additional financial corrections are applied at closure. Therefore, this ultimate filter ensures that
no material level of error exists in the co-funded expenditure.
If there are no pending issues identified in the programme or all pending issues have been
resolved, the final balance can be determined and paid. Consequently, a closure letter can be
sent accepting the closure documents. However, if there are pending issues identified in the
programme, the final balance cannot yet be determined and a pre-closure letter shall be sent, the
Commission pays only the uncontested amount to the Member State. Once the pending issues
are resolved, a closure letter can be sent to the Member State.
Article 89(4) of the General Regulation provides that subject to available funding, the Commission
shall pay the final balance within no more than 45 days from the latter of the following dates: the
date of the acceptance of the Final Implementation Report and the date of the acceptance of the
Closure Declaration.
Commission supervisory work carried out throughout the programming period
Closure declarations and final control reports contain a synthesis of all EU and national audit work
carried out during the programming period to monitor and mitigate irregularities and risks
identified throughout implementation. On its side, during the 2007-2013 programming period,
REGIO's audit directorate has built up significant knowledge of the effective functioning of
management and control systems at national/regional level both from monitoring and analysing
the work carried out by the audit authorities, and from its own work under different audit
enquiries, in line with its audit strategy:
Review of the work of audit authorities (for mainstream and ETC programmes) in view of
possible reliance on audit results
Monitoring of continued application of conditions for formal reliance on audit authorities in
line with Art.73
Bridging the assurance gap for the quality of management verifications, in particular for
public procurement and State Aid issues
Effectiveness of management verifications carried out under the ETC objective
Reliability of the reporting of withdrawals and recoveries
Financial instruments
Over the programming period, REGIO carried out over 580 audit missions in the Member States,
as follows:
19 The on the spot audits by Directorate General of Regional and Urban Policy covered the following ERDF/CF audit authorities responsible for audit of mainstream programmes: (1 AT, 2 BE (out of 3 AAs), 1 BG, 1 CY, 1 CZ, 11 DE ( out of 17 AAs), 1 DK, 1 EE, 1 ES, 1 FI (out of 2 AAs), 1 FR, 1 EL, 1 HR, 1 HU, 1 IE, 12 IT (out of 25 AAs), 1 LT, 1 LV, 1 MT, 1 NL, 1 PL, 1 PT, 1 RO, 1 SE, 1 SI, 1 SK and 4 UK (out of 5 AAs). LU was the only MS without on-the-spot audit by REGIO. In addition, 7 audit authorities responsible for ETC programmes only were indirectly covered by the specific ETC audits as well (the latter representing 0.36% of total ERDF allocation). 20
ERDF/CF allocation for both mainstream and ETC programmes under the audit responsibility of 75 ERDF/CF audit authorities.
Indicator (programming period 2007-2013) 2018
Reviewed audit authorities by REGIO 5219 in charge of >98% of ERDF/CF allocations20
Reliance on reviewed audit authorities by REGIO 100% of reviewed audit authorities (after action plans, where necessary)

regio_aar_2018_annexes
45
Enquiry planning memorandum21
Number of audits
Review of the work of audit authorities 241
Monitoring of Article 73 21
Fact finding audits on annual control reports and final control reports 72
Bridging the assurance gap 155
Reliability of reporting of withdrawals and recoveries 36
Financial instruments 15
Audit of the management verifications in ETC programmes 20
Audits to estimate an error rate at the beginning of the programming period (2009) 14
Performance audits (pilot exercise) 9
TOTAL 583
The validated error rates reported annually by the audit authorities reflect the effective
functioning of the management and control systems and, together with the cumulative residual
risk (taking account of the financial corrections implemented by Member States), constitute the
cornerstone of the assurance process and of the methodology to estimate the residual amount at
risk at closure.
Therefore, REGIO's audit effort focused in first instance to
ascertain the reliability to be put in the work of audit authorities.
Since 2009, 334 audits to review the audit authorities' work were
carried out. These audits contributed to capacity building, when
need for improvements or weaknesses were identified and
allowed to bring all concerned audit authorities to a common
level playing field. As a result of this exhaustive audit work,
REGIO was eventually able to rely on the work of 52 audit
authorities, in charge of auditing 98% of the ERDF/CF
expenditure in the programming period.
Where the work of the audit authorities could not be fully relied
upon, or where specific risks were not addressed in a timely way
by the audit authorities' audit strategies, REGIO carried out its own audit work to obtain direct
assurance (under the "Bridging the assurance gap" audit enquiry).
Where serious deficiencies have been detected, either through the work of the audit authorities or
from the work of the REGIO audit directorate, timely corrective actions have been taken. In
particular, through procedures for the interruption and suspension of Commission payments and
appropriate reservations entered in the annual activity reports, REGIO has systematically
requested national authorities to implement appropriate action plans to ensure the effective
functioning of the management and control systems for newly declared expenditure (to avoid
repetition of same types of irregularities) and to make proportionate financial corrections for
expenditure already declared to the Commission, when needed. The audit directorate has closely
monitored and assessed the system improvements and the corrective actions taken by the
national authorities. More than 200 of the 322 ERDF/CF programmes have gone through a
21
Audits carried out for preparation of closure are included in the respective audit enquiries, see next section.
Over 580 REGIO audits since 2009
334 to review the audit authorities' work
Reliance on work of 52 audit
authorities (auditing >98 % of ERDF/CF)
regio_aar_2018_annexes
46
warning, interruption or suspension procedure since the beginning of the programming period
(see section 2 below).
Detailed reports on the results of audit activities were systematically disclosed in each annual
activity report since 2009.
Targeted audits for preparation to closure in case of remaining risks
From 2016 till end-2018, REGIO also carried out targeted audits to address any risk that it
considered remaining high in view of the preparation for closure. These audits could cover any of
the enquiries available under the REGIO audit strategy and were tailor-made.
The audit work to prepare for closure was based on the following enquiries:
- Reliance on the work of audit authorities and monitoring Article 73
During 2016, 2017 and beginning of 2018 REGIO auditors carried out the following audits to
assess the reliance that could be placed on the work of the audit authorities in view of closure:
o 4 audits re-performing the audits of operations carried out by the audit authorities in CZ,
HR, IT and SK;
o 5 audits to prepare for closure in DE, IT (2), SI and SK;
o 21 fact-finding audits to assess the reliability of the 2015 annual control reports and the
final control reports in BG (2), CZ, DE (3), DK, EL (2), ES, FR, HU (2), IT (2), RO(3), SK
and UK (2) and one fact finding in relation to the 2016 annual control report in HR.
o 4 audits in DE, 2 in EE and PL to monitor the work of audit authorities for programmes
that were granted Article 73.
- Bridging the assurance gap
In 2016, 2017 and 2018, 9 audits were carried out under this enquiry in BG, DE, HU (3), IT (2)
and RO (2). Audits aimed to obtain direct assurance in view of closure declarations, ensuring that
identified risks were appropriately treated and adequately mitigated. The scope of the audits was
tailored to address the specific residual high risks of each programme taking into account the
results of the work of the audit authorities, systemic weaknesses previously identified, error rates
from audits of operation and effectiveness of management verifications. Other high risk areas
were also covered under this enquiry such as the inclusion of retrospective projects expenditure,
the inclusion of expenditure linked to contracts known to be affected by public procurement
irregularities for which appropriate ex-ante corrections had to be applied, risk of reduced quality
of management verifications due to higher amounts of expenditure to be certified in 2015 and
2016 and delays in certification resulting in the reduced time for audit authorities to complete
their audits of operations.
- Withdrawals and recoveries
In 2017, two audits on the spot (in Romania and Slovakia) at the level of the certifying and
managing authorities and three desk audits covering Greece, France and Italy were carried out.
In all cases, the audit work focused on the accuracy and reliability of the data reported by the
Member States on withdrawals and recoveries submitted by 31 March 2016 and in previous years
with the aim to ensure that the residual risk rate to be calculated and reported by audit
authorities at closure is reliable.
The cumulative audit work carried out throughout the programming period and the related
corrective actions taken by the national authorities have thus paved the way to closure and have
contributed significantly to limiting the risks remaining at closure.
Assessment of the final implementation reports and reported information on performance of
programmes
The Final Implementation Report (FIR) enables the Commission to check whether the
programme, as approved by the Commission, was properly implemented and whether the
programme's objectives have been reached. Therefore, it presents aggregated data and
regio_aar_2018_annexes
47
information for the entire implementing period, including data for 2015. Before being sent to the
Commission, the FIR should have been examined and approved by the Monitoring Committee.
The structure of the FIR follows the template provided the Implementing Regulation. It should
contain all the information described in Art.67(2) of the General Regulation including:
the progress made in implementing the programme;
financial information;
the measures taken to provide information on and publicise the OP;
information about significant problems; and
information about major projects implementation.
The analysis of the FIR was carried out within the regulatory deadline of the five months of its
receipt by the Commission and where necessary observations were sent to the Member State for
improvement of the document. Particular attention was given to the analysis of the outputs and
results described against the programmes' objectives.
In the course of the examination of the closure of the 2007-2013 programmes the Commission
has also examined with the Managing Authorities the final achievement values reported under
selected “core” indicators. The values are set out in Annex 12 B. All values show important
increases in the final year(s) of the eligibility period (2015 for most programmes with
implementation continuing into 2016 for Croatian, Romanian and Slovak programmes). For
instance, aggregate gross job created is now reported at 1.3 million. It is particularly striking how
values for indicators linked to major infrastructures (multi annual projects) showed significant
increases in the final report, i.e. population covered by broadband access, or served by water and
waste water projects have increase almost 3 times in comparison with 2014 values, which could
be explained by the fact that certain type of interventions take more time to produce tangible
results, and also by the pressure to complete them within the eligibility period.
Assessment of the final control reports and closure declarations (audit opinions) reported by audit
authorities at closure and assessment of the residual risk rate per programme
REGIO's audit directorate has reviewed all final control reports in 2018 and validated the error
rates communicated by the audit authorities or requested additional information or audit work to
be performed, based on desk review of all documents transmitted and taking into account the
results of the targeted audits for preparation to closure described in section 1 above. For the desk
review, a standard checklist applied to all programmes and paying particular attention to some
risks (in particular, those identified by the European Court of Auditors in its 2016 Annual Report,
namely confirmation of audits on the eligible amounts reported for financial instruments,
verification that State aid or contractual advances were covered by real expenditure at closure,
appropriate coverage of programmes by audit activities over the programming period,
appropriate controls of the reliability of financial corrections used for the purpose of the
calculation of the residual risk rate at closure, etc.).
At closure, audit authorities have disclosed a residual risk rate (RRR) for each programme and
calculated on the basis of the expenditure certified during the whole programming period, the
identified error rates and the validated financial corrections. This was their best estimate of the
expenditure that was considered not in full conformity with contractual or regulatory provisions.
The RRR is also the best estimate of a programme’s corrective capacity, i.e. of the residual risk
taking account of the corrective capacity of the programme over the programming period. It
assesses whether the financial risk for programmes has been kept at a tolerable level at closure.
It is estimated by considering for each programme or group of programmes the multi-annual
impact of the validated error rates calculated since the beginning of the programming period,
after deduction of the financial corrections reported by the certifying authority and
audited/validated by the audit authorities at closure.

regio_aar_2018_annexes
48
Safeguarding the EU budget by preventive (up to closure) and corrective actions
Interruptions/suspensions of payments
Since the beginning of the programming period, REGIO interrupted ERDF/CF payments, warned
about the possible interruption of payment (when no payment claims were submitted) or
suspended payments to 233 out of 322 ERDF/CF programmes due to serious deficiencies in the
functioning of management and control systems. In line with the proportionality principle, these
measures were taken at the level of the deficiency: programme or part of programme, for
example intermediate body, specific measure etc.
The use of these preventive measures allowed REGIO to
appropriately monitor risks throughout the period, continuously
protecting the EU budget from irregular expenditure. This was
confirmed by the European Court of Auditors in its Special
report on the protection of the EU budget from irregular
expenditure22
where it concluded that "overall, we found that
the Commission made effective use of the measures at its
disposal during the 2007-2013 programme period to protect
the EU budget from irregular expenditure". These measures
also allowed REGIO to accelerate the closure process of 2007-
2013 programmes compared to previous programming periods.
At the time of closure, there were three operational programmes23
with a suspension decision
adopted by the Commission. The concerned Member States were informed that the suspension
decision has become redundant at closure and that the underlying deficiencies or irregularities
will be dealt within the course of the closure procedure. Final payments could only be processed
once all outstanding issues have been dealt with. Suspension decisions will have to be removed
by means of a repealing Decision after closure of the operational programmes concerned.
Financial corrections as a result of the Commission supervisory role24
Indicator (ERDF and Cohesion Fund) 2018
(EUR million) Cumulative since 2007
(EUR million) Financial corrections as a result of the Commission supervisory role
- Decided/confirmed25
265
3,763
- Implemented - 3,542
- Rate of implementation of corrections for 2007-2013 programmes - 94%
The purpose of financial corrections is to ensure that the risk on the legality and regularity of the
expenditure declared for co-financing at programme level is below materiality, either through
corrections of individual irregularities detected or through extrapolated corrections in case of
material representative error rates. These must be based on evidence. The Commission bears
the (initial) burden of proof for system deficiencies, irregularities and breaches of the obligations
under Articles 98 and 15(4).
The principal sources of evidence for the reported financial corrections are:
- REGIO audits;
22
Special Report No 04 from 2017: Protecting the EU budget from irregular spending: The Commission made increasing use of preventive measures and financial corrections in Cohesion during the 2007-2013 period. 23 Ref 2007HU161PO008, 2007ES161PO002 and 2007ES162PO006 24
Financial corrections for the 2007-2013 programming period only. More details are given in Annex 8. 25
Excluding financial corrections at source.
72% OPs interrupted or warned during the period
Corrective measures including
financial corrections taken
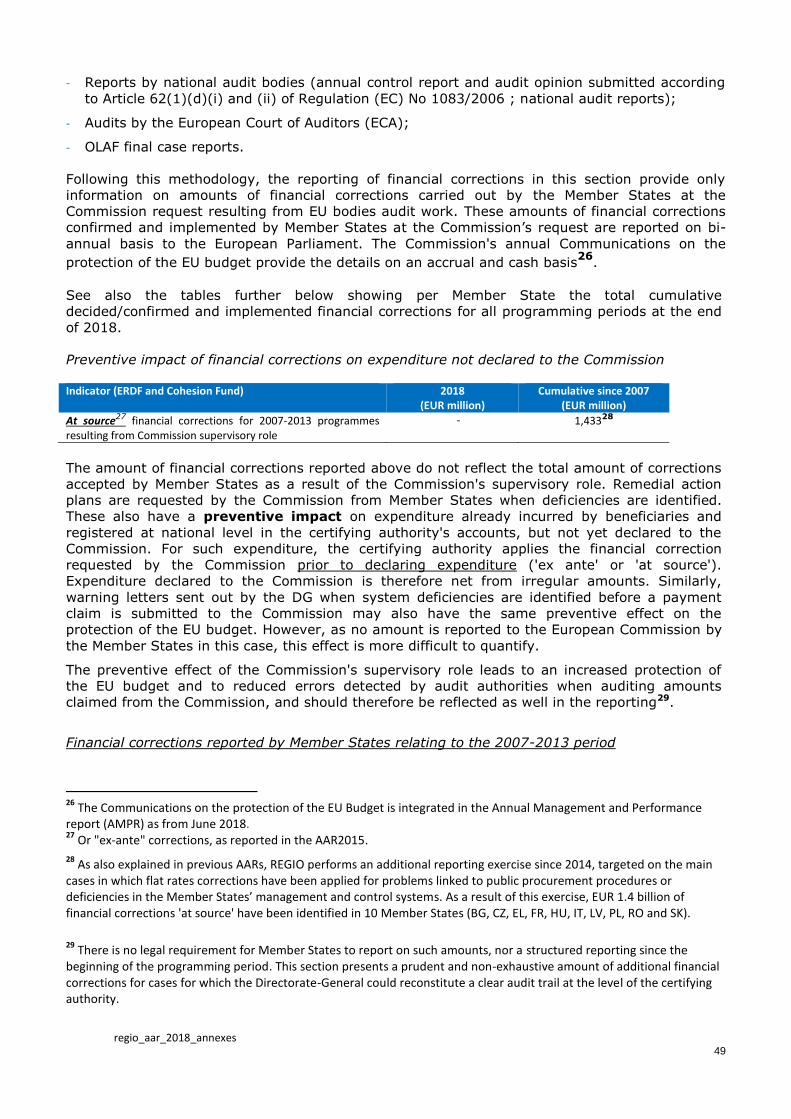
regio_aar_2018_annexes
49
- Reports by national audit bodies (annual control report and audit opinion submitted according
to Article 62(1)(d)(i) and (ii) of Regulation (EC) No 1083/2006 ; national audit reports);
- Audits by the European Court of Auditors (ECA);
- OLAF final case reports.
Following this methodology, the reporting of financial corrections in this section provide only
information on amounts of financial corrections carried out by the Member States at the
Commission request resulting from EU bodies audit work. These amounts of financial corrections
confirmed and implemented by Member States at the Commission’s request are reported on bi-
annual basis to the European Parliament. The Commission's annual Communications on the
protection of the EU budget provide the details on an accrual and cash basis26
.
See also the tables further below showing per Member State the total cumulative
decided/confirmed and implemented financial corrections for all programming periods at the end
of 2018.
Preventive impact of financial corrections on expenditure not declared to the Commission
Indicator (ERDF and Cohesion Fund)
2018 (EUR million)
Cumulative since 2007 (EUR million)
At source27 financial corrections for 2007-2013 programmes resulting from Commission supervisory role
- 1,43328
The amount of financial corrections reported above do not reflect the total amount of corrections
accepted by Member States as a result of the Commission's supervisory role. Remedial action
plans are requested by the Commission from Member States when deficiencies are identified.
These also have a preventive impact on expenditure already incurred by beneficiaries and
registered at national level in the certifying authority's accounts, but not yet declared to the
Commission. For such expenditure, the certifying authority applies the financial correction
requested by the Commission prior to declaring expenditure ('ex ante' or 'at source').
Expenditure declared to the Commission is therefore net from irregular amounts. Similarly,
warning letters sent out by the DG when system deficiencies are identified before a payment
claim is submitted to the Commission may also have the same preventive effect on the
protection of the EU budget. However, as no amount is reported to the European Commission by
the Member States in this case, this effect is more difficult to quantify.
The preventive effect of the Commission's supervisory role leads to an increased protection of
the EU budget and to reduced errors detected by audit authorities when auditing amounts
claimed from the Commission, and should therefore be reflected as well in the reporting29.
Financial corrections reported by Member States relating to the 2007-2013 period
26
The Communications on the protection of the EU Budget is integrated in the Annual Management and Performance report (AMPR) as from June 2018. 27
Or "ex-ante" corrections, as reported in the AAR2015.
28 As also explained in previous AARs, REGIO performs an additional reporting exercise since 2014, targeted on the main
cases in which flat rates corrections have been applied for problems linked to public procurement procedures or deficiencies in the Member States’ management and control systems. As a result of this exercise, EUR 1.4 billion of financial corrections 'at source' have been identified in 10 Member States (BG, CZ, EL, FR, HU, IT, LV, PL, RO and SK).
29 There is no legal requirement for Member States to report on such amounts, nor a structured reporting since the
beginning of the programming period. This section presents a prudent and non-exhaustive amount of additional financial corrections for cases for which the Directorate-General could reconstitute a clear audit trail at the level of the certifying authority.

regio_aar_2018_annexes
50
Indicator (ERDF and Cohesion Fund) at closure
(EUR million) Cumulative since 2007
30
(EUR million) Corrections for 2007-2013 programmes reported by Member States
31 3,162 9,643
Out of which additional to the Commission's reporting at 1/03/201732 6,106
Since the reporting year 2010 and by 31st March of each year, Member States submit an annual
statement on withdrawals, recoveries, pending recoveries and irrecoverable amounts under the
provisions of the Article 20(2) of Regulation (EC) No 1828/2006 for the 2007-2013 programmes.
This is sent to the Commission through the IT system SFC2007. This information has been
reported for the last time with closure declarations by 31 March 2017. This report refers to two
sources of financial corrections:
- Financial corrections implemented by Member States (or pending recoveries) following the
national verification and audit work carried out by all programme authorities, i.e. including
from management verifications and audits,
- Financial corrections implemented as a result of EU audit work, including at the Commission's
request.
When facing irregular expenditure included in previous payment claims submitted to and
reimbursed by the Commission, Member States have two choices according to the regulation:
1) immediately withdraw the irregular expenditure from the programme as soon as they detect
the irregularity, by deducting it from the next statement of expenditure and thereby releasing EU
funding for other, eligible operations or
2) issue a recovery order from the beneficiary and leave the expenditure in the programme until
the outcome of proceedings to recover the unduly paid amounts from the beneficiary. Once the
amount is effectively reimbursed by the beneficiary, they deduct the recovered amount from the
next statement of expenditure.
The first type of financial corrections should be reported under withdrawals and the second one
under recoveries and refer to corrections deducted from payment claims in the previous year.
Finally, from the overall cumulative amounts reported by Member States the Commission
deducts its own reported cumulative amounts to estimate the additional corrections from
Member States only. Cumulatively at the date of this report, Member States reported EUR 9.6
billion of withdrawals and recoveries for ERDF/CF for the 2007-2013 programming period, out of
which EUR 6.1 billion are estimated by the Commission to be additional to its
reporting33
. A table providing a detailed picture of withdrawals and recoveries reported by
Member State can be found below.
30 The 2007-2013 regulatory payment system implies that EU payments or the EU share of withdrawals and recoveries are calculated automatically based on either the declared total or public cost, taking into account the co-financing rate at priority axis level. Amounts of recoveries and withdrawals are therefore calculated on the basis of the latest available financing plan, which means that amounts of EU share for a given year can vary in subsequent years if the co-financing rates were subsequently modified. Reporting can also be subsequently adjusted by the Member State, at the Commission request, when errors are detected. 31
Following the provisions set in the guidance note to the Member States ref. COCOF 10/0002 EN. 32
As a result of comparison for each Member State between national and EU reporting of implemented corrections. 33
Additional corrections are estimated as the difference between the cumulative amount reported by the Member States up to closure (EUR 9,64 billion) and the amount reported by the Commission as implemented as a result of its supervisory role (EUR 3,53 billion). In the cases where the amount reported by the Commission is higher (like for example in Malta), the additional corrections are set to zero. See tables below with more details on the corrections reported by each Member State.
51 regio_aar_2018_annexes
Indirect management - Assurance building blocks for Urban Innovative Actions
Programming and initial set-up of the system:
Assurance on the initial set-up of the system is obtained via audits carried out by the External
Auditor before signing the first contracts with cities.
Concerning programming, a yearly exercise provides assurance that the programme managed by
the entrusted entity follows Commission's priorities34.
Tendering and contracting:
Assurance is obtained during project selection as follows:
- Grants are selected and awarded by the entrusted entity using its own rules and procedures;
however, these should be in accordance with the set of principles defined in the Delegation
Agreement (including equal treatment, non-discrimination, adequate publication, prevention of
conflict of interest, non-cumulative and non-retrospective award of grants, existence of
transparent and effective review procedures, etc.)
- Themes of calls for proposals are defined by Commission services. The selection is carried out
based on criteria35 applicable to Urban Innovative Actions as defined in the delegated act.36 The
evaluation of proposals is carried out by an expert panel, set up in agreement with the
Commission, and evaluation results are checked by Commission services.
Monitoring of implementation and payments:
Assurance concerning the monitoring of operations at the entrusted entity level and payments to
beneficiaries rests on the following pillars:
- The entrusted entity verifies that the co-financed products and services have been delivered,
expenditure declared by the beneficiary has been incurred and that it complies with Community
and national rules.
- Verifications on the spot may be carried out by the entrusted entity at the level of the
beneficiaries on a sample basis.
- Beneficiaries provide, at the closure of the operation, an independent audit opinion, which
covers the legality and regularity of expenditure declared and the delivery of relevant products
and services.
- The certification authority (Province of east Flanders) checks payment applications of the
entrusted entity to the Commission before their submission and certifies that these applications
are reliable and complete and that underlying expenditure is eligible, legal and regular.
- Annual accounts are provided by the certification authority, who certifies that these accounts
are complete, accurate and true.
Assurance is also obtained through Commission monitoring of the implementation of the
programme and through its supervision activities:
- An annual implementation report is provided by the entrusted entity each year by the 15th of
February and reviewed by the Commission
- Payment applications and annual accounts submitted by the certification authority are checked
by Commission services before payment.
Ex-post controls - Audit work
Control and auditing arrangements at the level of the entrusted entity are based on the following
blocks:
- An independent External Auditor carries out audits on systems and operations by way of
sampling.
- Audits are carried out according to a multiannual audit strategy sent to the Commission, which
is reviewed annually.
- An audit opinion and a control report are provided to the Commission every year by the 15th of
February.
34 An annual work programme describing the planned work for the following year is prepared by the entrusted entity by the 31st of October and approved by the Commission before the end of the same year
35 innovativeness, quality, partnership and results, transferability
36 Article 2 of Commission Delegated Regulation (EU) No 522/2014

regio_aar_2018_annexes
52
The Commission supervises throughout the budget implementation cycle. In addition, the
Commission has the possibility to suspend payments, apply financial corrections or suspend the
entrusted tasks in case of detected irregularities.
Direct management
The assurance system for direct management comprises the following blocks:
Programming: overall and individual action
For technical assistance, assurance that operations cover the needs of the DG and are carried out
according to priorities is derived from the programming exercise. The main objectives and
priorities for technical assistance interventions in the 2014-2020 period are spelled out in the TA
strategy, which is linked to the objectives set out in the REGIO's Management Plan, the Juncker's
Commission priorities and Europe 2020 objectives. Specific actions implementing the TA strategy
are identified by REGIO services and are consolidated and assessed against the overall strategy
through the preparation of the annual Financing decision and its mid-year modification. Reporting
on the implementation of the TA strategy (financial execution of the yearly Financing Decision and
annual progress in implementing the TA strategy) gives additional assurance that TA funds were
used for their intended purpose.
Tendering and contracting
For the award of contracts and grants, REGIO has put in place partly decentralised financial
circuits. In addition to these standard circuits, all administrative, financial and procedural tasks
were centralised in the central financial unit (TA Cell).
Following the centralisation of the administrative, procedural and financial tasks in the TA Cell,
the 4 eyes principle is applied within the TA Cell. Therefore, the role of the former Committee on
Public Procurement and Grants (CIMS), checking the legality and regularity of the public
procurement processes according its internal procedural rules became redundant.
To provide assurance to the AO(S)D the 4-eyes principle is applied for all procedures in the TA
Cell, and an additional ex-ante verification is performed by the Legal Unit before awarding
contracts above the Directive ceiling.
Monitoring of implementation and payments
In accordance with the partly decentralised financial circuit, payments are approved following the
four-eye principle (each file is double-checked both on operational and financial aspects).
Operational monitoring is carried out along the life of the contracts by the implementing services;
generally through verifications of deliverables (e.g. interim, final reports…).
Ex-post controls
Additional assurance is provided through the performance of ex-post controls on a sample of
payments (including both mainstream and direct payments) systematically selected from the
different budget lines, to ensure that these were duly authorised, paid to the right beneficiaries,
properly accounted for and materially correct. There were no critical or very important findings
identified for 2018 payments.
Other work carried out in 2018 – contribution to audit capacity building and preventive
actions
Audit work also includes advisory procedures (including guidance) and capacity building actions at
the level of audit authorities, but also managing and certifying authorities, which contribute to
preventing and correcting errors and therefore contribute to the assurance process.
regio_aar_2018_annexes
53
During 2018, REGIO auditors participated in different seminars aiming to strengthen the capacity
of Member States authorities to deal with the provisions of the programming period 2014-2020.
In particular, under the organisation of EIPA, seminars on management and control principles,
public procurement and SCOs took place in Brussels, Maastricht and Barcelona.
In addition, the Commission hosted Annual Coordination Bilateral Meetings with each Member
State's audit authorities covering the monitoring of / progress on audit strategy with a focus on
the state of play of 2014-2020 audit strategies from both Commission and audit authorities
perspective and a bilateral discussion of the main type of findings and other methodological
aspects of common interest.
Two technical meetings with all audit authorities took place in 2018: in June and December.
These dedicated meetings provided the opportunity to compare the Commission and audit
authorities' audit methodologies and points of view. In March 2018 the Commission organised a
specific Technical Meeting to present the Commission proposals for the legal basis of the period
2021-2027.
The Homologues Group meeting as most important annual event between the audit authorities
and Commission auditors took place in Sofia in September 2018. The meeting was mainly
dedicated to the Commission’s proposal for CPR 2021-2027 and its impact to the work of the
audit authorities. In relation to the programming period 2014-2020, the meeting also covered
workshops on the audit methodologies for financial instruments and SCOs.
Representatives of European Court of Auditors participated in the technical meetings and
Homologues Group meeting.
REGIO participated as well in the annual meeting of the network of certifying authorities held in
Romania in October 2018. The main topic in the agenda was the lesson learnt from assessment of
the accounts received in February 2018 and the clarifications introduced in the update guidance
notes on management and control system issued end 201837.
Several sampling training sessions and other events covering sampling issues were organised by
Directorate General Regional and Urban Policy in Brussels, Berlin and Paris with the support of
one of the most recognised academic experts at European level in the field of statistics.
Other activities included technical workshops for managing and audit authorities on the use of
ARACHNE.
37 https://ec.europa.eu/regional_policy/en/information/legislation/guidance/

regio_aar_2018_annexes
54
1.1.1. Fraud prevention and detection
Indicator 2018 target 2018 result
Number of cases of suspected fraud detected by/brought to the attention of the DG transmitted to OLAF for evaluation
100% All cases that were brought to the attention of REGIO staff (11 cases) were communicated to OLAF for evaluation and possible selection
Trainings delivered to REGIO staff Identification of MS' practices in relation to fraud risk assessments and/or anti-fraud measures
Train 100% of all newcomers in anti-fraud awareness raising when they join DG REGIO. Develop a new way to ensure everyone can participate and get basic knowledge about procedures and anti-fraud environment. Dissemination of the results of the stock-taking study and featured practices identified to a large audience of national authorities. The results of the Study on Anti-Fraud measures in Member States have been presented at 4 events:
- September 2018: workshop in Brussels
- December 2018: Technical meeting with Audit
Authorities
- December 2018: EGESIF meeting with Managing
authorities
- At the COCOLAF in December 2018 with AFCOS
(Anti-Fraud Coordination Services of Member
States).
A seminar on anti-fraud measures in the management of EU funds was planned in Cyprus in October 2018 and had to be rescheduled on request of the Cypriot authorities.
2 trainings were delivered “live” to REGIO colleagues: in June and December Additionally, a new e-learning tool was developed and introduced for all REGIO staff it will become compulsory upon arrival. Training contributed to a better understanding of the reasons, modus operandi, risks and sources of fraud. It also covered new regulatory requirements and procedures on handling final case reports and launching financial follow-up of recommendations from OLAF. Dissemination activities help convey the messages to Member States and help fight fraud
Number of Member States using Arachne tool for at a least one operational programme (ERDF or multifund OP).
50% of Member States
16 Member States have integrated Arachne in their management verification processes for at least 1 Operational Programme for 2014-2020.

regio_aar_2018_annexes
55
Number of OLAF cases under investigation in OLAF and in follow-up in REGIO at begin February
2018:
Member States Active
investigation Cases in
Follow-up Total
AT 1
1
BE
1 1
BG 2 1 3
CZ 2 1 3
DE
2 2
ES 4 6 10
GR 2 3 5
HR 1 3 4
HU 3 4 7
IT 2 5 7
LV 1
1
PL 3 6 9
PT 2 3 5
RO 3 11 14
SK 3 3 6
UK 4 1 5
ETC (multi-country) 3 4 7
Grand Total 36 54 90
Begin 2019, OLAF was actively involved in 36 investigations. Final reports have been received for
54 OLAF cases and follow-up is ongoing in REGIO.
1.1.2. Audit observations and recommendations
A. European Court of Auditors
The Court issued the following recommendations in its 2017 Annual report:
Recommendation 1: ensure that the audit arrangements for financial instruments managed by the EIF
are adequate at the level of financial intermediaries. When the EIB/EIF uses agreed-upon procedures
with external auditors, the Commission should define the minimum conditions of such contracts with a
view to the need to provide assurance, in particular the obligation for sufficient audit work at the level
of the Member State.
Implementation date: immediate.
Commission Reply: The Commission accepts the recommendation and considers that with the
entry into force of the Omnibus proposal, in its drafting resulting from the political agreement
between the Council and Parliament, and with new provisions for audit of financial instruments
managed by EIF, the recommendation will be implemented. Moreover, the Member States will
have to carry out verifications and audits at the level of financial intermediaries and, for audit
authorities, at the level of final recipients in their jurisdiction, where relevant.
Recommendation 2: propose legislative changes for the post-2020 financial framework
which would exclude reimbursement of VAT to public bodies from EU funds.
Implementation date: before approval of the post-2020 legislative framework.
Commission Reply: The Commission partially accepts the recommendation and has made a
legislative proposal for the financial framework 2021-2027. The Commission proposal (COM
(2018) 375 final) introduces a simple rule in relation to VAT, independently from the
private/public status of beneficiaries: for projects below a total cost of EUR 5 million the VAT is
considered eligible while above the threshold the VAT is ineligible.
regio_aar_2018_annexes
56
Recommendation 3: address the weaknesses we have identified in its verification of the audit
authorities’ work in the context of the Commission’s regularity audits.
Implementation date: immediate.
Commission Reply: The Commission accepts the recommendation. In line with their Single Audit
Strategy and agreed audit plan, the Commission services will from 2018 on focus their audit work
on verifying the quality and compliance of audit authorities' work with a view to obtaining fully
reliable audit opinions and results.
Recommendation 4: address the complexity of the information presented on the 2014-2020 control
and assurance framework in the AARs of DGs REGIO and EMPL, by:
(i) focusing on expenditure that has gone through the control cycle, i.e. assurance packages covering
expenditure before 30 June ‘n-1’. For this purpose, the Commission should adjust its reporting to
ensure that it does not present provisional estimates;
(ii) clearly indicating which expenditure has not yet been examined in depth (including
regularity checks). It should indicate which preventive actions protect the EU budget
and whether these actions are sufficient to provide assurance, but refrain from
calculating a residual rate for expenditure that has not yet been examined.
(iii) disclosing an overall residual error rate for MFF sub-heading 1b for each accounting
year.
Implementation date: June 2019.
Commission Reply: The Commission partially accepts this recommendation. The Commission
underlines that the Annual Activity Reports of the concerned Directorates general already provide
a clear focus on the validation of error rates for programmes and accounts in relation with
accounting years ending 30 June n-1. This can be made even clearer in future reports. In line
with the Financial Regulation, the assurance required from authorising officers in the Annual
Activity Reports refers to all types of payments executed in the reporting year n. Directorates
general report separately on the level of assurance obtained for each of them. The amount at risk
is therefore established on the basis of the relevant expenditure of the calendar year. The
Commission reiterates furthermore that it is open to reflect on, and to discuss with ECA, how to
improve and simplify its system leading to the presentation of error rates in the Annual Activity
Reports.
Recommendation 5: ensure that audit arrangements are changed in accordance with the proposal
made by the Commission for financial instruments in the post-2020 regulatory framework so that only
the actual use of funds at final recipient level is used for the calculation of residual error rates.
Implementation date: before implementation of the post-2020 legislative framework
begins.
Commission Reply: The Commission accepts this recommendation to the extent the Commission’s
proposal for the post-2020 regulatory framework is adopted by the co-legislators. Following this
proposal adopted on 29/5/2018, the Member State will declare expenditure of financial
instruments based on disbursed amount into final recipients. There will be only one advance
payment of 25% to financial instruments that should not be part of the audited population
defined in the regulatory framework which will limit the expenditure which may be declared
before payment is made to final recipients.
Recommendation 6: carry out sufficient regularity checks to conclude on the effectiveness of audit
authorities’ work and obtain reasonable assurance on the regularity of expenditure at the latest in the
AARs it publishes following the year of accepting the accounts.
Implementation date: immediate.

regio_aar_2018_annexes
57
Commission Reply: The Commission partially accepts this recommendation which is in line with its
Single Audit Strategy for the concerned funds. The Commission has set as an objective to be able
to report each year in the respective AARs on the reliability of the residual error rates reported by
audit authorities in the previous year's assurance packages. It underlines at the same time that it
has up to 3 years to carry out audits on the expenditure included in the accounts to conclude on
the reliability of the error rates reported by audit authorities and to confirm the legality and
regularity of the certified expenditure.
The Court also issued one recommendation to be addressed by REGIO in its chapter 2 relating to
budgetary and financial management:
Recommendation 1: provide accurate and complete information on the closure of the financial
instruments for the 2007-2013 Multi-annual Financial Framework, including the final amounts
returned to the EU budget and amounts belonging to Member States.
Implementation date: by mid-2019. Commission Reply: The Commission partially accepts the recommendation. The Commission will report on closure in line with the legislation in force. The current
legislation does not require Member States to provide information on the amounts belonging to them. In line with the accepted recommendation 2 of the Special Report 04/2017 on protecting the EU budget, the Commission will report on the final outcome of
closure for the programme period in the context of the annual activity report of the respective Directorates-General. This report will include by operational programme the
amount eligible at closure, including for financial instruments where available. It will also include information on recoveries by operational programme, if any.
The Commission refers in that respect to Annex 10F which discloses such information
Follow-up of previous recommendations
REGIO systematically follows up the recommendations issued by the Court in its Annual Reports
and accepted by the Commission. In its 2017 Annual Report, the Court assessed that all
recommendations issued in the context of its 2014 Annual Report and accepted by the
Commission had been implemented, at least in some respects. Older recommendations are
closed.
The following table gives an overview of the status of implementation of the recommendations for
which REGIO is responsible, as registered by the Commission in the RAD database.
Annual Report Number of recommendations
issued DONE/CLOSED OPEN
2014 7* 6 1
2015 6* 5 1
2016 7 7 0
* The 2014 and 2015 recommendations asking to submit a legislative proposal to amend
Regulation (EC) No 1083/2006 with respect to the extension of the eligibility period for financial
instruments under shared management were rejected by the Commission.
Summary of the results of the Court's Performance audits and special reports published
in 2018
The Court’s Performance audits and other reports
In 2018, the Court continued an extensive work on performance audits for REGIO and finalized
eight special reports involving expenditure from regional and urban policy (High-speed rail, High-

regio_aar_2018_annexes
58
speed broadband infrastructure, Flooding in the EU, Air quality, Absorption capacity (2007-2013),
Project durability, Selection and monitoring of projects (2014-2020), Public Private Partnerships).
Other audits encompassing in particular fraud detection in cohesion policy, costs of
implementation of ESI funds and transport related matters were on-going in 2018.
Here are the main conclusions and recommendations issued from the special reports for which
REGIO was in the lead.
SR 8/2018 EU support for productive investments in businesses - greater focus on
durability needed
In this audit, the Court defines durability as the ability of a project to maintain its benefits for a
long time after the project has been completed. The aim of the audit was to assess whether this
funding had been managed in a way which ensures durability of outputs and results and to
identify the main factors affecting it. It focused on the 2000-2006 and 2007-2013 programme
period. The Court of auditors concluded that even though a majority of the projects audited
generated durable results, between 2000 and 2013 there was not enough emphasis on the
durability of results in the management of the ERDF support to productive investments in
European businesses.
Three recommendations were addressed to the Commission and were all accepted. They aimed at
checking how Member States address durability of outputs and results during the approval
process of OPs, making sure that ex-post evaluations at OP or EU level look into the different
aspects of the durability of results achieved at the end of the durability period and beyond in a
more systematic manner and finally ensuring that Member States apply clear corrective measures
including recovery arrangements consistently where projects fail to comply with EU legal
durability requirements.
SR 17/2018 Commission’s and Member States’ actions in the last years of the 2007-
2013 programmes tackled low absorption but had insufficient focus on results
The European Court of Auditors (ECA) examined whether the Commission’s and Member States’
actions were effective in absorbing funding from the European Regional Development Fund
(ERDF), the European Social Fund (ESF) and the Cohesion Fund (CF) during the 2007-2013
programme period. The audit covered the 2007-2013 programme period and the ECA
comparisons with the 2000-2006 and 2014-2020 programme periods highlighting risks of
absorption for the current period. The ECA acknowledged that the measures taken by the Task
Force for Better Implementation have led to a marked increase in absorption for the assisted
Member States. Nevertheless, some of the measures introduced to increase spending focussed
mainly on absorption and compliance with rules with little consideration for results.
The Commission accepted all recommendations which read as: propose to the Council and the
European Parliament a timetable for negotiation and adoption of the legislative framework and
programme documents with a view to ensure that OP implementation can start at the beginning
of the programme period; where key elements of performance are affected, ensure that revisions
of OPs are based on a sound and comprehensive assessment of the OPs and partnership
agreements and related needs and that the revision is primarily undertaken to provide better
results; ensure that it has the means to obtain information allowing it to monitor absorption,
identify slow and rapid absorption and assess ex-ante the need and the impact of measures to
know whether to use them or not; and when providing targeted support to accelerate
implementation ensure that actions are undertaken with a focus on delivery of good results.
SR 21/2018 Selection and monitoring for ERDF and ESF projects in the 2014–2020
period are still mainly outputs-oriented
The Court of auditors examined how well the focus on results is embedded within the way
projects are selected, and how well the Commission and Member States can demonstrate the EU
budget is well spent. The Court of auditors concluded that, despite longstanding intentions, the
design of selection procedures and the processes themselves continue to emphasise outputs and
absorption rather than results. Moreover, shortcomings in the monitoring arrangements made it
difficult to assess the extent to which EU funding has contributed to the achievement of the EU’s
regio_aar_2018_annexes
59
and Member States’ objectives.
The ECA issued three sub-recommendations to the Commission which were all accepted. In order
to make the ERDF monitoring framework more results oriented, and in particular to allow the
aggregation of performance information, the COM should define common result indicators for this
fund based on a common definition of “results”. The Commission should also improve the
reporting on performance and ensure that a meaningful performance review takes place in 2019.
The Commission is taking actions to implement the recommendations, which have been accepted.
Regarding special reports on thematic investments supported by cohesion policy funds, the vast
majority of the recommendations issued were addressed to the Directorates General responsible
for the policies concerned. REGIO is implementing the Court's recommendations within the limits
of its competencies provided by the legal framework under shared management.
In addition, the Court also published in May 2018 a briefing paper on Simplification in post-2020
delivery of Cohesion Policy. The Court of Auditors identified four guiding principles for effective
simplification such as a well-defined strategy for administrative simplification is needed; an
evidence-based and structured approach is vital for understanding complexity and proposing
simplification; ensuring effective simplification requires a firm commitment by the Commission,
the European Parliament, the Council and the Member States; accountability and performance:
simplification is not a goal in itself and should not jeopardise achievements in strengthened
internal control.
The Commission's legislative proposals for post 2020 are in line with the guiding principles
presented above. The Commission addressed the key areas for simplification underlined by the
ECA: the number and complexity of regulations, stability of rules between the programming
periods, streamlining of ex ante conditionalities, more use of simplified cost options and
payments based of conditions, and – what was underlined as a horizontal issue underpinning all
other efforts in recommendations of the High Level Group on simplification for beneficiaries and
practically all other inputs from the stakeholders – significant streamlining of management
verifications which account for the vast majority of control activities.
Eventually, the Court of Auditors issued a rapid case review on VAT reimbursement in Cohesion -
an error-prone and sub-optimal use of EU funds in November 2018. The ECA pointed out that
reimbursement of VAT is a frequent source of errors and may also lead to the sub-optimal use of
EU funds, EU reimbursement to a Member State may even exceed the actual cost of a project.
The ECA maintains its previously expressed opinion that VAT should not be reimbursed to public
bodies at all. The Commission agrees with the Court that the current VAT rules are indeed
complex and lead to many errors and acknowledges that the EU budget should never finance
more than the costs of a project, especially in the case of infrastructure. This is precisely why a
radically simplified, streamlined approach to VAT eligibility after 2020 has been proposed
meaning that means VAT would be eligible for projects costing less than EUR 5 million, and
completely ineligible for projects above that amount.
Follow-up to previous ECA recommendations:
The Court conducted in 2018 a follow-up of five special reports published in 2015 and involving
directly or indirectly REGIO (SR 01/2015 on inland waterways, SR 02/2015 on urban waste water
treatment plants in the Danube river basin, SR 10/2015 on public procurement problems in EU
cohesion expenditure, SR 16/2015 on security of energy supplies and SR 23/2015 on water
quality in the Danube river basin).
The Commission considers that all recommendations issued in those special reports and accepted
have been implemented, except for the ones, which have an implementation date not yet
reached. The Court's assessment on the implementation of these recommendations will be
reported in its next Annual Report (chapter 3).
B. Internal Audit Service (IAS)
Follow-up of very important recommendations included in completed audits

regio_aar_2018_annexes
60
In relation to the IAS audit on "Early implementation of ESIF control strategy 2014-20" the state
of play of implementation of the open very important recommendation is as follows:
In relation to the IAS audit on "Effectiveness of simplification measures under 2014-2020 ESI
Funds in DG EMPL, REGIO and MARE" the state of play of implementation of the open very
important recommendation is as follows:
In relation to the IAS audit on "Major Projects" the state of play of implementation of the open
very important recommendation is as follows:
Very Important Recommendation Actions taken by DG REGIO
Audits on financial instruments
- Develop a methodology for audits on financial instruments
- Address the assurance gap for financial instruments
implemented by EIB Group
- The low implementation of financial instruments
justifies the delay of the preparation of the audit methodology. Audit methodology presented to the Audit Authorities. Enquiry Planning Memorandum expected to be finalised in Q1 2019. The first audits will take place in 2019.
- Omnibus Regulation came into force on 2/08/2018 (Regulation (EU, Euratom) 2018/1046): Article 40 as amended by Omnibus addresses the assurance gap identified for financial instruments implemented by EIB Group
Very Important Recommendation Actions taken by DG REGIO
Uptake and impact of simplification measures
- Facilitating the uptake of Simplified Cost Options (SCOs)
- Analysis of the uptake and impact of the
simplification measures for the post-2020 legislative framework
- Omnibus regulation was adopted with a significant
delay, in August 2018. The Guidance on SCOs is currently under important revision to include all important issues that have arisen in the course of implementation of operations in the 2014 2020 period (Public Procurement, State Aids, etc.). The finalisation of the guidance is expected in Q1 2019;
- following adoption of the Omnibus Regulation several meetings (technical meetings, ARM, peer to peer) were organised by REGIO to promote the new provisions on SCOs in MS;
- DG REGIO made sure that the new provisions on SCOs offering much scope for their uptake were presented and explained in specific meetings (Annual Review Meetings and technical meetings), peer to peer initiatives, training events. DG REGIO has set up a network of SCO practitioners for ERDF/CF, in order to support ERDF authorities and stakeholders to improve the use of SCOs and serve as a transnational platform for regular exchanges. The first meeting took place in November 2018.
Very Important Recommendation Actions taken by DG REGIO
Major Projects Governance: JASPERS contractual and supervision arrangements
- Risk of potential conflicts of interest between
JASPERS IQR, JASPERS Advisory and EIB lending
activities
- Key JASPERS internal documents and reports on the
functioning of JASPERS internal control system have been requested to be presented to JASPERS Steering Committee;
- as regards to external mid-term evaluation, the
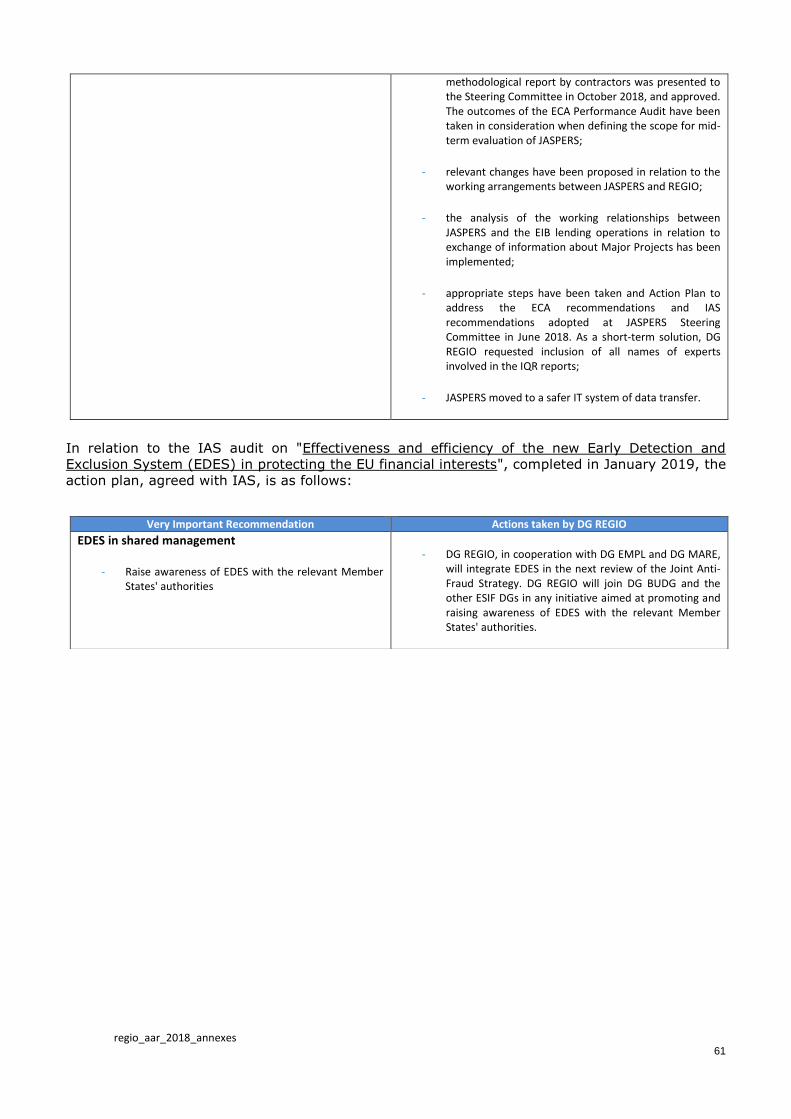
regio_aar_2018_annexes
61
In relation to the IAS audit on "Effectiveness and efficiency of the new Early Detection and
Exclusion System (EDES) in protecting the EU financial interests", completed in January 2019, the
action plan, agreed with IAS, is as follows:
methodological report by contractors was presented to the Steering Committee in October 2018, and approved. The outcomes of the ECA Performance Audit have been taken in consideration when defining the scope for mid-term evaluation of JASPERS;
- relevant changes have been proposed in relation to the working arrangements between JASPERS and REGIO;
- the analysis of the working relationships between JASPERS and the EIB lending operations in relation to exchange of information about Major Projects has been implemented;
- appropriate steps have been taken and Action Plan to address the ECA recommendations and IAS recommendations adopted at JASPERS Steering Committee in June 2018. As a short-term solution, DG REGIO requested inclusion of all names of experts involved in the IQR reports;
- JASPERS moved to a safer IT system of data transfer.
Very Important Recommendation Actions taken by DG REGIO
EDES in shared management
- Raise awareness of EDES with the relevant Member States' authorities
- DG REGIO, in cooperation with DG EMPL and DG MARE,
will integrate EDES in the next review of the Joint Anti-Fraud Strategy. DG REGIO will join DG BUDG and the other ESIF DGs in any initiative aimed at promoting and raising awareness of EDES with the relevant Member States' authorities.
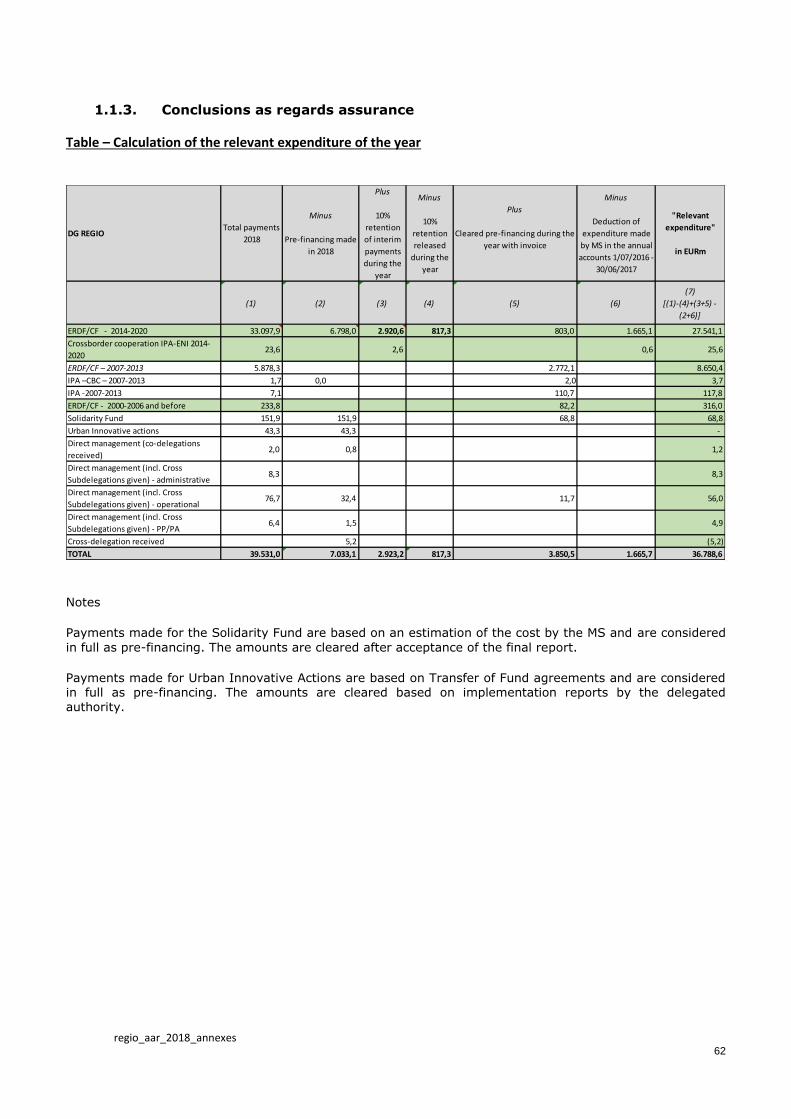
regio_aar_2018_annexes
62
1.1.3. Conclusions as regards assurance
Table – Calculation of the relevant expenditure of the year
Notes
Payments made for the Solidarity Fund are based on an estimation of the cost by the MS and are considered
in full as pre-financing. The amounts are cleared after acceptance of the final report.
Payments made for Urban Innovative Actions are based on Transfer of Fund agreements and are considered in full as pre-financing. The amounts are cleared based on implementation reports by the delegated authority.
(1) (2) (3) (4) (5) (6)
(7)
[(1)-(4)+(3+5) -
(2+6)]
ERDF/CF - 2014-2020 33.097,9 6.798,0 2.920,6 817,3 803,0 1.665,1 27.541,1
Crossborder cooperation IPA-ENI 2014-
2020 23,6 2,6 0,6 25,6
ERDF/CF – 2007-2013 5.878,3 2.772,1 8.650,4
IPA –CBC – 2007-2013 1,7 0,0 2,0 3,7
IPA -2007-2013 7,1 110,7 117,8
ERDF/CF - 2000-2006 and before 233,8 82,2 316,0
Solidarity Fund 151,9 151,9 68,8 68,8
Urban Innovative actions 43,3 43,3 -
Direct management (co-delegations
received) 2,0 0,8 1,2
Direct management (incl. Cross
Subdelegations given) - administrative 8,3 8,3
Direct management (incl. Cross
Subdelegations given) - operational 76,7 32,4 11,7 56,0
Direct management (incl. Cross
Subdelegations given) - PP/PA 6,4 1,5 4,9
Cross-delegation received 5,2 (5,2)
TOTAL 39.531,0 7.033,1 2.923,2 817,3 3.850,5 1.665,7 36.788,6
"Relevant
expenditure"
in EURm
DG REGIOTotal payments
2018
Minus
Pre-financing made
in 2018
Plus
10%
retention
of interim
payments
during the
year
Plus
Cleared pre-financing during the
year with invoice
Minus
Deduction of
expenditure made
by MS in the annual
accounts 1/07/2016 -
30/06/2017
Minus
10%
retention
released
during the
year
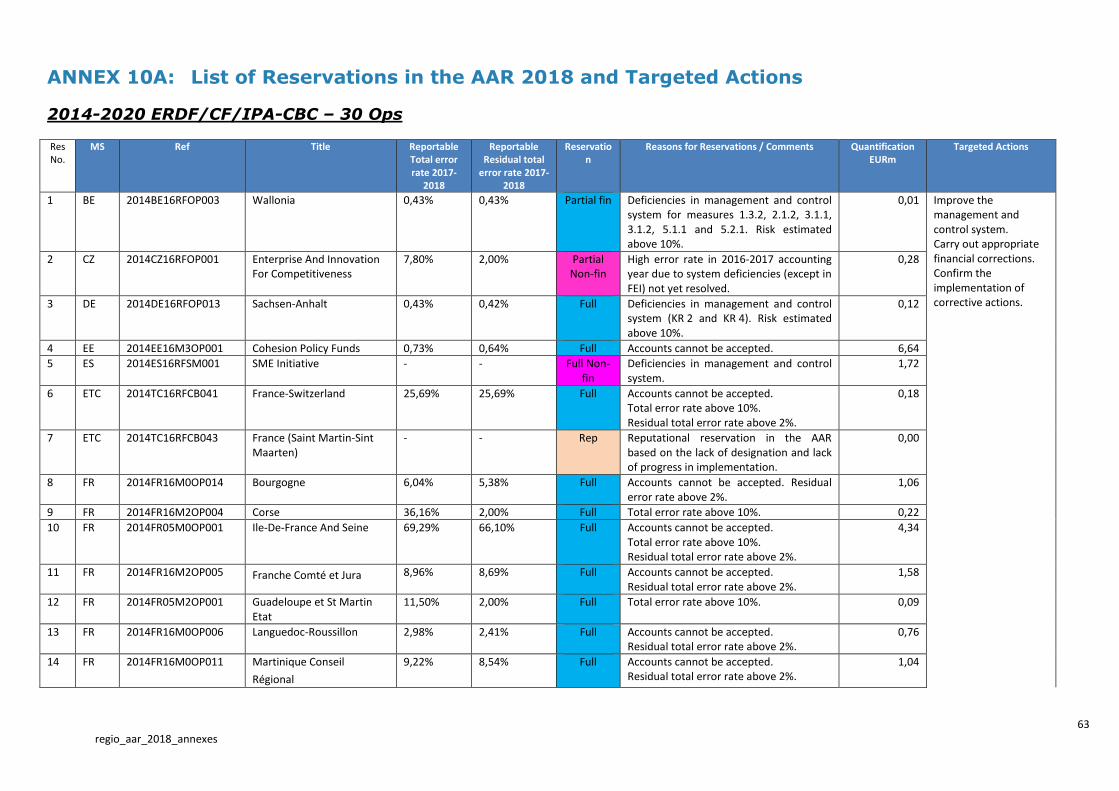
63 regio_aar_2018_annexes
ANNEX 10A: List of Reservations in the AAR 2018 and Targeted Actions
2014-2020 ERDF/CF/IPA-CBC – 30 Ops
Res No.
MS Ref Title Reportable Total error rate 2017-
2018
Reportable Residual total
error rate 2017-2018
Reservation
Reasons for Reservations / Comments Quantification EURm
Targeted Actions
1 BE 2014BE16RFOP003 Wallonia 0,43% 0,43% Partial fin Deficiencies in management and control system for measures 1.3.2, 2.1.2, 3.1.1, 3.1.2, 5.1.1 and 5.2.1. Risk estimated above 10%.
0,01 Improve the management and control system. Carry out appropriate financial corrections. Confirm the implementation of corrective actions.
2 CZ 2014CZ16RFOP001 Enterprise And Innovation For Competitiveness
7,80% 2,00% Partial Non-fin
High error rate in 2016-2017 accounting year due to system deficiencies (except in FEI) not yet resolved.
0,28
3 DE 2014DE16RFOP013 Sachsen-Anhalt 0,43% 0,42% Full Deficiencies in management and control system (KR 2 and KR 4). Risk estimated above 10%.
0,12
4 EE 2014EE16M3OP001 Cohesion Policy Funds 0,73% 0,64% Full Accounts cannot be accepted. 6,64
5 ES 2014ES16RFSM001 SME Initiative - - Full Non-fin
Deficiencies in management and control system.
1,72
6 ETC 2014TC16RFCB041 France-Switzerland 25,69% 25,69% Full Accounts cannot be accepted. Total error rate above 10%. Residual total error rate above 2%.
0,18
7 ETC 2014TC16RFCB043 France (Saint Martin-Sint Maarten)
- - Rep Reputational reservation in the AAR based on the lack of designation and lack of progress in implementation.
0,00
8 FR 2014FR16M0OP014 Bourgogne 6,04% 5,38% Full Accounts cannot be accepted. Residual error rate above 2%.
1,06
9 FR 2014FR16M2OP004 Corse 36,16% 2,00% Full Total error rate above 10%. 0,22
10 FR 2014FR05M0OP001 Ile-De-France And Seine 69,29% 66,10% Full Accounts cannot be accepted. Total error rate above 10%. Residual total error rate above 2%.
4,34
11 FR 2014FR16M2OP005 Franche Comté et Jura 8,96% 8,69% Full Accounts cannot be accepted. Residual total error rate above 2%.
1,58
12 FR 2014FR05M2OP001 Guadeloupe et St Martin Etat
11,50% 2,00% Full Total error rate above 10%. 0,09
13 FR 2014FR16M0OP006 Languedoc-Roussillon 2,98% 2,41% Full Accounts cannot be accepted. Residual total error rate above 2%.
0,76
14 FR 2014FR16M0OP011 Martinique Conseil
Régional 9,22% 8,54% Full Accounts cannot be accepted.
Residual total error rate above 2%. 1,04
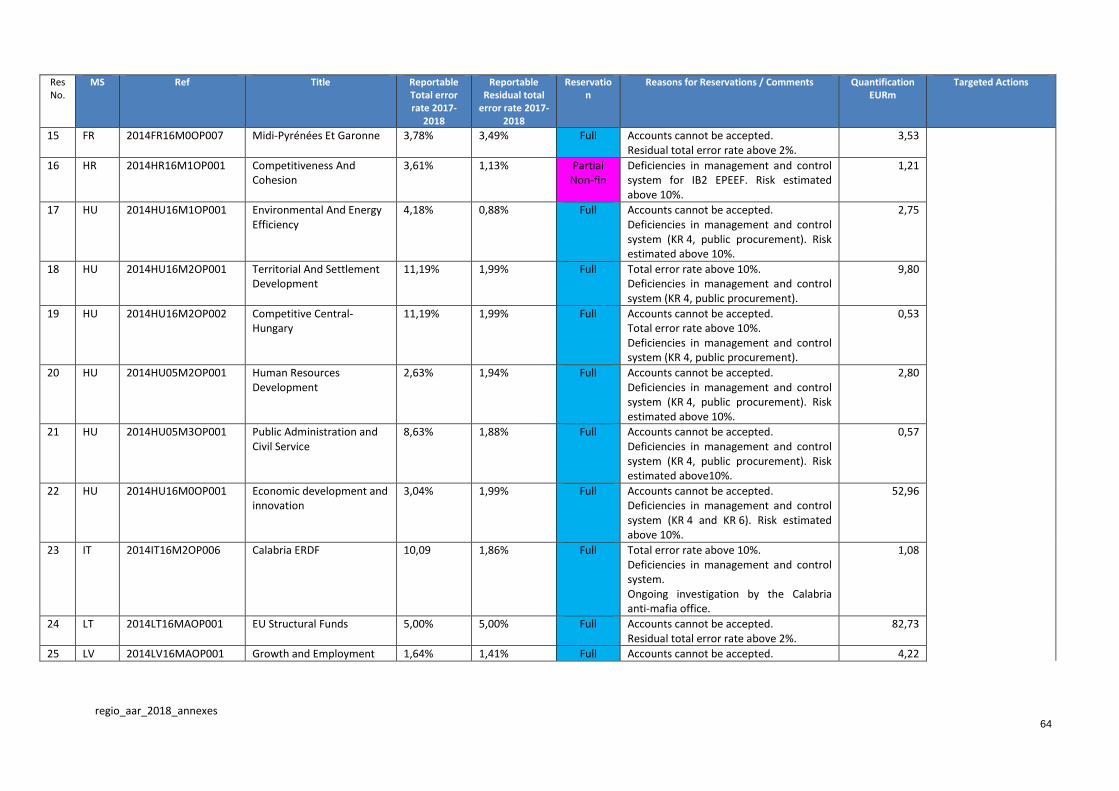
regio_aar_2018_annexes
64
Res No.
MS Ref Title Reportable Total error rate 2017-
2018
Reportable Residual total
error rate 2017-2018
Reservation
Reasons for Reservations / Comments Quantification EURm
Targeted Actions
15 FR 2014FR16M0OP007 Midi-Pyrénées Et Garonne 3,78% 3,49% Full Accounts cannot be accepted. Residual total error rate above 2%.
3,53
16 HR 2014HR16M1OP001 Competitiveness And Cohesion
3,61% 1,13% Partial Non-fin
Deficiencies in management and control system for IB2 EPEEF. Risk estimated above 10%.
1,21
17 HU 2014HU16M1OP001 Environmental And Energy Efficiency
4,18% 0,88% Full Accounts cannot be accepted. Deficiencies in management and control system (KR 4, public procurement). Risk estimated above 10%.
2,75
18 HU 2014HU16M2OP001 Territorial And Settlement Development
11,19% 1,99% Full Total error rate above 10%. Deficiencies in management and control system (KR 4, public procurement).
9,80
19 HU 2014HU16M2OP002 Competitive Central-Hungary
11,19% 1,99% Full Accounts cannot be accepted. Total error rate above 10%. Deficiencies in management and control system (KR 4, public procurement).
0,53
20 HU 2014HU05M2OP001 Human Resources Development
2,63% 1,94% Full Accounts cannot be accepted. Deficiencies in management and control system (KR 4, public procurement). Risk estimated above 10%.
2,80
21 HU 2014HU05M3OP001 Public Administration and Civil Service
8,63% 1,88% Full Accounts cannot be accepted. Deficiencies in management and control system (KR 4, public procurement). Risk estimated above10%.
0,57
22 HU 2014HU16M0OP001 Economic development and innovation
3,04% 1,99% Full Accounts cannot be accepted. Deficiencies in management and control system (KR 4 and KR 6). Risk estimated above 10%.
52,96
23 IT 2014IT16M2OP006 Calabria ERDF 10,09 1,86% Full Total error rate above 10%. Deficiencies in management and control system. Ongoing investigation by the Calabria anti-mafia office.
1,08
24 LT 2014LT16MAOP001 EU Structural Funds 5,00% 5,00% Full Accounts cannot be accepted. Residual total error rate above 2%.
82,73
25 LV 2014LV16MAOP001 Growth and Employment 1,64% 1,41% Full Accounts cannot be accepted. 4,22
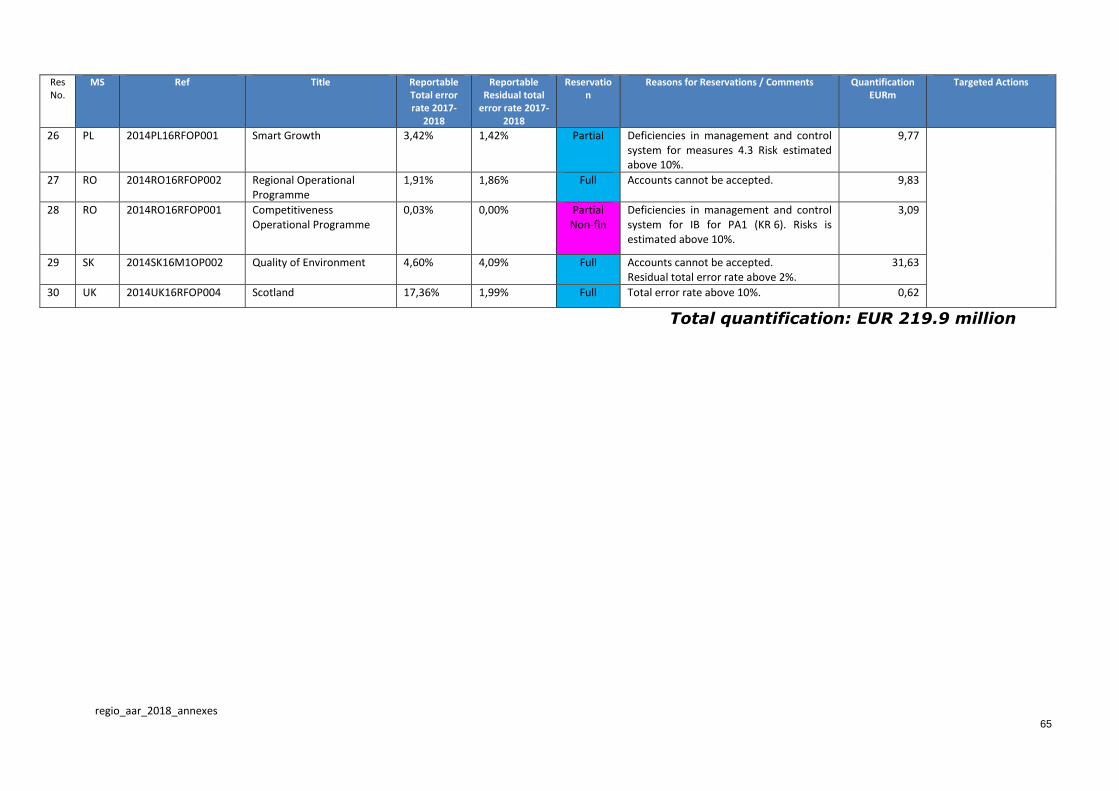
regio_aar_2018_annexes
65
Res No.
MS Ref Title Reportable Total error rate 2017-
2018
Reportable Residual total
error rate 2017-2018
Reservation
Reasons for Reservations / Comments Quantification EURm
Targeted Actions
26 PL 2014PL16RFOP001 Smart Growth 3,42% 1,42% Partial Deficiencies in management and control system for measures 4.3 Risk estimated above 10%.
9,77
27 RO 2014RO16RFOP002 Regional Operational Programme
1,91% 1,86% Full Accounts cannot be accepted. 9,83
28 RO 2014RO16RFOP001 Competitiveness Operational Programme
0,03% 0,00% Partial Non-fin
Deficiencies in management and control system for IB for PA1 (KR 6). Risks is estimated above 10%.
3,09
29 SK 2014SK16M1OP002 Quality of Environment 4,60% 4,09% Full Accounts cannot be accepted. Residual total error rate above 2%.
31,63
30 UK 2014UK16RFOP004 Scotland 17,36% 1,99% Full Total error rate above 10%. 0,62
Total quantification: EUR 219.9 million

regio_aar_2018_annexes
66
2007-2013 ERDF/CF/IPA-CBC – 18 Ops
Res No. MS Ref Title Validated
error rate by REGIO
Validated Residual error
by REGIO Reservation Reasons for Reservations / Comments
Quantification of Reservation
EURm
Targeted Actions
1 CZ 2007CZ161PO008 North-West 3,71% 1,85% Full Non-Fin
Due to ongoing police investigations on the former head of the managing authority.
0,00 Improve the management and control system. Carry out appropriate financial corrections. Confirm the implementation of corrective actions.
2 DE 2007DE161PO007 Sachsen – Anhalt 10,00% 2,00% Par Non-fin
Partial reservation at the level of one measures (11.16/41.16 IBG). OLAF report Dec 2017: potential significant financial impact for the FEI managed by IBG.
0,00
3 ETC 2007CB163PO021 Romania – Bulgaria 10,00% 0,53% Full Non-fin
High error rate. 0,00
4 HR 2007HR161PO001 Environment 25,00% 14,48% Full Non-Fin
Incomplete audit work at closure. 0,00
5 HR 2007HR161PO002 Transport 25,00% 16,64% Full Non-Fin
Incomplete audit work at closure 0,00
6 HR 2007HR161PO003 Regional Competitiveness
25,00% 8,61% Full Non-Fin
Incomplete audit work at closure 0,00
7 HU 2007HU161PO002 Environment and Energy 0,91% 0,17% Par Non-Fin
Ongoing OLAF case on measure 5.5.0 public lightening.
0,00
8 HU 2007HU161PO007 Transport 3,59% 0,32% Par Non-fin
One OLAF case still open (OF/2012/0118/B4, Metro 4 and 2).
0,00
9 HU 2007HU161PO010 Implementation 5,00% 2,00% Par Non-fin
Risk is estimated above 5%. 0,00
10 HU 2007HU16UPO001 Electronic Public Administration
5,00% 2,00% Full Non-Fin
Risk estimated above 5%. 0,00
11 IT 2007IT161PO005 Reti e mobilità 25,00% 12,44% Full Non-Fin
Risk above 5%. 0,00
12 IT 2007IT161PO006 Ricerca e competitività 10,00% 2,96% Full Non-Fin
Risk above 5%. 0,00
13 IT 2007IT162PO004 Lazio 10,00% 2,66% Full Non-Fin
Deficiencies at the level of the AA (as detected by EMPL).
0,00
14 IT 2007IT161PO008 Calabria 10,00% 2,00% Full Non-Fin
Ongoing investigation by the Calabria anti-mafia office.
0,00
15 RO 2007RO161PO003 Transport 4,88% 0,00% Full Non-Fin
High error rate at closure. Risk above the retention.
0,00
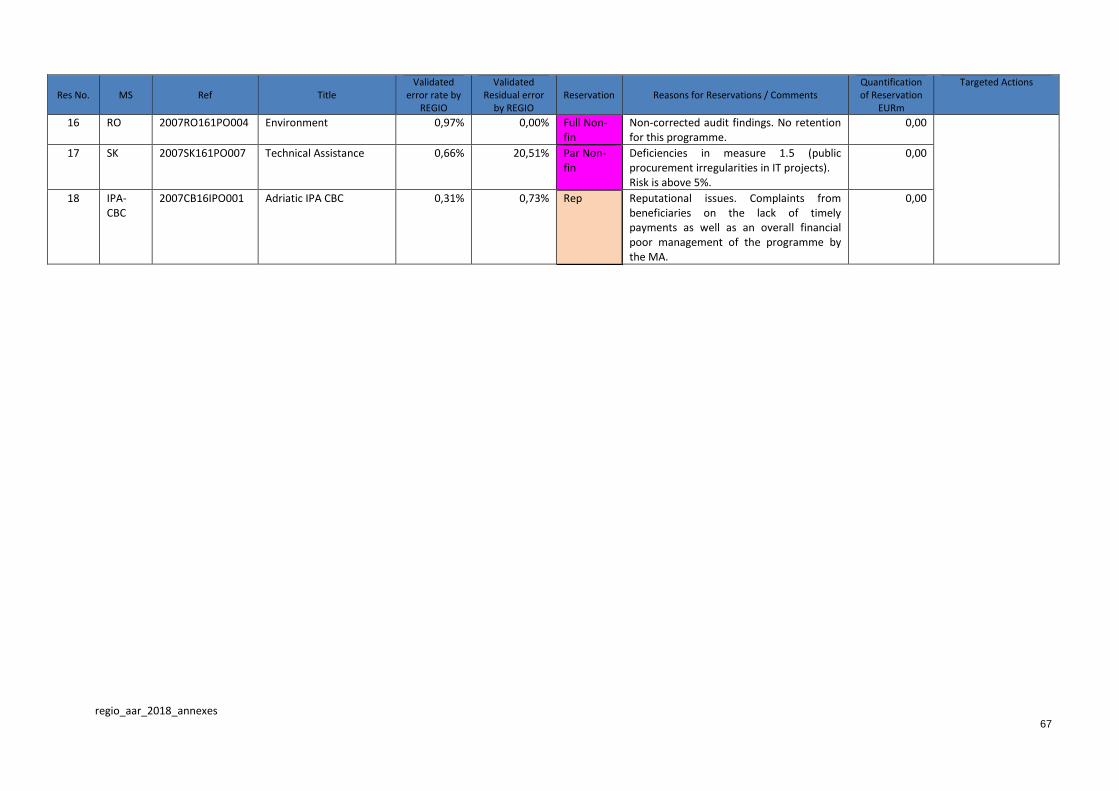
regio_aar_2018_annexes
67
Res No. MS Ref Title Validated
error rate by REGIO
Validated Residual error
by REGIO Reservation Reasons for Reservations / Comments
Quantification of Reservation
EURm
Targeted Actions
16 RO 2007RO161PO004 Environment 0,97% 0,00% Full Non-fin
Non-corrected audit findings. No retention for this programme.
0,00
17 SK 2007SK161PO007 Technical Assistance 0,66% 20,51% Par Non-fin
Deficiencies in measure 1.5 (public procurement irregularities in IT projects). Risk is above 5%.
0,00
18 IPA-CBC
2007CB16IPO001 Adriatic IPA CBC 0,31% 0,73% Rep Reputational issues. Complaints from beneficiaries on the lack of timely payments as well as an overall financial poor management of the programme by the MA.
0,00

regio_aar_2018_annexes
68
ANNEX 10B: 2014-2020 ERDF / CF Operational Programmes: Audit Opinion and Error Rates
MS CCI Ref Title
(1)
MC
S fu
nct
ion
ing
eff
ecti
vely
(Y
/N/N
A*)
:
Y=C
at.
1-2
; N
=Ca
t. 3
-4
Accounting year 2016-2017 Accounting year 2017-2018
Reporting year 2018
Confirmed error rates after EC's assessment (desk review of all OPs and risk-based compliance audits)
Reportable rates (reported by audit authorities and,
where necessary, adjusted by EC following preliminary
consistency checks)
(2)
Tota
l Err
or
Rat
e
(3)
Tota
l Err
or
Rat
e
rem
ovi
ng
imp
act
of
adva
nce
s to
fin
anci
al
inst
rum
ents
(4)
Re
sid
ual
To
tal E
rro
r
Rat
e
(5)
Re
sid
ual
To
tal E
rro
r
Rat
e re
mo
vin
g im
pac
t o
f
adva
nce
s to
fin
anci
al
inst
rum
ents
(6)
To
tal E
rro
r R
ate
rep
ort
able
by
EC
(7)
Re
sid
ual
To
tal E
rro
r
Rat
e re
po
rtab
le b
y EC
Relevant expenditure
(interims+retentions-deductions)
Risk at Payment Risk reported in
column (5), or (7) if higher (or flat rate of 2% when (5) and (7) are empty, or (5) is empty and (7) is
below 2%)
Risk at Closure (taking into
account additional estimated financial
corrections)
Comments
AT 2014AT16RFOP001
Investments in Growth and Employment Austria 2014-
2020 - Operational Programme for the use of the
ERDF funds
Y - - - - 0,56% 0,36% 49.883.229,26 € 2,00% 2,00%
BE 2014BE16RFOP001 OP Brussels Capital Region N 0,20% 0,20% 0,09% 0,09% 1,35% 0,00% 9.303.880,04 € 0,09% 0,09%
BE 2014BE16RFOP002 OP Flanders Y 2,62% 2,62% 0,00% 0,00% 2,26% 1,45% 22.152.090,12 € 1,45% 1,45%
BE 2014BE16RFOP003 OP Wallonia N 0,00% 0,00% 0,00% 0,00% 0,43% 0,43% 44.923.303,33 € 2,00% 2,00% System in category 3 limited to measures 1.3.2, 2.1.2, 3.1.1, 3.1.2, 5.1.1 and 5.2.1
BG 2014BG05M2OP001 Operational Programme
Science and Education for Smart Growth
Y - - - - 0,29% 0,17% - € 2,00% 2,00%
BG 2014BG16M1OP001 Operational programme “Transport and transport
infrastructure” N 7,78% 7,78% 7,66% 7,66% 0,23% 0,23% 141.302.182,07 € 7,66% 2,00%
Ongoing audit contradictory procedure. Financial corrections will be applied to bring RTER 2016-2017 down to 2%, if necessary
BG 2014BG16M1OP002 Operational programme
“Environment” Y 0,92% 1,62% 0,49% 1,08% 0,00% 0,00% 88.946.048,41 € 1,08% 1,08%
BG 2014BG16RFOP001 Operational programme
“Regions in Growth” Y 0,51% 3,12% 0,00% 0,00% 0,97% 0,01 130.082.571,23 € 0,69% 0,69%
BG 2014BG16RFOP002 Operational programme
“Innovations and Competitiveness”
Y 1,33% 1,68% 1,24% 1,58% 1,22% 0,36% 111.328.688,81 € 1,58% 1,58%
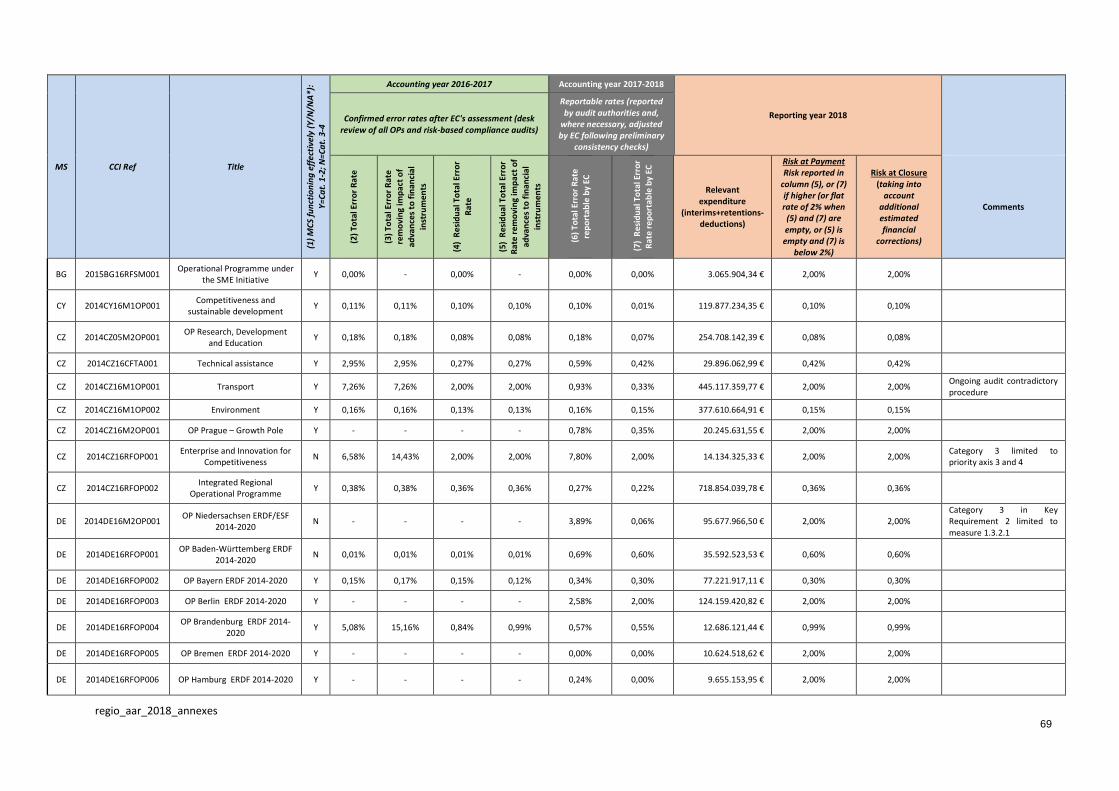
regio_aar_2018_annexes
69
MS CCI Ref Title
(1)
MC
S fu
nct
ion
ing
eff
ecti
vely
(Y
/N/N
A*)
:
Y=C
at.
1-2
; N
=Ca
t. 3
-4
Accounting year 2016-2017 Accounting year 2017-2018
Reporting year 2018
Confirmed error rates after EC's assessment (desk review of all OPs and risk-based compliance audits)
Reportable rates (reported by audit authorities and,
where necessary, adjusted by EC following preliminary
consistency checks)
(2)
Tota
l Err
or
Rat
e
(3)
Tota
l Err
or
Rat
e
rem
ovi
ng
imp
act
of
adva
nce
s to
fin
anci
al
inst
rum
ents
(4)
Re
sid
ual
To
tal E
rro
r
Rat
e
(5)
Re
sid
ual
To
tal E
rro
r
Rat
e re
mo
vin
g im
pac
t o
f
adva
nce
s to
fin
anci
al
inst
rum
ents
(6)
To
tal E
rro
r R
ate
rep
ort
able
by
EC
(7)
Re
sid
ual
To
tal E
rro
r
Rat
e re
po
rtab
le b
y EC
Relevant expenditure
(interims+retentions-deductions)
Risk at Payment Risk reported in
column (5), or (7) if higher (or flat rate of 2% when (5) and (7) are empty, or (5) is empty and (7) is
below 2%)
Risk at Closure (taking into
account additional estimated financial
corrections)
Comments
BG 2015BG16RFSM001 Operational Programme under
the SME Initiative Y 0,00% - 0,00% - 0,00% 0,00% 3.065.904,34 € 2,00% 2,00%
CY 2014CY16M1OP001 Competitiveness and
sustainable development Y 0,11% 0,11% 0,10% 0,10% 0,10% 0,01% 119.877.234,35 € 0,10% 0,10%
CZ 2014CZ05M2OP001 OP Research, Development
and Education Y 0,18% 0,18% 0,08% 0,08% 0,18% 0,07% 254.708.142,39 € 0,08% 0,08%
CZ 2014CZ16CFTA001 Technical assistance Y 2,95% 2,95% 0,27% 0,27% 0,59% 0,42% 29.896.062,99 € 0,42% 0,42%
CZ 2014CZ16M1OP001 Transport Y 7,26% 7,26% 2,00% 2,00% 0,93% 0,33% 445.117.359,77 € 2,00% 2,00% Ongoing audit contradictory procedure
CZ 2014CZ16M1OP002 Environment Y 0,16% 0,16% 0,13% 0,13% 0,16% 0,15% 377.610.664,91 € 0,15% 0,15%
CZ 2014CZ16M2OP001 OP Prague – Growth Pole Y - - - - 0,78% 0,35% 20.245.631,55 € 2,00% 2,00%
CZ 2014CZ16RFOP001 Enterprise and Innovation for
Competitiveness N 6,58% 14,43% 2,00% 2,00% 7,80% 2,00% 14.134.325,33 € 2,00% 2,00%
Category 3 limited to priority axis 3 and 4
CZ 2014CZ16RFOP002 Integrated Regional
Operational Programme Y 0,38% 0,38% 0,36% 0,36% 0,27% 0,22% 718.854.039,78 € 0,36% 0,36%
DE 2014DE16M2OP001 OP Niedersachsen ERDF/ESF
2014-2020 N - - - - 3,89% 0,06% 95.677.966,50 € 2,00% 2,00%
Category 3 in Key Requirement 2 limited to measure 1.3.2.1
DE 2014DE16RFOP001 OP Baden-Württemberg ERDF
2014-2020 N 0,01% 0,01% 0,01% 0,01% 0,69% 0,60% 35.592.523,53 € 0,60% 0,60%
DE 2014DE16RFOP002 OP Bayern ERDF 2014-2020 Y 0,15% 0,17% 0,15% 0,12% 0,34% 0,30% 77.221.917,11 € 0,30% 0,30%
DE 2014DE16RFOP003 OP Berlin ERDF 2014-2020 Y - - - - 2,58% 2,00% 124.159.420,82 € 2,00% 2,00%
DE 2014DE16RFOP004 OP Brandenburg ERDF 2014-
2020 Y 5,08% 15,16% 0,84% 0,99% 0,57% 0,55% 12.686.121,44 € 0,99% 0,99%
DE 2014DE16RFOP005 OP Bremen ERDF 2014-2020 Y - - - - 0,00% 0,00% 10.624.518,62 € 2,00% 2,00%
DE 2014DE16RFOP006 OP Hamburg ERDF 2014-2020 Y - - - - 0,24% 0,00% 9.655.153,95 € 2,00% 2,00%
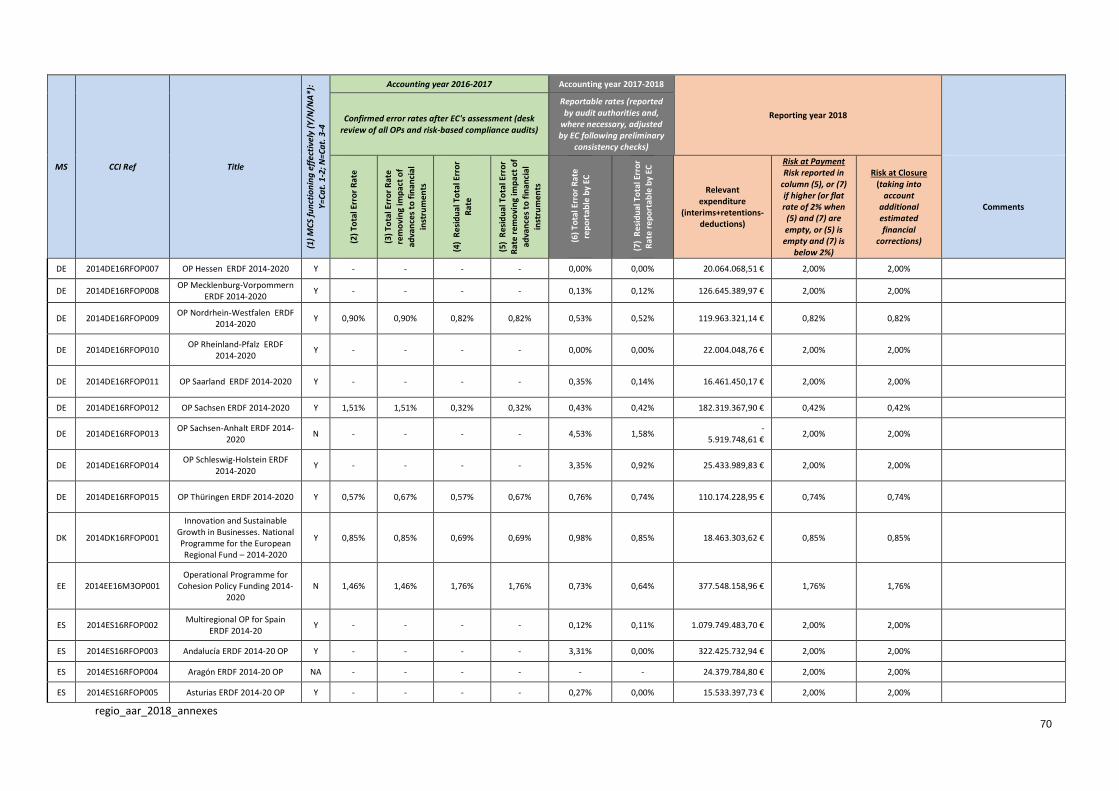
regio_aar_2018_annexes
70
MS CCI Ref Title
(1)
MC
S fu
nct
ion
ing
eff
ecti
vely
(Y
/N/N
A*)
:
Y=C
at.
1-2
; N
=Ca
t. 3
-4
Accounting year 2016-2017 Accounting year 2017-2018
Reporting year 2018
Confirmed error rates after EC's assessment (desk review of all OPs and risk-based compliance audits)
Reportable rates (reported by audit authorities and,
where necessary, adjusted by EC following preliminary
consistency checks)
(2)
Tota
l Err
or
Rat
e
(3)
Tota
l Err
or
Rat
e
rem
ovi
ng
imp
act
of
adva
nce
s to
fin
anci
al
inst
rum
ents
(4)
Re
sid
ual
To
tal E
rro
r
Rat
e
(5)
Re
sid
ual
To
tal E
rro
r
Rat
e re
mo
vin
g im
pac
t o
f
adva
nce
s to
fin
anci
al
inst
rum
ents
(6)
To
tal E
rro
r R
ate
rep
ort
able
by
EC
(7)
Re
sid
ual
To
tal E
rro
r
Rat
e re
po
rtab
le b
y EC
Relevant expenditure
(interims+retentions-deductions)
Risk at Payment Risk reported in
column (5), or (7) if higher (or flat rate of 2% when (5) and (7) are empty, or (5) is empty and (7) is
below 2%)
Risk at Closure (taking into
account additional estimated financial
corrections)
Comments
DE 2014DE16RFOP007 OP Hessen ERDF 2014-2020 Y - - - - 0,00% 0,00% 20.064.068,51 € 2,00% 2,00%
DE 2014DE16RFOP008 OP Mecklenburg-Vorpommern
ERDF 2014-2020 Y - - - - 0,13% 0,12% 126.645.389,97 € 2,00% 2,00%
DE 2014DE16RFOP009 OP Nordrhein-Westfalen ERDF
2014-2020 Y 0,90% 0,90% 0,82% 0,82% 0,53% 0,52% 119.963.321,14 € 0,82% 0,82%
DE 2014DE16RFOP010 OP Rheinland-Pfalz ERDF
2014-2020 Y - - - - 0,00% 0,00% 22.004.048,76 € 2,00% 2,00%
DE 2014DE16RFOP011 OP Saarland ERDF 2014-2020 Y - - - - 0,35% 0,14% 16.461.450,17 € 2,00% 2,00%
DE 2014DE16RFOP012 OP Sachsen ERDF 2014-2020 Y 1,51% 1,51% 0,32% 0,32% 0,43% 0,42% 182.319.367,90 € 0,42% 0,42%
DE 2014DE16RFOP013 OP Sachsen-Anhalt ERDF 2014-
2020 N - - - - 4,53% 1,58%
- 5.919.748,61 €
2,00% 2,00%
DE 2014DE16RFOP014 OP Schleswig-Holstein ERDF
2014-2020 Y - - - - 3,35% 0,92% 25.433.989,83 € 2,00% 2,00%
DE 2014DE16RFOP015 OP Thüringen ERDF 2014-2020 Y 0,57% 0,67% 0,57% 0,67% 0,76% 0,74% 110.174.228,95 € 0,74% 0,74%
DK 2014DK16RFOP001
Innovation and Sustainable Growth in Businesses. National Programme for the European Regional Fund – 2014-2020
Y 0,85% 0,85% 0,69% 0,69% 0,98% 0,85% 18.463.303,62 € 0,85% 0,85%
EE 2014EE16M3OP001 Operational Programme for
Cohesion Policy Funding 2014-2020
N 1,46% 1,46% 1,76% 1,76% 0,73% 0,64% 377.548.158,96 € 1,76% 1,76%
ES 2014ES16RFOP002 Multiregional OP for Spain
ERDF 2014-20 Y - - - - 0,12% 0,11% 1.079.749.483,70 € 2,00% 2,00%
ES 2014ES16RFOP003 Andalucía ERDF 2014-20 OP Y - - - - 3,31% 0,00% 322.425.732,94 € 2,00% 2,00%
ES 2014ES16RFOP004 Aragón ERDF 2014-20 OP NA - - - - - - 24.379.784,80 € 2,00% 2,00%
ES 2014ES16RFOP005 Asturias ERDF 2014-20 OP Y - - - - 0,27% 0,00% 15.533.397,73 € 2,00% 2,00%
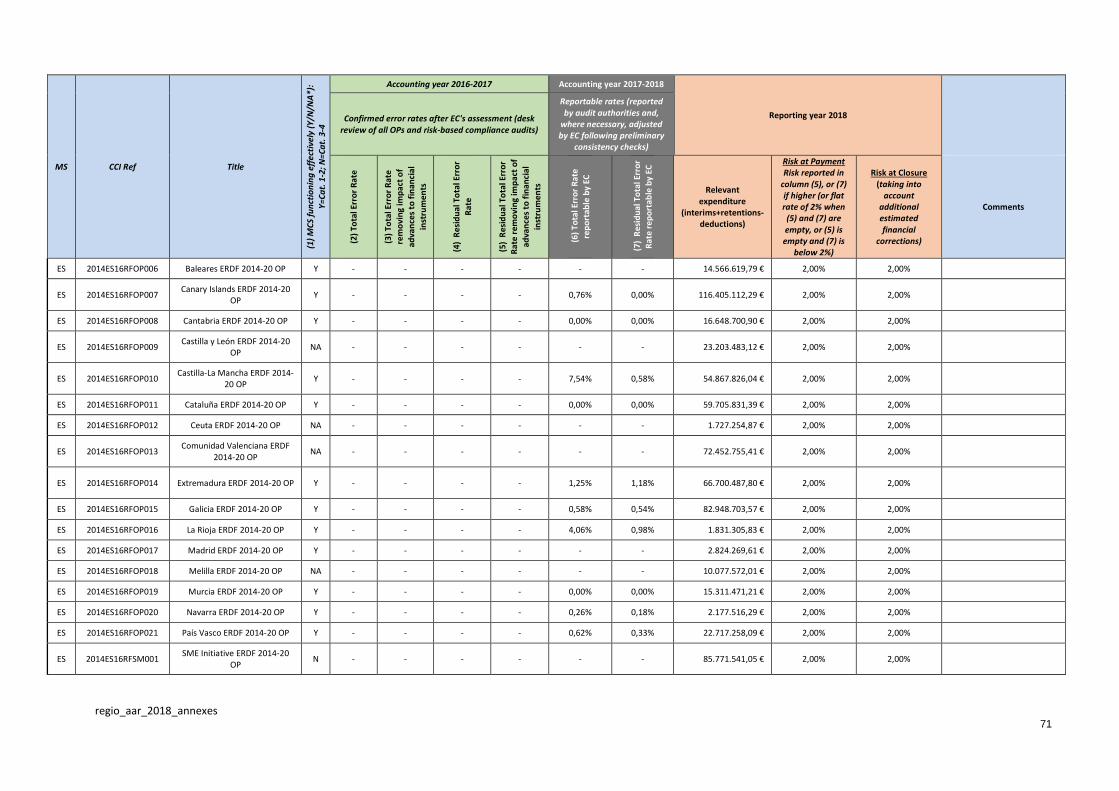
regio_aar_2018_annexes
71
MS CCI Ref Title
(1)
MC
S fu
nct
ion
ing
eff
ecti
vely
(Y
/N/N
A*)
:
Y=C
at.
1-2
; N
=Ca
t. 3
-4
Accounting year 2016-2017 Accounting year 2017-2018
Reporting year 2018
Confirmed error rates after EC's assessment (desk review of all OPs and risk-based compliance audits)
Reportable rates (reported by audit authorities and,
where necessary, adjusted by EC following preliminary
consistency checks)
(2)
Tota
l Err
or
Rat
e
(3)
Tota
l Err
or
Rat
e
rem
ovi
ng
imp
act
of
adva
nce
s to
fin
anci
al
inst
rum
ents
(4)
Re
sid
ual
To
tal E
rro
r
Rat
e
(5)
Re
sid
ual
To
tal E
rro
r
Rat
e re
mo
vin
g im
pac
t o
f
adva
nce
s to
fin
anci
al
inst
rum
ents
(6)
To
tal E
rro
r R
ate
rep
ort
able
by
EC
(7)
Re
sid
ual
To
tal E
rro
r
Rat
e re
po
rtab
le b
y EC
Relevant expenditure
(interims+retentions-deductions)
Risk at Payment Risk reported in
column (5), or (7) if higher (or flat rate of 2% when (5) and (7) are empty, or (5) is empty and (7) is
below 2%)
Risk at Closure (taking into
account additional estimated financial
corrections)
Comments
ES 2014ES16RFOP006 Baleares ERDF 2014-20 OP Y - - - - - - 14.566.619,79 € 2,00% 2,00%
ES 2014ES16RFOP007 Canary Islands ERDF 2014-20
OP Y - - - - 0,76% 0,00% 116.405.112,29 € 2,00% 2,00%
ES 2014ES16RFOP008 Cantabria ERDF 2014-20 OP Y - - - - 0,00% 0,00% 16.648.700,90 € 2,00% 2,00%
ES 2014ES16RFOP009 Castilla y León ERDF 2014-20
OP NA - - - - - - 23.203.483,12 € 2,00% 2,00%
ES 2014ES16RFOP010 Castilla-La Mancha ERDF 2014-
20 OP Y - - - - 7,54% 0,58% 54.867.826,04 € 2,00% 2,00%
ES 2014ES16RFOP011 Cataluña ERDF 2014-20 OP Y - - - - 0,00% 0,00% 59.705.831,39 € 2,00% 2,00%
ES 2014ES16RFOP012 Ceuta ERDF 2014-20 OP NA - - - - - - 1.727.254,87 € 2,00% 2,00%
ES 2014ES16RFOP013 Comunidad Valenciana ERDF
2014-20 OP NA - - - - - - 72.452.755,41 € 2,00% 2,00%
ES 2014ES16RFOP014 Extremadura ERDF 2014-20 OP Y - - - - 1,25% 1,18% 66.700.487,80 € 2,00% 2,00%
ES 2014ES16RFOP015 Galicia ERDF 2014-20 OP Y - - - - 0,58% 0,54% 82.948.703,57 € 2,00% 2,00%
ES 2014ES16RFOP016 La Rioja ERDF 2014-20 OP Y - - - - 4,06% 0,98% 1.831.305,83 € 2,00% 2,00%
ES 2014ES16RFOP017 Madrid ERDF 2014-20 OP Y - - - - - - 2.824.269,61 € 2,00% 2,00%
ES 2014ES16RFOP018 Melilla ERDF 2014-20 OP NA - - - - - - 10.077.572,01 € 2,00% 2,00%
ES 2014ES16RFOP019 Murcia ERDF 2014-20 OP Y - - - - 0,00% 0,00% 15.311.471,21 € 2,00% 2,00%
ES 2014ES16RFOP020 Navarra ERDF 2014-20 OP Y - - - - 0,26% 0,18% 2.177.516,29 € 2,00% 2,00%
ES 2014ES16RFOP021 País Vasco ERDF 2014-20 OP Y - - - - 0,62% 0,33% 22.717.258,09 € 2,00% 2,00%
ES 2014ES16RFSM001 SME Initiative ERDF 2014-20
OP N - - - - - - 85.771.541,05 € 2,00% 2,00%

regio_aar_2018_annexes
72
MS CCI Ref Title
(1)
MC
S fu
nct
ion
ing
eff
ecti
vely
(Y
/N/N
A*)
:
Y=C
at.
1-2
; N
=Ca
t. 3
-4
Accounting year 2016-2017 Accounting year 2017-2018
Reporting year 2018
Confirmed error rates after EC's assessment (desk review of all OPs and risk-based compliance audits)
Reportable rates (reported by audit authorities and,
where necessary, adjusted by EC following preliminary
consistency checks)
(2)
Tota
l Err
or
Rat
e
(3)
Tota
l Err
or
Rat
e
rem
ovi
ng
imp
act
of
adva
nce
s to
fin
anci
al
inst
rum
ents
(4)
Re
sid
ual
To
tal E
rro
r
Rat
e
(5)
Re
sid
ual
To
tal E
rro
r
Rat
e re
mo
vin
g im
pac
t o
f
adva
nce
s to
fin
anci
al
inst
rum
ents
(6)
To
tal E
rro
r R
ate
rep
ort
able
by
EC
(7)
Re
sid
ual
To
tal E
rro
r
Rat
e re
po
rtab
le b
y EC
Relevant expenditure
(interims+retentions-deductions)
Risk at Payment Risk reported in
column (5), or (7) if higher (or flat rate of 2% when (5) and (7) are empty, or (5) is empty and (7) is
below 2%)
Risk at Closure (taking into
account additional estimated financial
corrections)
Comments
FI 2014FI05M2OP001 Entrepreneurship and skills,
Åland Structural Fund Programme 2014-2020
Y - - - - 1,49% 0,94% 264.067,97 € 2,00% 2,00%
FI 2014FI16M2OP001 Sustainable growth and jobs 2014-2020 - Structural Funds
Programme of Finland Y 1,93% 1,93% 1,89% 1,89% 0,72% 0,00% 91.490.833,66 € 1,89% 1,89%
FI 2016FI16RFSM001
SME Initiative: Finnish guarantee scheme to improve
access to finance for high-growth firms
NA - - - - - - 20.000.000,00 € 2,00% 2,00%
FR 2014FR05M0OP001 Operational Programme ERDF-
ESF ile-de-France et Seine 2014-2020
N 40,89% 40,89% 2,00% 2,00% 69,29% 66,10% -
6.568.328,01 € 66,10% 2,00%
Ongoing assessment of the legality and regularity. Financial corrections will be applied to bring RTER 2017-2018 down to 2%, if necessary.
FR 2014FR05M2OP001 Operational Programme ERDF-ESF Guadeloupe et St Martin
Etat 2014-2020 N - - - - 11,50% 2,00% 4.682.899,10 € 2,00% 2,00%
FR 2014FR16M0OP001 Regional programme Aquitaine 2014-2020
N 5,11% 5,11% 2,00% 2,00% 3,64% 2,00% 36.699.711,54 € 2,00% 2,00%
FR 2014FR16M0OP002 Regional programme Auvergne 2014-2020
Y 0,94% 0,94% 0,03% 0,03% 3,13% 0,83% 39.060.846,31 € 0,83% 0,83%
FR 2014FR16M0OP003 Regional programme Centre
2014-2020 Y 4,22% 4,22% 2,00% 2,00% 1,36% 0,88% 21.004.085,49 € 2,00% 2,00%

regio_aar_2018_annexes
73
MS CCI Ref Title
(1)
MC
S fu
nct
ion
ing
eff
ecti
vely
(Y
/N/N
A*)
:
Y=C
at.
1-2
; N
=Ca
t. 3
-4
Accounting year 2016-2017 Accounting year 2017-2018
Reporting year 2018
Confirmed error rates after EC's assessment (desk review of all OPs and risk-based compliance audits)
Reportable rates (reported by audit authorities and,
where necessary, adjusted by EC following preliminary
consistency checks)
(2)
Tota
l Err
or
Rat
e
(3)
Tota
l Err
or
Rat
e
rem
ovi
ng
imp
act
of
adva
nce
s to
fin
anci
al
inst
rum
ents
(4)
Re
sid
ual
To
tal E
rro
r
Rat
e
(5)
Re
sid
ual
To
tal E
rro
r
Rat
e re
mo
vin
g im
pac
t o
f
adva
nce
s to
fin
anci
al
inst
rum
ents
(6)
To
tal E
rro
r R
ate
rep
ort
able
by
EC
(7)
Re
sid
ual
To
tal E
rro
r
Rat
e re
po
rtab
le b
y EC
Relevant expenditure
(interims+retentions-deductions)
Risk at Payment Risk reported in
column (5), or (7) if higher (or flat rate of 2% when (5) and (7) are empty, or (5) is empty and (7) is
below 2%)
Risk at Closure (taking into
account additional estimated financial
corrections)
Comments
FR 2014FR16M0OP004 Regional programme
Champagne-Ardenne 2014-2020
N 10,00% 10,00% 9,47% 9,47% 4,83% 2,00% 9.973.484,96 € 9,47% 2,00%
Ongoing audit contradictory procedure. Financial corrections will be applied to bring RTER 2016-2017 down to 2%, if necessary
FR 2014FR16M0OP005 Regional programme Haute-
Normandie 2014-2020 Y - - - - 2,98% 2,00% 27.911.576,01 € 2,00% 2,00%
FR 2014FR16M0OP006 Regional programme
Languedoc-Roussillon 2014-2020
N 1,72% 1,72% 1,37% 1,37% 2,98% 2,41% 31.569.320,41 € 2,41% 2,00%
Ongoing assessment of the legality and regularity. Financial corrections will be applied to bring RTER 2017-2018 down to 2%, if necessary.
FR 2014FR16M0OP007 Regional programme Midi-Pyrénées et Garonne 2014-
2020 N 5,00% 0,81% 4,84% 4,84% 3,78% 3,49% 72.846.308,76 € 4,84% 2,00%
Ongoing audit contradictory procedure. Financial corrections will be applied to bring RTERs 2016-2017 and 2017-2018 down to 2%, if necessary

regio_aar_2018_annexes
74
MS CCI Ref Title
(1)
MC
S fu
nct
ion
ing
eff
ecti
vely
(Y
/N/N
A*)
:
Y=C
at.
1-2
; N
=Ca
t. 3
-4
Accounting year 2016-2017 Accounting year 2017-2018
Reporting year 2018
Confirmed error rates after EC's assessment (desk review of all OPs and risk-based compliance audits)
Reportable rates (reported by audit authorities and,
where necessary, adjusted by EC following preliminary
consistency checks)
(2)
Tota
l Err
or
Rat
e
(3)
Tota
l Err
or
Rat
e
rem
ovi
ng
imp
act
of
adva
nce
s to
fin
anci
al
inst
rum
ents
(4)
Re
sid
ual
To
tal E
rro
r
Rat
e
(5)
Re
sid
ual
To
tal E
rro
r
Rat
e re
mo
vin
g im
pac
t o
f
adva
nce
s to
fin
anci
al
inst
rum
ents
(6)
To
tal E
rro
r R
ate
rep
ort
able
by
EC
(7)
Re
sid
ual
To
tal E
rro
r
Rat
e re
po
rtab
le b
y EC
Relevant expenditure
(interims+retentions-deductions)
Risk at Payment Risk reported in
column (5), or (7) if higher (or flat rate of 2% when (5) and (7) are empty, or (5) is empty and (7) is
below 2%)
Risk at Closure (taking into
account additional estimated financial
corrections)
Comments
FR 2014FR16M0OP008 Regional programme Picardie
2014-2020 N 5,00% 5,00% 4,78% 4,78% 5,34% 2,00% 17.305.635,03 € 4,78% 2,00%
Ongoing audit contradictory procedure. Financial corrections will be applied to bring RTER 2016-2017 down to 2%, if necessary
FR 2014FR16M0OP009 Regional programme
Guadeloupe Conseil Régional 2014-2020
N - - - - 0,38% 0,32% 32.219.477,69 € 2,00% 2,00%
FR 2014FR16M0OP011 Regional programme
Martinique Conseil Régional 2014-2020
N 2,05% 2,05% 1,66% 1,66% 9,22% 8,54% 12.120.102,71 € 8,54% 2,00%
Ongoing assessment of the legality and regularity. Financial corrections will be applied to bring RTER 2017-2018 down to 2%, if necessary.
FR 2014FR16M0OP012 Regional programme Nord-Pas
de Calais 2014-2020 Y 4,16% 4,16% 0,67% 0,67% 0,59% 0,41% 60.182.522,98 € 0,67% 0,67%
FR 2014FR16M0OP013 Regional programme Provence Alpes Côte d'Azur 2014-2020
Y 2,67% 2,67% 1,90% 1,90% 1,31% 0,76% 34.289.307,82 € 1,90% 1,90%
FR 2014FR16M0OP014 Regional programme
Bourgogne 2014-2020 N 5,70% 5,70% 1,34% 1,34% 6,04% 5,38% 19.697.249,25 € 5,38% 2,00%
Ongoing assessment of the legality and regularity. Financial corrections will be applied to bring RTER 2017-2018 down to 2%, if necessary.
FR 2014FR16M0OP015 Regional programme Lorraine
et Vosges 2014-2020 N 10,00% 10,00% 9,47% 9,47% 4,83% 2,00% 41.880.041,45 € 9,47% 2,00%
Ongoing audit contradictory procedure. Financial corrections will be applied to bring RTER 2016-2017 down to 2%, if necessary
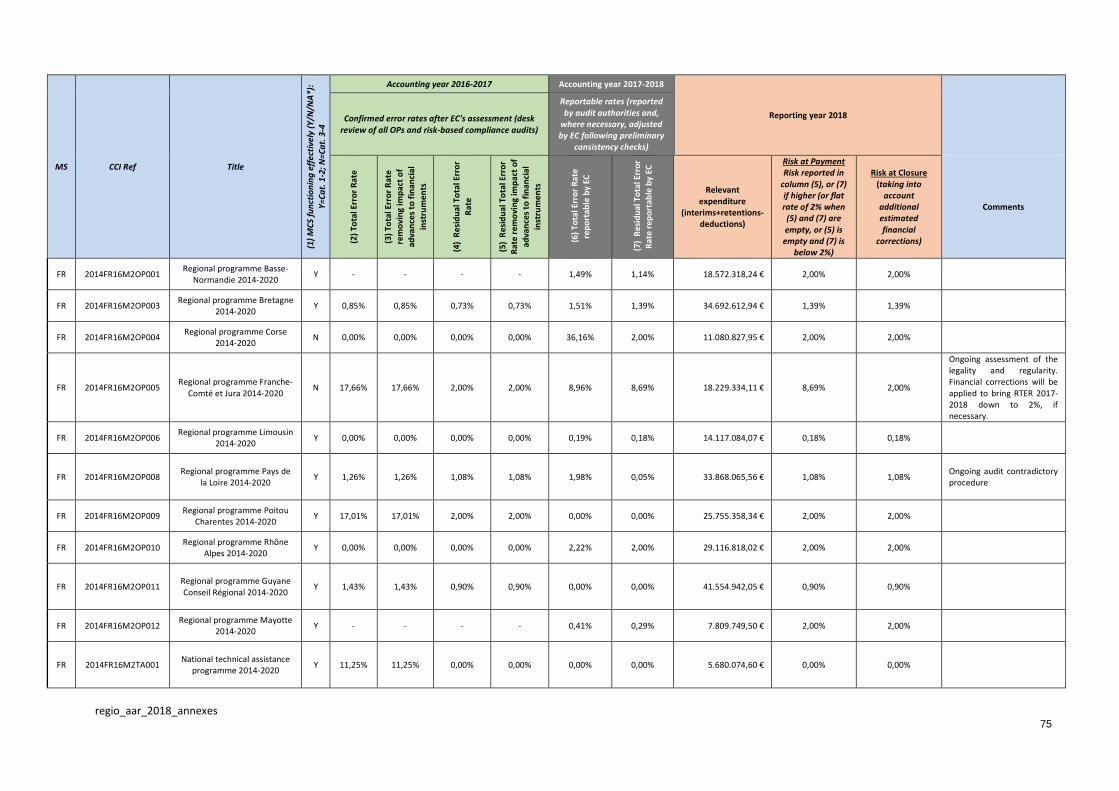
regio_aar_2018_annexes
75
MS CCI Ref Title
(1)
MC
S fu
nct
ion
ing
eff
ecti
vely
(Y
/N/N
A*)
:
Y=C
at.
1-2
; N
=Ca
t. 3
-4
Accounting year 2016-2017 Accounting year 2017-2018
Reporting year 2018
Confirmed error rates after EC's assessment (desk review of all OPs and risk-based compliance audits)
Reportable rates (reported by audit authorities and,
where necessary, adjusted by EC following preliminary
consistency checks)
(2)
Tota
l Err
or
Rat
e
(3)
Tota
l Err
or
Rat
e
rem
ovi
ng
imp
act
of
adva
nce
s to
fin
anci
al
inst
rum
ents
(4)
Re
sid
ual
To
tal E
rro
r
Rat
e
(5)
Re
sid
ual
To
tal E
rro
r
Rat
e re
mo
vin
g im
pac
t o
f
adva
nce
s to
fin
anci
al
inst
rum
ents
(6)
To
tal E
rro
r R
ate
rep
ort
able
by
EC
(7)
Re
sid
ual
To
tal E
rro
r
Rat
e re
po
rtab
le b
y EC
Relevant expenditure
(interims+retentions-deductions)
Risk at Payment Risk reported in
column (5), or (7) if higher (or flat rate of 2% when (5) and (7) are empty, or (5) is empty and (7) is
below 2%)
Risk at Closure (taking into
account additional estimated financial
corrections)
Comments
FR 2014FR16M2OP001 Regional programme Basse-
Normandie 2014-2020 Y - - - - 1,49% 1,14% 18.572.318,24 € 2,00% 2,00%
FR 2014FR16M2OP003 Regional programme Bretagne
2014-2020 Y 0,85% 0,85% 0,73% 0,73% 1,51% 1,39% 34.692.612,94 € 1,39% 1,39%
FR 2014FR16M2OP004 Regional programme Corse
2014-2020 N 0,00% 0,00% 0,00% 0,00% 36,16% 2,00% 11.080.827,95 € 2,00% 2,00%
FR 2014FR16M2OP005 Regional programme Franche-
Comté et Jura 2014-2020 N 17,66% 17,66% 2,00% 2,00% 8,96% 8,69% 18.229.334,11 € 8,69% 2,00%
Ongoing assessment of the legality and regularity. Financial corrections will be applied to bring RTER 2017-2018 down to 2%, if necessary.
FR 2014FR16M2OP006 Regional programme Limousin
2014-2020 Y 0,00% 0,00% 0,00% 0,00% 0,19% 0,18% 14.117.084,07 € 0,18% 0,18%
FR 2014FR16M2OP008 Regional programme Pays de
la Loire 2014-2020 Y 1,26% 1,26% 1,08% 1,08% 1,98% 0,05% 33.868.065,56 € 1,08% 1,08%
Ongoing audit contradictory procedure
FR 2014FR16M2OP009 Regional programme Poitou
Charentes 2014-2020 Y 17,01% 17,01% 2,00% 2,00% 0,00% 0,00% 25.755.358,34 € 2,00% 2,00%
FR 2014FR16M2OP010 Regional programme Rhône
Alpes 2014-2020 Y 0,00% 0,00% 0,00% 0,00% 2,22% 2,00% 29.116.818,02 € 2,00% 2,00%
FR 2014FR16M2OP011 Regional programme Guyane Conseil Régional 2014-2020
Y 1,43% 1,43% 0,90% 0,90% 0,00% 0,00% 41.554.942,05 € 0,90% 0,90%
FR 2014FR16M2OP012 Regional programme Mayotte
2014-2020 Y - - - - 0,41% 0,29% 7.809.749,50 € 2,00% 2,00%
FR 2014FR16M2TA001 National technical assistance
programme 2014-2020 Y 11,25% 11,25% 0,00% 0,00% 0,00% 0,00% 5.680.074,60 € 0,00% 0,00%

regio_aar_2018_annexes
76
MS CCI Ref Title
(1)
MC
S fu
nct
ion
ing
eff
ecti
vely
(Y
/N/N
A*)
:
Y=C
at.
1-2
; N
=Ca
t. 3
-4
Accounting year 2016-2017 Accounting year 2017-2018
Reporting year 2018
Confirmed error rates after EC's assessment (desk review of all OPs and risk-based compliance audits)
Reportable rates (reported by audit authorities and,
where necessary, adjusted by EC following preliminary
consistency checks)
(2)
Tota
l Err
or
Rat
e
(3)
Tota
l Err
or
Rat
e
rem
ovi
ng
imp
act
of
adva
nce
s to
fin
anci
al
inst
rum
ents
(4)
Re
sid
ual
To
tal E
rro
r
Rat
e
(5)
Re
sid
ual
To
tal E
rro
r
Rat
e re
mo
vin
g im
pac
t o
f
adva
nce
s to
fin
anci
al
inst
rum
ents
(6)
To
tal E
rro
r R
ate
rep
ort
able
by
EC
(7)
Re
sid
ual
To
tal E
rro
r
Rat
e re
po
rtab
le b
y EC
Relevant expenditure
(interims+retentions-deductions)
Risk at Payment Risk reported in
column (5), or (7) if higher (or flat rate of 2% when (5) and (7) are empty, or (5) is empty and (7) is
below 2%)
Risk at Closure (taking into
account additional estimated financial
corrections)
Comments
FR 2014FR16RFOP001 Interregional programme
Alpes 2014-2020 Y 4,89% 4,89% 1,43% 1,43% 0,00% 0,00% 2.891.018,95 € 1,43% 1,43%
FR 2014FR16RFOP002 Interregional programme Loire
2014-2020 Y 0,00% 0,00% 0,00% 0,00% 0,04% 0,04% 4.862.480,94 € 0,04% 0,04%
FR 2014FR16RFOP003 Interregional programme Massif Central 2014-2020
N 6,23% 6,23% 2,00% 2,00% 2,87% 2,00% 2.330.746,85 € 2,00% 2,00%
FR 2014FR16RFOP004 Interregional programme
Pyrénées 2014-2020 Y - - - - 1,07% 0,75% 3.276.884,65 € 2,00% 2,00%
FR 2014FR16RFOP005 Interregional programme
Rhône 2014-2020 Y 0,00% 0,00% 0,00% 0,00% 1,08% 0,93% 1.535.377,12 € 0,93% 0,93%
FR 2014FR16RFOP006 Interregional programme
Alsace 2014-2020 N 10,00% 10,00% 9,47% 9,47% 4,83% 2,00% 11.542.696,75 € 9,47% 2,00%
Ongoing audit contradictory procedure. Financial corrections will be applied to bring RTER 2016-2017 down to 2%, if necessary
FR 2014FR16RFOP007 Interregional programme Réunion Conseil Régional
2014-2020 Y 0,04% 0,04% 0,03% 0,03% 0,26% 0,24% 93.029.748,13 € 0,24% 0,24%
GR 2014GR05M2OP001 Reform of the Public Sector Y 3,99% 4,45% 2,75% 3,05% 2,70% 1,77% 6.318.273,80 € 3,05% 2,00%
Ongoing audit contradictory procedure. Financial corrections will be applied to bring RTER 2016-2017 down to 2%, if necessary
GR 2014GR16M1OP001
TRANSPORT INFRASTRUCTURE,
ENVIRONMENT AND SUSTAINABLE DEVELOPMENT
OP
Y 3,99% 4,45% 2,75% 3,05% 2,70% 1,77% 358.420.061,59 € 3,05% 2,00%
Ongoing audit contradictory procedure. Financial corrections will be applied to bring RTER 2016-2017 down to 2%, if necessary
GR 2014GR16M2OP001 COMPETITIVENESS,
ENTREPRENEURSHIP AND INNOVATION OP
Y 3,99% 4,45% 2,75% 3,05% 2,70% 1,77% 145.763.824,48 € 3,05% 2,00%
Ongoing audit contradictory procedure. Financial corrections will be applied to bring RTER 2016-2017 down to 2%, if necessary
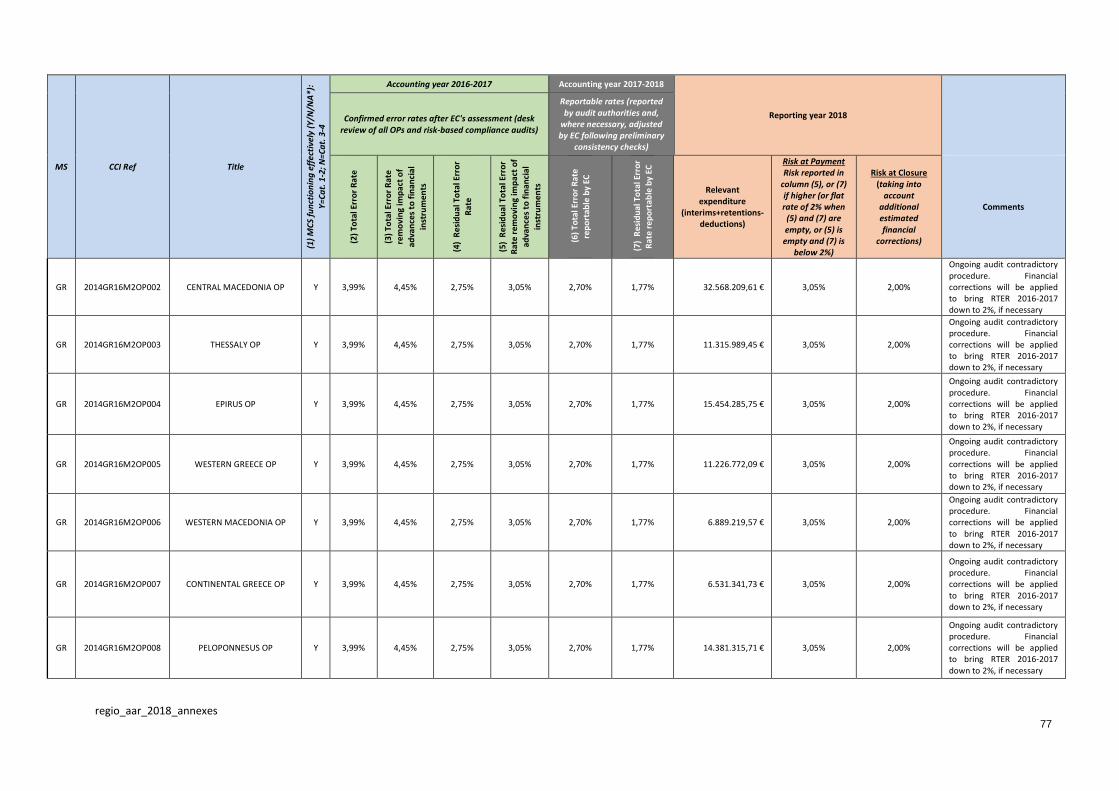
regio_aar_2018_annexes
77
MS CCI Ref Title
(1)
MC
S fu
nct
ion
ing
eff
ecti
vely
(Y
/N/N
A*)
:
Y=C
at.
1-2
; N
=Ca
t. 3
-4
Accounting year 2016-2017 Accounting year 2017-2018
Reporting year 2018
Confirmed error rates after EC's assessment (desk review of all OPs and risk-based compliance audits)
Reportable rates (reported by audit authorities and,
where necessary, adjusted by EC following preliminary
consistency checks)
(2)
Tota
l Err
or
Rat
e
(3)
Tota
l Err
or
Rat
e
rem
ovi
ng
imp
act
of
adva
nce
s to
fin
anci
al
inst
rum
ents
(4)
Re
sid
ual
To
tal E
rro
r
Rat
e
(5)
Re
sid
ual
To
tal E
rro
r
Rat
e re
mo
vin
g im
pac
t o
f
adva
nce
s to
fin
anci
al
inst
rum
ents
(6)
To
tal E
rro
r R
ate
rep
ort
able
by
EC
(7)
Re
sid
ual
To
tal E
rro
r
Rat
e re
po
rtab
le b
y EC
Relevant expenditure
(interims+retentions-deductions)
Risk at Payment Risk reported in
column (5), or (7) if higher (or flat rate of 2% when (5) and (7) are empty, or (5) is empty and (7) is
below 2%)
Risk at Closure (taking into
account additional estimated financial
corrections)
Comments
GR 2014GR16M2OP002 CENTRAL MACEDONIA OP Y 3,99% 4,45% 2,75% 3,05% 2,70% 1,77% 32.568.209,61 € 3,05% 2,00%
Ongoing audit contradictory procedure. Financial corrections will be applied to bring RTER 2016-2017 down to 2%, if necessary
GR 2014GR16M2OP003 THESSALY OP Y 3,99% 4,45% 2,75% 3,05% 2,70% 1,77% 11.315.989,45 € 3,05% 2,00%
Ongoing audit contradictory procedure. Financial corrections will be applied to bring RTER 2016-2017 down to 2%, if necessary
GR 2014GR16M2OP004 EPIRUS OP Y 3,99% 4,45% 2,75% 3,05% 2,70% 1,77% 15.454.285,75 € 3,05% 2,00%
Ongoing audit contradictory procedure. Financial corrections will be applied to bring RTER 2016-2017 down to 2%, if necessary
GR 2014GR16M2OP005 WESTERN GREECE OP Y 3,99% 4,45% 2,75% 3,05% 2,70% 1,77% 11.226.772,09 € 3,05% 2,00%
Ongoing audit contradictory procedure. Financial corrections will be applied to bring RTER 2016-2017 down to 2%, if necessary
GR 2014GR16M2OP006 WESTERN MACEDONIA OP Y 3,99% 4,45% 2,75% 3,05% 2,70% 1,77% 6.889.219,57 € 3,05% 2,00%
Ongoing audit contradictory procedure. Financial corrections will be applied to bring RTER 2016-2017 down to 2%, if necessary
GR 2014GR16M2OP007 CONTINENTAL GREECE OP Y 3,99% 4,45% 2,75% 3,05% 2,70% 1,77% 6.531.341,73 € 3,05% 2,00%
Ongoing audit contradictory procedure. Financial corrections will be applied to bring RTER 2016-2017 down to 2%, if necessary
GR 2014GR16M2OP008 PELOPONNESUS OP Y 3,99% 4,45% 2,75% 3,05% 2,70% 1,77% 14.381.315,71 € 3,05% 2,00%
Ongoing audit contradictory procedure. Financial corrections will be applied to bring RTER 2016-2017 down to 2%, if necessary
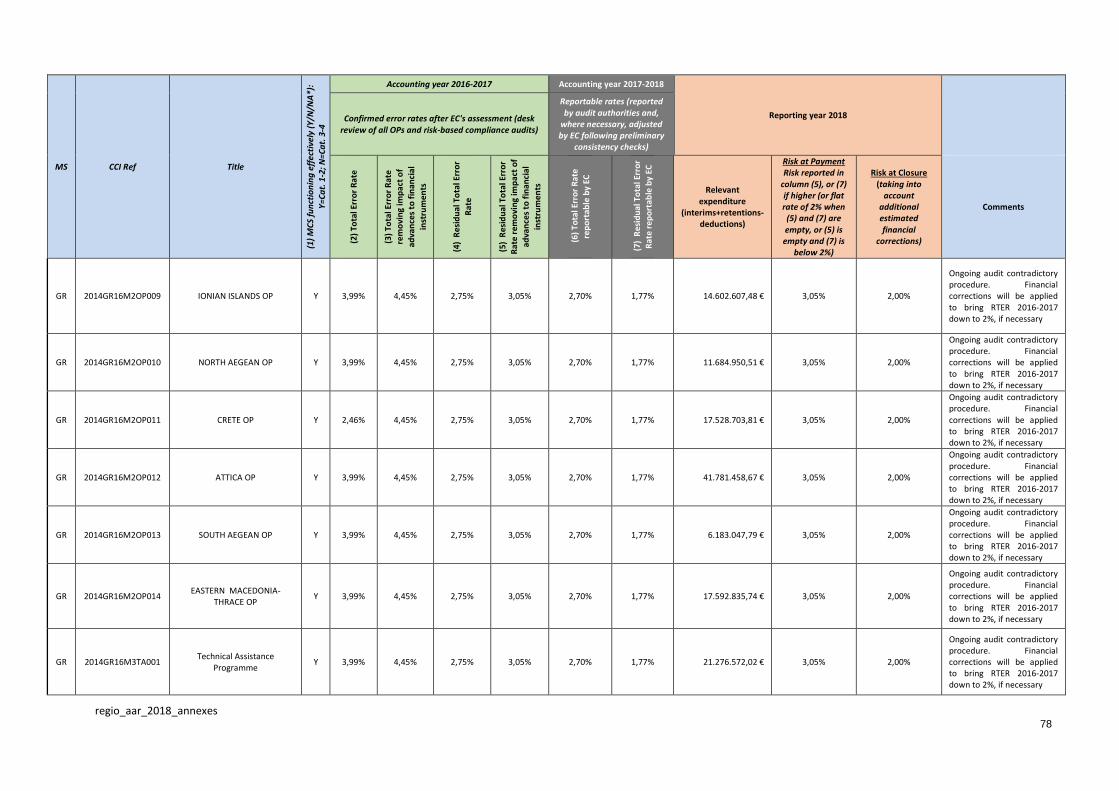
regio_aar_2018_annexes
78
MS CCI Ref Title
(1)
MC
S fu
nct
ion
ing
eff
ecti
vely
(Y
/N/N
A*)
:
Y=C
at.
1-2
; N
=Ca
t. 3
-4
Accounting year 2016-2017 Accounting year 2017-2018
Reporting year 2018
Confirmed error rates after EC's assessment (desk review of all OPs and risk-based compliance audits)
Reportable rates (reported by audit authorities and,
where necessary, adjusted by EC following preliminary
consistency checks)
(2)
Tota
l Err
or
Rat
e
(3)
Tota
l Err
or
Rat
e
rem
ovi
ng
imp
act
of
adva
nce
s to
fin
anci
al
inst
rum
ents
(4)
Re
sid
ual
To
tal E
rro
r
Rat
e
(5)
Re
sid
ual
To
tal E
rro
r
Rat
e re
mo
vin
g im
pac
t o
f
adva
nce
s to
fin
anci
al
inst
rum
ents
(6)
To
tal E
rro
r R
ate
rep
ort
able
by
EC
(7)
Re
sid
ual
To
tal E
rro
r
Rat
e re
po
rtab
le b
y EC
Relevant expenditure
(interims+retentions-deductions)
Risk at Payment Risk reported in
column (5), or (7) if higher (or flat rate of 2% when (5) and (7) are empty, or (5) is empty and (7) is
below 2%)
Risk at Closure (taking into
account additional estimated financial
corrections)
Comments
GR 2014GR16M2OP009 IONIAN ISLANDS OP Y 3,99% 4,45% 2,75% 3,05% 2,70% 1,77% 14.602.607,48 € 3,05% 2,00%
Ongoing audit contradictory procedure. Financial corrections will be applied to bring RTER 2016-2017 down to 2%, if necessary
GR 2014GR16M2OP010 NORTH AEGEAN OP Y 3,99% 4,45% 2,75% 3,05% 2,70% 1,77% 11.684.950,51 € 3,05% 2,00%
Ongoing audit contradictory procedure. Financial corrections will be applied to bring RTER 2016-2017 down to 2%, if necessary
GR 2014GR16M2OP011 CRETE OP Y 2,46% 4,45% 2,75% 3,05% 2,70% 1,77% 17.528.703,81 € 3,05% 2,00%
Ongoing audit contradictory procedure. Financial corrections will be applied to bring RTER 2016-2017 down to 2%, if necessary
GR 2014GR16M2OP012 ATTICA OP Y 3,99% 4,45% 2,75% 3,05% 2,70% 1,77% 41.781.458,67 € 3,05% 2,00%
Ongoing audit contradictory procedure. Financial corrections will be applied to bring RTER 2016-2017 down to 2%, if necessary
GR 2014GR16M2OP013 SOUTH AEGEAN OP Y 3,99% 4,45% 2,75% 3,05% 2,70% 1,77% 6.183.047,79 € 3,05% 2,00%
Ongoing audit contradictory procedure. Financial corrections will be applied to bring RTER 2016-2017 down to 2%, if necessary
GR 2014GR16M2OP014 EASTERN MACEDONIA-
THRACE OP Y 3,99% 4,45% 2,75% 3,05% 2,70% 1,77% 17.592.835,74 € 3,05% 2,00%
Ongoing audit contradictory procedure. Financial corrections will be applied to bring RTER 2016-2017 down to 2%, if necessary
GR 2014GR16M3TA001 Technical Assistance
Programme Y 3,99% 4,45% 2,75% 3,05% 2,70% 1,77% 21.276.572,02 € 3,05% 2,00%
Ongoing audit contradictory procedure. Financial corrections will be applied to bring RTER 2016-2017 down to 2%, if necessary

regio_aar_2018_annexes
79
MS CCI Ref Title
(1)
MC
S fu
nct
ion
ing
eff
ecti
vely
(Y
/N/N
A*)
:
Y=C
at.
1-2
; N
=Ca
t. 3
-4
Accounting year 2016-2017 Accounting year 2017-2018
Reporting year 2018
Confirmed error rates after EC's assessment (desk review of all OPs and risk-based compliance audits)
Reportable rates (reported by audit authorities and,
where necessary, adjusted by EC following preliminary
consistency checks)
(2)
Tota
l Err
or
Rat
e
(3)
Tota
l Err
or
Rat
e
rem
ovi
ng
imp
act
of
adva
nce
s to
fin
anci
al
inst
rum
ents
(4)
Re
sid
ual
To
tal E
rro
r
Rat
e
(5)
Re
sid
ual
To
tal E
rro
r
Rat
e re
mo
vin
g im
pac
t o
f
adva
nce
s to
fin
anci
al
inst
rum
ents
(6)
To
tal E
rro
r R
ate
rep
ort
able
by
EC
(7)
Re
sid
ual
To
tal E
rro
r
Rat
e re
po
rtab
le b
y EC
Relevant expenditure
(interims+retentions-deductions)
Risk at Payment Risk reported in
column (5), or (7) if higher (or flat rate of 2% when (5) and (7) are empty, or (5) is empty and (7) is
below 2%)
Risk at Closure (taking into
account additional estimated financial
corrections)
Comments
HR 2014HR16M1OP001 Competitiveness and Cohesion
OP N - - - - 3,61% 1,13% 106.943.513,46 € 1,13% 1,13%
Category 3 limited to IB2 EPEEF
HU 2014HU05M2OP001 Human Resources
Development Operational Programme
N - - - - 2,63% 1,94% 139.793.451,44 € 2,00% 2,00%
HU 2014HU05M3OP001 Public Administration and Civil
Service Development OP N - - - - 8,63% 1,88% 28.294.624,17 € 2,00% 2,00%
HU 2014HU16M0OP001 Economic Development and
Innovation Operational Programme
N 2,06% 6,29% 0,96% 5,32% 3,04% 1,99% 995.562.706,32 € 5,32% 2,00% Ongoing audit contradictory procedure
HU 2014HU16M1OP001 Environmental and Energy
Efficiency OP N 0,01% 0,01% 0,01% 0,01% 4,18% 0,88% 312.138.533,07 € 0,88% 0,88%
HU 2014HU16M1OP003 Integrated Transport OP N - - - - 1,01% 0,00% -
450.378.345,19 € 2,00% 2,00%
HU 2014HU16M2OP001 Territorial and settlement
development OP N 53,92% 53,92% 0,00% 0,00% 11,19% 1,99% 490.056.847,85 € 1,99% 1,99%
HU 2014HU16M2OP002 Competitive Central-Hungary
OP N - - - - 11,19% 1,99% 26.434.831,35 € 2,00% 2,00%
IE 2014IE16RFOP001 Border, Midland and Western
Regional Operational Programme 2014-2020
Y 0,00% 0,00% 0,00% 0,00% 1,68% 0,08% 23.625.344,54 € 0,08% 0,08%
IE 2014IE16RFOP002 Southern & Eastern Regional
Operational Programme Y 0,00% 0,00% 0,00% 0,00% 1,68% 0,08% 34.180.520,32 € 0,08% 0,08%
IT 2014IT05M2OP001 National Operational
Programme on Education Y 0,90% 0,90% 0,50% 0,50% 0,28% 0,25% 44.586.058,93 € 0,50% 0,50%
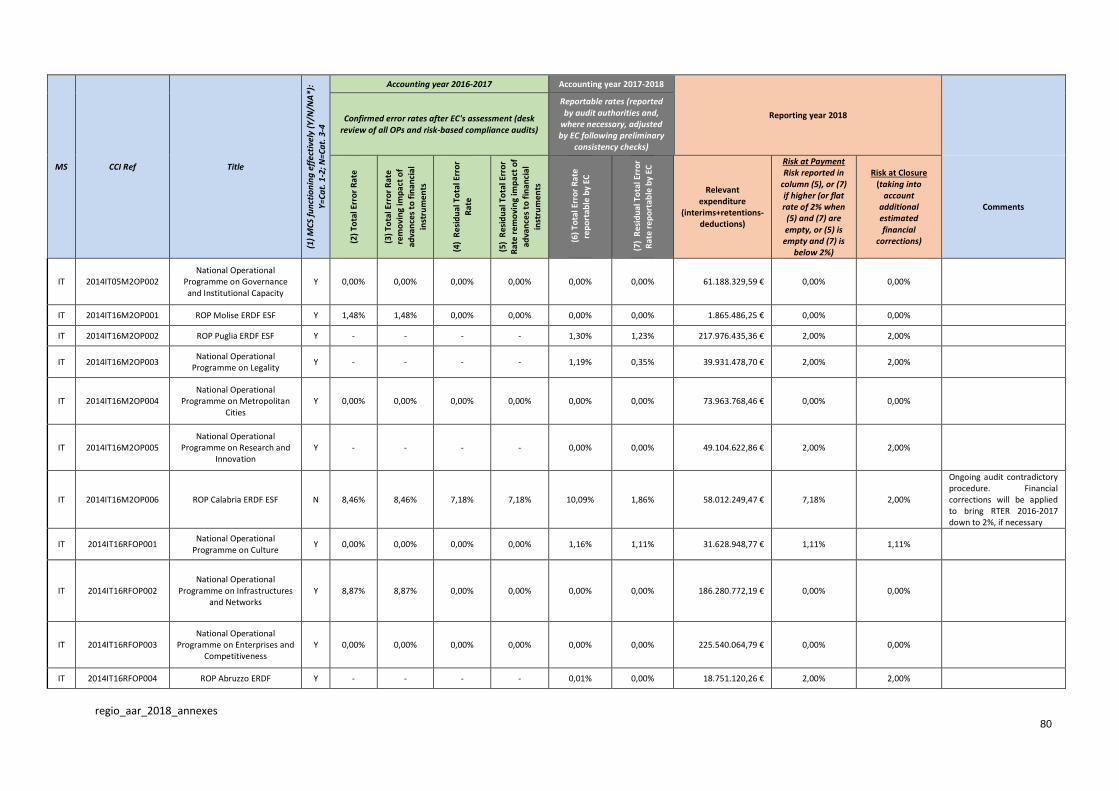
regio_aar_2018_annexes
80
MS CCI Ref Title
(1)
MC
S fu
nct
ion
ing
eff
ecti
vely
(Y
/N/N
A*)
:
Y=C
at.
1-2
; N
=Ca
t. 3
-4
Accounting year 2016-2017 Accounting year 2017-2018
Reporting year 2018
Confirmed error rates after EC's assessment (desk review of all OPs and risk-based compliance audits)
Reportable rates (reported by audit authorities and,
where necessary, adjusted by EC following preliminary
consistency checks)
(2)
Tota
l Err
or
Rat
e
(3)
Tota
l Err
or
Rat
e
rem
ovi
ng
imp
act
of
adva
nce
s to
fin
anci
al
inst
rum
ents
(4)
Re
sid
ual
To
tal E
rro
r
Rat
e
(5)
Re
sid
ual
To
tal E
rro
r
Rat
e re
mo
vin
g im
pac
t o
f
adva
nce
s to
fin
anci
al
inst
rum
ents
(6)
To
tal E
rro
r R
ate
rep
ort
able
by
EC
(7)
Re
sid
ual
To
tal E
rro
r
Rat
e re
po
rtab
le b
y EC
Relevant expenditure
(interims+retentions-deductions)
Risk at Payment Risk reported in
column (5), or (7) if higher (or flat rate of 2% when (5) and (7) are empty, or (5) is empty and (7) is
below 2%)
Risk at Closure (taking into
account additional estimated financial
corrections)
Comments
IT 2014IT05M2OP002 National Operational
Programme on Governance and Institutional Capacity
Y 0,00% 0,00% 0,00% 0,00% 0,00% 0,00% 61.188.329,59 € 0,00% 0,00%
IT 2014IT16M2OP001 ROP Molise ERDF ESF Y 1,48% 1,48% 0,00% 0,00% 0,00% 0,00% 1.865.486,25 € 0,00% 0,00%
IT 2014IT16M2OP002 ROP Puglia ERDF ESF Y - - - - 1,30% 1,23% 217.976.435,36 € 2,00% 2,00%
IT 2014IT16M2OP003 National Operational
Programme on Legality Y - - - - 1,19% 0,35% 39.931.478,70 € 2,00% 2,00%
IT 2014IT16M2OP004 National Operational
Programme on Metropolitan Cities
Y 0,00% 0,00% 0,00% 0,00% 0,00% 0,00% 73.963.768,46 € 0,00% 0,00%
IT 2014IT16M2OP005 National Operational
Programme on Research and Innovation
Y - - - - 0,00% 0,00% 49.104.622,86 € 2,00% 2,00%
IT 2014IT16M2OP006 ROP Calabria ERDF ESF N 8,46% 8,46% 7,18% 7,18% 10,09% 1,86% 58.012.249,47 € 7,18% 2,00%
Ongoing audit contradictory procedure. Financial corrections will be applied to bring RTER 2016-2017 down to 2%, if necessary
IT 2014IT16RFOP001 National Operational
Programme on Culture Y 0,00% 0,00% 0,00% 0,00% 1,16% 1,11% 31.628.948,77 € 1,11% 1,11%
IT 2014IT16RFOP002 National Operational
Programme on Infrastructures and Networks
Y 8,87% 8,87% 0,00% 0,00% 0,00% 0,00% 186.280.772,19 € 0,00% 0,00%
IT 2014IT16RFOP003 National Operational
Programme on Enterprises and Competitiveness
Y 0,00% 0,00% 0,00% 0,00% 0,00% 0,00% 225.540.064,79 € 0,00% 0,00%
IT 2014IT16RFOP004 ROP Abruzzo ERDF Y - - - - 0,01% 0,00% 18.751.120,26 € 2,00% 2,00%

regio_aar_2018_annexes
81
MS CCI Ref Title
(1)
MC
S fu
nct
ion
ing
eff
ecti
vely
(Y
/N/N
A*)
:
Y=C
at.
1-2
; N
=Ca
t. 3
-4
Accounting year 2016-2017 Accounting year 2017-2018
Reporting year 2018
Confirmed error rates after EC's assessment (desk review of all OPs and risk-based compliance audits)
Reportable rates (reported by audit authorities and,
where necessary, adjusted by EC following preliminary
consistency checks)
(2)
Tota
l Err
or
Rat
e
(3)
Tota
l Err
or
Rat
e
rem
ovi
ng
imp
act
of
adva
nce
s to
fin
anci
al
inst
rum
ents
(4)
Re
sid
ual
To
tal E
rro
r
Rat
e
(5)
Re
sid
ual
To
tal E
rro
r
Rat
e re
mo
vin
g im
pac
t o
f
adva
nce
s to
fin
anci
al
inst
rum
ents
(6)
To
tal E
rro
r R
ate
rep
ort
able
by
EC
(7)
Re
sid
ual
To
tal E
rro
r
Rat
e re
po
rtab
le b
y EC
Relevant expenditure
(interims+retentions-deductions)
Risk at Payment Risk reported in
column (5), or (7) if higher (or flat rate of 2% when (5) and (7) are empty, or (5) is empty and (7) is
below 2%)
Risk at Closure (taking into
account additional estimated financial
corrections)
Comments
IT 2014IT16RFOP005 ROP PA Bolzano ERDF Y - - - - - - 11.212.251,96 € 2,00% 2,00%
IT 2014IT16RFOP007 ROP Campania ERDF N 0,00% 0,00% 0,00% 0,00% 1,50% 1,50% 79.914.943,01 € 1,50% 1,50%
IT 2014IT16RFOP008 ROP Emilia Romagna ERDF Y 0,52% 0,52% 0,50% 0,50% 0,57% 0,37% 54.724.789,54 € 0,50% 0,50%
IT 2014IT16RFOP009 ROP Friuli Venezia Giulia ERDF Y 0,00% 0,00% 0,00% 0,00% 0,27% 0,27% 21.325.951,97 € 0,27% 0,27%
IT 2014IT16RFOP010 ROP Lazio ERDF Y 0,00% 0,00% 0,00% 0,00% 0,00% 0,00% 37.699.842,94 € 0,00% 0,00%
IT 2014IT16RFOP011 ROP Liguria ERDF Y 0,93% 0,93% 0,13% 0,13% 0,00% 0,00% 29.690.991,14 € 0,13% 0,13%
IT 2014IT16RFOP012 ROP Lombardia ERDF Y 0,28% 0,28% 0,00% 0,00% 0,17% 0,00% 42.138.186,88 € 0,00% 0,00%
IT 2014IT16RFOP013 ROP Marche ERDF Y 0,00% 0,00% 0,00% 0,00% 0,04% 0,00% 30.493.465,75 € 0,00% 0,00%
IT 2014IT16RFOP014 ROP Piemonte ERDF Y 0,00% 0,00% 0,00% 0,00% 0,08% 0,00% 62.178.190,30 € 0,00% 0,00%
IT 2014IT16RFOP015 ROP Sardegna ERDF Y 0,63% 0,91% 0,52% 0,76% 3,76% 2,00% 61.405.046,32 € 2,00% 2,00%
IT 2014IT16RFOP016 ROP Sicilia ERDF Y - - - - 0,00% 0,00% 457.755.965,55 € 2,00% 2,00%
IT 2014IT16RFOP017 ROP Toscana ERDF Y 0,00% 0,04% 0,00% 0,02% 0,18% 0,16% 87.007.796,91 € 0,16% 0,16%
IT 2014IT16RFOP018 ROP PA Trento ERDF Y - - - - 0,00% 0,00% 8.763.666,05 € 2,00% 2,00%
IT 2014IT16RFOP019 ROP Umbria ERDF Y - - - - 0,75% 0,66% 29.382.762,04 € 2,00% 2,00%
IT 2014IT16RFOP020 ROP Valle d'Aosta ERDF Y - - - - 0,00% 0,00% 5.630.560,08 € 2,00% 2,00%
IT 2014IT16RFOP021 ROP Veneto ERDF Y - - - - 1,86% 1,33% 44.766.191,10 € 2,00% 2,00%
IT 2014IT16RFOP022 ROP Basilicata ERDF Y 10,96% 10,96% 0,00% 0,00% - - - € 0,00% 0,00%
IT 2015IT16RFSM001 National operational
programme SME Initiative Y - - - - - - - € 2,00% 2,00%
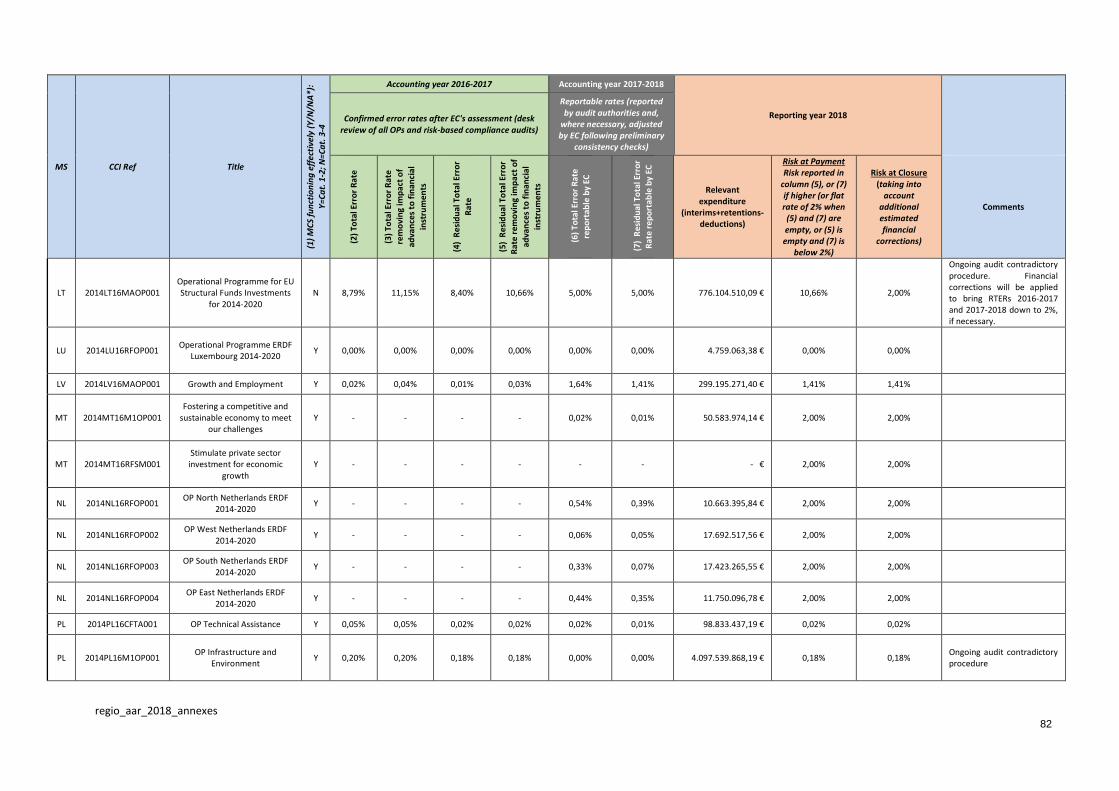
regio_aar_2018_annexes
82
MS CCI Ref Title
(1)
MC
S fu
nct
ion
ing
eff
ecti
vely
(Y
/N/N
A*)
:
Y=C
at.
1-2
; N
=Ca
t. 3
-4
Accounting year 2016-2017 Accounting year 2017-2018
Reporting year 2018
Confirmed error rates after EC's assessment (desk review of all OPs and risk-based compliance audits)
Reportable rates (reported by audit authorities and,
where necessary, adjusted by EC following preliminary
consistency checks)
(2)
Tota
l Err
or
Rat
e
(3)
Tota
l Err
or
Rat
e
rem
ovi
ng
imp
act
of
adva
nce
s to
fin
anci
al
inst
rum
ents
(4)
Re
sid
ual
To
tal E
rro
r
Rat
e
(5)
Re
sid
ual
To
tal E
rro
r
Rat
e re
mo
vin
g im
pac
t o
f
adva
nce
s to
fin
anci
al
inst
rum
ents
(6)
To
tal E
rro
r R
ate
rep
ort
able
by
EC
(7)
Re
sid
ual
To
tal E
rro
r
Rat
e re
po
rtab
le b
y EC
Relevant expenditure
(interims+retentions-deductions)
Risk at Payment Risk reported in
column (5), or (7) if higher (or flat rate of 2% when (5) and (7) are empty, or (5) is empty and (7) is
below 2%)
Risk at Closure (taking into
account additional estimated financial
corrections)
Comments
LT 2014LT16MAOP001 Operational Programme for EU Structural Funds Investments
for 2014-2020 N 8,79% 11,15% 8,40% 10,66% 5,00% 5,00% 776.104.510,09 € 10,66% 2,00%
Ongoing audit contradictory procedure. Financial corrections will be applied to bring RTERs 2016-2017 and 2017-2018 down to 2%, if necessary.
LU 2014LU16RFOP001 Operational Programme ERDF
Luxembourg 2014-2020 Y 0,00% 0,00% 0,00% 0,00% 0,00% 0,00% 4.759.063,38 € 0,00% 0,00%
LV 2014LV16MAOP001 Growth and Employment Y 0,02% 0,04% 0,01% 0,03% 1,64% 1,41% 299.195.271,40 € 1,41% 1,41%
MT 2014MT16M1OP001 Fostering a competitive and
sustainable economy to meet our challenges
Y - - - - 0,02% 0,01% 50.583.974,14 € 2,00% 2,00%
MT 2014MT16RFSM001 Stimulate private sector investment for economic
growth Y - - - - - - - € 2,00% 2,00%
NL 2014NL16RFOP001 OP North Netherlands ERDF
2014-2020 Y - - - - 0,54% 0,39% 10.663.395,84 € 2,00% 2,00%
NL 2014NL16RFOP002 OP West Netherlands ERDF
2014-2020 Y - - - - 0,06% 0,05% 17.692.517,56 € 2,00% 2,00%
NL 2014NL16RFOP003 OP South Netherlands ERDF
2014-2020 Y - - - - 0,33% 0,07% 17.423.265,55 € 2,00% 2,00%
NL 2014NL16RFOP004 OP East Netherlands ERDF
2014-2020 Y - - - - 0,44% 0,35% 11.750.096,78 € 2,00% 2,00%
PL 2014PL16CFTA001 OP Technical Assistance Y 0,05% 0,05% 0,02% 0,02% 0,02% 0,01% 98.833.437,19 € 0,02% 0,02%
PL 2014PL16M1OP001 OP Infrastructure and
Environment Y 0,20% 0,20% 0,18% 0,18% 0,00% 0,00% 4.097.539.868,19 € 0,18% 0,18%
Ongoing audit contradictory procedure

regio_aar_2018_annexes
83
MS CCI Ref Title
(1)
MC
S fu
nct
ion
ing
eff
ecti
vely
(Y
/N/N
A*)
:
Y=C
at.
1-2
; N
=Ca
t. 3
-4
Accounting year 2016-2017 Accounting year 2017-2018
Reporting year 2018
Confirmed error rates after EC's assessment (desk review of all OPs and risk-based compliance audits)
Reportable rates (reported by audit authorities and,
where necessary, adjusted by EC following preliminary
consistency checks)
(2)
Tota
l Err
or
Rat
e
(3)
Tota
l Err
or
Rat
e
rem
ovi
ng
imp
act
of
adva
nce
s to
fin
anci
al
inst
rum
ents
(4)
Re
sid
ual
To
tal E
rro
r
Rat
e
(5)
Re
sid
ual
To
tal E
rro
r
Rat
e re
mo
vin
g im
pac
t o
f
adva
nce
s to
fin
anci
al
inst
rum
ents
(6)
To
tal E
rro
r R
ate
rep
ort
able
by
EC
(7)
Re
sid
ual
To
tal E
rro
r
Rat
e re
po
rtab
le b
y EC
Relevant expenditure
(interims+retentions-deductions)
Risk at Payment Risk reported in
column (5), or (7) if higher (or flat rate of 2% when (5) and (7) are empty, or (5) is empty and (7) is
below 2%)
Risk at Closure (taking into
account additional estimated financial
corrections)
Comments
PL 2014PL16M2OP001 ROP 1 Regional Operational Programme for Dolnośląskie
Voivodeship 2014-2020 Y 0,50% 2,00% 0,08% 2,00% 0,50% 0,26% 253.710.180,76 € 2,00% 2,00%
PL 2014PL16M2OP002
ROP 2 Regional Operational Programme for Kujawsko-
Pomorskie Voivodeship 2014-2020
Y 1,33% 0,42% 0,02% 0,03% 0,59% 0,00% 140.681.786,91 € 0,03% 0,03%
PL 2014PL16M2OP003 ROP 3 Regional Operational
Programme for Lubelskie Voivodeship 2014-2020
Y 1,07% 2,00% 0,16% 2,24% 1,40% 0,76% 165.900.854,17 € 2,24% 2,00% Ongoing audit contradictory procedure
PL 2014PL16M2OP004 ROP 4 Regional Operational
Programme for Lubuskie Voivodeship 2014-2020
Y 1,12% 1,63% 1,10% 1,62% 1,84% 1,13% 75.103.129,39 € 1,62% 1,62%
PL 2014PL16M2OP005 ROP 5 Regional Operational
Programme for Łódzkie Voivodeship 2014-2020
Y 0,65% 0,42% 0,07% 0,06% 1,74% 1,05% 165.873.152,93 € 1,05% 1,05%
PL 2014PL16M2OP006 ROP 6 Regional Operational Programme for Małopolskie
Voivodeship 2014-2020 Y 1,58% 1,67% 1,11% 1,67% 1,66% 1,11% 229.054.253,62 € 1,67% 1,67%
PL 2014PL16M2OP007 ROP 7 Regional Operational
Programme for Mazowieckie Voivodeship 2014-2020
Y 0,57% 0,68% 0,00% 0,00% 2,39% 1,71% 249.425.752,02 € 1,71% 1,71%
PL 2014PL16M2OP008 ROP 8 Regional Operational
Programme for Opolskie Voivodeship
Y 0,51% 0,32% 0,25% 0,31% 2,03% 1,49% 134.720.304,37 € 1,49% 1,49%
PL 2014PL16M2OP009 ROP 9 Regional Operational
Programme for Podkarpackie Voivodeship
Y 1,50% 0,49% 0,25% 0,48% 1,12% 0,49% 281.791.645,13 € 0,49% 0,49%

regio_aar_2018_annexes
84
MS CCI Ref Title
(1)
MC
S fu
nct
ion
ing
eff
ecti
vely
(Y
/N/N
A*)
:
Y=C
at.
1-2
; N
=Ca
t. 3
-4
Accounting year 2016-2017 Accounting year 2017-2018
Reporting year 2018
Confirmed error rates after EC's assessment (desk review of all OPs and risk-based compliance audits)
Reportable rates (reported by audit authorities and,
where necessary, adjusted by EC following preliminary
consistency checks)
(2)
Tota
l Err
or
Rat
e
(3)
Tota
l Err
or
Rat
e
rem
ovi
ng
imp
act
of
adva
nce
s to
fin
anci
al
inst
rum
ents
(4)
Re
sid
ual
To
tal E
rro
r
Rat
e
(5)
Re
sid
ual
To
tal E
rro
r
Rat
e re
mo
vin
g im
pac
t o
f
adva
nce
s to
fin
anci
al
inst
rum
ents
(6)
To
tal E
rro
r R
ate
rep
ort
able
by
EC
(7)
Re
sid
ual
To
tal E
rro
r
Rat
e re
po
rtab
le b
y EC
Relevant expenditure
(interims+retentions-deductions)
Risk at Payment Risk reported in
column (5), or (7) if higher (or flat rate of 2% when (5) and (7) are empty, or (5) is empty and (7) is
below 2%)
Risk at Closure (taking into
account additional estimated financial
corrections)
Comments
PL 2014PL16M2OP010 ROP 10 Regional Operational
Programme for Podlaskie Voivodeship
Y 1,15% 2,02% 0,43% 0,74% 0,75% 0,27% 97.873.159,88 € 0,74% 0,74%
PL 2014PL16M2OP011 ROP 11 Regional Operational
Programme for Pomorskie Voivodeship
Y 0,83% 1,49% 0,83% 1,48% 2,80% 2,00% 173.514.272,43 € 2,00% 2,00%
PL 2014PL16M2OP012 ROP 12 Regional Operational
Programme for Śląskie Voivodeship
Y 1,05% 0,66% 0,47% 0,66% 4,01% 2,00% 248.475.951,25 € 2,00% 2,00%
PL 2014PL16M2OP013 ROP 13 Regional Operational
Programme for Świętokrzyskie Voivodeship
Y 2,35% 1,03% 0,73% 1,02% 0,88% 0,19% 100.581.537,37 € 1,02% 1,02%
PL 2014PL16M2OP014 ROP 14 Regional Operational Programme for Warmińsko-
Mazurskie Voivodeship Y 0,41% 0,61% 0,35% 0,52% 2,15% 1,27% 116.966.673,87 € 1,27% 1,27%
PL 2014PL16M2OP015 ROP 15 Regional Operational Programme for Wielkopolskie
Voivodeship Y 0,08% 0,12% 0,07% 0,11% 1,86% 1,47% 315.462.609,45 € 1,47% 1,47%
PL 2014PL16M2OP016
ROP 16 Regional Operational Programme for
Zachodniopomorskie Voivodeship
Y 0,79% 0,48% 0,24% 0,39% 0,52% 0,10% 204.105.103,65 € 0,39% 0,39%
PL 2014PL16RFOP001 OP Smart growth N 3,59% 8,61% 1,52% 3,51% 3,42% 1,42% 1.113.065.837,71 € 3,51% 2,00%
PL 2014PL16RFOP002 OP Digital Poland Y 0,61% 2,17% 0,60% 2,15% 0,18% 0,12% 271.289.672,66 € 2,15% 2,00%
PL 2014PL16RFOP003 OP Development of Eastern
Poland Y 0,68% 0,68% 0,67% 0,67% 1,70% 1,53% 323.395.068,24 € 1,53% 1,53%
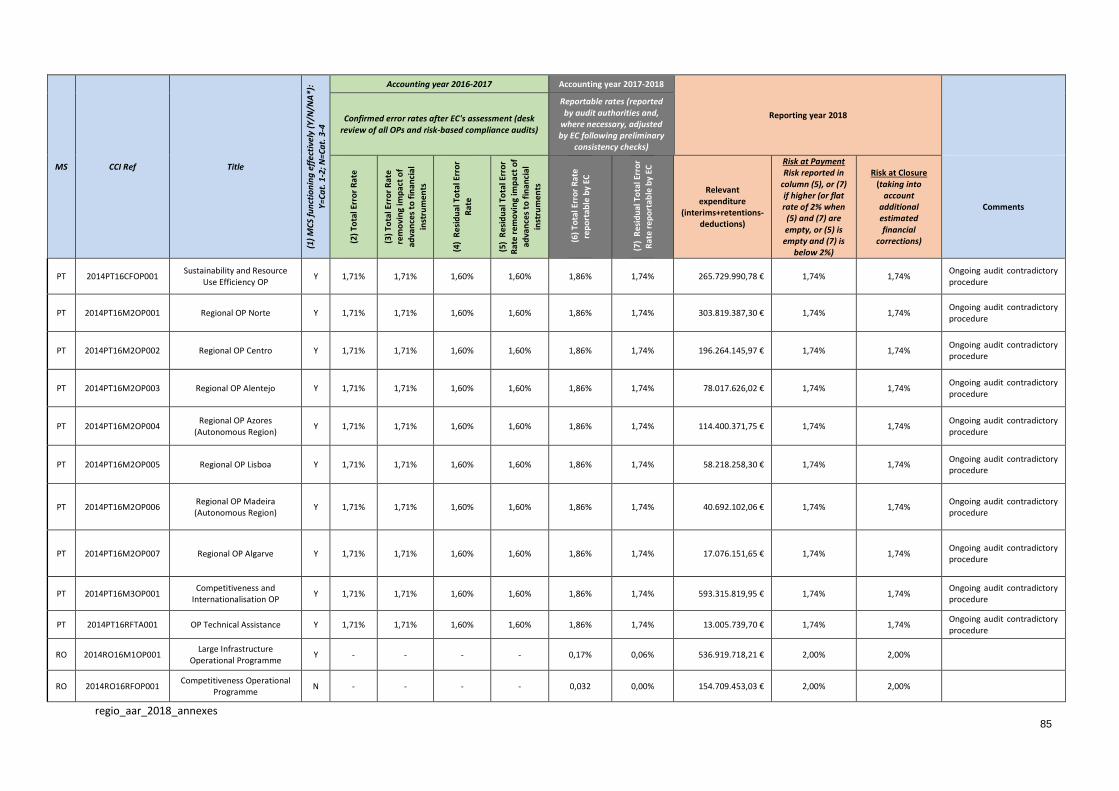
regio_aar_2018_annexes
85
MS CCI Ref Title
(1)
MC
S fu
nct
ion
ing
eff
ecti
vely
(Y
/N/N
A*)
:
Y=C
at.
1-2
; N
=Ca
t. 3
-4
Accounting year 2016-2017 Accounting year 2017-2018
Reporting year 2018
Confirmed error rates after EC's assessment (desk review of all OPs and risk-based compliance audits)
Reportable rates (reported by audit authorities and,
where necessary, adjusted by EC following preliminary
consistency checks)
(2)
Tota
l Err
or
Rat
e
(3)
Tota
l Err
or
Rat
e
rem
ovi
ng
imp
act
of
adva
nce
s to
fin
anci
al
inst
rum
ents
(4)
Re
sid
ual
To
tal E
rro
r
Rat
e
(5)
Re
sid
ual
To
tal E
rro
r
Rat
e re
mo
vin
g im
pac
t o
f
adva
nce
s to
fin
anci
al
inst
rum
ents
(6)
To
tal E
rro
r R
ate
rep
ort
able
by
EC
(7)
Re
sid
ual
To
tal E
rro
r
Rat
e re
po
rtab
le b
y EC
Relevant expenditure
(interims+retentions-deductions)
Risk at Payment Risk reported in
column (5), or (7) if higher (or flat rate of 2% when (5) and (7) are empty, or (5) is empty and (7) is
below 2%)
Risk at Closure (taking into
account additional estimated financial
corrections)
Comments
PT 2014PT16CFOP001 Sustainability and Resource
Use Efficiency OP Y 1,71% 1,71% 1,60% 1,60% 1,86% 1,74% 265.729.990,78 € 1,74% 1,74%
Ongoing audit contradictory procedure
PT 2014PT16M2OP001 Regional OP Norte Y 1,71% 1,71% 1,60% 1,60% 1,86% 1,74% 303.819.387,30 € 1,74% 1,74% Ongoing audit contradictory procedure
PT 2014PT16M2OP002 Regional OP Centro Y 1,71% 1,71% 1,60% 1,60% 1,86% 1,74% 196.264.145,97 € 1,74% 1,74% Ongoing audit contradictory procedure
PT 2014PT16M2OP003 Regional OP Alentejo Y 1,71% 1,71% 1,60% 1,60% 1,86% 1,74% 78.017.626,02 € 1,74% 1,74% Ongoing audit contradictory procedure
PT 2014PT16M2OP004 Regional OP Azores
(Autonomous Region) Y 1,71% 1,71% 1,60% 1,60% 1,86% 1,74% 114.400.371,75 € 1,74% 1,74%
Ongoing audit contradictory procedure
PT 2014PT16M2OP005 Regional OP Lisboa Y 1,71% 1,71% 1,60% 1,60% 1,86% 1,74% 58.218.258,30 € 1,74% 1,74% Ongoing audit contradictory procedure
PT 2014PT16M2OP006 Regional OP Madeira (Autonomous Region)
Y 1,71% 1,71% 1,60% 1,60% 1,86% 1,74% 40.692.102,06 € 1,74% 1,74% Ongoing audit contradictory procedure
PT 2014PT16M2OP007 Regional OP Algarve Y 1,71% 1,71% 1,60% 1,60% 1,86% 1,74% 17.076.151,65 € 1,74% 1,74% Ongoing audit contradictory procedure
PT 2014PT16M3OP001 Competitiveness and
Internationalisation OP Y 1,71% 1,71% 1,60% 1,60% 1,86% 1,74% 593.315.819,95 € 1,74% 1,74%
Ongoing audit contradictory procedure
PT 2014PT16RFTA001 OP Technical Assistance Y 1,71% 1,71% 1,60% 1,60% 1,86% 1,74% 13.005.739,70 € 1,74% 1,74% Ongoing audit contradictory procedure
RO 2014RO16M1OP001 Large Infrastructure
Operational Programme Y - - - - 0,17% 0,06% 536.919.718,21 € 2,00% 2,00%
RO 2014RO16RFOP001 Competitiveness Operational
Programme N - - - - 0,032 0,00% 154.709.453,03 € 2,00% 2,00%
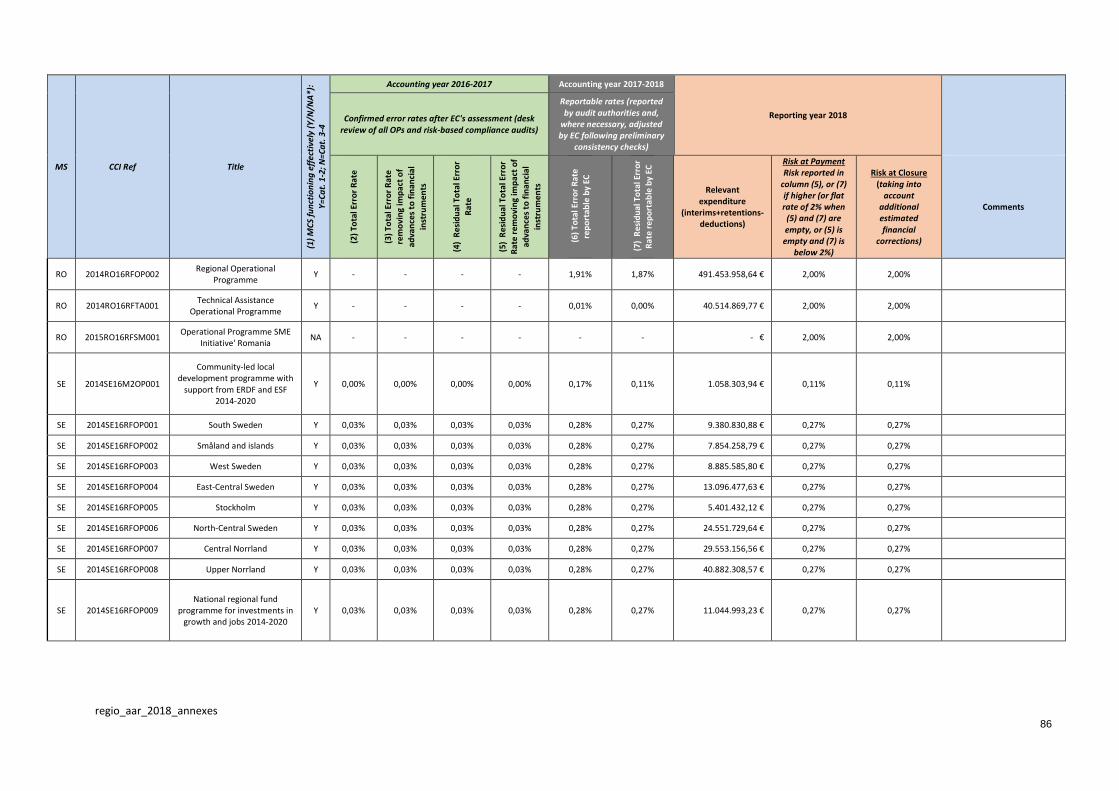
regio_aar_2018_annexes
86
MS CCI Ref Title
(1)
MC
S fu
nct
ion
ing
eff
ecti
vely
(Y
/N/N
A*)
:
Y=C
at.
1-2
; N
=Ca
t. 3
-4
Accounting year 2016-2017 Accounting year 2017-2018
Reporting year 2018
Confirmed error rates after EC's assessment (desk review of all OPs and risk-based compliance audits)
Reportable rates (reported by audit authorities and,
where necessary, adjusted by EC following preliminary
consistency checks)
(2)
Tota
l Err
or
Rat
e
(3)
Tota
l Err
or
Rat
e
rem
ovi
ng
imp
act
of
adva
nce
s to
fin
anci
al
inst
rum
ents
(4)
Re
sid
ual
To
tal E
rro
r
Rat
e
(5)
Re
sid
ual
To
tal E
rro
r
Rat
e re
mo
vin
g im
pac
t o
f
adva
nce
s to
fin
anci
al
inst
rum
ents
(6)
To
tal E
rro
r R
ate
rep
ort
able
by
EC
(7)
Re
sid
ual
To
tal E
rro
r
Rat
e re
po
rtab
le b
y EC
Relevant expenditure
(interims+retentions-deductions)
Risk at Payment Risk reported in
column (5), or (7) if higher (or flat rate of 2% when (5) and (7) are empty, or (5) is empty and (7) is
below 2%)
Risk at Closure (taking into
account additional estimated financial
corrections)
Comments
RO 2014RO16RFOP002 Regional Operational
Programme Y - - - - 1,91% 1,87% 491.453.958,64 € 2,00% 2,00%
RO 2014RO16RFTA001 Technical Assistance
Operational Programme Y - - - - 0,01% 0,00% 40.514.869,77 € 2,00% 2,00%
RO 2015RO16RFSM001 Operational Programme SME
Initiative' Romania NA - - - - - - - € 2,00% 2,00%
SE 2014SE16M2OP001
Community-led local development programme with
support from ERDF and ESF 2014-2020
Y 0,00% 0,00% 0,00% 0,00% 0,17% 0,11% 1.058.303,94 € 0,11% 0,11%
SE 2014SE16RFOP001 South Sweden Y 0,03% 0,03% 0,03% 0,03% 0,28% 0,27% 9.380.830,88 € 0,27% 0,27%
SE 2014SE16RFOP002 Småland and islands Y 0,03% 0,03% 0,03% 0,03% 0,28% 0,27% 7.854.258,79 € 0,27% 0,27%
SE 2014SE16RFOP003 West Sweden Y 0,03% 0,03% 0,03% 0,03% 0,28% 0,27% 8.885.585,80 € 0,27% 0,27%
SE 2014SE16RFOP004 East-Central Sweden Y 0,03% 0,03% 0,03% 0,03% 0,28% 0,27% 13.096.477,63 € 0,27% 0,27%
SE 2014SE16RFOP005 Stockholm Y 0,03% 0,03% 0,03% 0,03% 0,28% 0,27% 5.401.432,12 € 0,27% 0,27%
SE 2014SE16RFOP006 North-Central Sweden Y 0,03% 0,03% 0,03% 0,03% 0,28% 0,27% 24.551.729,64 € 0,27% 0,27%
SE 2014SE16RFOP007 Central Norrland Y 0,03% 0,03% 0,03% 0,03% 0,28% 0,27% 29.553.156,56 € 0,27% 0,27%
SE 2014SE16RFOP008 Upper Norrland Y 0,03% 0,03% 0,03% 0,03% 0,28% 0,27% 40.882.308,57 € 0,27% 0,27%
SE 2014SE16RFOP009 National regional fund
programme for investments in growth and jobs 2014-2020
Y 0,03% 0,03% 0,03% 0,03% 0,28% 0,27% 11.044.993,23 € 0,27% 0,27%
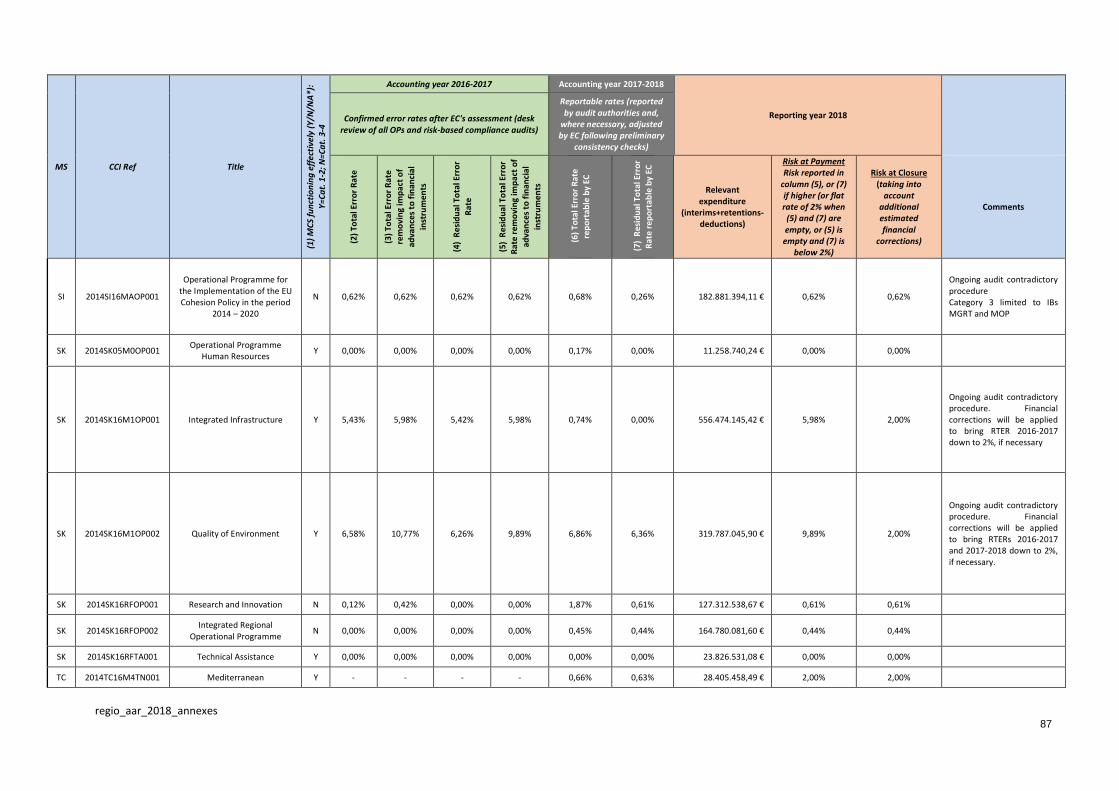
regio_aar_2018_annexes
87
MS CCI Ref Title
(1)
MC
S fu
nct
ion
ing
eff
ecti
vely
(Y
/N/N
A*)
:
Y=C
at.
1-2
; N
=Ca
t. 3
-4
Accounting year 2016-2017 Accounting year 2017-2018
Reporting year 2018
Confirmed error rates after EC's assessment (desk review of all OPs and risk-based compliance audits)
Reportable rates (reported by audit authorities and,
where necessary, adjusted by EC following preliminary
consistency checks)
(2)
Tota
l Err
or
Rat
e
(3)
Tota
l Err
or
Rat
e
rem
ovi
ng
imp
act
of
adva
nce
s to
fin
anci
al
inst
rum
ents
(4)
Re
sid
ual
To
tal E
rro
r
Rat
e
(5)
Re
sid
ual
To
tal E
rro
r
Rat
e re
mo
vin
g im
pac
t o
f
adva
nce
s to
fin
anci
al
inst
rum
ents
(6)
To
tal E
rro
r R
ate
rep
ort
able
by
EC
(7)
Re
sid
ual
To
tal E
rro
r
Rat
e re
po
rtab
le b
y EC
Relevant expenditure
(interims+retentions-deductions)
Risk at Payment Risk reported in
column (5), or (7) if higher (or flat rate of 2% when (5) and (7) are empty, or (5) is empty and (7) is
below 2%)
Risk at Closure (taking into
account additional estimated financial
corrections)
Comments
SI 2014SI16MAOP001
Operational Programme for the Implementation of the EU Cohesion Policy in the period
2014 – 2020
N 0,62% 0,62% 0,62% 0,62% 0,68% 0,26% 182.881.394,11 € 0,62% 0,62%
Ongoing audit contradictory procedure Category 3 limited to IBs MGRT and MOP
SK 2014SK05M0OP001 Operational Programme
Human Resources Y 0,00% 0,00% 0,00% 0,00% 0,17% 0,00% 11.258.740,24 € 0,00% 0,00%
SK 2014SK16M1OP001 Integrated Infrastructure Y 5,43% 5,98% 5,42% 5,98% 0,74% 0,00% 556.474.145,42 € 5,98% 2,00%
Ongoing audit contradictory procedure. Financial corrections will be applied to bring RTER 2016-2017 down to 2%, if necessary
SK 2014SK16M1OP002 Quality of Environment Y 6,58% 10,77% 6,26% 9,89% 6,86% 6,36% 319.787.045,90 € 9,89% 2,00%
Ongoing audit contradictory procedure. Financial corrections will be applied to bring RTERs 2016-2017 and 2017-2018 down to 2%, if necessary.
SK 2014SK16RFOP001 Research and Innovation N 0,12% 0,42% 0,00% 0,00% 1,87% 0,61% 127.312.538,67 € 0,61% 0,61%
SK 2014SK16RFOP002 Integrated Regional
Operational Programme N 0,00% 0,00% 0,00% 0,00% 0,45% 0,44% 164.780.081,60 € 0,44% 0,44%
SK 2014SK16RFTA001 Technical Assistance Y 0,00% 0,00% 0,00% 0,00% 0,00% 0,00% 23.826.531,08 € 0,00% 0,00%
TC 2014TC16M4TN001 Mediterranean Y - - - - 0,66% 0,63% 28.405.458,49 € 2,00% 2,00%
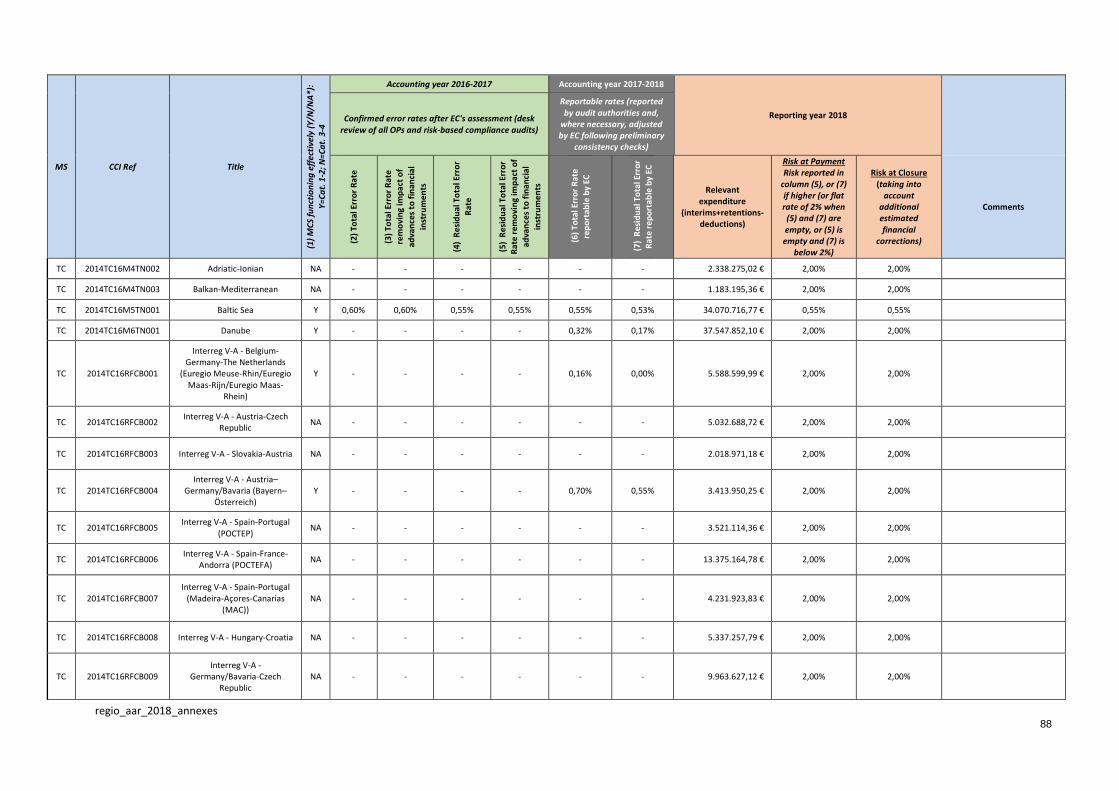
regio_aar_2018_annexes
88
MS CCI Ref Title
(1)
MC
S fu
nct
ion
ing
eff
ecti
vely
(Y
/N/N
A*)
:
Y=C
at.
1-2
; N
=Ca
t. 3
-4
Accounting year 2016-2017 Accounting year 2017-2018
Reporting year 2018
Confirmed error rates after EC's assessment (desk review of all OPs and risk-based compliance audits)
Reportable rates (reported by audit authorities and,
where necessary, adjusted by EC following preliminary
consistency checks)
(2)
Tota
l Err
or
Rat
e
(3)
Tota
l Err
or
Rat
e
rem
ovi
ng
imp
act
of
adva
nce
s to
fin
anci
al
inst
rum
ents
(4)
Re
sid
ual
To
tal E
rro
r
Rat
e
(5)
Re
sid
ual
To
tal E
rro
r
Rat
e re
mo
vin
g im
pac
t o
f
adva
nce
s to
fin
anci
al
inst
rum
ents
(6)
To
tal E
rro
r R
ate
rep
ort
able
by
EC
(7)
Re
sid
ual
To
tal E
rro
r
Rat
e re
po
rtab
le b
y EC
Relevant expenditure
(interims+retentions-deductions)
Risk at Payment Risk reported in
column (5), or (7) if higher (or flat rate of 2% when (5) and (7) are empty, or (5) is empty and (7) is
below 2%)
Risk at Closure (taking into
account additional estimated financial
corrections)
Comments
TC 2014TC16M4TN002 Adriatic-Ionian NA - - - - - - 2.338.275,02 € 2,00% 2,00%
TC 2014TC16M4TN003 Balkan-Mediterranean NA - - - - - - 1.183.195,36 € 2,00% 2,00%
TC 2014TC16M5TN001 Baltic Sea Y 0,60% 0,60% 0,55% 0,55% 0,55% 0,53% 34.070.716,77 € 0,55% 0,55%
TC 2014TC16M6TN001 Danube Y - - - - 0,32% 0,17% 37.547.852,10 € 2,00% 2,00%
TC 2014TC16RFCB001
Interreg V-A - Belgium-Germany-The Netherlands
(Euregio Meuse-Rhin/Euregio Maas-Rijn/Euregio Maas-
Rhein)
Y - - - - 0,16% 0,00% 5.588.599,99 € 2,00% 2,00%
TC 2014TC16RFCB002 Interreg V-A - Austria-Czech
Republic NA - - - - - - 5.032.688,72 € 2,00% 2,00%
TC 2014TC16RFCB003 Interreg V-A - Slovakia-Austria NA - - - - - - 2.018.971,18 € 2,00% 2,00%
TC 2014TC16RFCB004 Interreg V-A - Austria–
Germany/Bavaria (Bayern–Österreich)
Y - - - - 0,70% 0,55% 3.413.950,25 € 2,00% 2,00%
TC 2014TC16RFCB005 Interreg V-A - Spain-Portugal
(POCTEP) NA - - - - - - 3.521.114,36 € 2,00% 2,00%
TC 2014TC16RFCB006 Interreg V-A - Spain-France-
Andorra (POCTEFA) NA - - - - - - 13.375.164,78 € 2,00% 2,00%
TC 2014TC16RFCB007 Interreg V-A - Spain-Portugal
(Madeira-Açores-Canarias (MAC))
NA - - - - - - 4.231.923,83 € 2,00% 2,00%
TC 2014TC16RFCB008 Interreg V-A - Hungary-Croatia NA - - - - - - 5.337.257,79 € 2,00% 2,00%
TC 2014TC16RFCB009 Interreg V-A -
Germany/Bavaria-Czech Republic
NA - - - - - - 9.963.627,12 € 2,00% 2,00%
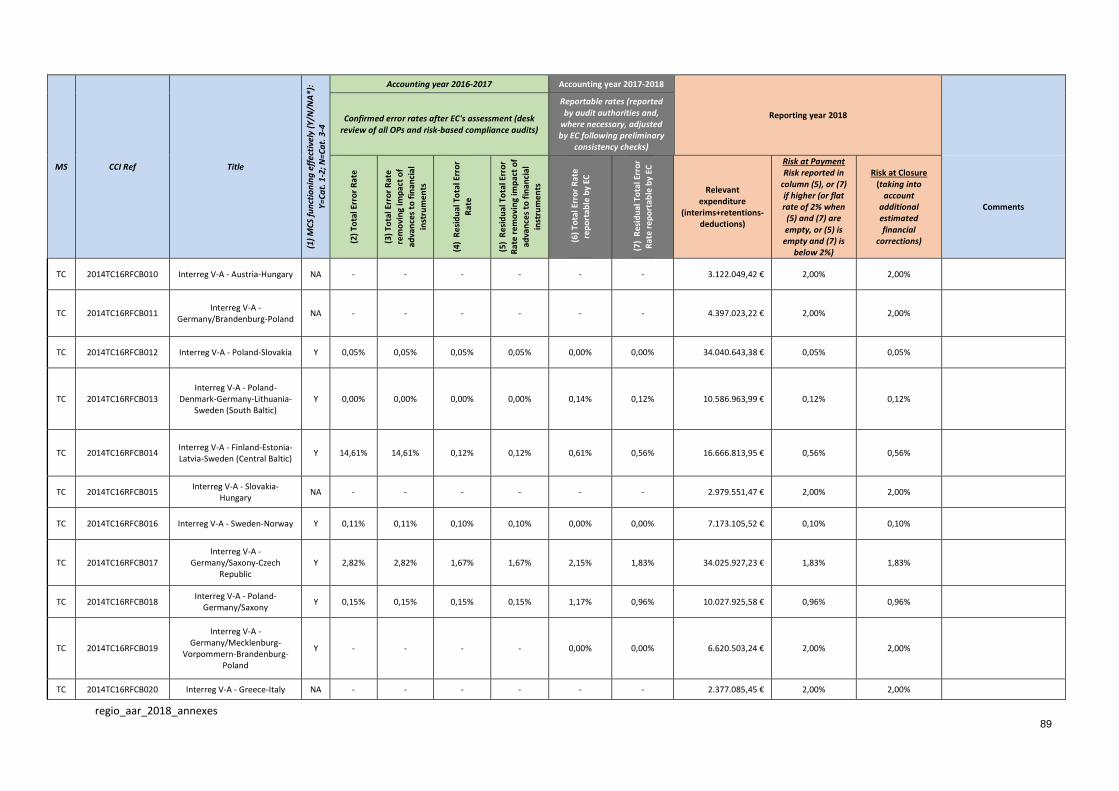
regio_aar_2018_annexes
89
MS CCI Ref Title
(1)
MC
S fu
nct
ion
ing
eff
ecti
vely
(Y
/N/N
A*)
:
Y=C
at.
1-2
; N
=Ca
t. 3
-4
Accounting year 2016-2017 Accounting year 2017-2018
Reporting year 2018
Confirmed error rates after EC's assessment (desk review of all OPs and risk-based compliance audits)
Reportable rates (reported by audit authorities and,
where necessary, adjusted by EC following preliminary
consistency checks)
(2)
Tota
l Err
or
Rat
e
(3)
Tota
l Err
or
Rat
e
rem
ovi
ng
imp
act
of
adva
nce
s to
fin
anci
al
inst
rum
ents
(4)
Re
sid
ual
To
tal E
rro
r
Rat
e
(5)
Re
sid
ual
To
tal E
rro
r
Rat
e re
mo
vin
g im
pac
t o
f
adva
nce
s to
fin
anci
al
inst
rum
ents
(6)
To
tal E
rro
r R
ate
rep
ort
able
by
EC
(7)
Re
sid
ual
To
tal E
rro
r
Rat
e re
po
rtab
le b
y EC
Relevant expenditure
(interims+retentions-deductions)
Risk at Payment Risk reported in
column (5), or (7) if higher (or flat rate of 2% when (5) and (7) are empty, or (5) is empty and (7) is
below 2%)
Risk at Closure (taking into
account additional estimated financial
corrections)
Comments
TC 2014TC16RFCB010 Interreg V-A - Austria-Hungary NA - - - - - - 3.122.049,42 € 2,00% 2,00%
TC 2014TC16RFCB011 Interreg V-A -
Germany/Brandenburg-Poland NA - - - - - - 4.397.023,22 € 2,00% 2,00%
TC 2014TC16RFCB012 Interreg V-A - Poland-Slovakia Y 0,05% 0,05% 0,05% 0,05% 0,00% 0,00% 34.040.643,38 € 0,05% 0,05%
TC 2014TC16RFCB013 Interreg V-A - Poland-
Denmark-Germany-Lithuania-Sweden (South Baltic)
Y 0,00% 0,00% 0,00% 0,00% 0,14% 0,12% 10.586.963,99 € 0,12% 0,12%
TC 2014TC16RFCB014 Interreg V-A - Finland-Estonia-Latvia-Sweden (Central Baltic)
Y 14,61% 14,61% 0,12% 0,12% 0,61% 0,56% 16.666.813,95 € 0,56% 0,56%
TC 2014TC16RFCB015 Interreg V-A - Slovakia-
Hungary NA - - - - - - 2.979.551,47 € 2,00% 2,00%
TC 2014TC16RFCB016 Interreg V-A - Sweden-Norway Y 0,11% 0,11% 0,10% 0,10% 0,00% 0,00% 7.173.105,52 € 0,10% 0,10%
TC 2014TC16RFCB017 Interreg V-A -
Germany/Saxony-Czech Republic
Y 2,82% 2,82% 1,67% 1,67% 2,15% 1,83% 34.025.927,23 € 1,83% 1,83%
TC 2014TC16RFCB018 Interreg V-A - Poland-
Germany/Saxony Y 0,15% 0,15% 0,15% 0,15% 1,17% 0,96% 10.027.925,58 € 0,96% 0,96%
TC 2014TC16RFCB019
Interreg V-A - Germany/Mecklenburg-
Vorpommern-Brandenburg-Poland
Y - - - - 0,00% 0,00% 6.620.503,24 € 2,00% 2,00%
TC 2014TC16RFCB020 Interreg V-A - Greece-Italy NA - - - - - - 2.377.085,45 € 2,00% 2,00%
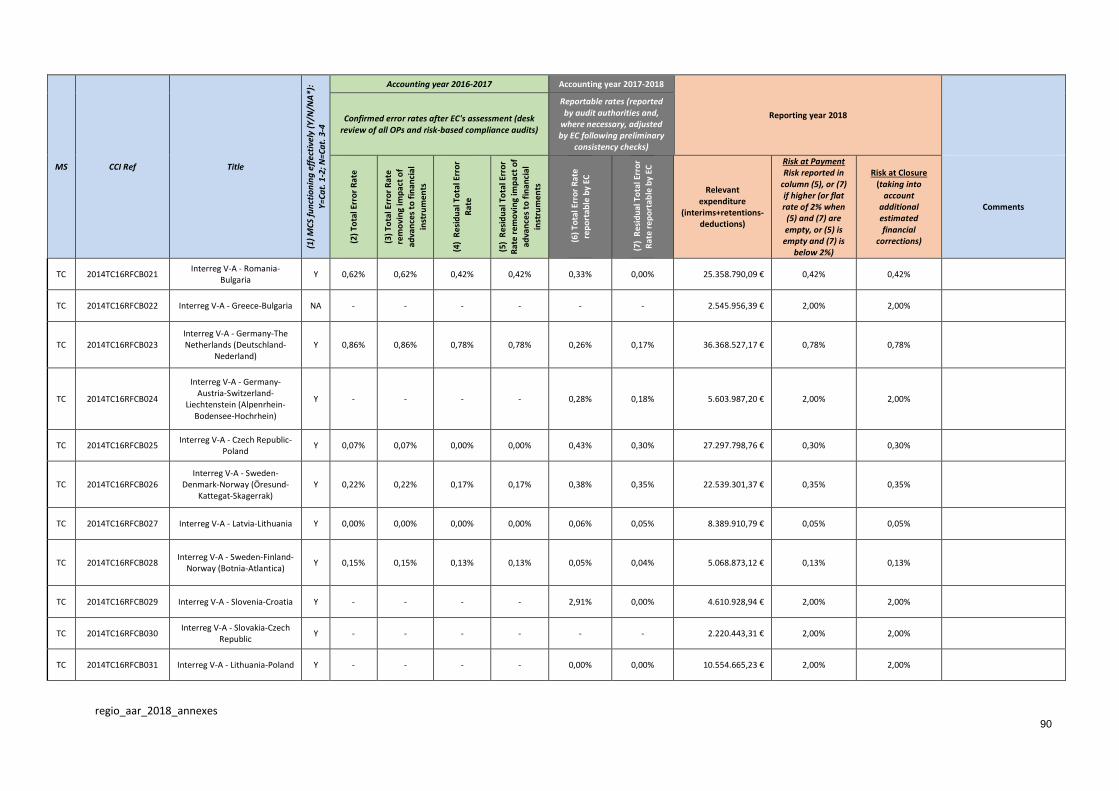
regio_aar_2018_annexes
90
MS CCI Ref Title
(1)
MC
S fu
nct
ion
ing
eff
ecti
vely
(Y
/N/N
A*)
:
Y=C
at.
1-2
; N
=Ca
t. 3
-4
Accounting year 2016-2017 Accounting year 2017-2018
Reporting year 2018
Confirmed error rates after EC's assessment (desk review of all OPs and risk-based compliance audits)
Reportable rates (reported by audit authorities and,
where necessary, adjusted by EC following preliminary
consistency checks)
(2)
Tota
l Err
or
Rat
e
(3)
Tota
l Err
or
Rat
e
rem
ovi
ng
imp
act
of
adva
nce
s to
fin
anci
al
inst
rum
ents
(4)
Re
sid
ual
To
tal E
rro
r
Rat
e
(5)
Re
sid
ual
To
tal E
rro
r
Rat
e re
mo
vin
g im
pac
t o
f
adva
nce
s to
fin
anci
al
inst
rum
ents
(6)
To
tal E
rro
r R
ate
rep
ort
able
by
EC
(7)
Re
sid
ual
To
tal E
rro
r
Rat
e re
po
rtab
le b
y EC
Relevant expenditure
(interims+retentions-deductions)
Risk at Payment Risk reported in
column (5), or (7) if higher (or flat rate of 2% when (5) and (7) are empty, or (5) is empty and (7) is
below 2%)
Risk at Closure (taking into
account additional estimated financial
corrections)
Comments
TC 2014TC16RFCB021 Interreg V-A - Romania-
Bulgaria Y 0,62% 0,62% 0,42% 0,42% 0,33% 0,00% 25.358.790,09 € 0,42% 0,42%
TC 2014TC16RFCB022 Interreg V-A - Greece-Bulgaria NA - - - - - - 2.545.956,39 € 2,00% 2,00%
TC 2014TC16RFCB023 Interreg V-A - Germany-The Netherlands (Deutschland-
Nederland) Y 0,86% 0,86% 0,78% 0,78% 0,26% 0,17% 36.368.527,17 € 0,78% 0,78%
TC 2014TC16RFCB024
Interreg V-A - Germany-Austria-Switzerland-
Liechtenstein (Alpenrhein-Bodensee-Hochrhein)
Y - - - - 0,28% 0,18% 5.603.987,20 € 2,00% 2,00%
TC 2014TC16RFCB025 Interreg V-A - Czech Republic-
Poland Y 0,07% 0,07% 0,00% 0,00% 0,43% 0,30% 27.297.798,76 € 0,30% 0,30%
TC 2014TC16RFCB026 Interreg V-A - Sweden-
Denmark-Norway (Öresund-Kattegat-Skagerrak)
Y 0,22% 0,22% 0,17% 0,17% 0,38% 0,35% 22.539.301,37 € 0,35% 0,35%
TC 2014TC16RFCB027 Interreg V-A - Latvia-Lithuania Y 0,00% 0,00% 0,00% 0,00% 0,06% 0,05% 8.389.910,79 € 0,05% 0,05%
TC 2014TC16RFCB028 Interreg V-A - Sweden-Finland-
Norway (Botnia-Atlantica) Y 0,15% 0,15% 0,13% 0,13% 0,05% 0,04% 5.068.873,12 € 0,13% 0,13%
TC 2014TC16RFCB029 Interreg V-A - Slovenia-Croatia Y - - - - 2,91% 0,00% 4.610.928,94 € 2,00% 2,00%
TC 2014TC16RFCB030 Interreg V-A - Slovakia-Czech
Republic Y - - - - - - 2.220.443,31 € 2,00% 2,00%
TC 2014TC16RFCB031 Interreg V-A - Lithuania-Poland Y - - - - 0,00% 0,00% 10.554.665,23 € 2,00% 2,00%
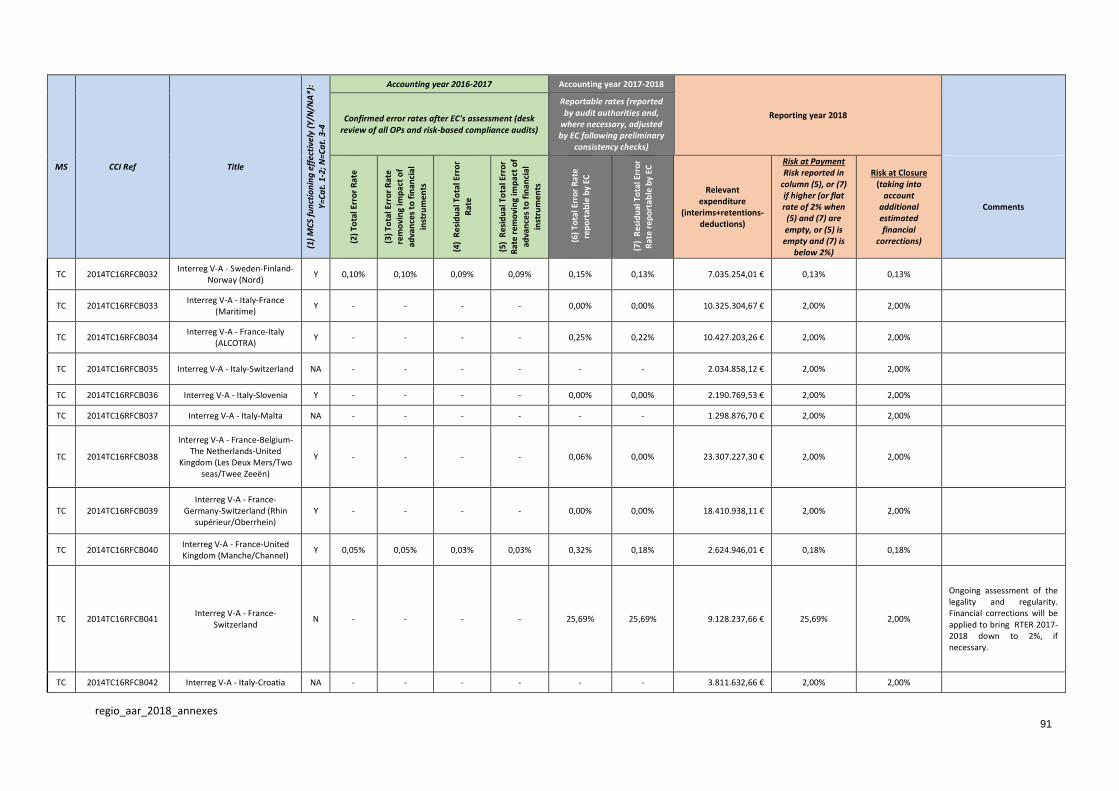
regio_aar_2018_annexes
91
MS CCI Ref Title
(1)
MC
S fu
nct
ion
ing
eff
ecti
vely
(Y
/N/N
A*)
:
Y=C
at.
1-2
; N
=Ca
t. 3
-4
Accounting year 2016-2017 Accounting year 2017-2018
Reporting year 2018
Confirmed error rates after EC's assessment (desk review of all OPs and risk-based compliance audits)
Reportable rates (reported by audit authorities and,
where necessary, adjusted by EC following preliminary
consistency checks)
(2)
Tota
l Err
or
Rat
e
(3)
Tota
l Err
or
Rat
e
rem
ovi
ng
imp
act
of
adva
nce
s to
fin
anci
al
inst
rum
ents
(4)
Re
sid
ual
To
tal E
rro
r
Rat
e
(5)
Re
sid
ual
To
tal E
rro
r
Rat
e re
mo
vin
g im
pac
t o
f
adva
nce
s to
fin
anci
al
inst
rum
ents
(6)
To
tal E
rro
r R
ate
rep
ort
able
by
EC
(7)
Re
sid
ual
To
tal E
rro
r
Rat
e re
po
rtab
le b
y EC
Relevant expenditure
(interims+retentions-deductions)
Risk at Payment Risk reported in
column (5), or (7) if higher (or flat rate of 2% when (5) and (7) are empty, or (5) is empty and (7) is
below 2%)
Risk at Closure (taking into
account additional estimated financial
corrections)
Comments
TC 2014TC16RFCB032 Interreg V-A - Sweden-Finland-
Norway (Nord) Y 0,10% 0,10% 0,09% 0,09% 0,15% 0,13% 7.035.254,01 € 0,13% 0,13%
TC 2014TC16RFCB033 Interreg V-A - Italy-France
(Maritime) Y - - - - 0,00% 0,00% 10.325.304,67 € 2,00% 2,00%
TC 2014TC16RFCB034 Interreg V-A - France-Italy
(ALCOTRA) Y - - - - 0,25% 0,22% 10.427.203,26 € 2,00% 2,00%
TC 2014TC16RFCB035 Interreg V-A - Italy-Switzerland NA - - - - - - 2.034.858,12 € 2,00% 2,00%
TC 2014TC16RFCB036 Interreg V-A - Italy-Slovenia Y - - - - 0,00% 0,00% 2.190.769,53 € 2,00% 2,00%
TC 2014TC16RFCB037 Interreg V-A - Italy-Malta NA - - - - - - 1.298.876,70 € 2,00% 2,00%
TC 2014TC16RFCB038
Interreg V-A - France-Belgium-The Netherlands-United
Kingdom (Les Deux Mers/Two seas/Twee Zeeën)
Y - - - - 0,06% 0,00% 23.307.227,30 € 2,00% 2,00%
TC 2014TC16RFCB039 Interreg V-A - France-
Germany-Switzerland (Rhin supérieur/Oberrhein)
Y - - - - 0,00% 0,00% 18.410.938,11 € 2,00% 2,00%
TC 2014TC16RFCB040 Interreg V-A - France-United Kingdom (Manche/Channel)
Y 0,05% 0,05% 0,03% 0,03% 0,32% 0,18% 2.624.946,01 € 0,18% 0,18%
TC 2014TC16RFCB041 Interreg V-A - France-
Switzerland N - - - - 25,69% 25,69% 9.128.237,66 € 25,69% 2,00%
Ongoing assessment of the legality and regularity. Financial corrections will be applied to bring RTER 2017-2018 down to 2%, if necessary.
TC 2014TC16RFCB042 Interreg V-A - Italy-Croatia NA - - - - - - 3.811.632,66 € 2,00% 2,00%
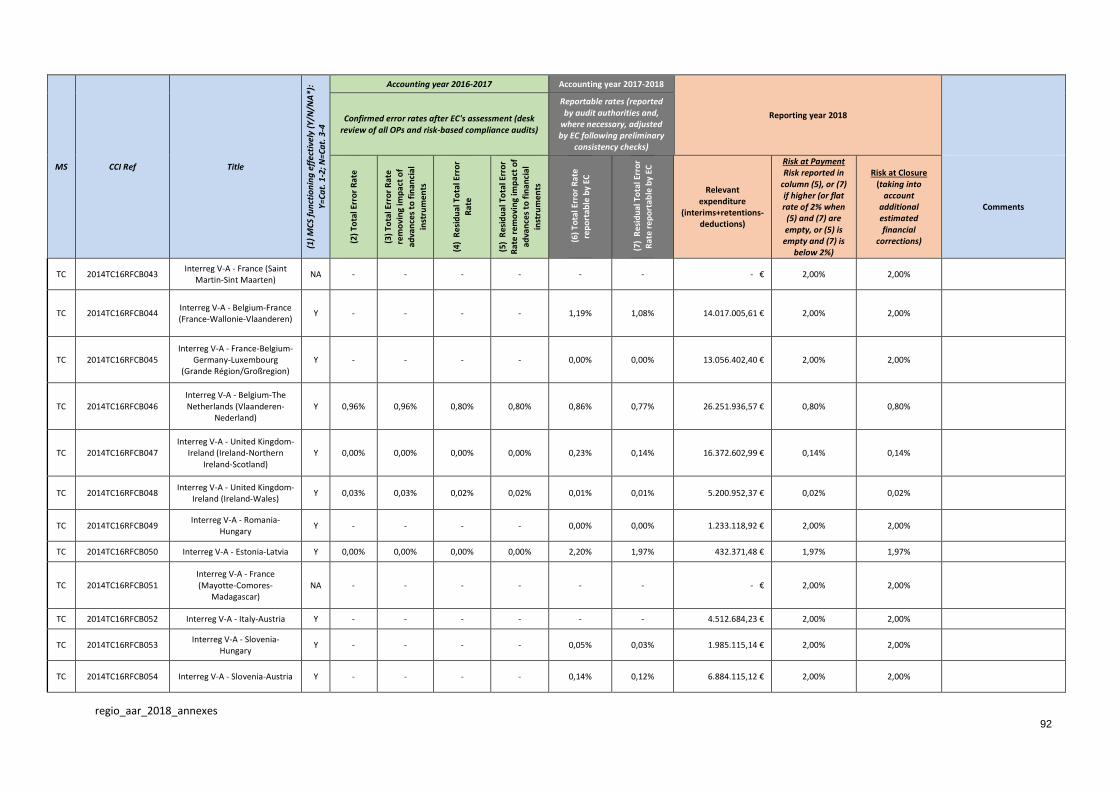
regio_aar_2018_annexes
92
MS CCI Ref Title
(1)
MC
S fu
nct
ion
ing
eff
ecti
vely
(Y
/N/N
A*)
:
Y=C
at.
1-2
; N
=Ca
t. 3
-4
Accounting year 2016-2017 Accounting year 2017-2018
Reporting year 2018
Confirmed error rates after EC's assessment (desk review of all OPs and risk-based compliance audits)
Reportable rates (reported by audit authorities and,
where necessary, adjusted by EC following preliminary
consistency checks)
(2)
Tota
l Err
or
Rat
e
(3)
Tota
l Err
or
Rat
e
rem
ovi
ng
imp
act
of
adva
nce
s to
fin
anci
al
inst
rum
ents
(4)
Re
sid
ual
To
tal E
rro
r
Rat
e
(5)
Re
sid
ual
To
tal E
rro
r
Rat
e re
mo
vin
g im
pac
t o
f
adva
nce
s to
fin
anci
al
inst
rum
ents
(6)
To
tal E
rro
r R
ate
rep
ort
able
by
EC
(7)
Re
sid
ual
To
tal E
rro
r
Rat
e re
po
rtab
le b
y EC
Relevant expenditure
(interims+retentions-deductions)
Risk at Payment Risk reported in
column (5), or (7) if higher (or flat rate of 2% when (5) and (7) are empty, or (5) is empty and (7) is
below 2%)
Risk at Closure (taking into
account additional estimated financial
corrections)
Comments
TC 2014TC16RFCB043 Interreg V-A - France (Saint
Martin-Sint Maarten) NA - - - - - - - € 2,00% 2,00%
TC 2014TC16RFCB044 Interreg V-A - Belgium-France (France-Wallonie-Vlaanderen)
Y - - - - 1,19% 1,08% 14.017.005,61 € 2,00% 2,00%
TC 2014TC16RFCB045 Interreg V-A - France-Belgium-
Germany-Luxembourg (Grande Région/Großregion)
Y - - - - 0,00% 0,00% 13.056.402,40 € 2,00% 2,00%
TC 2014TC16RFCB046 Interreg V-A - Belgium-The Netherlands (Vlaanderen-
Nederland) Y 0,96% 0,96% 0,80% 0,80% 0,86% 0,77% 26.251.936,57 € 0,80% 0,80%
TC 2014TC16RFCB047 Interreg V-A - United Kingdom-
Ireland (Ireland-Northern Ireland-Scotland)
Y 0,00% 0,00% 0,00% 0,00% 0,23% 0,14% 16.372.602,99 € 0,14% 0,14%
TC 2014TC16RFCB048 Interreg V-A - United Kingdom-
Ireland (Ireland-Wales) Y 0,03% 0,03% 0,02% 0,02% 0,01% 0,01% 5.200.952,37 € 0,02% 0,02%
TC 2014TC16RFCB049 Interreg V-A - Romania-
Hungary Y - - - - 0,00% 0,00% 1.233.118,92 € 2,00% 2,00%
TC 2014TC16RFCB050 Interreg V-A - Estonia-Latvia Y 0,00% 0,00% 0,00% 0,00% 2,20% 1,97% 432.371,48 € 1,97% 1,97%
TC 2014TC16RFCB051 Interreg V-A - France (Mayotte-Comores-
Madagascar) NA - - - - - - - € 2,00% 2,00%
TC 2014TC16RFCB052 Interreg V-A - Italy-Austria Y - - - - - - 4.512.684,23 € 2,00% 2,00%
TC 2014TC16RFCB053 Interreg V-A - Slovenia-
Hungary Y - - - - 0,05% 0,03% 1.985.115,14 € 2,00% 2,00%
TC 2014TC16RFCB054 Interreg V-A - Slovenia-Austria Y - - - - 0,14% 0,12% 6.884.115,12 € 2,00% 2,00%

regio_aar_2018_annexes
93
MS CCI Ref Title
(1)
MC
S fu
nct
ion
ing
eff
ecti
vely
(Y
/N/N
A*)
:
Y=C
at.
1-2
; N
=Ca
t. 3
-4
Accounting year 2016-2017 Accounting year 2017-2018
Reporting year 2018
Confirmed error rates after EC's assessment (desk review of all OPs and risk-based compliance audits)
Reportable rates (reported by audit authorities and,
where necessary, adjusted by EC following preliminary
consistency checks)
(2)
Tota
l Err
or
Rat
e
(3)
Tota
l Err
or
Rat
e
rem
ovi
ng
imp
act
of
adva
nce
s to
fin
anci
al
inst
rum
ents
(4)
Re
sid
ual
To
tal E
rro
r
Rat
e
(5)
Re
sid
ual
To
tal E
rro
r
Rat
e re
mo
vin
g im
pac
t o
f
adva
nce
s to
fin
anci
al
inst
rum
ents
(6)
To
tal E
rro
r R
ate
rep
ort
able
by
EC
(7)
Re
sid
ual
To
tal E
rro
r
Rat
e re
po
rtab
le b
y EC
Relevant expenditure
(interims+retentions-deductions)
Risk at Payment Risk reported in
column (5), or (7) if higher (or flat rate of 2% when (5) and (7) are empty, or (5) is empty and (7) is
below 2%)
Risk at Closure (taking into
account additional estimated financial
corrections)
Comments
TC 2014TC16RFCB055 Interreg V-A - Greece-Cyprus NA - - - - - - - € 2,00% 2,00%
TC 2014TC16RFCB056 Interreg V-A - Germany-
Denmark Y 0,07% 0,07% 0,06% 0,06% 0,57% 0,49% 15.330.293,77 € 0,49% 0,49%
TC 2014TC16RFIR001 INTERREG EUROPE Y - - - - 0,07% 0,07% 49.372.411,69 € 2,00% 2,00%
TC 2014TC16RFIR002 INTERACT Y 0,00% 0,00% 0,00% 0,00% 0,00% 0,00% 8.412.259,58 € 0,00% 0,00%
TC 2014TC16RFIR003 URBACT Y - - - - 0,33% 0,31% 6.842.832,57 € 2,00% 2,00%
TC 2014TC16RFIR004 ESPON Y - - - - 0,00% 0,00% 6.402.238,93 € 2,00% 2,00%
TC 2014TC16RFPC001 Ireland-United Kingdom
(PEACE) Y 0,00% 0,00% 0,00% 0,00% 0,23% 0,14% 11.110.551,67 € 0,14% 0,14%
TC 2014TC16RFTN001 Alpine Space Y - - - - 0,75% 0,71% 19.797.174,11 € 2,00% 2,00%
TC 2014TC16RFTN002 Atlantic Area Y - - - - 0,00% 0,00% 2.779.234,88 € 2,00% 2,00%
TC 2014TC16RFTN003 Central Europe Y - - - - 0,00% 0,00% 43.268.090,06 € 2,00% 2,00%
TC 2014TC16RFTN004 Northern Periphery and Arctic Y 0,92% 0,92% 0,81% 0,81% 0,00% 0,00% 8.004.784,09 € 0,81% 0,81%
TC 2014TC16RFTN005 North Sea Y 0,46% 0,46% 0,34% 0,34% 1,22% 1,12% 15.131.462,82 € 1,12% 1,12%
TC 2014TC16RFTN006 North West Europe Y - - - - 0,07% 0,04% 21.365.266,70 € 2,00% 2,00%
TC 2014TC16RFTN007 South West Europe Y - - - - 0,45% 0,43% 6.557.502,22 € 2,00% 2,00%
TC 2014TC16RFTN008 Caribbean Area NA - - - - - - 1.515.702,52 € 2,00% 2,00%
TC 2014TC16RFTN009 Indian Ocean Area Y 0,00% 0,00% 0,00% 0,00% 0,00% 0,00% 4.664.445,70 € 0,00% 0,00%
TC 2014TC16RFTN010 Amazonia Y - - - - 0,00% 0,00% 522.195,54 € 2,00% 2,00%
UK 2014UK16RFOP001 United Kingdom - ERDF
England Y 0,07% 0,56% 0,05% 0,39% 0,93% 0,62% 461.019.536,91 € 0,62% 0,62%

regio_aar_2018_annexes
94
MS CCI Ref Title
(1)
MC
S fu
nct
ion
ing
eff
ecti
vely
(Y
/N/N
A*)
:
Y=C
at.
1-2
; N
=Ca
t. 3
-4
Accounting year 2016-2017 Accounting year 2017-2018
Reporting year 2018
Confirmed error rates after EC's assessment (desk review of all OPs and risk-based compliance audits)
Reportable rates (reported by audit authorities and,
where necessary, adjusted by EC following preliminary
consistency checks)
(2)
Tota
l Err
or
Rat
e
(3)
Tota
l Err
or
Rat
e
rem
ovi
ng
imp
act
of
adva
nce
s to
fin
anci
al
inst
rum
ents
(4)
Re
sid
ual
To
tal E
rro
r
Rat
e
(5)
Re
sid
ual
To
tal E
rro
r
Rat
e re
mo
vin
g im
pac
t o
f
adva
nce
s to
fin
anci
al
inst
rum
ents
(6)
To
tal E
rro
r R
ate
rep
ort
able
by
EC
(7)
Re
sid
ual
To
tal E
rro
r
Rat
e re
po
rtab
le b
y EC
Relevant expenditure
(interims+retentions-deductions)
Risk at Payment Risk reported in
column (5), or (7) if higher (or flat rate of 2% when (5) and (7) are empty, or (5) is empty and (7) is
below 2%)
Risk at Closure (taking into
account additional estimated financial
corrections)
Comments
UK 2014UK16RFOP002 United Kingdom - ERDF
Gibraltar Y 0,00% 0,00% 0,00% 0,00% 0,00% 0,00% 128.397,75 € 0,00% 0,00%
UK 2014UK16RFOP003 United Kingdom - ERDF
Northern Ireland Y 0,00% 0,00% 0,00% 0,00% 1,14% 0,22% 79.131.019,08 € 0,22% 0,22%
UK 2014UK16RFOP004 United Kingdom - ERDF
Scotland N - - - - 17,36% 1,99% 31.200.810,53 € 2,00% 2,00%
UK 2014UK16RFOP005 United Kingdom - ERDF West
Wales and The Valleys N 6,94% 8,95% 6,93% 8,94% 0,10% 0,09% 128.232.691,87 € 8,94% 2,00%
Ongoing audit contradictory procedure. Financial corrections will be applied to bring RTER 2016-2017 down to 2%, if necessary
UK 2014UK16RFOP006 United Kingdom - ERDF East
Wales N 6,94% 8,95% 6,93% 8,94% 0,10% 0,09% 15.496.716,74 € 8,94% 2,00%
Ongoing audit contradictory procedure. Financial corrections will be applied to bring RTER 2016-2017 down to 2%, if necessary
TOTAL
1,96%
27.541.035.620,90 € 2,03% 1,46%
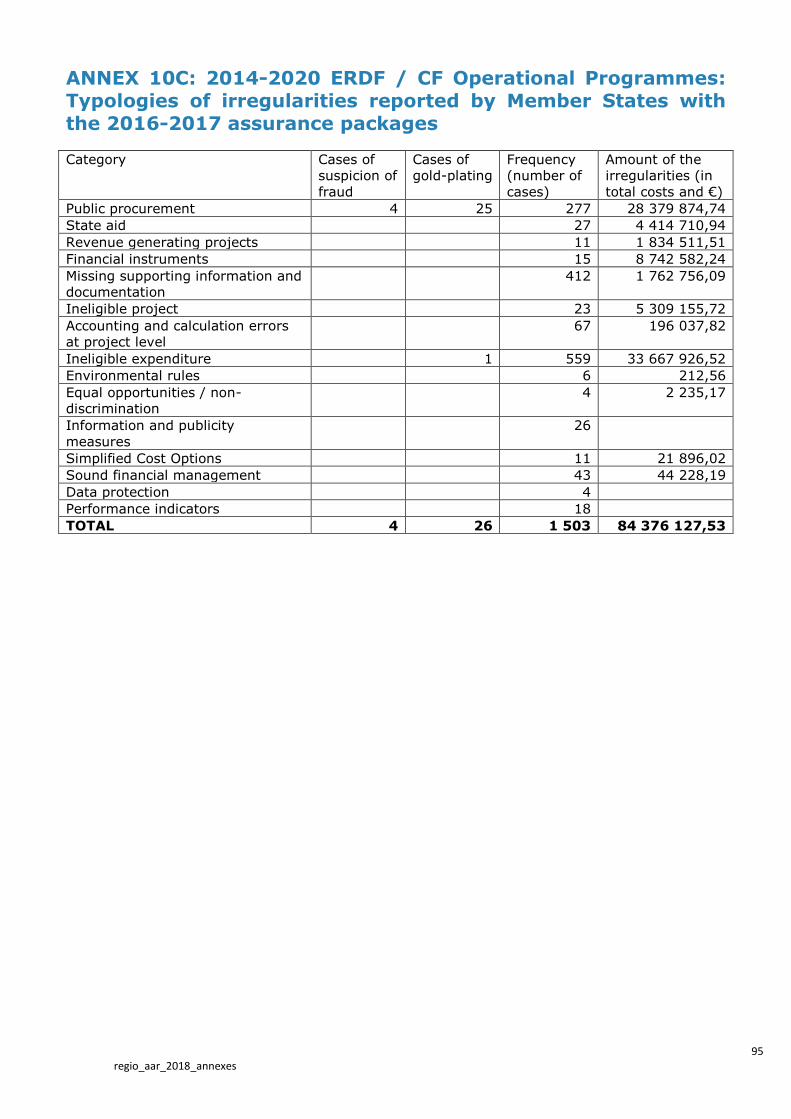
95 regio_aar_2018_annexes
ANNEX 10C: 2014-2020 ERDF / CF Operational Programmes:
Typologies of irregularities reported by Member States with the 2016-2017 assurance packages
Category Cases of
suspicion of
fraud
Cases of
gold-plating
Frequency
(number of
cases)
Amount of the
irregularities (in
total costs and €)
Public procurement 4 25 277 28 379 874,74
State aid 27 4 414 710,94
Revenue generating projects 11 1 834 511,51
Financial instruments 15 8 742 582,24
Missing supporting information and
documentation
412 1 762 756,09
Ineligible project 23 5 309 155,72
Accounting and calculation errors
at project level
67 196 037,82
Ineligible expenditure 1 559 33 667 926,52
Environmental rules 6 212,56
Equal opportunities / non-
discrimination
4 2 235,17
Information and publicity
measures
26
Simplified Cost Options 11 21 896,02
Sound financial management 43 44 228,19
Data protection 4
Performance indicators 18
TOTAL 4 26 1 503 84 376 127,53
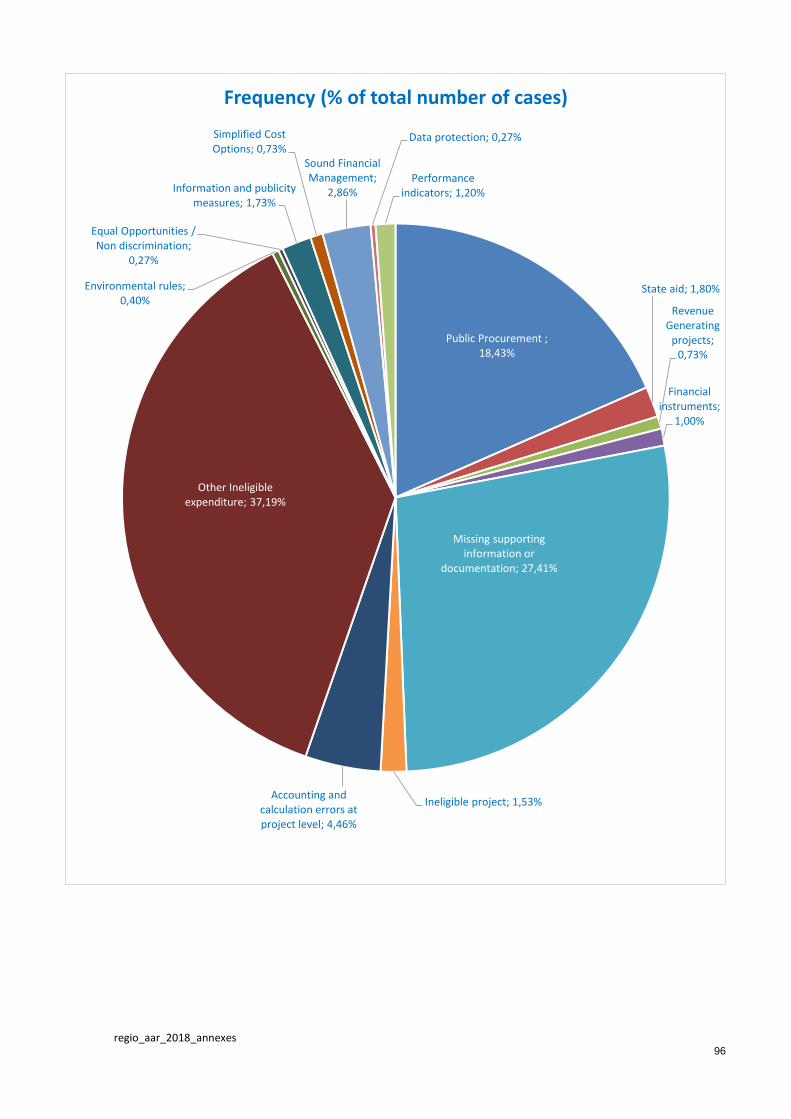
regio_aar_2018_annexes
96
Public Procurement ; 18,43%
State aid; 1,80%
Revenue Generating
projects; 0,73%
Financial instruments;
1,00%
Missing supporting information or
documentation; 27,41%
Ineligible project; 1,53% Accounting and
calculation errors at project level; 4,46%
Other Ineligible expenditure; 37,19%
Environmental rules; 0,40%
Equal Opportunities / Non discrimination;
0,27%
Information and publicity measures; 1,73%
Simplified Cost Options; 0,73%
Sound Financial Management;
2,86%
Data protection; 0,27%
Performance indicators; 1,20%
Frequency (% of total number of cases)

regio_aar_2018_annexes
97
[CATEGORY NAME] [PERCENTAGE]
State aid 5%
Revenue Generating projects
2%
Financial instruments 11%
Missing supporting information or documentation
2%
Ineligible project 6%
Other Ineligible expenditure
40%
Amount (% of total amount)
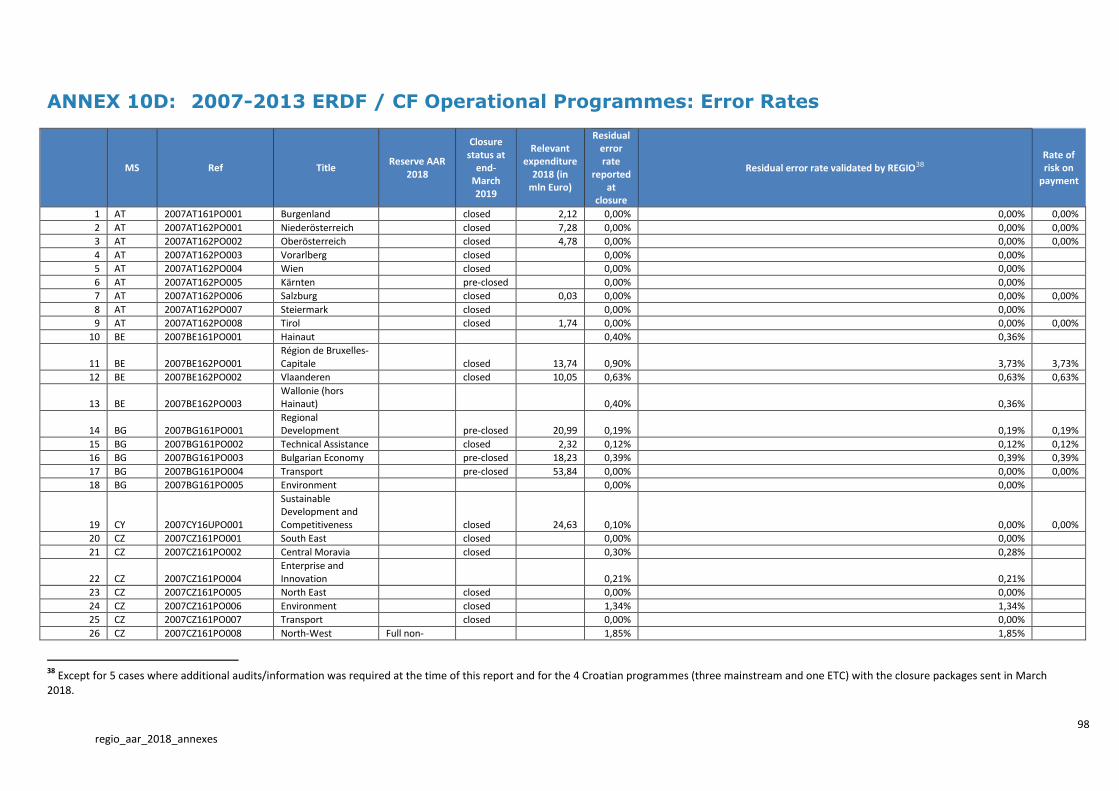
98 regio_aar_2018_annexes
ANNEX 10D: 2007-2013 ERDF / CF Operational Programmes: Error Rates
MS Ref Title
Reserve AAR 2018
Closure status at
end-March 2019
Relevant expenditure
2018 (in mln Euro)
Residual error rate
reported at
closure
Residual error rate validated by REGIO38 Rate of risk on
payment
1 AT 2007AT161PO001 Burgenland closed 2,12 0,00% 0,00% 0,00%
2 AT 2007AT162PO001 Niederösterreich closed 7,28 0,00% 0,00% 0,00%
3 AT 2007AT162PO002 Oberösterreich closed 4,78 0,00% 0,00% 0,00%
4 AT 2007AT162PO003 Vorarlberg closed 0,00% 0,00%
5 AT 2007AT162PO004 Wien closed 0,00% 0,00%
6 AT 2007AT162PO005 Kärnten pre-closed 0,00% 0,00%
7 AT 2007AT162PO006 Salzburg closed 0,03 0,00% 0,00% 0,00%
8 AT 2007AT162PO007 Steiermark closed 0,00% 0,00%
9 AT 2007AT162PO008 Tirol closed 1,74 0,00% 0,00% 0,00%
10 BE 2007BE161PO001 Hainaut
0,40% 0,36%
11 BE 2007BE162PO001 Région de Bruxelles-Capitale closed 13,74 0,90% 3,73% 3,73%
12 BE 2007BE162PO002 Vlaanderen closed 10,05 0,63% 0,63% 0,63%
13 BE 2007BE162PO003 Wallonie (hors Hainaut) 0,40% 0,36%
14 BG 2007BG161PO001 Regional Development pre-closed 20,99 0,19% 0,19% 0,19%
15 BG 2007BG161PO002 Technical Assistance closed 2,32 0,12% 0,12% 0,12%
16 BG 2007BG161PO003 Bulgarian Economy pre-closed 18,23 0,39% 0,39% 0,39%
17 BG 2007BG161PO004 Transport pre-closed 53,84 0,00% 0,00% 0,00%
18 BG 2007BG161PO005 Environment 0,00% 0,00%
19 CY 2007CY16UPO001
Sustainable Development and Competitiveness closed 24,63 0,10% 0,00% 0,00%
20 CZ 2007CZ161PO001 South East closed 0,00% 0,00%
21 CZ 2007CZ161PO002 Central Moravia closed 0,30% 0,28%
22 CZ 2007CZ161PO004 Enterprise and Innovation
0,21% 0,21%
23 CZ 2007CZ161PO005 North East closed 0,00% 0,00%
24 CZ 2007CZ161PO006 Environment closed 1,34% 1,34%
25 CZ 2007CZ161PO007 Transport closed 0,00% 0,00%
26 CZ 2007CZ161PO008 North-West Full non-
1,85% 1,85%
38
Except for 5 cases where additional audits/information was required at the time of this report and for the 4 Croatian programmes (three mainstream and one ETC) with the closure packages sent in March 2018.

regio_aar_2018_annexes
99
MS Ref Title
Reserve AAR 2018
Closure status at
end-March 2019
Relevant expenditure
2018 (in mln Euro)
Residual error rate
reported at
closure
Residual error rate validated by REGIO38 Rate of risk on
payment
financial
27 CZ 2007CZ161PO009 Central Bohemia closed 0,24% 0,24%
28 CZ 2007CZ161PO010 Moravia Silesia closed 0,00% 0,00%
29 CZ 2007CZ161PO012
Research and Development for Innovation pre-closed 0,00% 0,00%
30 CZ 2007CZ161PO013 South West pre-closed 0,00% 0,00%
31 CZ 2007CZ162PO001 Prague pre-closed 12,16 0,00% 0,00% 0,00%
32 CZ 2007CZ16UPO001 Technical Assistance closed 14,57 0,55% 15,91% 15,91%
33 CZ 2007CZ16UPO002 Integrated OP pre-closed 162,66 0,00% 0,00% 0,00%
34 DE 2007DE161PO001 Thüringen closed 73,88 0,00% 0,00% 0,00%
35 DE 2007DE161PO002 Brandenburg pre-closed 11,44 0,00% 0,00% 0,00%
36 DE 2007DE161PO003 Mecklenburg - Vorpommern closed 0,00% 0,00%
37 DE 2007DE161PO004 Sachsen
0,00% 0,00%
38 DE 2007DE161PO005 Verkehr closed 76,02 0,00% 0,00% 0,00%
39 DE 2007DE161PO006 Niedersachsen - Region Lüneburg closed 0,00% 0,00%
40 DE 2007DE161PO007 Sachsen - Anhalt Partial non-financial 1,60% 2,00%
41 DE 2007DE162PO001 Bayern closed 28,80 0,15% 0,15% 0,15%
42 DE 2007DE162PO002 Saarland closed 5,25 0,00% 0,00% 0,00%
43 DE 2007DE162PO003 Schleswig - Holstein pre-closed 0,00% 0,00%
44 DE 2007DE162PO004 Berlin pre-closed 0,00% 0,00%
45 DE 2007DE162PO005 Hessen closed 0,00% 0,04%
46 DE 2007DE162PO006 Bremen closed 0,00% 0,00%
47 DE 2007DE162PO007 Nordrhein - Westfalen pre-closed 6,10 1,63% 1,60% 1,60%
48 DE 2007DE162PO008 Baden - Württemberg closed 0,00% 0,00%
49 DE 2007DE162PO009 Hamburg closed 0,00% 0,00%
50 DE 2007DE162PO010
Niedersachsen (ohne Region Lüneburg) closed 0,00% 0,00%
51 DE 2007DE162PO011 Rheinland - Pfalz closed 0,00% 0,00%
52 DK 2007DK162PO001 Innovation og Viden closed 0,39% 0,39%
53 EE 2007EE161PO001 Economic Environment 0,00% 0,69%
54 EE 2007EE161PO002 Living Environment 0,00% 0,69%
55 ES 2007ES161PO001 Región de Murcia 65,48 0,45% 0,45% 0,45%

regio_aar_2018_annexes
100
MS Ref Title
Reserve AAR 2018
Closure status at
end-March 2019
Relevant expenditure
2018 (in mln Euro)
Residual error rate
reported at
closure
Residual error rate validated by REGIO38 Rate of risk on
payment
56 ES 2007ES161PO002 Melilla closed 7,02 1,96% 1,97% 1,97%
57 ES 2007ES161PO003 Ceuta closed 5,82 0,00% 0,01% 0,01%
58 ES 2007ES161PO004 Asturias closed 19,76 0,77% 0,76% 0,76%
59 ES 2007ES161PO005 Galicia closed 273,95 0,00% 2,00% 2,00%
60 ES 2007ES161PO006 Extremadura closed 238,67 0,00% 0,00% 0,00%
61 ES 2007ES161PO007 Castilla La Mancha closed 179,92 0,38% 0,21% 0,21%
62 ES 2007ES161PO008 Andalucía pre-closed 1 023,24 0,00% 0,50% 0,50%
63 ES 2007ES161PO009 Fondo de Cohesión - FEDER pre-closed 172,72 0,00% 0,00% 0,00%
64 ES 2007ES162PO001 Cantabria closed 4,45 0,00% 0,00% 0,00%
65 ES 2007ES162PO002 País Vasco pre-closed 24,45 1,67% 1,67% 1,67%
66 ES 2007ES162PO003 Navarra closed 2,26 1,35% 1,35% 1,35%
67 ES 2007ES162PO004 Madrid closed 66,15 0,00% 0,00% 0,00%
68 ES 2007ES162PO005 La Rioja closed 1,63 0,00% 0,00% 0,00%
69 ES 2007ES162PO006 Cataluña pre-closed 88,64 0,00% 0,00% 0,00%
70 ES 2007ES162PO007 Baleares closed 19,73 0,00% 0,00% 0,00%
71 ES 2007ES162PO008 Aragón closed 20,10 0,70% 0,64% 0,64%
72 ES 2007ES162PO009 Castilla y León closed 40,91 0,00% 0,00% 0,00%
73 ES 2007ES162PO010 Comunidad Valenciana pre-closed 29,26 0,00% 0,00% 0,00%
74 ES 2007ES162PO011 Canarias closed 129,31 0,35% 0,29% 0,29%
75 ES 2007ES16UPO001
Investigación, Desarrollo e innovación pre-closed 0,32% 0,80%
76 ES 2007ES16UPO002 Asistencia Técnica y Gobernanza closed 0,32% 0,80%
77 ES 2007ES16UPO003 Economía basada en el Conocimiento closed 0,32% 0,80%
ES 2007ESNAT-PART
Spain – National Part of 19 Regional
OPs39 0.20% 0.09%
78 ETC 2007CB163PO001 EUREGIO Maas Rijn closed 0,85% 0,85%
79 ETC 2007CB163PO002 Austria-Czech Republic closed 0,48% 0,48%
80 ETC 2007CB163PO003 Slovakia-Austria closed 0,18 0,06% 0,10% 0,10%
39
The relevant expenditure for Spain national part is included in those indicated per regional programme. The error rates indicated per regional programme are the error rates corresponding to the regional part of the programmes, excluding the national part. The national part is covered by one audit sample (error rate of 2.57% and residual error rate of 0.09%).
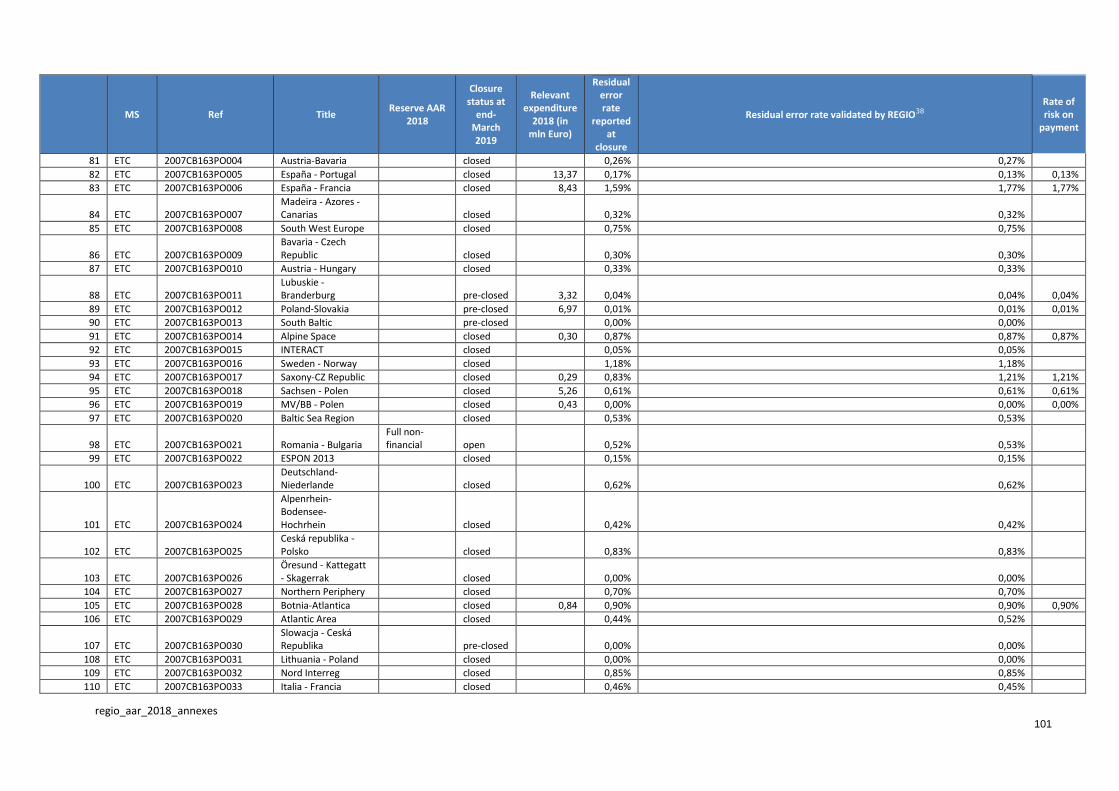
regio_aar_2018_annexes
101
MS Ref Title
Reserve AAR 2018
Closure status at
end-March 2019
Relevant expenditure
2018 (in mln Euro)
Residual error rate
reported at
closure
Residual error rate validated by REGIO38 Rate of risk on
payment
81 ETC 2007CB163PO004 Austria-Bavaria closed 0,26% 0,27% 82 ETC 2007CB163PO005 España - Portugal closed 13,37 0,17% 0,13% 0,13%
83 ETC 2007CB163PO006 España - Francia closed 8,43 1,59% 1,77% 1,77%
84 ETC 2007CB163PO007 Madeira - Azores - Canarias closed 0,32% 0,32%
85 ETC 2007CB163PO008 South West Europe closed 0,75% 0,75%
86 ETC 2007CB163PO009 Bavaria - Czech Republic closed 0,30% 0,30%
87 ETC 2007CB163PO010 Austria - Hungary closed 0,33% 0,33%
88 ETC 2007CB163PO011 Lubuskie - Branderburg pre-closed 3,32 0,04% 0,04% 0,04%
89 ETC 2007CB163PO012 Poland-Slovakia pre-closed 6,97 0,01% 0,01% 0,01%
90 ETC 2007CB163PO013 South Baltic pre-closed 0,00% 0,00% 91 ETC 2007CB163PO014 Alpine Space closed 0,30 0,87% 0,87% 0,87%
92 ETC 2007CB163PO015 INTERACT closed 0,05% 0,05%
93 ETC 2007CB163PO016 Sweden - Norway closed 1,18% 1,18%
94 ETC 2007CB163PO017 Saxony-CZ Republic closed 0,29 0,83% 1,21% 1,21%
95 ETC 2007CB163PO018 Sachsen - Polen closed 5,26 0,61% 0,61% 0,61%
96 ETC 2007CB163PO019 MV/BB - Polen closed 0,43 0,00% 0,00% 0,00%
97 ETC 2007CB163PO020 Baltic Sea Region closed 0,53% 0,53%
98 ETC 2007CB163PO021 Romania - Bulgaria Full non-financial open 0,52% 0,53%
99 ETC 2007CB163PO022 ESPON 2013 closed 0,15% 0,15%
100 ETC 2007CB163PO023 Deutschland-Niederlande closed 0,62% 0,62%
101 ETC 2007CB163PO024
Alpenrhein-Bodensee-Hochrhein closed 0,42% 0,42%
102 ETC 2007CB163PO025 Ceská republika - Polsko closed 0,83% 0,83%
103 ETC 2007CB163PO026 Öresund - Kattegatt - Skagerrak closed 0,00% 0,00%
104 ETC 2007CB163PO027 Northern Periphery closed 0,70% 0,70%
105 ETC 2007CB163PO028 Botnia-Atlantica closed 0,84 0,90% 0,90% 0,90%
106 ETC 2007CB163PO029 Atlantic Area closed 0,44% 0,52%
107 ETC 2007CB163PO030 Slowacja - Ceská Republika pre-closed 0,00% 0,00%
108 ETC 2007CB163PO031 Lithuania - Poland closed 0,00% 0,00%
109 ETC 2007CB163PO032 Nord Interreg closed 0,85% 0,85%
110 ETC 2007CB163PO033 Italia - Francia closed 0,46% 0,45%
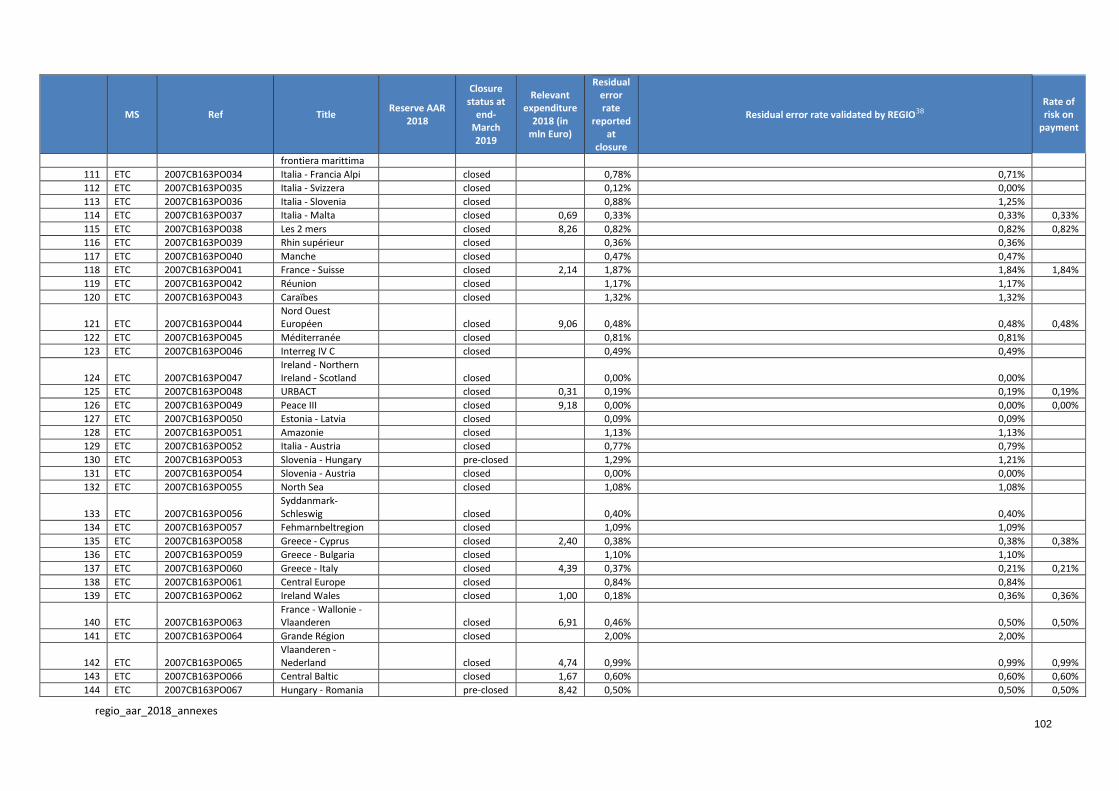
regio_aar_2018_annexes
102
MS Ref Title
Reserve AAR 2018
Closure status at
end-March 2019
Relevant expenditure
2018 (in mln Euro)
Residual error rate
reported at
closure
Residual error rate validated by REGIO38 Rate of risk on
payment
frontiera marittima
111 ETC 2007CB163PO034 Italia - Francia Alpi closed 0,78% 0,71%
112 ETC 2007CB163PO035 Italia - Svizzera closed 0,12% 0,00%
113 ETC 2007CB163PO036 Italia - Slovenia closed 0,88% 1,25%
114 ETC 2007CB163PO037 Italia - Malta closed 0,69 0,33% 0,33% 0,33%
115 ETC 2007CB163PO038 Les 2 mers closed 8,26 0,82% 0,82% 0,82%
116 ETC 2007CB163PO039 Rhin supérieur closed 0,36% 0,36%
117 ETC 2007CB163PO040 Manche closed 0,47% 0,47%
118 ETC 2007CB163PO041 France - Suisse closed 2,14 1,87% 1,84% 1,84%
119 ETC 2007CB163PO042 Réunion closed 1,17% 1,17%
120 ETC 2007CB163PO043 Caraïbes closed 1,32% 1,32%
121 ETC 2007CB163PO044 Nord Ouest Européen closed 9,06 0,48% 0,48% 0,48%
122 ETC 2007CB163PO045 Méditerranée closed 0,81% 0,81%
123 ETC 2007CB163PO046 Interreg IV C closed 0,49% 0,49%
124 ETC 2007CB163PO047 Ireland - Northern Ireland - Scotland closed 0,00% 0,00%
125 ETC 2007CB163PO048 URBACT closed 0,31 0,19% 0,19% 0,19%
126 ETC 2007CB163PO049 Peace III closed 9,18 0,00% 0,00% 0,00%
127 ETC 2007CB163PO050 Estonia - Latvia closed 0,09% 0,09%
128 ETC 2007CB163PO051 Amazonie closed 1,13% 1,13%
129 ETC 2007CB163PO052 Italia - Austria closed 0,77% 0,79%
130 ETC 2007CB163PO053 Slovenia - Hungary pre-closed 1,29% 1,21%
131 ETC 2007CB163PO054 Slovenia - Austria closed 0,00% 0,00%
132 ETC 2007CB163PO055 North Sea closed 1,08% 1,08%
133 ETC 2007CB163PO056 Syddanmark-Schleswig closed 0,40% 0,40%
134 ETC 2007CB163PO057 Fehmarnbeltregion closed 1,09% 1,09%
135 ETC 2007CB163PO058 Greece - Cyprus closed 2,40 0,38% 0,38% 0,38%
136 ETC 2007CB163PO059 Greece - Bulgaria closed 1,10% 1,10% 137 ETC 2007CB163PO060 Greece - Italy closed 4,39 0,37% 0,21% 0,21%
138 ETC 2007CB163PO061 Central Europe closed 0,84% 0,84% 139 ETC 2007CB163PO062 Ireland Wales closed 1,00 0,18% 0,36% 0,36%
140 ETC 2007CB163PO063 France - Wallonie - Vlaanderen closed 6,91 0,46% 0,50% 0,50%
141 ETC 2007CB163PO064 Grande Région closed 2,00% 2,00%
142 ETC 2007CB163PO065 Vlaanderen - Nederland closed 4,74 0,99% 0,99% 0,99%
143 ETC 2007CB163PO066 Central Baltic closed 1,67 0,60% 0,60% 0,60%
144 ETC 2007CB163PO067 Hungary - Romania pre-closed 8,42 0,50% 0,50% 0,50%

regio_aar_2018_annexes
103
MS Ref Title
Reserve AAR 2018
Closure status at
end-March 2019
Relevant expenditure
2018 (in mln Euro)
Residual error rate
reported at
closure
Residual error rate validated by REGIO38 Rate of risk on
payment
145 ETC 2007CB163PO068 Hungary - Slovakia closed 0,65 0,34% 0,34% 0,34%
146 ETC 2007CB163PO069 South East Europe pre-closed 0,15% 0,15%
147 ETC 2007CB163PO070 Latvia - Lithuania closed 0,00% 0,00%
148 ETC 2013CB163PO001 Slovenia-Croatia 0,00% 0,37%
149 ETC 2013CB163PO002 Hungary-Croatia closed 1,22 0,00% 0,00% 0,00%
150 ETC 2008CB163PO001 España - Fronteras Exteriores closed 4,37 0,62% 0,56% 0,56%
151 FI 2007FI162PO001 Itä pre-closed 0,00% 0,00%
152 FI 2007FI162PO002 Pohjois closed 0,00% 0,00%
153 FI 2007FI162PO003 Länsi closed 0,00% 0,00%
154 FI 2007FI162PO004 Etelä closed 0,00% 0,00%
155 FI 2007FI162PO005 Åland closed 1,87% 1,87%
156 FR 2007FR161PO001 Guyane closed 15,26 1,84% 1,85% 1,85%
157 FR 2007FR161PO002 Guadeloupe pre-closed 1,84% 1,85%
158 FR 2007FR161PO003 Martinique pre-closed 15,55 1,84% 1,85% 1,85%
159 FR 2007FR161PO004 Réunion closed 50,71 1,84% 1,85% 1,85%
160 FR 2007FR162PO001 Aquitaine closed 19,62 1,84% 1,85% 1,85%
161 FR 2007FR162PO002 Centre closed 4,20 1,84% 1,85% 1,85%
162 FR 2007FR162PO003 Alsace closed 3,80 1,84% 1,85% 1,85%
163 FR 2007FR162PO004 Auvergne closed 10,34 1,84% 1,85% 1,85%
164 FR 2007FR162PO005 Basse-Normandie closed 9,07 1,84% 1,85% 1,85%
165 FR 2007FR162PO006 Bourgogne closed 9,28 1,84% 1,85% 1,85%
166 FR 2007FR162PO007 Bretagne closed 11,89 1,84% 1,85% 1,85%
167 FR 2007FR162PO008 Champagne-Ardenne closed 9,28 1,84%
1,85% 1,85%
168 FR 2007FR162PO009 Corse closed 7,52 1,84% 1,85% 1,85%
169 FR 2007FR162PO010 Franche-Comté closed 7,34 1,84% 1,85% 1,85%
170 FR 2007FR162PO011 Haute-Normandie closed 70,97 1,84% 1,85% 1,85%
171 FR 2007FR162PO012 Ile-De-France closed 7,54 1,84% 1,85% 1,85%
172 FR 2007FR162PO013 Languedoc-Roussillon closed 13,52 1,84%
1,85% 1,85%
173 FR 2007FR162PO014 Limousin closed 6,36 1,84% 1,85% 1,85%
174 FR 2007FR162PO015 Lorraine 16,47 1,84% 1,85% 1,85%
175 FR 2007FR162PO016 Pays De La Loire closed 15,11 1,84% 1,85% 1,85%
176 FR 2007FR162PO017 Nord Pas-De-Calais pre-closed 20,29 1,84% 1,85% 1,85%
177 FR 2007FR162PO018 Picardie open 1,84% 1,85%
178 FR 2007FR162PO019 Poitou-Charentes closed 10,07 1,84% 1,85% 1,85%
179 FR 2007FR162PO020 PACA closed 15,11 1,84% 1,85% 1,85%
180 FR 2007FR162PO021 Midi-Pyrénées pre-closed 21,50 1,84% 1,85% 1,85%
181 FR 2007FR162PO022 Rhône-Alpes closed 16,70 1,84% 1,85% 1,85%
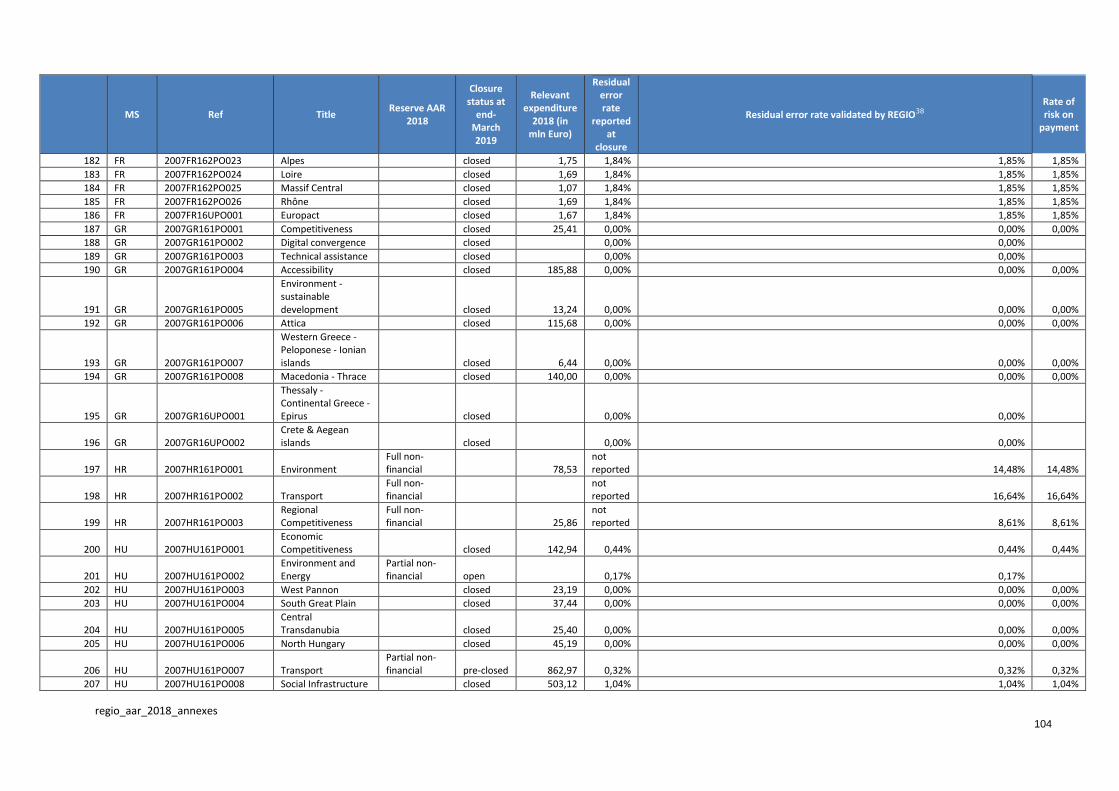
regio_aar_2018_annexes
104
MS Ref Title
Reserve AAR 2018
Closure status at
end-March 2019
Relevant expenditure
2018 (in mln Euro)
Residual error rate
reported at
closure
Residual error rate validated by REGIO38 Rate of risk on
payment
182 FR 2007FR162PO023 Alpes closed 1,75 1,84% 1,85% 1,85%
183 FR 2007FR162PO024 Loire closed 1,69 1,84% 1,85% 1,85%
184 FR 2007FR162PO025 Massif Central closed 1,07 1,84% 1,85% 1,85%
185 FR 2007FR162PO026 Rhône closed 1,69 1,84% 1,85% 1,85%
186 FR 2007FR16UPO001 Europact closed 1,67 1,84% 1,85% 1,85%
187 GR 2007GR161PO001 Competitiveness closed 25,41 0,00% 0,00% 0,00%
188 GR 2007GR161PO002 Digital convergence closed 0,00% 0,00%
189 GR 2007GR161PO003 Technical assistance closed 0,00% 0,00%
190 GR 2007GR161PO004 Accessibility closed 185,88 0,00% 0,00% 0,00%
191 GR 2007GR161PO005
Environment - sustainable development closed 13,24 0,00% 0,00% 0,00%
192 GR 2007GR161PO006 Attica closed 115,68 0,00% 0,00% 0,00%
193 GR 2007GR161PO007
Western Greece - Peloponese - Ionian islands closed 6,44 0,00% 0,00% 0,00%
194 GR 2007GR161PO008 Macedonia - Thrace closed 140,00 0,00% 0,00% 0,00%
195 GR 2007GR16UPO001
Thessaly - Continental Greece - Epirus closed 0,00% 0,00%
196 GR 2007GR16UPO002 Crete & Aegean islands closed 0,00% 0,00%
197 HR 2007HR161PO001 Environment Full non-financial 78,53
not reported 14,48% 14,48%
198 HR 2007HR161PO002 Transport Full non-financial
not reported 16,64% 16,64%
199 HR 2007HR161PO003 Regional Competitiveness
Full non-financial 25,86
not reported 8,61% 8,61%
200 HU 2007HU161PO001 Economic Competitiveness closed 142,94 0,44% 0,44% 0,44%
201 HU 2007HU161PO002 Environment and Energy
Partial non-financial open 0,17% 0,17%
202 HU 2007HU161PO003 West Pannon closed 23,19 0,00% 0,00% 0,00%
203 HU 2007HU161PO004 South Great Plain closed 37,44 0,00% 0,00% 0,00%
204 HU 2007HU161PO005 Central Transdanubia closed 25,40 0,00% 0,00% 0,00%
205 HU 2007HU161PO006 North Hungary closed 45,19 0,00% 0,00% 0,00%
206 HU 2007HU161PO007 Transport Partial non-financial pre-closed 862,97 0,32% 0,32% 0,32%
207 HU 2007HU161PO008 Social Infrastructure closed 503,12 1,04% 1,04% 1,04%
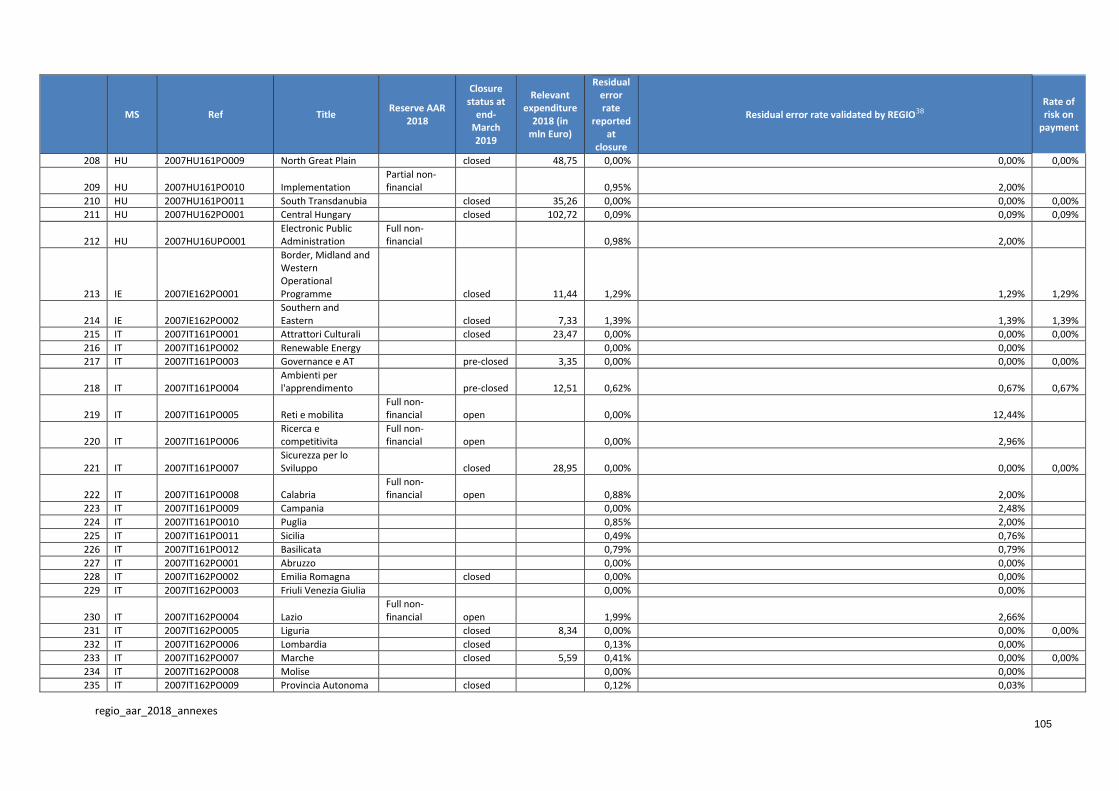
regio_aar_2018_annexes
105
MS Ref Title
Reserve AAR 2018
Closure status at
end-March 2019
Relevant expenditure
2018 (in mln Euro)
Residual error rate
reported at
closure
Residual error rate validated by REGIO38 Rate of risk on
payment
208 HU 2007HU161PO009 North Great Plain closed 48,75 0,00% 0,00% 0,00%
209 HU 2007HU161PO010 Implementation Partial non-financial 0,95% 2,00%
210 HU 2007HU161PO011 South Transdanubia closed 35,26 0,00% 0,00% 0,00%
211 HU 2007HU162PO001 Central Hungary closed 102,72 0,09% 0,09% 0,09%
212 HU 2007HU16UPO001 Electronic Public Administration
Full non-financial 0,98% 2,00%
213 IE 2007IE162PO001
Border, Midland and Western Operational Programme closed 11,44 1,29% 1,29% 1,29%
214 IE 2007IE162PO002 Southern and Eastern closed 7,33 1,39% 1,39% 1,39%
215 IT 2007IT161PO001 Attrattori Culturali closed 23,47 0,00% 0,00% 0,00%
216 IT 2007IT161PO002 Renewable Energy 0,00% 0,00% 217 IT 2007IT161PO003 Governance e AT pre-closed 3,35 0,00% 0,00% 0,00%
218 IT 2007IT161PO004 Ambienti per l'apprendimento pre-closed 12,51 0,62% 0,67% 0,67%
219 IT 2007IT161PO005 Reti e mobilita Full non-financial open 0,00% 12,44%
220 IT 2007IT161PO006 Ricerca e competitivita
Full non-financial open 0,00% 2,96%
221 IT 2007IT161PO007 Sicurezza per lo Sviluppo closed 28,95 0,00% 0,00% 0,00%
222 IT 2007IT161PO008 Calabria Full non-financial open 0,88% 2,00%
223 IT 2007IT161PO009 Campania 0,00% 2,48%
224 IT 2007IT161PO010 Puglia 0,85% 2,00%
225 IT 2007IT161PO011 Sicilia 0,49% 0,76%
226 IT 2007IT161PO012 Basilicata 0,79% 0,79%
227 IT 2007IT162PO001 Abruzzo 0,00% 0,00%
228 IT 2007IT162PO002 Emilia Romagna closed 0,00% 0,00%
229 IT 2007IT162PO003 Friuli Venezia Giulia 0,00% 0,00%
230 IT 2007IT162PO004 Lazio Full non-financial open 1,99% 2,66%
231 IT 2007IT162PO005 Liguria closed 8,34 0,00% 0,00% 0,00%
232 IT 2007IT162PO006 Lombardia closed 0,13% 0,00% 233 IT 2007IT162PO007 Marche closed 5,59 0,41% 0,00% 0,00%
234 IT 2007IT162PO008 Molise 0,00% 0,00%
235 IT 2007IT162PO009 Provincia Autonoma closed 0,12% 0,03%
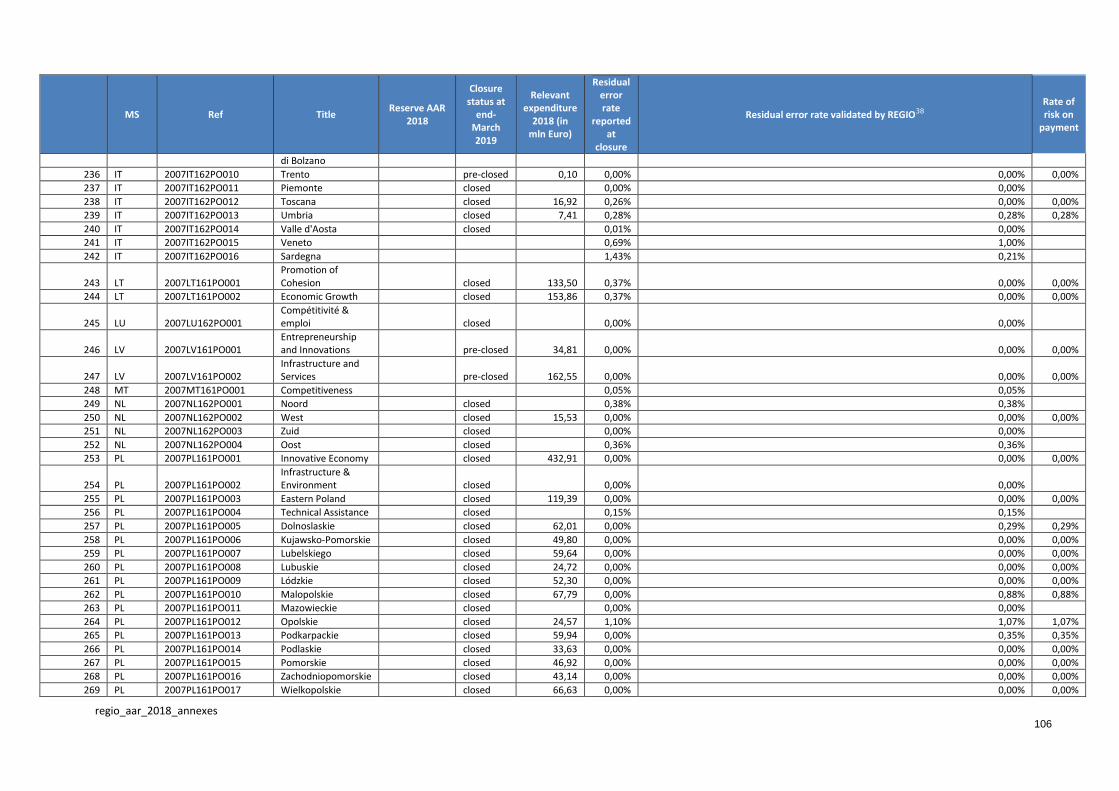
regio_aar_2018_annexes
106
MS Ref Title
Reserve AAR 2018
Closure status at
end-March 2019
Relevant expenditure
2018 (in mln Euro)
Residual error rate
reported at
closure
Residual error rate validated by REGIO38 Rate of risk on
payment
di Bolzano
236 IT 2007IT162PO010 Trento pre-closed 0,10 0,00% 0,00% 0,00%
237 IT 2007IT162PO011 Piemonte closed 0,00% 0,00% 238 IT 2007IT162PO012 Toscana closed 16,92 0,26% 0,00% 0,00%
239 IT 2007IT162PO013 Umbria closed 7,41 0,28% 0,28% 0,28%
240 IT 2007IT162PO014 Valle d'Aosta closed 0,01% 0,00%
241 IT 2007IT162PO015 Veneto 0,69% 1,00%
242 IT 2007IT162PO016 Sardegna 1,43% 0,21%
243 LT 2007LT161PO001 Promotion of Cohesion closed 133,50 0,37% 0,00% 0,00%
244 LT 2007LT161PO002 Economic Growth closed 153,86 0,37% 0,00% 0,00%
245 LU 2007LU162PO001 Compétitivité & emploi closed 0,00% 0,00%
246 LV 2007LV161PO001 Entrepreneurship and Innovations pre-closed 34,81 0,00% 0,00% 0,00%
247 LV 2007LV161PO002 Infrastructure and Services pre-closed 162,55 0,00% 0,00% 0,00%
248 MT 2007MT161PO001 Competitiveness 0,05% 0,05%
249 NL 2007NL162PO001 Noord closed 0,38% 0,38%
250 NL 2007NL162PO002 West closed 15,53 0,00% 0,00% 0,00%
251 NL 2007NL162PO003 Zuid closed 0,00% 0,00%
252 NL 2007NL162PO004 Oost closed 0,36% 0,36%
253 PL 2007PL161PO001 Innovative Economy closed 432,91 0,00% 0,00% 0,00%
254 PL 2007PL161PO002 Infrastructure & Environment closed 0,00% 0,00%
255 PL 2007PL161PO003 Eastern Poland closed 119,39 0,00% 0,00% 0,00%
256 PL 2007PL161PO004 Technical Assistance closed 0,15% 0,15%
257 PL 2007PL161PO005 Dolnoslaskie closed 62,01 0,00% 0,29% 0,29%
258 PL 2007PL161PO006 Kujawsko-Pomorskie closed 49,80 0,00% 0,00% 0,00%
259 PL 2007PL161PO007 Lubelskiego closed 59,64 0,00% 0,00% 0,00%
260 PL 2007PL161PO008 Lubuskie closed 24,72 0,00% 0,00% 0,00%
261 PL 2007PL161PO009 Lódzkie closed 52,30 0,00% 0,00% 0,00%
262 PL 2007PL161PO010 Malopolskie closed 67,79 0,00% 0,88% 0,88%
263 PL 2007PL161PO011 Mazowieckie closed 0,00% 0,00% 264 PL 2007PL161PO012 Opolskie closed 24,57 1,10% 1,07% 1,07%
265 PL 2007PL161PO013 Podkarpackie closed 59,94 0,00% 0,35% 0,35%
266 PL 2007PL161PO014 Podlaskie closed 33,63 0,00% 0,00% 0,00%
267 PL 2007PL161PO015 Pomorskie closed 46,92 0,00% 0,00% 0,00%
268 PL 2007PL161PO016 Zachodniopomorskie closed 43,14 0,00% 0,00% 0,00%
269 PL 2007PL161PO017 Wielkopolskie closed 66,63 0,00% 0,00% 0,00%
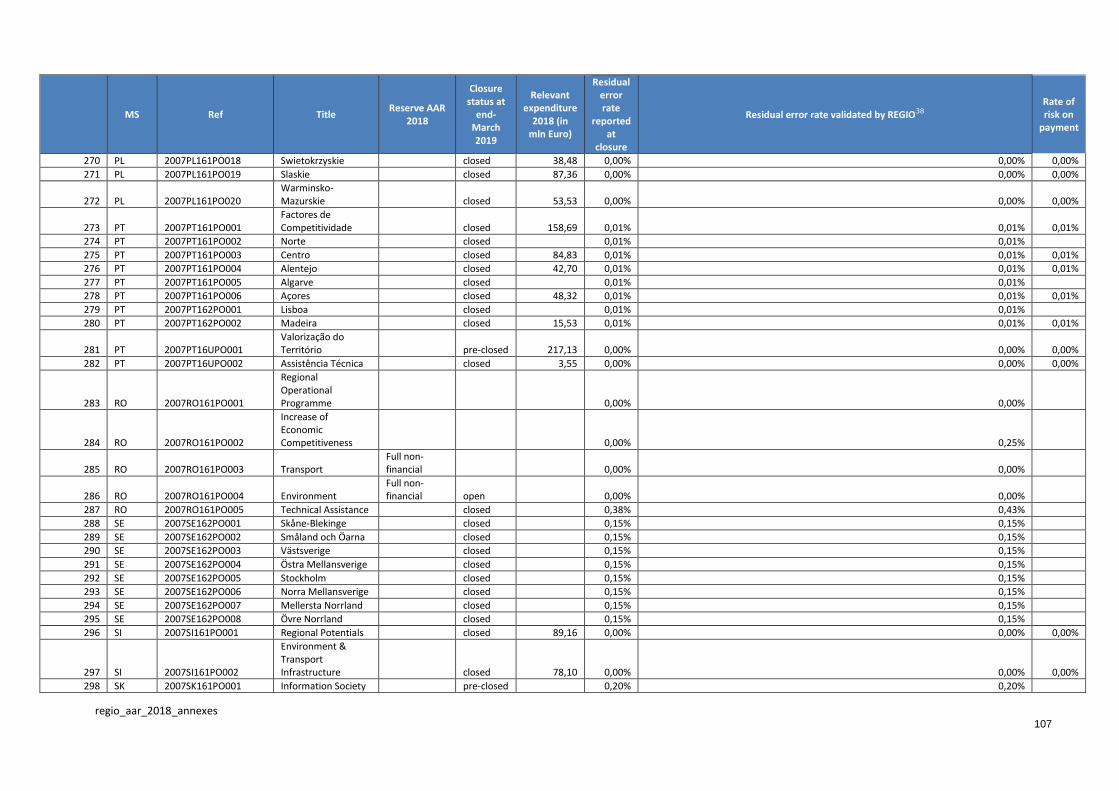
regio_aar_2018_annexes
107
MS Ref Title
Reserve AAR 2018
Closure status at
end-March 2019
Relevant expenditure
2018 (in mln Euro)
Residual error rate
reported at
closure
Residual error rate validated by REGIO38 Rate of risk on
payment
270 PL 2007PL161PO018 Swietokrzyskie closed 38,48 0,00% 0,00% 0,00%
271 PL 2007PL161PO019 Slaskie closed 87,36 0,00% 0,00% 0,00%
272 PL 2007PL161PO020 Warminsko-Mazurskie closed 53,53 0,00% 0,00% 0,00%
273 PT 2007PT161PO001 Factores de Competitividade closed 158,69 0,01% 0,01% 0,01%
274 PT 2007PT161PO002 Norte closed 0,01% 0,01%
275 PT 2007PT161PO003 Centro closed 84,83 0,01% 0,01% 0,01%
276 PT 2007PT161PO004 Alentejo closed 42,70 0,01% 0,01% 0,01%
277 PT 2007PT161PO005 Algarve closed 0,01% 0,01% 278 PT 2007PT161PO006 Açores closed 48,32 0,01% 0,01% 0,01%
279 PT 2007PT162PO001 Lisboa closed 0,01% 0,01%
280 PT 2007PT162PO002 Madeira closed 15,53 0,01% 0,01% 0,01%
281 PT 2007PT16UPO001 Valorização do Território pre-closed 217,13 0,00% 0,00% 0,00%
282 PT 2007PT16UPO002 Assistência Técnica closed 3,55 0,00% 0,00% 0,00%
283 RO 2007RO161PO001
Regional Operational Programme 0,00% 0,00%
284 RO 2007RO161PO002
Increase of Economic Competitiveness 0,00% 0,25%
285 RO 2007RO161PO003 Transport Full non-financial 0,00% 0,00%
286 RO 2007RO161PO004 Environment Full non-financial open 0,00% 0,00%
287 RO 2007RO161PO005 Technical Assistance closed 0,38% 0,43%
288 SE 2007SE162PO001 Skåne-Blekinge closed 0,15% 0,15%
289 SE 2007SE162PO002 Småland och Öarna closed 0,15% 0,15%
290 SE 2007SE162PO003 Västsverige closed 0,15% 0,15%
291 SE 2007SE162PO004 Östra Mellansverige closed 0,15% 0,15%
292 SE 2007SE162PO005 Stockholm closed 0,15% 0,15%
293 SE 2007SE162PO006 Norra Mellansverige closed 0,15% 0,15%
294 SE 2007SE162PO007 Mellersta Norrland closed 0,15% 0,15%
295 SE 2007SE162PO008 Övre Norrland closed 0,15% 0,15%
296 SI 2007SI161PO001 Regional Potentials closed 89,16 0,00% 0,00% 0,00%
297 SI 2007SI161PO002
Environment & Transport Infrastructure closed 78,10 0,00% 0,00% 0,00%
298 SK 2007SK161PO001 Information Society pre-closed 0,20% 0,20%
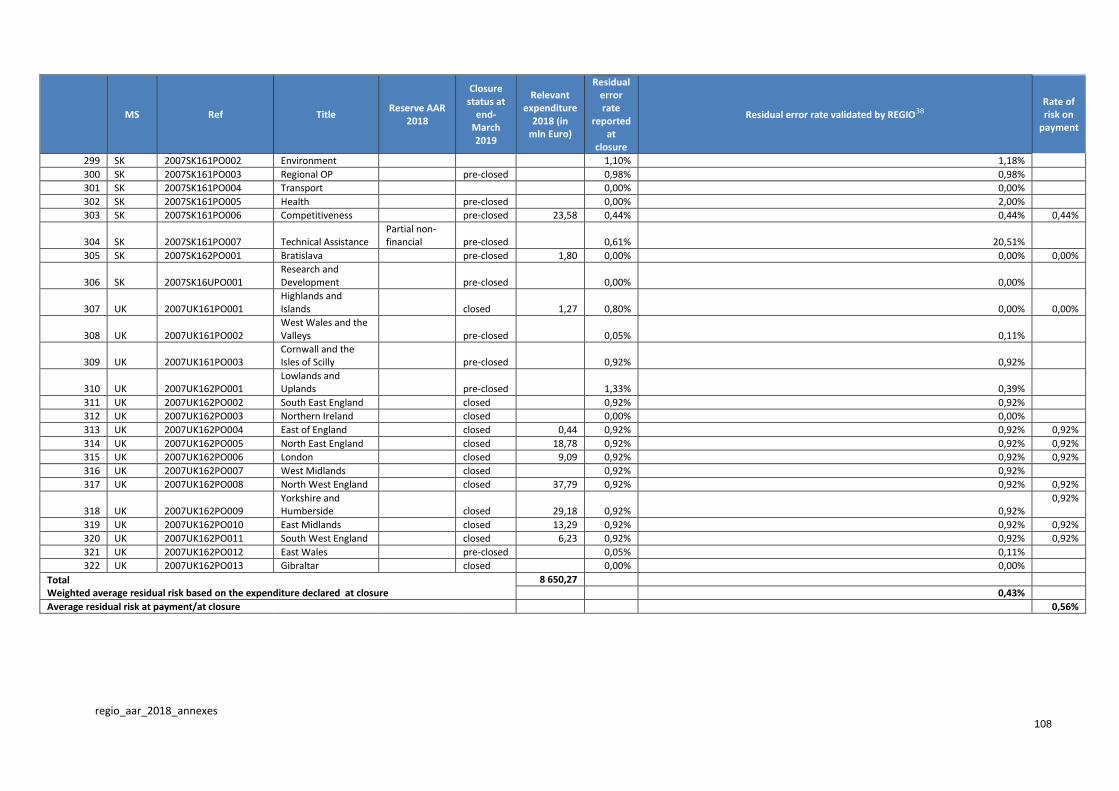
regio_aar_2018_annexes
108
MS Ref Title
Reserve AAR 2018
Closure status at
end-March 2019
Relevant expenditure
2018 (in mln Euro)
Residual error rate
reported at
closure
Residual error rate validated by REGIO38 Rate of risk on
payment
299 SK 2007SK161PO002 Environment 1,10% 1,18%
300 SK 2007SK161PO003 Regional OP pre-closed 0,98% 0,98%
301 SK 2007SK161PO004 Transport 0,00% 0,00%
302 SK 2007SK161PO005 Health pre-closed 0,00% 2,00%
303 SK 2007SK161PO006 Competitiveness pre-closed 23,58 0,44% 0,44% 0,44%
304 SK 2007SK161PO007 Technical Assistance Partial non-financial pre-closed 0,61% 20,51%
305 SK 2007SK162PO001 Bratislava pre-closed 1,80 0,00% 0,00% 0,00%
306 SK 2007SK16UPO001 Research and Development pre-closed 0,00% 0,00%
307 UK 2007UK161PO001 Highlands and Islands closed 1,27 0,80% 0,00% 0,00%
308 UK 2007UK161PO002 West Wales and the Valleys pre-closed 0,05% 0,11%
309 UK 2007UK161PO003 Cornwall and the Isles of Scilly pre-closed 0,92% 0,92%
310 UK 2007UK162PO001 Lowlands and Uplands pre-closed 1,33% 0,39%
311 UK 2007UK162PO002 South East England closed 0,92% 0,92%
312 UK 2007UK162PO003 Northern Ireland closed 0,00% 0,00%
313 UK 2007UK162PO004 East of England closed 0,44 0,92% 0,92% 0,92%
314 UK 2007UK162PO005 North East England closed 18,78 0,92% 0,92% 0,92%
315 UK 2007UK162PO006 London closed 9,09 0,92% 0,92% 0,92%
316 UK 2007UK162PO007 West Midlands closed 0,92% 0,92%
317 UK 2007UK162PO008 North West England closed 37,79 0,92% 0,92% 0,92%
318 UK 2007UK162PO009 Yorkshire and Humberside closed 29,18 0,92% 0,92%
0,92%
319 UK 2007UK162PO010 East Midlands closed 13,29 0,92% 0,92% 0,92%
320 UK 2007UK162PO011 South West England closed 6,23 0,92% 0,92% 0,92%
321 UK 2007UK162PO012 East Wales pre-closed 0,05% 0,11%
322 UK 2007UK162PO013 Gibraltar closed 0,00% 0,00%
Total Weighted average residual risk based on the expenditure declared at closure
8 650,27
0,43%
Average residual risk at payment/at closure 0,56%

109 regio_aar_2018_annexes
ANNEX 10E: 2007-2013 ERDF / CF Operational Programmes: Financial Corrections, Withdrawals and Recoveries
1. Commission supervisory role - Financial corrections confirmed/decided in 2018 (excluded at source corrections) by programming period, in EUR million*
Programming period
1994-99 2000-06 2007-13 Total
2018 Cumulative (ERDF + CF) end of 2018
2018 Cumulative (ERDF + CF) end of 2018
2018 Cumulative (ERDF + CF) end of 2018
2018 Cumulative (ERDF + CF) end of 2018
ERDF CF Total 2018
ERDF CF Total 2018
ERDF CF Total 2018
ERDF CF Total 2018
Austria 0,2 0,7 -0,04 -0,04 16,16 0,0 0,0 17,1
Belgium 9,1 8,2 1,39 1,39 2,99 1,4 1,4 20,3
Bulgaria 2,2 2,2 25,7 120,6 2,2 2,2 146,3
Croatia 1,0 0,44 0,44 0,44 0,4 0,4 1,4
Cyprus
Czech Republic 45,0 22,71 22,71 377,81 22,7 22,7 422,8
Denmark 1,8 0,5 2,4
Estonia 2,2 9,7 11,9
ETC 1,8 69,1 5,62 5,62 10,72 5,6 5,6 81,6
Finland 0,5 0,5
France 32,7 0,2 0,2 112,3 1,16 1,16 14,66 1,4 1,4 159,8
Germany 48,6 26,6 161,2 236,4
Greece 519,6 -1,6 -1,6 1 235,4 14,43 2,09 16,52 412,62 14,4 0,5 14,9 2 167,5
Hungary 64,9 75,41 66,86 142,27 699,07 75,4 66,9 142,3 764,1
Ireland 11,2 64,9 2,4 78,5
Italy 338,9 101,2 101,2 1 312,6 2,37 2,37 308,07 103,6 103,6 1 959,7
Latvia 17,9 61,1 79,0
Lithuania 8,4 8,4
Luxembourg 0,3 0,4
Malta 11 11,0
Netherlands 8,2 0,2 8,4
Poland 303,5 6,17 6,17 526,07 6,2 6,2 829,5
Portugal 85,0 240,3 13,98 13,98 72,58 14,0 14,0 397,9
Romania 8,3 8,3 27,4 0,16 0,16 72,46 8,5 8,5 99,9
Slovakia 119,8 373,6 493,5
Spain 225,9 2 918,4 24.60 11,82 36.42 398.72 24.6 11,8 36.5 3 543.2
Slovenia 2,9 16,52 16,52 49,42 16,5 16,5 52,4
Sweden 0,5 0,1 0,7 1,3
United Kingdom 126,9 159,9 0,11 0,11 61,41 0,1 0,1 348,2
TOTAL 1 411,2 101,4 8,9 110,3 6 767,9 184.46 81,4 265.8 3 763,5 285,9 90,3 376.1 11 943,2
Implemented:
1 409,3
6 738,3
3 542.46
11 690,1
%
100%
99,6% 94,1% 97,9%
* Negative amounts refer to adjustments/corrections to reporting of previous years
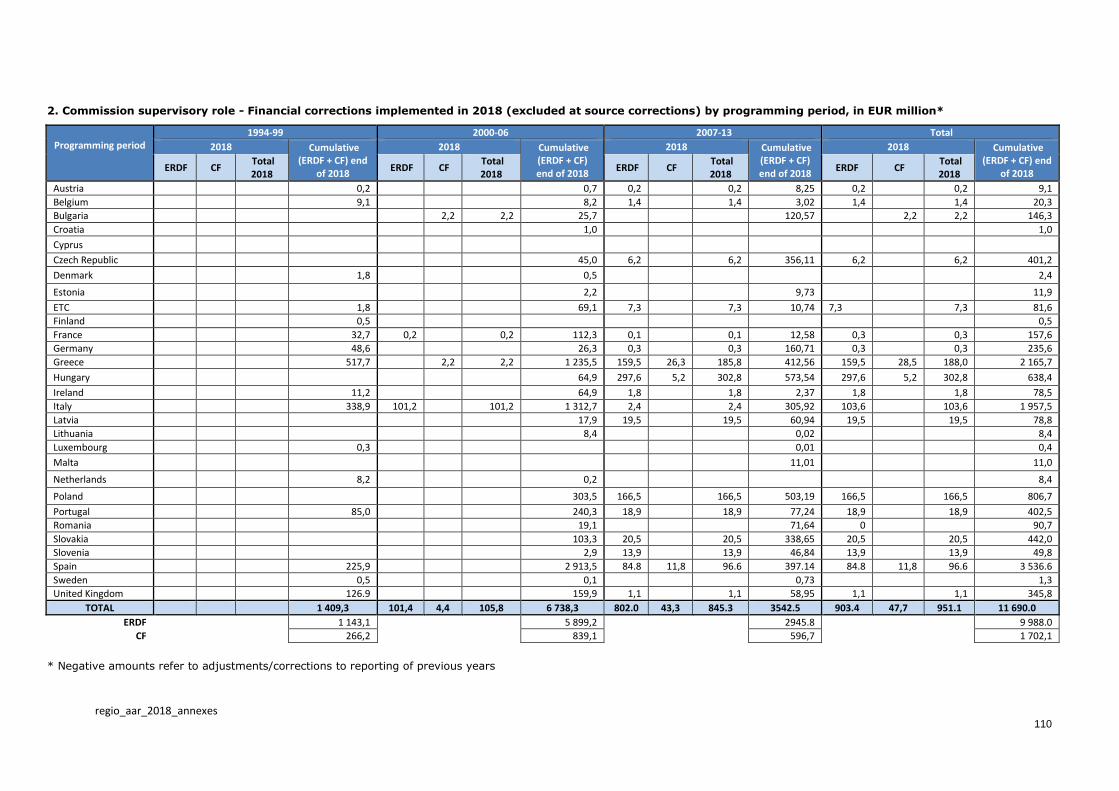
regio_aar_2018_annexes
110
2. Commission supervisory role - Financial corrections implemented in 2018 (excluded at source corrections) by programming period, in EUR million*
Programming period 1994-99 2000-06 2007-13 Total
2018 Cumulative (ERDF + CF) end
of 2018
2018 Cumulative (ERDF + CF) end of 2018
2018 Cumulative (ERDF + CF) end of 2018
2018 Cumulative (ERDF + CF) end
of 2018 ERDF CF
Total 2018
ERDF CF Total 2018
ERDF CF Total 2018
ERDF CF Total 2018
Austria 0,2 0,7 0,2 0,2 8,25 0,2 0,2 9,1
Belgium 9,1 8,2 1,4 1,4 3,02 1,4 1,4 20,3
Bulgaria 2,2 2,2 25,7 120,57 2,2 2,2 146,3
Croatia 1,0 1,0
Cyprus Czech Republic 45,0 6,2 6,2 356,11 6,2 6,2 401,2
Denmark 1,8 0,5 2,4
Estonia 2,2 9,73 11,9
ETC 1,8 69,1 7,3 7,3 10,74 7,3 7,3 81,6
Finland 0,5 0,5
France 32,7 0,2 0,2 112,3 0,1 0,1 12,58 0,3 0,3 157,6
Germany 48,6 26,3 0,3 0,3 160,71 0,3 0,3 235,6
Greece 517,7 2,2 2,2 1 235,5 159,5 26,3 185,8 412,56 159,5 28,5 188,0 2 165,7
Hungary 64,9 297,6 5,2 302,8 573,54 297,6 5,2 302,8 638,4
Ireland 11,2 64,9 1,8 1,8 2,37 1,8 1,8 78,5
Italy 338,9 101,2 101,2 1 312,7 2,4 2,4 305,92 103,6 103,6 1 957,5
Latvia 17,9 19,5 19,5 60,94 19,5 19,5 78,8
Lithuania 8,4 0,02 8,4
Luxembourg 0,3 0,01 0,4
Malta 11,01 11,0
Netherlands 8,2 0,2 8,4
Poland 303,5 166,5 166,5 503,19 166,5 166,5 806,7
Portugal 85,0 240,3 18,9 18,9 77,24 18,9 18,9 402,5
Romania 19,1 71,64 0 90,7
Slovakia 103,3 20,5 20,5 338,65 20,5 20,5 442,0
Slovenia 2,9 13,9 13,9 46,84 13,9 13,9 49,8
Spain 225,9 2 913,5 84.8 11,8 96.6 397.14 84.8 11,8 96.6 3 536.6
Sweden 0,5 0,1 0,73 1,3
United Kingdom 126.9 159,9 1,1 1,1 58,95 1,1 1,1 345,8
TOTAL 1 409,3 101,4 4,4 105,8 6 738,3 802.0 43,3 845.3 3542.5 903.4 47,7 951.1 11 690.0
ERDF
1 143,1
5 899,2
2945.8
9 988.0
CF
266,2
839,1
596,7
1 702,1
* Negative amounts refer to adjustments/corrections to reporting of previous years
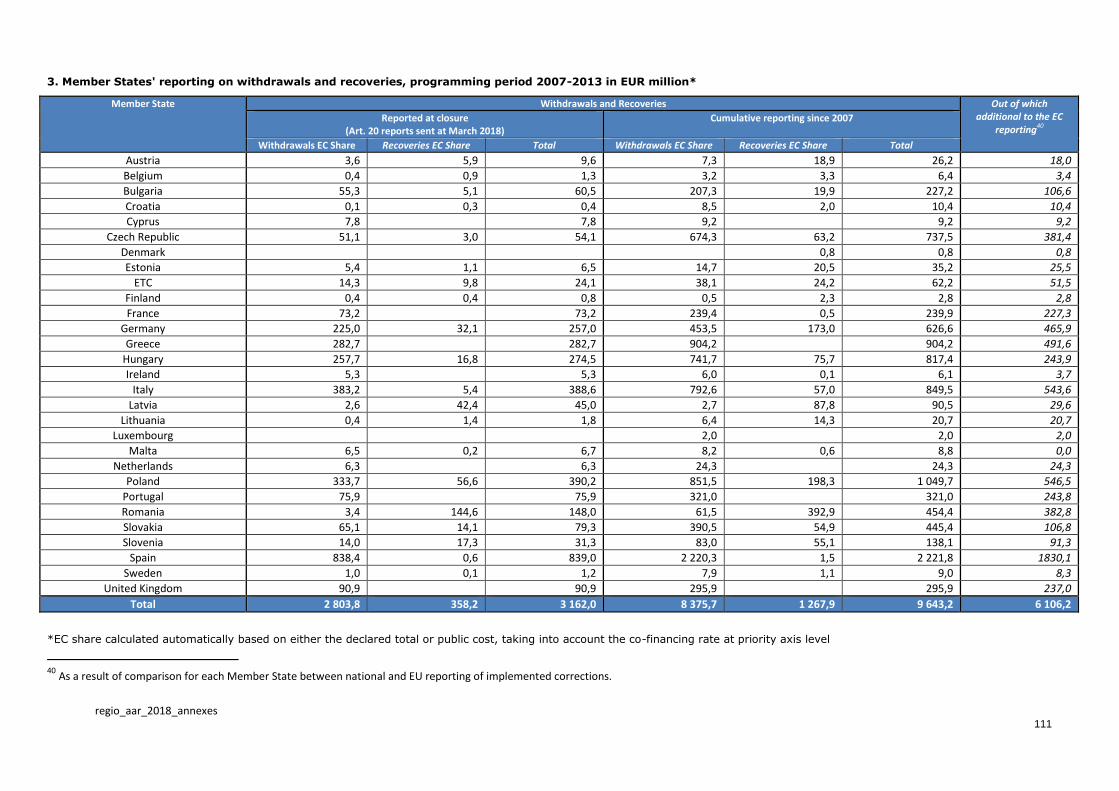
regio_aar_2018_annexes
111
3. Member States' reporting on withdrawals and recoveries, programming period 2007-2013 in EUR million*
Member State Withdrawals and Recoveries Out of which additional to the EC
reporting40 Reported at closure
(Art. 20 reports sent at March 2018) Cumulative reporting since 2007
Withdrawals EC Share Recoveries EC Share Total Withdrawals EC Share Recoveries EC Share Total
Austria 3,6 5,9 9,6 7,3 18,9 26,2 18,0
Belgium 0,4 0,9 1,3 3,2 3,3 6,4 3,4
Bulgaria 55,3 5,1 60,5 207,3 19,9 227,2 106,6
Croatia 0,1 0,3 0,4 8,5 2,0 10,4 10,4
Cyprus 7,8 7,8 9,2 9,2 9,2
Czech Republic 51,1 3,0 54,1 674,3 63,2 737,5 381,4
Denmark 0,8 0,8 0,8
Estonia 5,4 1,1 6,5 14,7 20,5 35,2 25,5
ETC 14,3 9,8 24,1 38,1 24,2 62,2 51,5
Finland 0,4 0,4 0,8 0,5 2,3 2,8 2,8
France 73,2 73,2 239,4 0,5 239,9 227,3
Germany 225,0 32,1 257,0 453,5 173,0 626,6 465,9
Greece 282,7 282,7 904,2 904,2 491,6
Hungary 257,7 16,8 274,5 741,7 75,7 817,4 243,9
Ireland 5,3 5,3 6,0 0,1 6,1 3,7
Italy 383,2 5,4 388,6 792,6 57,0 849,5 543,6
Latvia 2,6 42,4 45,0 2,7 87,8 90,5 29,6
Lithuania 0,4 1,4 1,8 6,4 14,3 20,7 20,7
Luxembourg 2,0 2,0 2,0
Malta 6,5 0,2 6,7 8,2 0,6 8,8 0,0
Netherlands 6,3 6,3 24,3 24,3 24,3
Poland 333,7 56,6 390,2 851,5 198,3 1 049,7 546,5
Portugal 75,9 75,9 321,0 321,0 243,8
Romania 3,4 144,6 148,0 61,5 392,9 454,4 382,8
Slovakia 65,1 14,1 79,3 390,5 54,9 445,4 106,8
Slovenia 14,0 17,3 31,3 83,0 55,1 138,1 91,3
Spain 838,4 0,6 839,0 2 220,3 1,5 2 221,8 1830,1
Sweden 1,0 0,1 1,2 7,9 1,1 9,0 8,3
United Kingdom 90,9 90,9 295,9 295,9 237,0
Total 2 803,8 358,2 3 162,0 8 375,7 1 267,9 9 643,2 6 106,2
*EC share calculated automatically based on either the declared total or public cost, taking into account the co-financing rate at priority axis level
40
As a result of comparison for each Member State between national and EU reporting of implemented corrections.
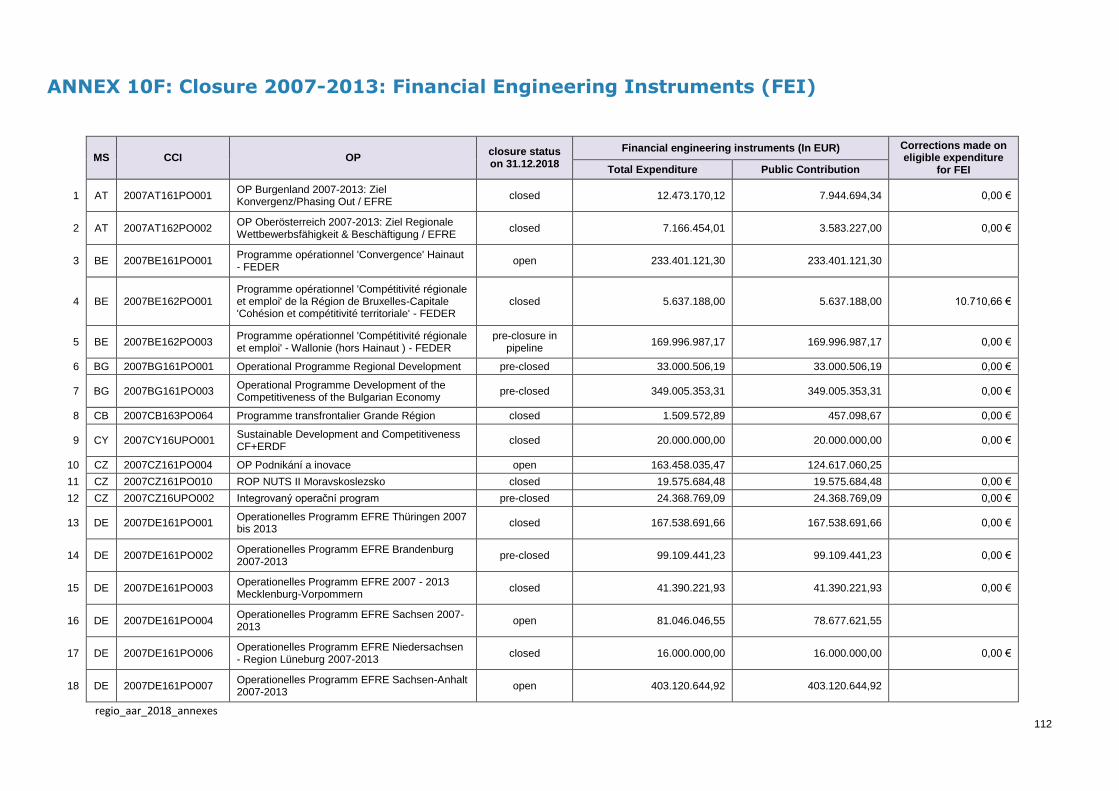
regio_aar_2018_annexes
112
ANNEX 10F: Closure 2007-2013: Financial Engineering Instruments (FEI)
MS CCI OP closure status on 31.12.2018
Financial engineering instruments (In EUR) Corrections made on eligible expenditure
for FEI Total Expenditure Public Contribution
1 AT 2007AT161PO001 OP Burgenland 2007-2013: Ziel Konvergenz/Phasing Out / EFRE
closed 12.473.170,12 7.944.694,34 0,00 €
2 AT 2007AT162PO002 OP Oberösterreich 2007-2013: Ziel Regionale Wettbewerbsfähigkeit & Beschäftigung / EFRE
closed 7.166.454,01 3.583.227,00 0,00 €
3 BE 2007BE161PO001 Programme opérationnel 'Convergence' Hainaut - FEDER
open 233.401.121,30 233.401.121,30
4 BE 2007BE162PO001 Programme opérationnel 'Compétitivité régionale et emploi' de la Région de Bruxelles-Capitale 'Cohésion et compétitivité territoriale' - FEDER
closed 5.637.188,00 5.637.188,00 10.710,66 €
5 BE 2007BE162PO003 Programme opérationnel 'Compétitivité régionale et emploi' - Wallonie (hors Hainaut ) - FEDER
pre-closure in pipeline
169.996.987,17 169.996.987,17 0,00 €
6 BG 2007BG161PO001 Operational Programme Regional Development pre-closed 33.000.506,19 33.000.506,19 0,00 €
7 BG 2007BG161PO003 Operational Programme Development of the Competitiveness of the Bulgarian Economy
pre-closed 349.005.353,31 349.005.353,31 0,00 €
8 CB 2007CB163PO064 Programme transfrontalier Grande Région closed 1.509.572,89 457.098,67 0,00 €
9 CY 2007CY16UPO001 Sustainable Development and Competitiveness CF+ERDF
closed 20.000.000,00 20.000.000,00 0,00 €
10 CZ 2007CZ161PO004 OP Podnikání a inovace open 163.458.035,47 124.617.060,25
11 CZ 2007CZ161PO010 ROP NUTS II Moravskoslezsko closed 19.575.684,48 19.575.684,48 0,00 €
12 CZ 2007CZ16UPO002 Integrovaný operační program pre-closed 24.368.769,09 24.368.769,09 0,00 €
13 DE 2007DE161PO001 Operationelles Programm EFRE Thüringen 2007 bis 2013
closed 167.538.691,66 167.538.691,66 0,00 €
14 DE 2007DE161PO002 Operationelles Programm EFRE Brandenburg 2007-2013
pre-closed 99.109.441,23 99.109.441,23 0,00 €
15 DE 2007DE161PO003 Operationelles Programm EFRE 2007 - 2013 Mecklenburg-Vorpommern
closed 41.390.221,93 41.390.221,93 0,00 €
16 DE 2007DE161PO004 Operationelles Programm EFRE Sachsen 2007-2013
open 81.046.046,55 78.677.621,55
17 DE 2007DE161PO006 Operationelles Programm EFRE Niedersachsen - Region Lüneburg 2007-2013
closed 16.000.000,00 16.000.000,00 0,00 €
18 DE 2007DE161PO007 Operationelles Programm EFRE Sachsen-Anhalt 2007-2013
open 403.120.644,92 403.120.644,92

regio_aar_2018_annexes
113
MS CCI OP
closure status on 31.12.2018
Financial engineering instruments (In EUR) Corrections made on eligible expenditure
for FEI Total Expenditure Public Contribution
19 DE 2007DE162PO001 Operationelles Programm EFRE Bayern 2007 - 2013
closed 102.223.352,97 87.223.352,97 0,00 €
20 DE 2007DE162PO003 Operationelles Programm EFRE Schleswig-Holstein 2007-2013
pre-closed 53.851.595,06 43.501.595,06 0,00 €
21 DE 2007DE162PO004 Operationelles Programm EFRE Berlin 2007-2013
pre-closed 222.850.534,55 222.850.534,55 0,00 €
22 DE 2007DE162PO005 Operationelles Programm EFRE Hessen 2007-2013
closed 57.908.777,34 57.908.777,34 0,00 €
23 DE 2007DE162PO007 Operationelles Programm EFRE Nordrhein-Westfalen 2007-2013
pre-closed 108.387.849,26 108.387.849,26 0,00 €
24 DE 2007DE162PO008 Operationelles Programm EFRE Baden-Württemberg 2007-2013
closed 1.650.000,00 1.650.000,00 0,00 €
25 DE 2007DE162PO009 Operationelles Programm EFRE Hamburg 2007-2013
closed 13.400.000,00 13.400.000,00 0,00 €
26 DE 2007DE162PO010 Operationelles Programm EFRE Niedersachsen (ohne Region Lüneburg) 2007-2013
closed 62.200.000,00 62.200.000,00 0,00 €
27 DE 2007DE162PO011 Operationelles Programm EFRE Rheinland-Pfalz 2007-2013
closed 28.658.055,13 28.658.055,13 0,00 €
28 DK 2007DK162PO001 Innovation og Viden closed 40.730.176,95 27.079.112,42 0,00 €
29 EE 2007EE161PO001 Operational Programme for the Development of Economic Environment
open 127.273.698,29 127.273.698,29
30 EE 2007EE161PO002 Operational Programme for the Development of Living Environment
open 49.736.539,73 49.736.539,73
31 ES 2007ES161PO001 Programa Operativo FEDER de la Región de Murcia
closed 7.064.916,21 7.064.916,21 0,00 €
32 ES 2007ES161PO002 Programa Operativo FEDER de Melilla closed 8.055,20 8.055,20 0,00 €
33 ES 2007ES161PO003 Programa Operativo FEDER de Ceuta closed 510.544,45 510.544,45 0,00 €
34 ES 2007ES161PO004 Programa Operativo FEDER de Asturias closed 738.910,99 738.910,99 0,00 €
35 ES 2007ES161PO005 Programa Operativo FEDER de Galicia closed 28.048.986,48 28.048.986,48 31.317,00 €
36 ES 2007ES161PO006 Programa Operativo FEDER de Extremadura closed 37.367.903,29 37.367.903,29 0,00 €
37 ES 2007ES161PO007 Programa Operativo FEDER de Castilla la Mancha
pre-closed 25.082.334,68 25.082.334,68 0,00 €
38 ES 2007ES161PO008 Programa Operativo FEDER de Andalucía pre-closed 195.101.724,02 195.101.724,02 6 810 848.97
39 ES 2007ES162PO006 Programa Operativo FEDER de Cataluña pre-closed 51.746.453,95 51.746.453,95 0,00 €
40 ES 2007ES162PO009 Programa Operativo FEDER de Castilla y León closed 8.222.594,76 8.222.594,76 0,00 €
41 ES 2007ES162PO010 Programa Operativo FEDER de la Comunitat Valenciana
pre-closed 14.038.449,63 14.038.449,63 0,00 €
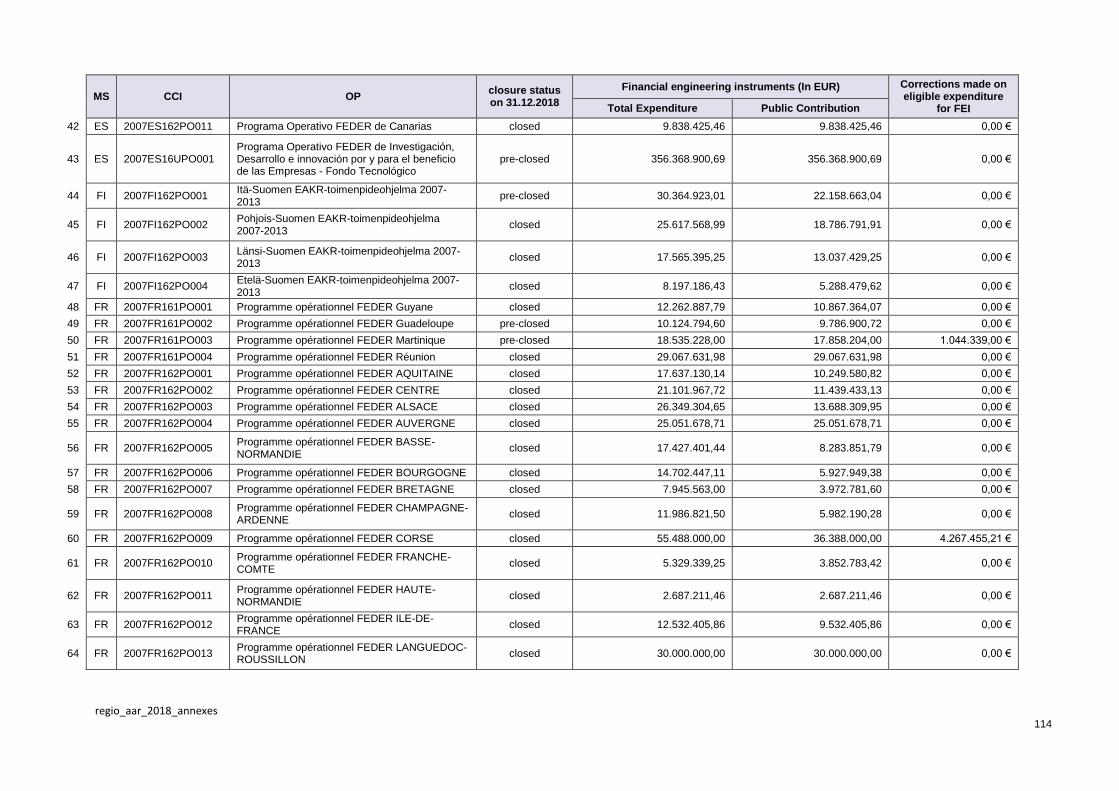
regio_aar_2018_annexes
114
MS CCI OP
closure status on 31.12.2018
Financial engineering instruments (In EUR) Corrections made on eligible expenditure
for FEI Total Expenditure Public Contribution
42 ES 2007ES162PO011 Programa Operativo FEDER de Canarias closed 9.838.425,46 9.838.425,46 0,00 €
43 ES 2007ES16UPO001 Programa Operativo FEDER de Investigación, Desarrollo e innovación por y para el beneficio de las Empresas - Fondo Tecnológico
pre-closed 356.368.900,69 356.368.900,69 0,00 €
44 FI 2007FI162PO001 Itä-Suomen EAKR-toimenpideohjelma 2007-2013
pre-closed 30.364.923,01 22.158.663,04 0,00 €
45 FI 2007FI162PO002 Pohjois-Suomen EAKR-toimenpideohjelma 2007-2013
closed 25.617.568,99 18.786.791,91 0,00 €
46 FI 2007FI162PO003 Länsi-Suomen EAKR-toimenpideohjelma 2007-2013
closed 17.565.395,25 13.037.429,25 0,00 €
47 FI 2007FI162PO004 Etelä-Suomen EAKR-toimenpideohjelma 2007-2013
closed 8.197.186,43 5.288.479,62 0,00 €
48 FR 2007FR161PO001 Programme opérationnel FEDER Guyane closed 12.262.887,79 10.867.364,07 0,00 €
49 FR 2007FR161PO002 Programme opérationnel FEDER Guadeloupe pre-closed 10.124.794,60 9.786.900,72 0,00 €
50 FR 2007FR161PO003 Programme opérationnel FEDER Martinique pre-closed 18.535.228,00 17.858.204,00 1.044.339,00 €
51 FR 2007FR161PO004 Programme opérationnel FEDER Réunion closed 29.067.631,98 29.067.631,98 0,00 €
52 FR 2007FR162PO001 Programme opérationnel FEDER AQUITAINE closed 17.637.130,14 10.249.580,82 0,00 €
53 FR 2007FR162PO002 Programme opérationnel FEDER CENTRE closed 21.101.967,72 11.439.433,13 0,00 €
54 FR 2007FR162PO003 Programme opérationnel FEDER ALSACE closed 26.349.304,65 13.688.309,95 0,00 €
55 FR 2007FR162PO004 Programme opérationnel FEDER AUVERGNE closed 25.051.678,71 25.051.678,71 0,00 €
56 FR 2007FR162PO005 Programme opérationnel FEDER BASSE-NORMANDIE
closed 17.427.401,44 8.283.851,79 0,00 €
57 FR 2007FR162PO006 Programme opérationnel FEDER BOURGOGNE closed 14.702.447,11 5.927.949,38 0,00 €
58 FR 2007FR162PO007 Programme opérationnel FEDER BRETAGNE closed 7.945.563,00 3.972.781,60 0,00 €
59 FR 2007FR162PO008 Programme opérationnel FEDER CHAMPAGNE-ARDENNE
closed 11.986.821,50 5.982.190,28 0,00 €
60 FR 2007FR162PO009 Programme opérationnel FEDER CORSE closed 55.488.000,00 36.388.000,00 4.267.455,21 €
61 FR 2007FR162PO010 Programme opérationnel FEDER FRANCHE-COMTE
closed 5.329.339,25 3.852.783,42 0,00 €
62 FR 2007FR162PO011 Programme opérationnel FEDER HAUTE-NORMANDIE
closed 2.687.211,46 2.687.211,46 0,00 €
63 FR 2007FR162PO012 Programme opérationnel FEDER ILE-DE-FRANCE
closed 12.532.405,86 9.532.405,86 0,00 €
64 FR 2007FR162PO013 Programme opérationnel FEDER LANGUEDOC-ROUSSILLON
closed 30.000.000,00 30.000.000,00 0,00 €
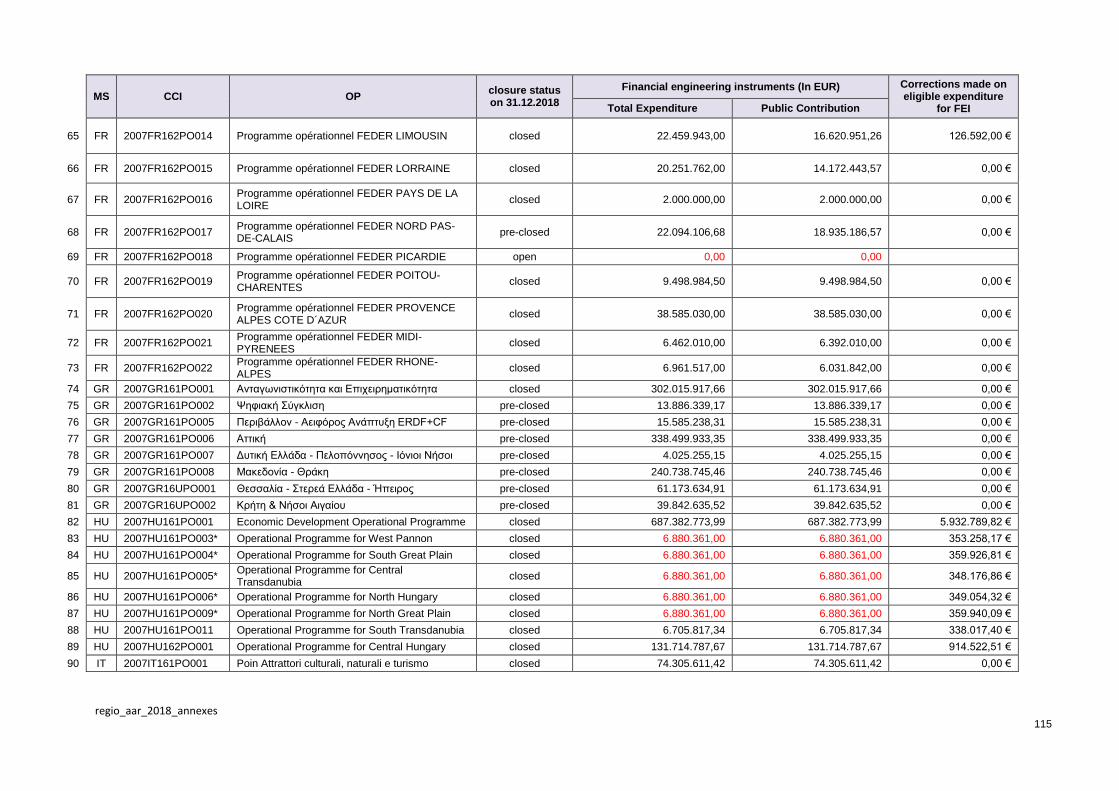
regio_aar_2018_annexes
115
MS CCI OP
closure status on 31.12.2018
Financial engineering instruments (In EUR) Corrections made on eligible expenditure
for FEI Total Expenditure Public Contribution
65 FR 2007FR162PO014 Programme opérationnel FEDER LIMOUSIN closed 22.459.943,00 16.620.951,26 126.592,00 €
66 FR 2007FR162PO015 Programme opérationnel FEDER LORRAINE closed 20.251.762,00 14.172.443,57 0,00 €
67 FR 2007FR162PO016 Programme opérationnel FEDER PAYS DE LA LOIRE
closed 2.000.000,00 2.000.000,00 0,00 €
68 FR 2007FR162PO017 Programme opérationnel FEDER NORD PAS-DE-CALAIS
pre-closed 22.094.106,68 18.935.186,57 0,00 €
69 FR 2007FR162PO018 Programme opérationnel FEDER PICARDIE open 0,00 0,00
70 FR 2007FR162PO019 Programme opérationnel FEDER POITOU-CHARENTES
closed 9.498.984,50 9.498.984,50 0,00 €
71 FR 2007FR162PO020 Programme opérationnel FEDER PROVENCE ALPES COTE D´AZUR
closed 38.585.030,00 38.585.030,00 0,00 €
72 FR 2007FR162PO021 Programme opérationnel FEDER MIDI-PYRENEES
closed 6.462.010,00 6.392.010,00 0,00 €
73 FR 2007FR162PO022 Programme opérationnel FEDER RHONE-ALPES
closed 6.961.517,00 6.031.842,00 0,00 €
74 GR 2007GR161PO001 Ανταγωνιστικότητα και Επιχειρηματικότητα closed 302.015.917,66 302.015.917,66 0,00 €
75 GR 2007GR161PO002 Ψηφιακή Σύγκλιση pre-closed 13.886.339,17 13.886.339,17 0,00 €
76 GR 2007GR161PO005 Περιβάλλον - Αειφόρος Ανάπτυξη ERDF+CF pre-closed 15.585.238,31 15.585.238,31 0,00 €
77 GR 2007GR161PO006 Αττική pre-closed 338.499.933,35 338.499.933,35 0,00 €
78 GR 2007GR161PO007 Δυτική Ελλάδα - Πελοπόννησος - Ιόνιοι Νήσοι pre-closed 4.025.255,15 4.025.255,15 0,00 €
79 GR 2007GR161PO008 Μακεδονία - Θράκη pre-closed 240.738.745,46 240.738.745,46 0,00 €
80 GR 2007GR16UPO001 Θεσσαλία - Στερεά Ελλάδα - Ήπειρος pre-closed 61.173.634,91 61.173.634,91 0,00 €
81 GR 2007GR16UPO002 Κρήτη & Νήσοι Αιγαίου pre-closed 39.842.635,52 39.842.635,52 0,00 €
82 HU 2007HU161PO001 Economic Development Operational Programme closed 687.382.773,99 687.382.773,99 5.932.789,82 €
83 HU 2007HU161PO003* Operational Programme for West Pannon closed 6.880.361,00 6.880.361,00 353.258,17 €
84 HU 2007HU161PO004* Operational Programme for South Great Plain closed 6.880.361,00 6.880.361,00 359.926,81 €
85 HU 2007HU161PO005* Operational Programme for Central Transdanubia
closed 6.880.361,00 6.880.361,00 348.176,86 €
86 HU 2007HU161PO006* Operational Programme for North Hungary closed 6.880.361,00 6.880.361,00 349.054,32 €
87 HU 2007HU161PO009* Operational Programme for North Great Plain closed 6.880.361,00 6.880.361,00 359.940,09 €
88 HU 2007HU161PO011 Operational Programme for South Transdanubia closed 6.705.817,34 6.705.817,34 338.017,40 €
89 HU 2007HU162PO001 Operational Programme for Central Hungary closed 131.714.787,67 131.714.787,67 914.522,51 €
90 IT 2007IT161PO001 Poin Attrattori culturali, naturali e turismo closed 74.305.611,42 74.305.611,42 0,00 €

regio_aar_2018_annexes
116
MS CCI OP
closure status on 31.12.2018
Financial engineering instruments (In EUR) Corrections made on eligible expenditure
for FEI Total Expenditure Public Contribution
91 IT 2007IT161PO002 Programma Operativo Interregionale "Energie rinnovabili e risparmio energetico" 2007-2013
open 77.838.785,41 77.838.785,41
92 IT 2007IT161PO006 Pon Ricerca e competitivita' - Riprogrammazione - 30 ottobre 2014
open 1.454.500.000,00 1.454.500.000,00
93 IT 2007IT161PO008 POR Calabria FESR 2007 - 2013 open 77.100.923,59 77.100.923,59
94 IT 2007IT161PO009 Por Campania FESR open 416.892.111,05 416.892.111,05
95 IT 2007IT161PO010 Programma Operativo FESR Puglia 2007-2013 open 283.376.135,98 283.376.135,98
96 IT 2007IT161PO011 Por Sicilia FESR open 220.715.577,58 220.715.577,58
97 IT 2007IT161PO012 Por Basilicata ST FESR open 21.999.999,18 21.999.999,18
98 IT 2007IT162PO001 Por Abruzzo FESR 2007-2013 riprogrammazione open 39.565.717,88 39.565.717,88
99 IT 2007IT162PO002 Por Emilia Romagna FESR Versione approvata dal Comitato di Sorveglianza 2015
closed 42.314.098,76 42.314.098,76 0,00 €
100 IT 2007IT162PO003 Por Friuli Venezia Giulia FESR versione 6 open 21.896.131,35 21.896.131,35
101 IT 2007IT162PO004 Por Lazio FESR 2007-2013 open 153.942.433,08 153.942.433,08
102 IT 2007IT162PO005 Por Liguria FESR closed 4.242.427.317,00 4.242.427.317,00 0,00 €
103 IT 2007IT162PO006 POR FESR 2007-2013 Lombardia closed 134.755.617,62 134.755.617,62 0,00 €
104 IT 2007IT162PO007 Por Marche FESR closed 16.958.876,37 16.958.876,37 274.331,74 €
105 IT 2007IT162PO008 POR Molise FESR Versione 5 - dicembre 2015 open 35.582.974,60 35.582.974,60
106 IT 2007IT162PO011 PO Regione Piemonte FESR - versione 6 closed 71.301.148,80 71.301.148,80 0,00 €
107 IT 2007IT162PO012 POR Toscana CReO(vers.n.7-Settembre2015) closed 208.497.080,05 208.497.080,05 0,00 €
108 IT 2007IT162PO013 Por Umbria FESR closed 32.204.609,07 32.204.609,07 0,00 €
109 IT 2007IT162PO015 Por Veneto FESR open 140.698.700,27 140.698.700,27
110 IT 2007IT162PO016 Por Sardegna ST FESR open 367.264.806,98 367.264.806,98
111 LT 2007LT161PO001 2007-2013 m. Sanglaudos skatinimo veiksmų programa - ERDF + CF
closed 173.420.793,91 173.420.793,91 0,00 €
112 LT 2007LT161PO002 2007-2013 m. Ekonomikos augimo veiksmų programa - ERDF + CF
closed 265.838.739,57 265.838.739,57 0,00 €
113 LV 2007LV161PO001 Entrepreneurship and Innovations pre-closed 192.490.329,87 161.933.103,00 0,00 €
114 MT 2007MT161PO001 Operational Programme I - Investing in Competitiveness for a Better Quality of Life
open 12.000.000,00 12.000.000,00
115 NL 2007NL162PO001 Operationeel Programma Noord 2007-2013 closed 0 0 0,00 €
116 NL 2007NL162PO002 Operationeel Programma West 2007-2013 closed 30.259.562,42 30.114.937,67 0,00 €
117 NL 2007NL162PO004 Operationeel Programma Oost 2007-2013 closed 17.636.364,00 16.636.364,00 0,00 €
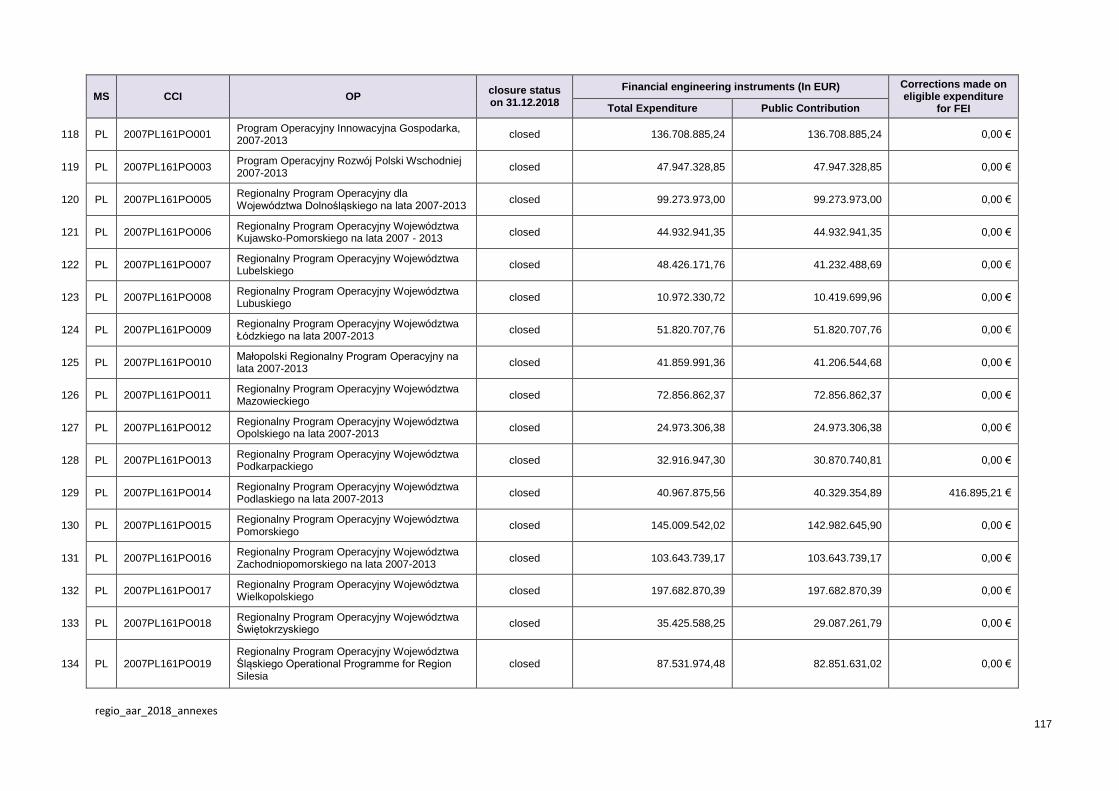
regio_aar_2018_annexes
117
MS CCI OP
closure status on 31.12.2018
Financial engineering instruments (In EUR) Corrections made on eligible expenditure
for FEI Total Expenditure Public Contribution
118 PL 2007PL161PO001 Program Operacyjny Innowacyjna Gospodarka, 2007-2013
closed 136.708.885,24 136.708.885,24 0,00 €
119 PL 2007PL161PO003 Program Operacyjny Rozwój Polski Wschodniej 2007-2013
closed 47.947.328,85 47.947.328,85 0,00 €
120 PL 2007PL161PO005 Regionalny Program Operacyjny dla Województwa Dolnośląskiego na lata 2007-2013
closed 99.273.973,00 99.273.973,00 0,00 €
121 PL 2007PL161PO006 Regionalny Program Operacyjny Województwa Kujawsko-Pomorskiego na lata 2007 - 2013
closed 44.932.941,35 44.932.941,35 0,00 €
122 PL 2007PL161PO007 Regionalny Program Operacyjny Województwa Lubelskiego
closed 48.426.171,76 41.232.488,69 0,00 €
123 PL 2007PL161PO008 Regionalny Program Operacyjny Województwa Lubuskiego
closed 10.972.330,72 10.419.699,96 0,00 €
124 PL 2007PL161PO009 Regionalny Program Operacyjny Województwa Łódzkiego na lata 2007-2013
closed 51.820.707,76 51.820.707,76 0,00 €
125 PL 2007PL161PO010 Małopolski Regionalny Program Operacyjny na lata 2007-2013
closed 41.859.991,36 41.206.544,68 0,00 €
126 PL 2007PL161PO011 Regionalny Program Operacyjny Województwa Mazowieckiego
closed 72.856.862,37 72.856.862,37 0,00 €
127 PL 2007PL161PO012 Regionalny Program Operacyjny Województwa Opolskiego na lata 2007-2013
closed 24.973.306,38 24.973.306,38 0,00 €
128 PL 2007PL161PO013 Regionalny Program Operacyjny Województwa Podkarpackiego
closed 32.916.947,30 30.870.740,81 0,00 €
129 PL 2007PL161PO014 Regionalny Program Operacyjny Województwa Podlaskiego na lata 2007-2013
closed 40.967.875,56 40.329.354,89 416.895,21 €
130 PL 2007PL161PO015 Regionalny Program Operacyjny Województwa Pomorskiego
closed 145.009.542,02 142.982.645,90 0,00 €
131 PL 2007PL161PO016 Regionalny Program Operacyjny Województwa Zachodniopomorskiego na lata 2007-2013
closed 103.643.739,17 103.643.739,17 0,00 €
132 PL 2007PL161PO017 Regionalny Program Operacyjny Województwa Wielkopolskiego
closed 197.682.870,39 197.682.870,39 0,00 €
133 PL 2007PL161PO018 Regionalny Program Operacyjny Województwa Świętokrzyskiego
closed 35.425.588,25 29.087.261,79 0,00 €
134 PL 2007PL161PO019 Regionalny Program Operacyjny Województwa Śląskiego Operational Programme for Region Silesia
closed 87.531.974,48 82.851.631,02 0,00 €

regio_aar_2018_annexes
118
MS CCI OP
closure status on 31.12.2018
Financial engineering instruments (In EUR) Corrections made on eligible expenditure
for FEI Total Expenditure Public Contribution
135 PL 2007PL161PO020 Regionalny Program Operacyjny Województwa Warmińsko-Mazurskiego
closed 30.567.675,63 30.567.675,63 0,00 €
136 PT 2007PT161PO001 PO Factores de Competitividade 2007-2013 closed 418.406.877,32 262.810.747,69 0,00 €
137 PT 2007PT161PO002 PO Regional do Norte 2007-2013 closed 67.582.418,00 67.582.418,00 0,00 €
138 PT 2007PT161PO003 PO Regional do Centro 2007-2013 closed 46.570.471,00 46.570.471,00 0,00 €
139 PT 2007PT161PO004 PO Regional do Alentejo 2007-2013 closed 26.566.087,00 26.566.087,00 0,00 €
140 PT 2007PT161PO005 PO Regional do Algarve 2007-2013 closed 30.401.898,91 23.865.898,91 0,00 €
141 PT 2007PT161PO006 Programa Operacional dos Açores para a Convergência 2007-2013
closed 2.745.343,52 2.745.343,52 0,00 €
142 PT 2007PT162PO001 PO Regional de Lisboa 2007-2013 closed 45.923.392,58 34.380.392,58 0,00 €
143 PT 2007PT162PO002 PO Valorização do Potencial Económico e Coesão Territorial da RAM 2007-2013
closed 5.351.747,13 5.351.747,13 2.062.190,60 €
144 RO 2007RO161PO002 Sectoral Operational Programme Increase of Economic Competitiveness
open 225.000.000,00 225.000.000,00
145 SE 2007SE162PO001 Skåne-Blekinge closed 12.825.617,42 11.103.481,94 0,00 €
146 SE 2007SE162PO002 Småland och Öarna closed 11.420.018,41 11.373.250,99 0,00 €
147 SE 2007SE162PO003 Västsverige closed 24.270.534,20 22.365.725,37 0,00 €
148 SE 2007SE162PO004 Östra Mellansverige closed 16.267.905,71 16.267.905,04 0,00 €
149 SE 2007SE162PO005 Stockholm closed 12.897.393,71 12.896.840,15 0,00 €
150 SE 2007SE162PO006 Norra Mellansverige closed 14.446.543,14 14.446.543,14 0,00 €
151 SE 2007SE162PO007 Mellersta Norrland closed 27.283.864,66 27.283.864,66 0,00 €
152 SE 2007SE162PO008 Övre Norrland closed 16.330.461,89 14.310.122,51 0,00 €
153 SI 2007SI161PO001 Operativni program krepitve regionalnih razvojnih potencialov za obdobje 2007 - 2013
closed 188.733.414,16 188.733.414,16 365.163,77 €
154 SK 2007SK161PO003 Regional Operational Programme pre-closed 164.986.660,00 164.986.660,00 0,00 €
155 SK 2007SK161PO006 OP Competitiveness and Economic Growth pre-closed 150.722.435,33 150.722.435,33 13.483,96 €
156 SK 2007SK162PO001 OP Bratislava Region pre-closed 24.061.819,25 24.061.819,25 1.107.031,44 €
157 SK 2007SK16UPO001 OP Research and Development pre-closed 22.700.896,20 22.700.896,20 59,02 €
158 UK 2007UK161PO001 Highlands and Islands of Scotland ERDF phasing out Convergence programme
closed 5.809.581,41 5.809.581,41 0,00 €
159 UK 2007UK161PO002 West Wales and the Valleys ERDF Convergence programme
pre-closed 104.745.368,38 52.372.684,18 0,00 €
160 UK 2007UK161PO003 Cornwall and the Isles of Scilly ERDF Convergence programme
pre-closed 5.381.551,00 5.381.551,00 0,00 €

regio_aar_2018_annexes
119
MS CCI OP
closure status on 31.12.2018
Financial engineering instruments (In EUR) Corrections made on eligible expenditure
for FEI Total Expenditure Public Contribution
161 UK 2007UK162PO001 Lowlands and Uplands of Scotland ERDF Regional Competitiveness and Employment programme
pre-closed 204.937.023,09 204.937.023,09 36.333.478,97 €
162 UK 2007UK162PO002 South East England ERDF Regional Competitiveness and Employment programme
closed 3.596.852,47 3.596.852,47 0,00 €
163 UK 2007UK162PO003 Northern Ireland ERDF Regional Competitiveness and Employment programme
closed 10,981,374 10,981,374 0,00 €
164 UK 2007UK162PO004 East of England ERDF Regional Competitiveness and Employment programme
closed 82.419.003,60 82.419.003,60 0,00 €
165 UK 2007UK162PO005 North East England ERDF Regional Competitiveness and Employment programme
closed 206.725.905,00 206.725.905,00 0,00 €
166 UK 2007UK162PO006 London England ERDF Regional Competitiveness and Employment Programme
closed 158.445.486,32 158.445.486,32 0,00 €
167 UK 2007UK162PO007 West Midlands England ERDF Regional Competitiveness and Employment programme
open 93.786.335,24 93.786.335,24 0,00 €
168 UK 2007UK162PO008 North West England ERDF Regional Competitiveness and Employment Operational Programme
pre-closed 353.092.877,34 353.092.877,34 0,00 €
169 UK 2007UK162PO009 Yorkshire and Humberside England ERDF Regional Competitiveness and Employment programme
closed 230.305.664,06 230.305.664,06 0,00 €
170 UK 2007UK162PO010 East Midlands England ERDF Regional Competitiveness and Employment programme
closed 5.055.625,78 5.055.625,78 0,00 €
171 UK 2007UK162PO011 South West England ERDF Regional Competitiveness and Employment programme
closed 8.182.676,44 8.182.676,44 0,00 €
172 UK 2007UK162PO012 East Wales ERDF Regional competitiveness and Employment programme
pre-closed 65.147.672,10 38.130.776,58 0,00 €
TOTAL 19.017.498.370,18 18.491.388.357,22 55.008.734,56
* 5 OPs contributed to 1 instrument with the same amounts
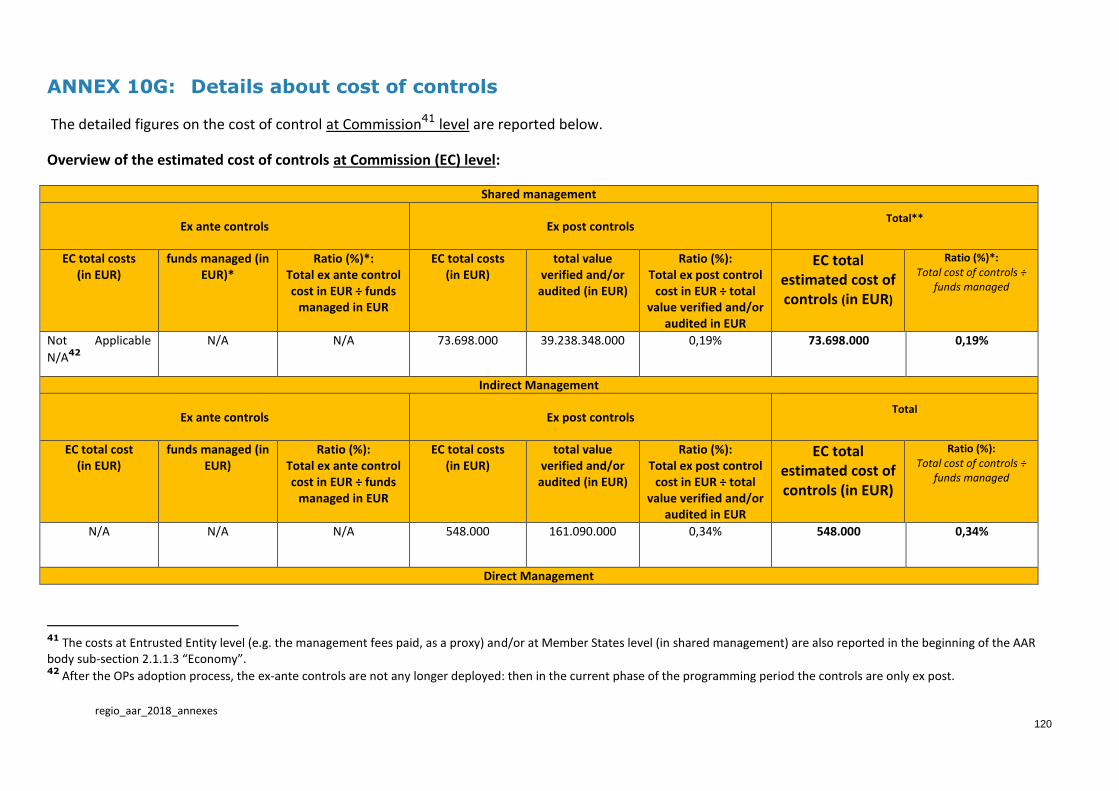
regio_aar_2018_annexes
120
ANNEX 10G: Details about cost of controls
The detailed figures on the cost of control at Commission41 level are reported below.
Overview of the estimated cost of controls at Commission (EC) level:
Shared management
Ex ante controls Ex post controls Total**
EC total costs (in EUR)
funds managed (in EUR)*
Ratio (%)*: Total ex ante control cost in EUR ÷ funds
managed in EUR
EC total costs (in EUR)
total value verified and/or
audited (in EUR)
Ratio (%): Total ex post control
cost in EUR ÷ total value verified and/or
audited in EUR
EC total estimated cost of controls (in EUR)
Ratio (%)*: Total cost of controls ÷
funds managed
Not Applicable
N/A42
N/A N/A 73.698.000 39.238.348.000 0,19% 73.698.000 0,19%
Indirect Management
Ex ante controls Ex post controls Total
EC total cost (in EUR)
funds managed (in EUR)
Ratio (%): Total ex ante control cost in EUR ÷ funds
managed in EUR
EC total costs (in EUR)
total value verified and/or
audited (in EUR)
Ratio (%): Total ex post control
cost in EUR ÷ total value verified and/or
audited in EUR
EC total estimated cost of controls (in EUR)
Ratio (%): Total cost of controls ÷
funds managed
N/A N/A N/A 548.000 161.090.000 0,34% 548.000 0,34%
Direct Management
41 The costs at Entrusted Entity level (e.g. the management fees paid, as a proxy) and/or at Member States level (in shared management) are also reported in the beginning of the AAR body sub-section 2.1.1.3 “Economy”. 42 After the OPs adoption process, the ex-ante controls are not any longer deployed: then in the current phase of the programming period the controls are only ex post.
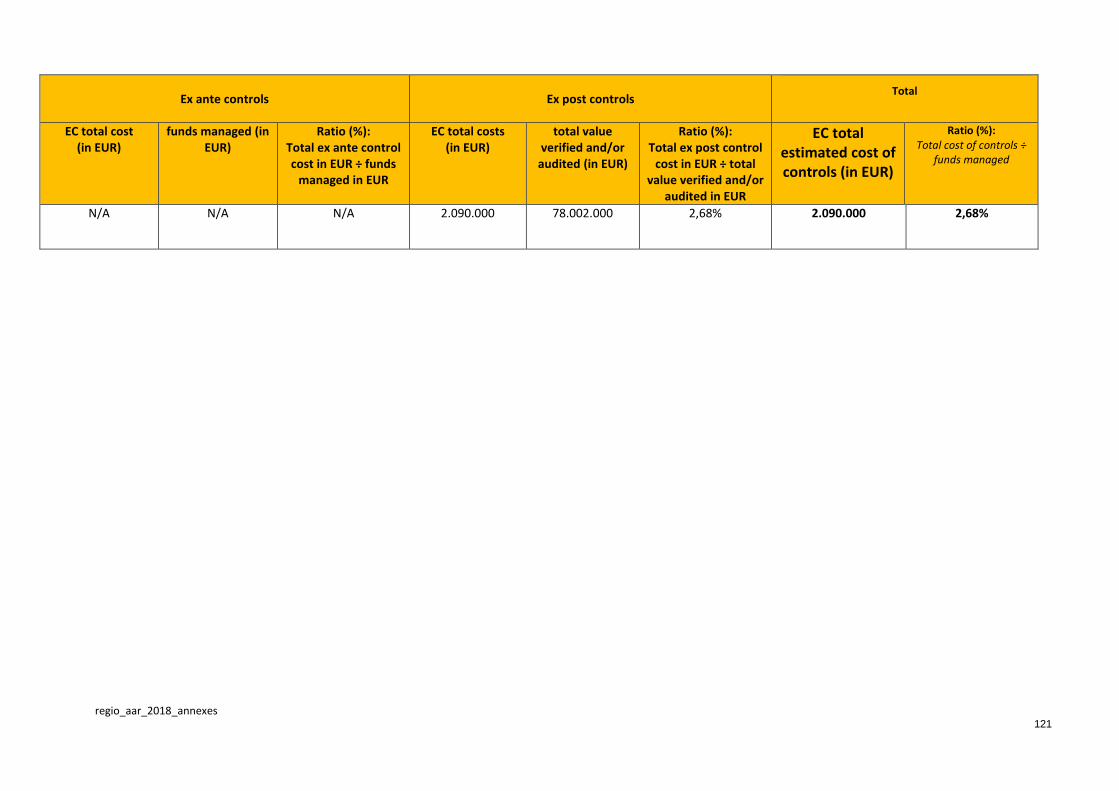
regio_aar_2018_annexes
121
Ex ante controls Ex post controls Total
EC total cost (in EUR)
funds managed (in EUR)
Ratio (%): Total ex ante control cost in EUR ÷ funds
managed in EUR
EC total costs (in EUR)
total value verified and/or
audited (in EUR)
Ratio (%): Total ex post control
cost in EUR ÷ total value verified and/or
audited in EUR
EC total estimated cost of controls (in EUR)
Ratio (%): Total cost of controls ÷
funds managed
N/A N/A N/A 2.090.000 78.002.000 2,68% 2.090.000 2,68%
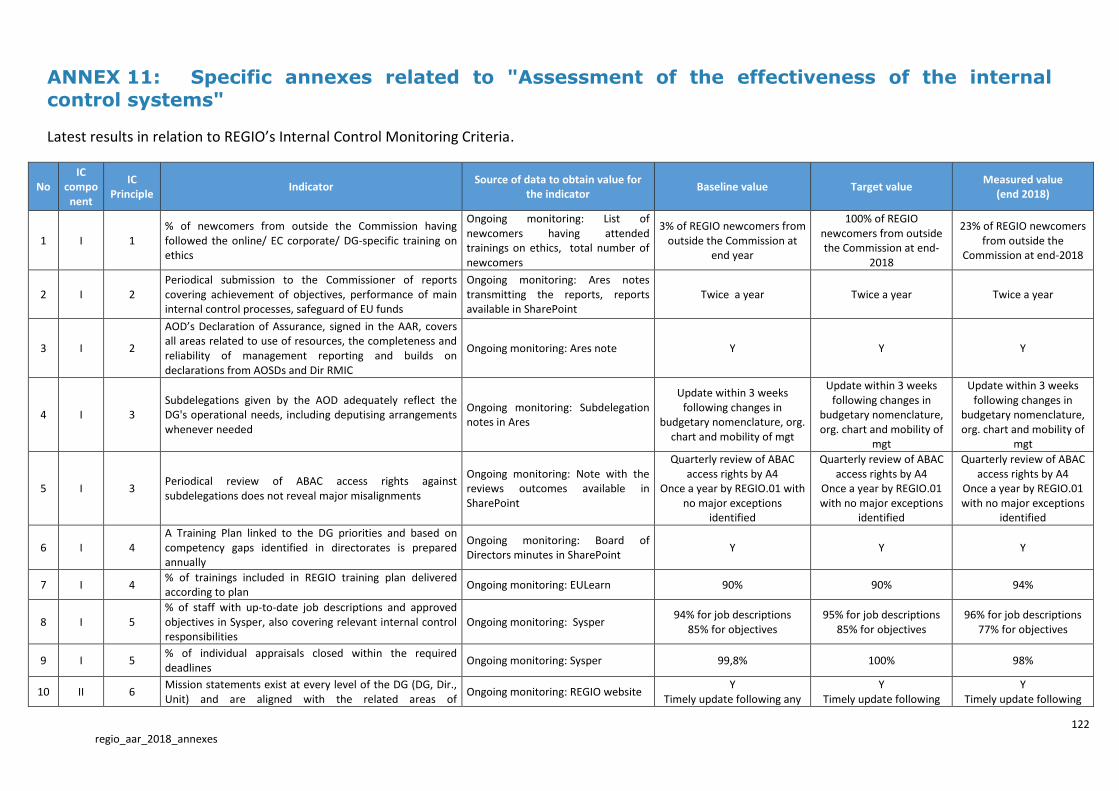
122 regio_aar_2018_annexes
ANNEX 11: Specific annexes related to "Assessment of the effectiveness of the internal control systems"
Latest results in relation to REGIO’s Internal Control Monitoring Criteria.
No IC
compo nent
IC Principle
Indicator Source of data to obtain value for
the indicator Baseline value Target value
Measured value (end 2018)
1 I 1 % of newcomers from outside the Commission having followed the online/ EC corporate/ DG-specific training on ethics
Ongoing monitoring: List of newcomers having attended trainings on ethics, total number of newcomers
3% of REGIO newcomers from outside the Commission at
end year
100% of REGIO newcomers from outside the Commission at end-
2018
23% of REGIO newcomers from outside the
Commission at end-2018
2 I 2 Periodical submission to the Commissioner of reports covering achievement of objectives, performance of main internal control processes, safeguard of EU funds
Ongoing monitoring: Ares notes transmitting the reports, reports available in SharePoint
Twice a year Twice a year Twice a year
3 I 2
AOD’s Declaration of Assurance, signed in the AAR, covers all areas related to use of resources, the completeness and reliability of management reporting and builds on declarations from AOSDs and Dir RMIC
Ongoing monitoring: Ares note Y Y Y
4 I 3 Subdelegations given by the AOD adequately reflect the DG's operational needs, including deputising arrangements whenever needed
Ongoing monitoring: Subdelegation notes in Ares
Update within 3 weeks following changes in
budgetary nomenclature, org. chart and mobility of mgt
Update within 3 weeks following changes in
budgetary nomenclature, org. chart and mobility of
mgt
Update within 3 weeks following changes in
budgetary nomenclature, org. chart and mobility of
mgt
5 I 3 Periodical review of ABAC access rights against subdelegations does not reveal major misalignments
Ongoing monitoring: Note with the reviews outcomes available in SharePoint
Quarterly review of ABAC access rights by A4
Once a year by REGIO.01 with no major exceptions
identified
Quarterly review of ABAC access rights by A4
Once a year by REGIO.01 with no major exceptions
identified
Quarterly review of ABAC access rights by A4
Once a year by REGIO.01 with no major exceptions
identified
6 I 4 A Training Plan linked to the DG priorities and based on competency gaps identified in directorates is prepared annually
Ongoing monitoring: Board of Directors minutes in SharePoint
Y Y Y
7 I 4 % of trainings included in REGIO training plan delivered according to plan
Ongoing monitoring: EULearn 90% 90% 94%
8 I 5 % of staff with up-to-date job descriptions and approved objectives in Sysper, also covering relevant internal control responsibilities
Ongoing monitoring: Sysper 94% for job descriptions
85% for objectives 95% for job descriptions
85% for objectives 96% for job descriptions
77% for objectives
9 I 5 % of individual appraisals closed within the required deadlines
Ongoing monitoring: Sysper 99,8% 100% 98%
10 II 6 Mission statements exist at every level of the DG (DG, Dir., Unit) and are aligned with the related areas of
Ongoing monitoring: REGIO website Y
Timely update following any Y
Timely update following Y
Timely update following
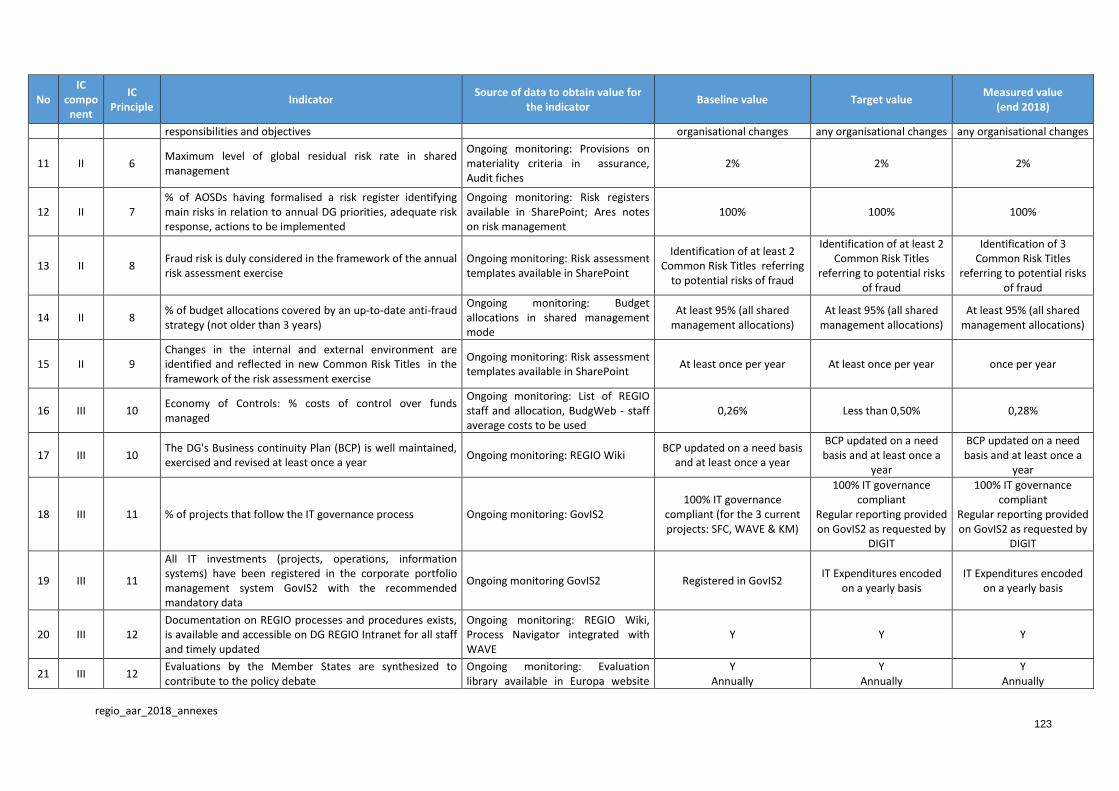
regio_aar_2018_annexes
123
No IC
compo nent
IC Principle
Indicator Source of data to obtain value for
the indicator Baseline value Target value
Measured value (end 2018)
responsibilities and objectives organisational changes any organisational changes any organisational changes
11 II 6 Maximum level of global residual risk rate in shared management
Ongoing monitoring: Provisions on materiality criteria in assurance, Audit fiches
2% 2% 2%
12 II 7 % of AOSDs having formalised a risk register identifying main risks in relation to annual DG priorities, adequate risk response, actions to be implemented
Ongoing monitoring: Risk registers available in SharePoint; Ares notes on risk management
100% 100% 100%
13 II 8 Fraud risk is duly considered in the framework of the annual risk assessment exercise
Ongoing monitoring: Risk assessment templates available in SharePoint
Identification of at least 2 Common Risk Titles referring
to potential risks of fraud
Identification of at least 2 Common Risk Titles
referring to potential risks of fraud
Identification of 3 Common Risk Titles
referring to potential risks of fraud
14 II 8 % of budget allocations covered by an up-to-date anti-fraud strategy (not older than 3 years)
Ongoing monitoring: Budget allocations in shared management mode
At least 95% (all shared management allocations)
At least 95% (all shared management allocations)
At least 95% (all shared management allocations)
15 II 9 Changes in the internal and external environment are identified and reflected in new Common Risk Titles in the framework of the risk assessment exercise
Ongoing monitoring: Risk assessment templates available in SharePoint
At least once per year At least once per year once per year
16 III 10 Economy of Controls: % costs of control over funds managed
Ongoing monitoring: List of REGIO staff and allocation, BudgWeb - staff average costs to be used
0,26% Less than 0,50% 0,28%
17 III 10 The DG's Business continuity Plan (BCP) is well maintained, exercised and revised at least once a year
Ongoing monitoring: REGIO Wiki BCP updated on a need basis
and at least once a year
BCP updated on a need basis and at least once a
year
BCP updated on a need basis and at least once a
year
18 III 11 % of projects that follow the IT governance process Ongoing monitoring: GovIS2 100% IT governance
compliant (for the 3 current projects: SFC, WAVE & KM)
100% IT governance compliant
Regular reporting provided on GovIS2 as requested by
DIGIT
100% IT governance compliant
Regular reporting provided on GovIS2 as requested by
DIGIT
19 III 11
All IT investments (projects, operations, information systems) have been registered in the corporate portfolio management system GovIS2 with the recommended mandatory data
Ongoing monitoring GovIS2 Registered in GovIS2 IT Expenditures encoded
on a yearly basis IT Expenditures encoded
on a yearly basis
20 III 12 Documentation on REGIO processes and procedures exists, is available and accessible on DG REGIO Intranet for all staff and timely updated
Ongoing monitoring: REGIO Wiki, Process Navigator integrated with WAVE
Y Y Y
21 III 12 Evaluations by the Member States are synthesized to contribute to the policy debate
Ongoing monitoring: Evaluation library available in Europa website
Y Annually
Y Annually
Y Annually
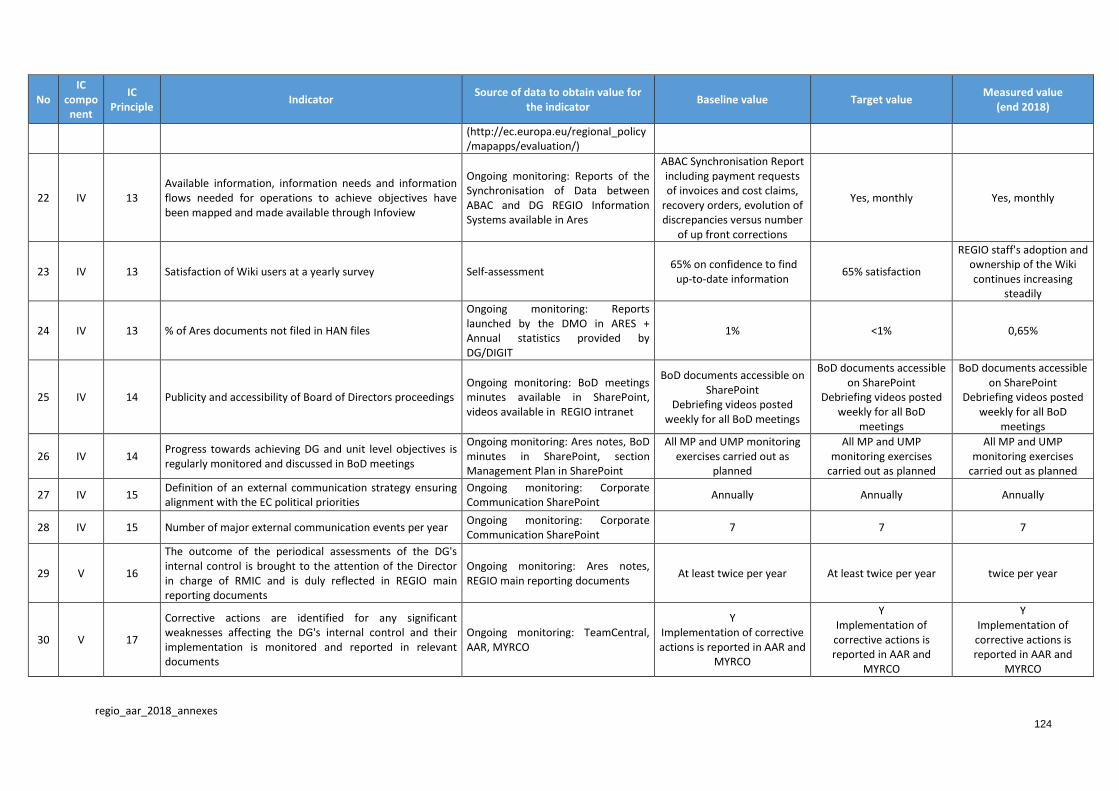
regio_aar_2018_annexes
124
No IC
compo nent
IC Principle
Indicator Source of data to obtain value for
the indicator Baseline value Target value
Measured value (end 2018)
(http://ec.europa.eu/regional_policy/mapapps/evaluation/)
22 IV 13 Available information, information needs and information flows needed for operations to achieve objectives have been mapped and made available through Infoview
Ongoing monitoring: Reports of the Synchronisation of Data between ABAC and DG REGIO Information Systems available in Ares
ABAC Synchronisation Report including payment requests of invoices and cost claims,
recovery orders, evolution of discrepancies versus number
of up front corrections
Yes, monthly Yes, monthly
23 IV 13 Satisfaction of Wiki users at a yearly survey Self-assessment 65% on confidence to find
up-to-date information 65% satisfaction
REGIO staff's adoption and ownership of the Wiki continues increasing
steadily
24 IV 13 % of Ares documents not filed in HAN files
Ongoing monitoring: Reports launched by the DMO in ARES + Annual statistics provided by DG/DIGIT
1% <1% 0,65%
25 IV 14 Publicity and accessibility of Board of Directors proceedings Ongoing monitoring: BoD meetings minutes available in SharePoint, videos available in REGIO intranet
BoD documents accessible on SharePoint
Debriefing videos posted weekly for all BoD meetings
BoD documents accessible on SharePoint
Debriefing videos posted weekly for all BoD
meetings
BoD documents accessible on SharePoint
Debriefing videos posted weekly for all BoD
meetings
26 IV 14 Progress towards achieving DG and unit level objectives is regularly monitored and discussed in BoD meetings
Ongoing monitoring: Ares notes, BoD minutes in SharePoint, section Management Plan in SharePoint
All MP and UMP monitoring exercises carried out as
planned
All MP and UMP monitoring exercises
carried out as planned
All MP and UMP monitoring exercises
carried out as planned
27 IV 15 Definition of an external communication strategy ensuring alignment with the EC political priorities
Ongoing monitoring: Corporate Communication SharePoint
Annually Annually Annually
28 IV 15 Number of major external communication events per year Ongoing monitoring: Corporate Communication SharePoint
7 7 7
29 V 16
The outcome of the periodical assessments of the DG's internal control is brought to the attention of the Director in charge of RMIC and is duly reflected in REGIO main reporting documents
Ongoing monitoring: Ares notes, REGIO main reporting documents
At least twice per year At least twice per year twice per year
30 V 17
Corrective actions are identified for any significant weaknesses affecting the DG's internal control and their implementation is monitored and reported in relevant documents
Ongoing monitoring: TeamCentral, AAR, MYRCO
Y Implementation of corrective actions is reported in AAR and
MYRCO
Y Implementation of corrective actions is reported in AAR and
MYRCO
Y Implementation of corrective actions is reported in AAR and
MYRCO

125 regio_aar_2018_annexes
ANNEX 12A: Performance against Operational Priorities as per Management Plan 2018
REGIO Indicator/target 2018 Status as of end-Dec '18
Reported results and risks (end-December 2018)
Planned actions (end-December 2018)
1. To deliver jobs, growth and investment
1.1 Support an accelerated delivery of the 2014-2020 programmes objectives by Member States ensuring quality of investment REGIO 1. a Ensure active support, monitoring and follow up of programme implementation. (Target: for all operational programmes, participation in monitoring committees and review meetings, Annual Implementation Reports (AIRs))
At the end of 2018, the majority of the AIRs (96%) have been received and accepted. The AIR for one programme (ETC) is still not admissible. Preparation for the 2019 exercise is ongoing. The support, monitoring and follow up of the programme implementation have been done during the monitoring committees by the geo units,(taking place few times per year for each of the 295 programs) and during the monitoring of the AIRs.
Prepare the 2019 exercise and follow the roadmap in order to review and update the process. The challenges for this year are the performance framework, the full report, and synchronisation with the progress report
REGIO 1. b Rolling out of specific actions supporting implementation efforts in High risk programmes. (Target: Timely implementation of action plans for programmes at risk)
Board approved a corrigendum (not update) of the list of programmes for closer monitoring on 26 November 2018 (ref. Ares(2018)6535390), within the Implementation Report No. 15. At the same time, GUs defined/updated actions plans for the identified programmes, included in the Annex 4 of the report (presented at the Board on 26 November 2018).
Continue updating the list of programmes at risk once the next update of financial data is received, taking into account also the update of the decommitment risk. Propose for Board approval the updated list and request GUs to define/update action plans for the identified programmes in the spring.
REGIO 2. Ensure close and structured scrutiny of the performance of programmes in preparation of the 2019 Performance Review (Target: Assessment of programme performance following review of AIRs, building on the scorecard of progress against the Performance Framework, and appropriate follow-up; Outcome of assessment to be reflected in the DG's list of programmes at risk monitored throughout the year).
Board approved a corrigendum (not update) of the list of programmes for closer monitoring on 26 November 2018 (ref. Ares(2018)6535390), within the Implementation Report No. 15. At the same time, GUs defined/updated actions plans for the identified programmes, included in the Annex 4 of the same report (presented at the Board on 26 November 2018).
Continue updating the list of programmes at risk once the next update of financial data is received, taking into account also the update of the decommitment risk. Propose for Board approval the updated list and request GUs to define/update action plans for the identified programmes in the spring.
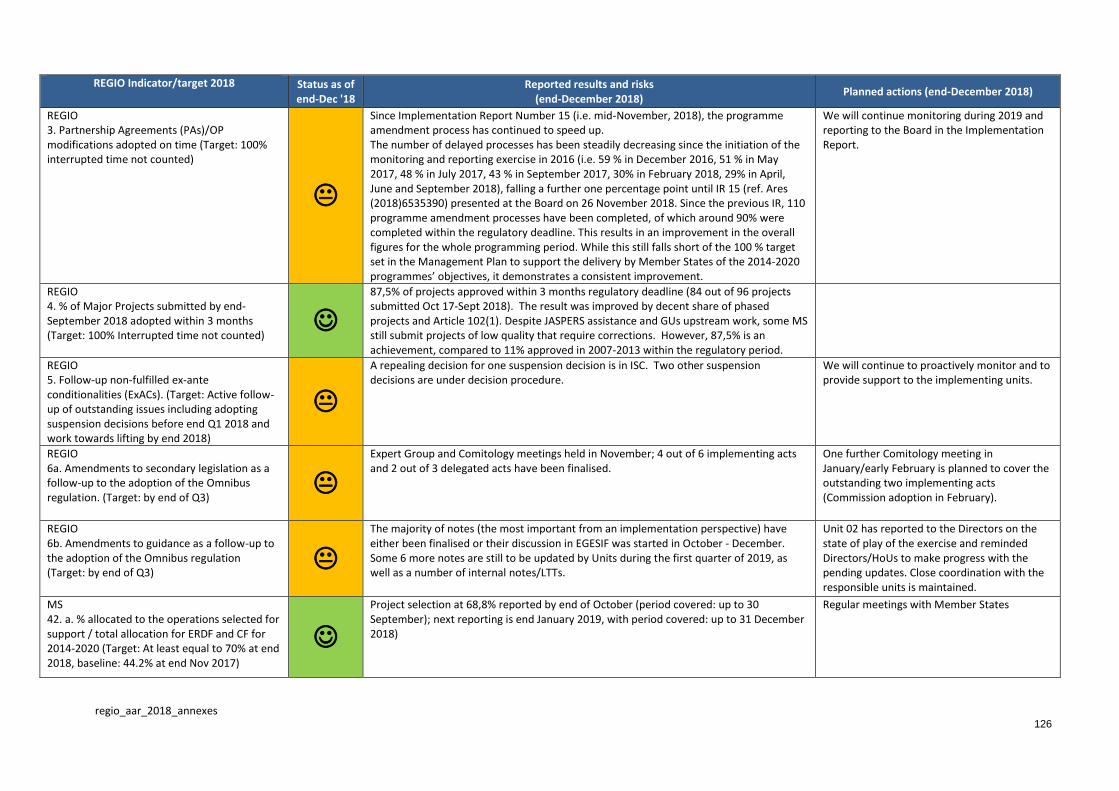
regio_aar_2018_annexes
126
REGIO Indicator/target 2018 Status as of end-Dec '18
Reported results and risks (end-December 2018)
Planned actions (end-December 2018)
REGIO 3. Partnership Agreements (PAs)/OP modifications adopted on time (Target: 100% interrupted time not counted)
Since Implementation Report Number 15 (i.e. mid-November, 2018), the programme amendment process has continued to speed up. The number of delayed processes has been steadily decreasing since the initiation of the monitoring and reporting exercise in 2016 (i.e. 59 % in December 2016, 51 % in May 2017, 48 % in July 2017, 43 % in September 2017, 30% in February 2018, 29% in April, June and September 2018), falling a further one percentage point until IR 15 (ref. Ares (2018)6535390) presented at the Board on 26 November 2018. Since the previous IR, 110 programme amendment processes have been completed, of which around 90% were completed within the regulatory deadline. This results in an improvement in the overall figures for the whole programming period. While this still falls short of the 100 % target set in the Management Plan to support the delivery by Member States of the 2014-2020 programmes’ objectives, it demonstrates a consistent improvement.
We will continue monitoring during 2019 and reporting to the Board in the Implementation Report.
REGIO 4. % of Major Projects submitted by end-September 2018 adopted within 3 months (Target: 100% Interrupted time not counted)
87,5% of projects approved within 3 months regulatory deadline (84 out of 96 projects submitted Oct 17-Sept 2018). The result was improved by decent share of phased projects and Article 102(1). Despite JASPERS assistance and GUs upstream work, some MS still submit projects of low quality that require corrections. However, 87,5% is an achievement, compared to 11% approved in 2007-2013 within the regulatory period.
REGIO 5. Follow-up non-fulfilled ex-ante conditionalities (ExACs). (Target: Active follow-up of outstanding issues including adopting suspension decisions before end Q1 2018 and work towards lifting by end 2018)
A repealing decision for one suspension decision is in ISC. Two other suspension decisions are under decision procedure.
We will continue to proactively monitor and to provide support to the implementing units.
REGIO 6a. Amendments to secondary legislation as a follow-up to the adoption of the Omnibus regulation. (Target: by end of Q3)
Expert Group and Comitology meetings held in November; 4 out of 6 implementing acts and 2 out of 3 delegated acts have been finalised.
One further Comitology meeting in January/early February is planned to cover the outstanding two implementing acts (Commission adoption in February).
REGIO 6b. Amendments to guidance as a follow-up to the adoption of the Omnibus regulation (Target: by end of Q3)
The majority of notes (the most important from an implementation perspective) have either been finalised or their discussion in EGESIF was started in October - December. Some 6 more notes are still to be updated by Units during the first quarter of 2019, as well as a number of internal notes/LTTs.
Unit 02 has reported to the Directors on the state of play of the exercise and reminded Directors/HoUs to make progress with the pending updates. Close coordination with the responsible units is maintained.
MS 42. a. % allocated to the operations selected for support / total allocation for ERDF and CF for 2014-2020 (Target: At least equal to 70% at end 2018, baseline: 44.2% at end Nov 2017)
Project selection at 68,8% reported by end of October (period covered: up to 30 September); next reporting is end January 2019, with period covered: up to 31 December 2018)
Regular meetings with Member States
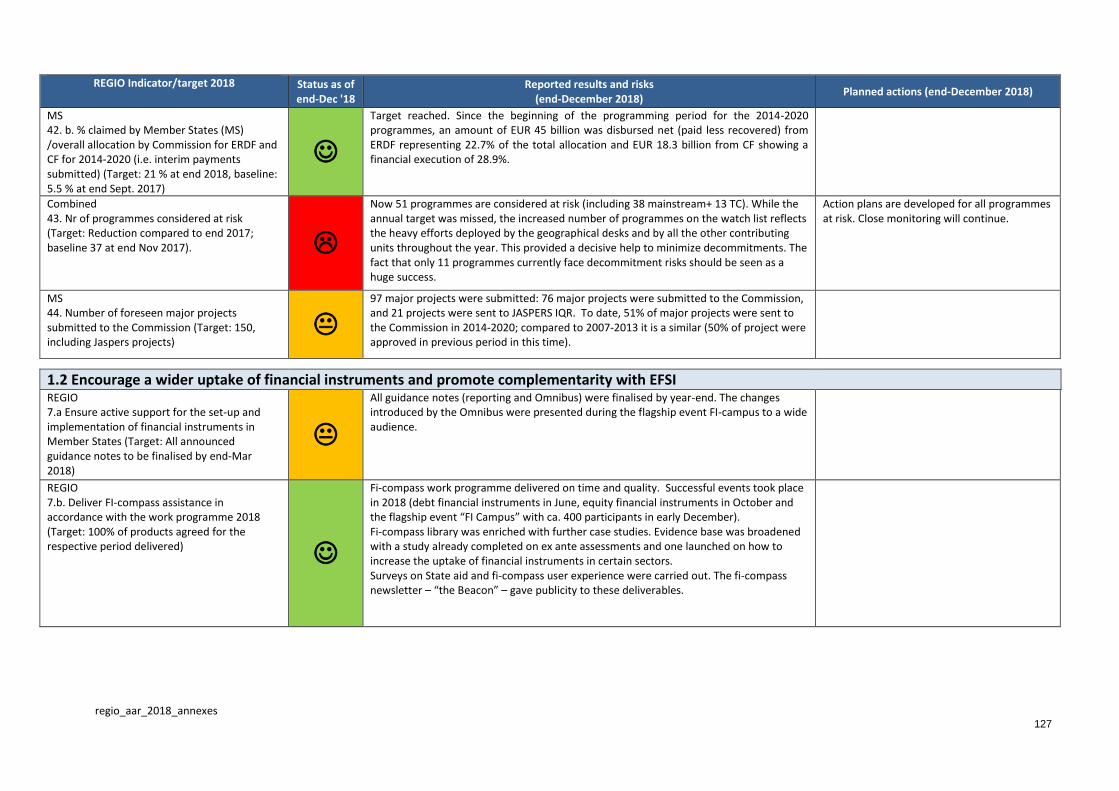
regio_aar_2018_annexes
127
REGIO Indicator/target 2018 Status as of end-Dec '18
Reported results and risks (end-December 2018)
Planned actions (end-December 2018)
MS 42. b. % claimed by Member States (MS) /overall allocation by Commission for ERDF and CF for 2014-2020 (i.e. interim payments submitted) (Target: 21 % at end 2018, baseline: 5.5 % at end Sept. 2017)
Target reached. Since the beginning of the programming period for the 2014-2020 programmes, an amount of EUR 45 billion was disbursed net (paid less recovered) from ERDF representing 22.7% of the total allocation and EUR 18.3 billion from CF showing a financial execution of 28.9%.
Combined 43. Nr of programmes considered at risk (Target: Reduction compared to end 2017; baseline 37 at end Nov 2017).
Now 51 programmes are considered at risk (including 38 mainstream+ 13 TC). While the annual target was missed, the increased number of programmes on the watch list reflects the heavy efforts deployed by the geographical desks and by all the other contributing units throughout the year. This provided a decisive help to minimize decommitments. The fact that only 11 programmes currently face decommitment risks should be seen as a huge success.
Action plans are developed for all programmes at risk. Close monitoring will continue.
MS 44. Number of foreseen major projects submitted to the Commission (Target: 150, including Jaspers projects)
97 major projects were submitted: 76 major projects were submitted to the Commission, and 21 projects were sent to JASPERS IQR. To date, 51% of major projects were sent to the Commission in 2014-2020; compared to 2007-2013 it is a similar (50% of project were approved in previous period in this time).
1.2 Encourage a wider uptake of financial instruments and promote complementarity with EFSI REGIO 7.a Ensure active support for the set-up and implementation of financial instruments in Member States (Target: All announced guidance notes to be finalised by end-Mar 2018)
All guidance notes (reporting and Omnibus) were finalised by year-end. The changes introduced by the Omnibus were presented during the flagship event FI-campus to a wide audience.
REGIO 7.b. Deliver FI-compass assistance in accordance with the work programme 2018 (Target: 100% of products agreed for the respective period delivered)
Fi-compass work programme delivered on time and quality. Successful events took place in 2018 (debt financial instruments in June, equity financial instruments in October and the flagship event “FI Campus” with ca. 400 participants in early December). Fi-compass library was enriched with further case studies. Evidence base was broadened with a study already completed on ex ante assessments and one launched on how to increase the uptake of financial instruments in certain sectors. Surveys on State aid and fi-compass user experience were carried out. The fi-compass newsletter – “the Beacon” – gave publicity to these deliverables.
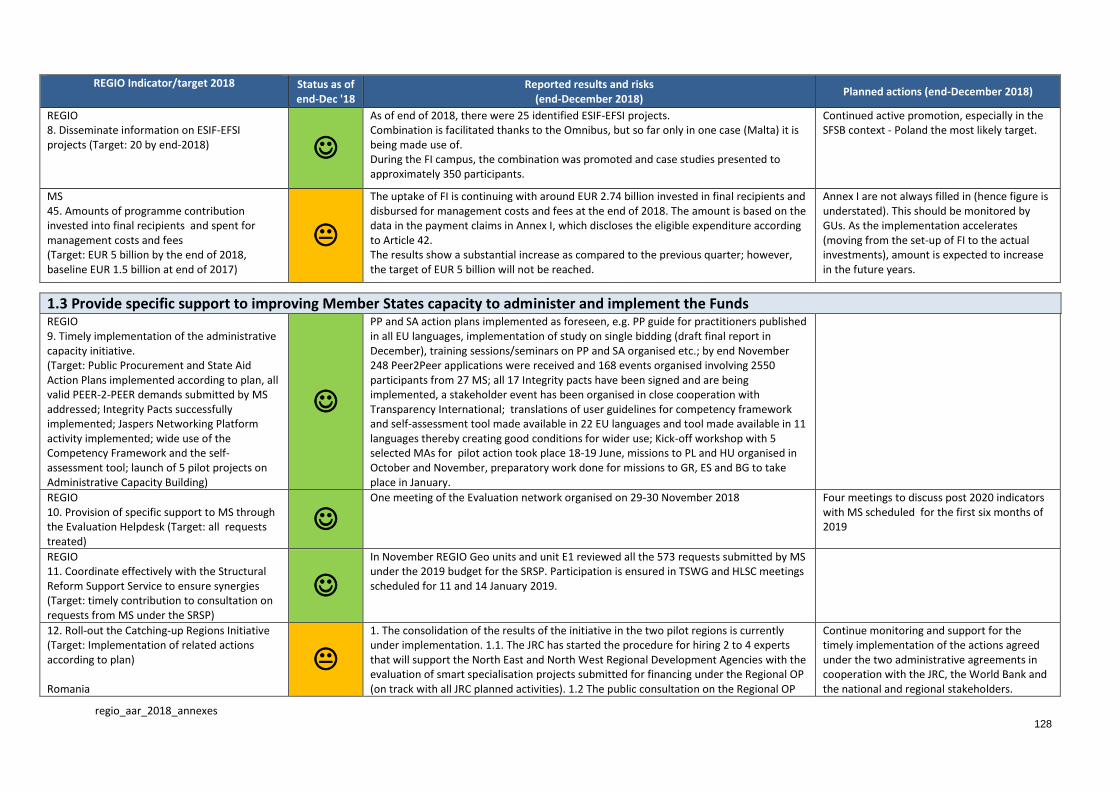
regio_aar_2018_annexes
128
REGIO Indicator/target 2018 Status as of end-Dec '18
Reported results and risks (end-December 2018)
Planned actions (end-December 2018)
REGIO 8. Disseminate information on ESIF-EFSI projects (Target: 20 by end-2018)
As of end of 2018, there were 25 identified ESIF-EFSI projects. Combination is facilitated thanks to the Omnibus, but so far only in one case (Malta) it is being made use of. During the FI campus, the combination was promoted and case studies presented to approximately 350 participants.
Continued active promotion, especially in the SFSB context - Poland the most likely target.
MS 45. Amounts of programme contribution invested into final recipients and spent for management costs and fees (Target: EUR 5 billion by the end of 2018, baseline EUR 1.5 billion at end of 2017)
The uptake of FI is continuing with around EUR 2.74 billion invested in final recipients and disbursed for management costs and fees at the end of 2018. The amount is based on the data in the payment claims in Annex I, which discloses the eligible expenditure according to Article 42. The results show a substantial increase as compared to the previous quarter; however, the target of EUR 5 billion will not be reached.
Annex I are not always filled in (hence figure is understated). This should be monitored by GUs. As the implementation accelerates (moving from the set-up of FI to the actual investments), amount is expected to increase in the future years.
1.3 Provide specific support to improving Member States capacity to administer and implement the Funds REGIO 9. Timely implementation of the administrative capacity initiative. (Target: Public Procurement and State Aid Action Plans implemented according to plan, all valid PEER-2-PEER demands submitted by MS addressed; Integrity Pacts successfully implemented; Jaspers Networking Platform activity implemented; wide use of the Competency Framework and the self-assessment tool; launch of 5 pilot projects on Administrative Capacity Building)
PP and SA action plans implemented as foreseen, e.g. PP guide for practitioners published in all EU languages, implementation of study on single bidding (draft final report in December), training sessions/seminars on PP and SA organised etc.; by end November 248 Peer2Peer applications were received and 168 events organised involving 2550 participants from 27 MS; all 17 Integrity pacts have been signed and are being implemented, a stakeholder event has been organised in close cooperation with Transparency International; translations of user guidelines for competency framework and self-assessment tool made available in 22 EU languages and tool made available in 11 languages thereby creating good conditions for wider use; Kick-off workshop with 5 selected MAs for pilot action took place 18-19 June, missions to PL and HU organised in October and November, preparatory work done for missions to GR, ES and BG to take place in January.
REGIO 10. Provision of specific support to MS through the Evaluation Helpdesk (Target: all requests treated)
One meeting of the Evaluation network organised on 29-30 November 2018 Four meetings to discuss post 2020 indicators with MS scheduled for the first six months of 2019
REGIO 11. Coordinate effectively with the Structural Reform Support Service to ensure synergies (Target: timely contribution to consultation on requests from MS under the SRSP)
In November REGIO Geo units and unit E1 reviewed all the 573 requests submitted by MS under the 2019 budget for the SRSP. Participation is ensured in TSWG and HLSC meetings scheduled for 11 and 14 January 2019.
12. Roll-out the Catching-up Regions Initiative (Target: Implementation of related actions according to plan) Romania
1. The consolidation of the results of the initiative in the two pilot regions is currently under implementation. 1.1. The JRC has started the procedure for hiring 2 to 4 experts that will support the North East and North West Regional Development Agencies with the evaluation of smart specialisation projects submitted for financing under the Regional OP (on track with all JRC planned activities). 1.2 The public consultation on the Regional OP
Continue monitoring and support for the timely implementation of the actions agreed under the two administrative agreements in cooperation with the JRC, the World Bank and the national and regional stakeholders.

regio_aar_2018_annexes
129
REGIO Indicator/target 2018 Status as of end-Dec '18
Reported results and risks (end-December 2018)
Planned actions (end-December 2018)
guide for financing smart specialisation projects in the two pilot regions has finished and the MA is redrafting the guide accordingly. The related call is planned to be launched by the end of February 2019 (delay). 2. The Roll-out of the initiative has started and is currently on track as far as the JRC is concerned. JRC has signed the contracts with 3 experts that have started their work with the Romanian Regional Development Agencies for the drafting and updating of their smart specialisation strategies, the organisation of EDPs and the preparation of the related project pipelines and projects applications (on track). The World Bank assignment is slightly delayed because of internal human resources reshuffling inside the Bank. However, even though delayed, the Bank has started the assignment and organised the kick-off meetings with the Regional Development Agencies and relevant ministries. The next exchanges with the World Bank for finding an agreement on a revised, updated timeline will be organised in the second half of January 2019 (delay).
Organise regular meetings and exchanges with the JRC, the World Bank and the beneficiaries. Organise in the first trimester of 2019 the second Coordination Committee.
12. Roll-out the Catching-up Regions Initiative (Target: Implementation of related actions according to plan) Poland
1. Technology transfers in Lodzkie, Dolnoslaskie and Podlaskie: preliminary report is prepared comprising data for benchmarking the regions and taking stock of demand and supply inputs and outputs. Desk research is supplemented by additional interviews with key local companies and universities 2. Energy efficiency: terms of reference for the WB technical assistance to National Environment Protection and Water Management Fund were delivered, but little progress has been made so far 3. Financial instruments in Slaskie and Podlaskie: Experts from the World Bank collected and analysed the data for desk research supplied by regional authorities of Podlaskie and Śląskie and organized workshops on possible management model of financial instruments (6 models to be analysed) 4. Demand responsive transport in Zachodniopomorskie: review of the proposal for the development of e-module (submitted during the call for proposals) was reviewed by the World Bank negatively. The launch of a new call will delay the implementation of the measure 5. Measure in Kujawsko-Pomorskie: development of coordinated health and social care model, spatial planning in the Wloclawek functional area and entrepreneurship support in Wloclawek - there is a need for increasing involvement of regional and local authorities in the implementation of the measure.
1. Technology transfers: WB team will collect feedback from regional counterparts on the findings from the analytical exercise, consult preliminary Program Design and expand consultations with the stakeholder in all regions. 2. Energy efficiency: a call is scheduled with the World Bank in the second week of January to check progress of the measure, identify bottlenecks and possible solutions 3. FIs: Completing individual interviews Podlaskie and Śląskie ; preparation of a draft final report for Podlaskie Region and its discussion with the Marshall Office; analysis of possibility of simplification of application documents for financial instruments and level of management costs of Financial Intermediaries 4. Demand-responsive transport: a new call for proposals to be launched for the development of e-module, the WB should send an overview of items to be financed through ROP Zachodniopomorskie to check their eligibility 5. Measures in Kujawsko-Pomorskie: letter to be sent to the MO Kujawsko-Pomorskie to ask them to decide whether they want to continue the implementation of the measures, which
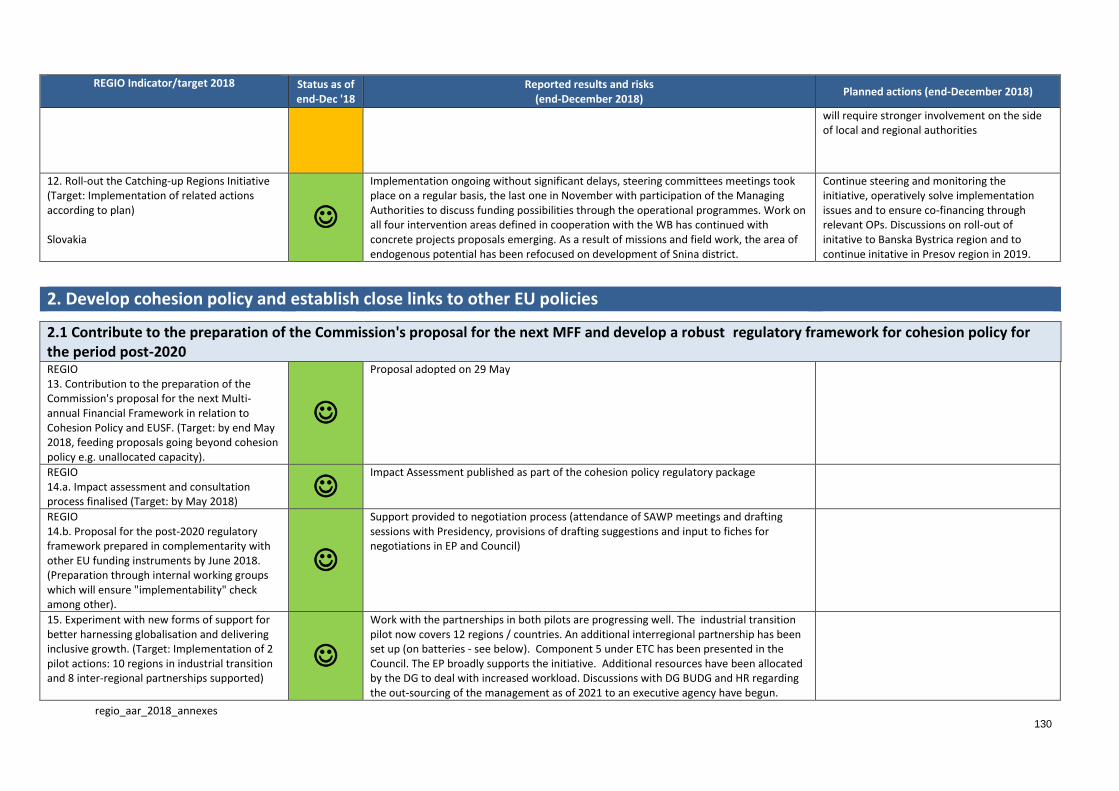
regio_aar_2018_annexes
130
REGIO Indicator/target 2018 Status as of end-Dec '18
Reported results and risks (end-December 2018)
Planned actions (end-December 2018)
will require stronger involvement on the side of local and regional authorities
12. Roll-out the Catching-up Regions Initiative (Target: Implementation of related actions according to plan) Slovakia
Implementation ongoing without significant delays, steering committees meetings took place on a regular basis, the last one in November with participation of the Managing Authorities to discuss funding possibilities through the operational programmes. Work on all four intervention areas defined in cooperation with the WB has continued with concrete projects proposals emerging. As a result of missions and field work, the area of endogenous potential has been refocused on development of Snina district.
Continue steering and monitoring the initiative, operatively solve implementation issues and to ensure co-financing through relevant OPs. Discussions on roll-out of initative to Banska Bystrica region and to continue initative in Presov region in 2019.
2. Develop cohesion policy and establish close links to other EU policies
2.1 Contribute to the preparation of the Commission's proposal for the next MFF and develop a robust regulatory framework for cohesion policy for the period post-2020 REGIO 13. Contribution to the preparation of the Commission's proposal for the next Multi-annual Financial Framework in relation to Cohesion Policy and EUSF. (Target: by end May 2018, feeding proposals going beyond cohesion policy e.g. unallocated capacity).
Proposal adopted on 29 May
REGIO 14.a. Impact assessment and consultation process finalised (Target: by May 2018)
Impact Assessment published as part of the cohesion policy regulatory package
REGIO 14.b. Proposal for the post-2020 regulatory framework prepared in complementarity with other EU funding instruments by June 2018. (Preparation through internal working groups which will ensure "implementability" check among other).
Support provided to negotiation process (attendance of SAWP meetings and drafting sessions with Presidency, provisions of drafting suggestions and input to fiches for negotiations in EP and Council)
15. Experiment with new forms of support for better harnessing globalisation and delivering inclusive growth. (Target: Implementation of 2 pilot actions: 10 regions in industrial transition and 8 inter-regional partnerships supported)
Work with the partnerships in both pilots are progressing well. The industrial transition pilot now covers 12 regions / countries. An additional interregional partnership has been set up (on batteries - see below). Component 5 under ETC has been presented in the Council. The EP broadly supports the initiative. Additional resources have been allocated by the DG to deal with increased workload. Discussions with DG BUDG and HR regarding the out-sourcing of the management as of 2021 to an executive agency have begun.
regio_aar_2018_annexes
131
REGIO Indicator/target 2018 Status as of end-Dec '18
Reported results and risks (end-December 2018)
Planned actions (end-December 2018)
2.2 Position Cohesion Policy as major contributor to EU policies REGIO 16. REGIO's contribution to the European Semester (Target: contribution to the Annual Growth Survey, SWDs, Country Reports and Country Specific Recommendations, participation in all country team meetings)
On-going close coordination of the DG's input for the 2019 edition and ad-hoc support to geo units in the finalisation of the parts under DG REGIO's responsibility with a primary focus on the drafting of high quality Annexes D and preparation of briefings for DG meeting.
Continuing close support till the finalisation of the Country Reports
REGIO 17. Establish strong links between cohesion policy and relevant Commission initiatives and Instruments. (Target: References to interaction with Cohesion Policy in Commission initiatives ; contribution to country teams and platform for Coal Regions in Transition)
Contributed to explanatory fiches on integrated territorial development and EUI. Country report contributions and Annex Ds reviewed within the deadline. Scope of policy support for post2020 discussed with GUs and incorporated in the work programme of Urbanet and Soconet matrices. DG REGIO has been well involved in the legislative negotiations of the relevant sectoral packages and in new initiatives. An interregional Battery Partnership has been established at part of the Battery Alliance.
REGIO 18. Position smart specialisation as a key element of EU industrial, research and innovation policies. (Target: implementation of the administrative agreements on "S3Platform" and, "Stairway to Excellence", "lagging regions" and "5.1.2 Targeted RIS3 support to Romania" according to their work plans and contribution to other initiatives)
All administrative agreements have been finalised.
3. Demonstrate and disseminate the EU added value of cohesion policy
3.1 Provide and report evidence on the effectiveness and EU added value of Cohesion Policy REGIO 19.a Annual summary report based on AIRs and on the synthesis of evaluation results reported by OPs (Target: by end 2018)
Annual summary report and synthesis of evaluations adopted on 19.12.2018 (COM (2018) 816 final
regio_aar_2018_annexes
132
REGIO Indicator/target 2018 Status as of end-Dec '18
Reported results and risks (end-December 2018)
Planned actions (end-December 2018)
REGIO 19.b Annual Summaries of data on the progress made in financing and implementing financial instruments under ESIF 2014-2020 (Target: by end-Nov 2018)
The annual summary was sent to EGESIF on 30/11 and published on 13/12.
REGIO 20. Assessment of the reliability of MS systems for the reporting of performance data (Target: Analysis of audit results communicated by audit authorities and 100% of the audits on performance indicators carried out by REGIO, as foreseen in the audit plan)
14 missions out of 14 planned were performed by end-December 2018. In 2018 only few audit authorities reported audit results in relation to data reliability. A significant contribution is expected with the ACRs 2018 due by 15 February 2019. With a note (Ares(2018)5525746), Directorate C has asked all audit authorities to report about the assurance on the reliability of performance data and to provide the relevant information under section 8 "Other information" of the next ACR.
Review of the audit result from DG REGIO audits (final reports) and from the audit authorities (main source: ACRs received in 2019).
MS 47. AIR are submitted on time and are of good quality (Target: all)
By the end of 2018 the majority of the AIRs (96%) have been received and accepted. The AIR for only one programme (ETC) is still not admissible. The preparation for 2019 exercise is ongoing.
Prepare for the 2019 exercise and follow the roadmap in order to review and to update the process. The challenges for this year are the performance framework, the full report, and synchronisation with the progress report
MS 48. Reliability of all data systems assessed by the audit authorities, providing a robust basis for the 2019 performance review (Target: by end of 2018, audit results on performance data available from at least 15 of the more risky programmes, as defined in the audit plan)
All risky operational programmes have been subject to audits on performance data reliability covering 15 Member States; all audits planned for the period 2017-January 2019, were performed by the end of 2018. The audit results have been communicated to the Member States for 23 audits carried out cumulatively since 2017.
3.2 Communicate to citizens and stakeholders the results of Cohesion Policy programmes and their contribution to the delivery Commission political priorities REGIO 21. Implementation of REGIO Communication Strategy 2017-2020 and joint communication actions proposed by Commissioners Crețu and Thyssen (regular progress reports to the Council), including contribution to corporate / strategic communication. (Target: 5 strands implemented, EUinmyRegion 2018, regional and local dialogues, Association Media, Promotion and Diffusion, MYRegions) and active participation in the Corporate campaign (#InvestEU, EU empowers, EU protects)
All REGIO campaigns for 2018 have been either completed (7 joint communication actions, Cohesion@30, 1st Road Trip Project, 1st partnership with media, local dialogues with CEMR, EU in my Region) or are being rolled out (EU delivers in the regions). DG REGIO has largely contributed to corporate communication campaigns, at different stages (Invest EU, EUandMe, EUprotects, rural campaign)
We will further team up with DG COMM in developing and deploying corporate and regional campaigns ahead of the EU elections (Invest EU, EUandMe, EUprotects, rural campaign, EU delivers in the regions, Road Trip Project 2.0 and Eu in My Region). We will also support EDICs (and IVYs in cooperation with D2) to organise local dialogues in 2019. A third media call is the 1st item on reserve in the 2019 TA decision for discussion in the mid-term review. The aim is to ensure a continuum of information activities throughout time.
regio_aar_2018_annexes
133
REGIO Indicator/target 2018 Status as of end-Dec '18
Reported results and risks (end-December 2018)
Planned actions (end-December 2018)
REGIO 22. Updates of the open data platform (Target: 3 updates by end 2018, reflecting periodical submission of performance and financial data by MS)
Third update on financial indicators carried out in November
REGIO 23. European Solidarity Corps Interreg internships (Target: 210 by end 2018, baseline 80 by end 2017)
233 volunteers deployed at end 2018 Commitment made for additional citizens' engagement budget/communication (in cooperation with A2)
MS 49. Systematic discussion in monitoring committees on the implementation of MS' communication plans
This point was included in the standard agenda for monitoring committees
MS 50. Increase usage of the open data platform (Target: steady increase compared to baseline at end 2017)
The platform received 945,000 views from the beginning of 2018 (770,000 during the same period in 2017)
4. Support territorial cohesion in Europe
4.1 Enhance policy coordination in the area of territorial and urban development REGIO 24. Urban Innovative Actions (UIAs): completed selection of projects for the third call by end 2018 (amounting to EUR 80-100 million)
Fourth call launched in October and promotion events organised in Brussels and Munich. REGIO board decided on topics of fifth call in December
REGIO 25. Number of participants in Urban Development Network (UDN) activities and other events for actors implementing integrated urban/territorial strategies. (Target: 1 000 participants)
UDN events in Baltic countries, IE, IT and RO: around 250 participants in total. DDG.03 organised and contributed to several ERWC workshops on territorial, social and urban where organised (approximately 900).
MS 51. Implementation of the EU Urban Agenda (Target: 4 action plans finalised by end 2018)
Launch of 2 new partnerships, 11 action plans finalised
regio_aar_2018_annexes
134
REGIO Indicator/target 2018 Status as of end-Dec '18
Reported results and risks (end-December 2018)
Planned actions (end-December 2018)
4.2 Support the implementation of macro regional strategies and steer the outermost region strategy REGIO 26. Monitoring implementation of the action plans of 4 on-going macro regional strategies i.e. for the Baltic Sea, the Adriatic and Ionian, the Danube and the Alpine Regions (Target: 4 Annual fora, 1 High-Level Group meeting)
All planned four MRS annual forums and the High-Level group meeting for MRS took place as planned with high levels of participation and good results; The High-Level Group meeting for MRS took place in Brussels on 1 March 2018, the EUSAIR 3rd annual forum on 24-25.5.2018 in Catania, the EUSBSR 9th annual forum on 4-5.6.2018 in Tallinn, The EUSDR 7th annual forum on 18-19.10.2018 in Sofia and the EUSALP 2nd annual forum on 20-21.11.2018 in Innsbruck.
REGIO 27. Steering the implementation of the new outermost regions strategy (Target: Implementation of the roadmap in line with the timetable)
- State aid guidelines revised for OR; Horizon OR Research project FORWARD signed - Successful conference of Presidents in November, delivered President Juncker and Commissioner Cretu speeches/briefings, followed-up Presidents’ requests - MFF: OR specific provisions kept so far in negotiations - 2nd Task Force launched - EIB Study on investment platforms presented to FR and ES ORs - Study on mobility further delayed due to poor quality - February - Created opportunities in existing programmes: e.g. LIFE - Improved dialogue with OR/ Communication: across DG wiki, workshop, factsheets, etc.
- Continue follow-up of OR related issues under
MFF discussions and mobilise support
- Continue scanning for opportunities in other
programmes/support OR in seizing them
- Continue ensuring that OR specificities are
enshrined in policy and legislative proposals
for ex. taxation regimes (upcoming revision)
- Continue co-ordinating two taskforces and
create new taskforce(s) upon demand
- Prepare a report on progress made in the first
two years of the Strategy for adoption in first
semester of 2020
- Start preparations for Outermost Regions'
Forum (first semester of 2020)
- Continue leading the outermost regions ISG
and working group; and co-ordinating action
in all DGs to support ORs
- Finalise Study on mobility; mission on EIB
study
4.3 Implement measures to address remaining cross-border obstacles REGIO 28. Communication follow-up by the Border Focal Point (Target: Implementation of the 10 actions proposed in the Communication on Border Regions in line with foreseen timetable)
All actions stemming from the BFP's work programme have been implemented as anticipated. No major difficulties encountered. Major highlights include the successful Cross-Border Healthcare services conference of 4/12/2018, the final report of the pilot project on CB statistics, the selection of 10 pilot projects looking at legal border obstacles and the presentation of a draft regulation proposing a mechanism to resolve legal and administrative border obstacles.
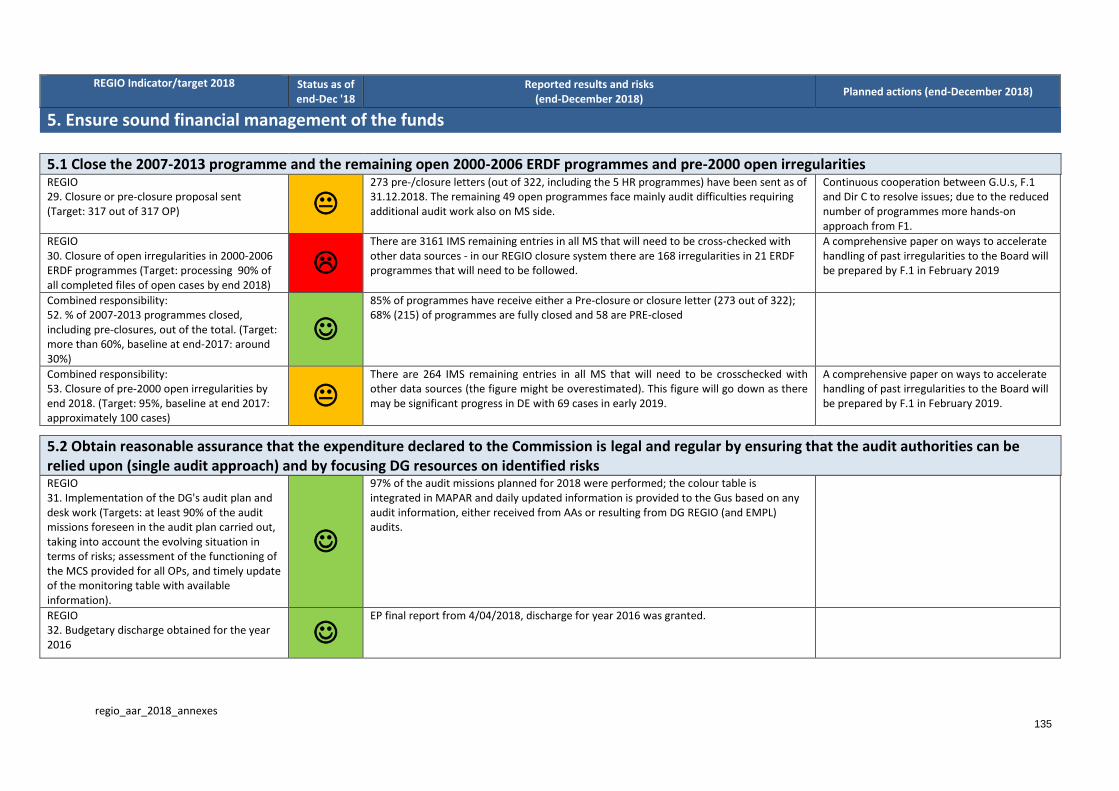
regio_aar_2018_annexes
135
REGIO Indicator/target 2018 Status as of end-Dec '18
Reported results and risks (end-December 2018)
Planned actions (end-December 2018)
5. Ensure sound financial management of the funds
5.1 Close the 2007-2013 programme and the remaining open 2000-2006 ERDF programmes and pre-2000 open irregularities REGIO 29. Closure or pre-closure proposal sent (Target: 317 out of 317 OP)
273 pre-/closure letters (out of 322, including the 5 HR programmes) have been sent as of 31.12.2018. The remaining 49 open programmes face mainly audit difficulties requiring additional audit work also on MS side.
Continuous cooperation between G.U.s, F.1 and Dir C to resolve issues; due to the reduced number of programmes more hands-on approach from F1.
REGIO 30. Closure of open irregularities in 2000-2006 ERDF programmes (Target: processing 90% of all completed files of open cases by end 2018)
There are 3161 IMS remaining entries in all MS that will need to be cross-checked with other data sources - in our REGIO closure system there are 168 irregularities in 21 ERDF programmes that will need to be followed.
A comprehensive paper on ways to accelerate handling of past irregularities to the Board will be prepared by F.1 in February 2019
Combined responsibility: 52. % of 2007-2013 programmes closed, including pre-closures, out of the total. (Target: more than 60%, baseline at end-2017: around 30%)
85% of programmes have receive either a Pre-closure or closure letter (273 out of 322); 68% (215) of programmes are fully closed and 58 are PRE-closed
Combined responsibility: 53. Closure of pre-2000 open irregularities by end 2018. (Target: 95%, baseline at end 2017: approximately 100 cases)
There are 264 IMS remaining entries in all MS that will need to be crosschecked with other data sources (the figure might be overestimated). This figure will go down as there may be significant progress in DE with 69 cases in early 2019.
A comprehensive paper on ways to accelerate handling of past irregularities to the Board will be prepared by F.1 in February 2019.
5.2 Obtain reasonable assurance that the expenditure declared to the Commission is legal and regular by ensuring that the audit authorities can be relied upon (single audit approach) and by focusing DG resources on identified risks REGIO 31. Implementation of the DG's audit plan and desk work (Targets: at least 90% of the audit missions foreseen in the audit plan carried out, taking into account the evolving situation in terms of risks; assessment of the functioning of the MCS provided for all OPs, and timely update of the monitoring table with available information).
97% of the audit missions planned for 2018 were performed; the colour table is integrated in MAPAR and daily updated information is provided to the Gus based on any audit information, either received from AAs or resulting from DG REGIO (and EMPL) audits.
REGIO 32. Budgetary discharge obtained for the year 2016
EP final report from 4/04/2018, discharge for year 2016 was granted.

regio_aar_2018_annexes
136
REGIO Indicator/target 2018 Status as of end-Dec '18
Reported results and risks (end-December 2018)
Planned actions (end-December 2018)
MS 54. % of annual control reports received from audit authorities with an opinion and residual error rate that can be relied upon (Target 95%)
In AAR 2017, Directorate C has validated the error rate reported by the 35 OPs with ERDF expenditure in the accounts for the accounting year 2015-2016 (average TER 0.5% and RTER 0.4%. However, the audit results reported by the Court of Auditors led to the recalculation of the error rates for 3 PL ACRs. Out of these 3 OPs only 1 had ERDF expenditure in the accounts and therefore the OP was put under reservation in the 2017 AAR. The Court also reported shortcomings of varying importance in the work of audited audit authorities. This reflects diverging professional judgement of technical issues such as sampling and audit documentation, as well as individual weaknesses in certain cases.
The validation of the error rates and audit opinions for the OPs with certified amounts of the accounting year 2016-2017 will be disclosed in the AAR 2018.
5.3 Obtain complete and accurate accounts for the accounting year REGIO 33. % of programmes informed about the Commission's decision on whether to accept the annual accounts. (Target: 100% by end-May 2018)
100% of Commission decisions issued within legal deadline
5.4 Safeguard EU funds through a rigorous policy on interruption and suspension of payments REGIO 34. Adoption of adequate measures in case of deficiencies impacting the legality and regularity of expenditure in excess of the 10% retention (Target: Issuance of warning/interruption/pre-suspension letters within 2 months)
All interruption letters have been issued within 2 months deadline to block submitted payment claims. Warning letters for mono-fund programmes were also issued within 2 months deadline. More time was needed to issue warning letters for multi-fund programmes (due to delays on EMPL side) and to issue pre-suspension letters for KR 6 (extensive consultation with the Legal service).
Review the procedure with DG EMPL for issuing letters related to multi-fund programmes. Issue remaining pre-suspension letters for KR 6 without further delay as the revised template for this type of letter has finally been agreed with the Legal Service.
Combined responsibility 55. % of the Annual Activity Report 2017 reservations cases lifted. (Target: 50% by end 2018)
5 reservations have been lifted as of end December (last one, IT Sicily 2014IT16RFOP016, has been lifted by the ISFCC on 13 December). Slow progress on 2007-13 closure as regards problematic cases is also affecting this objective. On the other hand, the relatively high number of reservations still unresolved reflects REGIO's determination to protect the EU budget.
Active follow-up to be continued, notably as regards cases dealt with in the framework of the 2007-2013 closure.
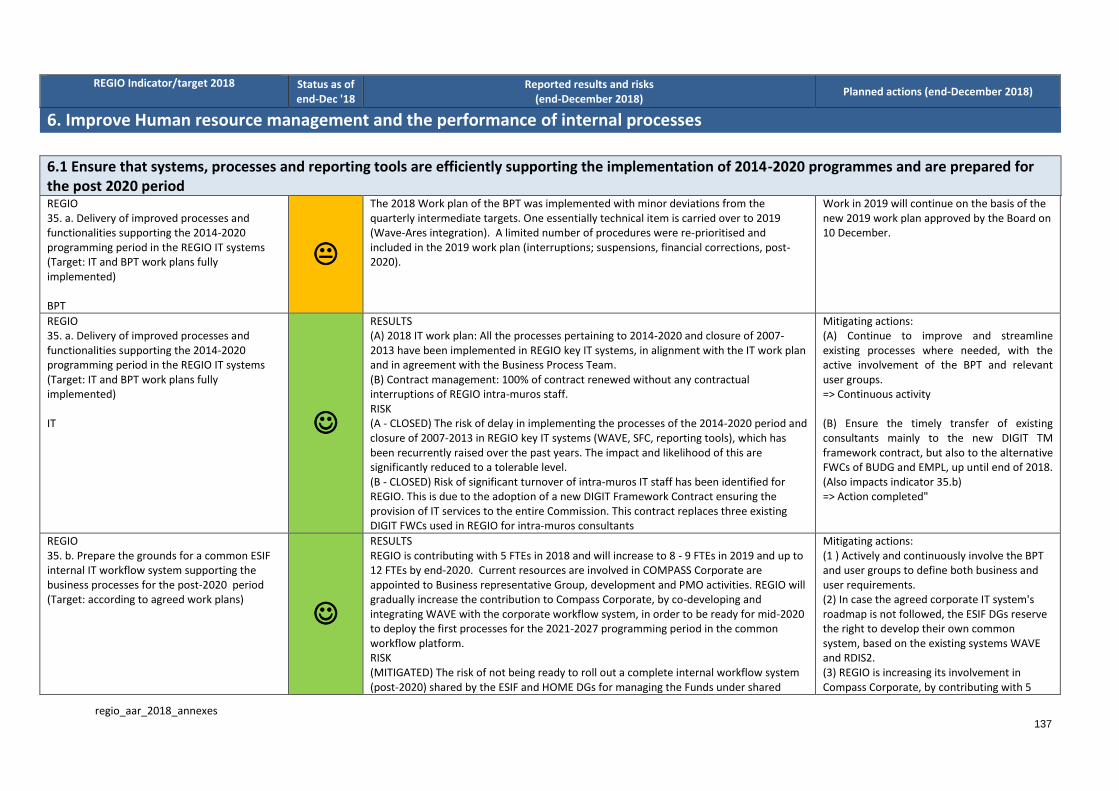
regio_aar_2018_annexes
137
REGIO Indicator/target 2018 Status as of end-Dec '18
Reported results and risks (end-December 2018)
Planned actions (end-December 2018)
6. Improve Human resource management and the performance of internal processes
6.1 Ensure that systems, processes and reporting tools are efficiently supporting the implementation of 2014-2020 programmes and are prepared for the post 2020 period REGIO 35. a. Delivery of improved processes and functionalities supporting the 2014-2020 programming period in the REGIO IT systems (Target: IT and BPT work plans fully implemented) BPT
The 2018 Work plan of the BPT was implemented with minor deviations from the quarterly intermediate targets. One essentially technical item is carried over to 2019 (Wave-Ares integration). A limited number of procedures were re-prioritised and included in the 2019 work plan (interruptions; suspensions, financial corrections, post-2020).
Work in 2019 will continue on the basis of the new 2019 work plan approved by the Board on 10 December.
REGIO 35. a. Delivery of improved processes and functionalities supporting the 2014-2020 programming period in the REGIO IT systems (Target: IT and BPT work plans fully implemented) IT
RESULTS (A) 2018 IT work plan: All the processes pertaining to 2014-2020 and closure of 2007-2013 have been implemented in REGIO key IT systems, in alignment with the IT work plan and in agreement with the Business Process Team. (B) Contract management: 100% of contract renewed without any contractual interruptions of REGIO intra-muros staff. RISK (A - CLOSED) The risk of delay in implementing the processes of the 2014-2020 period and closure of 2007-2013 in REGIO key IT systems (WAVE, SFC, reporting tools), which has been recurrently raised over the past years. The impact and likelihood of this are significantly reduced to a tolerable level. (B - CLOSED) Risk of significant turnover of intra-muros IT staff has been identified for REGIO. This is due to the adoption of a new DIGIT Framework Contract ensuring the provision of IT services to the entire Commission. This contract replaces three existing DIGIT FWCs used in REGIO for intra-muros consultants
Mitigating actions: (A) Continue to improve and streamline existing processes where needed, with the active involvement of the BPT and relevant user groups. => Continuous activity (B) Ensure the timely transfer of existing consultants mainly to the new DIGIT TM framework contract, but also to the alternative FWCs of BUDG and EMPL, up until end of 2018. (Also impacts indicator 35.b) => Action completed"
REGIO 35. b. Prepare the grounds for a common ESIF internal IT workflow system supporting the business processes for the post-2020 period (Target: according to agreed work plans)
RESULTS REGIO is contributing with 5 FTEs in 2018 and will increase to 8 - 9 FTEs in 2019 and up to 12 FTEs by end-2020. Current resources are involved in COMPASS Corporate are appointed to Business representative Group, development and PMO activities. REGIO will gradually increase the contribution to Compass Corporate, by co-developing and integrating WAVE with the corporate workflow system, in order to be ready for mid-2020 to deploy the first processes for the 2021-2027 programming period in the common workflow platform. RISK (MITIGATED) The risk of not being ready to roll out a complete internal workflow system (post-2020) shared by the ESIF and HOME DGs for managing the Funds under shared
Mitigating actions: (1 ) Actively and continuously involve the BPT and user groups to define both business and user requirements. (2) In case the agreed corporate IT system's roadmap is not followed, the ESIF DGs reserve the right to develop their own common system, based on the existing systems WAVE and RDIS2. (3) REGIO is increasing its involvement in Compass Corporate, by contributing with 5

regio_aar_2018_annexes
138
REGIO Indicator/target 2018 Status as of end-Dec '18
Reported results and risks (end-December 2018)
Planned actions (end-December 2018)
management for the 2021-2027 programming period. FTEs in 2018 and increasing up to 12 FTEs by end-2020. Moreover, in the business case endorsed by the Commission IT board on 26/04/2018, the programme has committed to deliver in production by Q1/2019 a first major release. (4) Project manager position open for REGIO COMPASS CORPORATE (recruitment ongoing) => Actions ongoing
REGIO 36. Implementation of the Commission's new internal control framework within REGIO (Target: analytical framework in place by end Q1 2018 and first assessment exercise feeding into AAR 2017 formalised by end Feb 2018)
The end 2018 overall internal control assessment exercise has been launched with Ares note (2018)6478831, with the requests of contributions from the IC chefs de file. Its outcome will be reflected into the AAR 2018.
6.2 Ensure effective sharing and reuse of information and knowledge within the DG REGIO 37. Steady increase of WIKI usage throughout the year, supported by an active user community (Target: increase compared to baseline (700 users at end-Oct 2017); content available to other DGs by end June 2018)
RegioWiki fully opened to all Commission DGs; REGIO use stable at 100% of staff; external users now overcome REGIO users (1726 > 800)
REGIO 38. Percentage of registered documents that are not filed (Target: below 1%)
1.7% of registered documents were not filed at end-December Reminder to units
6.3 Effectively deploy REGIO resources and ensure an engaged and productive workforce driven by effective and gender-balanced management REGIO 39. Assessment of HR resources allocation to the delivery of REGIO 2018 objectives (Target: by end May 2018)
Extensive forecasts concerning 2019 workload were collected through the mid-year UMP reporting and presented to the Board on 16 July. The related figures, together with other elements and analyses, also served as a basis for senior management's decision about HR reinforcements of 1st October.
REGIO 40. Work towards fulfilment of indicative target set by central services as regards the appointment of female HoUs (Target: 3 female Head of Unit by Nov 2019)
The course Unlocking the hidden potential took place in December

regio_aar_2018_annexes
139
REGIO Indicator/target 2018 Status as of end-Dec '18
Reported results and risks (end-December 2018)
Planned actions (end-December 2018)
REGIO 41. Implementation of new mobility policy (Target: More than 50% of mobile staff has a new assignment by the end of 2018)
52% of staff on mobility changed assignment by end of the year, no further mobility proposals were reported since September.
Continue with the proposed approach and remain in dialogue in particular with colleagues above 7 years on the same post.
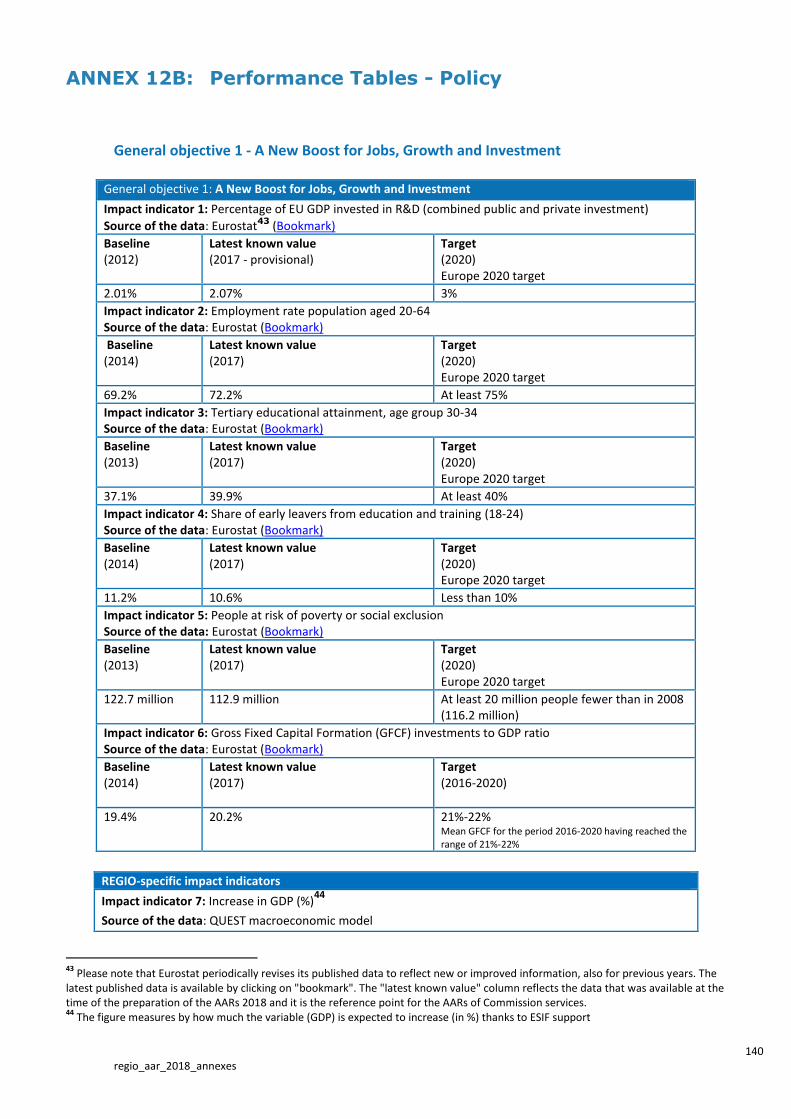
140 regio_aar_2018_annexes
ANNEX 12B: Performance Tables - Policy
General objective 1 - A New Boost for Jobs, Growth and Investment
General objective 1: A New Boost for Jobs, Growth and Investment
Impact indicator 1: Percentage of EU GDP invested in R&D (combined public and private investment)
Source of the data: Eurostat43 (Bookmark)
Baseline (2012)
Latest known value (2017 - provisional)
Target (2020) Europe 2020 target
2.01% 2.07% 3%
Impact indicator 2: Employment rate population aged 20-64 Source of the data: Eurostat (Bookmark)
Baseline (2014)
Latest known value (2017)
Target (2020) Europe 2020 target
69.2% 72.2% At least 75%
Impact indicator 3: Tertiary educational attainment, age group 30-34 Source of the data: Eurostat (Bookmark)
Baseline (2013)
Latest known value (2017)
Target (2020) Europe 2020 target
37.1% 39.9% At least 40%
Impact indicator 4: Share of early leavers from education and training (18-24) Source of the data: Eurostat (Bookmark)
Baseline (2014)
Latest known value (2017)
Target (2020) Europe 2020 target
11.2% 10.6% Less than 10%
Impact indicator 5: People at risk of poverty or social exclusion Source of the data: Eurostat (Bookmark)
Baseline (2013)
Latest known value (2017)
Target (2020) Europe 2020 target
122.7 million 112.9 million At least 20 million people fewer than in 2008 (116.2 million)
Impact indicator 6: Gross Fixed Capital Formation (GFCF) investments to GDP ratio Source of the data: Eurostat (Bookmark)
Baseline (2014)
Latest known value (2017)
Target (2016-2020)
19.4% 20.2% 21%-22% Mean GFCF for the period 2016-2020 having reached the range of 21%-22%
REGIO-specific impact indicators
Impact indicator 7: Increase in GDP (%)44
Source of the data: QUEST macroeconomic model
43
Please note that Eurostat periodically revises its published data to reflect new or improved information, also for previous years. The latest published data is available by clicking on "bookmark". The "latest known value" column reflects the data that was available at the time of the preparation of the AARs 2018 and it is the reference point for the AARs of Commission services. 44
The figure measures by how much the variable (GDP) is expected to increase (in %) thanks to ESIF support

regio_aar_2018_annexes
141
Baseline
(2014)
Latest known value
Target
(2023 – end of the implementation of the
2014-2020 programmes) (2018)
0 0.24 0.46
Impact indicator 8: Increase in employment
Source of the data: QUEST macroeconomic model
Baseline
(2014)
Latest known value
Target
(2023 – end of the implementation of the
2014-2020 programmes) (2018)
0 312,757 439,499
Impact indicator 9: Increase in private investment (%)45
Source of the data: QUEST macroeconomic model
Baseline
(2014)
Latest known value
Target
(2023 – end of the implementation of the
2014-2020 programmes) (2018)
0 0.17 0.51
Impact indicator 10: Dispersion of GDP per capita (all MS, coefficient of variation GDP per head)
Source of the data: Eurostat
Baseline
(2014)
Latest known value Target
(2020) (2017)
Euro area: 32.2% 32.5% Reduce
EU 27: 38.7% 38.1% Reduce
EU 28: 45.7% 44.2% Reduce
Bookmark
Associated specific objectives and indicators
The figures presented below result from the performance reporting of the 2014-2020 ERDF/CF programmes. The latest known results correspond to data at end 2017, reported by Member States in the Annual Implementation Reports submitted in May 2018.
It should also be noted that all data reported by the Member States in the Operational programmes are of a dynamic nature – by end 2017, certain values had been revised either because of reprogramming or due to manual corrections (clerical errors). This explains the change in certain indicator values compared to what was reported in REGIO's AAR 2017.
As regards the milestone figures included in the following tables, it should also be noted that they are purely indicative estimates that should not be used to identify cases of underperformance. Moreover, estimated milestones refer to 2018 while the latest available performance data capture the state of play at end 2017. In addition, previous experience shows that the progression of reported achievements is relatively flat in the first years of implementation and usually increases dramatically in the last years.
No evaluation evidence is available as regards programme achievements. A comprehensive ex-post evaluation will be carried out at the end of the 2014-2020 period (scope and precise schedule not yet
45
The figure measures by how much the variable (investment) is expected to increase (in %) thanks to ESIF support

regio_aar_2018_annexes
142
available).
Specific objective 1.1:
Strengthening research, technological development and innovation
Related to spending programme
ERDF
Indicator 1: Number of new researchers in supported entities
Source of data: REGIO common indicator 24 (research jobs created)
Baseline
(2014)
Interim Milestone
(estimate) 46
Target
2014-2023
(cumulative)
Latest known results
(2017)
(2018)
0 7,070 30,140 2472
Indicator 2: Number of enterprises cooperating with research institutions
Source of data: REGIO common indicator 26 (number of cooperation projects enterprises-research
institutions)
Baseline
(2014)
Interim Milestone
(estimate)
Target
2014-2023
(cumulative)
Latest known results
(2017)
(2018)
0 11,270 63,071 6,999
Indicator 3: Number of researchers working in improved research infrastructure facilities
Source of data: REGIO common indicator 25
Baseline
(2014)
Interim Milestone
(estimate)
Target
2014-2023
(cumulative)
Latest known results
(2017)
(2018)
0 28,250 129,895 15,207
Specific objective 1.2:
Enhancing the competitiveness of small and medium-sized
enterprises
Related to spending programme
ERDF
Indicator 1: Number of enterprises receiving support
Source of data: REGIO common indicator 1
Baseline
(2014)
Interim Milestone
(estimate)
Target
2014-2023
(cumulative)
Latest known results
(2017)
(2018)
0 181,800 1,117,749 193,365
Indicator 2: Employment increase in supported enterprises
Source of data: REGIO common indicator 8
Baseline
(2014)
Interim Milestone
(estimate)
Target
2014-2023
(cumulative)
Latest known results
(2017)
(2018)
0 109,600 422,546 42,745
Indicator 3: Increase in expected number of visits to supported sites of cultural and natural heritage and
attractions (sustainable tourism)
Source of data: REGIO common indicator 9
46
Disclosed milestones for the indicators under each specific objective are estimates. This estimation is based on the values of the milestones of the corresponding indicators are those used in the performance frameworks. The indicators presented, and those used in the performance frameworks of operational programmes and are only a subset of the indicators used in the operational programmes. They only provide interim estimate of the targeted achievements in 2014-2020 programmes. Performance data was updated from AAR 2017. Some of the 2018 milestones are now lower. This is due to the fact that some 200 programmes modified their milestones in the course of 2018 (in view of the performance review to be undertaken in 2019, based on the achievement of the 2018 milestones).

regio_aar_2018_annexes
143
Baseline
(2014)
Interim Milestone
(estimate)
Target
2014-2023
(cumulative)
Latest known results
(2017)
(2018)
0 13,408,900 38,006,316 5,071,565
Specific objective 1.3:
Preserving and protecting the environment, promoting circular
economy and resource efficiency
Related to spending programme
ERDF/CF
Indicator 1: Additional population served by improved wastewater treatment
Source of data: REGIO common indicator 19
Baseline
(2014)
Interim Milestone
(estimate)
Target
2014-2023
(cumulative)
Latest known results
(2017)
(2018)
0 979,800 17,058,951 302,606
Indicator 2: Additional waste recycling capacity
Source of data: REGIO common indicator 17
Baseline
(2014)
Interim Milestone
(estimate)
Target
2014-2023
(cumulative)
Latest known results
(207)
(2018)
0 1,554,000 5,296,207 47,745
Indicator 3: Additional population served by improved water supply
Source of data: REGIO common indicator 18
Baseline
(2014)
Interim Milestone
(estimate)
Target
2014-2023
(cumulative)
Latest known results
(2017)
(2018)
0 1,152,100 12,517,885 241,468
Indicator 4: Surface area of habitats supported to attain a better conservation status
Source of data: REGIO common indicator 23
Baseline
(2014)
Interim Milestone
(estimate)
Target
2014-2023
(cumulative)
Latest known results
(2017)
(2018)
0 2,532,100 18,629,474 1,409,669
Specific objective 1.4:
Promoting sustainable transport and removing bottlenecks in key
network infrastructures
Related to spending programme
ERDF/CF
Indicator 1: Total length of reconstructed or upgraded railway line
Source of data: REGIO common indicator 12
Baseline
(2014)
Interim Milestone
(estimate)
Target
2014-2023
(cumulative)
Latest known results
(2017)
(2018)
0 270 5,999 281
Indicator 2: Total length of reconstructed or upgraded roads
Source of data: REGIO common indicator 14
Baseline
(2014)
Interim Milestone
(estimate)
Target
2014-2023
(cumulative)
Latest known results
(2017)
(2018)
0 1,100 9,942 984
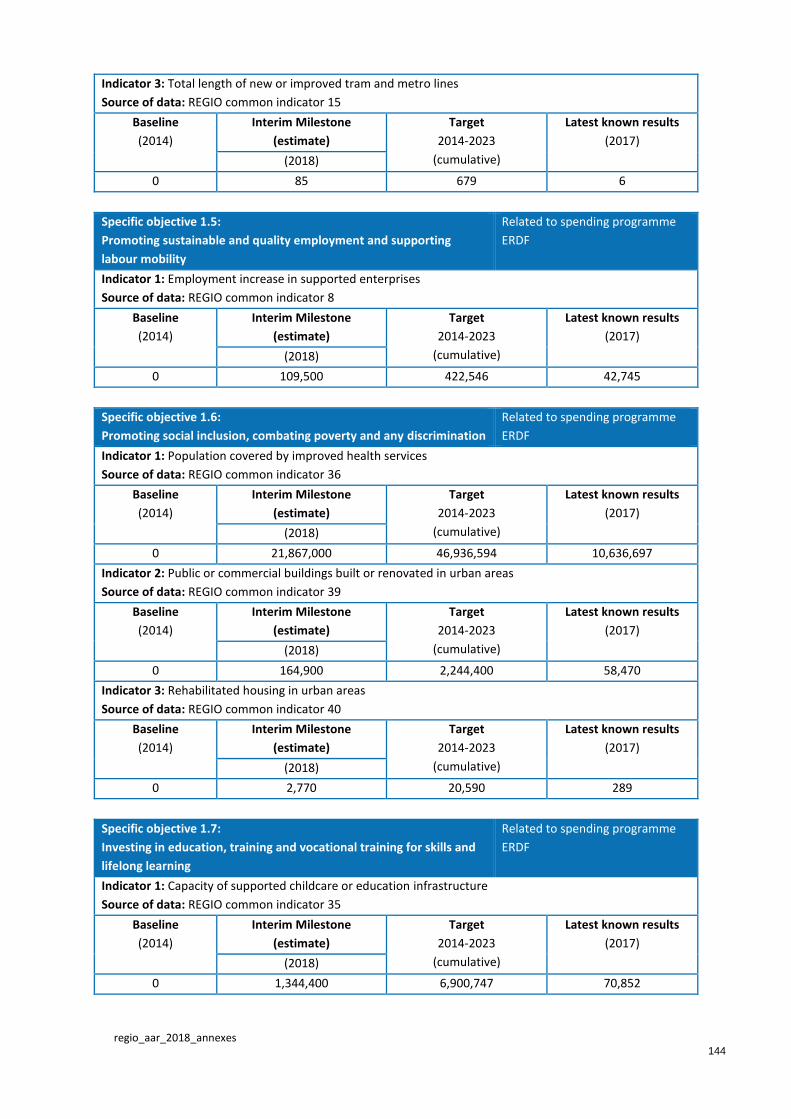
regio_aar_2018_annexes
144
Indicator 3: Total length of new or improved tram and metro lines
Source of data: REGIO common indicator 15
Baseline
(2014)
Interim Milestone
(estimate)
Target
2014-2023
(cumulative)
Latest known results
(2017)
(2018)
0 85 679 6
Specific objective 1.5:
Promoting sustainable and quality employment and supporting
labour mobility
Related to spending programme
ERDF
Indicator 1: Employment increase in supported enterprises
Source of data: REGIO common indicator 8
Baseline
(2014)
Interim Milestone
(estimate)
Target
2014-2023
(cumulative)
Latest known results
(2017)
(2018)
0 109,500 422,546 42,745
Specific objective 1.6:
Promoting social inclusion, combating poverty and any discrimination
Related to spending programme
ERDF
Indicator 1: Population covered by improved health services
Source of data: REGIO common indicator 36
Baseline
(2014)
Interim Milestone
(estimate)
Target
2014-2023
(cumulative)
Latest known results
(2017)
(2018)
0 21,867,000 46,936,594 10,636,697
Indicator 2: Public or commercial buildings built or renovated in urban areas
Source of data: REGIO common indicator 39
Baseline
(2014)
Interim Milestone
(estimate)
Target
2014-2023
(cumulative)
Latest known results
(2017)
(2018)
0 164,900 2,244,400 58,470
Indicator 3: Rehabilitated housing in urban areas
Source of data: REGIO common indicator 40
Baseline
(2014)
Interim Milestone
(estimate)
Target
2014-2023
(cumulative)
Latest known results
(2017)
(2018)
0 2,770 20,590 289
Specific objective 1.7:
Investing in education, training and vocational training for skills and
lifelong learning
Related to spending programme
ERDF
Indicator 1: Capacity of supported childcare or education infrastructure
Source of data: REGIO common indicator 35
Baseline
(2014)
Interim Milestone
(estimate)
Target
2014-2023
(cumulative)
Latest known results
(2017)
(2018)
0 1,344,400 6,900,747 70,852
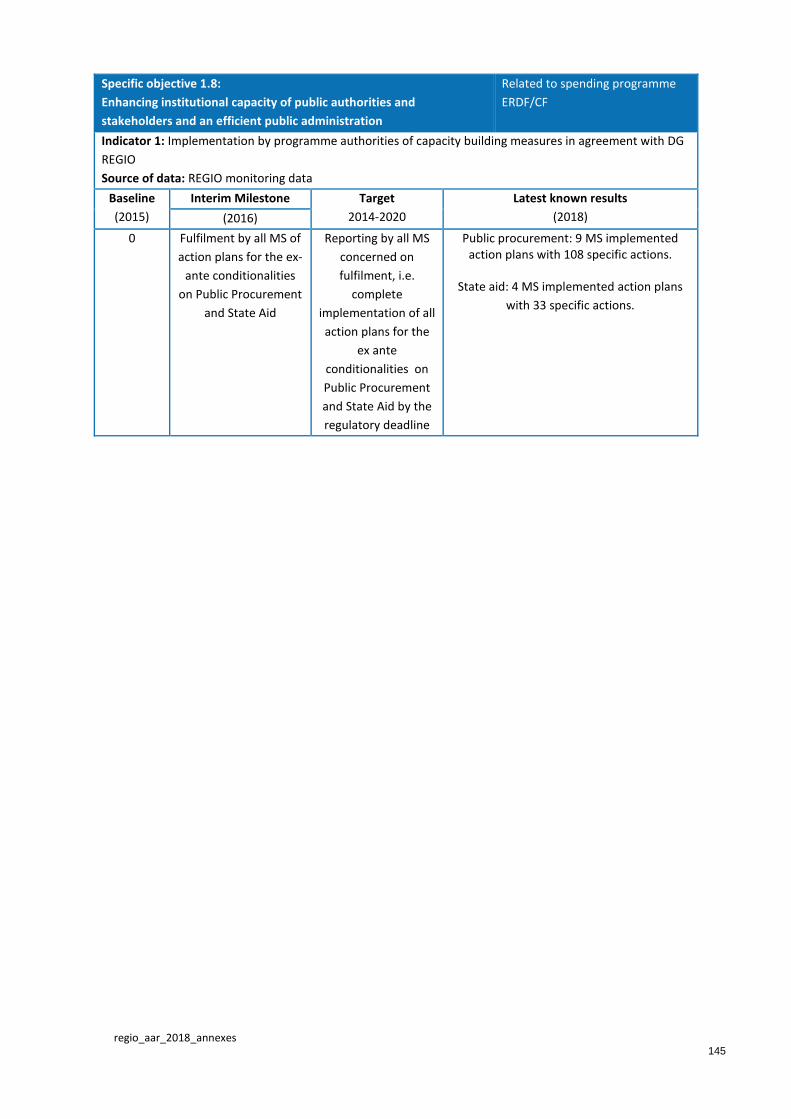
regio_aar_2018_annexes
145
Specific objective 1.8:
Enhancing institutional capacity of public authorities and
stakeholders and an efficient public administration
Related to spending programme
ERDF/CF
Indicator 1: Implementation by programme authorities of capacity building measures in agreement with DG
REGIO
Source of data: REGIO monitoring data
Baseline
(2015)
Interim Milestone Target
2014-2020
Latest known results
(2018) (2016)
0 Fulfilment by all MS of
action plans for the ex-
ante conditionalities
on Public Procurement
and State Aid
Reporting by all MS
concerned on
fulfilment, i.e.
complete
implementation of all
action plans for the
ex ante
conditionalities on
Public Procurement
and State Aid by the
regulatory deadline
Public procurement: 9 MS implemented action plans with 108 specific actions.
State aid: 4 MS implemented action plans
with 33 specific actions.

regio_aar_2018_annexes
146
General objective 2 - A Connected Digital Single Market
General objective 2: A Connected Digital Single Market
Impact indicator 1: Aggregate score in Digital Economy and Society Index (DESI) EU-28 Explanation: DESI is a composite index that summarises relevant indicators on Europe's digital performance and tracks the evolution of EU Member States in digital competitiveness. The closer the value is to 1, the better. The DESI index is calculated as the weighted average of the five main DESI dimensions: 1 Connectivity (25%), 2 Human Capital (25%), 3 Use of Internet (15%), 4 Integration of Digital Technology (20%) and 5 Digital Public Services (15%). The DESI index is updated once a year. Source of the data: DESI
Baseline (DESI 2015)
Latest known value (DESI - 2018)
Target (2020)
45 [Baseline adjusted: before: 46 acc. to new scale]
54 Increase
DESI has been updated, the indicator list has slightly changed; in addition, move from 0-1 scale to 0-100 scale
Associated specific objective and indicator
The figures presented below result from the performance reporting of the 2014-2020 ERDF/CF programmes. The latest known results correspond to data at end 2017, reported by Member States in the Annual Implementation Reports submitted in May 2018.
It should also be noted that all data reported by the Member States in the Operational programmes are of a dynamic nature – by end 2017, certain values had been revised either because of reprogramming or due to manual corrections (clerical errors). This explains the change in certain indicator values compared to what was reported in REGIO's AAR 2017.
As regards the milestone figures included in the following tables, it should also be noted that they are purely indicative estimates that should not be used to identify cases of underperformance. Moreover, estimated milestones refer to 2018 while the latest available performance data capture the state of play at end 2017. In addition, previous experience shows that the progression of reported achievements is relatively flat in the first years of implementation and usually increases dramatically in the last years.
No evaluation evidence is available as regards programme achievements. A comprehensive ex-post evaluation will be carried out at the end of the 2014-2020 period (scope and precise schedule not yet available).
Specific objective 2.1:
Enhancing access to, and use and quality of, information and
communication technologies
Related to spending programme
ERDF
Indicator 1: Additional households with broadband access of at least 30 Mbps
Source of data: REGIO common indicator 10 (additional population covered by broadband access)
Baseline
(2014)
Interim Milestone (estimate) Target
2014-2023
(cumulative)
Latest known results
(2017) (2018)
0 4,835,000 14,538,844 226,879
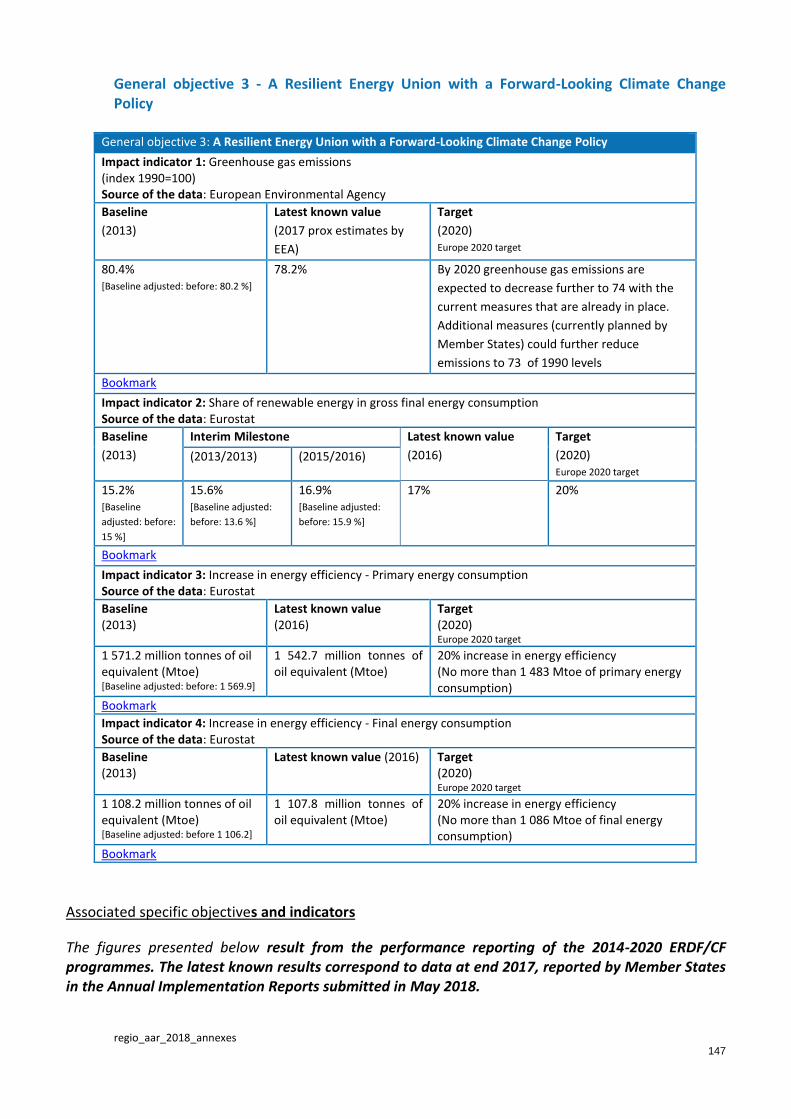
regio_aar_2018_annexes
147
General objective 3 - A Resilient Energy Union with a Forward-Looking Climate Change Policy
General objective 3: A Resilient Energy Union with a Forward-Looking Climate Change Policy
Impact indicator 1: Greenhouse gas emissions (index 1990=100) Source of the data: European Environmental Agency
Baseline
(2013)
Latest known value
(2017 prox estimates by
EEA)
Target
(2020)
Europe 2020 target
80.4% [Baseline adjusted: before: 80.2 %]
78.2% By 2020 greenhouse gas emissions are
expected to decrease further to 74 with the
current measures that are already in place.
Additional measures (currently planned by
Member States) could further reduce
emissions to 73 of 1990 levels
Bookmark
Impact indicator 2: Share of renewable energy in gross final energy consumption Source of the data: Eurostat
Baseline
(2013)
Interim Milestone Latest known value
(2016)
Target
(2020)
Europe 2020 target (2013/2013) (2015/2016)
15.2% [Baseline
adjusted: before:
15 %]
15.6% [Baseline adjusted:
before: 13.6 %]
16.9% [Baseline adjusted:
before: 15.9 %]
17% 20%
Bookmark
Impact indicator 3: Increase in energy efficiency - Primary energy consumption Source of the data: Eurostat
Baseline (2013)
Latest known value (2016)
Target (2020) Europe 2020 target
1 571.2 million tonnes of oil equivalent (Mtoe) [Baseline adjusted: before: 1 569.9]
1 542.7 million tonnes of oil equivalent (Mtoe)
20% increase in energy efficiency (No more than 1 483 Mtoe of primary energy consumption)
Bookmark
Impact indicator 4: Increase in energy efficiency - Final energy consumption Source of the data: Eurostat
Baseline (2013)
Latest known value (2016) Target (2020) Europe 2020 target
1 108.2 million tonnes of oil equivalent (Mtoe) [Baseline adjusted: before 1 106.2]
1 107.8 million tonnes of oil equivalent (Mtoe)
20% increase in energy efficiency (No more than 1 086 Mtoe of final energy consumption)
Bookmark
Associated specific objectives and indicators
The figures presented below result from the performance reporting of the 2014-2020 ERDF/CF programmes. The latest known results correspond to data at end 2017, reported by Member States in the Annual Implementation Reports submitted in May 2018.

regio_aar_2018_annexes
148
It should also be noted that all data reported by the Member States in the Operational programmes are of a dynamic nature – by end 2017, certain values had been revised either because of reprogramming or due to manual corrections (clerical errors). This explains the change in certain indicator values compared to what was reported in REGIO's AAR 2017.
As regards the milestone figures included in the following tables, it should also be noted that they are purely indicative estimates that should not be used to identify cases of underperformance. Moreover, estimated milestones refer to 2018 while the latest available performance data capture the state of play at end 2017. In addition, previous experience shows that the progression of reported achievements is relatively flat in the first years of implementation and usually increases dramatically in the last years.
No evaluation evidence is available as regards programme achievements. A comprehensive ex-post evaluation will be carried out at the end of the 2014-2020 period (scope and precise schedule not yet available).
Specific objective 3.1:
Supporting the shift towards a low-carbon economy in all sectors
Related to spending programme
ERDF/CF
Indicator 1: Additional capacity of renewable energy production-MW
Source of data: REGIO common indicator 30
Baseline
(2014)
Interim Milestone
(estimate)
Target
2014-2023
(cumulative)
Latest known results
(2017)
(2018)
0 19,590 90,624 197
Indicator 2: Number of households with improved energy consumption classification
Source of data: REGIO common indicator 31
Baseline
(2014)
Interim Milestone
(estimate)
Target
2014-2023
(cumulative)
Latest known results
(2017)
(2018)
0 121,100 838,097 84,865
Indicator 3: Decrease of annual primary energy consumption of public buildings
Source of data: REGIO common indicator 32
Baseline
(2014)
Interim Milestone
(estimate)
Target
2014-2023
(cumulative)
Latest known results
(2017)
(2018)
0 550,260,700 4,827,022,253 33,396,011
Specific objective 3.2:
Promoting climate change adaptation, risk prevention and
management
Related to spending programme
ERDF/CF
Indicator 1: Population benefiting from flood protection measures
Source of data: REGIO common indicator 20
Baseline
(2014)
Interim Milestone
(estimate)
Target
2014-2023
(cumulative)
Latest known results
(2017)
(2018)
0 4,541,100 14,737,351 1,668,528
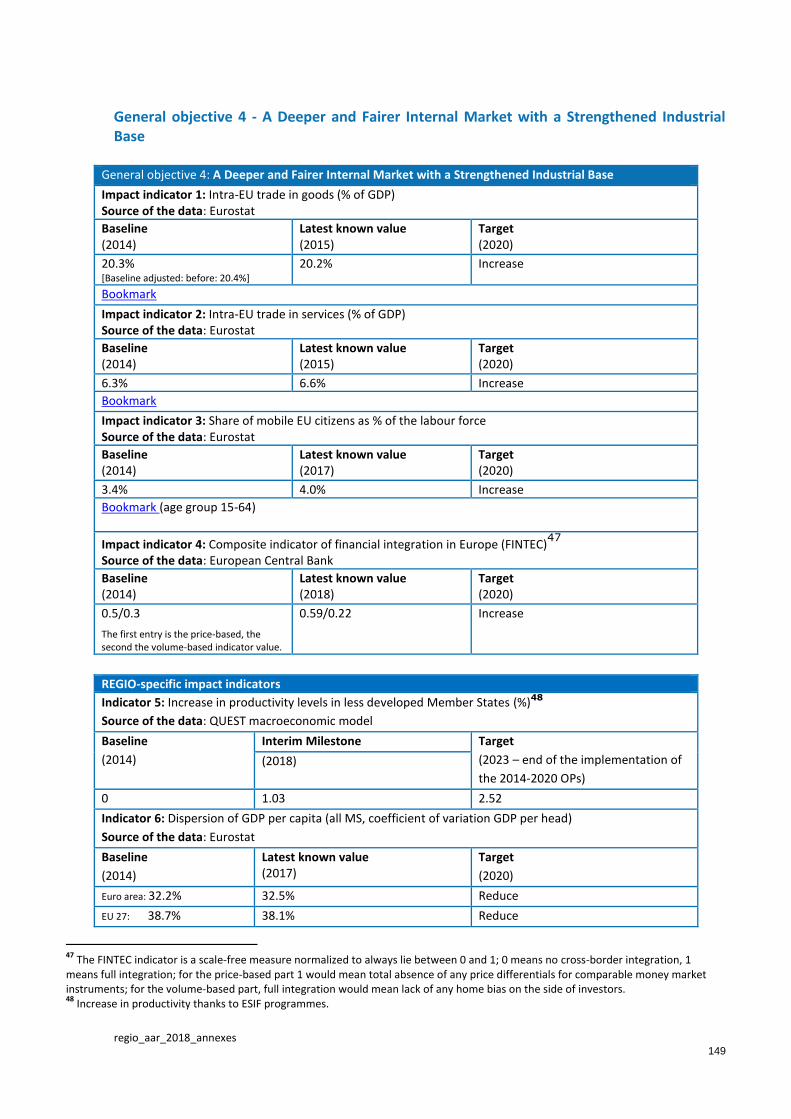
regio_aar_2018_annexes
149
General objective 4 - A Deeper and Fairer Internal Market with a Strengthened Industrial Base
General objective 4: A Deeper and Fairer Internal Market with a Strengthened Industrial Base
Impact indicator 1: Intra-EU trade in goods (% of GDP) Source of the data: Eurostat
Baseline (2014)
Latest known value (2015)
Target (2020)
20.3% [Baseline adjusted: before: 20.4%]
20.2% Increase
Bookmark
Impact indicator 2: Intra-EU trade in services (% of GDP) Source of the data: Eurostat
Baseline (2014)
Latest known value (2015)
Target (2020)
6.3% 6.6% Increase
Bookmark
Impact indicator 3: Share of mobile EU citizens as % of the labour force Source of the data: Eurostat
Baseline (2014)
Latest known value (2017)
Target (2020)
3.4% 4.0% Increase
Bookmark (age group 15-64)
Impact indicator 4: Composite indicator of financial integration in Europe (FINTEC)47
Source of the data: European Central Bank
Baseline (2014)
Latest known value (2018)
Target (2020)
0.5/0.3
The first entry is the price-based, the second the volume-based indicator value.
0.59/0.22 Increase
REGIO-specific impact indicators
Indicator 5: Increase in productivity levels in less developed Member States (%)48
Source of the data: QUEST macroeconomic model
Baseline
(2014)
Interim Milestone Target
(2023 – end of the implementation of
the 2014-2020 OPs)
(2018)
0 1.03 2.52
Indicator 6: Dispersion of GDP per capita (all MS, coefficient of variation GDP per head)
Source of the data: Eurostat
Baseline
(2014)
Latest known value (2017)
Target
(2020)
Euro area: 32.2% 32.5% Reduce
EU 27: 38.7% 38.1% Reduce
47
The FINTEC indicator is a scale-free measure normalized to always lie between 0 and 1; 0 means no cross-border integration, 1 means full integration; for the price-based part 1 would mean total absence of any price differentials for comparable money market instruments; for the volume-based part, full integration would mean lack of any home bias on the side of investors. 48
Increase in productivity thanks to ESIF programmes.
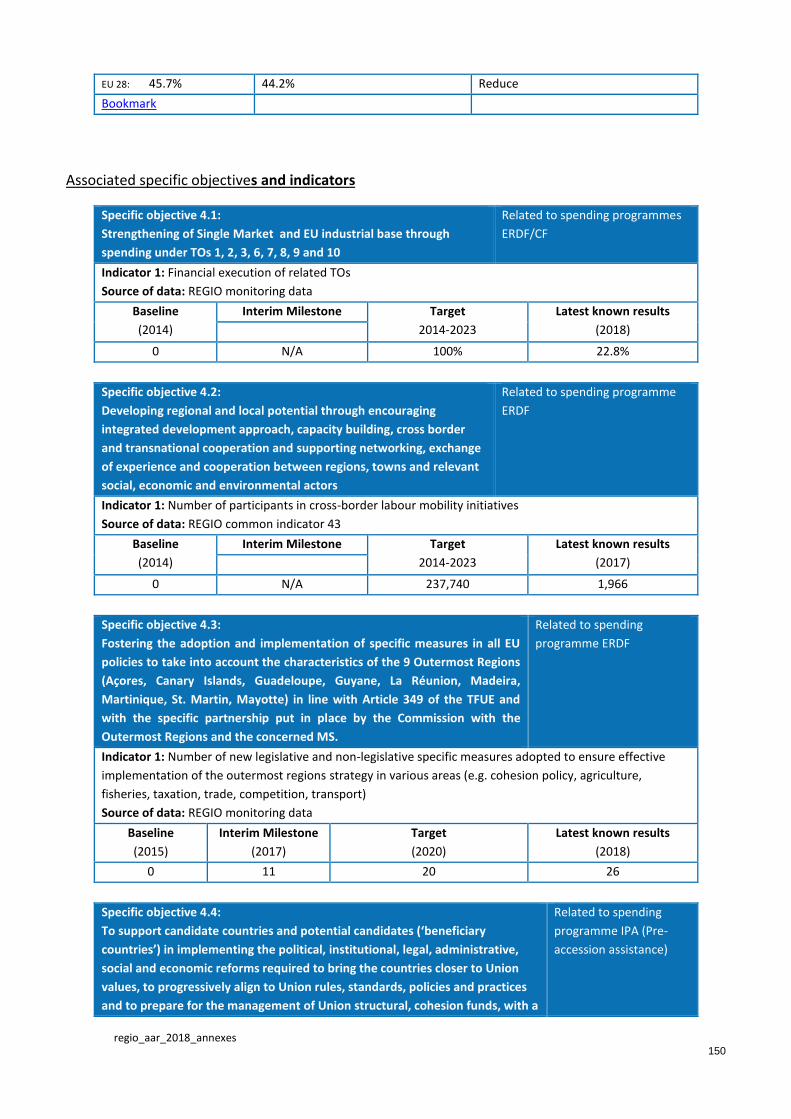
regio_aar_2018_annexes
150
EU 28: 45.7% 44.2% Reduce
Bookmark
Associated specific objectives and indicators
Specific objective 4.1:
Strengthening of Single Market and EU industrial base through
spending under TOs 1, 2, 3, 6, 7, 8, 9 and 10
Related to spending programmes
ERDF/CF
Indicator 1: Financial execution of related TOs
Source of data: REGIO monitoring data
Baseline
(2014)
Interim Milestone Target
2014-2023
Latest known results
(2018)
0 N/A 100% 22.8%
Specific objective 4.2:
Developing regional and local potential through encouraging
integrated development approach, capacity building, cross border
and transnational cooperation and supporting networking, exchange
of experience and cooperation between regions, towns and relevant
social, economic and environmental actors
Related to spending programme
ERDF
Indicator 1: Number of participants in cross-border labour mobility initiatives
Source of data: REGIO common indicator 43
Baseline
(2014)
Interim Milestone Target
2014-2023
Latest known results
(2017)
0 N/A 237,740 1,966
Specific objective 4.3:
Fostering the adoption and implementation of specific measures in all EU
policies to take into account the characteristics of the 9 Outermost Regions
(Açores, Canary Islands, Guadeloupe, Guyane, La Réunion, Madeira,
Martinique, St. Martin, Mayotte) in line with Article 349 of the TFUE and
with the specific partnership put in place by the Commission with the
Outermost Regions and the concerned MS.
Related to spending
programme ERDF
Indicator 1: Number of new legislative and non-legislative specific measures adopted to ensure effective
implementation of the outermost regions strategy in various areas (e.g. cohesion policy, agriculture,
fisheries, taxation, trade, competition, transport)
Source of data: REGIO monitoring data
Baseline
(2015)
Interim Milestone
(2017)
Target
(2020)
Latest known results
(2018)
0 11 20 26
Specific objective 4.4:
To support candidate countries and potential candidates (‘beneficiary
countries’) in implementing the political, institutional, legal, administrative,
social and economic reforms required to bring the countries closer to Union
values, to progressively align to Union rules, standards, policies and practices
and to prepare for the management of Union structural, cohesion funds, with a
Related to spending
programme IPA (Pre-
accession assistance)

regio_aar_2018_annexes
151
view to Union membership.
Indicator 1: Commission Decisions on Conferral of Management (Decentralized Implementation System
under IPA Component III in place for all 5 Operational Programmes of the former Yugoslav Republic of
Macedonia, Montenegro, Turkey)
Source of data: Source: (Article 14 of Commission Regulation (EC) No 718/2007 of 12 June 2007)
Baseline
(2007)
Interim Milestones Target
(2017)49
Latest known
results (2018) 2013 2014 2015
0
4 (1 North
Macedonia, 3 Turkey)
5
(1 North Macedonia, 3
Turkey, 1 Montenegro)
5
(1 North Macedonia, 3
Turkey, 1 Montenegro
5 (1 North Macedonia, 3
Turkey, 1 Montenegro)
5 (1 North Macedonia, 3
Turkey, 1 Montenegro)
Indicator 2: Screening Reports (SR), Opening Benchmarks (OB), and EU Common Positions (EUCP) adopted
relative to the accession of individual candidate countries
Source of data: DG NEAR data
Baseline
(2007)
Interim Milestones Target
(2019)50
Latest known
results (2018) 2013 2015 2016
1
(Turkey)
7 Iceland:
SR+OB+EUCP Turkey:
SR+O B + EUCP Montenegro:
SR
8 Iceland:
SR+OB+EUCP Turkey:
SR+O B + EUCP Montenegro:
SR+OB
10 Iceland:
SR+OB+EUCP Turkey:
SR+O B + EUCP Montenegro:
SR+OB Serbia: SR+OB
9 Turkey:
SR+O B + EUCP Montenegro: SR+OB+ EUCP
Serbia: SR+OB+ EUCP
8 Turkey:
SR+OB+EUCP Montenegro: SR+OB+EUCP
Serbia: SR+OB
49
End of eligibility period throughout which it is necessary not only to achieve but also to maintain budget management powers under IPA 2007-2013 50
End of mandate of present Commission; end of mandate of IPA/accession negotiations sector
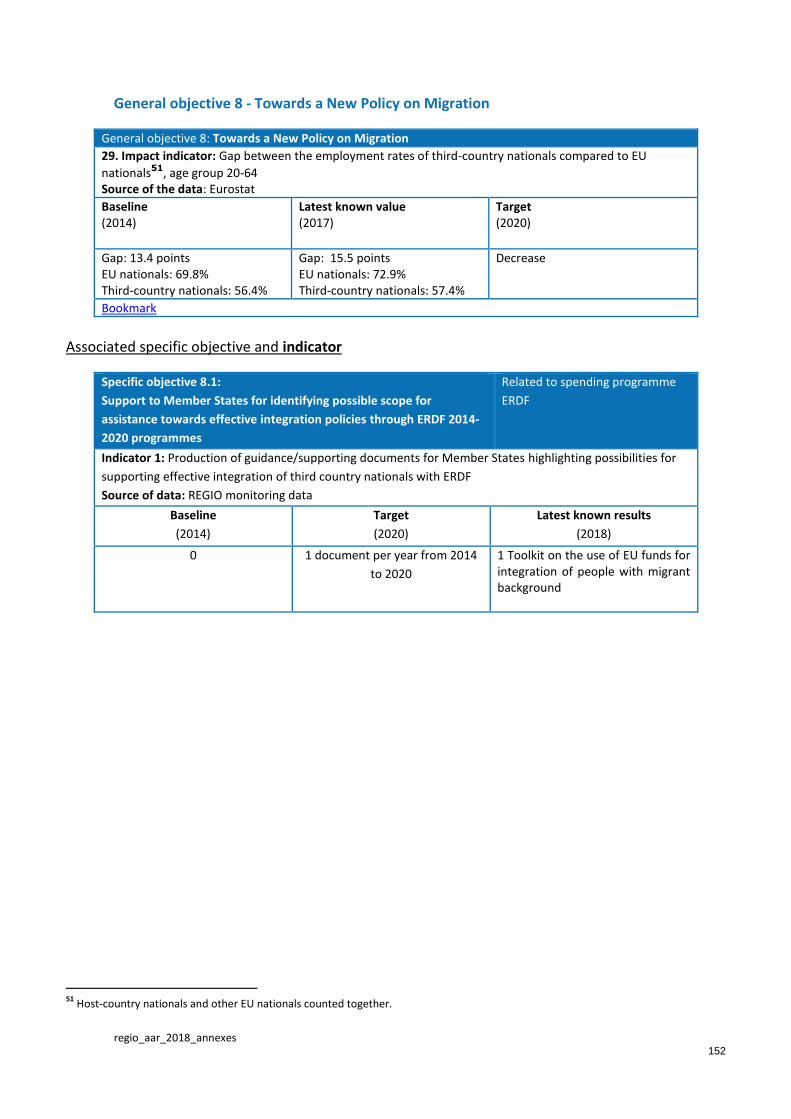
regio_aar_2018_annexes
152
General objective 8 - Towards a New Policy on Migration
General objective 8: Towards a New Policy on Migration
29. Impact indicator: Gap between the employment rates of third-country nationals compared to EU
nationals51, age group 20-64 Source of the data: Eurostat
Baseline (2014)
Latest known value (2017)
Target (2020)
Gap: 13.4 points EU nationals: 69.8% Third-country nationals: 56.4%
Gap: 15.5 points EU nationals: 72.9% Third-country nationals: 57.4%
Decrease
Bookmark
Associated specific objective and indicator
Specific objective 8.1:
Support to Member States for identifying possible scope for
assistance towards effective integration policies through ERDF 2014-
2020 programmes
Related to spending programme
ERDF
Indicator 1: Production of guidance/supporting documents for Member States highlighting possibilities for
supporting effective integration of third country nationals with ERDF
Source of data: REGIO monitoring data
Baseline
(2014)
Target
(2020)
Latest known results
(2018)
0 1 document per year from 2014
to 2020
1 Toolkit on the use of EU funds for integration of people with migrant background
51
Host-country nationals and other EU nationals counted together.
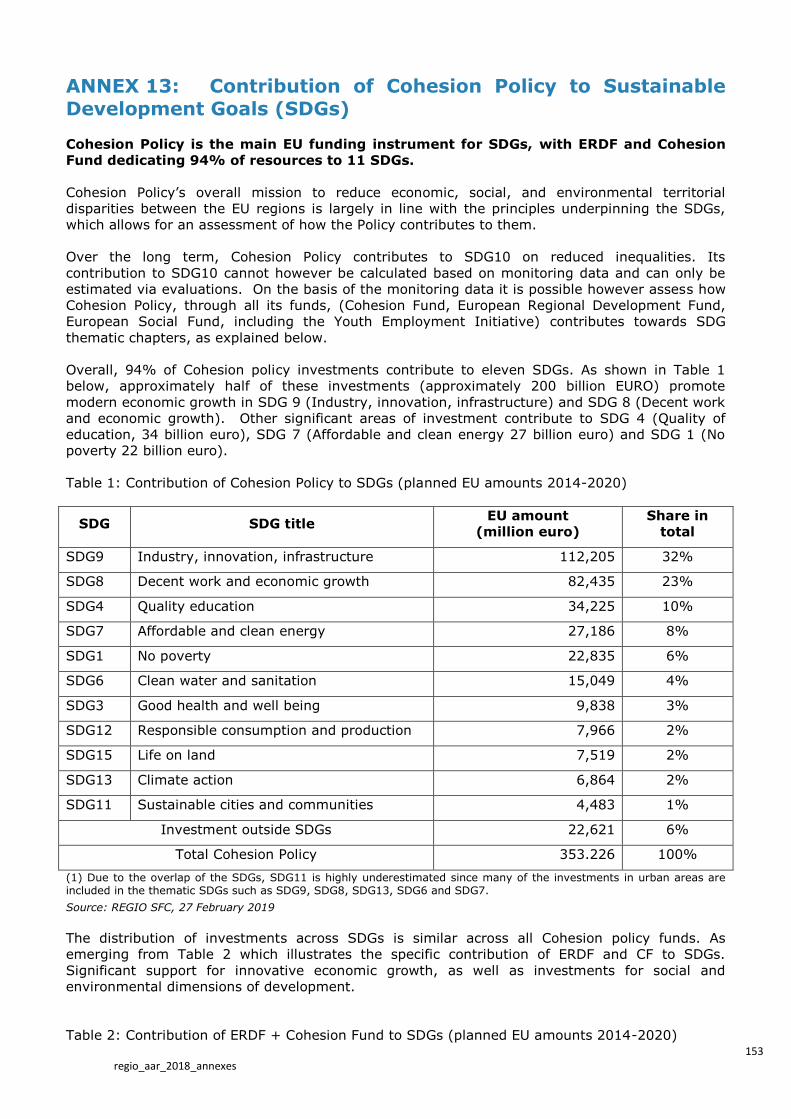
153 regio_aar_2018_annexes
ANNEX 13: Contribution of Cohesion Policy to Sustainable
Development Goals (SDGs)
Cohesion Policy is the main EU funding instrument for SDGs, with ERDF and Cohesion
Fund dedicating 94% of resources to 11 SDGs.
Cohesion Policy’s overall mission to reduce economic, social, and environmental territorial
disparities between the EU regions is largely in line with the principles underpinning the SDGs,
which allows for an assessment of how the Policy contributes to them.
Over the long term, Cohesion Policy contributes to SDG10 on reduced inequalities. Its
contribution to SDG10 cannot however be calculated based on monitoring data and can only be
estimated via evaluations. On the basis of the monitoring data it is possible however assess how
Cohesion Policy, through all its funds, (Cohesion Fund, European Regional Development Fund,
European Social Fund, including the Youth Employment Initiative) contributes towards SDG
thematic chapters, as explained below.
Overall, 94% of Cohesion policy investments contribute to eleven SDGs. As shown in Table 1
below, approximately half of these investments (approximately 200 billion EURO) promote
modern economic growth in SDG 9 (Industry, innovation, infrastructure) and SDG 8 (Decent work
and economic growth). Other significant areas of investment contribute to SDG 4 (Quality of
education, 34 billion euro), SDG 7 (Affordable and clean energy 27 billion euro) and SDG 1 (No
poverty 22 billion euro).
Table 1: Contribution of Cohesion Policy to SDGs (planned EU amounts 2014-2020)
SDG SDG title EU amount
(million euro)
Share in
total
SDG9 Industry, innovation, infrastructure 112,205 32%
SDG8 Decent work and economic growth 82,435 23%
SDG4 Quality education 34,225 10%
SDG7 Affordable and clean energy 27,186 8%
SDG1 No poverty 22,835 6%
SDG6 Clean water and sanitation 15,049 4%
SDG3 Good health and well being 9,838 3%
SDG12 Responsible consumption and production 7,966 2%
SDG15 Life on land 7,519 2%
SDG13 Climate action 6,864 2%
SDG11 Sustainable cities and communities 4,483 1%
Investment outside SDGs 22,621 6%
Total Cohesion Policy 353.226 100%
(1) Due to the overlap of the SDGs, SDG11 is highly underestimated since many of the investments in urban areas are included in the thematic SDGs such as SDG9, SDG8, SDG13, SDG6 and SDG7.
Source: REGIO SFC, 27 February 2019
The distribution of investments across SDGs is similar across all Cohesion policy funds. As
emerging from Table 2 which illustrates the specific contribution of ERDF and CF to SDGs.
Significant support for innovative economic growth, as well as investments for social and
environmental dimensions of development.
Table 2: Contribution of ERDF + Cohesion Fund to SDGs (planned EU amounts 2014-2020)
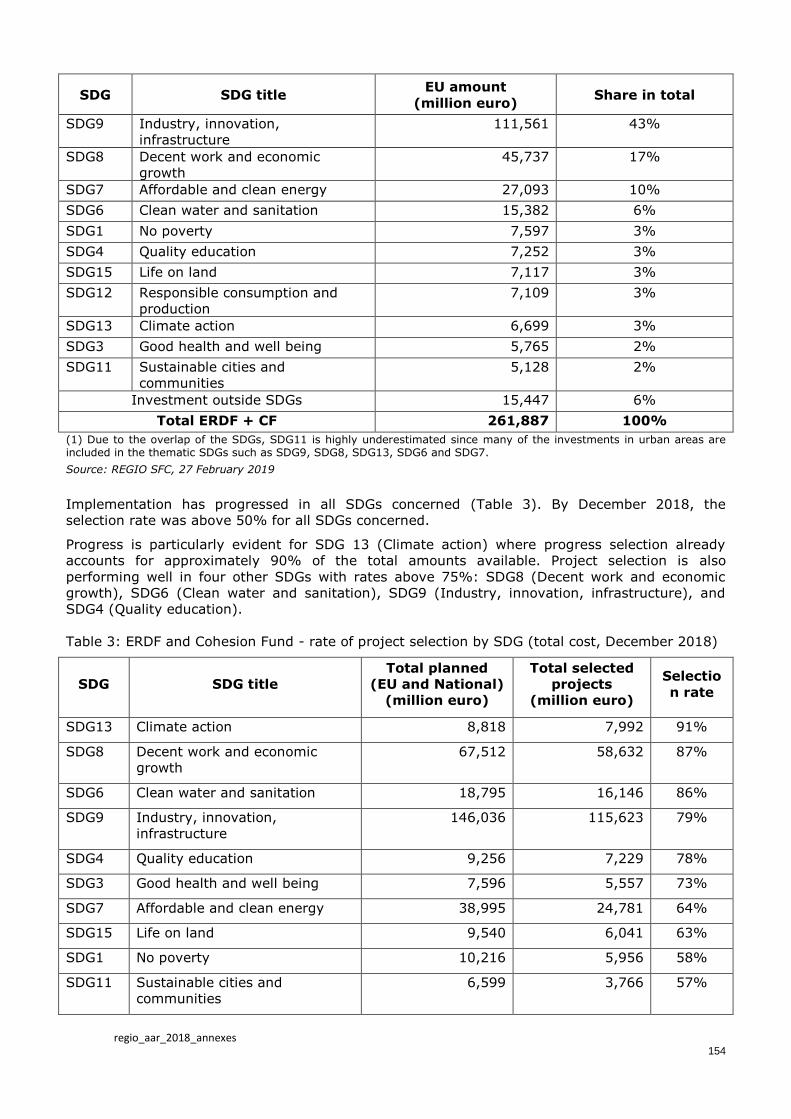
regio_aar_2018_annexes
154
SDG SDG title EU amount
(million euro) Share in total
SDG9 Industry, innovation,
infrastructure
111,561 43%
SDG8 Decent work and economic
growth
45,737 17%
SDG7 Affordable and clean energy 27,093 10%
SDG6 Clean water and sanitation 15,382 6%
SDG1 No poverty 7,597 3%
SDG4 Quality education 7,252 3%
SDG15 Life on land 7,117 3%
SDG12 Responsible consumption and
production
7,109 3%
SDG13 Climate action 6,699 3%
SDG3 Good health and well being 5,765 2%
SDG11 Sustainable cities and
communities
5,128 2%
Investment outside SDGs 15,447 6%
Total ERDF + CF 261,887 100%
(1) Due to the overlap of the SDGs, SDG11 is highly underestimated since many of the investments in urban areas are included in the thematic SDGs such as SDG9, SDG8, SDG13, SDG6 and SDG7.
Source: REGIO SFC, 27 February 2019
Implementation has progressed in all SDGs concerned (Table 3). By December 2018, the
selection rate was above 50% for all SDGs concerned.
Progress is particularly evident for SDG 13 (Climate action) where progress selection already
accounts for approximately 90% of the total amounts available. Project selection is also
performing well in four other SDGs with rates above 75%: SDG8 (Decent work and economic
growth), SDG6 (Clean water and sanitation), SDG9 (Industry, innovation, infrastructure), and
SDG4 (Quality education).
Table 3: ERDF and Cohesion Fund - rate of project selection by SDG (total cost, December 2018)
SDG SDG title
Total planned
(EU and National)
(million euro)
Total selected
projects
(million euro)
Selectio
n rate
SDG13 Climate action 8,818 7,992 91%
SDG8 Decent work and economic
growth
67,512 58,632 87%
SDG6 Clean water and sanitation 18,795 16,146 86%
SDG9 Industry, innovation,
infrastructure
146,036 115,623 79%
SDG4 Quality education 9,256 7,229 78%
SDG3 Good health and well being 7,596 5,557 73%
SDG7 Affordable and clean energy 38,995 24,781 64%
SDG15 Life on land 9,540 6,041 63%
SDG1 No poverty 10,216 5,956 58%
SDG11 Sustainable cities and
communities
6,599 3,766 57%
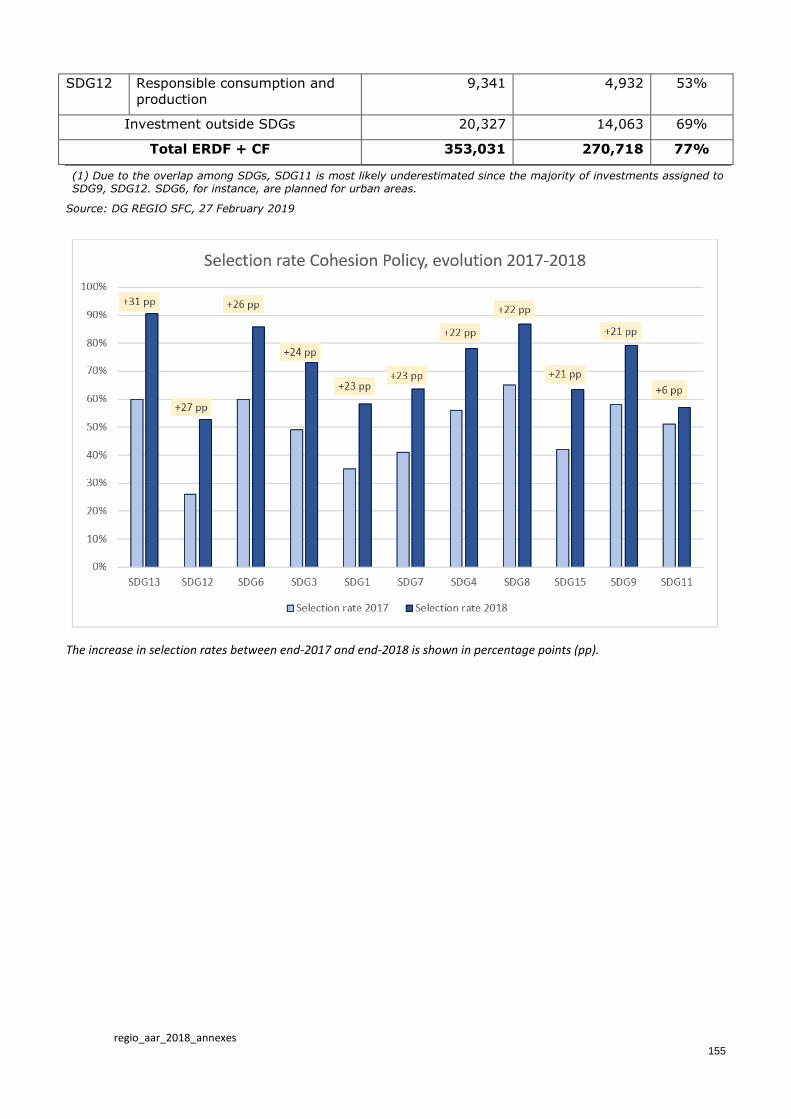
regio_aar_2018_annexes
155
SDG12 Responsible consumption and
production
9,341 4,932 53%
Investment outside SDGs 20,327 14,063 69%
Total ERDF + CF 353,031 270,718 77%
(1) Due to the overlap among SDGs, SDG11 is most likely underestimated since the majority of investments assigned to SDG9, SDG12. SDG6, for instance, are planned for urban areas.
Source: DG REGIO SFC, 27 February 2019
The increase in selection rates between end-2017 and end-2018 is shown in percentage points (pp).


