32
2018 ANNUAL REPORT

2018ANNUALREPORT
FOUNDED IN 1890 . REDISCOVERED EVERY DAY .


CONTENTS
Financial Highlights 2
Message to Shareholders 3
Report of Independent Auditors 5
Consolidated Balance Sheets 6
Consolidated Statements of Income 7
Consolidated Statements of Comprehensive Income 8
Consolidated Statements of Changes in Shareholders’ Equity 8
Consolidated Statements of Cash Flows 9
Notes to Consolidated Financial Statements 10
Directors 26
Officers 26
OfficeLocations 27
ATMLocations 27
The Annual Meeting of the shareholders of Century Financial Corporation will be held March 19, 2019 at 4:00 p.m., at the DearthCommunityCenter,GarfieldRoad,Coldwater,Michigan.
F I N A N C I A L C O R P O R A T I O N
F I N A N C I A L C O R P O R A T I O N
Century Financial Corporation
Company Profile 28

Financial HighlightsCentury Financial Corporation
2014 2013For the Year Net Income $ 2,441,000 $ 2,410,000 Cash Dividends 812,664 661,424 Return on Average Assets 0.90% 0.90% Return on Average Equity 8.20% 8.46%
At Year End Assets $ 272,033,000 $ 270,517,000 Deposits 236,342,000 238,660,000 NetLoans 167,590,000 149,005,000 Shareholders' Equity 31,207,000 28,318,000
Per Share Basic Earnings $ 1.26 $ 1.24 Diluted Earnings 1.26 1.24 Cash Dividends 0.42 0.34
16.13 14.64
2
Financial Highlights
Century Financial Corporation is a Michigan bank holding company with Century Bank and Trust as its only wholly-ownedsubsidiary.CenturyBankandTrustoffersafullrangeoffinancialandtrustservicesthrough
asystemofelevenbankingofficeslocatedinBranch,St.JosephandHillsdaleCountiesinMichigan.
Century Financial Corporation
2018 2017For the Year Net Income $ 3,823,000 $ 1,146,000 Cash Dividends 1,145,000 1,037,000 Return on Average Assets 1.24% 0.38% Return on Average Equity 10.27% 3.24%
At Year End Assets $ 315,568,000 $ 301,539,000 Deposits 273,539,000 258,184,000 Net Loans 203,474,000 189,423,000 Shareholders' Equity 37,957,000 36,501,000
Per Share Basic and Diluted Earnings $ 2.00 $ 0.60 Cash Dividends 0.60 0.54 Book Value -- December 31 20.01 19.00
Message to Shareholders
3
Dear Fellow Shareholders,
I am pleased to announce that 2013 was another solid year for Century Financial Corporation and its subsidiary Century Bank and Trust. Your company earned $2,410,000 or basic earnings per share of $1.24 for the year. This is a strong increase over 2012 results when net income of $2,171,000 and earnings per share of $1.10 were reported.
The 2013 performance represents a return on average assets (ROA) of 0.90% and a return on average equity (ROE) of 8.46%. Corresponding numbers for 2012 were 0.82% ROA and 8.16% ROE.
There were a number of positive things in our 2013 operations that contributed to the 11% increase in year-over-year net income and strongboostinearningspershare.However,itisimportanttorecognizethefirstandforemostcontributingfactortoCenturyBankand Trust’s success is our 130 talented and dedicated employees who serve our customers and communities.
During 2013 we were again able to exceed the key operating measure of total revenue. This component is the combination of net interest and non-interest income. Our total revenue for 2013 was $13,326,000 compared to $13,033,000 in 2012. The diversificationofourrevenuestreamduringthiseraofhistoricallylowinterestrateshasbeenanimportantaspectofourresults–for 2013 net interest income constituted approximately 64% of revenue with non-interest income at 36%. Major contributors to revenue for the year were our commercial lending, mortgage lending and trust and investment management teams. Our commercial lenders diligently grew existing relationships and established new ones as our local business economy continues to rebound. Our mortgage lenders, once again, feverishly worked to assist customers in taking advantage of the attractively low residential mortgage rates. And our Trust and Investment Management Group continued growing our client base who seeks investment management, trust and estate planning services. This group’s dedicated effort for clients allowed them to end 2013 at record levels for both assets under management and department revenue. Equally as impressive and important to 2013 results was our focus on implementing efficienciesandreducingcostsinouroperations.Ourretaildepositandoperationsteamsreducedthecombinationoftotalinterestand non-interest expense by $510,000 as compared to 2012 levels.
Century Bank and Trust’s balance sheet continues to be very strong and exhibits top tier banking industry capital ratios and liquidity. At 12-31-13 total assets were $270,517,000 up from 2012 total assets of $266,001,000. Total deposits grew slightly more than $6,000,000 ending the year at $238,660,000. The asset quality measures of the loan portfolio within the balance sheet remain solid with important reductions during 2013 in the key categories of nonaccrual loans and other real estate owned. Additionally, a sound allowance for loan loss reserve is maintained as a percentage of total loans.
In last year’s letter to you, I reinforced the Board of Directors’ long-term commitment of creating shareholder value and focus on the dividend. Century Financial Corporation (CFC) adjusted its dividend twice during 2013, increasing it $0.02 per share both in March and December. An annual cash dividend of $0.34 per share was paid in 2013, as compared to $0.25 per share in 2012. Additionally, via a Board authorized program, CFC repurchased 28,903 shares of stock on the open market during the year. A similar repurchase programhasbeenapprovedtobeutilizedin2014.Ourshareholdersalsobenefitedfromanincreaseinstockpricewhichbegantheyear at $8.23 and ended it at $12.35.
Fortheupcomingyear,weexpectfamiliartestsinthecommunitybankingoperatingenvironment–thecontinuingchallengeofnavigatinglowinterestratesandreducedresidentialmortgagerefinanceactivitybeingthemainones.IbelieveCenturyBankandTrustiswell-positionedandhasasuccessfultrackrecordthatreflectsourabilitytoperformappropriatelyagainsttheseheadwinds.Your bank team will continue its focus and execute on the foundation that drives our long-term success: (1) grow and retain profitablebusinessactivity,(2)maintainstrongassetquality,(3)manageoperatingexpensesand(4)implementefficiencies.
Beforeclosing,Iwanttothankeachcustomer,employee,directorandshareholderfortheloyaltyandconfidenceyouexpressinourcompany.YourcommitmentandcontinuedsupportarewhatmakeCenturyBankandTrustsuchanexceptionalorganization–nowand into the future.
I look forward to reporting to you as we move into 2014.
Eric H. Beckhusen Chairman & CEO
Financial HighlightsCentury Financial Corporation
2014 2013For the Year Net Income $ 2,441,000 $ 2,410,000 Cash Dividends 812,664 661,424 Return on Average Assets 0.90% 0.90% Return on Average Equity 8.20% 8.46%
At Year End Assets $ 272,033,000 $ 270,517,000 Deposits 236,342,000 238,660,000 NetLoans 167,590,000 149,005,000 Shareholders' Equity 31,207,000 28,318,000
Per Share Basic Earnings $ 1.26 $ 1.24 Diluted Earnings 1.26 1.24 Cash Dividends 0.42 0.34
16.13 14.64
Century Financial Corporation
Dear Fellow Shareholders,
It is my pleasure to announce the annual performance for Century Financial Corporation and its subsidiary Century Bank and Trust in 2018. Our company reported net income of $3,823,000 or basic earnings per share of $2.00 for the year. This compares to net income of $1,146,000 and earnings per share of $0.60 reported to you in 2017.
The 2018 performance represents a return on average assets (ROA) of 1.24% and a return on average equity (ROE) of 10.27%. In 2017, ROA and ROE were 0.38% and 3.24%, respectively.
As a reminder, the skewed trend-line you notice when comparing 2018 to 2017 results is primarily related to the one-time, pre-tax expense associated with terminating and settling the Bank’s defined benefit pension plan in 2017. A final distribution of plan assets were made to participants in December 2017 – resulting in a pension related expense for 2017 totaling $2,838,000. Additionally in 2017, the entire banking
industry had to adjust for the corporate tax code approved late in the year. After accounting for the new tax code based on the Corporation’s net deferred tax assets, the Bank recorded $196,000 more in income tax for 2017 than it normally would have. When 2017 is adjusted for these unusual events, net income would have been $3,076,000 or $1.60 per share with a ROA of 1.03% and ROE of 8.47%.
As you’ve come to recognize in my communications with you, I firmly believe in giving credit where credit is due. Your company’s results in 2018 were – without doubt – driven by our dedicated and talented team of employees. Their daily passion and work ethic in serving our customers, communities and shareholders is truly remarkable. I enthusiastically welcome the chance to once again echo my sincere gratitude for the privilege of working alongside each of them.
Strong capital, liquidity and core deposit funding continue to be key details describing Century Bank and Trust’s balance sheet. Total assets grew $14,029,000 or 4.65% ending 12-31-18 at $315,568,000. At 12-31-17, asset levels of $301,539,000 were reported.
The loan portfolio grew $14,426,000, or 7.53%, on an annual basis. Both our commercial and residential lending teams contributed to the growth. At 12-31-18, total loans were $206,050,000 with an allowance for loan loss reserve of $2,575,000 or 1.25% of the loan portfolio. For the same period in 2017, loans totaled $191,624,000 with an allowance for loan loss reserve of $2,201,000 or 1.15% of the loan portfolio. Century Bank and Trust continues to service our customers’ residential mortgage loans that are sold to the secondary market. This off-balance sheet portfolio was $116,580,000 at 12-31-18 compared to $111,331,000 at 12-31-17. Net loan loss in 2018, as a percentage of average loans was 0.23%, compared to 0.17% in 2017. At December 31, 2018, nonaccrual loans totaled $1,762,000 and Other Real Estate Owned was $283,000. At December 2017, these categories stood at $1,942,000 and $305,000, respectively.
Total deposits grew, ending 2018 at $273,539,000 – this compares to total deposits of $258,184,000 at 12-31-17. Our deposit service teams continue their strong work on maintaining and growing important core deposit products of personal and business checking and savings accounts.
Century Bank and Trust’s capital levels soundly exceed requirements to be considered “well capitalized” by bank regulatory agencies. At 12-31-18, the core capital ratios banking institutions are measured by stood at: Total capital/risk weighted assets – 16.68%, Tier 1 capital/risk weighted assets – 15.66% and Tier 1 capital/average assets – 13.08%. These measures at 12-31-17 were 16.60%, 15.67% and 12.52%, respectively. The continued strong local and national economy along with the reduced corporate tax rate in 2018 were both welcomed and contributed positively as the year progressed. For the year, the Bank’s federal income tax was $340,000 lower than what was paid in 2017. Additionally, with four rate increases by the Federal Open Market Committee in 2018, the Bank’s growing loan portfolio saw a nice adjustment in yield. Net interest margin for the year was 4.01% compared to 3.69% in 2017.
The foundation of Century Bank and Trust’s business model continues to be based on lending to our local communities and providing quality products and services that generate fee income. Wrapped around both is the core focus of providing outstanding, customer-centered service.

Message to Shareholders (continued)
3
Dear Fellow Shareholders,
I am pleased to announce that 2013 was another solid year for Century Financial Corporation and its subsidiary Century Bank and Trust. Your company earned $2,410,000 or basic earnings per share of $1.24 for the year. This is a strong increase over 2012 results when net income of $2,171,000 and earnings per share of $1.10 were reported.
The 2013 performance represents a return on average assets (ROA) of 0.90% and a return on average equity (ROE) of 8.46%. Corresponding numbers for 2012 were 0.82% ROA and 8.16% ROE.
There were a number of positive things in our 2013 operations that contributed to the 11% increase in year-over-year net income and strongboostinearningspershare.However,itisimportanttorecognizethefirstandforemostcontributingfactortoCenturyBankand Trust’s success is our 130 talented and dedicated employees who serve our customers and communities.
During 2013 we were again able to exceed the key operating measure of total revenue. This component is the combination of net interest and non-interest income. Our total revenue for 2013 was $13,326,000 compared to $13,033,000 in 2012. The diversificationofourrevenuestreamduringthiseraofhistoricallylowinterestrateshasbeenanimportantaspectofourresults–for 2013 net interest income constituted approximately 64% of revenue with non-interest income at 36%. Major contributors to revenue for the year were our commercial lending, mortgage lending and trust and investment management teams. Our commercial lenders diligently grew existing relationships and established new ones as our local business economy continues to rebound. Our mortgage lenders, once again, feverishly worked to assist customers in taking advantage of the attractively low residential mortgage rates. And our Trust and Investment Management Group continued growing our client base who seeks investment management, trust and estate planning services. This group’s dedicated effort for clients allowed them to end 2013 at record levels for both assets under management and department revenue. Equally as impressive and important to 2013 results was our focus on implementing efficienciesandreducingcostsinouroperations.Ourretaildepositandoperationsteamsreducedthecombinationoftotalinterestand non-interest expense by $510,000 as compared to 2012 levels.
Century Bank and Trust’s balance sheet continues to be very strong and exhibits top tier banking industry capital ratios and liquidity. At 12-31-13 total assets were $270,517,000 up from 2012 total assets of $266,001,000. Total deposits grew slightly more than $6,000,000 ending the year at $238,660,000. The asset quality measures of the loan portfolio within the balance sheet remain solid with important reductions during 2013 in the key categories of nonaccrual loans and other real estate owned. Additionally, a sound allowance for loan loss reserve is maintained as a percentage of total loans.
In last year’s letter to you, I reinforced the Board of Directors’ long-term commitment of creating shareholder value and focus on the dividend. Century Financial Corporation (CFC) adjusted its dividend twice during 2013, increasing it $0.02 per share both in March and December. An annual cash dividend of $0.34 per share was paid in 2013, as compared to $0.25 per share in 2012. Additionally, via a Board authorized program, CFC repurchased 28,903 shares of stock on the open market during the year. A similar repurchase programhasbeenapprovedtobeutilizedin2014.Ourshareholdersalsobenefitedfromanincreaseinstockpricewhichbegantheyear at $8.23 and ended it at $12.35.
Fortheupcomingyear,weexpectfamiliartestsinthecommunitybankingoperatingenvironment–thecontinuingchallengeofnavigatinglowinterestratesandreducedresidentialmortgagerefinanceactivitybeingthemainones.IbelieveCenturyBankandTrustiswell-positionedandhasasuccessfultrackrecordthatreflectsourabilitytoperformappropriatelyagainsttheseheadwinds.Your bank team will continue its focus and execute on the foundation that drives our long-term success: (1) grow and retain profitablebusinessactivity,(2)maintainstrongassetquality,(3)manageoperatingexpensesand(4)implementefficiencies.
Beforeclosing,Iwanttothankeachcustomer,employee,directorandshareholderfortheloyaltyandconfidenceyouexpressinourcompany.YourcommitmentandcontinuedsupportarewhatmakeCenturyBankandTrustsuchanexceptionalorganization–nowand into the future.
I look forward to reporting to you as we move into 2014.
Eric H. Beckhusen Chairman & CEO
Financial HighlightsCentury Financial Corporation
2014 2013For the Year Net Income $ 2,441,000 $ 2,410,000 Cash Dividends 812,664 661,424 Return on Average Assets 0.90% 0.90% Return on Average Equity 8.20% 8.46%
At Year End Assets $ 272,033,000 $ 270,517,000 Deposits 236,342,000 238,660,000 NetLoans 167,590,000 149,005,000 Shareholders' Equity 31,207,000 28,318,000
Per Share Basic Earnings $ 1.26 $ 1.24 Diluted Earnings 1.26 1.24 Cash Dividends 0.42 0.34
16.13 14.64
Century Financial Corporation
Message to Shareholders
3
Dear Fellow Shareholders,
I am pleased to announce that 2013 was another solid year for Century Financial Corporation and its subsidiary Century Bank and Trust. Your company earned $2,410,000 or basic earnings per share of $1.24 for the year. This is a strong increase over 2012 results when net income of $2,171,000 and earnings per share of $1.10 were reported.
The 2013 performance represents a return on average assets (ROA) of 0.90% and a return on average equity (ROE) of 8.46%. Corresponding numbers for 2012 were 0.82% ROA and 8.16% ROE.
There were a number of positive things in our 2013 operations that contributed to the 11% increase in year-over-year net income and strongboostinearningspershare.However,itisimportanttorecognizethefirstandforemostcontributingfactortoCenturyBankand Trust’s success is our 130 talented and dedicated employees who serve our customers and communities.
During 2013 we were again able to exceed the key operating measure of total revenue. This component is the combination of net interest and non-interest income. Our total revenue for 2013 was $13,326,000 compared to $13,033,000 in 2012. The diversificationofourrevenuestreamduringthiseraofhistoricallylowinterestrateshasbeenanimportantaspectofourresults–for 2013 net interest income constituted approximately 64% of revenue with non-interest income at 36%. Major contributors to revenue for the year were our commercial lending, mortgage lending and trust and investment management teams. Our commercial lenders diligently grew existing relationships and established new ones as our local business economy continues to rebound. Our mortgage lenders, once again, feverishly worked to assist customers in taking advantage of the attractively low residential mortgage rates. And our Trust and Investment Management Group continued growing our client base who seeks investment management, trust and estate planning services. This group’s dedicated effort for clients allowed them to end 2013 at record levels for both assets under management and department revenue. Equally as impressive and important to 2013 results was our focus on implementing efficienciesandreducingcostsinouroperations.Ourretaildepositandoperationsteamsreducedthecombinationoftotalinterestand non-interest expense by $510,000 as compared to 2012 levels.
Century Bank and Trust’s balance sheet continues to be very strong and exhibits top tier banking industry capital ratios and liquidity. At 12-31-13 total assets were $270,517,000 up from 2012 total assets of $266,001,000. Total deposits grew slightly more than $6,000,000 ending the year at $238,660,000. The asset quality measures of the loan portfolio within the balance sheet remain solid with important reductions during 2013 in the key categories of nonaccrual loans and other real estate owned. Additionally, a sound allowance for loan loss reserve is maintained as a percentage of total loans.
In last year’s letter to you, I reinforced the Board of Directors’ long-term commitment of creating shareholder value and focus on the dividend. Century Financial Corporation (CFC) adjusted its dividend twice during 2013, increasing it $0.02 per share both in March and December. An annual cash dividend of $0.34 per share was paid in 2013, as compared to $0.25 per share in 2012. Additionally, via a Board authorized program, CFC repurchased 28,903 shares of stock on the open market during the year. A similar repurchase programhasbeenapprovedtobeutilizedin2014.Ourshareholdersalsobenefitedfromanincreaseinstockpricewhichbegantheyear at $8.23 and ended it at $12.35.
Fortheupcomingyear,weexpectfamiliartestsinthecommunitybankingoperatingenvironment–thecontinuingchallengeofnavigatinglowinterestratesandreducedresidentialmortgagerefinanceactivitybeingthemainones.IbelieveCenturyBankandTrustiswell-positionedandhasasuccessfultrackrecordthatreflectsourabilitytoperformappropriatelyagainsttheseheadwinds.Your bank team will continue its focus and execute on the foundation that drives our long-term success: (1) grow and retain profitablebusinessactivity,(2)maintainstrongassetquality,(3)manageoperatingexpensesand(4)implementefficiencies.
Beforeclosing,Iwanttothankeachcustomer,employee,directorandshareholderfortheloyaltyandconfidenceyouexpressinourcompany.YourcommitmentandcontinuedsupportarewhatmakeCenturyBankandTrustsuchanexceptionalorganization–nowand into the future.
I look forward to reporting to you as we move into 2014.
Eric H. Beckhusen Chairman & CEO
Financial HighlightsCentury Financial Corporation
2014 2013For the Year Net Income $ 2,441,000 $ 2,410,000 Cash Dividends 812,664 661,424 Return on Average Assets 0.90% 0.90% Return on Average Equity 8.20% 8.46%
At Year End Assets $ 272,033,000 $ 270,517,000 Deposits 236,342,000 238,660,000 NetLoans 167,590,000 149,005,000 Shareholders' Equity 31,207,000 28,318,000
Per Share Basic Earnings $ 1.26 $ 1.24 Diluted Earnings 1.26 1.24 Cash Dividends 0.42 0.34
16.13 14.64
Century Financial Corporation
4
Review of Performance and Operations
OverviewCentury Financial Corporation is a Michigan bank holding company with Century Bank and Trust being a wholly-owned subsidiary. TheBank’sprimarymarketareaisthetri-countyregionofsouthernMichiganthatconsistsofBranch,HillsdaleandSt.Josephcounties.
Earnings ReviewCentury Bank and Trust in 2013 recorded net income of $2,410,000 resulting in basic earnings per share of $1.24. In 2012, net income was $2,171,000 with basic earnings per share of $1.10. The increase in net income and earnings per share in 2013 was achieved through a balanced approach of increasing both net interest and non-interest income (fee income) while managing non-interest expense. Further highlights are as follows:
• Net interest income, before provision expense, for 2013 was $8,537,000 compared to $8,331,000 in 2012.
• Total fee income remained strong at $4,789,000 in 2013, an increase of $88,000 over 2012 level of $4,701,000. The gain onsaleofresidentialmortgageloanswasagainasignificantcontributorfortheyearat$1,080,000–upslightlyfrom2012results of $1,071,800.
• Trust and Investment Management Services continues to be a very important and consistent component of the bank’s non-interest income. For the year, revenue from this business line was $1,569,000, an increase of $143,000 or 10% as compared to 2012 results of $1,426,000.
• Solid management of interest expense was again recognized in 2013. Total interest expense was reduced by $205,000 or 34% from 2012 levels.
• The provision for loan loss expense for 2013 was $485,000 compared to $225,000 in 2012.
• Focusonefficienciesandexpensemanagement resulted in reducednon-interestexpense for theyear. Totaloperatingexpenses were $9,516,000, or $305,000 less than the 2012 level of $9,821,000.
The 2013 results represent a return on average assets (ROA) of 0.90% and a return on equity (ROE) 8.46%. Respective numbers for 2012 were ROA at 0.82% and ROE at 8.16%.
BalanceSheetandLoanPortfolioThe balance sheet of Century Bank and Trust remains solid with strong capital and liquidity positions. Total assets grew by $4.5 million over 2012, ending the year at $270 million. Capital ratios at 12-31-13 were as follows: Total capital/risk weighted assets –18.0%,Tier1capital/riskweightedassets–16.7%andTier1capital/averageassets–12.2%.Thesewellexceedtheminimumlevels for a bank to be considered “well capitalized” by regulatory agencies, which are 10.0%, 6.0% and 5.0%, respectively. Century Bank and Trust’s ratios at 12-31-12 for these respective capital measurements were 17.9%, 16.6% and 11.6%.
The loan portfolio grew approximately 3.30% or $4,955,000, ending the year at $152,048,000 with an allowance for loan loss reserve of $3,043,000 or 2.00% of the loan portfolio. At 12-31-12, loans totaled $147,093,000 with an allowance for loan loss reserve of $3,298,000 or 2.24% of the loan portfolio. Overall loan growth was driven by the commercial loan segment of the portfolio which increased approximately $7,200,000 or 7.5%, ending the year at $102,316,000. The bank’s on-balance sheet residential mortgage portfolio did see a decline of roughly $2,500,000. However, the on-balance sheet residential mortgage activity needstobeconsideredwithloansthataremadeviathesecondarymarket.Withlow,long-termfixedresidentialmortgageratescontinuingin2013,ourmortgagelendingteamsintensifiedtheireffortsinhelpingexistingandnewcustomerstakeadvantageofrefinancingorpurchasinghomesusingtheseproducts. CenturyBankandTrustcontinues toserviceourcustomers’residentialmortgage loans that are sold and this off-balance sheet portfolio grew 13.0% or $11,500,000, ending the year at $100,222,000. The aggregateconsumerandhomeequitylinesofcreditportfoliosalsoexperiencedgrowth–combinedportfoliostotaled$11,966,000at 12-31-13 and $11,699,000 at 12-31-12.
Net loan losses in 2013, as a percentage of average outstanding loans, was 0.49%. In 2012 the loan portfolio experienced a net recovery with a net loss of -0.03%. At 12-31-13 nonaccrual loans totaled $4,356,000 and Other Real Estate Owned on the bank’s balance sheet was $460,000. At 12-31-12, these balances were $6,020,000 and $663,000, respectively.
Century Financial Corporation
Operating highlights for the year are:
●● Net operating revenue, defined as net interest and non-interest income combined, increased 8.54% totaling $16,313,000 for 2018. Net operating revenue was $15,030,000 in 2017.
●● The revenue mix for 2018 was 69.09% from net interest (spread) income and 30.91% from non-interest (fee) income. For 2017 the components were: 67.09% net interest income and 32.91% fee income.
●● Net interest income, before provision expense, increased $1,187,000 or 11.77%. Net interest income for 2018 was $11,270,000 compared to $10,083,000 in 2017.
●● The provision for loan losses for 2018 was $830,000 compared to $250,000 in 2017.
●● Commercial lending remained the largest segment of the loan portfolio. This lending team finished the year up $10,647,000 or 8.40%. The commercial loan portfolio totaled $137,358,000 and $126,711,000 at 12-31-18 and 12-31-17, respectively.
●● Total interest expense increased, ending the year at $618,000 versus $353,000 in 2017 – an increase of $265,000.
●● Overall fee income grew $96,000 or 1.94%. Fee income totaled $5,043,000 for 2018 compared to $4,947,000 for 2017.
●● Trust and Investment Management revenue continues as the single largest component of fee income. This team again produced record results in 2018, generating revenue of $1,979,000 compared to $1,925,000 in 2017. This constitutes an increase of $54,000 or 2.78%.
●● Fee income from Deposit Services components of service charges and fees and exchanges increased 2.53%, or $45,000 in 2018 with aggregate revenue of $1,795,000 versus $1,750,000 in 2017.
●● The gain on sale of mortgage loans increased $9,000 in 2018 compared to 2017. Total gain was $604,000 for 2018 compared to $595,000 the year prior. Additionally, the rebounding housing market and tight inventory led to year-over loan portfolio growth associated with home construction. The combined residential and consumer loan portfolio at 12-31-18 was $68,691,000. This compares to $64,913,000 at 12-31-17.
●● Non-interest expense for 2018 totaled $10,833,000 compared to $13,147,000 in 2017. As mentioned previously, the dramatic decrease is related to the one-time expense associated with terminating the Bank’s pension plan. Core operating expenses, net of employee-related items, for the year were $4,586,000 compared to $4,366,000 in 2017 – an increase of $220,000 or 5.04%.
Strong execution by managers and teams in all our core lines of business coupled with conservative balance sheet management again drove the Bank’s core performance in 2018. This consistency continues to allow the Board of Directors to focus on their commitment to long-term shareholder value and return. Century Financial Corporation (CFC) paid an annual cash dividend in 2018 of $0.60 per share. This compares to a $0.54 per share annual payout for 2017. The market share price of CFC stock (ticker symbol CYFL) was $19.75 at 12-31-18 and $20.00 at 12-31-17. Book values for these same time periods were $20.01 and $19.00, respectively.
In conclusion, I thank you for your continued support and confidence as a shareholder, your business as a client and making those ever-important referrals of friends, family and associates to Century Bank and Trust. As we take aim on 2019, I believe we do it with encouraging factors not seen for some time in the economy. This continued positive economic activity and a rate environment carefully managed to this point by the Federal Reserve, should provide a strong operating situation for well-managed banking organizations. A phrase I whole-heartedly agree with and strongly believe applies to our organization no matter the environment ~ “successful banking is the result of doing a lot of little things right”. Our long-term vision remains the same – unwavering focus on daily actions that build successful communities, clients and the Bank.
Eric H. BeckhusenChairman & CEO
Report of Independent Auditors
5
Crowe Horwath LLP Independent Member Crowe Horwath International
INDEPENDENT AUDITOR’S REPORT Board of Directors and Stockholders Century Financial Corporation Coldwater, Michigan Report on the Financial Statements We have audited the accompanying consolidated financial statements of Century Financial Corporation, which comprise the consolidated balance sheets as of December 31, 2013 and 2012, and the related consolidated statements of income, comprehensive income, changes in shareholders’ equity and cash flows for the years then ended, and the related notes to the financial statements. Management’s Responsibility for the Financial Statements Management is responsible for the preparation and fair presentation of these consolidated financial statements in accordance with accounting principles generally accepted in the United States of America; this includes the design, implementation, and maintenance of internal control relevant to the preparation and fair presentation of consolidated financial statements that are free from material misstatement, whether due to fraud or error. Auditor’s Responsibility Our responsibility is to express an opinion on these consolidated financial statements based on our audits. We conducted our audits in accordance with auditing standards generally accepted in the United States of America. Those standards require that we plan and perform the audit to obtain reasonable assurance about whether the consolidated financial statements are free from material misstatement. An audit involves performing procedures to obtain audit evidence about the amounts and disclosures in the consolidated financial statements. The procedures selected depend on the auditor’s judgment, including the assessment of the risks of material misstatement of the consolidated financial statements, whether due to fraud or error. In making those risk assessments, the auditor considers internal control relevant to the entity’s preparation and fair presentation of the consolidated financial statements in order to design audit procedures that are appropriate in the circumstances, but not for the purpose of expressing an opinion on the effectiveness of the entity’s internal control. Accordingly, we express no such opinion. An audit also includes evaluating the appropriateness of accounting policies used and the reasonableness of significant accounting estimates made by management, as well as evaluating the overall presentation of the consolidated financial statements. We believe that the audit evidence we have obtained is sufficient and appropriate to provide a basis for our audit opinion.
Grand Rapids, MichiganMarch 7, 2016
Opinion In our opinion, the consolidated financial statements referred to above present fairly, in all material respects, the financial position of Century Financial Corporation as of December 31, 2014 and 2015, and the results of its operations and its cash flows for the years then ended in accordance with accounting principles generally accepted in the United States of America.
Crowe Horwath LLP Grand Rapids, Michigan March 5, 2014
Crowe Horwath LLP Independent Member Crowe Horwath International
INDEPENDENT AUDITOR’S REPORT Board of Directors and Stockholders Century Financial Corporation Coldwater, Michigan Report on the Financial Statements We have audited the accompanying consolidated financial statements of Century Financial Corporation, which comprise the consolidated balance sheets as of December 31, 2014 and 2015, and the related consolidated statements of income, comprehensive income, changes in shareholders’ equity and cash flows for the years then ended, and the related notes to the financial statements. Management’s Responsibility for the Financial Statements Management is responsible for the preparation and fair presentation of these consolidated financial statements in accordance with accounting principles generally accepted in the United States of America; this includes the design, implementation, and maintenance of internal control relevant to the preparation and fair presentation of consolidated financial statements that are free from material misstatement, whether due to fraud or error. Auditor’s Responsibility Our responsibility is to express an opinion on these consolidated financial statements based on our audits. We conducted our audits in accordance with auditing standards generally accepted in the United States of America. Those standards require that we plan and perform the audit to obtain reasonable assurance about whether the consolidated financial statements are free from material misstatement. An audit involves performing procedures to obtain audit evidence about the amounts and disclosures in the consolidated financial statements. The procedures selected depend on the auditor’s judgment, including the assessment of the risks of material misstatement of the consolidated financial statements, whether due to fraud or error. In making those risk assessments, the auditor considers internal control relevant to the entity’s preparation and fair presentation of the consolidated financial statements in order to design audit procedures that are appropriate in the circumstances, but not for the purpose of expressing an opinion on the effectiveness of the entity’s internal control. Accordingly, we express no such opinion. An audit also includes evaluating the appropriateness of accounting policies used and the reasonableness of significant accounting estimates made by management, as well as evaluating the overall presentation of the consolidated financial statements. We believe that the audit evidence we have obtained is sufficient and appropriate to provide a basis for our audit opinion.
Century Financial Corporation
Crowe LLP Independent Member Crowe Global
INDEPENDENT AUDITOR’S REPORT Board of Directors and Shareholders Century Financial Corporation Coldwater, Michigan Report on the Financial Statements We have audited the accompanying consolidated financial statements of Century Financial Corporation, which comprise the consolidated balance sheets as of December 31, 2018 and 2017, and the related consolidated statements of income, comprehensive income, changes in shareholders’ equity and cash flows for the years then ended, and the related notes to the financial statements. Management’s Responsibility for the Financial Statements Management is responsible for the preparation and fair presentation of these consolidated financial statements in accordance with accounting principles generally accepted in the United States of America; this includes the design, implementation, and maintenance of internal control relevant to the preparation and fair presentation of consolidated financial statements that are free from material misstatement, whether due to fraud or error. Auditor’s Responsibility Our responsibility is to express an opinion on these consolidated financial statements based on our audits. We conducted our audits in accordance with auditing standards generally accepted in the United States of America. Those standards require that we plan and perform the audit to obtain reasonable assurance about whether the consolidated financial statements are free from material misstatement. An audit involves performing procedures to obtain audit evidence about the amounts and disclosures in the consolidated financial statements. The procedures selected depend on the auditor’s judgment, including the assessment of the risks of material misstatement of the consolidated financial statements, whether due to fraud or error. In making those risk assessments, the auditor considers internal control relevant to the entity’s preparation and fair presentation of the consolidated financial statements in order to design audit procedures that are appropriate in the circumstances, but not for the purpose of expressing an opinion on the effectiveness of the entity’s internal control. Accordingly, we express no such opinion. An audit also includes evaluating the appropriateness of accounting policies used and the reasonableness of significant accounting estimates made by management, as well as evaluating the overall presentation of the consolidated financial statements. We believe that the audit evidence we have obtained is sufficient and appropriate to provide a basis for our audit opinion. Opinion In our opinion, the consolidated financial statements referred to above present fairly, in all material respects, the financial position of Century Financial Corporation as of December 31, 2018 and 2017, and the results of its operations and its cash flows for the years then ended in accordance with accounting principles generally accepted in the United States of America. Crowe LLP Grand Rapids, Michigan March 1, 2019

6
Consolidated Balance SheetsCentury Financial Corporation
December 31,2014 2013
Assets Cash and due from banks $ 8,557,178 $ 8,255,630 Short term investments 17,390,000 24,040,000 Total cash and cash equivalents 25,947,178 32,295,630 Securities available for sale 48,381,641 56,937,472 Securities held to maturity (Fair value of $11,844,676 in 2013 and $7,816,351 in 2012) 11,021,853 12,057,738 FederalHomeLoanBankandFederalAgricultureMortgageCorp.stock 533,853 611,553 Loansheldforsale 208,427 256,288 Loans,net 167,589,677 149,005,193 Premises and equipment, net 5,326,096 5,618,792 Bank owned life insurance 7,852,680 7,624,398 Accrued interest receivable 838,828 857,230 Other assets 4,332,760 5,252,864 Total Assets $ 272,032,993 $ 270,517,158
Liabilities Deposits Noninterest-bearing $ 44,261,084 $ 48,078,081 Time deposits of $100,000 or more 19,619,375 22,142,683 Other time deposits 17,841,984 19,554,114 Other interest-bearing deposits 154,620,011 148,884,954 Total deposits 236,825,647 238,659,832 Accrued interest payable 14,676 21,396 Other liabilities 4,468,517 3,517,887Total Liabilities 240,825,647 242,199,115
Shareholders' Equity Preferred stock -- $1 par value; shares authorized -- 300,000; issued and outstanding -- none Common stock -- $1 par value; shares authorized -- 3,000,000; issued and outstanding -- 1,934,757 in 2014 and 1,934,757 in 2013 1,934,757 1,934,757 Paid in capital 19,202,709 19,202,709 Retained earnings 12,680,949 11,052,872 Accumulated other comprehensive loss (2,611,069) (3,872,295)Total Shareholders' Equity 31,207,346 28,318,043Total Liabilities and Shareholders' Equity $ 272,032,993 $ 270,517,158
Consolidated Balance Sheets
The accompanying notes are an integral part of these consolidated financial statements.
Century Financial CorporationConsolidated Balance SheetsCentury Financial Corporation
2018 2017Assets Cash and due from banks $ 7,556,700 $ 7,415,966 Short term investments 25,579,305 19,153,020 Total cash and cash equivalents 33,136,005 26,568,986 Time deposits in other financial institutions 2,992,803 3,242,439 Securities available for sale 46,168,733 48,651,288 Securities held to maturity (Fair value of $12,390,635 in 2018 and $16,177,770 in 2017) 12,245,817 16,210,020 Other investments 414,354 414,354 Loans held for sale - 74,000 Loans, net 203,474,401 189,422,862 Premises and equipment, net 5,015,457 5,084,214 Bank owned life insurance 8,783,039 8,550,877 Accrued interest receivable 1,087,641 1,022,097 Other assets 2,249,525 2,297,386Total Assets $ 315,567,775 301,538,523
Liabilities Deposits Noninterest-bearing $ 88,676,854 81,405,550 Time deposits of $100,000 or more 12,455,057 13,257,745 Other time deposits 12,157,286 8,350,111 Other interest-bearing deposits 160,249,591 155,171,006 Total deposits 273,538,788 258,184,412 Accrued interest payable 15,709 8,347 FHLB Advances 2,500,000 5,000,000 Other liabilities 1,556,526 1,844,318Total Liabilities 277,611,023 265,037,077
Shareholders' Equity Preferred stock -- $1 par value; shares authorized -- 300,000; issued and outstanding -- none Common stock -- $1 par value; shares authorized -- 3,000,000; issued and outstanding -- 1,896,608 in 2018 and 1,921,140 in 2017 1,896,608 1,921,140 Paid in capital 18,528,663 19,003,810 Retained earnings 18,922,298 16,134,491 Accumulated other comprehensive loss (1,390,817) (557,995)Total Shareholders' Equity 37,956,752 36,501,446Total Liabilities and Shareholders' Equity $ 315,567,775 301,538,523
December 31,
$
$
$
Consolidated Statements of OperationsCentury Financial Corporation
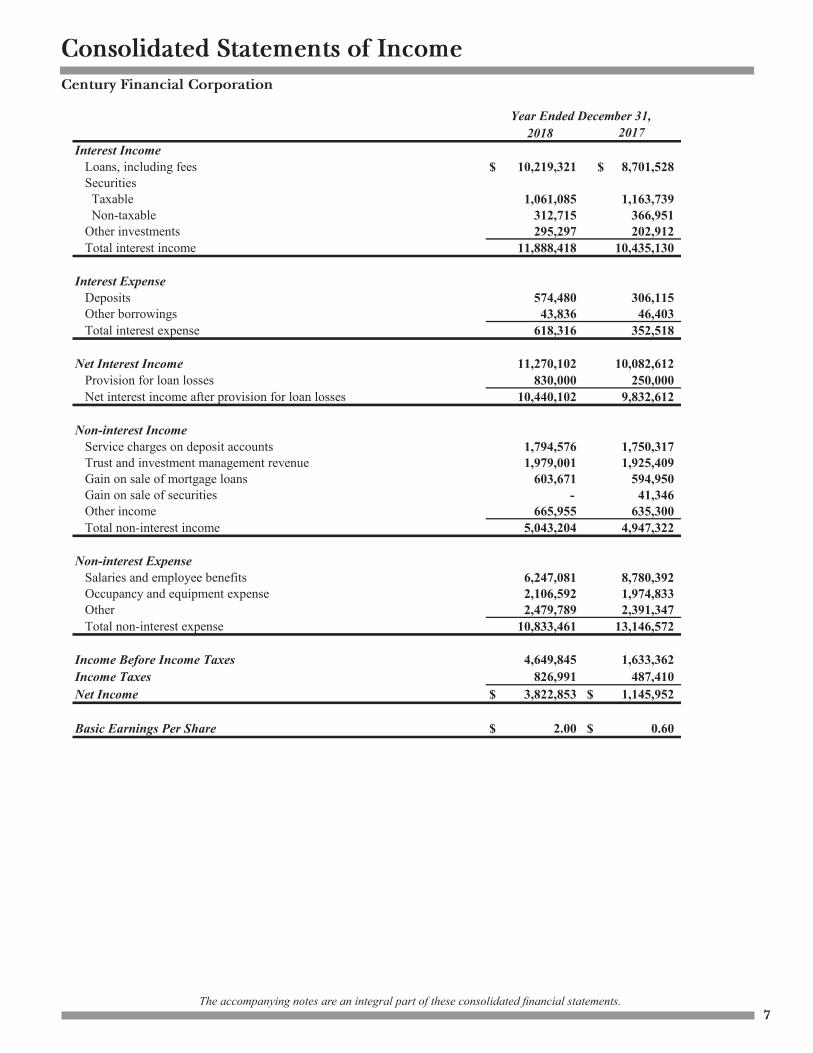
2018Interest Income Loans, including fees $ 10,219,321 8,701,528 Securities Taxable 1,061,085 1,163,739 Non-taxable 312,715 366,951 Other investments 295,297 202,912 Total interest income 11,888,418 10,435,130
Interest Expense Deposits 574,480 306,115 Other borrowings 43,836 46,403 Total interest expense 618,316 352,518
Net Interest Income 11,270,102 10,082,612 Provision for loan losses 830,000 250,000 Net interest income after provision for loan losses 10,440,102 9,832,612
Non-interest Income Service charges on deposit accounts 1,794,576 1,750,317 Trust and investment management revenue 1,979,001 1,925,409 Gain on sale of mortgage loans 603,671 594,950 Gain on sale of securities - 41,346 Other income 665,955 635,300 Total non-interest income 5,043,204 4,947,322
Non-interest Expense Salaries and employee benefits 6,247,081 8,780,392 Occupancy and equipment expense 2,106,592 1,974,833 Other 2,479,789 2,391,347 Total non-interest expense 10,833,461 13,146,572
Income Before Income Taxes 4,649,845 1,633,362Income Taxes 826,991 487,410Net Income $ 3,822,853 1,145,952
Basic Earnings Per Share $ 2.00 $ 0.60
2017Year Ended December 31,
$
$
Consolidated Balance SheetsCentury Financial Corporation
2018 2017Assets Cash and due from banks $ 7,556,700 $ 7,415,966 Short term investments 25,579,305 19,153,020 Total cash and cash equivalents 33,136,005 26,568,986 Time deposits in other financial institutions 2,992,803 3,242,439 Securities available for sale 46,168,733 48,651,288 Securities held to maturity (Fair value of $12,390,635 in 2018 and $16,177,770 in 2017) 12,245,817 16,210,020 Other investments 414,354 414,354 Loans held for sale - 74,000 Loans, net 203,474,401 189,422,862 Premises and equipment, net 5,015,457 5,084,214 Bank owned life insurance 8,783,039 8,550,877 Accrued interest receivable 1,087,641 1,022,097 Other assets 2,249,525 2,297,386Total Assets $ 315,567,775 301,538,523
Liabilities Deposits Noninterest-bearing $ 88,676,854 81,405,550 Time deposits of $100,000 or more 12,455,057 13,257,745 Other time deposits 12,157,286 8,350,111 Other interest-bearing deposits 160,249,591 155,171,006 Total deposits 273,538,788 258,184,412 Accrued interest payable 15,709 8,347 FHLB Advances 2,500,000 5,000,000 Other liabilities 1,556,526 1,844,318Total Liabilities 277,611,023 265,037,077
Shareholders' Equity Preferred stock -- $1 par value; shares authorized -- 300,000; issued and outstanding -- none Common stock -- $1 par value; shares authorized -- 3,000,000; issued and outstanding -- 1,896,608 in 2018 and 1,921,140 in 2017 1,896,608 1,921,140 Paid in capital 18,528,663 19,003,810 Retained earnings 18,922,298 16,134,491 Accumulated other comprehensive loss (1,390,817) (557,995)Total Shareholders' Equity 37,956,752 36,501,446Total Liabilities and Shareholders' Equity $ 315,567,775 301,538,523
December 31,
$
$
$
Consolidated Statements of IncomeCentury Financial Corporation
Year Ended December 31,
2014 2013Interest IncomeLoans,includingfees $ 7,444,260 $ 7,157,969 Securities Taxable 1,235,225 1,410,694 Non-taxable 296,378 299,107 Short term investments 74,068 59,006 Total interest income 9,049,931 8,926,776
Interest Expense Deposits 277,760 389,706 Other borrowings 15 35 Total interest expense 277,775 389,741
Net Interest Income 8,772,156 8,537,035 Provision for loan losses 160,000 485,000 Net interest income after provision for loan losses 8,612,156 8,052,035
Non-interest Income Service charges on deposit accounts 1,649,783 1,595,252 Trust and investment management revenue 1,714,132 1,569,947 Gain on sale of mortgage loans 562,141 1,080,063 Gain/(loss) on sale of securities (2,197) (15,614) Other income 584,799 560,051 Total non-interest income 4,508,658 4,789,699
Non-interest ExpenseSalariesandemployeebenefits 5,430,638 5,485,341 Occupancy and equipment expense 2,106,838 1,929,500 Other 2,233,961 2,101,862 Total non-interest expense 9,771,437 9,516,703
Income Before Income Taxes 3,349,377 3,325,031 Income Taxes 908,636 915,013 Net Income Available to Shareholders $ 2,440,741 $ 2,410,018
Basic and Diluted Earnings Per Share $ 1.26 $ 1.24
Consolidated Statements of Income
The accompanying notes are an integral part of these consolidated financial statements.7
Century Financial CorporationConsolidated Statements of OperationsCentury Financial Corporation
2018Interest Income Loans, including fees $ 10,219,321 8,701,528 Securities Taxable 1,061,085 1,163,739 Non-taxable 312,715 366,951 Other investments 295,297 202,912 Total interest income 11,888,418 10,435,130
Interest Expense Deposits 574,480 306,115 Other borrowings 43,836 46,403 Total interest expense 618,316 352,518
Net Interest Income 11,270,102 10,082,612 Provision for loan losses 830,000 250,000 Net interest income after provision for loan losses 10,440,102 9,832,612
Non-interest Income Service charges on deposit accounts 1,794,576 1,750,317 Trust and investment management revenue 1,979,001 1,925,409 Gain on sale of mortgage loans 603,671 594,950 Gain on sale of securities - 41,346 Other income 665,955 635,300 Total non-interest income 5,043,204 4,947,322
Non-interest Expense Salaries and employee benefits 6,247,081 8,780,392 Occupancy and equipment expense 2,106,592 1,974,833 Other 2,479,789 2,391,347 Total non-interest expense 10,833,461 13,146,572
Income Before Income Taxes 4,649,845 1,633,362Income Taxes 826,991 487,410Net Income $ 3,822,853 1,145,952
Basic Earnings Per Share $ 2.00 $ 0.60
2017Year Ended December 31,
$
$

10
8
Consolidated Statements of Comprehensive Income
The accompanying notes are an integral part of these consolidated financial statements.
2014 2013
Net Income Available to Shareholders $ 2,440,741 $ 2,410,018
Other Comprehensive Income Unrealized gains (losses) on securities Unrealized holding gain/(loss) Reclassificationadjustmentfornet (gains)/losses on sales of securities (A) 2,197 15,614 Unrealized holding (gain)/loss 2,698,328 (3,628,229) Tax effect (C) (918,178) 1,228,289 Net of tax (1,782,347) (2,384,326) Definedbenefitpensionplan Net gain (loss) (968,221) 1,039,331 Reclassificationadjustmentforrealized pension (gains)/losses (B) 178,643 260,041 Tax effect (C) 268,457 353,373 Net of tax (521,121) 685,958Total other comprehensive income (loss) (1,261,226) (1,698,368)
Comprehensive Income $ 3,701,967 $ 711,650
Year ended December 31,
(A) Included in the gain/(loss) on sale of securities(B)Includedinsalariesandemployeebenefits(C)Incometaxesfor2014and2013includebenefitsof$61,486and$93,723relatedtoreclassificationadjustments
Century Financial Corporation
10Consolidated State-ments of Changes in Shareholders’ EquityCentury Financial Corporation
AccumulatedOther
Common Paid In Retained ComprehensiveStock Capital Earnings Income (Loss) Total
Balance, January 1, 2013 $ 1,963,660 $ 19,540,051 $ 9,304,278 $ (2,173,927) $ 28,634,062 Net income 2,410,018 2,410,018 Other comprehensive income (1,698,368) (1,698,368) Cash dividends, $.34 per share (661,424) (661,424) Repurchase of shares (28,903) (337,342) (366,245)Balance, December 31, 2013 1,934,757 19,202,709 11,052,872 (3,872,295) 28,318,043 Net income 2,440,741 2,440,741 Other comprehensive loss 1,261,226 1,261,226 Cash dividends, $.42 per share (812,664) (812,664)
Balance, December 31, 2014 $ 1,934,757 $ 19,202,709 $ 12,680,949 $ (2,611,069) $ 31,207,346
Consolidated Statements of Changes in Shareholders’ EquityCentury Financial Corporation
Consolidated Statements of Comprehesive IncomeCentury Financial Corporation
2018 2017
$ 3,822,853 $ 1,145,952
- (41,346)
(914,929) 170,788192,135 (44,009)
(722,794) 85,433
-
- 3,217,147 - (1,093,831) - 2,123,316
(722,794) 2,208,749
$ 3,100,059 $ 3,354,701
(C) Income taxes for 2018 and 2017 include benefits of $0 and $1,079,773 related to reclassification adjustments
Consolidated Statements of Changes in Shareholders' EquityCentury Financial Corporation
Balance, January 1, 2017 $ 1,923,757 $ 19,047,749 $ 16,025,930 $ (2,766,744) $ Net income - - 1,145,952 - Other comprehensive income - - - 2,208,749 Cash dividends, $.54 per share - - (1,037,391) - Repurchase of shares (2,617) (43,939) - - Balance, December 31, 2017 1,921,140 19,003,810 16,134,491 (557,995) Adoption of ASU 2018-02 (See Note 1) 110,028 (110,028) Net income - - 3,822,853 - Other comprehensive loss - - - (722,794) Cash dividends, $.60 per share - - (1,145,074) - Repurchase of shares (24,532) (475,147) - - Balance, December 31, 2018 $ 1,896,608 $ 18,528,663 $ 18,922,298 $ (1,390,817)
The accompanying notes are an integral part of these consolidated financial statements.
Stock
Reclassification adjustment for realized pension (gains)/losses (B)
Reclassification adjustment for net realized (gains)/losses on sales of securities (A) Unrealized gains/(losses) on securities Unrealized holding gain/(loss) Tax effect (C) Net of tax Defined benefit pension plan Net gain/(loss)
(A) Included in gain/(loss) on sale of securities(B) Included in salaries and employee benefits
Comprehensive Income
AccumulatedOther
Comprehensive
Year Ended December 31,
Earnings Income/(Loss)CapitalRetained
Net Income Available to Shareholders
Other Comprehensive Income
Common Paid In
Tax effect (C) Net of taxTotal other comprehensive income/(loss)
- -
34,230,6921,145,952 2,208,749
(1,037,391) (46,556)
36,501,446 -
3,822,853 (722,794)
(1,145,074) (499,679)
37,956,752
AccumulatedOther
ComprehensiveTotal
$
Consolidated Statements of Comprehesive IncomeCentury Financial Corporation
2017 2016
$ 1,145,952 $ 2,642,020
(41,346) (31,261)
170,788 (226,384)(44,009) 87,60085,433 (170,045)
- (223,988)
3,217,147 228,179(1,093,831) (1,425)2,123,316 2,7662,208,749 (167,279)
$ 3,354,701 $ 2,474,741
(C) Income taxes for 2017 and 2016 include benefits of $1,079,773 and $66,952 related to reclassification adjustments
Balance, January 01, 2016 1,931,757 19,162,759 14,347,069 (2,599,465) Net income - - 2,642,020 - Other comprehensive loss - - - (167,279) Cash dividends, $.50 per share - - (963,159) - Repurchase of shares (8,000) (115,010) - - Balance, December 31, 2016
$
1,923,757
$
19,047,749
$
16,025,930
$
(2,766,744)
$
Net income - - 1,145,952 - Other comprehensive income - - - 2,208,749 Cash dividends, $.54 per share - - (1,037,391) - Repurchase of shares (2,617) (43,939) - - Balance, December 31, 2017 $ 1,921,140 $ 19,003,810 $ 16,134,491 $ (557,995) $
The accompanying notes are an integral part of these consolidated financial statements.
Income/(Loss)
Total
Capital
Unrealized gains/(losses) on securities Unrealized holding (gain)/loss Tax effect (C) Net of tax Defined benefit pension plan Net gain/(loss)
(A) Included in gain/(loss) on sale of securities(B) Included in salaries and employee benefits
Comprehensive Income
Tax effect (C) Net of taxTotal other comprehensive income/(loss)
RetainedEarningsStock
Reclassification adjustment for realized pension (gains)/losses (B)
Reclassification adjustment for net realized (gains)/losses on sales of securities (A)
Year Ended December 31,
Net Income Available to Shareholders
Other Comprehensive Income
Common Paid In
AccumulatedOther
Comprehensive
Securities available for sale
Consolidated Statements of Comprehesive IncomeCentury Financial Corporation
2018 2017
$ 3,822,853 $ 1,145,952
- (41,346)
(914,929) 170,788192,135 (44,009)
(722,794) 85,433
-
- 3,217,147 - (1,093,831) - 2,123,316
(722,794) 2,208,749
$ 3,100,059 $ 3,354,701
(C) Income taxes for 2018 and 2017 include benefits of $0 and $1,079,773 related to reclassification adjustments
Consolidated Statements of Changes in Shareholders' EquityCentury Financial Corporation
Balance, January 1, 2017 $ 1,923,757 $ 19,047,749 $ 16,025,930 $ (2,766,744) $ Net income - - 1,145,952 - Other comprehensive income - - - 2,208,749 Cash dividends, $.54 per share - - (1,037,391) - Repurchase of shares (2,617) (43,939) - - Balance, December 31, 2017 1,921,140 19,003,810 16,134,491 (557,995) Adoption of ASU 2018-02 (See Note 1) 110,028 (110,028) Net income - - 3,822,853 - Other comprehensive loss - - - (722,794) Cash dividends, $.60 per share - - (1,145,074) - Repurchase of shares (24,532) (475,147) - - Balance, December 31, 2018 $ 1,896,608 $ 18,528,663 $ 18,922,298 $ (1,390,817)
The accompanying notes are an integral part of these consolidated financial statements.
Stock
Reclassification adjustment for realized pension (gains)/losses (B)
Reclassification adjustment for net realized (gains)/losses on sales of securities (A) Unrealized gains/(losses) on securities Unrealized holding gain/(loss) Tax effect (C) Net of tax Defined benefit pension plan Net gain/(loss)
(A) Included in gain/(loss) on sale of securities(B) Included in salaries and employee benefits
Comprehensive Income
AccumulatedOther
Comprehensive
Year Ended December 31,
Earnings Income/(Loss)CapitalRetained
Net Income Available to Shareholders
Other Comprehensive Income
Common Paid In
Tax effect (C) Net of taxTotal other comprehensive income/(loss)
- -
Consolidated Statements of Comprehesive IncomeCentury Financial Corporation
2017 2016
$ 1,145,952 $ 2,642,020
(41,346) (31,261)
170,788 (226,384)(44,009) 87,60085,433 (170,045)
- (223,988)
3,217,147 228,179(1,093,831) (1,425)2,123,316 2,7662,208,749 (167,279)
$ 3,354,701 $ 2,474,741
(C) Income taxes for 2017 and 2016 include benefits of $1,079,773 and $66,952 related to reclassification adjustments
Balance, January 01, 2016 1,931,757 19,162,759 14,347,069 (2,599,465) Net income - - 2,642,020 - Other comprehensive loss - - - (167,279) Cash dividends, $.50 per share - - (963,159) - Repurchase of shares (8,000) (115,010) - - Balance, December 31, 2016
$
1,923,757
$
19,047,749
$
16,025,930
$
(2,766,744)
$
Net income - - 1,145,952 - Other comprehensive income - - - 2,208,749 Cash dividends, $.54 per share - - (1,037,391) - Repurchase of shares (2,617) (43,939) - - Balance, December 31, 2017 $ 1,921,140 $ 19,003,810 $ 16,134,491 $ (557,995) $
The accompanying notes are an integral part of these consolidated financial statements.
Income/(Loss)
Total
Capital
Unrealized gains/(losses) on securities Unrealized holding (gain)/loss Tax effect (C) Net of tax Defined benefit pension plan Net gain/(loss)
(A) Included in gain/(loss) on sale of securities(B) Included in salaries and employee benefits
Comprehensive Income
Tax effect (C) Net of taxTotal other comprehensive income/(loss)
RetainedEarningsStock
Reclassification adjustment for realized pension (gains)/losses (B)
Reclassification adjustment for net realized (gains)/losses on sales of securities (A)
Year Ended December 31,
Net Income Available to Shareholders
Other Comprehensive Income
Common Paid In
AccumulatedOther
Comprehensive
Securities available for sale

Year Ended December 31,
2014 2013Cash Flows from Operating Activities Net Income $ 2,440,741 $ 2,410,018 Adjustments to Reconcile Net Income to Net Cash from Operating Activities Depreciation 530,648 543,335 Net amortization on securities 290,791 (58,761) Provision for loan losses 160,000 485,000 Gain on sales of mortgage loans (562,141) (1,080,063) Proceeds from sales of mortgage loans 15,349,514 34,176,819 Mortgage loans originated for sale (14,739,510) (31,952,104)Lossonsalesofsecurities 2,197 15,614 Lossonsalesofotherrealestateowned (19,846) (15,837) Earnings on bank owned life insurance (228,282) (231,710)Net Change in Assets and Liabilities Interest receivable 18,402 49,433 Interest payable (6,720) (18,184) Other assets (196,582) (69,367) Other liabilities (161,052) (183,564) Net cash from operating activities 3,633,120 4,070,629 Cash Flows from Investing ActivitiesRedemptionofFederalHomeLoanBankstock 77,700 0 Purchases of securities available for sale (5,500,000) (33,120,000) Proceeds from sales, calls and maturities of securities available for sale 16,542,803 26,088,764 Proceeds from calls, prepayment and maturities of securities held to maturity 1,829,450 1,260,421 Purchases of securities held to maturity (873,000) (5,438,000) Net change in portfolio loans (19,600,135) (6,150,731) Proceeds from sales of other real estate owned 909,604 641,431 Premises and equipment expenditures, net (237,952) (252,838) Net cash from investing activities (6,851,530) (16,970,953)Cash Flows from Financing Activities Net change in time deposits of $100,000 or more (2,523,308) (7,274,183) Net change in other deposits 205,930 13,347,733 Repurchase of stock 0 (366,245) Cash dividends paid (812,664) (661,424) Net cash from financing activities (3,130,042) 5,045,881 Net Change in Cash and Cash Equivalents (6,348,452) (7,854,443) Cash and cash equivalents at beginning of year 32,295,630 40,150,073 Cash and Cash Equivalents at End of Year $ 25,947,178 $ 32,295,630 Supplemental Disclosures of Cash Flow Information Cash Paid During the Year for 2014 2013 Interest $ 284,495 $ 407,925 Income taxes paid (refunded) 571,300 989,000 Supplemental Disclosures of Non-Cash Financing and Investing Activities Transfers of loans to other real estate owned $ 855,651 $ 456,000
Consolidated Statements of Cash Flows
The accompanying notes are an integral part of these consolidated financial statements.
Year ended December 31,
9
2014 2013
Net Income Available to Shareholders $ 2,440,741 $ 2,410,018
Other Comprehensive Income Unrealized gains (losses) on securities Unrealized holding gain/(loss) Reclassificationadjustmentfornet (gains)/losses on sales of securities (A) 2,197 15,614 Unrealized holding (gain)/loss 2,698,328 (3,628,229) Tax effect (C) (918,178) 1,228,289 Net of tax (1,782,347) (2,384,326) Definedbenefitpensionplan Net gain (loss) (968,221) 1,039,331 Reclassificationadjustmentforrealized pension (gains)/losses (B) 178,643 260,041 Tax effect (C) 268,457 353,373 Net of tax (521,121) 685,958Total other comprehensive income (loss) (1,261,226) (1,698,368)
Comprehensive Income $ 3,701,967 $ 711,650
Century Financial Corporation
Consolidated Statements of Cash FlowsCentury Financial Corporation
2018 2017Cash Flows from Operating Activities Net Income 3,822,853$ 1,145,952$ Adjustments to Reconcile Net Income to Net Cash from Operating Activities Depreciation 461,543 451,525 Net (accretion)/amortization on securities 135,189 97,521 Provision for loan losses 830,000 250,000 Gain on sales of mortgage loans (603,671) (594,950) Proceeds from sales of mortgage loans 21,048,397 18,750,489 Mortgage loans originated for sale (20,370,726) (17,789,089) Gain on sales of securities - (41,346) Loss/(gain) on sales of other real estate owned 77,725 (55,583) Earnings on bank owned life insurance (232,162) (232,197)Net Change in Assets and Liabilities Interest receivable (65,544) (35,991) Interest payable 7,362 (1,026) Other assets 246,410 809,074 Other liabilities (287,792) 831,666 Net cash from operating activities 5,069,584 3,586,045 Cash Flows from Investing Activities Redemption of Federal Home Loan Bank stock - - Purchases of securities available for sale - (7,080,000) Proceeds from sales, calls and maturities of securities available for sale 1,465,000 14,276,346 Purchases of securities held to maturity (786,000) (6,660,000) Proceeds from calls, prepayment and maturities of securities held to maturity 4,717,276 5,787,448 Proceeds from maturities of time deposits in other financial institutions 250,000 - Purchase of time deposits in other financial institutions - (1,494,000) Proceeds from sales of time deposits in other financial institutions - 1,743,000 Net change in portfolio loans (15,015,037) (11,872,259) Proceeds from sales of other real estate owned 49,359 434,417 Premises and equipment expenditures, net (392,786) (509,705) Net cash from investing activities (9,712,188) (5,374,753) Cash Flows from Financing Activities Net change in time deposits of $100,000 or more (802,688) (1,480,348) Net change in other deposits 16,157,064 2,339,084 Repurchase of stock (499,679) 46,556) ( Proceeds from FHLB Advances 4,000,000 8,000,000 Repayment on FHLB Advances (6,500,000) (3,000,000) Cash dividends paid (1,145,074) (1,037,391) Net cash from financing activities 11,209,623 4,774,789 Net Change in Cash and Cash Equivalents 6,567,019 2,986,081 Cash and cash equivalents at beginning of year 26,568,986 23,582,905 Cash and Cash Equivalents at End of Year 33,136,005 26,568,986$ Supplemental Disclosures of Cash Flow Information Cash Paid During the Year for 2018 2017 Interest 610,954$ 353,544$ Income taxes paid (refunded) 441,000 1,070,000 Supplemental Disclosures of Non-Cash Financing and Investing Activities Transfers of loans to other real estate owned 133,498$ 150,222$
December 31,Year Ended
$
10
Notes to Consolidated Financial Statements
Nature of OperationsTheconsolidatedfinancialstatementsincludetheaccountsofCenturyFinancialCorporation(the“Corporation”),itswholly-ownedsubsidiary, Century Bank and Trust (the “Bank”), combined with its wholly-owned subsidiaries, Century Insurance Services andCenturyMortgageServices,aftereliminationofsignificantintercompanytransactionsandaccounts.TheCorporationprovidesfinancialservicesthroughitsofficeslocatedinsouthernMichigan.Itsprimarydepositproductsarechecking,savings,andtermcertificateaccounts,anditsprimarylendingproductsareresidentialmortgage,commercial,andinstallmentconsumerloans.Substantiallyallloansaresecuredbyspecificitemsofcollateralincludingbusinessassets,consumerassetsandrealestate.Commercialloansareexpectedtoberepaidbycashflowsfromoperationsofbusinesses.Realestateloansaresecuredbybothresidentialandcommercialrealestate.Otherfinancialinstrumentswhichpotentiallyrepresentconcentrationsofcreditriskincludedepositaccountsinotherfinancialinstitutions.
Subsequent EventsTheBankhasevaluatedsubsequenteventsforrecognitionanddisclosurethroughMarch6,2015,whichisthedatethefinancialstatements were available to be issued.
Use of EstimatesThepreparationoffinancialstatementsinconformitywithaccountingprinciplesgenerallyacceptedintheUnitedStatesofAmericarequires management to make estimates and assumptions based on available information. These estimates and assumptions affect theamountsreportedintheconsolidatedfinancialstatementsandthedisclosuresprovided.Actualamountscoulddifferfromthoseestimates.
Cash FlowsForthepurposeofthisstatement,cashandcashequivalentsaredefinedtoincludecashonhand,demanddepositswithbanks,overnight investments and certain short term investments with maturities of three months or less upon acquisition. Overnightinvestmentscanbeliquidatedtocashwithinsevendays.Netcashflowsarereportedforcustomerloananddeposittransactionsandshort-term borrowings.
SecuritiesSecuritiesclassifiedasavailableforsalearereportedattheirfairvalueandtherelatedunrealizedholdinggainsorlossesarereported,net of related income tax effects, in other comprehensive income, until realized. Such securities might be sold prior to maturity due tochanges in interest rates, prepayment risks, yield and availability of alternative investments, liquidity needs or other factors. Securitiesforwhichmanagementhasthepositiveintentandtheabilitytoholdtomaturityareclassifiedasheldtomaturityandarereportedatamortizedcost.Othersecurities,suchasFederalHomeLoanBankandFederalAgricultureMortgageCorpstock,arecarriedatcost. Premiums and discounts on securities are recognized in interest income using the level yield method over the estimated life of thesecurity.Gainsandlossesonthesaleofsecuritiesarerecordedonthetradedateanddeterminedusingthespecificidentificationmethod.Declinesinthefairvalueofsecuritiesbelowtheircostthatareotherthantemporaryarereflectedasrealizedlosses.Inestimatingother-than-temporary losses, management considers: (1) the length of time and extent that fair value has been less than cost, (2) thefinancialconditionandneartermprospectsoftheissuer,(3)whetherthemarketdeclinewasaffectedbymacroeconomicconditions,and (4) whether the Corporation has the intent to sell the debt security or more likely than not will be required to sell the debt securitybefore its anticipated recovery. If either of the criteria regarding intent or requirement to sell is met, the entire difference between amortized cost and fair value is recognized as impairment through earnings. For debt securities that do not meet the aforementionedcriteria, the amount of impairment is split into two components as follows: (1) other-than-temporary-impairment (OTTI) related tocredit loss, which must be recognized in the income statement and (2) OTTI related to other factors, which is recognized in othercomprehensiveincome.Thecreditlossisdefinedasthedifferencebetweenthepresentvalueofthecashflowsexpectedtobecollected and the amortized cash basis. For equity securities, the entire amount of impairment is recognized through earnings. Theassessment of whether an other-than-temporary decline exists involves a high degree of subjectivity and judgment and is based on theinformation available to management at a point in time.
Loans Held for Sale Mortgage loans originated and intended for sale in the secondary market are carried at the lower of aggregate cost or fair value, as deteremined by outstanding commitments from investors. Net unrealized losses, if any, are recorded as a valuation allowance andcharged to earnings. Mortgage loans held for sale are generally sold with servicing rights retained. The carrying value of mortgage loans sold is reducedby the amount allocated to the servicing right. Gains and losses on sales of mortgage loans are based on the difference between theselling price and the carrying value of the related loan sold.
8
1. SIGNIFICANT ACCOUNTING POLICIES
Century Financial Corporation
Nature of Operations The consolidated financial statements include the accounts of Century Financial Corporation (the “Corporation”), its wholly-ownedsubsidiary, Century Bank and Trust (the “Bank”), combined with its wholly-owned subsidiaries, Century Insurance Services andCentury Mortgage Services, after elimination of significant intercompany transactions and accounts. The Corporation provides financial services through its offices located in southern Michigan. Its primary deposit products are checking, savings, and term certificate accounts, and its primary lending products are residential mortgage, commercial, and installment consumer loans. Substantially all loans are secured by specific items of collateral including business assets, consumer assets and real estate. Commercial loans are expected to be repaid by cash flows from operations of businesses. Real estate loans are secured by both residential and commercial real estate. Other financial instruments which potentially represent concentrations of credit risk include deposit accounts in other financial institutions.
Subsequent Events The Corporation has evaluated subsequent events for recognition and disclosure through March 1, 2019, which is the date the financial statements were available to be issued.
Use of Estimates The preparation of financial statements in conformity with accounting principles generally accepted in the United States of Americarequires management to make estimates and assumptions based on available information. These estimates and assumptions affect the amounts reported in the consolidated financial statements and the disclosures provided. Actual amounts could differ from thoseestimates.
Cash Flows For the purpose of this statement, cash and cash equivalents are defined to include cash on hand, demand deposits with banks,overnight investments and certain short term investments with maturities of three months or less upon acquisition. Overnightinvestments can be liquidated to cash within seven days. Net cash flows are reported for customer loan and deposit transactions and short-term borrowings.
Securities Securities classified as available for sale are reported at their fair value and the related unrealized holding gains or losses are reported, net of related income tax effects, in other comprehensive income, until realized. Such securities might be sold prior to maturity due to changes in interest rates, prepayment risks, yield and availability of alternative investments, liquidity needs or other factors. Securities for which management has the positive intent and the ability to hold to maturity are classified as held to maturity and are reported at amortized cost. Other securities, such as Federal Home Loan Bank and Federal Agriculture Mortgage Corp stock, are carried at cost. Premiums and discounts on securities are recognized in interest income using the level yield method over the estimated life of thesecurity. Gains and losses on the sale of securities are recorded on the trade date and determined using the specific identificationmethod. Declines in the fair value of securities below their cost that are other than temporary are reflected as realized losses. In estimatingother-than-temporary losses, management considers: (1) the length of time and extent that fair value has been less than cost, (2) thefinancial condition and near term prospects of the issuer, (3) whether the market decline was affected by macroeconomic conditions,and (4) whether the Corporation has the intent to sell the debt security or more likely than not will be required to sell the debt securitybefore its anticipated recovery. If either of the criteria regarding intent or requirement to sell is met, the entire difference between amortized cost and fair value is recognized as impairment through earnings. For debt securities that do not meet the aforementionedcriteria, the amount of impairment is split into two components as follows: (1) other-than-temporary-impairment (OTTI) related tocredit loss, which must be recognized in the income statement and (2) OTTI related to other factors, which is recognized in other comprehensive income. The credit loss is defined as the difference between the present value of the cash flows expected to be collected and the amortized cash basis. For equity securities, the entire amount of impairment is recognized through earnings. Theassessment of whether an other-than-temporary decline exists involves a high degree of subjectivity and judgment and is based on the information available to management at a point in time.
Time Deposits in Other Financial Institutions These are FDIC insured deposits with future contractual maturities of $250,000 (2019), $750,000 (2021), $1,494,000 (2022), $250,000 (2023) and $249,000 (2025).
Loans Held for Sale Mortgage loans originated and intended for sale in the secondary market are carried at the lower of aggregate cost or fair value, as determined by outstanding commitments from investors. Net unrealized losses, if any, are recorded as a valuation allowance andcharged to earnings. Mortgage loans held for sale are generally sold with servicing rights retained. The carrying value of mortgage loans sold is reducedby the amount allocated to the servicing right. Gains and losses on sales of mortgage loans are based on the difference between theselling price and the carrying value of the related loan sold.
11
Notes to Consolidated Financial Statements (continued)
Loans Loansarereportedattheprincipalbalanceoutstanding,netofdeferredloanfeesandcostsandanallowanceforloanlosses.Interestincome is reported on the interest method and includes amortization of net deferred loan fees and costs over the loan term. Interest income on loans is generally discontinued at the time the loan is 90 days delinquent unless the credit is well-secured and in process of collection. In all cases, loans are placed on non-accrual or charged-off at an earlier date if collection of principal or interest is considered doubtful. All interest accrued but not received for loans placed on non-accrual is reversed against interest income. Interest received on such loans isaccountedonthecashbasisorcost-recoverymethod,untilqualifyingforreturntoaccrual.Loansarereturnedtoaccrualstatuswhenall the principal and interest amounts contractually due are brought current and future payments are reasonably assured.
Allowance for Loan LossesTheallowanceforloanlossesisavaluationallowanceforprobableincurredcreditlosses.Loanlossesarechargedagainsttheallowancewhenmanagementbelievestheuncollectibilityofaloanbalanceisconfirmed.Subsequentrecoveries,ifany,arecreditedto the allowance. Management estimates the allowance balance required using past loan loss experience, the nature and volume oftheportfolio,informationaboutspecificborrowersituationsandestimatedcollateralvalues,economicconditions,andotherfactors.Allocationsoftheallowancemaybemadeforspecificloans,buttheentireallowanceisavailableforanyloanthat,inmanagement’sjudgment, should be charged-off.Theallowanceconsistsofspecificandgeneralcomponents.Thespecificcomponentrelatestoloansthatareindividuallyclassifiedasimpairedorloansotherwiseclassifiedassubstandardordoubtful.Aloanisimpairedwhenfullpaymentundertheloantermsisnotexpected.Loans,forwhichthetermshavebeenmodified,resultinginaconcession,andforwhichtheborrowerisexperiencingfinancialdificulties,areconsideredtroubleddebtrestructuringsandclassifiedasimpaired.Commercialandcommercialrealestateloansareindividuallyevaluatedforimpairment. Factors considered by management in determining impairment include payment status, collateral value, and the probability ofcollectingscheduledprincipalandinterestpaymentswhendue.Loansthatexperienceinsignificantpaymentdelaysandpaymentshortfallsgenerallyarenotclassifiedasimpaired.Managementdeterminesthesignificanceofpaymentdelaysandpaymentshortfallson a case-by-case basis, taking into consideration all of the circumstances surrounding the loan and the borrower, including the lengthof the delay, the reasons for the delay, the borrower’s prior payment record, and the amount of the shortfall in relation to the principaland interest owed. If a loan is impaired, a portion of the allowance is allocated so that the loan is reported, net, at the present value of the estimatedfuturecashflowsusingtheloan’sexistingrateoratthefairvalueofcollateralifrepaymentisexpectedsolelyfromthecollateral.Largegroups of smaller balance homogenous loans, such as consumer and residential real estate loans, are collectively evaluated forimpairment,andaccordingly,theyarenotseparatelyidentifiedforimpairmentdisclosures.Troubleddebtrestructuringsareseparatelyidentifiedforimpairmentdisclosuresandaremeasuredatthepresentvalueofestimatedfuturecashflowsusingtheloan’seffectiverateatinception.Ifatroubleddebtrestructuringisconsideredtobeacollateraldependentloan, the loan is reported, net, at the fair value of the collateral. For troubled debt restructurings that subsequently default, theCorporation determines the amount of reserve in accordance with the accounting policy for the allowance for loan losses. The general component covers non-impaired loans and is based on historical loss experience adjusted for current factors. Thehistorical loss experience is determined by portfolio segment and is based on the actual loss history experienced by the Corporationoverthemostrecentfiveyears.Thisactuallossexperienceissupplementedwithothereconomicfactorsbasedontheriskspresentfor each portfolio segment. These economic factors include consideration of the following: levels of and trends in delinquencies andimpaired loans; levels of and trends in charge-offs and recoveries; trends in volume and terms of loans; effects of any changes in riskselection and underwriting standards; other changes in lending policies, procedures, and practices; experience, ability, and depth oflending management and other relevant staff; national and local economic trends and conditions; industry conditions; and effects ofchangesincreditconcentrations.Thefollowingportfoliosegmentshavebeenidentified:
Commercial-Loanstobusinessthataresoleproprietorships,partnerships,limitedliabilitycompaniesandcorporations.These loans are for commercial, industrial, or professional purposes. The risk characteristics of these loans vary based on the borrowers’businessandindustryasrepaymentistypicallydependentoncashflowsgeneratedfromtheunderlyingbusiness.
Residentialrealestate-Loanstopurchaseorrefinanceone-tofour-familyresidences.Therisksassociatedwiththissegmentare generally dependent on the overall real estate value environment and individual payment obligations. Real estate is subject to changes in market valuation and can be unstable for a variety of reasons.
Consumer - Term loans or lines of credit for the purchase of consumer goods, vehicles or home improvement. The risk characteristics of the loans in this segment vary depending on the type of collateral but generally repayment is expected from a consumercontinuingtogenerateacashflowthatsupportsthecalculatedpaymentobligation.Secondarysupportcouldinvolve liquidation of collateral.
1. SIGNIFICANT ACCOUNTING POLICIES (continued)
Century Financial Corporation
Loans Loans are reported at the principal balance outstanding, net of deferred loan fees and costs and an allowance for loan losses. Interest income is reported on the interest method and includes amortization of net deferred loan fees and costs over the loan term. Interest income on loans is generally discontinued at the time the loan is ninety days delinquent, determined based upon the contractual termsof the loan, unless the credit is well-secured and in process of collection. In all cases, loans are placed on non-accrual or charged-off at an earlier date if collection of principal or interest is considered doubtful. Past due status is determined based on the contractual terms of the loan. All interest accrued but not received for loans placed on non-accrual is reversed against interest income. Interest received on such loans is accounted on the cash basis or cost-recovery method, until qualifying for return to accrual. Loans are returned to accrual status when all the principal and interest amounts contractually due are brought current and future payments are reasonably assured.
Allowance for Loan Losses The allowance for loan losses is a valuation allowance for probable incurred credit losses. Loan losses are charged against the allowance when management believes the uncollectibility of a loan balance is confirmed. Subsequent recoveries, if any, are creditedto the allowance. Management estimates the allowance balance required using past loan loss experience, the nature and volume ofthe portfolio, information about specific borrower situations and estimated collateral values, economic conditions, and other factors.Allocations of the allowance may be made for specific loans, but the entire allowance is available for any loan that, in management’sjudgment, should be charged-off. The allowance consists of specific and general components. The specific component relates to loans that are individually classifiedas impaired or loans otherwise classified as substandard or doubtful. A loan is impaired when full payment under the loan terms is not expected. Loans, for which the terms have been modified, resulting in a concession, and for which the borrower is experiencing financial difficulties, are considered troubled debt restructurings and classified as impaired. Commercial and commercial real estate loans are individually evaluated for impairment. Factors considered by management in determining impairment include payment status, collateral value, and the probability of collecting scheduled principal and interest payments when due. Loans that experience insignificant payment delays and payment shortfalls generally are not classified as impaired. Management determines the significance of payment delays and payment shortfallson a case-by-case basis, taking into consideration all of the circumstances surrounding the loan and the borrower, including the length of the delay, the reasons for the delay, the borrower’s prior payment record, and the amount of the shortfall in relation to the principal and interest owed. If a loan is impaired, a portion of the allowance is allocated so that the loan is reported, net, at the present value of the estimatedfuture cash flows using the loan’s existing rate or at the fair value of collateral if repayment is expected solely from the collateral. Large groups of smaller balance homogenous loans, such as consumer and residential real estate loans, are collectively evaluated forimpairment, and accordingly, they are not separately identified for impairment disclosures. Troubled debt restructurings are separately identified for impairment disclosures and are measured at the present value of estimatedfuture cash flows using the loan’s effective rate at inception. If a troubled debt restructuring is considered to be a collateral dependentloan, the loan is reported, net, at the fair value of the collateral. For troubled debt restructurings that subsequently default, the Corporation determines the amount of reserve in accordance with the accounting policy for the allowance for loan losses. The general component covers non-impaired loans and is based on historical loss experience adjusted for current factors. The historical loss experience is determined by portfolio segment and is based on the actual loss history experienced by the Corporationover the most recent five years. This actual loss experience is supplemented with other economic factors based on the risks presentfor each portfolio segment. These economic factors include consideration of the following: levels of and trends in delinquencies andimpaired loans; levels of and trends in charge-offs and recoveries; trends in volume and terms of loans; effects of any changes in riskselection and underwriting standards; other changes in lending policies, procedures, and practices; experience, ability, and depth oflending management and other relevant staff; national and local economic trends and conditions; industry conditions; and effects ofchanges in credit concentrations. The following portfolio segments have been identified:
Commercial - Loans to business that are sole proprietorships, partnerships, limited liability companies and corporations. These loans are for commercial, industrial, or professional purposes. The risk characteristics of these loans vary based on the borrowers’ business and industry as repayment is typically dependent on cash flows generated from the underlying business.
Residential real estate - Loans to purchase or refinance one- to four-family residences. The risks associated with this segment are generally dependent on the overall real estate value environment and individual payment obligations. Real estate is subject to changes in market valuation and can be unstable for a variety of reasons.
Consumer - Term loans or lines of credit for the purchase of consumer goods, vehicles or home improvement. The risk characteristics of the loans in this segment vary depending on the type of collateral but generally repayment is expected from a consumer continuing to generate a cash flow that supports the calculated payment obligation. Secondary support could involve liquidation of collateral.
Bank Owned Life Insurance The Corporation has purchased life insurance policies on certain key executives. Bank owned life insurance is recorded at the amount that can be realized under the insurance contract at the balance sheet date, which is the cash surrender value adjusted for other changes or amounts due that are probable at settlement.
Commercial - Loans to business that are sole proprietorships, partnerships, limited liability companies and corporations. These loans are for commercial, industrial, or professional purposes. The risk characteristics of these loans vary based on the borrowers’ business and industry as repayment is typically dependent on cash flows generated from the underlying business.
Residential real estate - Loans to purchase or refinance one- to four-family residences. The risks associated with this segment are generally dependent on the overall real estate value environment and individual payment obligations. Real estate is subject to changes in market valuation and can be unstable for a variety of reasons.
Consumer - Term loans or lines of credit for the purchase of consumer goods, vehicles or home improvement. The risk characteristics of the loans in this segment vary depending on the type of collateral but generally repayment is expected from a consumer continuing to generate a cash flow that supports the calculated payment obligation. Secondary support could involve liquidation of collateral.

12
Notes to Consolidated Financial Statements (continued)
Bank Owned Life Insurance The Corporation has purchased life insurance policies on certain key executives. Bank owned life insurance is recorded at theamount that can be realized under the insurance contract at the balance sheet date, which is the cash surrender value adjustedfor other changes or amounts due that are probable at settlement.
Servicing Rights Servicing rights represent the fair value of servicing rights retained on loans sold. Servicing rights are expensed in proportionto, and over the period of, estimated net servicing revenues. Impairment is evaluated based on the fair value of the rights, usinggroupings of the underlying loans as to interest rates and prepayment characteristics. Fair value is determined using pricesforsimilarassetswithsimilarcharacteristics,whenavailable,orbasedupondiscountedcashflowsusingmarket-basedassumptions. Any impairment of a grouping is reported as a valuation allowance. Servicing fee income, which is reported on the income statement as other income, is recorded for fees earned for servicingloans. The fees are based on a contractual percentage of the outstanding principal. The amortization of mortgage servicingrights is netted against loan servicing fee income. Servicing fees totaled $218,000 and $216,000 for the years ended December31,2014and2013.Latefeesandancillaryfeesrelatedtoloanservicingarenotmaterial.
Transfers of Financial AssetsTransfersoffinancialassetsareaccountedforassales,whencontrolovertheassetshasbeensurrendered.Controlovertransferred assets is deemed to be surrendered when (1) the assets have been isolated from the Corporation, (2) the transfereeobtains the right (free of conditions that constrain it from taking advantage of that right) to pledge or exchange the transferredassets, and (3) the Corporation does not maintain effective control over the transferred assets through an agreement to repur-chase them before their maturity.
Foreclosed Assets Assets acquired in collection of a loan are recorded at fair value less costs to sell at acquisition. Any reduction to fair valueat acquisition from carrying value is recorded as a loan loss. After acquisition, a valuation allowance reduces the reportedamount for further reductions in fair value. Expenses, gains and losses on disposition, and changes in the valuation allowanceare reported as other expense. The Corporation had $381,000 and $460,000 of foreclosed assets at December 31, 2014 and 2013.
Premises and EquipmentLandiscarriedatcost.Premisesandequipmentarestatedatcostlessaccumulateddepreciation.Buildingsandrelatedcomponentsaredepreciatedusingthestraight-linemethodandfurniture,fixturesandequipmentaredepreciatedusingthestraight-line or accelerated methods.
Long-term Assets Premises and equipment and other long-term assets are reviewed for impairment when events indicate their carrying amountmaynotberecoverablefromfutureundiscountedcashflows.Ifimpaired,theassetsarerecordedatfairvalue.
Retirement Plans Pension expense is the net of service and interest cost, return on plan assets, and amortization of gains and losses notimmediately recognized. Expense for the Employee Stock Ownership Plan is the amount contributed as determined by theBoard of Directors.Stock Compensation Compensation cost is recognized for stock options issued to employees, based on the fair value of these awards at the dateof the grant. There have been no stock options granted during 2014 or 2013.
Income Taxes Income tax expense is the tax due or refundable for the period plus or minus the change during the period in the deferred taxassets and liabilities. Deferred income tax assets and liabilities are computed annually for temporary differences between thefinancialstatementandtaxbasesofassetsandliabilitiesthatwillresultintaxableordeductibleamountsinthefuturebasedonenacted tax laws and rates applicable to the periods in which the differences are expected to affect taxable income. Valuationallowances are established, when necessary, to reduce deferred tax assets to the amount expected to be realized.Ataxpositionisrecognizedasabenefitonlyifitis“morelikelythannot”thatthetaxpositionwouldbesustainedinataxexamination,withataxexaminationbeingpresumedtooccur.Theamountrecognizedisthelargestamountoftaxbenefitthatis greater than 50% likely of being realized on examination. For tax positions not meeting the “more likely than not” test, notaxbenefitisrecorded. The Corporation recognizes interest and/or penalties related to income tax matters in income tax expense.
1. SIGNIFICANT ACCOUNTING POLICIES (continued)
Century Financial Corporation
Servicing Rights Servicing rights on loans sold with servicing retained are initially recorded at fair value with the income effect included in gain on sale of mortgage loans. Servicing rights are expensed in proportion to, and over the period of, estimated net servicing revenues. Impairment is evaluated based on the fair value of the rights, using groupings of the underlying loans as to interest rates and prepayment characteristics. Fair value is determined using prices for similar assets with similar characteristics, when available, or based upon discounted cash flows using market-based assumptions. Any impairment of a grouping is reported as a valuation allowance. Servicing fee income, which is reported on the income statement as other income, is recorded for fees earned for servicing loans. The fees are based on a contractual percentage of the outstanding principal. The amortization of mortgage servicing rights is netted against loan servicing fee income. Servicing fees totaled $311,000 and $290,000 for the years ended December 31, 2018 and 2017. Late fees and ancillary fees related to loan servicing are not material.
Transfers of Financial Assets Transfers of financial assets are accounted for as sales, when control over the assets has been surrendered. Control over transferred assets is deemed to be surrendered when (1) the assets have been isolated from the Corporation, (2) the transferee obtains the right (free of conditions that constrain it from taking advantage of that right) to pledge or exchange the transferred assets, and (3) the Corporation does not maintain effective control over the transferred assets through an agreement to repurchase them before their maturity.
Foreclosed Assets Assets acquired in collection of a loan are recorded at fair value less costs to sell at acquisition. Any reduction to fair value at acquisition from carrying value is recorded as a loan loss. After acquisition, a valuation allowance reduces the reported amount for further reductions in fair value. Expenses, gains and losses on disposition, and changes in the valuation allowance are reported as other expense. The Corporation had $283,000 and $305,000 of foreclosed assets at December 31, 2018 and 2017.
Premises and Equipment Land is carried at cost. Premises and equipment are stated at cost less accumulated depreciation. Buildings and related components are depreciated using the straight-line method and furniture, fixtures and equipment are depreciated using the straight-line or accelerated methods.
Long-term Assets Premises and equipment and other long-term assets are reviewed for impairment when events indicate their carrying amount may not be recoverable from future undiscounted cash flows. If impaired, the assets are recorded at fair value.
Retirement Plans Expense for the Employee Stock Ownership Plan is the amount contributed as determined by the Board of Directors.
Income Taxes Income tax expense is the tax due or refundable for the period plus or minus the change during the period in the deferred tax assets and liabilities. Deferred income tax assets and liabilities are computed annually for temporary differences between the financial statement and tax bases of assets and liabilities that will result in taxable or deductible amounts in the future based on enacted tax laws and rates applicable to the periods in which the differences are expected to affect taxable income. Valuation allowances are established, when necessary, to reduce deferred tax assets to the amount expected to be realized. A tax position is recognized as a benefit only if it is “more likely than not” that the tax position would be sustained in a tax examination, with a tax examination being presumed to occur. The amount recognized is the largest amount of tax benefit that is greater than 50% likely of being realized on examination. For tax positions not meeting the “more likely than not” test, no tax benefit is recorded. The Corporation recognizes interest and/or penalties related to income tax matters in income tax expense.
Loan Commitments and Related Financial Instruments Financial instruments include off-balance sheet credit instruments, such as commitments to make loans and commercial letters of credit, issued to meet customer financing needs. The face amount for these items represents the exposure to loss before considering customer collateral or ability to repay. Such financial instruments are recorded when they are funded.
Fair Values of Financial Instruments Fair values of financial instruments are estimated using the relevant market information and other assumptions, as more fully disclosed in a separate note. Fair value estimates involve uncertainties and matters of significant judgment regarding interest rates, credit risk, prepayments, and other factors, especially in the absence of broad markets for particular items. Changes in assumptions or in market conditions could significantly affect the estimates.
Earnings and Dividends Per Share Basic earnings per share is based on net income divided by the weighted average number of shares outstanding during the period. Diluted earnings per share would show the dilutive effect of additional common shares issuable under stock options. However, there are currently no outstanding stock options or other instruments which could cause dilution.

13
Notes to Consolidated Financial Statements (continued)
1. SIGNIFICANT ACCOUNTING POLICIES (continued)
Loan Commitments and Related Financial Instruments Financial instruments include off-balance sheet credit instruments, such as commitments to make loans and commerciallettersofcredit,issuedtomeetcustomerfinancingneeds.Thefaceamountfortheseitemsrepresentstheexposuretolossbeforeconsideringcustomercollateralorabilitytorepay.Suchfinancialinstrumentsarerecordedwhentheyarefunded.
Fair Values of Financial InstrumentsFairvaluesoffinancialinstrumentsareestimatedusingtherelevantmarketinformationandotherassumptions,asmorefullydisclosedinaseparatenote.Fairvalueestimatesinvolveuncertaintiesandmattersofsignificantjudgmentregardinginterestrates, credit risk, prepayments, and other factors, especially in the absence of broad markets for particular items. Changes inassumptionsorinmarketconditionscouldsignificantlyaffecttheestimates.
Earnings and Dividends Per Share Basic earnings per share is based on net income divided by the weighted average number of shares outstanding during theperiod. Diluted earnings per share shows the dilutive effect of additional common shares issuable under stock options. There arecurrently no outstanding stock options.Comprehensive Income Comprehensive income consists of net income and unrealized gains and losses on securities available for sale, net of tax, andchanges in the funded status of the pension plan, which are recognized as a separate component of equity.Loss ContingenciesLosscontingencies,includingclaimsandlegalactionsarisingintheordinarycourseofbusiness,arerecordedasliabilitieswhen the likelihood of loss is probable and an amount or range of loss can be reasonably estimated. Management does notbelievetherearenowanysuchmattersthatwillhaveamaterialeffectonthefinancialstatements.
Dividend Restriction Banking regulations require maintaining certain capital levels and may limit the dividends paid by the bank to the holdingcompany or by the holding company to the shareholders.
ReclassificationsCertainamountsintheprioryearconsolidatedfinancialstatementshavebeenreclassifiedtoconformwiththecurrentyearpresentation.
2. RESTRICTIONS ON CASH Cash on hand or on deposit with the Federal Reserve Bank of $0 was required to meet regulatory reserve and clearing requirementsat both December 31, 2014 and 2013.
Century Financial Corporation
Comprehensive Income Comprehensive income consists of net income and unrealized gains and losses on securities available for sale, net of tax, and changes in the funded status of the pension plan, which are recognized as a separate component of equity.
Loss Contingencies Loss contingencies, including claims and legal actions arising in the ordinary course of business, are recorded as liabilities when the likelihood of loss is probable and an amount or range of loss can be reasonably estimated. Management does not believe there are now any such matters that will have a material effect on the financial statements.
Dividend Restriction Banking regulations require maintaining certain capital levels and may limit the dividends paid by the bank to the holding company or by the holding company to the shareholders.
Adoption Of New Accounting Standards
Income Statement - Reporting Comprehensive Income - In February 2018, the FASB issued ASU 2018-02, “Income Statement - Reporting Comprehensive Income (Topic 220): Reclassification of Certain Tax Effects from Accumulated Other Comprehensive Income.” The ASU required a reclassification from accumulated other comprehensive income to retained earnings for stranded tax effects resulting from the newly enacted federal corporate income tax rate as a result of the Tax Cuts and Jobs Act of 2017. The amount reclassified was the difference between the historical income tax rate and the new 21% federal corporate income tax rate. The new guidance is effective for fiscal years beginning after December 15, 2018 and early adoption is permitted. The Corporation elected to early adopt the guidance during the first quarter of 2018, and recorded a credit to retained earnings for the reclassification in the amount of $110,000 during the first quarter.
Revenue Recognition - Effective January 1, 2018, the Corporation adopted ASU 2014-09, Revenue from Contracts with Customers (ASC Topic 606), and subsequent related Updates (collectively, ASU 2014-09). ASU 2014-09 modifies the guidance used to recognize revenue from contracts with customers for transfers of goods or services and transfers of non-financial assets, unless those contracts are within the scope of other guidance. The Corporation elected the modified retrospective approach for adoption of this standard which had no impact to its financial condition upon adoption. The Corporation determined that all interest revenues from loans and investments should be excluded from ASU 2014-09, as guidance from ASC Topic 310, Receivables (ASC Topic 310), and ASC Topic 320, Investments-Debt and Equity Securities (ASC Topic 320), respectively, address these revenues. Non-interest revenues from loan fees, bank-owned life insurance (BOLI) and gains and losses on sale of loans, securities and fixed assets are also excluded from the scope of ASU 2014-09. The Corporation’s principal revenue streams that are within the scope of ASC 606 include deposit service charges and fees, interchange income and trust income. These revenues are generally recognized immediately upon the completion of the service or over time as services are performed. Any services performed over time generally require that the Corporation renders services each period, for example monthly, therefore the Corporation measures progress in completing these services based upon the passage of time. Adoption of the new standard did not change the manner or timing of revenue recognition with respect to these services as the Corporation’s performance obligations are completed at the time that revenue is recognized.
Financial Instruments - Effective January 1, 2018, the Corporation adopted ASU 2016-01, Financial Instruments - Overall (Subtopic 825-10): Recognition and Measurement of Financial Assets and Liabilities, and related Updates (collectively, ASU 2016-01). ASU 2016-01 makes revisions to several elements of Subtopic 825-10, which include: (1) equity investments with readily determinable fair values are to be measured at fair value with changes in fair value recognized in net income, (2) the impairment assessment of equity investments without readily determinable fair values is simplified, and (3) public business entities are required to use the exit price notion when measuring the fair value of financial instruments for disclosure purposes. Adoption of this standard had no impact on the Corporation’s financial condition or results of operations. The requirement to utilize the exit price notion affected the Corporation’s fair value disclosures which are presented in Note 5.
Leases – Effective January 1, 2019, the Corporation was required to adopt ASU 2016-02 (Topic 842). This standard requires lessees to recognize a lease liability and a right of use asset for all leases, other than short-term leases. Adoption of this standard did not have a significant effect of the Corporation’s financial condition on January 1, 2019.
Reclassifications Certain amounts in the prior year consolidated financial statements have been reclassified to conform with the current year presentation.
Cash on hand or on deposit with the Federal Reserve Bank of $0 was required to meet regulatory reserve and clearing requirementsat both December 31, 2018 and 2017.
13
Notes to Consolidated Financial Statements (continued)
1. SIGNIFICANT ACCOUNTING POLICIES (continued)
Loan Commitments and Related Financial Instruments Financial instruments include off-balance sheet credit instruments, such as commitments to make loans and commerciallettersofcredit,issuedtomeetcustomerfinancingneeds.Thefaceamountfortheseitemsrepresentstheexposuretolossbeforeconsideringcustomercollateralorabilitytorepay.Suchfinancialinstrumentsarerecordedwhentheyarefunded.
Fair Values of Financial InstrumentsFairvaluesoffinancialinstrumentsareestimatedusingtherelevantmarketinformationandotherassumptions,asmorefullydisclosedinaseparatenote.Fairvalueestimatesinvolveuncertaintiesandmattersofsignificantjudgmentregardinginterestrates, credit risk, prepayments, and other factors, especially in the absence of broad markets for particular items. Changes inassumptionsorinmarketconditionscouldsignificantlyaffecttheestimates.
Earnings and Dividends Per Share Basic earnings per share is based on net income divided by the weighted average number of shares outstanding during theperiod. Diluted earnings per share shows the dilutive effect of additional common shares issuable under stock options. There arecurrently no outstanding stock options.Comprehensive Income Comprehensive income consists of net income and unrealized gains and losses on securities available for sale, net of tax, andchanges in the funded status of the pension plan, which are recognized as a separate component of equity.Loss ContingenciesLosscontingencies,includingclaimsandlegalactionsarisingintheordinarycourseofbusiness,arerecordedasliabilitieswhen the likelihood of loss is probable and an amount or range of loss can be reasonably estimated. Management does notbelievetherearenowanysuchmattersthatwillhaveamaterialeffectonthefinancialstatements.
Dividend Restriction Banking regulations require maintaining certain capital levels and may limit the dividends paid by the bank to the holdingcompany or by the holding company to the shareholders.
ReclassificationsCertainamountsintheprioryearconsolidatedfinancialstatementshavebeenreclassifiedtoconformwiththecurrentyearpresentation.
2. RESTRICTIONS ON CASH Cash on hand or on deposit with the Federal Reserve Bank of $0 was required to meet regulatory reserve and clearing requirementsat both December 31, 2014 and 2013.
Century Financial Corporation
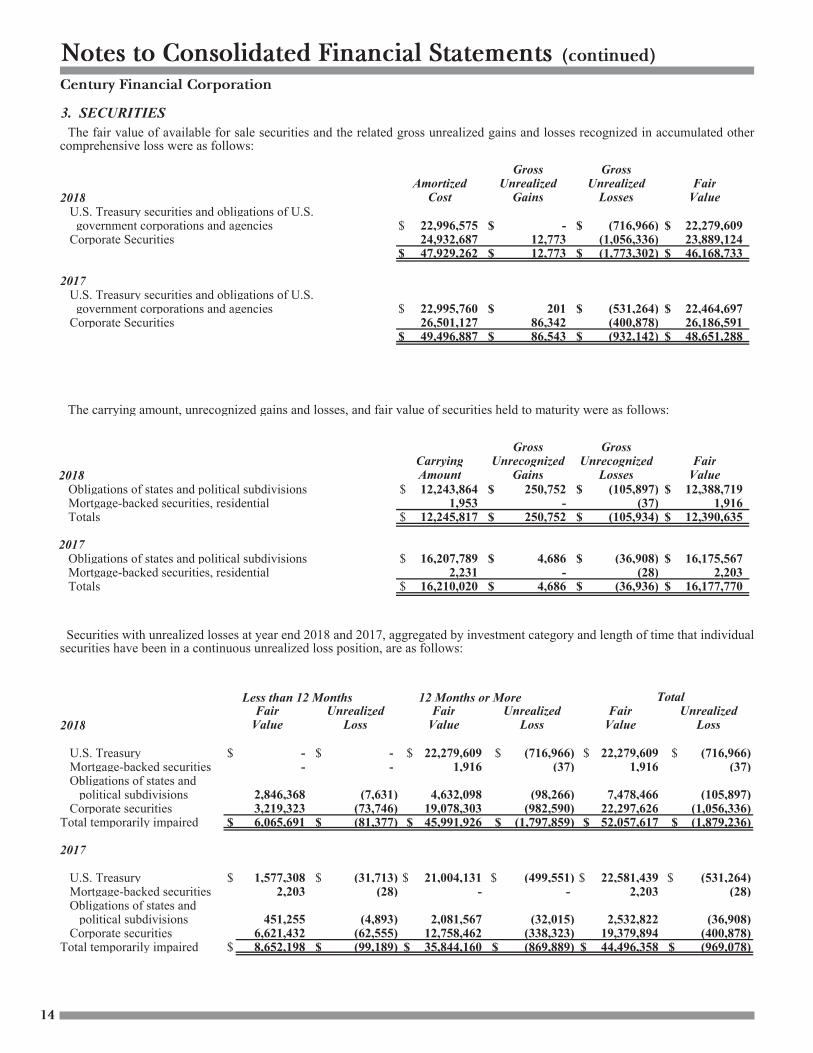
Notes to Consolidated Financial Statements (continued)
Gross Gross Amortized Unrealized Unrealized Fair
2014 Cost Gains Losses Value U.S. Treasury securities and obligations of U.S. government corporations and agencies $ 34,762,863 $ 9,281 $ (637,735) $ 37,134,409 Corporate Securities 14,127,670 197,543 (77,981) 12,247,232
$ 48,890,533 $ 206,824 $ (715,716) $ 48,381,641
2013 U.S. Treasury securities and obligations of U.S. government corporations and agencies $ 40,759,722 $ 0 $ (3,370,659) $ 37,389,063 Corporate Securities 19,387,167 284,048 (122,806) 19,548,409
$ 60,146,889 $ 284,048 $ (3,493,465) $ 56,937,472
Gross Gross Carrying Unrecognized Unrecognized Fair
2014 Amount Gains Losses Value Obligations of states and political subdivisions $ 11,016,624 $ 60,714 $ (37,233) $ 11,040,105 Mortgage-backed securities, residential 5,229 346 0 5,575 Totals $ 11,021,853 $ 61,060 $ (37,233) $ 11,045,680
2013 Obligations of states and political subdivisions $ 12,051,049 $ 29,831 $ (243,310) $ 11,837,571 Mortgage-backed securities, residential 6,729 416 0 7,145 Totals $ 12,057,778 $ 30,247 $ (243,310) $ 11,844,716
3. SECURITIES The fair value of available for sale securities and the related gross unrealized gains and losses recognized in accumulated other comprehensive income were as follows:
Securities with unrealized losses at year end 2013 and 2012, aggregated by investment category and length of time that individual securities have been in a continuous unrealized loss position, are as follows:
The carrying amount, unrecognized gains and losses, and fair value of securities held to maturity were as follows:
12 Months or More Total Fair Unrealized Fair Unrealized Fair Unrealized
2014 Value Loss Value Loss Value Loss U.S. Treasury $ 1,498,325 $ (1,675) $ 30,134,679 $ (636,060) $ 31,633,004 $ (637,735) Obligations of states and political subdivisions 0 0 2,840,568 (37,233) 2,840,568 (37,233) Corporate securities 1,720,355 (11,754) 3,779,765 (66,227) 5,500,120 (77,981)Total temporarily impaired $ 3,218,680 $ (13,429) $ 36,755,012 $ (739,520) $ 39,973,692 $ (752,949)
2013 U.S. Treasury $ 30,452,933 $ (2,805,319) $ 6,936,130 $ (565,340) $ 37,389,063 $ (3,370,659) Obligations of states and political subdivisions 2,117,892 (127,377) 2,274,823 (115,933) 4,392,715 (243,310) Corporate securities 4,980,646 (119,105) 868,561 (3,701) 5,849,207 (122,806)Total temporarily impaired $ 37,551,470 $ (3,051,801) $ 10,079,514 $ (684,974) $ 47,630,985 $ (3,736,775)
Less than 12 Months
14
Century Financial Corporation
Securities with unrealized losses at year end 2018 and 2017, aggregated by investment category and length of time that individual securities have been in a continuous unrealized loss position, are as follows:
Notes to Consolidated Financial Statements (continued)Century Financial Corporation
3. SECURITIES The fair value of available for sale securities and the related gross unrealized gains and losses recognized in accumulatedother comprehensive losses were as follows:
2017 U.S. Treasury securities and obligations of U.S. government corporations and agencies $ 22,995,760 $ 201 $ (531,264) $ Corporate Securities 26,501,127 86,342 (400,878)
$ 49,496,887 $ 86,543 $ (932,142) $
2016 U.S. Treasury securities and obligations of U.S. government corporations and agencies $ 23,990,027 $ 27 $ (530,520) $ Corporate Securities 32,686,912 107,694 (552,242)
$ 56,676,939 $ 107,721 $ (1,082,762) $
The carrying amount, unrecognized gains and losses, and fair value of securities held to maturity were as follows:
2017 Obligations of states and political subdivisions $ 16,207,789 $ 4,686 $ (36,908) $ Mortgage-backed securities, residential 2,231 - (28) Totals $ 16,210,020 $ 4,686 $ (36,936) $
2016 Obligations of states and political subdivisions $ 15,408,070 $ 52,493 $ (92,044) $ Mortgage-backed securities, residential 2,682 104 0 Totals $ 15,410,752 $ 52,597 $ (92,044) $
Less than 12 Months 12 Months or More
2017
U.S. Treasury $ 1,577,308 $ (31,713) $ 21,004,131 $ (499,551) $ 22,581,439 $ Mortgage-backed securities 2,203 (28) - - 2,203 Obligations of states and political subdivisions 451,255 (4,893) 2,081,567 (32,015) 2,532,822 Corporate securities 6,621,432 (62,555) 12,758,462 (338,323) 19,379,894Total temporarily impaired $ 8,652,198 $ (99,189) $ 35,844,160 $ (869,889) $ 44,496,358 $
2016
U.S. Treasury $ 20,484,100 $ (503,621) $ 1,975,408 $ (26,899) $ 22,459,508 $ Mortgage-backed securities - - - - - Obligations of states and political subdivisions 2,307,985 (78,589) 1,027,358 (13,455) 3,335,343 Corporate securities 14,693,500 (432,962) 3,938,807 (119,280) 18,632,307Total temporarily impaired $ 37,485,585 $ (1,015,172) $ 6,941,573 $ (159,634) $ 44,427,158 $
Unrealized losses on securities have not been recognized into income because the issuers' bonds are of high credit quality(rated A or higher), management does not intend to sell the securities, it is not likely to be required to sell the securities priorto the recovery in value, and the decline in fair value is largely due to changes in interest rates. The fair value is expectedto recover as the securities approach maturity.
Sales of securities in 2017 resulted in a gains of $78,176 and losses of $36,830 for a net gain of $41,346. While no securities were sold in 2016, called securities resulted in a gain of $31,261.
GrossUnrealized
Gains
GrossUnrealized
Losses
FairValue
CarryingAmount
AmortizedCost
FairValue
GrossUnrecognized
Gains
GrossUnrecognized
Losses
FairValue
UnrealizedLoss
FairValue
TotalUnrealized
LossFair
ValueUnrealized
Loss
The fair value of available for sale securities and the related gross unrealized gains and losses recognized in accumulated other comprehensive loss were as follows:
Notes to Consolidated Financial Statements (continued)Century Financial Corporation
3. SECURITIES The fair value of available for sale securities and the related gross unrealized gains and losses recognized in accumulatedother comprehensive losses were as follows:
2018 U.S. Treasury securities and obligations of U.S. government corporations and agencies $ 22,996,575 $ - $ (716,966) $ 22,279,609 Corporate Securities 24,932,687 12,773 (1,056,336) 23,889,124
$ 47,929,262 $ 12,773 $ (1,773,302) $ 46,168,733
2017 U.S. Treasury securities and obligations of U.S. government corporations and agencies $ 22,995,760 $ 201 $ (531,264) $ 22,464,697 Corporate Securities 26,501,127 86,342 (400,878) 26,186,591
$ 49,496,887 $ 86,543 $ (932,142) $ 48,651,288
The carrying amount, unrecognized gains and losses, and fair value of securities held to maturity were as follows:
2018 Obligations of states and political subdivisions $ 12,243,864 $ 250,752 $ (105,897) $ 12,388,719 Mortgage-backed securities, residential 1,953 - (37) 1,916 Totals $ 12,245,817 $ 250,752 $ (105,934) $ 12,390,635
2017 Obligations of states and political subdivisions $ 16,207,789 $ 4,686 $ (36,908) $ 16,175,567 Mortgage-backed securities, residential 2,231 - (28) 2,203 Totals $ 16,210,020 $ 4,686 $ (36,936) $ 16,177,770
Securities with unrealized losses at year end 2018 and 2017, aggregated by investment category and length of time thatindividual securities have been in a continuous unrealized loss position, are as follows:
Less than 12 Months 12 Months or More
2018
U.S. Treasury $ - $ - $ 22,279,609 $ (716,966) $ 22,279,609 $ (716,966) Mortgage-backed securities - - 1,916 (37) 1,916 (37) Obligations of states and political subdivisions 2,846,368 (7,631) 4,632,098 (98,266) 7,478,466 (105,897) Corporate securities 3,219,323 (73,746) 19,078,303 (982,590) 22,297,626 (1,056,336)Total temporarily impaired $ 6,065,691 $ (81,377) $ 45,991,926 $ (1,797,859) $ 52,057,617 $ (1,879,236)
2017
U.S. Treasury $ 1,577,308 $ (31,713) $ 21,004,131 $ (499,551) $ 22,581,439 $ (531,264) Mortgage-backed securities 2,203 (28) - - 2,203 (28) Obligations of states and political subdivisions 451,255 (4,893) 2,081,567 (32,015) 2,532,822 (36,908) Corporate securities 6,621,432 (62,555) 12,758,462 (338,323) 19,379,894 (400,878)Total temporarily impaired $ 8,652,198 $ (99,189) $ 35,844,160 $ (869,889) $ 44,496,358 $ (969,078)
Unrealized losses on securities have not been recognized into income because the issuers' bonds are of high credit quality.Management does not intend to sell the securities, it is not likely to be required to sell the securities prior to the recovery in value, and the decline in fair value is largely due to changes in interest rates. The fair value is expected to recover as the securities approach maturity.
There were no gains or losses as a result of the sale or call of securities in 2018. Sales of securities in 2017 generated proceeds of $13,680,000 and resulted in gross gains $78,17 6and gross losses of $36,830 for a net gain of $41,346.
GrossUnrealized
Gains
GrossUnrealized
Losses
FairValue
CarryingAmount
AmortizedCost
FairValue
GrossUnrecognized
Gains
GrossUnrecognized
Losses
FairValue
UnrealizedLoss
FairValue
TotalUnrealized
LossFair
ValueUnrealized
Loss
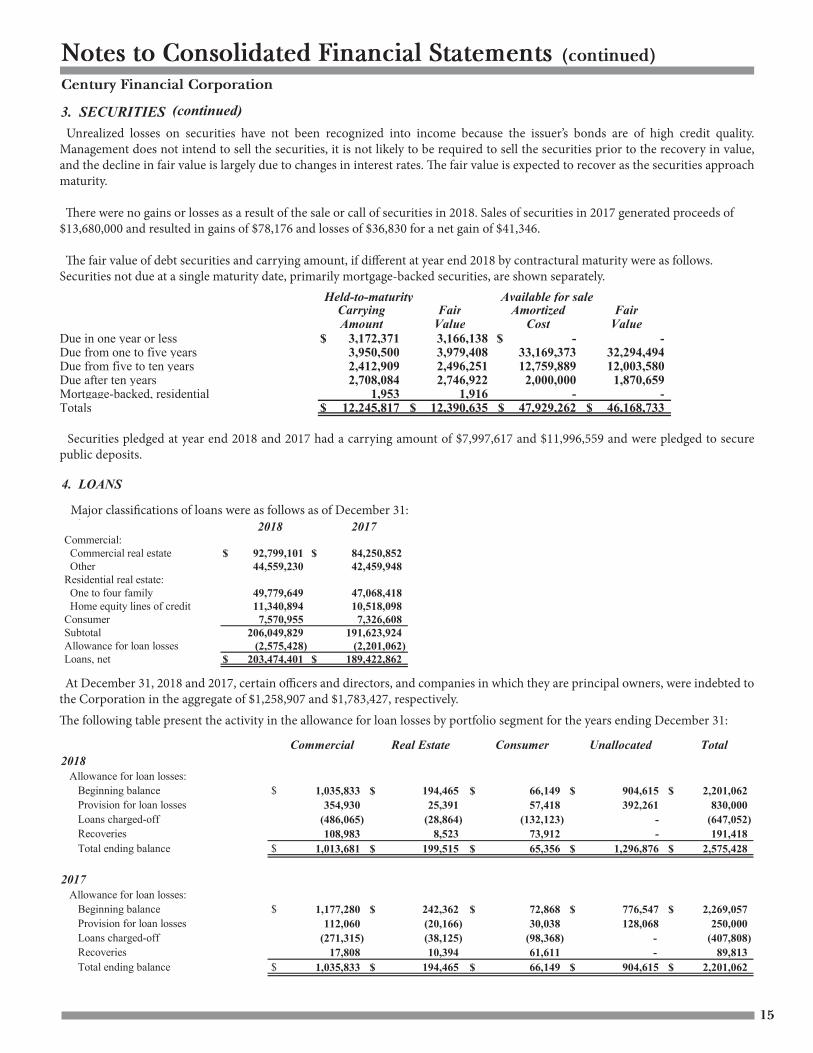
Notes to Consolidated Financial Statements (continued)
Held-to-maturity Available for sale Carrying Fair Amortized Fair Amount Value Cost Value
Due in one year or less $ 797,500 $ 798,067 $ 3,526,797 $ 3,547,523 Duefromonetofiveyears 5,798,730 5,809,375 12,215,845 12,310,727 Duefromfivetotenyears 1,084,000 1,084,000 18,643,467 18,305,102 Due after ten years 3,336,395 3,348,664 14,504,424 14,218,290 Mortgage-backed, residential 5,229 5,575 0 0 Totals $ 11,021,853 $ 11,045,680 $ 60,146,889 $ 48,381,641
3. SECURITIES (continued)
4. LOANS
2014 2013 Commercial: Commercial real estate $ 68,829,459 $ 62,233,373 Other 46,447,748 40,083,635 Residential real estate: One to four family 41,276,310 37,764,946 Home equity lines of credit 7,399,354 7,096,967 Consumer 5,760,433 4,869,885 Subtotal 169,713,303 152,048,806 Allowance for loan losses (2,123,627) (3,043,613)Loans,net $ 167,589,677 $ 149,005,193
MajorclassificationsofloanswereasfollowsasofDecember31:
At December 31, 2014 and 2013, certain officers and directors, and companies in which they are principal owners, wereindebted to the Corporation in the aggregate of $2,474,876 and $2,293,919, respectively.
Unrealized losses on securities have not been recognized into income because the issuers’ bonds are of high credit quality (rated A or higher), management does not intend to sell the securities, it is not likely to be required to sell the securities prior to the re-covery in value, and the decline in fair value is largely due to changes in interest rates. The fair value is expected to recover as the securities approach maturity.
Proceeds from sales of securities in 2014 and 2013 were $250,626 and $754,681 resulting in gross losses of $2,197 and $15,614, respectively.
The fair value of debt securities and carrying amount, if different, at year end 2013 by contractual maturity were as follows. Securities not due at a single maturity date, primarily mortgage-backed securities, are shown separately.
Securities pledged at year end 2014 and 2013 had a carrying amount $8,003,028 and $8,002,783 and were pledged to secure public deposits.
15
Gross Gross Amortized Unrealized Unrealized Fair
2014 Cost Gains Losses Value U.S. Treasury securities and obligations of U.S. government corporations and agencies $ 34,762,863 $ 9,281 $ (637,735) $ 37,134,409 Corporate Securities 14,127,670 197,543 (77,981) 12,247,232
$ 48,890,533 $ 206,824 $ (715,716) $ 48,381,641
2013 U.S. Treasury securities and obligations of U.S. government corporations and agencies $ 40,759,722 $ 0 $ (3,370,659) $ 37,389,063 Corporate Securities 19,387,167 284,048 (122,806) 19,548,409
$ 60,146,889 $ 284,048 $ (3,493,465) $ 56,937,472
Gross Gross Carrying Unrecognized Unrecognized Fair
2014 Amount Gains Losses Value Obligations of states and political subdivisions $ 11,016,624 $ 60,714 $ (37,233) $ 11,040,105 Mortgage-backed securities, residential 5,229 346 0 5,575 Totals $ 11,021,853 $ 61,060 $ (37,233) $ 11,045,680
2013 Obligations of states and political subdivisions $ 12,051,049 $ 29,831 $ (243,310) $ 11,837,571 Mortgage-backed securities, residential 6,729 416 0 7,145 Totals $ 12,057,778 $ 30,247 $ (243,310) $ 11,844,716
Century Financial Corporation
Unrealized losses on securities have not been recognized into income because the issuer’s bonds are of high credit quality. Management does not intend to sell the securities, it is not likely to be required to sell the securities prior to the recovery in value, and the decline in fair value is largely due to changes in interest rates. The fair value is expected to recover as the securities approach maturity.
There were no gains or losses as a result of the sale or call of securities in 2018. Sales of securities in 2017 generated proceeds of $13,680,000 and resulted in gains of $78,176 and losses of $36,830 for a net gain of $41,346. The fair value of debt securities and carrying amount, if different at year end 2018 by contractural maturity were as follows. Securities not due at a single maturity date, primarily mortgage-backed securities, are shown separately.
Notes to Consolidated Financial Statements (continued)
Held-to-maturity Available for sale Carrying Fair Amortized Fair Amount Value Cost Value
Due in one year or less $ 797,500 $ 798,067 $ 3,526,797 $ 3,547,523 Duefromonetofiveyears 5,798,730 5,809,375 12,215,845 12,310,727 Duefromfivetotenyears 1,084,000 1,084,000 18,643,467 18,305,102 Due after ten years 3,336,395 3,348,664 14,504,424 14,218,290 Mortgage-backed, residential 5,229 5,575 0 0 Totals $ 11,021,853 $ 11,045,680 $ 60,146,889 $ 48,381,641
3. SECURITIES (continued)
4. LOANS
2014 2013 Commercial: Commercial real estate $ 68,829,459 $ 62,233,373 Other 46,447,748 40,083,635 Residential real estate: One to four family 41,276,310 37,764,946 Home equity lines of credit 7,399,354 7,096,967 Consumer 5,760,433 4,869,885 Subtotal 169,713,303 152,048,806 Allowance for loan losses (2,123,627) (3,043,613)Loans,net $ 167,589,677 $ 149,005,193
MajorclassificationsofloanswereasfollowsasofDecember31:
At December 31, 2014 and 2013, certain officers and directors, and companies in which they are principal owners, wereindebted to the Corporation in the aggregate of $2,474,876 and $2,293,919, respectively.
Unrealized losses on securities have not been recognized into income because the issuers’ bonds are of high credit quality (rated A or higher), management does not intend to sell the securities, it is not likely to be required to sell the securities prior to the re-covery in value, and the decline in fair value is largely due to changes in interest rates. The fair value is expected to recover as the securities approach maturity.
Proceeds from sales of securities in 2014 and 2013 were $250,626 and $754,681 resulting in gross losses of $2,197 and $15,614, respectively.
The fair value of debt securities and carrying amount, if different, at year end 2013 by contractual maturity were as follows. Securities not due at a single maturity date, primarily mortgage-backed securities, are shown separately.
Securities pledged at year end 2014 and 2013 had a carrying amount $8,003,028 and $8,002,783 and were pledged to secure public deposits.
15
Gross Gross Amortized Unrealized Unrealized Fair
2014 Cost Gains Losses Value U.S. Treasury securities and obligations of U.S. government corporations and agencies $ 34,762,863 $ 9,281 $ (637,735) $ 37,134,409 Corporate Securities 14,127,670 197,543 (77,981) 12,247,232
$ 48,890,533 $ 206,824 $ (715,716) $ 48,381,641
2013 U.S. Treasury securities and obligations of U.S. government corporations and agencies $ 40,759,722 $ 0 $ (3,370,659) $ 37,389,063 Corporate Securities 19,387,167 284,048 (122,806) 19,548,409
$ 60,146,889 $ 284,048 $ (3,493,465) $ 56,937,472
Gross Gross Carrying Unrecognized Unrecognized Fair
2014 Amount Gains Losses Value Obligations of states and political subdivisions $ 11,016,624 $ 60,714 $ (37,233) $ 11,040,105 Mortgage-backed securities, residential 5,229 346 0 5,575 Totals $ 11,021,853 $ 61,060 $ (37,233) $ 11,045,680
2013 Obligations of states and political subdivisions $ 12,051,049 $ 29,831 $ (243,310) $ 11,837,571 Mortgage-backed securities, residential 6,729 416 0 7,145 Totals $ 12,057,778 $ 30,247 $ (243,310) $ 11,844,716
Century Financial Corporation
Securities pledged at year end 2018 and 2017 had a carrying amount of $7,997,617 and $11,996,559 and were pledged to secure public deposits.
Notes to Consolidated Financial Statements (continued)Century Financial Corporation
4. LOANS
Major classifications of loans were as follows as of December 31:2018 2017
Commercial: Commercial real estate $ 92,799,101 $ 84,250,852
Other 44,559,230 42,459,948 Residential real estate:
One to four family 49,779,649 47,068,418 Home equity lines of credit 11,340,894 10,518,098
Consumer 7,570,955 7,326,608 Subtotal 206,049,829 191,623,924 Allowance for loan losses (2,575,428) (2,201,062) Loans, net $ 203,474,401 $ 189,422,862
At December 31, 2018 and 2017, certain officers and directors, and companies in which they are principal owners, were indebted to the Corporation in the aggregate of $1,258,907 and $1,783,427, respectively.
The following tables present the activity in the allowance for loan losses by portfolio segment for the years ending December 31:Residential
Commercial Real Estate Consumer Unallocated Total2018 Allowance for loan losses:
Beginning balance $ 1,035,833 $ 194,465 $ 66,149 $ 904,615 $ 2,201,062 Provision for loan losses 354,930 25,391 57,418 392,261 830,000 Loans charged-off (486,065) (28,864) (132,123) - (647,052) Recoveries 108,983 8,523 73,912 - 191,418 Total ending balance $ 1,013,681 $ 199,515 $ 65,356 $ 1,296,876 $ 2,575,428
2017 Allowance for loan losses:
Beginning balance $ 1,177,280 $ 242,362 $ 72,868 $ 776,547 $ 2,269,057 Provision for loan losses 112,060 (20,166) 30,038 128,068 250,000 Loans charged-off (271,315) (38,125) (98,368) - (407,808) Recoveries 17,808 10,394 61,611 - 89,813 Total ending balance $ 1,035,833 $ 194,465 $ 66,149 $ 904,615 $ 2,201,062
The following table presents the balance in the allowance for loan losses and the recorded investment in loans by portfolio segment and based
ResidentialCommercial Real Estate Consumer Unallocated Total
2018 Allowance for loan losses:
Ending allowance balance attributable to loans: Individually evaluated for impairment $ 410,000 $ - $ - $ - $ 410,000 Collectively evaluated for impairment 603,681 199,515 65,356 1,296,876 2,165,428
Total ending allowance balance $ 1,013,681 $ 199,515 $ 65,356 $ 1,296,876 $ 2,575,428
Loans: Individually evaluated for impairment $ 2,140,366 $ 470,743 $ - $ - $ 2,611,109 Collectively evaluated for impairment 135,217,965 60,649,800 7,570,955 - 203,438,720 Total ending loans balance $ 137,358,331 $ 61,120,543 $ 7,570,955 $ - $ 206,049,829
2017 Allowance for loan losses:
Ending allowance balance attributable to loans: Individually evaluated for impairment $ 250,000 $ - $ - $ - $ 250,000 Collectively evaluated for impairment 785,833 194,465 66,149 904,615 1,951,062
Total ending allowance balance $ 1,035,833 $ 194,465 $ 66,149 $ 904,615 $ 2,201,062
Loans: Individually evaluated for impairment $ 3,243,967 $ 509,814 $ - $ - $ 3,753,781 Collectively evaluated for impairment 123,466,833 57,076,702 7,326,608 - 187,870,143 Total ending loans balance $ 126,710,800 $ 57,586,516 $ 7,326,608 $ - $ 191,623,924
The following tables present information related to impaired loans by class of loans as of and for the years ending December 31:
Interest Cash BasisAllowance for AverageUnpaid
At December 31, 2018 and 2017, certain officers and directors, and companies in which they are principal owners, were indebted to the Corporation in the aggregate of $1,258,907 and $1,783,427, respectively.The following table present the activity in the allowance for loan losses by portfolio segment for the years ending December 31:
Notes to Consolidated Financial Statements (continued)Century Financial Corporation
4. LOANS
Major classifications of loans were as follows as of December 31:2018 2017
Commercial: Commercial real estate $ 92,799,101 $ 84,250,852
Other 44,559,230 42,459,948 Residential real estate:
One to four family 49,779,649 47,068,418 Home equity lines of credit 11,340,894 10,518,098
Consumer 7,570,955 7,326,608 Subtotal 206,049,829 191,623,924 Allowance for loan losses (2,575,428) (2,201,062) Loans, net $ 203,474,401 $ 189,422,862
At December 31, 2018 and 2017, certain officers and directors, and companies in which they are principal owners, were indebted to the Corporation in the aggregate of $1,258,907 and $1,783,427, respectively.
The following tables present the activity in the allowance for loan losses by portfolio segment for the years ending December 31:Residential
Commercial Real Estate Consumer Unallocated Total2018 Allowance for loan losses:
Beginning balance $ 1,035,833 $ 194,465 $ 66,149 $ 904,615 $ 2,201,062 Provision for loan losses 354,930 25,391 57,418 392,261 830,000 Loans charged-off (486,065) (28,864) (132,123) - (647,052) Recoveries 108,983 8,523 73,912 - 191,418 Total ending balance $ 1,013,681 $ 199,515 $ 65,356 $ 1,296,876 $ 2,575,428
2017 Allowance for loan losses:
Beginning balance $ 1,177,280 $ 242,362 $ 72,868 $ 776,547 $ 2,269,057 Provision for loan losses 112,060 (20,166) 30,038 128,068 250,000 Loans charged-off (271,315) (38,125) (98,368) - (407,808) Recoveries 17,808 10,394 61,611 - 89,813 Total ending balance $ 1,035,833 $ 194,465 $ 66,149 $ 904,615 $ 2,201,062
The following table presents the balance in the allowance for loan losses and the recorded investment in loans by portfolio segment and based
ResidentialCommercial Real Estate Consumer Unallocated Total
2018 Allowance for loan losses:
Ending allowance balance attributable to loans: Individually evaluated for impairment $ 410,000 $ - $ - $ - $ 410,000 Collectively evaluated for impairment 603,681 199,515 65,356 1,296,876 2,165,428
Total ending allowance balance $ 1,013,681 $ 199,515 $ 65,356 $ 1,296,876 $ 2,575,428
Loans: Individually evaluated for impairment $ 2,140,366 $ 470,743 $ - $ - $ 2,611,109 Collectively evaluated for impairment 135,217,965 60,649,800 7,570,955 - 203,438,720 Total ending loans balance $ 137,358,331 $ 61,120,543 $ 7,570,955 $ - $ 206,049,829
2017 Allowance for loan losses:
Ending allowance balance attributable to loans: Individually evaluated for impairment $ 250,000 $ - $ - $ - $ 250,000 Collectively evaluated for impairment 785,833 194,465 66,149 904,615 1,951,062
Total ending allowance balance $ 1,035,833 $ 194,465 $ 66,149 $ 904,615 $ 2,201,062
Loans: Individually evaluated for impairment $ 3,243,967 $ 509,814 $ - $ - $ 3,753,781 Collectively evaluated for impairment 123,466,833 57,076,702 7,326,608 - 187,870,143 Total ending loans balance $ 126,710,800 $ 57,586,516 $ 7,326,608 $ - $ 191,623,924
The following tables present information related to impaired loans by class of loans as of and for the years ending December 31:
Interest Cash BasisAllowance for AverageUnpaid
Major classifications of loans were as follows as of December 31:
Notes to Consolidated Financial Statements (continued)
Gross Gross Amortized Unrealized Unrealized Fair
2014 Cost Gains Losses Value U.S. Treasury securities and obligations of U.S. government corporations and agencies $ 34,762,863 $ 9,281 $ (637,735) $ 37,134,409 Corporate Securities 14,127,670 197,543 (77,981) 12,247,232
$ 48,890,533 $ 206,824 $ (715,716) $ 48,381,641
2013 U.S. Treasury securities and obligations of U.S. government corporations and agencies $ 40,759,722 $ 0 $ (3,370,659) $ 37,389,063 Corporate Securities 19,387,167 284,048 (122,806) 19,548,409
$ 60,146,889 $ 284,048 $ (3,493,465) $ 56,937,472
Gross Gross Carrying Unrecognized Unrecognized Fair
2014 Amount Gains Losses Value Obligations of states and political subdivisions $ 11,016,624 $ 60,714 $ (37,233) $ 11,040,105 Mortgage-backed securities, residential 5,229 346 0 5,575 Totals $ 11,021,853 $ 61,060 $ (37,233) $ 11,045,680
2013 Obligations of states and political subdivisions $ 12,051,049 $ 29,831 $ (243,310) $ 11,837,571 Mortgage-backed securities, residential 6,729 416 0 7,145 Totals $ 12,057,778 $ 30,247 $ (243,310) $ 11,844,716
3. SECURITIES The fair value of available for sale securities and the related gross unrealized gains and losses recognized in accumulated other comprehensive income were as follows:
Securities with unrealized losses at year end 2013 and 2012, aggregated by investment category and length of time that individual securities have been in a continuous unrealized loss position, are as follows:
The carrying amount, unrecognized gains and losses, and fair value of securities held to maturity were as follows:
12 Months or More Total Fair Unrealized Fair Unrealized Fair Unrealized
2014 Value Loss Value Loss Value Loss U.S. Treasury $ 1,498,325 $ (1,675) $ 30,134,679 $ (636,060) $ 31,633,004 $ (637,735) Obligations of states and political subdivisions 0 0 2,840,568 (37,233) 2,840,568 (37,233) Corporate securities 1,720,355 (11,754) 3,779,765 (66,227) 5,500,120 (77,981)Total temporarily impaired $ 3,218,680 $ (13,429) $ 36,755,012 $ (739,520) $ 39,973,692 $ (752,949)
2013 U.S. Treasury $ 30,452,933 $ (2,805,319) $ 6,936,130 $ (565,340) $ 37,389,063 $ (3,370,659) Obligations of states and political subdivisions 2,117,892 (127,377) 2,274,823 (115,933) 4,392,715 (243,310) Corporate securities 4,980,646 (119,105) 868,561 (3,701) 5,849,207 (122,806)Total temporarily impaired $ 37,551,470 $ (3,051,801) $ 10,079,514 $ (684,974) $ 47,630,985 $ (3,736,775)
Less than 12 Months
14
Century Financial Corporation
12
Notes to Consolidated Financial Statements (continued)
Bank Owned Life Insurance The Corporation has purchased life insurance policies on certain key executives. Bank owned life insurance is recorded at theamount that can be realized under the insurance contract at the balance sheet date, which is the cash surrender value adjustedfor other changes or amounts due that are probable at settlement.
Servicing Rights Servicing rights represent the fair value of servicing rights retained on loans sold. Servicing rights are expensed in proportionto, and over the period of, estimated net servicing revenues. Impairment is evaluated based on the fair value of the rights, usinggroupings of the underlying loans as to interest rates and prepayment characteristics. Fair value is determined using pricesforsimilarassetswithsimilarcharacteristics,whenavailable,orbasedupondiscountedcashflowsusingmarket-basedassumptions. Any impairment of a grouping is reported as a valuation allowance. Servicing fee income, which is reported on the income statement as other income, is recorded for fees earned for servicingloans. The fees are based on a contractual percentage of the outstanding principal. The amortization of mortgage servicingrights is netted against loan servicing fee income. Servicing fees totaled $218,000 and $216,000 for the years ended December31,2014and2013.Latefeesandancillaryfeesrelatedtoloanservicingarenotmaterial.
Transfers of Financial AssetsTransfersoffinancialassetsareaccountedforassales,whencontrolovertheassetshasbeensurrendered.Controlovertransferred assets is deemed to be surrendered when (1) the assets have been isolated from the Corporation, (2) the transfereeobtains the right (free of conditions that constrain it from taking advantage of that right) to pledge or exchange the transferredassets, and (3) the Corporation does not maintain effective control over the transferred assets through an agreement to repur-chase them before their maturity.
Foreclosed Assets Assets acquired in collection of a loan are recorded at fair value less costs to sell at acquisition. Any reduction to fair valueat acquisition from carrying value is recorded as a loan loss. After acquisition, a valuation allowance reduces the reportedamount for further reductions in fair value. Expenses, gains and losses on disposition, and changes in the valuation allowanceare reported as other expense. The Corporation had $381,000 and $460,000 of foreclosed assets at December 31, 2014 and 2013.
Premises and EquipmentLandiscarriedatcost.Premisesandequipmentarestatedatcostlessaccumulateddepreciation.Buildingsandrelatedcomponentsaredepreciatedusingthestraight-linemethodandfurniture,fixturesandequipmentaredepreciatedusingthestraight-line or accelerated methods.
Long-term Assets Premises and equipment and other long-term assets are reviewed for impairment when events indicate their carrying amountmaynotberecoverablefromfutureundiscountedcashflows.Ifimpaired,theassetsarerecordedatfairvalue.
Retirement Plans Pension expense is the net of service and interest cost, return on plan assets, and amortization of gains and losses notimmediately recognized. Expense for the Employee Stock Ownership Plan is the amount contributed as determined by theBoard of Directors.Stock Compensation Compensation cost is recognized for stock options issued to employees, based on the fair value of these awards at the dateof the grant. There have been no stock options granted during 2014 or 2013.
Income Taxes Income tax expense is the tax due or refundable for the period plus or minus the change during the period in the deferred taxassets and liabilities. Deferred income tax assets and liabilities are computed annually for temporary differences between thefinancialstatementandtaxbasesofassetsandliabilitiesthatwillresultintaxableordeductibleamountsinthefuturebasedonenacted tax laws and rates applicable to the periods in which the differences are expected to affect taxable income. Valuationallowances are established, when necessary, to reduce deferred tax assets to the amount expected to be realized.Ataxpositionisrecognizedasabenefitonlyifitis“morelikelythannot”thatthetaxpositionwouldbesustainedinataxexamination,withataxexaminationbeingpresumedtooccur.Theamountrecognizedisthelargestamountoftaxbenefitthatis greater than 50% likely of being realized on examination. For tax positions not meeting the “more likely than not” test, notaxbenefitisrecorded. The Corporation recognizes interest and/or penalties related to income tax matters in income tax expense.
1. SIGNIFICANT ACCOUNTING POLICIES (continued)
Century Financial Corporation
The fair value of debt securities and carrying amount, if different, at year end 2018 by contractual maturity were as follows.Securities not due at a single maturity date, primarily mortgage-backed securities, are shown separately.
Held-to-maturity Available for sale
Due in one year or less $ 3,172,371 3,166,138 $ - - Due from one to five years 3,950,500 3,979,408 33,169,373 32,294,494 Due from five to ten years 2,412,909 2,496,251 12,759,889 12,003,580 Due after ten years 2,708,084 2,746,922 2,000,000 1,870,659 Mortgage-backed, residential 1,953 1,916 - - Totals $ 12,245,817 $ 12,390,635 $ 47,929,262 $ 46,168,733
Securities pledged at year end 2018 and 2017 had a carrying amount of $7,997,617 and $11,996,559, respectively and were pledged to secure public deposits.
Amount Value Cost ValueCarrying Fair Amortized Fair
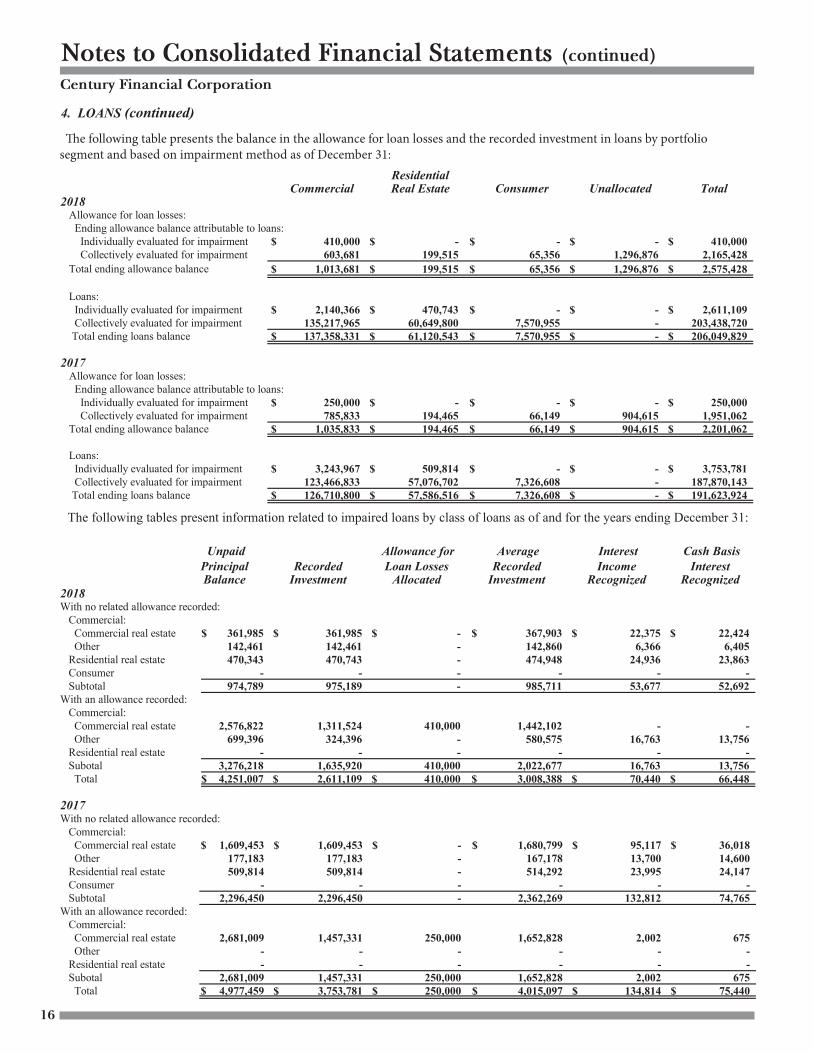
Notes to Consolidated Financial Statements (continued)
4. LOANS (continued)MajorclassificationsofloanswereasfollowsasofDecember31:
The following tables present the balance in the allowance for loan losses and the recorded investment in loans by portfolio segment and based on impairment method as of December 31:
Residential Commercial Real Estate Consumer Unallocated Total
2013 Allowance for loan losses: Beginning balance $ 2,097,859 $ 528,230 $ 79,139 $ 338,385 $ 3,043,613 Provision for loan losses (62,996) 184,516 24,375 14,105 160,000 Loanscharged-off (811,216) (315,917) (70,544) 0 (1,197,677) Recoveries 60,248 20,747 36,696 0 117,691 Total ending balance $ 1,283,895 $ 417,576 $ 69,665 $ 352,490 $ 2,123,627
2012 Allowance for loan losses: Beginning balance $ 2,459,008 $ 548,826 $ 81,121 $ 209,016 $ 3,297,971 Provision for loan losses 140,580 156,868 58,183 129,369 485,000 Loanscharged-off (529,941) (245,892) (90,069) 0 (865,902) Recoveries 28,212 68,428 29,904 0 126,544 Total ending balance $ 2,097,859 $ 528,230 $ 79,139 $ 338,385 $ 3,043,613
Residential Commercial Real Estate Consumer Unallocated Total
2013 Allowance for loan losses: Ending allowance balance attributable to loans: Individually evaluated for impairment $ 370,000 $ 0 0 $ 0 $ 370,000 Collectively evaluated for impairment 913,895 417,576 69,665 352,490 1,753,626 Total ending allowance balance $ 1,283,895 $ 417,576 $ 69,665 $ 352,490 $ 2,123,626
Loans: Individually evaluated for impairment $ 3,192,627 $ 626,129 $ 0 $ 0 $ 3,818,756 Collectively evaluated for impairment 112,084,579 48,049,535 5,760,433 0 165,894,547 Total ending loans balance $ 115,277,206 $ 48,675,664 $ 5,760,433 $ 0 $ 169,713,303
2012 Allowance for loan losses: Ending allowance balance attributable to loans: Individually evaluated for impairment $ 1,100,000 $ 40,000 0 $ 0 $ 1,140,000 Collectively evaluated for impairment 997,859 488,230 79,139 338,385 1,903,613 Total ending allowance balance $ 2,097,859 $ 528,230 $ 79,139 $ 338,385 $ 3,043,613
Loans: Individually evaluated for impairment $ 3,301,002 $ 983,805 $ 15,458 $ 0 $ 4,300,265 Collectively evaluated for impairment 99,016,006 43,878,108 4,854,427 0 147,748,541 Total ending loans balance $ 102,317,008 $ 44,861,913 $ 4,869,885 $ 0 $ 152,048,806
The following tables present the activity in the allowance for loan losses by portfolio segment for the years ending December 31:
16
Century Financial Corporation
2018With no related allowance recorded: Commercial: Commercial real estate $ 361,985 $ 361,985 $ - $ 367,903 $ 22,375 $ 22,424 Other 142,461 142,461 - 142,860 6,366 6,405 Residential real estate 470,343 470,743 - 474,948 24,936 23,863 Consumer - - - - - - Subtotal 974,789 975,189 - 985,711 53,677 52,692With an allowance recorded: Commercial: Commercial real estate 2,576,822 1,311,524 410,000 1,442,102 - - Other 699,396 324,396 - 580,575 16,763 13,756 Residential real estate - - - - - - Subotal 3,276,218 1,635,920 410,000 2,022,677 16,763 13,756 Total $ 4,251,007 2,611,109 $ 410,000 $ 3,008,388 $ 70,440 $ 66,448
2017With no related allowance recorded: Commercial: Commercial real estate $ 1,609,453 $ 1,609,453 $ - $ 1,680,799 $ 95,117 $ 36,018 Other 177,183 177,183 - 167,178 13,700 14,600 Residential real estate 509,814 509,814 - 514,292 23,995 24,147 Consumer - - - - - - Subtotal 2,296,450 2,296,450 - 2,362,269 132,812 74,765 With an allowance recorded: Commercial: Commercial real estate 2,681,009 1,457,331 250,000 1,652,828 2,002 675 Other - - - - - - Residential real estate - - - - - - Subotal 2,681,009 1,457,331 250,000 1,652,828 2,002 675 Total $ 4,977,459 3,753,781 $ 250,000 $ 4,015,097 $ 134,814 $ 75,440
The recorded investment in loans does not include accrued interest receivable and loan origination fees, net, as they are immaterial. Forpurposes of this disclosure, the unpaid principal balance is not reduced for net charge-offs.
Nonaccrual loans and loans past due 90 days and still on accrual include both smaller balance homogenous loans that are collectively evaluated for impairment and individually classified impaired loans.
The following tables present the recorded investment in nonaccrual and loans past due over 90 days still on accrual by class of loans as of
Commercial: Commercial real estate $ 1,311,524 $ 1,521,325 $ - $ - Other 324,396 73,006 - - Residential real estate: One to four family 96,076 250,261 212,690 23,880 Home equity lines of credit 16,443 66,966 - - Consumer 13,996 30,732 - - Total $ 1,762,435 $ 1,942,290 $ 212,690 $ 23,880
2018 Commercial: Commercial real estate $ 635,312 $ 839,708 $ 1,475,020 $ 91,324,081 $ 92,799,101 Other 201,646 225,000 426,646 44,132,584 44,559,230 Residential real estate: One to four family 1,515,217 262,956 1,778,173 48,001,476 49,779,649 Home equity lines of credit 103,522 16,443 119,965 11,220,929 11,340,894 Consumer 115,543 11,658 127,201 7,443,754 7,570,955 Total $ 2,571,240 $ 1,355,765 $ 3,927,005 $ 202,122,824 $ 206,049,829
2017 Commercial: Commercial real estate $ 437,324 $ 1,116,620 $ 1,553,944 $ 82,696,908 $ 84,250,852 Other 1,205,943 73,006 1,278,949 41,180,999 42,459,948 Residential real estate: One to four family 1,875,431 262,793 2,138,224 44,930,194 47,068,418 Home equity lines of credit 319,897 25,324 345,221 10,172,877 10,518,098 Consumer 124,623 18,274 142,897 7,178,511 7,326,608
IncomeRecognized
InterestRecognized
Loan LossesAllocated
RecordedInvestment
PrincipalBalance
RecordedInvestment
TotalPast Due
Loans NotPast Due Total
30 - 89 DaysGreater than
89 DaysPast DuePast Due
Loans Past Due Over90 Days Still Accruing
2018 2017 2018 2017Nonaccrual
$
$
Notes to Consolidated Financial Statements (continued)Century Financial Corporation
4. LOANS
Major classifications of loans were as follows as of December 31:2018 2017
Commercial: Commercial real estate $ 92,799,101 $ 84,250,852
Other 44,559,230 42,459,948 Residential real estate:
One to four family 49,779,649 47,068,418 Home equity lines of credit 11,340,894 10,518,098
Consumer 7,570,955 7,326,608 Subtotal 206,049,829 191,623,924 Allowance for loan losses (2,575,428) (2,201,062) Loans, net $ 203,474,401 $ 189,422,862
At December 31, 2018 and 2017, certain officers and directors, and companies in which they are principal owners, were indebted to the Corporation in the aggregate of $1,258,907 and $1,783,427, respectively.
The following tables present the activity in the allowance for loan losses by portfolio segment for the years ending December 31:Residential
Commercial Real Estate Consumer Unallocated Total2018 Allowance for loan losses:
Beginning balance $ 1,035,833 $ 194,465 $ 66,149 $ 904,615 $ 2,201,062 Provision for loan losses 354,930 25,391 57,418 392,261 830,000 Loans charged-off (486,065) (28,864) (132,123) - (647,052) Recoveries 108,983 8,523 73,912 - 191,418 Total ending balance $ 1,013,681 $ 199,515 $ 65,356 $ 1,296,876 $ 2,575,428
2017 Allowance for loan losses:
Beginning balance $ 1,177,280 $ 242,362 $ 72,868 $ 776,547 $ 2,269,057 Provision for loan losses 112,060 (20,166) 30,038 128,068 250,000 Loans charged-off (271,315) (38,125) (98,368) - (407,808) Recoveries 17,808 10,394 61,611 - 89,813 Total ending balance $ 1,035,833 $ 194,465 $ 66,149 $ 904,615 $ 2,201,062
The following table presents the balance in the allowance for loan losses and the recorded investment in loans by portfolio segment and based
ResidentialCommercial Real Estate Consumer Unallocated Total
2018 Allowance for loan losses:
Ending allowance balance attributable to loans: Individually evaluated for impairment $ 410,000 $ - $ - $ - $ 410,000 Collectively evaluated for impairment 603,681 199,515 65,356 1,296,876 2,165,428
Total ending allowance balance $ 1,013,681 $ 199,515 $ 65,356 $ 1,296,876 $ 2,575,428
Loans: Individually evaluated for impairment $ 2,140,366 $ 470,743 $ - $ - $ 2,611,109 Collectively evaluated for impairment 135,217,965 60,649,800 7,570,955 - 203,438,720 Total ending loans balance $ 137,358,331 $ 61,120,543 $ 7,570,955 $ - $ 206,049,829
2017 Allowance for loan losses:
Ending allowance balance attributable to loans: Individually evaluated for impairment $ 250,000 $ - $ - $ - $ 250,000 Collectively evaluated for impairment 785,833 194,465 66,149 904,615 1,951,062
Total ending allowance balance $ 1,035,833 $ 194,465 $ 66,149 $ 904,615 $ 2,201,062
Loans: Individually evaluated for impairment $ 3,243,967 $ 509,814 $ - $ - $ 3,753,781 Collectively evaluated for impairment 123,466,833 57,076,702 7,326,608 - 187,870,143 Total ending loans balance $ 126,710,800 $ 57,586,516 $ 7,326,608 $ - $ 191,623,924
The following tables present information related to impaired loans by class of loans as of and for the years ending December 31:
Interest Cash BasisAllowance for AverageUnpaid
The following table presents the balance in the allowance for loan losses and the recorded investment in loans by portfolio segment and based on impairment method as of December 31:
The following tables present information related to impaired loans by class of loans as of and for the years ending December 31:

Notes to Consolidated Financial Statements (continued)
4. LOANS (continued)
The recorded investment in loans does not include accrued interest receivable and loan origination fees, net, as they are immaterial. For purposes of this disclosure, the unpaid principal balance is not reduced for net charge-offs.
Nonaccrual loans and loans past due 90 days and still on accrual include both smaller balance homogeneous loans that are col-lectivelyevaluatedforimpairmentandindividuallyclassifiedimpairedloans.
The following tables present information related to impaired loans by class of loans as of and for the years ending December 31:
Unpaid Allowance for Average Interest Cash Basis Principal Recorded Loan Losses Recorded Income Interest Balance Investment Allocated Investment Recognized Recognized
2014With no related allowance recorded: Commercial: Commercial real estate $ 69,622 $ 0 $ 0 $ 0 $ 0 $ 0 Other 48,451 12,900 0 17,150 0 0 Residential real estate 626,129 626,129 0 629,297 14,346 14,293 Consumer 0 0 0 0 0 0 Subtotal 744,202 639,029 0 646,447 14,346 14,293 With an allowance recorded: Commercial: Commercial real estate 4,144,708 3,141,227 361,656 3,966,603 9,503 11,351 Other 179,500 38,500 8,344 114,496 0 0 Residential real estate 0 0 0 0 0 0 Subotal 4,324,208 3,179,727 370,000 4,081,099 9,503 11,351 Total $ 5,068,410 $ 3,818,756 $ 370,000 $ 4,727,546 $ 23,849 $ 25,644
2013With no related allowance recorded: Commercial: Commercial real estate $ 332,873 $ 204,420 $ 0 $ 243,496 $ 669 $ 805 Other 78,238 34,900 0 44,591 0 0 Residential real estate 713,480 665,530 0 702,867 16,302 14,121 Consumer 20,179 15,458 0 20,270 1,254 1,209 Subtotal 1,144,770 920,308 0 1,011,224 18,225 16,135 With an allowance recorded: Commercial: Commercial real estate 3,381,798 2,871,000 1,013,600 3,030,950 0 2,500 Other 190,682 190,682 86,400 191,307 0 0 Residential real estate 318,275 318,275 40,000 318,980 11,763 12,321 Subotal 3,890,755 3,379,957 1,140,000 3,541,237 11,763 14,821
Total $ 5,035,525 $ 4,300,265 $ 1,140,000 $ 4,552,461 $ 29,988 $ 30,956
17
Century Financial Corporation
The recorded investment in loans does not include accrued interest receivable and loan origination fees, net, as they are immaterial. For purposes of this disclosure, the unpaid principal balance is not reduced for net charge-offs.
Nonaccrual loans and loans past due 90 days and still on accrual include both smaller balance homogeneous loans that are collectively evaluated for impairment and individually classified impaired loans.
The following tables present the recorded investment in nonaccrual and loans past due over 90 days still on accrual by class of loans as of December 31:
Troubled Debt Restructurings:
The Corporation has allocated $305,000 and $250,000 of specific reserve to customers whose loan terms have been modified in troubled debt restructurings as of December 31, 2018 and 2017. No additional amounts are committed to be lent to these borrowers. During the years ended December 31, 2018 and 2017, the terms of certain loans were modified as troubled debt restructurings.The modification of the terms of such loans included a reduction of the stated interest rate of the loan or an extension of the maturity date at a stated rate of interest lower than the current market rate for new debt with similar risk. Modifications involving a reduction of the stated interest rate of the loan were for periods ranging from 12 months to 120 months. Modifications involving an extension of the maturity date were for 12 months.
967,51624,370,84220,911,029
2,401,901-
48,651,288
FairValue2018
With no related allowance recorded: Commercial: Commercial real estate $ 361,985 $ 361,985 $ - $ 367,903 $ 22,375 $ 22,424 Other 142,461 142,461 - 142,860 6,366 6,405 Residential real estate 470,343 470,743 - 474,948 24,936 23,863 Consumer - - - - - - Subtotal 974,789 975,189 - 985,711 53,677 52,692With an allowance recorded: Commercial: Commercial real estate 2,576,822 1,311,524 410,000 1,442,102 - - Other 699,396 324,396 - 580,575 16,763 13,756 Residential real estate - - - - - - Subotal 3,276,218 1,635,920 410,000 2,022,677 16,763 13,756 Total $ 4,251,007 2,611,109 $ 410,000 $ 3,008,388 $ 70,440 $ 66,448
2017With no related allowance recorded: Commercial: Commercial real estate $ 1,609,453 $ 1,609,453 $ - $ 1,680,799 $ 95,117 $ 36,018 Other 177,183 177,183 - 167,178 13,700 14,600 Residential real estate 509,814 509,814 - 514,292 23,995 24,147 Consumer - - - - - - Subtotal 2,296,450 2,296,450 - 2,362,269 132,812 74,765 With an allowance recorded: Commercial: Commercial real estate 2,681,009 1,457,331 250,000 1,652,828 2,002 675 Other - - - - - - Residential real estate - - - - - - Subotal 2,681,009 1,457,331 250,000 1,652,828 2,002 675 Total $ 4,977,459 3,753,781 $ 250,000 $ 4,015,097 $ 134,814 $ 75,440
The recorded investment in loans does not include accrued interest receivable and loan origination fees, net, as they are immaterial. Forpurposes of this disclosure, the unpaid principal balance is not reduced for net charge-offs.
Nonaccrual loans and loans past due 90 days and still on accrual include both smaller balance homogenous loans that are collectively evaluated for impairment and individually classified impaired loans.
The following tables present the recorded investment in nonaccrual and loans past due over 90 days still on accrual by class of loans as of
Commercial: Commercial real estate $ 1,311,524 $ 1,521,325 $ - $ - Other 324,396 73,006 - - Residential real estate: One to four family 96,076 250,261 212,690 23,880 Home equity lines of credit 16,443 66,966 - - Consumer 13,996 30,732 - - Total $ 1,762,435 $ 1,942,290 $ 212,690 $ 23,880
2018 Commercial: Commercial real estate $ 635,312 $ 839,708 $ 1,475,020 $ 91,324,081 $ 92,799,101 Other 201,646 225,000 426,646 44,132,584 44,559,230 Residential real estate: One to four family 1,515,217 262,956 1,778,173 48,001,476 49,779,649 Home equity lines of credit 103,522 16,443 119,965 11,220,929 11,340,894 Consumer 115,543 11,658 127,201 7,443,754 7,570,955 Total $ 2,571,240 $ 1,355,765 $ 3,927,005 $ 202,122,824 $ 206,049,829
2017 Commercial: Commercial real estate $ 437,324 $ 1,116,620 $ 1,553,944 $ 82,696,908 $ 84,250,852 Other 1,205,943 73,006 1,278,949 41,180,999 42,459,948 Residential real estate: One to four family 1,875,431 262,793 2,138,224 44,930,194 47,068,418 Home equity lines of credit 319,897 25,324 345,221 10,172,877 10,518,098 Consumer 124,623 18,274 142,897 7,178,511 7,326,608
IncomeRecognized
InterestRecognized
Loan LossesAllocated
RecordedInvestment
PrincipalBalance
RecordedInvestment
TotalPast Due
Loans NotPast Due Total
30 - 89 DaysGreater than
89 DaysPast DuePast Due
Loans Past Due Over90 Days Still Accruing
2018 2017 2018 2017Nonaccrual
$
$
2018With no related allowance recorded: Commercial: Commercial real estate $ 361,985 $ 361,985 $ - $ 367,903 $ 22,375 $ 22,424 Other 142,461 142,461 - 142,860 6,366 6,405 Residential real estate 470,343 470,743 - 474,948 24,936 23,863 Consumer - - - - - - Subtotal 974,789 975,189 - 985,711 53,677 52,692With an allowance recorded: Commercial: Commercial real estate 2,576,822 1,311,524 410,000 1,442,102 - - Other 699,396 324,396 - 580,575 16,763 13,756 Residential real estate - - - - - - Subotal 3,276,218 1,635,920 410,000 2,022,677 16,763 13,756 Total $ 4,251,007 2,611,109 $ 410,000 $ 3,008,388 $ 70,440 $ 66,448
2017With no related allowance recorded: Commercial: Commercial real estate $ 1,609,453 $ 1,609,453 $ - $ 1,680,799 $ 95,117 $ 36,018 Other 177,183 177,183 - 167,178 13,700 14,600 Residential real estate 509,814 509,814 - 514,292 23,995 24,147 Consumer - - - - - - Subtotal 2,296,450 2,296,450 - 2,362,269 132,812 74,765 With an allowance recorded: Commercial: Commercial real estate 2,681,009 1,457,331 250,000 1,652,828 2,002 675 Other - - - - - - Residential real estate - - - - - - Subotal 2,681,009 1,457,331 250,000 1,652,828 2,002 675 Total $ 4,977,459 3,753,781 $ 250,000 $ 4,015,097 $ 134,814 $ 75,440
The recorded investment in loans does not include accrued interest receivable and loan origination fees, net, as they are immaterial. Forpurposes of this disclosure, the unpaid principal balance is not reduced for net charge-offs.
Nonaccrual loans and loans past due 90 days and still on accrual include both smaller balance homogenous loans that are collectively evaluated for impairment and individually classified impaired loans.
The following tables present the recorded investment in nonaccrual and loans past due over 90 days still on accrual by class of loans as of
Commercial: Commercial real estate $ 1,311,524 $ 1,521,325 $ - $ - Other 324,396 73,006 - - Residential real estate: One to four family 96,076 250,261 212,690 23,880 Home equity lines of credit 16,443 66,966 - - Consumer 13,996 30,732 - - Total $ 1,762,435 $ 1,942,290 $ 212,690 $ 23,880
2018 Commercial: Commercial real estate $ 635,312 $ 839,708 $ 1,475,020 $ 91,324,081 $ 92,799,101 Other 201,646 225,000 426,646 44,132,584 44,559,230 Residential real estate: One to four family 1,515,217 262,956 1,778,173 48,001,476 49,779,649 Home equity lines of credit 103,522 16,443 119,965 11,220,929 11,340,894 Consumer 115,543 11,658 127,201 7,443,754 7,570,955 Total $ 2,571,240 $ 1,355,765 $ 3,927,005 $ 202,122,824 $ 206,049,829
2017 Commercial: Commercial real estate $ 437,324 $ 1,116,620 $ 1,553,944 $ 82,696,908 $ 84,250,852 Other 1,205,943 73,006 1,278,949 41,180,999 42,459,948 Residential real estate: One to four family 1,875,431 262,793 2,138,224 44,930,194 47,068,418 Home equity lines of credit 319,897 25,324 345,221 10,172,877 10,518,098 Consumer 124,623 18,274 142,897 7,178,511 7,326,608
IncomeRecognized
InterestRecognized
Loan LossesAllocated
RecordedInvestment
PrincipalBalance
RecordedInvestment
TotalPast Due
Loans NotPast Due Total
30 - 89 DaysGreater than
89 DaysPast DuePast Due
Loans Past Due Over90 Days Still Accruing
2018 2017 2018 2017Nonaccrual
$
$
Total $ 3,963,218 $ 1,496,017 $ 5,459,235 $ 186,159,489 $ 191,623,924
Troubled Debt Restructurings:
The Corporation has allocated $305,000 and $250,000 of specific reserve to customers whose loan terms have been modified in troubled debtrestructurings as of December 31, 2018 and 2017. No additional amounts are committed to be lent to these borrowers. During the years ended December 31, 2018 and 2017, the terms of certain loans were modified as troubled debt restructurings. The modification of the terms of such loans included a reduction of the stated interest rate of the loan or an extension of the maturity date at astated rate of interest lower than the current market rate for new debt with similar risk. Modifications involving a reduction of the stated interest rate of the loan were for periods ranging from 12 months to 120 months. Modifica-tions involving an extension of the maturity date were for 36 months.
The following tables present loans by class modified as troubled debt restructurings that occurred during the years ending December 31:
Pre-Modification Post-Modification
Numberof Loans
2018 Commercial: Commercial real estate 1 $ 228,408 $ 222,390 Other - - - Commercial other - - - Residential real estate: One to four family 1 26,632 26,125 Consumer 1 25,856 23,401 Total 3 $ 280,896 $ 271,916
2017 Commercial: Commercial real estate 1 $ 153,181 $ 137,000 Other - - - Commercial other - - - Residential real estate: One to four family - - - Consumer 3 9,895 8,915 Total 4 $ 163,076 $ 145,915
The troubled debt restructurings described above did not increase the allowance for loan losses and did not result in charge offs in the years2018 or 2017. The majority of the loans modified were already identified as problem loans and the modifications did not change the impact ofthe impairment assessment on those loans. Additionally, there were no troubled debt restructurings during 2018 or 2017 for which there was apayment default within twelve months following the restructuring.
Credit Quality Indicators:
The Corporation categorizes loans into risk categories based on relevant information about the ability of borrowers to service their debt suchas: current financial information, historical payment experience, credit documentation, public information, and current economic trends, amongother factors. The Corporation analyzes loans individually by classifying the loans as to credit risk. This analysis includes primarily non-homogenous loans, such as commercial and commercial real estate loans, and certain related borrowings. This analysis is performed on aquarterly basis. The Corporation uses the following definitions for risk ratings: Watch/Special Mention Borrowers who exhibit potential credit weaknesses or downward trends deserving management's close attention.While potentially weak, these borrowers are currently marginally acceptable; no loss of principal or interest is envisioned. However, if leftuncorrected, these potential weaknesses could result in deterioration of the repayment prospects for the assets or in the banks' credit position atsome future date. These borrowers have characteristics which corrective management action would remedy. Included in this category could beturnaround situations, as well as those borrowers previously rated satisfactory who have shown deterioration, for whatever reason, indicating adowngrading from the better categories. An element of asset quality, financial flexibility, or management is below average. Potential Problem (Substandard) Borrowers with well-defined weaknesses that jeopardize the orderly liquidation of debt. A potentialproblem loan is inadequately protected by the current sound worth and paying capacity of the obligor or by the collateral pledged, if any. Normalrepayment from the borrower is in jeopardy. There is a distinct possibility that a partial loss of interest and/or principal will occur if thedeficiencies are not corrected. Loss potential, while existing in the aggregate amount of potential problem assets, does not have to exist inindividual assets classified potential problem. Problem (Doubtful) Borrowers classified problem have all the weaknesses found in potential problem borrowers with the added provisionthat the weaknesses make collection of debt in full, on the basis of currently existing facts, conditions, and values, highly questionable andimprobable. Serious problems exist to the point where partial loss of principal is likely. The possibility of loss is high, but because of certainimportant, reasonably specific pending factors that may work to strengthen the assets, the loan's classification as estimated loss is deferred untila more exact status may be determined. Pending factors include proposed merger, acquisition, or liquidation procedures; capital injection;perfecting liens on additional collateral; and refinancing plans.
Loans not meeting the criteria above that are analyzed individually as part of the process described above are considered to be pass rated loans.Loans listed as not rated are predominantly homogenous loans. These loans are monitored for credit quality based primarily on paymentperformance.
Watch2018 Commercial: Commercial real estate $ 90,819,849 $ 659,234 $ - $ 1,320,018 $ -
Pass ProblemPotential
Problem Not Rated
Outstanding Recorded
Investment
OutstandingRecorded
Investment
2018With no related allowance recorded: Commercial: Commercial real estate $ 361,985 $ 361,985 $ - $ 367,903 $ 22,375 $ 22,424 Other 142,461 142,461 - 142,860 6,366 6,405 Residential real estate 470,343 470,743 - 474,948 24,936 23,863 Consumer - - - - - - Subtotal 974,789 975,189 - 985,711 53,677 52,692With an allowance recorded: Commercial: Commercial real estate 2,576,822 1,311,524 410,000 1,442,102 - - Other 699,396 324,396 - 580,575 16,763 13,756 Residential real estate - - - - - - Subotal 3,276,218 1,635,920 410,000 2,022,677 16,763 13,756 Total $ 4,251,007 2,611,109 $ 410,000 $ 3,008,388 $ 70,440 $ 66,448
2017With no related allowance recorded: Commercial: Commercial real estate $ 1,609,453 $ 1,609,453 $ - $ 1,680,799 $ 95,117 $ 36,018 Other 177,183 177,183 - 167,178 13,700 14,600 Residential real estate 509,814 509,814 - 514,292 23,995 24,147 Consumer - - - - - - Subtotal 2,296,450 2,296,450 - 2,362,269 132,812 74,765 With an allowance recorded: Commercial: Commercial real estate 2,681,009 1,457,331 250,000 1,652,828 2,002 675 Other - - - - - - Residential real estate - - - - - - Subotal 2,681,009 1,457,331 250,000 1,652,828 2,002 675 Total $ 4,977,459 3,753,781 $ 250,000 $ 4,015,097 $ 134,814 $ 75,440
The recorded investment in loans does not include accrued interest receivable and loan origination fees, net, as they are immaterial. Forpurposes of this disclosure, the unpaid principal balance is not reduced for net charge-offs.
Nonaccrual loans and loans past due 90 days and still on accrual include both smaller balance homogenous loans that are collectively evaluated for impairment and individually classified impaired loans.
The following tables present the recorded investment in nonaccrual and loans past due over 90 days still on accrual by class of loans as of
Commercial: Commercial real estate $ 1,311,524 $ 1,521,325 $ - $ - Other 324,396 73,006 - - Residential real estate: One to four family 96,076 250,261 212,690 23,880 Home equity lines of credit 16,443 66,966 - - Consumer 13,996 30,732 - - Total $ 1,762,435 $ 1,942,290 $ 212,690 $ 23,880
2018 Commercial: Commercial real estate $ 635,312 $ 839,708 $ 1,475,020 $ 91,324,081 $ 92,799,101 Other 201,646 225,000 426,646 44,132,584 44,559,230 Residential real estate: One to four family 1,515,217 262,956 1,778,173 48,001,476 49,779,649 Home equity lines of credit 103,522 16,443 119,965 11,220,929 11,340,894 Consumer 115,543 11,658 127,201 7,443,754 7,570,955 Total $ 2,571,240 $ 1,355,765 $ 3,927,005 $ 202,122,824 $ 206,049,829
2017 Commercial: Commercial real estate $ 437,324 $ 1,116,620 $ 1,553,944 $ 82,696,908 $ 84,250,852 Other 1,205,943 73,006 1,278,949 41,180,999 42,459,948 Residential real estate: One to four family 1,875,431 262,793 2,138,224 44,930,194 47,068,418 Home equity lines of credit 319,897 25,324 345,221 10,172,877 10,518,098 Consumer 124,623 18,274 142,897 7,178,511 7,326,608
IncomeRecognized
InterestRecognized
Loan LossesAllocated
RecordedInvestment
PrincipalBalance
RecordedInvestment
TotalPast Due
Loans NotPast Due Total
30 - 89 DaysGreater than
89 DaysPast DuePast Due
Loans Past Due Over90 Days Still Accruing
2018 2017 2018 2017Nonaccrual
$
$
Notes to Consolidated Financial Statements (continued)Century Financial Corporation
4. LOANS
Major classifications of loans were as follows as of December 31:2018 2017
Commercial: Commercial real estate $ 92,799,101 $ 84,250,852
Other 44,559,230 42,459,948 Residential real estate:
One to four family 49,779,649 47,068,418 Home equity lines of credit 11,340,894 10,518,098
Consumer 7,570,955 7,326,608 Subtotal 206,049,829 191,623,924 Allowance for loan losses (2,575,428) (2,201,062) Loans, net $ 203,474,401 $ 189,422,862
At December 31, 2018 and 2017, certain officers and directors, and companies in which they are principal owners, were indebted to the Corporation in the aggregate of $1,258,907 and $1,783,427, respectively.
The following tables present the activity in the allowance for loan losses by portfolio segment for the years ending December 31:Residential
Commercial Real Estate Consumer Unallocated Total2018 Allowance for loan losses:
Beginning balance $ 1,035,833 $ 194,465 $ 66,149 $ 904,615 $ 2,201,062 Provision for loan losses 354,930 25,391 57,418 392,261 830,000 Loans charged-off (486,065) (28,864) (132,123) - (647,052) Recoveries 108,983 8,523 73,912 - 191,418 Total ending balance $ 1,013,681 $ 199,515 $ 65,356 $ 1,296,876 $ 2,575,428
2017 Allowance for loan losses:
Beginning balance $ 1,177,280 $ 242,362 $ 72,868 $ 776,547 $ 2,269,057 Provision for loan losses 112,060 (20,166) 30,038 128,068 250,000 Loans charged-off (271,315) (38,125) (98,368) - (407,808) Recoveries 17,808 10,394 61,611 - 89,813 Total ending balance $ 1,035,833 $ 194,465 $ 66,149 $ 904,615 $ 2,201,062
The following table presents the balance in the allowance for loan losses and the recorded investment in loans by portfolio segment and based
ResidentialCommercial Real Estate Consumer Unallocated Total
2018 Allowance for loan losses:
Ending allowance balance attributable to loans: Individually evaluated for impairment $ 410,000 $ - $ - $ - $ 410,000 Collectively evaluated for impairment 603,681 199,515 65,356 1,296,876 2,165,428
Total ending allowance balance $ 1,013,681 $ 199,515 $ 65,356 $ 1,296,876 $ 2,575,428
Loans: Individually evaluated for impairment $ 2,140,366 $ 470,743 $ - $ - $ 2,611,109 Collectively evaluated for impairment 135,217,965 60,649,800 7,570,955 - 203,438,720 Total ending loans balance $ 137,358,331 $ 61,120,543 $ 7,570,955 $ - $ 206,049,829
2017 Allowance for loan losses:
Ending allowance balance attributable to loans: Individually evaluated for impairment $ 250,000 $ - $ - $ - $ 250,000 Collectively evaluated for impairment 785,833 194,465 66,149 904,615 1,951,062
Total ending allowance balance $ 1,035,833 $ 194,465 $ 66,149 $ 904,615 $ 2,201,062
Loans: Individually evaluated for impairment $ 3,243,967 $ 509,814 $ - $ - $ 3,753,781 Collectively evaluated for impairment 123,466,833 57,076,702 7,326,608 - 187,870,143 Total ending loans balance $ 126,710,800 $ 57,586,516 $ 7,326,608 $ - $ 191,623,924
The following tables present information related to impaired loans by class of loans as of and for the years ending December 31:
Interest Cash BasisAllowance for AverageUnpaid
The following tables present the aging of the recorded investment in past due loans by class of loans as of December 31:

Notes to Consolidated Financial Statements (continued)
Loans Past Due OverNonaccrual 90 Days Still Accruing
2014 2013 2014 2013 Commercial: Commercial real estate $ 2,187,922 $ 3,057,500 $ 0 $ 0 Other 335,900 230,184 0 0 Residential real estate: One to four family 601,169 886,582 178,978 667,001 Home equity lines of credit 16,060 112,248 0 0 Consumer 69,785 69,872 95 774 Total $ 3,210,836 $ 4,356,386 $ 179,073 $ 667,775
Greater than30 - 89 Days 89 Days Total Loans Not
Past Due Past Due Past Due Past Due Total2014 Commercial: Commercial real estate $ 1,634,237 $ 2,187,922 $ 3,822,159 $ 65,007,300 $ 68,829,459 Other 444,478 12,900 457,378 45,990,370 46,447,748 $95,112,389 Residential real estate: One to four family 1,736,275 588,456 2,324,730 38,951,580 41,276,310 Home equity lines of credit 71,784 4,802 76,586 7,322,768 7,399,354 47,418,573 Consumer 57,601 55,395 112,996 5,647,437 5,760,433 Total $ 3,944,374 $ 2,849,475 $ 6,793,849 $ 162,919,454 $ 169,713,303
2013 Commercial: Commercial real estate $ 2,769,300 $ 1,406,500 $ 4,175,800 $ 58,057,573 $ 62,233,373 Other 103,851 225,582 329,433 39,754,202 40,083,635 $94,183,144 Residential real estate One to four family 2,271,849 667,001 2,938,850 34,826,096 37,764,946 Home equity lines of credit 58,306 0 58,306 7,038,661 7,096,967 49,755,130 Consumer 70,446 774 71,220 4,798,665 4,869,885 Total $ 5,273,752 $ 2,299,857 $ 7,573,609 $ 144,475,198 $ 152,048,806
4. LOANS (continued)
The following tables present the aging of the recorded investment in past due loans by class of loans as of December 31:
Troubled Debt Restructurings: TheCorporationhasallocated$270,000and$1,140,000ofspecificreservetocustomerswhoseloantermshavebeenmodifiedin troubled debt restructurings as of December 31, 2014 and 2013. No additional amounts are committed to be lent to these bor-rowers. DuringtheyearsendedDecember31,2014and2013,thetermsofcertainloansweremodifiedastroubleddebtrestructurings.Themodificationofthetermsofsuchloansincludedoneoracombinationofthefollowing:areductionofthestatedinterestrate of the loan; an extension of the maturity date at a stated rate of interest lower than the current market rate for new debt with similar risk; or a permanent reduction of the recorded investment in the loan.Modificationsinvolvingareductionofthestatedinterestrateoftheloanwereforperiodsrangingfrom24monthsto36months.Modificationsinvolvinganextensionofthematuritydatewereforperiodsrangingfrom13monthsto240months.
The following table presents the recorded investment in nonaccrual and loans past due over 90 days still on accrual by class of loans as of December 31:
Century Financial Corporation
18
Credit Quality Indicators:
The Corporation categorizes loans into risk categories based on relevant information about the ability of borrowers to service their debt such as: current financial information, historical payment experience, credit documentation, public information, and current economic trends, among other factors. The Corporation analyzes loans individually by classifying the loans as to credit risk. This analysis includes primarily non-homogenous loans, such as commercial and commercial real estate loans, and certain related borrowings. This analysis is performed on a quarterly basis. The Corporation uses the following definitions for risk ratings: Watch/Special Mention Borrowers who exhibit potential credit weaknesses or downward trends deserving management’s close attention. While potentially weak, these borrowers are currently marginally acceptable; no loss of principal or interest is envisioned. However, if left uncorrected, these potential weaknesses could result in deteriorations of the repayment prospects for the assets or in the banks’ credit position at some future date. These borrowers have characteristics which corrective management action would remedy. Included in this category could be turnaround situations, as well as those borrowers previously rated satisfactory who have shown deterioration, for whatever reason, indicating a downgrading from the better categories. An element of asset quality, financial flexibility, or management is below average. Potential Problem (Substandard) Borrowers with well-defined weaknesses that jeopardize the orderly liquidation of debt. A potential problem loan is inadequately protected by the current sound worth and paying capacity of the obligor or by the collateral pledged, if any. Normal repayment from the borrower is in jeopardy. There is a distinct possibility that a partial loss of interest and/or principal will occur if the deficiencies are not corrected. Loss potential, while existing in the aggregate amount of potential problem assets, does not have to exist in individual assets classified potential problem. Problem (Doubtful) Borrowers classified problem have all the weaknesses found in potential problem borrowers with the added provision that weaknesses make collection of debt in full, on the basis of currently existing facts, conditions, and values, highly questionable and improbable. Serious problems exist to the point where partial loss of principal is likely. The possibility of loss is high, but because of certain important, reasonably specific pending factors that may work to strengthen the assets, the loan’s classification as estimated loss is deferred until a more exact status may be determined. Pending factors include proposed merger, acquisition, or liquidation procedures; capital injection; perfecting liens on additional collateral; and refinancing plans.
Loans not meeting the criteria above that are analyzed individually as part of the process described above are considered to be pass rated loans. Loans listed as not rated are predominantly homogenous loans. These loans are monitored for credit quality based primarily on payment performance.
The troubled debt restructurings described above did not increase the allowance for loan losses and did not result in charge offs in the years 2018 or 2017. The majority of the loans modified were already identified as problem loans and the modifications did not change the impact of the impairment assessment on those loans. Additionally, there were no troubled debt restructurings during 2018 or 2017 for which there was a payment default within twelve months following the restructuring.
Total $ 3,963,218 $ 1,496,017 $ 5,459,235 $ 186,159,489 $ 191,623,924
Troubled Debt Restructurings:
The Corporation has allocated $305,000 and $250,000 of specific reserve to customers whose loan terms have been modified in troubled debtrestructurings as of December 31, 2018 and 2017. No additional amounts are committed to be lent to these borrowers. During the years ended December 31, 2018 and 2017, the terms of certain loans were modified as troubled debt restructurings. The modification of the terms of such loans included a reduction of the stated interest rate of the loan or an extension of the maturity date at astated rate of interest lower than the current market rate for new debt with similar risk. Modifications involving a reduction of the stated interest rate of the loan were for periods ranging from 12 months to 120 months. Modifica-tions involving an extension of the maturity date were for 36 months.
The following tables present loans by class modified as troubled debt restructurings that occurred during the years ending December 31:
Pre-Modification Post-Modification
Numberof Loans
2018 Commercial: Commercial real estate 1 $ 228,408 $ 222,390 Other - - - Commercial other - - - Residential real estate: One to four family 1 26,632 26,125 Consumer 1 25,856 23,401 Total 3 $ 280,896 $ 271,916
2017 Commercial: Commercial real estate 1 $ 153,181 $ 137,000 Other - - - Commercial other - - - Residential real estate: One to four family - - - Consumer 3 9,895 8,915 Total 4 $ 163,076 $ 145,915
The troubled debt restructurings described above did not increase the allowance for loan losses and did not result in charge offs in the years2018 or 2017. The majority of the loans modified were already identified as problem loans and the modifications did not change the impact ofthe impairment assessment on those loans. Additionally, there were no troubled debt restructurings during 2018 or 2017 for which there was apayment default within twelve months following the restructuring.
Credit Quality Indicators:
The Corporation categorizes loans into risk categories based on relevant information about the ability of borrowers to service their debt suchas: current financial information, historical payment experience, credit documentation, public information, and current economic trends, amongother factors. The Corporation analyzes loans individually by classifying the loans as to credit risk. This analysis includes primarily non-homogenous loans, such as commercial and commercial real estate loans, and certain related borrowings. This analysis is performed on aquarterly basis. The Corporation uses the following definitions for risk ratings: Watch/Special Mention Borrowers who exhibit potential credit weaknesses or downward trends deserving management's close attention.While potentially weak, these borrowers are currently marginally acceptable; no loss of principal or interest is envisioned. However, if leftuncorrected, these potential weaknesses could result in deterioration of the repayment prospects for the assets or in the banks' credit position atsome future date. These borrowers have characteristics which corrective management action would remedy. Included in this category could beturnaround situations, as well as those borrowers previously rated satisfactory who have shown deterioration, for whatever reason, indicating adowngrading from the better categories. An element of asset quality, financial flexibility, or management is below average. Potential Problem (Substandard) Borrowers with well-defined weaknesses that jeopardize the orderly liquidation of debt. A potentialproblem loan is inadequately protected by the current sound worth and paying capacity of the obligor or by the collateral pledged, if any. Normalrepayment from the borrower is in jeopardy. There is a distinct possibility that a partial loss of interest and/or principal will occur if thedeficiencies are not corrected. Loss potential, while existing in the aggregate amount of potential problem assets, does not have to exist inindividual assets classified potential problem. Problem (Doubtful) Borrowers classified problem have all the weaknesses found in potential problem borrowers with the added provisionthat the weaknesses make collection of debt in full, on the basis of currently existing facts, conditions, and values, highly questionable andimprobable. Serious problems exist to the point where partial loss of principal is likely. The possibility of loss is high, but because of certainimportant, reasonably specific pending factors that may work to strengthen the assets, the loan's classification as estimated loss is deferred untila more exact status may be determined. Pending factors include proposed merger, acquisition, or liquidation procedures; capital injection;perfecting liens on additional collateral; and refinancing plans.
Loans not meeting the criteria above that are analyzed individually as part of the process described above are considered to be pass rated loans.Loans listed as not rated are predominantly homogenous loans. These loans are monitored for credit quality based primarily on paymentperformance.
Watch2018 Commercial: Commercial real estate $ 90,819,849 $ 659,234 $ - $ 1,320,018 $ -
Pass ProblemPotential
Problem Not Rated
Outstanding Recorded
Investment
OutstandingRecorded
Investment

The troubled debt restructurings described above did not increase the allowance for loan losses in the years 2014 and 2013. The restructur-ingsdidnotresultinchargeoffsduring2014;2013restructuringsresultedinchargeoffsof$460,112.Themajorityoftheloansmodifiedwerealreadyidentifiedasproblemloansandthemodificationsdidnotchangetheimpairmentassessmentonthoseloans.Additionally,there were no troubled debt restructurings during 2014 or 2013 for which there was a payment default within twelve months following the restructuring.Credit Quality Indicators: The Corporation categorizes loans into risk categories based on relevant information about the ability of borrowers to service their debt such as:currentfinancialinformation,historicalpaymentexperience,creditdocumentation,publicinformation,andcurrenteconomictrends,among other factors. The Corporation analyzes loans individually by classifying the loans as to credit risk. This analysis includes primarily non-homogenous loans, such as commercial and commercial real estate loans, and certain related borrowings. This analysis is performed on aquarterlybasis.TheCorporationusesthefollowingdefinitionsforriskratings: Watch/Special Mention Borrowers who exhibit potential credit weaknesses or downward trends deserving management’s close attention. While potentially weak, these borrowers are currently marginally acceptable; no loss of principal or interest is envisioned. However, if left uncorrected, these potential weaknesses could result in deterioration of the repayment prospects for the assets or in the banks’ credit position at some future date. These borrowers have characteristics which corrective management action would remedy. Included in this category could be turnaround situations, as well as those borrowers previously rated satisfactory who have shown deterioration, for whatever reason, indicating adowngradingfromthebettercategories.Anelementofassetquality,financialflexibility,ormanagementisbelowaverage. Potential Problem (Substandard) Borrowerswithwell-definedweaknessesthatjeopardizetheorderlyliquidationofdebt.Apotentialproblem loan is inadequately protected by the current sound worth and paying capacity of the obligor or by the collateral pledged, if any. Normal repayment from the borrower is in jeopardy. There is a distinct possibility that a partial loss of interest and/or principal will occur if thedeficienciesarenotcorrected.Losspotential,whileexistingintheaggregateamountofpotentialproblemassets,doesnothavetoexistinindividualassetsclassifiedpotentialproblem. Problem (Doubtful) Borrowersclassifiedproblemhavealltheweaknessesfoundinpotentialproblemborrowerswiththeaddedprovisionthat the weaknesses make collection of debt in full, on the basis of currently existing facts, conditions, and values, highly questionable and improbable. Serious problems exist to the point where partial loss of principal is likely. The possibility of loss is high, but because of certain important,reasonablyspecificpendingfactorsthatmayworktostrengthentheassets,theloan’sclassificationasestimatedlossisdeferreduntila more exact status may be determined. Pending factors include proposed merger, acquisition, or liquidation procedures; capital injection; perfectingliensonadditionalcollateral;andrefinancingplans.
Loansnotmeetingthecriteriaabovethatareanalyzedindividuallyaspartoftheprocessdescribedaboveareconsideredtobepassratedloans.Loanslistedasnotratedarepredominantlyhomogenousloans.Theseloansaremonitoredforcreditqualitybasedprimarilyonpay-ment performance.
Notes to Consolidated Financial Statements (continued)
4. LOANS (continued) The following tables present loans by classmodified as troubled debt restructurings that occurred during the years endingDecember 31:
Pre-Modification Post-ModificationOutstanding Outstanding
Number Recorded Recordedof Loans Investment Investment
2014 Commercial: Commercial real estate 3 $ 1,095,871 $ 1,201,598 Other 1 24,361 25,516 Residential real estate:
One to four family 1 5,636 8,268 Consumer 3 23,258 22,183 Total 8 $ 1,149,126 $ 1,257,565
2013 Commercial: Commercial real estate 6 $ 3,474,520 $ 2,726,376 Other 2 261,733 212,582 Residential real estate: One to four family 1 94,149 93,729 Consumer 1 3,944 423 Total 10 $ 3,834,346 $ 3,033,110
19
Loans Past Due OverNonaccrual 90 Days Still Accruing
2014 2013 2014 2013 Commercial: Commercial real estate $ 2,187,922 $ 3,057,500 $ 0 $ 0 Other 335,900 230,184 0 0 Residential real estate: One to four family 601,169 886,582 178,978 667,001 Home equity lines of credit 16,060 112,248 0 0 Consumer 69,785 69,872 95 774 Total $ 3,210,836 $ 4,356,386 $ 179,073 $ 667,775
Greater than30 - 89 Days 89 Days Total Loans Not
Past Due Past Due Past Due Past Due Total2014 Commercial: Commercial real estate $ 1,634,237 $ 2,187,922 $ 3,822,159 $ 65,007,300 $ 68,829,459 Other 444,478 12,900 457,378 45,990,370 46,447,748 $95,112,389 Residential real estate: One to four family 1,736,275 588,456 2,324,730 38,951,580 41,276,310 Home equity lines of credit 71,784 4,802 76,586 7,322,768 7,399,354 47,418,573 Consumer 57,601 55,395 112,996 5,647,437 5,760,433 Total $ 3,944,374 $ 2,849,475 $ 6,793,849 $ 162,919,454 $ 169,713,303
2013 Commercial: Commercial real estate $ 2,769,300 $ 1,406,500 $ 4,175,800 $ 58,057,573 $ 62,233,373 Other 103,851 225,582 329,433 39,754,202 40,083,635 $94,183,144 Residential real estate One to four family 2,271,849 667,001 2,938,850 34,826,096 37,764,946 Home equity lines of credit 58,306 0 58,306 7,038,661 7,096,967 49,755,130 Consumer 70,446 774 71,220 4,798,665 4,869,885 Total $ 5,273,752 $ 2,299,857 $ 7,573,609 $ 144,475,198 $ 152,048,806
Century Financial Corporation
Notes to Consolidated Financial Statements (continued)Century Financial Corporation
5. FAIR VALUE
Level 1: Quoted prices (unadjusted) for identical assets or liabilities in active markets that the entity has the ability to access as of the measurement date.
Level 2: Significant other observable inputs other than Level 1 prices such as quoted prices for similar assets or liabilities; quoted prices in markets that are not active; or other inputs that are observable or can be corroborated by observable market data.
Level 3: Significant unobservable inputs that reflect a reporting entity's own assumptions about the assumptions that market participants would use in pricing an asset or liability.
The fair values of securities available for sale are determined by obtaining quoted prices on nationally recognized securitiesexchanges (Level 1 inputs) or matrix pricing, which is a mathematical technique widely used in the industry to value debt securitieswithout relying exclusively on quoted prices for the specific securities but rather by relying on the securities' relationship to otherbenchmark quoted securities (Level 2 inputs).
The fair value of impaired loans with specific allocations of the allowance for loan losses is generally based on recent real estateappraisals. These appraisals may utilize a single valuation approach or a combination of approaches including comparable salesand the income approach. Adjustments are routinely made in the appraisal process by the independent appraisers to adjust for differences between the comparable sales and income data available, and management makes adjustments to appraised values basedon market conditions. Such adjustments are usually significant and typically result in a Level 3 classification of the inputs fordetermining fair value. Non-real estate collateral may be valued using an appraisal, net book value per the borrower's financialstatements, or aging reports, adjusted or discounted based on management's historical knowledge, changes in market conditionsfrom the time of the valuation, and management's expertise and knowledge of the client and client's business, resulting in a Level 3fair value classification. Impaired loans are evaluated on a quarterly basis for additional impairment and adjusted accordingly.
Assets acquired through or instead of loan foreclosure are initially recorded at fair value less costs to sell when acquired, estab-lishing a new cost basis. These assets are subsequently accounted for at lower of cost or fair value less estimated costs to sell.Fair value is commonly based on recent real estate appraisals which are updated no less frequently than annually. These appraisalsmay utilize a single valuation approach or a combination of approaches including comparable sales and the income approach.Adjustments are routinely made in the appraisal process by the independent appraisers to adjust for differences between thecomparable sales and income data available, and management makes adjustments to appraised values based on market conditions.Such adjustments are usually significant and typically result in a Level 3 classification of the inputs for determining fair value. Realestate owned properties are evaluated on a quarterly basis for additional impairment and adjusted accordingly. No real estateowned property held at year-end 2017 or 2016 was being measured at fair value on a non-recurring basis.
Appraisals for both collateral-dependent impaired loans and real estate owned are performed by certified general appraisers (forcommercial properties) or certified residential appraisers (for residential properties) whose qualifications and licenses have beenreviewed and verified by the Corporation. Once received, an officer reviews the assumptions and approaches utilized in the app-raisal as well as the overall resulting fair value in comparison with independent data sources such as recent market data or industry-wide statistics. On an annual basis, the Corporation compares the actual selling price of collateral that has been sold to the mostrecent appraised value to determine what additional adjustment should be made to the appraisal value to arrive at fair value. Themost recent analysis performed indicated that a discount of 10% should be applied to properties with appraisals performed within12 months.
Assets and Liabilities Measured on a Recurring Basis
Assets and liabilities measured at fair value on a recurring basis are summarized below:
for Identical
Fair Value Measurements UsingQuoted Prices in Significant
SignificantObservable
OtherUnobservable
Active Markets
Fair value is the exchange price that would be received for an asset or paid to transfer a liability (exit price) in the principal or most advantageous market for the asset or liability in an orderly transaction between market participants on the measurement date. There are three levels of inputs that may be used to measure fair values:
The fair values of securities available for sale are determined by obtaining quoted prices on nationally recognized securities exchanges (Level 1 inputs) or matrix pricing, which is a mathematical technique widely used in the industry to value debt securities without relying exclusively on quoted prices for the specific securities but rather by relying on the securities’ relationship to other benchmark quoted securities (Level 2 inputs).
The fair value of impaired loans with specific allocations of the allowance for loan losses is generally based on recent real estate appraisals. These appraisals may utilize a single valuation approach or a combination of approaches including comparable sales and the income approach. Adjustments are routinely made in the appraisal process by the independent appraisers to adjust for differences between the comparable sales and income data available, and management makes adjustments to appraised values based on market conditions. Such adjustments are usually significant and typically result in a Level 3 classification of the inputs for determining fair value. Non-real estate collateral may be valued using an appraisal, net book value per the borrower’s financial statements, or aging reports, adjusted or discounted based on management’s historical knowledge, changes in market conditions from the time of the valuation, and management’s expertise and knowledge of the client and client’s business, resulting in a Level 3 fair value classification. Impaired loans are evaluated on a quarterly basis for additional impairment and adjusted accordingly.
Assets acquired through or instead of loan foreclosure are initially recorded at fair value less costs to sell when acquired, establishing a new cost basis. These assets are subsequently accounted for at lower of cost or fair value less estimated costs to sell. Fair value is commonly based on recent real estate appraisals which are updated no less frequently than annually. These appraisals may utilize a single valuation approach or a combination of approaches including comparable sales and the income approach. Adjustments are routinely made in the appraisal process by the independent appraisers to adjust for differences between the comparable sales and income data available, and management makes adjustments to appraised values based on market conditions. Such adjustments are usually significant and typically result in a Level 3 classification of the inputs for determining fair value. Real estate owned properties are evaluated on a quarterly basis for additional impairment and adjusted accordingly. No real estate owned property held at year-end 2018 or 2017 was being measured at fair value on a non-recurring basis.
Other 43,727,241 365,132 142,461 324,396 - Residential real estate One to four family - - - - 49,779,649 Home equity lines of credit - - - - 11,340,894 Consumer - - - - 7,570,955 Total $ 134,547,090 $ 1,024,366 $ 142,461 $ 1,644,414 $ 68,691,498
2017 Commercial: Commercial real estate $ 80,032,502 $ 2,209,026 $ 625,000 $ 1,384,325 $ - Other 40,464,681 1,857,821 64,440 73,006 - Residential real estate One to four family - - - - 47,068,418 Home equity lines of credit - - - - 10,518,098 Consumer - - - - 7,326,608 Total $ 120,497,183 $ 4,066,847 $ 689,440 $ 1,457,331 $ 64,913,124
Total $ 3,963,218 $ 1,496,017 $ 5,459,235 $ 186,159,489 $ 191,623,924
Troubled Debt Restructurings:
The Corporation has allocated $305,000 and $250,000 of specific reserve to customers whose loan terms have been modified in troubled debtrestructurings as of December 31, 2018 and 2017. No additional amounts are committed to be lent to these borrowers. During the years ended December 31, 2018 and 2017, the terms of certain loans were modified as troubled debt restructurings. The modification of the terms of such loans included a reduction of the stated interest rate of the loan or an extension of the maturity date at astated rate of interest lower than the current market rate for new debt with similar risk. Modifications involving a reduction of the stated interest rate of the loan were for periods ranging from 12 months to 120 months. Modifica-tions involving an extension of the maturity date were for 36 months.
The following tables present loans by class modified as troubled debt restructurings that occurred during the years ending December 31:
Pre-Modification Post-Modification
Numberof Loans
2018 Commercial: Commercial real estate 1 $ 228,408 $ 222,390 Other - - - Commercial other - - - Residential real estate: One to four family 1 26,632 26,125 Consumer 1 25,856 23,401 Total 3 $ 280,896 $ 271,916
2017 Commercial: Commercial real estate 1 $ 153,181 $ 137,000 Other - - - Commercial other - - - Residential real estate: One to four family - - - Consumer 3 9,895 8,915 Total 4 $ 163,076 $ 145,915
The troubled debt restructurings described above did not increase the allowance for loan losses and did not result in charge offs in the years2018 or 2017. The majority of the loans modified were already identified as problem loans and the modifications did not change the impact ofthe impairment assessment on those loans. Additionally, there were no troubled debt restructurings during 2018 or 2017 for which there was apayment default within twelve months following the restructuring.
Credit Quality Indicators:
The Corporation categorizes loans into risk categories based on relevant information about the ability of borrowers to service their debt suchas: current financial information, historical payment experience, credit documentation, public information, and current economic trends, amongother factors. The Corporation analyzes loans individually by classifying the loans as to credit risk. This analysis includes primarily non-homogenous loans, such as commercial and commercial real estate loans, and certain related borrowings. This analysis is performed on aquarterly basis. The Corporation uses the following definitions for risk ratings: Watch/Special Mention Borrowers who exhibit potential credit weaknesses or downward trends deserving management's close attention.While potentially weak, these borrowers are currently marginally acceptable; no loss of principal or interest is envisioned. However, if leftuncorrected, these potential weaknesses could result in deterioration of the repayment prospects for the assets or in the banks' credit position atsome future date. These borrowers have characteristics which corrective management action would remedy. Included in this category could beturnaround situations, as well as those borrowers previously rated satisfactory who have shown deterioration, for whatever reason, indicating adowngrading from the better categories. An element of asset quality, financial flexibility, or management is below average. Potential Problem (Substandard) Borrowers with well-defined weaknesses that jeopardize the orderly liquidation of debt. A potentialproblem loan is inadequately protected by the current sound worth and paying capacity of the obligor or by the collateral pledged, if any. Normalrepayment from the borrower is in jeopardy. There is a distinct possibility that a partial loss of interest and/or principal will occur if thedeficiencies are not corrected. Loss potential, while existing in the aggregate amount of potential problem assets, does not have to exist inindividual assets classified potential problem. Problem (Doubtful) Borrowers classified problem have all the weaknesses found in potential problem borrowers with the added provisionthat the weaknesses make collection of debt in full, on the basis of currently existing facts, conditions, and values, highly questionable andimprobable. Serious problems exist to the point where partial loss of principal is likely. The possibility of loss is high, but because of certainimportant, reasonably specific pending factors that may work to strengthen the assets, the loan's classification as estimated loss is deferred untila more exact status may be determined. Pending factors include proposed merger, acquisition, or liquidation procedures; capital injection;perfecting liens on additional collateral; and refinancing plans.
Loans not meeting the criteria above that are analyzed individually as part of the process described above are considered to be pass rated loans.Loans listed as not rated are predominantly homogenous loans. These loans are monitored for credit quality based primarily on paymentperformance.
Watch2018 Commercial: Commercial real estate $ 90,819,849 $ 659,234 $ - $ 1,320,018 $ -
Pass ProblemPotential
Problem Not Rated
Outstanding Recorded
Investment
OutstandingRecorded
Investment
Based on the most recent analysis performed, the risk category of loans by class of loans is as follows:
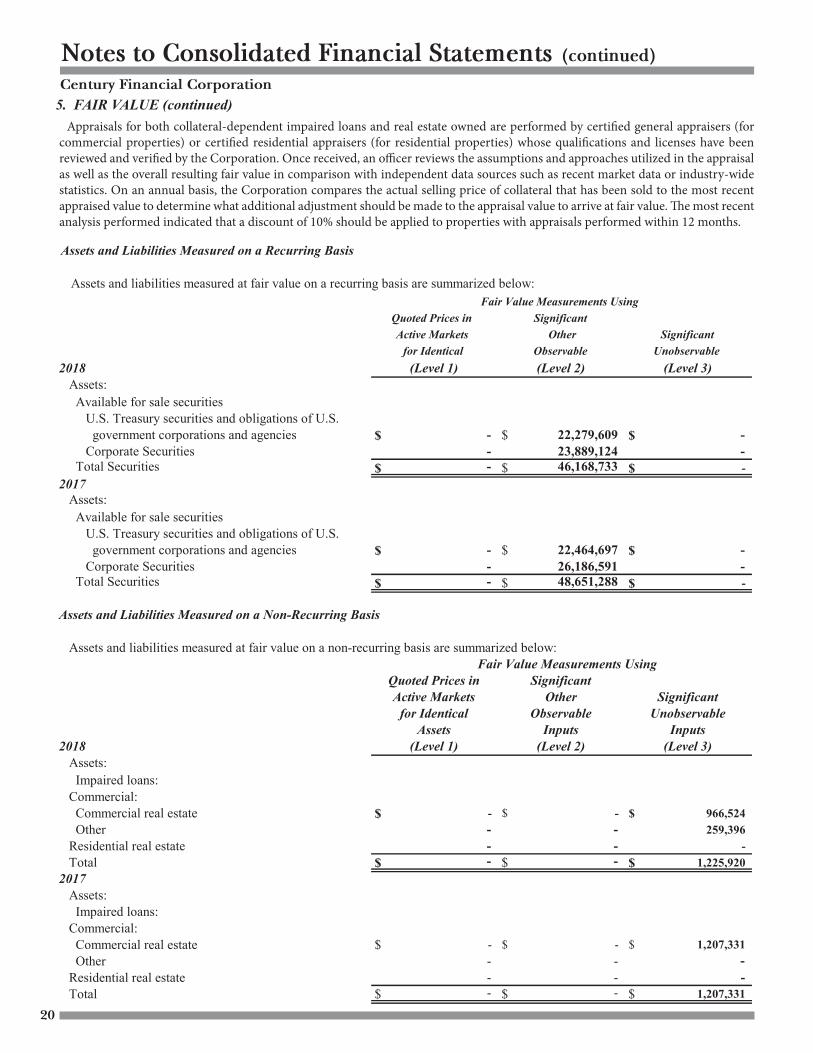
Notes to Consolidated Financial Statements (continued)
4. LOANS (continued)
5. FAIR VALUE
Based on the most recent analysis performed, the risk category of loans by class of loans is as follows:
PotentialPass Watch Problem Problem Not Rated
2014 Commercial: Commercial real estate $ 62,684,980 $ 1,467,320 $ 2,018,718 $ 2,658,441 $ 0 Other 41,940,214 3,961,394 210,239 335,900 0 Residential real estate One to four family 0 0 0 0 41,276,310 Home equity lines of credit 0 0 0 0 7,399,354 Consumer 0 0 0 0 5,760,433 Total $ 104,625,195 $ 5,428,714 $ 2,228,957 $ 2,994,341 $ 54,436,097
2013 Commercial: Commercial real estate $ 55,235,277 $ 1,517,674 $ 2,422,922 $ 3,057,500 $ 0 Other 37,104,125 2,286,827 422,613 270,070 0 Residential real estate One to four family 0 0 0 633,805 37,131,141 Home equity lines of credit 0 0 0 0 7,096,967 Consumer 0 0 0 11,435 4,858,450 Total $ 92,339,402 $ 3,804,501 $ 2,845,535 $ 3,972,810 $ 49,086,558
Fair value is the exchange price that would be received for an asset or paid to transfer a liability (exit price) in the principal or most advantageous market for the asset or liability in an orderly transaction between market participants on the measurement date. There are three levels of inputs that may be used to measure fair values:
Level1:Quotedprices(unadjusted)foridenticalassetsorliabilitiesinactivemarketsthattheentityhastheabilitytoaccessas of the measurement date.
Level2:SignificantotherobservableinputsotherthanLevel1pricessuchasquotedpricesforsimilarassetsorliabilities;quoted prices in markets that are not active; or other inputs that are observable or can be corroborated by observable market data.
Level 3: Significant unobservable inputs that reflect a reporting entity’s own assumptions about the assumptions thatmarket participants would use in pricing an asset or liability.
The fair values of securities available for sale are determined by obtaining quoted prices on nationally recognized s e c u r i t i e s exchanges(Level1inputs)ormatrixpricing,whichisamathematicaltechniquewidelyusedintheindustrytovaluedebtsecuritieswithoutrelyingexclusivelyonquotedpricesforthespecificsecuritiesbutratherbyrelyingonthesecurities’relationshiptootherbenchmarkquotedsecurities(Level2inputs).
Thefairvalueofimpairedloanswithspecificallocationsoftheallowanceforloanlossesisgenerallybasedonrecentrealestateappraisals. These appraisals may utilize a single valuation approach or a combination of approaches including comparable sales and the income approach. Adjustments are routinely made in the appraisal process by the independent appraisers to adjust for differences between the comparable sales and income data available, and management makes adjustments to appraised values basedonmarketconditions.SuchadjustmentsareusuallysignificantandtypicallyresultinaLevel3classificationoftheinputs
Century Financial Corporation
20
Notes to Consolidated Financial Statements (continued)Century Financial Corporation
5. FAIR VALUE
Level 1: Quoted prices (unadjusted) for identical assets or liabilities in active markets that the entity has the ability to access as of the measurement date.
Level 2: Significant other observable inputs other than Level 1 prices such as quoted prices for similar assets or liabilities; quoted prices in markets that are not active; or other inputs that are observable or can be corroborated by observable market data.
Level 3: Significant unobservable inputs that reflect a reporting entity's own assumptions about the assumptions that market participants would use in pricing an asset or liability.
The fair values of securities available for sale are determined by obtaining quoted prices on nationally recognized securitiesexchanges (Level 1 inputs) or matrix pricing, which is a mathematical technique widely used in the industry to value debt securitieswithout relying exclusively on quoted prices for the specific securities but rather by relying on the securities' relationship to otherbenchmark quoted securities (Level 2 inputs).
The fair value of impaired loans with specific allocations of the allowance for loan losses is generally based on recent real estateappraisals. These appraisals may utilize a single valuation approach or a combination of approaches including comparable salesand the income approach. Adjustments are routinely made in the appraisal process by the independent appraisers to adjust for differences between the comparable sales and income data available, and management makes adjustments to appraised values basedon market conditions. Such adjustments are usually significant and typically result in a Level 3 classification of the inputs fordetermining fair value. Non-real estate collateral may be valued using an appraisal, net book value per the borrower's financialstatements, or aging reports, adjusted or discounted based on management's historical knowledge, changes in market conditionsfrom the time of the valuation, and management's expertise and knowledge of the client and client's business, resulting in a Level 3fair value classification. Impaired loans are evaluated on a quarterly basis for additional impairment and adjusted accordingly.
Assets acquired through or instead of loan foreclosure are initially recorded at fair value less costs to sell when acquired, estab-lishing a new cost basis. These assets are subsequently accounted for at lower of cost or fair value less estimated costs to sell.Fair value is commonly based on recent real estate appraisals which are updated no less frequently than annually. These appraisalsmay utilize a single valuation approach or a combination of approaches including comparable sales and the income approach.Adjustments are routinely made in the appraisal process by the independent appraisers to adjust for differences between thecomparable sales and income data available, and management makes adjustments to appraised values based on market conditions.Such adjustments are usually significant and typically result in a Level 3 classification of the inputs for determining fair value. Realestate owned properties are evaluated on a quarterly basis for additional impairment and adjusted accordingly. No real estateowned property held at year-end 2017 or 2016 was being measured at fair value on a non-recurring basis.
Appraisals for both collateral-dependent impaired loans and real estate owned are performed by certified general appraisers (forcommercial properties) or certified residential appraisers (for residential properties) whose qualifications and licenses have beenreviewed and verified by the Corporation. Once received, an officer reviews the assumptions and approaches utilized in the app-raisal as well as the overall resulting fair value in comparison with independent data sources such as recent market data or industry-wide statistics. On an annual basis, the Corporation compares the actual selling price of collateral that has been sold to the mostrecent appraised value to determine what additional adjustment should be made to the appraisal value to arrive at fair value. Themost recent analysis performed indicated that a discount of 10% should be applied to properties with appraisals performed within12 months.
Assets and Liabilities Measured on a Recurring Basis
Assets and liabilities measured at fair value on a recurring basis are summarized below:
for Identical
Fair Value Measurements UsingQuoted Prices in Significant
SignificantObservable
OtherUnobservable
Active Markets
2018 Assets: Available for sale securities U.S. Treasury securities and obligations of U.S. government corporations and agencies $ - $ 22,279,609 $ - Corporate Securities - 23,889,124 - Total Securities $ - $ 46,168,733 $ - 2017 Assets: Available for sale securities U.S. Treasury securities and obligations of U.S. government corporations and agencies $ - $ 22,464,697 $ - Corporate Securities - 26,186,591 - Total Securities $ - $ 48,651,288 $ -
Assets and Liabilities Measured on a Non-Recurring Basis
Assets and liabilities measured at fair value on a non-recurring basis are summarized below:
2018 Assets: Impaired loans: Commercial: Commercial real estate $ - $ - $ 966,524 Other - - 259,396 Residential real estate - - - Total $ - $ - $ 1,225,920 2017 Assets: Impaired loans: Commercial: Commercial real estate $ - $ - $ 1,207,331 Other - - - Residential real estate - - - Total $ - $ - $ 1,207,331
The following represent impairment charges recognized during the period:
Impaired loans, which are measured for impairment using the fair value of the collateral for collateral dependent loans, had arecorded investment of $1,635,900, before a valuation allowance of $410,000 at year-end 2017, resulting in a $180,000 provisionfor loan losses for 2018. At December 31, 2017 impaired loans had a recorded investment of $1,457,331, before a valuation allowanceof 250,000 resulting in no significant provision for loan losses for 2017. As discussed previously, the fair values of impaired loans and other real estate carried at fair value are determined by thirdparty appraisals. Management makes adjustments to these appraised values based on the age of the appraisal and the type ofproperty. The following tables present quantitative information about level 3 fair value measurements for the larger classes offinancial instruments measured at fair value on a non-recurring basis at December 31:
2018 Impaired loans: Commercial: Commercial real estate $ 966,524 Sales comparison Management 10%
discount for propertytype and recent
(Level 1)Assets
Unobservable Discount RateInput
for IdenticalActive Markets
Fair ValueValuation
Technique(s)
UnobservableInputs
(Level 3)
OtherObservable
Inputs(Level 2)
Assets(Level 1)
Quoted Prices in SignificantSignificant
Fair Value Measurements Using
(Range and Average)
Inputs(Level 3)(Level 2)
Inputs
Notes to Consolidated Financial Statements (continued)Century Financial Corporation
5. FAIR VALUE
Level 1: Quoted prices (unadjusted) for identical assets or liabilities in active markets that the entity has the ability to access as of the measurement date.
Level 2: Significant other observable inputs other than Level 1 prices such as quoted prices for similar assets or liabilities; quoted prices in markets that are not active; or other inputs that are observable or can be corroborated by observable market data.
Level 3: Significant unobservable inputs that reflect a reporting entity's own assumptions about the assumptions that market participants would use in pricing an asset or liability.
The fair values of securities available for sale are determined by obtaining quoted prices on nationally recognized securitiesexchanges (Level 1 inputs) or matrix pricing, which is a mathematical technique widely used in the industry to value debt securitieswithout relying exclusively on quoted prices for the specific securities but rather by relying on the securities' relationship to otherbenchmark quoted securities (Level 2 inputs).
The fair value of impaired loans with specific allocations of the allowance for loan losses is generally based on recent real estateappraisals. These appraisals may utilize a single valuation approach or a combination of approaches including comparable salesand the income approach. Adjustments are routinely made in the appraisal process by the independent appraisers to adjust for differences between the comparable sales and income data available, and management makes adjustments to appraised values basedon market conditions. Such adjustments are usually significant and typically result in a Level 3 classification of the inputs fordetermining fair value. Non-real estate collateral may be valued using an appraisal, net book value per the borrower's financialstatements, or aging reports, adjusted or discounted based on management's historical knowledge, changes in market conditionsfrom the time of the valuation, and management's expertise and knowledge of the client and client's business, resulting in a Level 3fair value classification. Impaired loans are evaluated on a quarterly basis for additional impairment and adjusted accordingly.
Assets acquired through or instead of loan foreclosure are initially recorded at fair value less costs to sell when acquired, estab-lishing a new cost basis. These assets are subsequently accounted for at lower of cost or fair value less estimated costs to sell.Fair value is commonly based on recent real estate appraisals which are updated no less frequently than annually. These appraisalsmay utilize a single valuation approach or a combination of approaches including comparable sales and the income approach.Adjustments are routinely made in the appraisal process by the independent appraisers to adjust for differences between thecomparable sales and income data available, and management makes adjustments to appraised values based on market conditions.Such adjustments are usually significant and typically result in a Level 3 classification of the inputs for determining fair value. Realestate owned properties are evaluated on a quarterly basis for additional impairment and adjusted accordingly. No real estateowned property held at year-end 2017 or 2016 was being measured at fair value on a non-recurring basis.
Appraisals for both collateral-dependent impaired loans and real estate owned are performed by certified general appraisers (forcommercial properties) or certified residential appraisers (for residential properties) whose qualifications and licenses have beenreviewed and verified by the Corporation. Once received, an officer reviews the assumptions and approaches utilized in the app-raisal as well as the overall resulting fair value in comparison with independent data sources such as recent market data or industry-wide statistics. On an annual basis, the Corporation compares the actual selling price of collateral that has been sold to the mostrecent appraised value to determine what additional adjustment should be made to the appraisal value to arrive at fair value. Themost recent analysis performed indicated that a discount of 10% should be applied to properties with appraisals performed within12 months.
Assets and Liabilities Measured on a Recurring Basis
Assets and liabilities measured at fair value on a recurring basis are summarized below:
for Identical
Fair Value Measurements UsingQuoted Prices in Significant
SignificantObservable
OtherUnobservable
Active Markets
2018 Assets: Available for sale securities U.S. Treasury securities and obligations of U.S. government corporations and agencies $ - $ 22,279,609 $ - Corporate Securities - 23,889,124 - Total Securities $ - $ 46,168,733 $ - 2017 Assets: Available for sale securities U.S. Treasury securities and obligations of U.S. government corporations and agencies $ - $ 22,464,697 $ - Corporate Securities - 26,186,591 - Total Securities $ - $ 48,651,288 $ -
Assets and Liabilities Measured on a Non-Recurring Basis
Assets and liabilities measured at fair value on a non-recurring basis are summarized below:
2018 Assets: Impaired loans: Commercial: Commercial real estate $ - $ - $ 966,524 Other - - 259,396 Residential real estate - - - Total $ - $ - $ 1,225,920 2017 Assets: Impaired loans: Commercial: Commercial real estate $ - $ - $ 1,207,331 Other - - - Residential real estate - - - Total $ - $ - $ 1,207,331
The following represent impairment charges recognized during the period:
Impaired loans, which are measured for impairment using the fair value of the collateral for collateral dependent loans, had arecorded investment of $1,635,900, before a valuation allowance of $410,000 at year-end 2017, resulting in a $180,000 provisionfor loan losses for 2018. At December 31, 2017 impaired loans had a recorded investment of $1,457,331, before a valuation allowanceof 250,000 resulting in no significant provision for loan losses for 2017. As discussed previously, the fair values of impaired loans and other real estate carried at fair value are determined by thirdparty appraisals. Management makes adjustments to these appraised values based on the age of the appraisal and the type ofproperty. The following tables present quantitative information about level 3 fair value measurements for the larger classes offinancial instruments measured at fair value on a non-recurring basis at December 31:
2018 Impaired loans: Commercial: Commercial real estate $ 966,524 Sales comparison Management 10%
discount for propertytype and recent
(Level 1)Assets
Unobservable Discount RateInput
for IdenticalActive Markets
Fair ValueValuation
Technique(s)
UnobservableInputs
(Level 3)
OtherObservable
Inputs(Level 2)
Assets(Level 1)
Quoted Prices in SignificantSignificant
Fair Value Measurements Using
(Range and Average)
Inputs(Level 3)(Level 2)
Inputs2018 Assets: Available for sale securities U.S. Treasury securities and obligations of U.S. government corporations and agencies $ - $ 22,279,609 $ - Corporate Securities - 23,889,124 - Total Securities $ - $ 46,168,733 $ - 2017 Assets: Available for sale securities U.S. Treasury securities and obligations of U.S. government corporations and agencies $ - $ 22,464,697 $ - Corporate Securities - 26,186,591 - Total Securities $ - $ 48,651,288 $ -
Assets and Liabilities Measured on a Non-Recurring Basis
Assets and liabilities measured at fair value on a non-recurring basis are summarized below:
2018 Assets: Impaired loans: Commercial: Commercial real estate $ - $ - $ 966,524 Other - - 259,396 Residential real estate - - - Total $ - $ - $ 1,225,920 2017 Assets: Impaired loans: Commercial: Commercial real estate $ - $ - $ 1,207,331 Other - - - Residential real estate - - - Total $ - $ - $ 1,207,331
The following represent impairment charges recognized during the period:
Impaired loans, which are measured for impairment using the fair value of the collateral for collateral dependent loans, had arecorded investment of $1,635,900, before a valuation allowance of $410,000 at year-end 2017, resulting in a $180,000 provisionfor loan losses for 2018. At December 31, 2017 impaired loans had a recorded investment of $1,457,331, before a valuation allowanceof 250,000 resulting in no significant provision for loan losses for 2017. As discussed previously, the fair values of impaired loans and other real estate carried at fair value are determined by thirdparty appraisals. Management makes adjustments to these appraised values based on the age of the appraisal and the type ofproperty. The following tables present quantitative information about level 3 fair value measurements for the larger classes offinancial instruments measured at fair value on a non-recurring basis at December 31:
2018 Impaired loans: Commercial: Commercial real estate $ 966,524 Sales comparison Management 10%
discount for propertytype and recent
(Level 1)Assets
Unobservable Discount RateInput
for IdenticalActive Markets
Fair ValueValuation
Technique(s)
UnobservableInputs
(Level 3)
OtherObservable
Inputs(Level 2)
Assets(Level 1)
Quoted Prices in SignificantSignificant
Fair Value Measurements Using
(Range and Average)
Inputs(Level 3)(Level 2)
Inputs
Appraisals for both collateral-dependent impaired loans and real estate owned are performed by certified general appraisers (for commercial properties) or certified residential appraisers (for residential properties) whose qualifications and licenses have been reviewed and verified by the Corporation. Once received, an officer reviews the assumptions and approaches utilized in the appraisal as well as the overall resulting fair value in comparison with independent data sources such as recent market data or industry-wide statistics. On an annual basis, the Corporation compares the actual selling price of collateral that has been sold to the most recent appraised value to determine what additional adjustment should be made to the appraisal value to arrive at fair value. The most recent analysis performed indicated that a discount of 10% should be applied to properties with appraisals performed within 12 months.
Notes to Consolidated Financial Statements (continued)
5. FAIR VALUE (continued)fordeterminingfairvalue.Non-realestatecollateralmaybevaluedusinganappraisal,netbookvaluepertheborrower’sfinancialstatements, or aging reports, adjusted or discounted based on management’s historical knowledge, changes in market conditions fromthetimeofthevaluation,andmanagement’sexpertiseandknowledgeoftheclientandclient’sbusiness,resultinginaLevel3fairvalueclassification.Impairedloansareevaluatedonaquarterlybasisforadditionalimpairmentandadjustedaccordingly. Assets acquired through or instead of loan foreclosure are initially recorded at fair value less costs to sell when acquired, establishing a new cost basis. These assets are subsequently accounted at for at lower of cost or fair value less estimated costs to sell. Fair value is commonly based on recent real estate appraisals which are updated no less frequently than annually. These appraisals may utilize a single valuation approach or a combination of approaches including comparable sales and the income approach. Adjustments are routinely made in the appraisal process by the independent appraisers to adjust for differences between the comparable sales and income data available, and management makes adjustments to appraised values based on market conditions. SuchadjustmentsareusuallysignificantandtypicallyresultinaLevel3classificationoftheinputsfordeterminingfairvalue.Realestate owned properties are evaluated on a quarterly basis for additional impairment and adjusted accordingly. No real estate owned property held at year-end 2014 or 2013 was being measured at fair value on a non-recurring basis. Appraisals forboth collateral-dependent impaired loans and real estateownedareperformedbycertifiedgeneral appraisers(forcommercialproperties)orcertifiedresidentialappraisers (for residentialproperties)whosequalificationsand licenseshavebeen reviewedandverifiedby theCorporation. Once received, anofficer reviews theassumptionsandapproachesutilized inthe appraisal as well as the overall resulting fair value in comparison with independent data sources such as recent market data or industry-wide statistics. On an annual basis, the Corporation compares the actual selling price of collateral that has been sold to the most recent appraised value to determine what additional adjustment should be made to the appraisal value to arrive at fair value. The most recent analysis performed indicated that a discount of 10% should be applied to properties with appraisals performed within 12 months.
Assets and Liabilities Measured on a Recurring Basis
Assets and liabilities measured at fair value on a recurring basis are summarized below:
Fair Value Measurements UsingQuoted Prices in SignificantActive Markets Other Significant
for Identical Observable UnobservableAssets Inputs Inputs
2014 (Level 1) (Level 2) (Level 3) Assets: Available for sale securities U.S. Treasury securities and obligations of U.S. government corporations and agencies $ 0 $ 34,134,409 $ 0 Corporate Securities 0 14,247,232 0 Total Securities $ 0 $ 48,381,641 $ 0 2013 Assets: Available for sale securities U.S. Treasury securities and obligations of U.S. government corporations and agencies $ 0 $ 37,389,063 $ 0 Corporate Securities 0 19,548,409 0 Total Securities $ 0 $ 56,937,472 $ 0
21
Century Financial Corporation
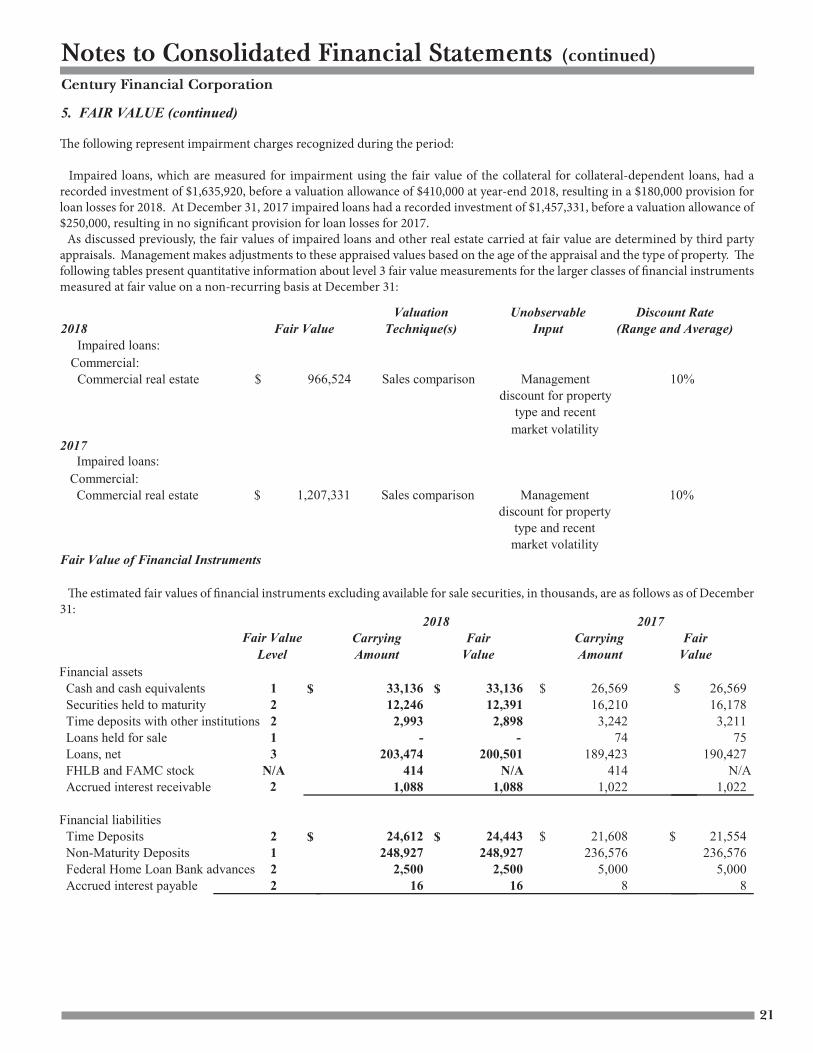
market volatility2017 Impaired loans: Commercial: Commercial real estate $ 1,207,331 Sales comparison Management 10%
discount for propertytype and recentmarket volatility
Fair Value of Financial Instruments
The estimated fair values of financial instruments excluding available for sale securities, in thousands, are as follows as of December 31:
Financial assets Cash and cash equivalents 1 $ 33,136 $ 33,136 $ 26,569 $ Securities held to maturity 2 12,246 12,391 16,210 Time deposits with other institutions 2 2,993 2,898 3,242 Loans held for sale 1 - - 74 Loans, net 3 203,474 200,501 189,423 FHLB and FAMC stock N/A 414 N/A 414 Accrued interest receivable 1,088 1,088 1,022
Financial liabilities Time Deposits 2 $ 24,612 $ 24,443 $ 21,608 $ Non-Maturity Deposits 1 248,927 248,927 236,576 Federal Home Loan Bank advances 2 2,500 2,500 5,000 Accrued interest payable 2 16 16 8
The estimated fair value approximates carrying amount for all items except those described below. Fair value for net loans as of December 31, 2018 is estiamted on an exit price basis incorporating discounts for credit, liquidity and marketability factors.This is not comparable with the fair values disclosed at December 31, 2017, which were based on current market rates for new loans with similar maturities, applied until the loan is assumed to reprice or be paid. Estimated fair value for time deposits are based on current market rates at year-end applied until maturity. It was not practicable to determine the fair value of Federal Home Loan Bank stock due to restrictions placed on its transferability. Estimated fair value for other financial instruments and off-balance-sheet loan commitments are considered nominal.
Fair Value Level
FairValue
CarryingAmount Value
CarryingAmount
2018 2017
2
2018 Assets: Available for sale securities U.S. Treasury securities and obligations of U.S. government corporations and agencies $ - $ 22,279,609 $ - Corporate Securities - 23,889,124 - Total Securities $ - $ 46,168,733 $ - 2017 Assets: Available for sale securities U.S. Treasury securities and obligations of U.S. government corporations and agencies $ - $ 22,464,697 $ - Corporate Securities - 26,186,591 - Total Securities $ - $ 48,651,288 $ -
Assets and Liabilities Measured on a Non-Recurring Basis
Assets and liabilities measured at fair value on a non-recurring basis are summarized below:
2018 Assets: Impaired loans: Commercial: Commercial real estate $ - $ - $ 966,524 Other - - 259,396 Residential real estate - - - Total $ - $ - $ 1,225,920 2017 Assets: Impaired loans: Commercial: Commercial real estate $ - $ - $ 1,207,331 Other - - - Residential real estate - - - Total $ - $ - $ 1,207,331
The following represent impairment charges recognized during the period:
Impaired loans, which are measured for impairment using the fair value of the collateral for collateral dependent loans, had arecorded investment of $1,635,900, before a valuation allowance of $410,000 at year-end 2017, resulting in a $180,000 provisionfor loan losses for 2018. At December 31, 2017 impaired loans had a recorded investment of $1,457,331, before a valuation allowanceof 250,000 resulting in no significant provision for loan losses for 2017. As discussed previously, the fair values of impaired loans and other real estate carried at fair value are determined by thirdparty appraisals. Management makes adjustments to these appraised values based on the age of the appraisal and the type ofproperty. The following tables present quantitative information about level 3 fair value measurements for the larger classes offinancial instruments measured at fair value on a non-recurring basis at December 31:
2018 Impaired loans: Commercial: Commercial real estate $ 966,524 Sales comparison Management 10%
discount for propertytype and recent
(Level 1)Assets
Unobservable Discount RateInput
for IdenticalActive Markets
Fair ValueValuation
Technique(s)
UnobservableInputs
(Level 3)
OtherObservable
Inputs(Level 2)
Assets(Level 1)
Quoted Prices in SignificantSignificant
Fair Value Measurements Using
(Range and Average)
Inputs(Level 3)(Level 2)
Inputs
The following represent impairment charges recognized during the period:
Impaired loans, which are measured for impairment using the fair value of the collateral for collateral-dependent loans, had a recorded investment of $1,635,920, before a valuation allowance of $410,000 at year-end 2018, resulting in a $180,000 provision for loan losses for 2018. At December 31, 2017 impaired loans had a recorded investment of $1,457,331, before a valuation allowance of $250,000, resulting in no significant provision for loan losses for 2017. As discussed previously, the fair values of impaired loans and other real estate carried at fair value are determined by third party appraisals. Management makes adjustments to these appraised values based on the age of the appraisal and the type of property. The following tables present quantitative information about level 3 fair value measurements for the larger classes of financial instruments measured at fair value on a non-recurring basis at December 31:
The estimated fair values of financial instruments excluding available for sale securities, in thousands, are as follows as of December 31:
Notes to Consolidated Financial Statements (continued)Century Financial Corporation
5. FAIR VALUE
Level 1: Quoted prices (unadjusted) for identical assets or liabilities in active markets that the entity has the ability to access as of the measurement date.
Level 2: Significant other observable inputs other than Level 1 prices such as quoted prices for similar assets or liabilities; quoted prices in markets that are not active; or other inputs that are observable or can be corroborated by observable market data.
Level 3: Significant unobservable inputs that reflect a reporting entity's own assumptions about the assumptions that market participants would use in pricing an asset or liability.
The fair values of securities available for sale are determined by obtaining quoted prices on nationally recognized securitiesexchanges (Level 1 inputs) or matrix pricing, which is a mathematical technique widely used in the industry to value debt securitieswithout relying exclusively on quoted prices for the specific securities but rather by relying on the securities' relationship to otherbenchmark quoted securities (Level 2 inputs).
The fair value of impaired loans with specific allocations of the allowance for loan losses is generally based on recent real estateappraisals. These appraisals may utilize a single valuation approach or a combination of approaches including comparable salesand the income approach. Adjustments are routinely made in the appraisal process by the independent appraisers to adjust for differences between the comparable sales and income data available, and management makes adjustments to appraised values basedon market conditions. Such adjustments are usually significant and typically result in a Level 3 classification of the inputs fordetermining fair value. Non-real estate collateral may be valued using an appraisal, net book value per the borrower's financialstatements, or aging reports, adjusted or discounted based on management's historical knowledge, changes in market conditionsfrom the time of the valuation, and management's expertise and knowledge of the client and client's business, resulting in a Level 3fair value classification. Impaired loans are evaluated on a quarterly basis for additional impairment and adjusted accordingly.
Assets acquired through or instead of loan foreclosure are initially recorded at fair value less costs to sell when acquired, estab-lishing a new cost basis. These assets are subsequently accounted for at lower of cost or fair value less estimated costs to sell.Fair value is commonly based on recent real estate appraisals which are updated no less frequently than annually. These appraisalsmay utilize a single valuation approach or a combination of approaches including comparable sales and the income approach.Adjustments are routinely made in the appraisal process by the independent appraisers to adjust for differences between thecomparable sales and income data available, and management makes adjustments to appraised values based on market conditions.Such adjustments are usually significant and typically result in a Level 3 classification of the inputs for determining fair value. Realestate owned properties are evaluated on a quarterly basis for additional impairment and adjusted accordingly. No real estateowned property held at year-end 2017 or 2016 was being measured at fair value on a non-recurring basis.
Appraisals for both collateral-dependent impaired loans and real estate owned are performed by certified general appraisers (forcommercial properties) or certified residential appraisers (for residential properties) whose qualifications and licenses have beenreviewed and verified by the Corporation. Once received, an officer reviews the assumptions and approaches utilized in the app-raisal as well as the overall resulting fair value in comparison with independent data sources such as recent market data or industry-wide statistics. On an annual basis, the Corporation compares the actual selling price of collateral that has been sold to the mostrecent appraised value to determine what additional adjustment should be made to the appraisal value to arrive at fair value. Themost recent analysis performed indicated that a discount of 10% should be applied to properties with appraisals performed within12 months.
Assets and Liabilities Measured on a Recurring Basis
Assets and liabilities measured at fair value on a recurring basis are summarized below:
for Identical
Fair Value Measurements UsingQuoted Prices in Significant
SignificantObservable
OtherUnobservable
Active Markets
market volatility2017 Impaired loans: Commercial: Commercial real estate $ 1,207,331 Sales comparison Management 10%
discount for propertytype and recentmarket volatility
Fair Value of Financial Instruments
The estimated fair values of financial instruments excluding available for sale securities, in thousands, are as follows as of December 31:
Financial assets Cash and cash equivalents 1 $ 33,136 $ 33,136 $ 26,569 $ Securities held to maturity 2 12,246 12,391 16,210 Time deposits with other institutions 2 2,993 2,898 3,242 Loans held for sale 1 - - 74 Loans, net 3 203,474 200,501 189,423 FHLB and FAMC stock N/A 414 N/A 414 Accrued interest receivable 1,088 1,088 1,022
Financial liabilities Time Deposits 2 $ 24,612 $ 24,443 $ 21,608 $ Non-Maturity Deposits 1 248,927 248,927 236,576 Federal Home Loan Bank advances 2 2,500 2,500 5,000 Accrued interest payable 2 16 16 8
The estimated fair value approximates carrying amount for all items except those described below. Fair value for net loans as of December 31, 2018 is estiamted on an exit price basis incorporating discounts for credit, liquidity and marketability factors.This is not comparable with the fair values disclosed at December 31, 2017, which were based on current market rates for new loans with similar maturities, applied until the loan is assumed to reprice or be paid. Estimated fair value for time deposits are based on current market rates at year-end applied until maturity. It was not practicable to determine the fair value of Federal Home Loan Bank stock due to restrictions placed on its transferability. Estimated fair value for other financial instruments and off-balance-sheet loan commitments are considered nominal.
Fair Value Level
FairValue
CarryingAmount Value
CarryingAmount
2018 2017
2
2018 Assets: Available for sale securities U.S. Treasury securities and obligations of U.S. government corporations and agencies $ - $ 22,279,609 $ - Corporate Securities - 23,889,124 - Total Securities $ - $ 46,168,733 $ - 2017 Assets: Available for sale securities U.S. Treasury securities and obligations of U.S. government corporations and agencies $ - $ 22,464,697 $ - Corporate Securities - 26,186,591 - Total Securities $ - $ 48,651,288 $ -
Assets and Liabilities Measured on a Non-Recurring Basis
Assets and liabilities measured at fair value on a non-recurring basis are summarized below:
2018 Assets: Impaired loans: Commercial: Commercial real estate $ - $ - $ 966,524 Other - - 259,396 Residential real estate - - - Total $ - $ - $ 1,225,920 2017 Assets: Impaired loans: Commercial: Commercial real estate $ - $ - $ 1,207,331 Other - - - Residential real estate - - - Total $ - $ - $ 1,207,331
The following represent impairment charges recognized during the period:
Impaired loans, which are measured for impairment using the fair value of the collateral for collateral dependent loans, had arecorded investment of $1,635,900, before a valuation allowance of $410,000 at year-end 2017, resulting in a $180,000 provisionfor loan losses for 2018. At December 31, 2017 impaired loans had a recorded investment of $1,457,331, before a valuation allowanceof 250,000 resulting in no significant provision for loan losses for 2017. As discussed previously, the fair values of impaired loans and other real estate carried at fair value are determined by thirdparty appraisals. Management makes adjustments to these appraised values based on the age of the appraisal and the type ofproperty. The following tables present quantitative information about level 3 fair value measurements for the larger classes offinancial instruments measured at fair value on a non-recurring basis at December 31:
2018 Impaired loans: Commercial: Commercial real estate $ 966,524 Sales comparison Management 10%
discount for propertytype and recent
(Level 1)Assets
Unobservable Discount RateInput
for IdenticalActive Markets
Fair ValueValuation
Technique(s)
UnobservableInputs
(Level 3)
OtherObservable
Inputs(Level 2)
Assets(Level 1)
Quoted Prices in SignificantSignificant
Fair Value Measurements Using
(Range and Average)
Inputs(Level 3)(Level 2)
Inputs
market volatility2017 Impaired loans: Commercial: Commercial real estate $ 1,207,331 Sales comparison Management 10%
discount for propertytype and recentmarket volatility
Fair Value of Financial Instruments
The estimated fair values of financial instruments excluding available for sale securities, in thousands, are as follows as of December 31:
Financial assets Cash and cash equivalents 1 $ 33,136 $ 33,136 $ 26,569 $ Securities held to maturity 2 12,246 12,391 16,210 Time deposits with other institutions 2 2,993 2,898 3,242 Loans held for sale 1 - - 74 Loans, net 3 203,474 200,501 189,423 FHLB and FAMC stock N/A 414 N/A 414 Accrued interest receivable 1,088 1,088 1,022
Financial liabilities Time Deposits 2 $ 24,612 $ 24,443 $ 21,608 $ Non-Maturity Deposits 1 248,927 248,927 236,576 Federal Home Loan Bank advances 2 2,500 2,500 5,000 Accrued interest payable 2 16 16 8
The estimated fair value approximates carrying amount for all items except those described below. Fair value for net loans as of December 31, 2018 is estiamted on an exit price basis incorporating discounts for credit, liquidity and marketability factors.This is not comparable with the fair values disclosed at December 31, 2017, which were based on current market rates for new loans with similar maturities, applied until the loan is assumed to reprice or be paid. Estimated fair value for time deposits are based on current market rates at year-end applied until maturity. It was not practicable to determine the fair value of Federal Home Loan Bank stock due to restrictions placed on its transferability. Estimated fair value for other financial instruments and off-balance-sheet loan commitments are considered nominal.
Fair Value Level
FairValue
CarryingAmount Value
CarryingAmount
2018 2017
2
26,56916,178
3,21175
190,427N/A
1,022
21,554 236,576
5,000 8
ValueFair
market volatility2017 Impaired loans: Commercial: Commercial real estate $ 1,207,331 Sales comparison Management 10%
discount for propertytype and recentmarket volatility
Fair Value of Financial Instruments
The estimated fair values of financial instruments excluding available for sale securities, in thousands, are as follows as of December 31:
Financial assets Cash and cash equivalents 1 $ 33,136 $ 33,136 $ 26,569 $ Securities held to maturity 2 12,246 12,391 16,210 Time deposits with other institutions 2 2,993 2,898 3,242 Loans held for sale 1 - - 74 Loans, net 3 203,474 200,501 189,423 FHLB and FAMC stock N/A 414 N/A 414 Accrued interest receivable 1,088 1,088 1,022
Financial liabilities Time Deposits 2 $ 24,612 $ 24,443 $ 21,608 $ Non-Maturity Deposits 1 248,927 248,927 236,576 Federal Home Loan Bank advances 2 2,500 2,500 5,000 Accrued interest payable 2 16 16 8
The estimated fair value approximates carrying amount for all items except those described below. Fair value for net loans as of December 31, 2018 is estiamted on an exit price basis incorporating discounts for credit, liquidity and marketability factors.This is not comparable with the fair values disclosed at December 31, 2017, which were based on current market rates for new loans with similar maturities, applied until the loan is assumed to reprice or be paid. Estimated fair value for time deposits are based on current market rates at year-end applied until maturity. It was not practicable to determine the fair value of Federal Home Loan Bank stock due to restrictions placed on its transferability. Estimated fair value for other financial instruments and off-balance-sheet loan commitments are considered nominal.
Fair Value Level
FairValue
CarryingAmount Value
CarryingAmount
2018 2017
2

Notes to Consolidated Financial Statements (continued)
5. FAIR VALUE (continued)
Fair Value Measurements UsingQuoted Prices in SignificantActive Markets Other Significant
for Identical Observable UnobservableAssets Inputs Inputs
2014 (Level 1) (Level 2) (Level 3) Assets: Impaired loans: Commercial: Commercial real estate $ 0 $ 0 $ 2,779,571 Other 0 0 30,156 Residential real estate 0 0 0 Total $ 0 $ 0 $ 2,809,727 2013 Assets: Impaired loans: Commercial: Commercial real estate $ 0 $ 0 $ 1,857,400 Other 0 0 104,282 Residential real estate 0 0 278,275 Total $ 0 $ 0 $ 2,239,957
Assets and Liabilities Measured on a Non-Recurring Basis Assets and liabilities measured at fair value on a non-recurring basis are summarized below:
The following represent impairment charges recognized during the period: Impaired loans, which are measured for impairment using the fair value of the collateral for collateral dependent loans, had a recordedinvestmentof$3,179,727,beforeavaluationallowanceof$370,000atyear-end2014,resultinginnosignificantprovi-sion for loan losses for 2014. At December 31, 2013 impaired loans had a recorded investment of $3,379,957, before a valuation allowance of $1,140,000, resulting in a provision for loan losses of $51,000 for the year ending December 31, 2013. As discussed previously, the fair values of impaired loans and other real estate carried at fair value are determined by third party appraisals. Management makes adjustments to these appraised values based on the age of the appraisal and the type of property. The following tables present quantitative information about level 3 fair valuemeasurements for the larger classes offinancialinstruments measured at fair value on a non-recurring basis at December 31:
Valuation Unobservable Discount Rate2014 Fair Value Technique(s) Input (Range and Average) Impaired loans: Commercial: Commercial real estate $ 2,779,571 Sales comparison Management 10%
discount for propertytype and recent
market volatility2013 Impaired loans: Commercial: Commercial real estate $ 1,857,400 Sales comparison Management 10%
discount for property type and recent
market volatility
Century Financial Corporation
22
Notes to Consolidated Financial Statements (continued)Century Financial Corporation
7. LOAN SERVICING Mortgage loans serviced for others are not reported as assets. The principal balances of these loans at year-end areas follows:
2018Mortgage loan portfolios serviced for: FHLMC $ 81,582,100 84,006,568 FHLBI 34,997,840 27,324,107
$ 116,579,940 111,330,675
Custodial escrow balances maintained in connection with serviced loans were $273,470 and $278,173 at December 31, 2018and 2017, respectively.
Activity for loan servicing rights follows:
Servicing rights Beginning of year $ 467,743 $ 493,854 Additions 227,013 201,854 Amortized to expense (212,222) (227,965) End of year $ 482,534 $ 467,743
The fair value of servicing rights at year-end 2018 and 2017 were approximately $1,368,013 and $1,173,311
2017
20172018
$
$Custodial escrow balances maintained in connection with serviced loans were $273,470 and $278,173 at December 31, 2018 and 2017, respectively.
Mortgage loans serviced for others are not reported as assets. The principal balances of these loans at year-end are as follows:
6. PREMISES AND EQUIPMENT
2014 2013Land $ 1,385,439 $ 1,385,439 Buildings 8,146,176 8,142,183 Furniture,fixturesandequipment 4,889,193 6,050,241 Total cost 14,420,809 15,577,863 Lessaccumulateddepreciation (9,094,713) (9,959,071) Total $ 5,326,096 $ 5,618,792
7. LOAN SERVICING
2014 2013Mortgage loan portfolios serviced for:FHLMC $ 81,158,290 $ 83,119,510 FHLBI 20,243,452 17,103,241
Activity for loan servicing rights follows:2014 2013
Servicing rights Beginning of year $ 563,157 $ 455,376 Additions 160,158 323,493 Amortized to expense (219,067) (215,712) End of year $ 504,248 $ 563,157
Notes to Consolidated Financial Statements (continued)
5. FAIR VALUE (continued)Fair Value of Financial Instruments
2013Carrying Fair Carrying FairAmount Value Amount Value
Financial assets Cash and cash equivalents $ 25,947 $ 25,947 $ 32,296 $ 32,296 Securities held to maturity 11,022 11,046 12,058 11,845 Loansheldforsale 208 208 256 256 Loans,net 167,590 168,914 149,005 148,379 FHLBandFAMCstock 534 N/A 612 N/A Accrued interest receivable 839 839 857 857
Financial liabilities Deposits $ 236,342 $ 236,253 $ 238,660 $ 238,720 Accrued interest payable 15 15 21 21
The estimated fair valuesoffinancial instruments excluding available for sale securities, in thousands, are as follows asof December 31:
The estimated fair value approximates carrying amount for all items except those described below. Estimated fair value for loans is based on current market rates for new loans with similar maturities, applied until the loan is assumed to reprice or be paid. Estimated fair value for time deposits are based on current market rates at year-end applied until maturity. It was not practicable todeterminethefairvalueofFederalHomeLoanBankstockduetorestrictionsplacedonitstransferability.Estimatedfairvalueforotherfinancialinstrumentsandoff-balance-sheetloancommitmentsareconsiderednominal.
MajorclassificationsofpremisesandequipmentwereasfollowsatDecember31:
Mortgage loans serviced for others are not reported as assets. The principal balances of these loans at year-end are as follows:
Custodial escrow balances maintained in connection with serviced loans were $273,371 and $142,523 at December 31, 2014 and 2013, respectively.
The fair value of servicing rights at year-end 2014 and 2013 were approximately $1,086,000 and $1,141,000.
2014
23
Valuation Unobservable Discount Rate2014 Fair Value Technique(s) Input (Range and Average) Impaired loans: Commercial: Commercial real estate $ 2,779,571 Sales comparison Management 10%
discount for propertytype and recent
market volatility2013 Impaired loans: Commercial: Commercial real estate $ 1,857,400 Sales comparison Management 10%
discount for property type and recent
market volatility
Century Financial Corporation
Notes to Consolidated Financial Statements (continued)
Statutory rate applied to income before taxes $ 1,138,788 $ 1,130,511 Add (deduct): Non-taxable income (155,294) (142,756) Bank owned life insurance (77,617) (78,781) Other 2,759 6,039 Totalincometaxexpense(benefit) $ 908,636 $ 915,013
Thedifferencebetweenthefinancialstatementtaxexpenseandamountscomputedbyapplyingthestatutoryfederaltaxrateof34% to pretax income is reconciled as follows:
There were no unrecognized tax benefits at December 31, 2014, and the Corporation does not expect the total amount ofunrecognizedtaxbenefitstosignificantlyincreaseordecreaseinthenexttwelvemonths.
The Corporation is no longer subject to examination by the Internal Revenue Service for years before 2011.
No amounts of interest, penalties, and/or accruals were recorded during or for the years ended December 31, 2014 and 2013.
9. INCOME TAx (continued)
10. EARNINGS PER SHARE
2014 2013 Basic earnings per share Net income available to common shareholders $ 2,440,741 $ 2,410,018
Weighted average common shares outstanding 1,934,757 1,945,583
Basic earnings per share $1.26 $1.24
A reconciliation of the numerators and denominators of basic and diluted earnings per share for the years ended December 31 are as follows:
2014 2013Projectedbenefitobligation $ 7,322,054 $ 6,301,006 Fair value of plan assets 5,097,875 4,882,996 Unfunded status $ (2,224,179) $ (1,418,010)
Accruedbenefitcost $ 2,224,179 $ 1,418,010 Accumulatedbenefitobligation 7,322,054 6,301,006 Employer contribution 157,229 427,862 Benefitspaid 337,544 315,087
11. EMPLOYEE BENEFIT PLANS
Defined Benefit Pension PlanTheCorporationhasafundednoncontributorydefinedbenefitpensionplanthatcoverssubstantiallyallofitsemployees.Theplanprovidesdefinedbenefitsbasedonyearsofserviceandfinalaveragesalary.TheCorporationusesaDecember31measurementdate. As of December 31, 2009 the pension plan was frozen. No employee could become a participant of the plan after December 31,2009.ParticipantsearnednoadditionalbenefitsundertheplanafterDecember31,2009.Aparticipant’sbenefitwillbedeter-minedusingyearsofbenefitservice,averagecompensation,andcoveredcompensationasofDecember31,2009.Participantswillcontinue to earn additional vesting years of service after December 31, 2009.
Information about the pension plan as of and for the years ended December 31 was as follows:
25
9. INCOME TAx
Incometaxexpense(benefit)consistsof:2014 2013
Current liability $ 466,279 $ 647,701 Deferred(benefit)liability 442,357 267,312 Totalincometaxexpense(benefit) $ 908,636 $ 915,013
Deferred tax assets and liabilities at December 31 consist of:2014 2013
Deferred tax assets Allowance for loan losses $ 670,712 $ 981,874 Deferred compensation 5,068 5,063 Nonaccrual loans 198,537 296,539 Pension liability 1,172,074 903,617 Unrealized loss on securities available for sale 172,972 1,091,202 Capital loss carry-forward 101,754 104,361 Accrued liabilities 42,500 120,700 Other 12,053 14,852 Total deferred tax assets $ 2,375,670 $ 3,518,208
Deferred tax liabilities Deferred loan fees/costs (129,454) (113,692) Depreciation (203,943) (241,678) Mortgage servicing rights (171,444) (191,473) Pension expense (404,839) (410,480) Unrealized gain on securities available for sale 0 0 Other (46,518) (46,676) Total deferred tax liabilities $ (956,198) $ (1,003,999)
Net deferred tax assets 1,419,472 2,514,209 Valuation allowance (101,754) (104,361) Total deferred tax assets $ 1,317,718 $ 2,409,848
2014 2013
Century Financial Corporation
Notes to Consolidated Financial Statements (continued)Century Financial Corporation
6. PREMISES AND EQUIPMENT Major classifications of premises and equipment were as follows at December 31:
2018 Land $ 1,385,439 $ 1,385,439 Buildings 8,685,950 8,399,048 Furniture, fixtures and equipment 5,069,133 4,964,821 Total cost 15,140,522 14,749,308 Less accumulated depreciation (10,125,065) (9,665,094) Total $ 5,015,457 $ 5,084,214
2017
6. PREMISES AND EQUIPMENT
2014 2013Land $ 1,385,439 $ 1,385,439 Buildings 8,146,176 8,142,183 Furniture,fixturesandequipment 4,889,193 6,050,241 Total cost 14,420,809 15,577,863 Lessaccumulateddepreciation (9,094,713) (9,959,071) Total $ 5,326,096 $ 5,618,792
7. LOAN SERVICING
2014 2013Mortgage loan portfolios serviced for:FHLMC $ 81,158,290 $ 83,119,510 FHLBI 20,243,452 17,103,241
Activity for loan servicing rights follows:2014 2013
Servicing rights Beginning of year $ 563,157 $ 455,376 Additions 160,158 323,493 Amortized to expense (219,067) (215,712) End of year $ 504,248 $ 563,157
Notes to Consolidated Financial Statements (continued)
5. FAIR VALUE (continued)Fair Value of Financial Instruments
2013Carrying Fair Carrying FairAmount Value Amount Value
Financial assets Cash and cash equivalents $ 25,947 $ 25,947 $ 32,296 $ 32,296 Securities held to maturity 11,022 11,046 12,058 11,845 Loansheldforsale 208 208 256 256 Loans,net 167,590 168,914 149,005 148,379 FHLBandFAMCstock 534 N/A 612 N/A Accrued interest receivable 839 839 857 857
Financial liabilities Deposits $ 236,342 $ 236,253 $ 238,660 $ 238,720 Accrued interest payable 15 15 21 21
The estimated fair valuesoffinancial instruments excluding available for sale securities, in thousands, are as follows asof December 31:
The estimated fair value approximates carrying amount for all items except those described below. Estimated fair value for loans is based on current market rates for new loans with similar maturities, applied until the loan is assumed to reprice or be paid. Estimated fair value for time deposits are based on current market rates at year-end applied until maturity. It was not practicable todeterminethefairvalueofFederalHomeLoanBankstockduetorestrictionsplacedonitstransferability.Estimatedfairvalueforotherfinancialinstrumentsandoff-balance-sheetloancommitmentsareconsiderednominal.
MajorclassificationsofpremisesandequipmentwereasfollowsatDecember31:
Mortgage loans serviced for others are not reported as assets. The principal balances of these loans at year-end are as follows:
Custodial escrow balances maintained in connection with serviced loans were $273,371 and $142,523 at December 31, 2014 and 2013, respectively.
The fair value of servicing rights at year-end 2014 and 2013 were approximately $1,086,000 and $1,141,000.
2014
23
Valuation Unobservable Discount Rate2014 Fair Value Technique(s) Input (Range and Average) Impaired loans: Commercial: Commercial real estate $ 2,779,571 Sales comparison Management 10%
discount for propertytype and recent
market volatility2013 Impaired loans: Commercial: Commercial real estate $ 1,857,400 Sales comparison Management 10%
discount for property type and recent
market volatility
Century Financial Corporation
Notes to Consolidated Financial Statements (continued)Century Financial Corporation
7. LOAN SERVICING Mortgage loans serviced for others are not reported as assets. The principal balances of these loans at year-end areas follows:
2018Mortgage loan portfolios serviced for: FHLMC $ 81,582,100 84,006,568 FHLBI 34,997,840 27,324,107
$ 116,579,940 111,330,675
Custodial escrow balances maintained in connection with serviced loans were $273,470 and $278,173 at December 31, 2018and 2017, respectively.
Activity for loan servicing rights follows:
Servicing rights Beginning of year $ 467,743 $ 493,854 Additions 227,013 201,854 Amortized to expense (212,222) (227,965) End of year $ 482,534 $ 467,743
The fair value of servicing rights at year-end 2018 and 2017 were approximately $1,368,013 and $1,173,311
2017
20172018
$
$
The estimated fair value approximates carrying amount for all items except those described below. Fair value for net loans as of December 31, 2018 is estimated on an exit price basis incorporating discounts for credit, liquidity and marketability factors. This is not comparable with the fair values disclosed at December 31, 2017, which were based on current market rates for new loans with similar maturities, applied until the loan is assumed to reprice or be paid. Estimated fair value for time deposits are based on current market rates at year-end applied until maturity. It was not practicable to determine the fair value of Federal Home Loan Bank stock due to restrictions placed on its transferability. Estimated fair value for other financial instruments and off-balance-sheet loan commitments are considered nominal.
Notes to Consolidated Financial Statements (continued)Century Financial Corporation
8. DEPOSITS At December 31, 2018, scheduled maturities of time deposits were as follows: 2019 $ 17,436,515 2020 5,309,202 2021 1,599,472 2022 267,154 Total $ 24,612,343
8. DEPOSITS
2015 $ 26,076,460 2016 8,714,201 2017 2,648,092 2018 21,277 2019 and later 1,329 Total $ 37,461,359
Related party deposits totaled $3,854,595 and $4,151,595 at December 31, 2014 and 2013, respectively. Time deposits that meet or exceed the FDIC Insurance limit of $250,000 at year-end 2014 and 2013 were $10,129,569 and $8,905,174, respectively.9. INCOME TAx
Incometaxexpense(benefit)consistsof:2014 2013
Current liability $ 466,279 $ 647,701 Deferred(benefit)liability 442,357 267,312 Totalincometaxexpense(benefit) $ 908,636 $ 915,013
Deferred tax assets and liabilities at December 31 consist of:2014 2013
Deferred tax assets Allowance for loan losses $ 670,712 $ 981,874 Deferred compensation 5,068 5,063 Nonaccrual loans 198,537 296,539 Pension liability 1,172,074 903,617 Unrealized loss on securities available for sale 172,972 1,091,202 Capital loss carry-forward 101,754 104,361 Accrued liabilities 42,500 120,700 Other 12,053 14,852 Total deferred tax assets $ 2,375,670 $ 3,518,208
Deferred tax liabilities Deferred loan fees/costs (129,454) (113,692) Depreciation (203,943) (241,678) Mortgage servicing rights (171,444) (191,473) Pension expense (404,839) (410,480) Unrealized gain on securities available for sale 0 0 Other (46,518) (46,676) Total deferred tax liabilities $ (956,198) $ (1,003,999)
Net deferred tax assets 1,419,472 2,514,209 Valuation allowance (101,754) (104,361) Total deferred tax assets $ 1,317,718 $ 2,409,848
2014 2013
At December 31, 2014, scheduled maturities of time deposits were as follows:
A valuation allowance related to deferred tax assets is required when it is considered more likely than not that all or part of the benefitsrelatedtosuchassetswillnotberealized.Managementhasdeterminedthatavaluationallowanceagainsttheunrealizedcapital loss carry-forward is required. If unused, the capital loss carry-forward will expire in 2015.
Notes to Consolidated Financial Statements (continued)Century Financial Corporation
24
Related party deposits totaled $25,205,259 and $23,391,737 at December 31, 2018 and 2017, respectively. Time deposits that meet or exceed the FDIC Insurance limit of $250,000 at year-end 2018 and 2017 were $3,697,834 and $3,338,993, respectively. At year-end 2018 and 2017, time deposits included brokered deposits of $5,450,000 and $0, respectively.
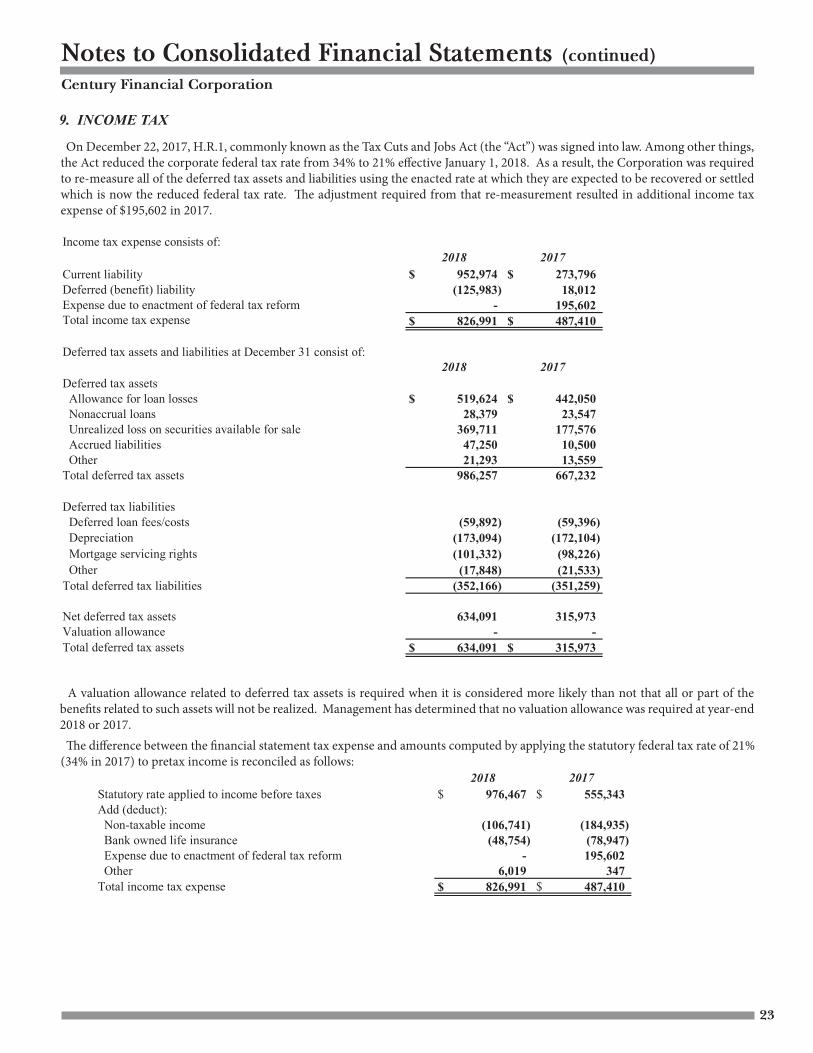
6. PREMISES AND EQUIPMENT
2014 2013Land $ 1,385,439 $ 1,385,439 Buildings 8,146,176 8,142,183 Furniture,fixturesandequipment 4,889,193 6,050,241 Total cost 14,420,809 15,577,863 Lessaccumulateddepreciation (9,094,713) (9,959,071) Total $ 5,326,096 $ 5,618,792
7. LOAN SERVICING
2014 2013Mortgage loan portfolios serviced for:FHLMC $ 81,158,290 $ 83,119,510 FHLBI 20,243,452 17,103,241
Activity for loan servicing rights follows:2014 2013
Servicing rights Beginning of year $ 563,157 $ 455,376 Additions 160,158 323,493 Amortized to expense (219,067) (215,712) End of year $ 504,248 $ 563,157
Notes to Consolidated Financial Statements (continued)
5. FAIR VALUE (continued)Fair Value of Financial Instruments
2013Carrying Fair Carrying FairAmount Value Amount Value
Financial assets Cash and cash equivalents $ 25,947 $ 25,947 $ 32,296 $ 32,296 Securities held to maturity 11,022 11,046 12,058 11,845 Loansheldforsale 208 208 256 256 Loans,net 167,590 168,914 149,005 148,379 FHLBandFAMCstock 534 N/A 612 N/A Accrued interest receivable 839 839 857 857
Financial liabilities Deposits $ 236,342 $ 236,253 $ 238,660 $ 238,720 Accrued interest payable 15 15 21 21
The estimated fair valuesoffinancial instruments excluding available for sale securities, in thousands, are as follows asof December 31:
The estimated fair value approximates carrying amount for all items except those described below. Estimated fair value for loans is based on current market rates for new loans with similar maturities, applied until the loan is assumed to reprice or be paid. Estimated fair value for time deposits are based on current market rates at year-end applied until maturity. It was not practicable todeterminethefairvalueofFederalHomeLoanBankstockduetorestrictionsplacedonitstransferability.Estimatedfairvalueforotherfinancialinstrumentsandoff-balance-sheetloancommitmentsareconsiderednominal.
MajorclassificationsofpremisesandequipmentwereasfollowsatDecember31:
Mortgage loans serviced for others are not reported as assets. The principal balances of these loans at year-end are as follows:
Custodial escrow balances maintained in connection with serviced loans were $273,371 and $142,523 at December 31, 2014 and 2013, respectively.
The fair value of servicing rights at year-end 2014 and 2013 were approximately $1,086,000 and $1,141,000.
2014
23
Valuation Unobservable Discount Rate2014 Fair Value Technique(s) Input (Range and Average) Impaired loans: Commercial: Commercial real estate $ 2,779,571 Sales comparison Management 10%
discount for propertytype and recent
market volatility2013 Impaired loans: Commercial: Commercial real estate $ 1,857,400 Sales comparison Management 10%
discount for property type and recent
market volatility
Century Financial CorporationCentury Financial Corporation
9. INCOME TAXOn December 22, 2017, H.R.1, commonly known as the Tax Cuts and Jobs Act (the “Act”) was signed into law. Among other things, the Act reduced our corporate federal tax rate from 34% to 21% effective January 1, 2018. As a result, we were required to re-measure all of our deferred tax assets and liabilities using the enacted rate at which we expect them to be recovered or settled which is now the reduced federal tax rate. The adjustment required from that re-measurement resulted in additional income tax expense of $195,602 in 2017.
Income tax expense consists of:
Current liability $ 952,974 $ 273,796 Deferred (benefit) liability (125,983) 18,012 Expense due to enactment of federal tax reform - 195,602 Total income tax expense $ 826,991 $ 487,410
Deferred tax assets and liabilities at December 31 consist of:
Deferred tax assets Allowance for loan losses $ 519,624 $ 442,050 Nonaccrual loans 28,379 23,547 Unrealized loss on securities available for sale 369,711 177,576 Accrued liabilities 47,250 10,500 Other 21,293 13,559 Total deferred tax assets 986,257 667,232
Deferred tax liabilities Deferred loan fees/costs (59,892) (59,396) Depreciation (173,094) (172,104) Mortgage servicing rights (101,332) (98,226) Other (17,848) (21,533) Total deferred tax liabilities (352,166) (351,259)
Net deferred tax assets 634,091 315,973 Valuation allowance - - Total deferred tax assets $ 634,091 $ 315,973
A valuation allowance related to deferred tax assets is required when it is considered more likely than not that all orpart of the benefits related to such assets will not be realized. Management has determined that no valuation allowancewas required at year-end 2018 or 2017.
The difference between the financial statement tax expense and amounts computed by applying the statutory federaltax rate of 21% (34% in 2017) to pretax income is reconciled as follows:
Statutory rate applied to income before taxes $ 976,467 $ 555,343 Add (deduct): Non-taxable income (106,741) (184,935) Bank owned life insurance (48,754) (78,947) Expense due to enactment of federal tax reform - 195,602 Other 6,019 347 Total income tax expense $ 826,991 $ 487,410
There were no unrecognized tax benefits at December 31, 2018, and the Corporation does not expect the total amountof unrecognized tax benefits to significantly increase or decrease in the next twelve months.
The Corporation is no longer subject to examination by the Internal Revenue Service for years before 2015.
No amounts of interest, penalties, and/or accruals were recorded during or for the years ended December 31, 201and 2017.
2018 2017
2017
2017
2018
2018
A valuation allowance related to deferred tax assets is required when it is considered more likely than not that all or part of the benefits related to such assets will not be realized. Management has determined that no valuation allowance was required at year-end 2018 or 2017.
Notes to Consolidated Financial Statements (continued)
Statutory rate applied to income before taxes $ 1,138,788 $ 1,130,511 Add (deduct): Non-taxable income (155,294) (142,756) Bank owned life insurance (77,617) (78,781) Other 2,759 6,039 Totalincometaxexpense(benefit) $ 908,636 $ 915,013
Thedifferencebetweenthefinancialstatementtaxexpenseandamountscomputedbyapplyingthestatutoryfederaltaxrateof34% to pretax income is reconciled as follows:
There were no unrecognized tax benefits at December 31, 2014, and the Corporation does not expect the total amount ofunrecognizedtaxbenefitstosignificantlyincreaseordecreaseinthenexttwelvemonths.
The Corporation is no longer subject to examination by the Internal Revenue Service for years before 2011.
No amounts of interest, penalties, and/or accruals were recorded during or for the years ended December 31, 2014 and 2013.
9. INCOME TAx (continued)
10. EARNINGS PER SHARE
2014 2013 Basic earnings per share Net income available to common shareholders $ 2,440,741 $ 2,410,018
Weighted average common shares outstanding 1,934,757 1,945,583
Basic earnings per share $1.26 $1.24
A reconciliation of the numerators and denominators of basic and diluted earnings per share for the years ended December 31 are as follows:
2014 2013Projectedbenefitobligation $ 7,322,054 $ 6,301,006 Fair value of plan assets 5,097,875 4,882,996 Unfunded status $ (2,224,179) $ (1,418,010)
Accruedbenefitcost $ 2,224,179 $ 1,418,010 Accumulatedbenefitobligation 7,322,054 6,301,006 Employer contribution 157,229 427,862 Benefitspaid 337,544 315,087
11. EMPLOYEE BENEFIT PLANS
Defined Benefit Pension PlanTheCorporationhasafundednoncontributorydefinedbenefitpensionplanthatcoverssubstantiallyallofitsemployees.Theplanprovidesdefinedbenefitsbasedonyearsofserviceandfinalaveragesalary.TheCorporationusesaDecember31measurementdate. As of December 31, 2009 the pension plan was frozen. No employee could become a participant of the plan after December 31,2009.ParticipantsearnednoadditionalbenefitsundertheplanafterDecember31,2009.Aparticipant’sbenefitwillbedeter-minedusingyearsofbenefitservice,averagecompensation,andcoveredcompensationasofDecember31,2009.Participantswillcontinue to earn additional vesting years of service after December 31, 2009.
Information about the pension plan as of and for the years ended December 31 was as follows:
25
9. INCOME TAx
Incometaxexpense(benefit)consistsof:2014 2013
Current liability $ 466,279 $ 647,701 Deferred(benefit)liability 442,357 267,312 Totalincometaxexpense(benefit) $ 908,636 $ 915,013
Deferred tax assets and liabilities at December 31 consist of:2014 2013
Deferred tax assets Allowance for loan losses $ 670,712 $ 981,874 Deferred compensation 5,068 5,063 Nonaccrual loans 198,537 296,539 Pension liability 1,172,074 903,617 Unrealized loss on securities available for sale 172,972 1,091,202 Capital loss carry-forward 101,754 104,361 Accrued liabilities 42,500 120,700 Other 12,053 14,852 Total deferred tax assets $ 2,375,670 $ 3,518,208
Deferred tax liabilities Deferred loan fees/costs (129,454) (113,692) Depreciation (203,943) (241,678) Mortgage servicing rights (171,444) (191,473) Pension expense (404,839) (410,480) Unrealized gain on securities available for sale 0 0 Other (46,518) (46,676) Total deferred tax liabilities $ (956,198) $ (1,003,999)
Net deferred tax assets 1,419,472 2,514,209 Valuation allowance (101,754) (104,361) Total deferred tax assets $ 1,317,718 $ 2,409,848
2014 2013
Century Financial CorporationCentury Financial Corporation
9. INCOME TAXOn December 22, 2017, H.R.1, commonly known as the Tax Cuts and Jobs Act (the “Act”) was signed into law. Among other things, the Act reduced our corporate federal tax rate from 34% to 21% effective January 1, 2018. As a result, we were required to re-measure all of our deferred tax assets and liabilities using the enacted rate at which we expect them to be recovered or settled which is now the reduced federal tax rate. The adjustment required from that re-measurement resulted in additional income tax expense of $195,602 in 2017.
Income tax expense consists of:
Current liability $ 952,974 $ 273,796 Deferred (benefit) liability (125,983) 18,012 Expense due to enactment of federal tax reform - 195,602 Total income tax expense $ 826,991 $ 487,410
Deferred tax assets and liabilities at December 31 consist of:
Deferred tax assets Allowance for loan losses $ 519,624 $ 442,050 Nonaccrual loans 28,379 23,547 Unrealized loss on securities available for sale 369,711 177,576 Accrued liabilities 47,250 10,500 Other 21,293 13,559 Total deferred tax assets 986,257 667,232
Deferred tax liabilities Deferred loan fees/costs (59,892) (59,396) Depreciation (173,094) (172,104) Mortgage servicing rights (101,332) (98,226) Other (17,848) (21,533) Total deferred tax liabilities (352,166) (351,259)
Net deferred tax assets 634,091 315,973 Valuation allowance - - Total deferred tax assets $ 634,091 $ 315,973
A valuation allowance related to deferred tax assets is required when it is considered more likely than not that all orpart of the benefits related to such assets will not be realized. Management has determined that no valuation allowancewas required at year-end 2018 or 2017.
The difference between the financial statement tax expense and amounts computed by applying the statutory federaltax rate of 21% (34% in 2017) to pretax income is reconciled as follows:
Statutory rate applied to income before taxes $ 976,467 $ 555,343 Add (deduct): Non-taxable income (106,741) (184,935) Bank owned life insurance (48,754) (78,947) Expense due to enactment of federal tax reform - 195,602 Other 6,019 347 Total income tax expense $ 826,991 $ 487,410
There were no unrecognized tax benefits at December 31, 2018, and the Corporation does not expect the total amountof unrecognized tax benefits to significantly increase or decrease in the next twelve months.
The Corporation is no longer subject to examination by the Internal Revenue Service for years before 2015.
No amounts of interest, penalties, and/or accruals were recorded during or for the years ended December 31, 201and 2017.
2018 2017
2017
2017
2018
2018
The difference between the financial statement tax expense and amounts computed by applying the statutory federal tax rate of 21% (34% in 2017) to pretax income is reconciled as follows:
On December 22, 2017, H.R.1, commonly known as the Tax Cuts and Jobs Act (the “Act”) was signed into law. Among other things, the Act reduced the corporate federal tax rate from 34% to 21% effective January 1, 2018. As a result, the Corporation was required to re-measure all of the deferred tax assets and liabilities using the enacted rate at which they are expected to be recovered or settled which is now the reduced federal tax rate. The adjustment required from that re-measurement resulted in additional income tax expense of $195,602 in 2017.
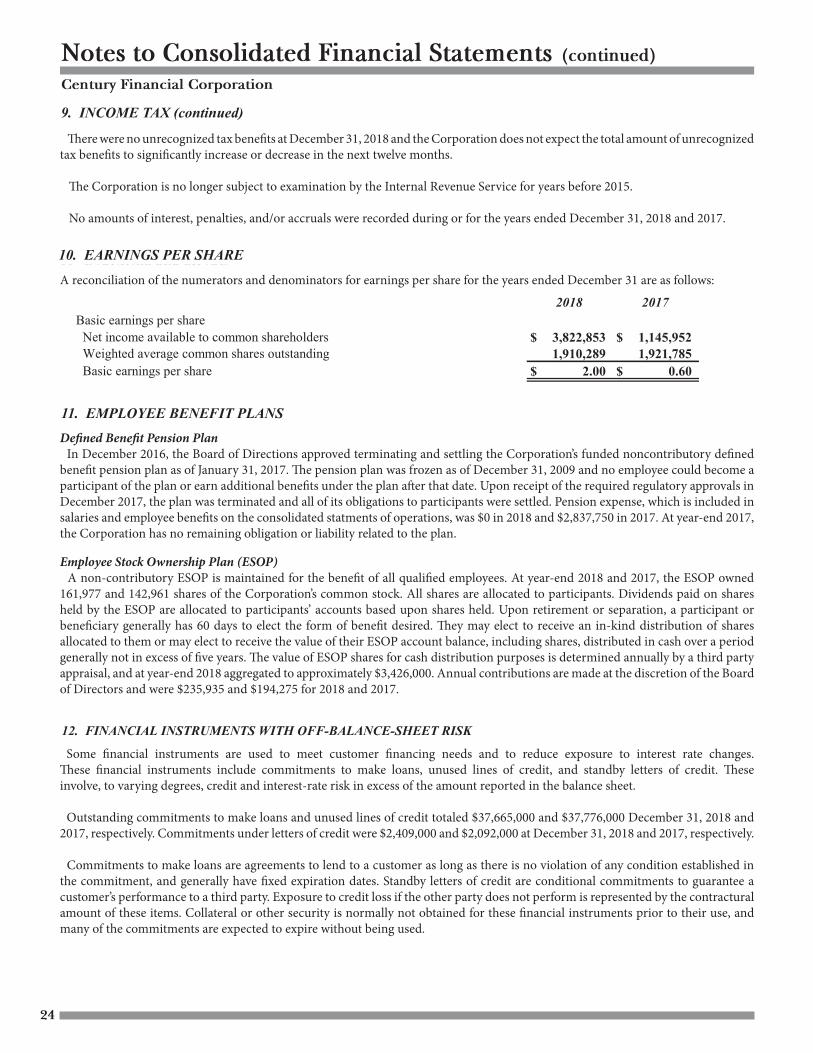
8. DEPOSITS
2015 $ 26,076,460 2016 8,714,201 2017 2,648,092 2018 21,277 2019 and later 1,329 Total $ 37,461,359
Related party deposits totaled $3,854,595 and $4,151,595 at December 31, 2014 and 2013, respectively. Time deposits that meet or exceed the FDIC Insurance limit of $250,000 at year-end 2014 and 2013 were $10,129,569 and $8,905,174, respectively.9. INCOME TAx
Incometaxexpense(benefit)consistsof:2014 2013
Current liability $ 466,279 $ 647,701 Deferred(benefit)liability 442,357 267,312 Totalincometaxexpense(benefit) $ 908,636 $ 915,013
Deferred tax assets and liabilities at December 31 consist of:2014 2013
Deferred tax assets Allowance for loan losses $ 670,712 $ 981,874 Deferred compensation 5,068 5,063 Nonaccrual loans 198,537 296,539 Pension liability 1,172,074 903,617 Unrealized loss on securities available for sale 172,972 1,091,202 Capital loss carry-forward 101,754 104,361 Accrued liabilities 42,500 120,700 Other 12,053 14,852 Total deferred tax assets $ 2,375,670 $ 3,518,208
Deferred tax liabilities Deferred loan fees/costs (129,454) (113,692) Depreciation (203,943) (241,678) Mortgage servicing rights (171,444) (191,473) Pension expense (404,839) (410,480) Unrealized gain on securities available for sale 0 0 Other (46,518) (46,676) Total deferred tax liabilities $ (956,198) $ (1,003,999)
Net deferred tax assets 1,419,472 2,514,209 Valuation allowance (101,754) (104,361) Total deferred tax assets $ 1,317,718 $ 2,409,848
2014 2013
At December 31, 2014, scheduled maturities of time deposits were as follows:
A valuation allowance related to deferred tax assets is required when it is considered more likely than not that all or part of the benefitsrelatedtosuchassetswillnotberealized.Managementhasdeterminedthatavaluationallowanceagainsttheunrealizedcapital loss carry-forward is required. If unused, the capital loss carry-forward will expire in 2015.
Notes to Consolidated Financial Statements (continued)Century Financial Corporation
24
Notes to Consolidated Financial Statements (continued)
Statutory rate applied to income before taxes $ 1,138,788 $ 1,130,511 Add (deduct): Non-taxable income (155,294) (142,756) Bank owned life insurance (77,617) (78,781) Other 2,759 6,039 Totalincometaxexpense(benefit) $ 908,636 $ 915,013
Thedifferencebetweenthefinancialstatementtaxexpenseandamountscomputedbyapplyingthestatutoryfederaltaxrateof34% to pretax income is reconciled as follows:
There were no unrecognized tax benefits at December 31, 2014, and the Corporation does not expect the total amount ofunrecognizedtaxbenefitstosignificantlyincreaseordecreaseinthenexttwelvemonths.
The Corporation is no longer subject to examination by the Internal Revenue Service for years before 2011.
No amounts of interest, penalties, and/or accruals were recorded during or for the years ended December 31, 2014 and 2013.
9. INCOME TAx (continued)
10. EARNINGS PER SHARE
2014 2013 Basic earnings per share Net income available to common shareholders $ 2,440,741 $ 2,410,018
Weighted average common shares outstanding 1,934,757 1,945,583
Basic earnings per share $1.26 $1.24
A reconciliation of the numerators and denominators of basic and diluted earnings per share for the years ended December 31 are as follows:
2014 2013Projectedbenefitobligation $ 7,322,054 $ 6,301,006 Fair value of plan assets 5,097,875 4,882,996 Unfunded status $ (2,224,179) $ (1,418,010)
Accruedbenefitcost $ 2,224,179 $ 1,418,010 Accumulatedbenefitobligation 7,322,054 6,301,006 Employer contribution 157,229 427,862 Benefitspaid 337,544 315,087
11. EMPLOYEE BENEFIT PLANS
Defined Benefit Pension PlanTheCorporationhasafundednoncontributorydefinedbenefitpensionplanthatcoverssubstantiallyallofitsemployees.Theplanprovidesdefinedbenefitsbasedonyearsofserviceandfinalaveragesalary.TheCorporationusesaDecember31measurementdate. As of December 31, 2009 the pension plan was frozen. No employee could become a participant of the plan after December 31,2009.ParticipantsearnednoadditionalbenefitsundertheplanafterDecember31,2009.Aparticipant’sbenefitwillbedeter-minedusingyearsofbenefitservice,averagecompensation,andcoveredcompensationasofDecember31,2009.Participantswillcontinue to earn additional vesting years of service after December 31, 2009.
Information about the pension plan as of and for the years ended December 31 was as follows:
25
9. INCOME TAx
Incometaxexpense(benefit)consistsof:2014 2013
Current liability $ 466,279 $ 647,701 Deferred(benefit)liability 442,357 267,312 Totalincometaxexpense(benefit) $ 908,636 $ 915,013
Deferred tax assets and liabilities at December 31 consist of:2014 2013
Deferred tax assets Allowance for loan losses $ 670,712 $ 981,874 Deferred compensation 5,068 5,063 Nonaccrual loans 198,537 296,539 Pension liability 1,172,074 903,617 Unrealized loss on securities available for sale 172,972 1,091,202 Capital loss carry-forward 101,754 104,361 Accrued liabilities 42,500 120,700 Other 12,053 14,852 Total deferred tax assets $ 2,375,670 $ 3,518,208
Deferred tax liabilities Deferred loan fees/costs (129,454) (113,692) Depreciation (203,943) (241,678) Mortgage servicing rights (171,444) (191,473) Pension expense (404,839) (410,480) Unrealized gain on securities available for sale 0 0 Other (46,518) (46,676) Total deferred tax liabilities $ (956,198) $ (1,003,999)
Net deferred tax assets 1,419,472 2,514,209 Valuation allowance (101,754) (104,361) Total deferred tax assets $ 1,317,718 $ 2,409,848
2014 2013
Century Financial Corporation
There were no unrecognized tax benefits at December 31, 2018 and the Corporation does not expect the total amount of unrecognized tax benefits to significantly increase or decrease in the next twelve months. The Corporation is no longer subject to examination by the Internal Revenue Service for years before 2015.
No amounts of interest, penalties, and/or accruals were recorded during or for the years ended December 31, 2018 and 2017.Notes to Consolidated Financial Statements (continued)Century Financial Corporation
10. EARNINGS PER SHARE The computation of earnings per share for the years ended December 31, is as follows:
Basic earnings per share Net income available to common shareholders $ 3,822,853 $ 1,145,952 Weighted average common shares outstanding 1,910,289 1,921,785 Basic earnings per share $ 2.00 $ 0.60
2018 2017
Defined Benefit Pension Plan In December 2016, the Board of Directions approved terminating and settling the Corporation’s funded noncontributory defined benefit pension plan as of January 31, 2017. The pension plan was frozen as of December 31, 2009 and no employee could become a participant of the plan or earn additional benefits under the plan after that date. Upon receipt of the required regulatory approvals in December 2017, the plan was terminated and all of its obligations to participants were settled. Pension expense, which is included in salaries and employee benefits on the consolidated statments of operations, was $0 in 2018 and $2,837,750 in 2017. At year-end 2017, the Corporation has no remaining obligation or liability related to the plan. Employee Stock Ownership Plan (ESOP) A non-contributory ESOP is maintained for the benefit of all qualified employees. At year-end 2018 and 2017, the ESOP owned 161,977 and 142,961 shares of the Corporation’s common stock. All shares are allocated to participants. Dividends paid on shares held by the ESOP are allocated to participants’ accounts based upon shares held. Upon retirement or separation, a participant or beneficiary generally has 60 days to elect the form of benefit desired. They may elect to receive an in-kind distribution of shares allocated to them or may elect to receive the value of their ESOP account balance, including shares, distributed in cash over a period generally not in excess of five years. The value of ESOP shares for cash distribution purposes is determined annually by a third party appraisal, and at year-end 2018 aggregated to approximately $3,426,000. Annual contributions are made at the discretion of the Board of Directors and were $235,935 and $194,275 for 2018 and 2017.
A reconciliation of the numerators and denominators for earnings per share for the years ended December 31 are as follows:
Notes to Consolidated Financial Statements (continued)
Statutory rate applied to income before taxes $ 1,138,788 $ 1,130,511 Add (deduct): Non-taxable income (155,294) (142,756) Bank owned life insurance (77,617) (78,781) Other 2,759 6,039 Totalincometaxexpense(benefit) $ 908,636 $ 915,013
Thedifferencebetweenthefinancialstatementtaxexpenseandamountscomputedbyapplyingthestatutoryfederaltaxrateof34% to pretax income is reconciled as follows:
There were no unrecognized tax benefits at December 31, 2014, and the Corporation does not expect the total amount ofunrecognizedtaxbenefitstosignificantlyincreaseordecreaseinthenexttwelvemonths.
The Corporation is no longer subject to examination by the Internal Revenue Service for years before 2011.
No amounts of interest, penalties, and/or accruals were recorded during or for the years ended December 31, 2014 and 2013.
9. INCOME TAx (continued)
10. EARNINGS PER SHARE
2014 2013 Basic earnings per share Net income available to common shareholders $ 2,440,741 $ 2,410,018
Weighted average common shares outstanding 1,934,757 1,945,583
Basic earnings per share $1.26 $1.24
A reconciliation of the numerators and denominators of basic and diluted earnings per share for the years ended December 31 are as follows:
2014 2013Projectedbenefitobligation $ 7,322,054 $ 6,301,006 Fair value of plan assets 5,097,875 4,882,996 Unfunded status $ (2,224,179) $ (1,418,010)
Accruedbenefitcost $ 2,224,179 $ 1,418,010 Accumulatedbenefitobligation 7,322,054 6,301,006 Employer contribution 157,229 427,862 Benefitspaid 337,544 315,087
11. EMPLOYEE BENEFIT PLANS
Defined Benefit Pension PlanTheCorporationhasafundednoncontributorydefinedbenefitpensionplanthatcoverssubstantiallyallofitsemployees.Theplanprovidesdefinedbenefitsbasedonyearsofserviceandfinalaveragesalary.TheCorporationusesaDecember31measurementdate. As of December 31, 2009 the pension plan was frozen. No employee could become a participant of the plan after December 31,2009.ParticipantsearnednoadditionalbenefitsundertheplanafterDecember31,2009.Aparticipant’sbenefitwillbedeter-minedusingyearsofbenefitservice,averagecompensation,andcoveredcompensationasofDecember31,2009.Participantswillcontinue to earn additional vesting years of service after December 31, 2009.
Information about the pension plan as of and for the years ended December 31 was as follows:
25
9. INCOME TAx
Incometaxexpense(benefit)consistsof:2014 2013
Current liability $ 466,279 $ 647,701 Deferred(benefit)liability 442,357 267,312 Totalincometaxexpense(benefit) $ 908,636 $ 915,013
Deferred tax assets and liabilities at December 31 consist of:2014 2013
Deferred tax assets Allowance for loan losses $ 670,712 $ 981,874 Deferred compensation 5,068 5,063 Nonaccrual loans 198,537 296,539 Pension liability 1,172,074 903,617 Unrealized loss on securities available for sale 172,972 1,091,202 Capital loss carry-forward 101,754 104,361 Accrued liabilities 42,500 120,700 Other 12,053 14,852 Total deferred tax assets $ 2,375,670 $ 3,518,208
Deferred tax liabilities Deferred loan fees/costs (129,454) (113,692) Depreciation (203,943) (241,678) Mortgage servicing rights (171,444) (191,473) Pension expense (404,839) (410,480) Unrealized gain on securities available for sale 0 0 Other (46,518) (46,676) Total deferred tax liabilities $ (956,198) $ (1,003,999)
Net deferred tax assets 1,419,472 2,514,209 Valuation allowance (101,754) (104,361) Total deferred tax assets $ 1,317,718 $ 2,409,848
2014 2013
Century Financial Corporation
Notes to Consolidated Financial Statements (continued)Century Financial Corporation
12. FINANCIAL INSTRUMENTS WITH OFF-BALANCE-SHEET RISK Some financial instruments are used to meet customer financing needs and to reduce exposure to interest rate changes.These financial instruments include commitments to make loans, unused lines of credit, and standby letters of credit.These involve, to varying degrees, credit and interest-rate risk in excess of the amount reported in the balance sheet.
Outstanding commitments to make loans and unused lines of credit totaled $37,776,000 and $40,968,000 at December 31,2017 and 2016, respectively. Commitments under letters of credit were $2,092,000 and $1,942,000 at December 31, 2017 and2016, respectively.
Commitments to make loans are agreements to lend to a customer as long as there is no violation of any conditionestablished in the commitment, and generally have fixed expiration dates. Standby letters of credit are conditionalcommitments to guarantee a customer's performance to a third party. Exposure to credit loss if the other party does notperform is represented by the contractual amount of these items. Collateral or other security is normally not obtainedfor these financial instruments prior to their use, and many of the commitments are expected to expire without being used.
Some financial instruments are used to meet customer financing needs and to reduce exposure to interest rate changes. These financial instruments include commitments to make loans, unused lines of credit, and standby letters of credit. These involve, to varying degrees, credit and interest-rate risk in excess of the amount reported in the balance sheet. Outstanding commitments to make loans and unused lines of credit totaled $37,665,000 and $37,776,000 December 31, 2018 and 2017, respectively. Commitments under letters of credit were $2,409,000 and $2,092,000 at December 31, 2018 and 2017, respectively. Commitments to make loans are agreements to lend to a customer as long as there is no violation of any condition established in the commitment, and generally have fixed expiration dates. Standby letters of credit are conditional commitments to guarantee a customer’s performance to a third party. Exposure to credit loss if the other party does not perform is represented by the contractural amount of these items. Collateral or other security is normally not obtained for these financial instruments prior to their use, and many of the commitments are expected to expire without being used.

Notes to Consolidated Financial Statements (continued)
Statutory rate applied to income before taxes $ 1,138,788 $ 1,130,511 Add (deduct): Non-taxable income (155,294) (142,756) Bank owned life insurance (77,617) (78,781) Other 2,759 6,039 Totalincometaxexpense(benefit) $ 908,636 $ 915,013
Thedifferencebetweenthefinancialstatementtaxexpenseandamountscomputedbyapplyingthestatutoryfederaltaxrateof34% to pretax income is reconciled as follows:
There were no unrecognized tax benefits at December 31, 2014, and the Corporation does not expect the total amount ofunrecognizedtaxbenefitstosignificantlyincreaseordecreaseinthenexttwelvemonths.
The Corporation is no longer subject to examination by the Internal Revenue Service for years before 2011.
No amounts of interest, penalties, and/or accruals were recorded during or for the years ended December 31, 2014 and 2013.
9. INCOME TAx (continued)
10. EARNINGS PER SHARE
2014 2013 Basic earnings per share Net income available to common shareholders $ 2,440,741 $ 2,410,018
Weighted average common shares outstanding 1,934,757 1,945,583
Basic earnings per share $1.26 $1.24
A reconciliation of the numerators and denominators of basic and diluted earnings per share for the years ended December 31 are as follows:
2014 2013Projectedbenefitobligation $ 7,322,054 $ 6,301,006 Fair value of plan assets 5,097,875 4,882,996 Unfunded status $ (2,224,179) $ (1,418,010)
Accruedbenefitcost $ 2,224,179 $ 1,418,010 Accumulatedbenefitobligation 7,322,054 6,301,006 Employer contribution 157,229 427,862 Benefitspaid 337,544 315,087
11. EMPLOYEE BENEFIT PLANS
Defined Benefit Pension PlanTheCorporationhasafundednoncontributorydefinedbenefitpensionplanthatcoverssubstantiallyallofitsemployees.Theplanprovidesdefinedbenefitsbasedonyearsofserviceandfinalaveragesalary.TheCorporationusesaDecember31measurementdate. As of December 31, 2009 the pension plan was frozen. No employee could become a participant of the plan after December 31,2009.ParticipantsearnednoadditionalbenefitsundertheplanafterDecember31,2009.Aparticipant’sbenefitwillbedeter-minedusingyearsofbenefitservice,averagecompensation,andcoveredcompensationasofDecember31,2009.Participantswillcontinue to earn additional vesting years of service after December 31, 2009.
Information about the pension plan as of and for the years ended December 31 was as follows:
25
9. INCOME TAx
Incometaxexpense(benefit)consistsof:2014 2013
Current liability $ 466,279 $ 647,701 Deferred(benefit)liability 442,357 267,312 Totalincometaxexpense(benefit) $ 908,636 $ 915,013
Deferred tax assets and liabilities at December 31 consist of:2014 2013
Deferred tax assets Allowance for loan losses $ 670,712 $ 981,874 Deferred compensation 5,068 5,063 Nonaccrual loans 198,537 296,539 Pension liability 1,172,074 903,617 Unrealized loss on securities available for sale 172,972 1,091,202 Capital loss carry-forward 101,754 104,361 Accrued liabilities 42,500 120,700 Other 12,053 14,852 Total deferred tax assets $ 2,375,670 $ 3,518,208
Deferred tax liabilities Deferred loan fees/costs (129,454) (113,692) Depreciation (203,943) (241,678) Mortgage servicing rights (171,444) (191,473) Pension expense (404,839) (410,480) Unrealized gain on securities available for sale 0 0 Other (46,518) (46,676) Total deferred tax liabilities $ (956,198) $ (1,003,999)
Net deferred tax assets 1,419,472 2,514,209 Valuation allowance (101,754) (104,361) Total deferred tax assets $ 1,317,718 $ 2,409,848
2014 2013
Century Financial Corporation
Notes to Consolidated Financial Statements (continued)
Fair Value of Plan Assets: Fair value is the exchange price that would be received for an asset in the principal or most advantageous market for the asset in an orderly transaction between market participants on the measurement date. TheCorporationusedthefollowingmethodsandsignificantassumptionstoestimatethefairvalueofeachtypeoffinancialinstru-ment: Equity, debt, and other securities: The fair values for investment securities are determined by quoted market prices, if available (Level1).Forsecuritieswherequotedpricesarenotavailable,fairvaluesarecalculatedbasedonmarketpricesofsimilarsecurities(Level2).Forsecuritieswherequotedpricesormarketpricesofsimilarsecuritiesarenotavailable,fairvaluesarecalculatedusingdiscountedcashflowsorothermarketindicators(Level3).DiscountedcashflowsarecalculatedusingspreadtoswapandLIBORcurves that are updated to incorporate loss severities, volatility, credit spread and optionality. During times when trading is more liquid, broker quotes are used (if available) to validate the model. Rating agency and industry research reports as well as defaults and deferrals on individual securities are reviewed and incorporated in to the calculations. The fair value of the plan assets at December 31, by asset class, is as follows:
at December 31, 2014 Using: at December 31, 2013 Using:Quoted Significant Quoted Significant
Prices in Active Other Significant Prices in Active Other SignificantMarkets for Observable Unobservable Markets for Observable Unobservable
Identical Assets Inputs Inputs Identical Assets Inputs Inputs(Level 1) (Level 2) (Level 3) (Level 1) (Level 2) (Level 3)
Plan assets Cash $ 68,410 $ 0 $ 0 $ 128,611 $ 0 $ 0
Equity securities U.S. large cap 2,371,548 0 0 2,181,557 0 0
U.S. mid cap 187,426 0 0 167,550 0 0
U.S. small cap 167,455 0 0 168,833 0 0
Preferred stock 153,964 0 0 135,337 0 0
International (developed) 161,381 0 0 206,143 0 0
International (emerging) 118,446 0 0 98,502 0 0
Debt securities U.S. government obligations 0 315,256 0 0 321,340 0
Certificatesofdeposit 0 473,261 0 0 458,583 0
Investment grade corporate bonds 673,157 0 0 653,680 0 0
High yield bonds 350,353 0 0 304,460 0 0
Specialty Precious Metals 57,200 0 0 58,400 0 0
Total plan assets $ 4,309,358 $ 788,517 $ 0 $ 4,103,073 $ 779,923 $ 0
11. EMPLOYEE BENEFIT PLANS (continued)
Employee Stock Ownership Plan (ESOP)AnESOPismaintainedforthebenefitofallqualifiedemployees.Annualmatchingcontributionsaremadeatthediscretionofthe Board of Directors. The contribution to the ESOP was $156,630 for 2014 and $131,828 for 2013.
12. FINANCIAL INSTRUMENTS WITH OFF-BALANCE-SHEET RISk Somefinancialinstrumentsareusedtomeetcustomerfinancingneedsandtoreduceexposuretointerestratechanges.Thesefinancialinstrumentsincludecommitmentstomakeloans,unusedlinesofcredit,andstandbylettersofcredit.Theseinvolve,tovarying degrees, credit and interest-rate risk in excess of the amount reported in the balance sheet.
Outstanding commitments to make loans and unused lines of credit totaled $31,822,000 and $29,235,000 at December 31, 2014 and 2013, respectively. Commitments under letters of credit were $1,597,000 and $1,868,000 at December 31, 2014 and 2013, respectively.
2014 2013 Service cost $ 32,916 0 Interest cost 275,415 247,613 Expected return on plan assets (313,154) (243,111) Amortization of net loss 178,643 260,041 Netperiodicbenefitcost 789,578 264,543
Net actuarial (gain) loss 968,221 (779,290) Amortization of prior service cost (178,643) (260,041) Total recognized in other comprehensive income 789,578 (1,039,331)Totalrecognizedinnetperiodicbenefitcostand other comprehensive income $ 963,398 $ (774,788)
Weightedaverageassumptionsusedtodeterminebenefitobligationsatyear-end: Discount rate 3.75% 4.50%
Weighted average assumptions used to determine net cost: Discount rate 4.50% 3.75% Expected rate of return on plan assets 6.50% 6.5%
Weighted Target Percentage of Average
Allocation Plan Assets at Year-End Rate of Return2015 2014 2013 2014
Equity securities 55% 63% 62% 10.51% Debt securities 40% 36% 36% 4.16% Cash and other 5% 1% 3% 0.13% Total 100% 100% 8.17%
Century Financial Corporation
27
Notes to Consolidated Financial Statements (continued)
12. FINANCIAL INSTRUMENTS WITH OFF-BALANCE-SHEET RISk (continued) Commitments to make loans are agreements to lend to a customer as long as there is no violation of any condition established in thecommitment,andgenerallyhavefixedexpirationdates.Standbylettersofcreditareconditionalcommitmentstoguaranteeacustomer’s performance to a third party. Exposure to credit loss if the other party does not perform is represented by the contractual amountoftheseitems.Collateralorothersecurityisnormallynotobtainedforthesefinancialinstrumentspriortotheiruse,andmany of the commitments are expected to expire without being used.
Capital to risk- weighted assets
Tier 1 capital Total Tier 1 to average assets
Well capitalized 10% 6% 5% Adequately capitalized 8% 4% 4% Under capitalized 6% 3% 3%
Minimum requiredto be well
Minimum required capitalized underfor capital prompt corrective
Actual adequacy purposes action regulations
2014 Amount Ratio Amount Ratio Amount Ratio Total capital (to risk weighted assets) $ 35,855 17.9% $ 16,022 8.0% $ 20,028 10.0%
Tier 1 capital (to risk weighted assets) 33,731 16.8% 8,011 4.0% 12,017 6.0%
Tier 1 capital (to average assets) 33,731 12.2% 11,066 4.0% 13,832 5.0%
2013 Total capital (to risk weighted assets) $ 34,500 18.0% $ 15,345 8.0% $ 19,181 10.0%
Tier 1 capital (to risk weighted assets) 32,094 16.7% 7,673 4.0% 11,509 6.0%
Tier 1 capital (to average assets) 32,094 12.2% 10,526 4.0% 13,158 5.0%
13. REGULATORY MATTERS Banks are subject to regulatory capital requirements administered by federal banking agencies. These prompt corrective action regulations involve quantitative measures of assets, liabilities, and certain off-balance-sheet items calculated under regulatory accountingpractices.Capitalamountsandclassificationsarealsosubjecttoqualitativejudgmentsbyregulators.Failuretomeetvarious requirements can initiate regulatory action. Management believes the Bank meets all the capital requirements to which it is subject at year-end 2014.
Prompt corrective action regulations provide five classifications: well capitalized, adequately capitalized, undercapitalized,significantlyundercapitalized,andcriticallyundercapitalized,althoughthesetermsarenotusedtorepresentoverallfinancialcondition.If adequately capitalized, regulatory approval is required to accept brokered deposits. If undercapitalized, capital distributions are limited, as is asset growth and expansion, and capital restoration plans are required. As of December 31, 2014 and 2013, the most recentregulatorynotificationscategorizedtheBankaswellcapitalizedundertheregulatoryframeworkforpromptcorrectiveaction.TherearenoconditionsoreventssincethatnotificationthatmanagementbelieveshavechangedtheBank’scategory.
At December 31, the Bank’s actual capital levels and minimum required levels, in thousands, approximated:
Banking regulations require maintaining certain capital levels and may limit the dividend paid by the Bank to the Corporation or by the Corporation to the shareholders.
Eric H. Beckhusen Thomas G. Kramer Robert W. Shedd
Chairman & CEO, Executive Director, Northshore Asset Management
Century Bank and Trust ADAPT, Incorporated
Stanley R. Welch
Robert P. Brothers Caroline P. Lowe Chairman of the Board,
Attorney-at-Law Certified Public Accountant Bronson Plating Co.
Bruce S. A. Gosling, Kelly B. Murphy Eric J. Wynes
Certified Public Accountant, President, President,Norman & Paulsen, P.C. C. A. Murphy Oil Co. Century Bank and Trust
John D. Hutchinson
Attorney-at-Law
Century Bank and Trust
Eric H. Beckhusen Michael D. Eddy Heather E. Eldridge
Chairman & CEO Trust Operations Officer
Eric J. WynesJared E. Hoffmaster
Jessica A. Handy
PresidentAssistant Vice President &
Commercial Loan Officer
Investment OfficerDylan M. Foster Jeffrey S. Holbrook
Senior Vice PresidentBarry R. Miller
Commercial Loan Officer
Assistant Vice President &Gaylene S. AdamsMortgage Loan Officer
AnnMarie L. Sanders
Vice President Commercial Loan Officer
Vicki R. MorrisJulie A. AndrewsAssistant Vice President &
Andrea J. Strong
Vice President & Senior Trust Officer Teller Operations Officer
Donna M. HobdayDonna L. Penick
Kathy A. Tomson
Vice PresidentAuditor
Mortgage Loan Officer
Ginger J. KeslerKatherine L. Sexton-Deck
Adam M. Wright
Vice PresidentController
Commercial Loan Officer
Ronald H. UhlCorey L. CollinsVice PresidentDeposit Services Officer
David L. WrightW. Samuel Davenport IIIVice PresidentLoan Officer
Alicia K. ColeRebecca R. DukeAssistant Vice President &Marketing DirectorTrust Officer
Century Financial Corporation
Eric H. Beckhusen Eric J. Wynes
Chairman & CEO President
DirectorsCentury Financial Corporation
Century Financial Corporation and Century Bank and Trust
Officers
Mortgage Loan Officer
Assistant Vice President &
Mortgage Loan Officer
OfficersCentury Bank and Trust
Eric H. Beckhusen Alicia K. Cole Adam M. Wright
Chairman & CEO Assistant Vice President & Assistant Vice President &
Trust Officer Commercial Loan Officer
Eric J. Wynes
President Corey L. Collins Donna L. Penick
Assistant Vice President & Deposit Auditor
Dylan M. Foster Services Officer
Senior Vice President Katherine L. Sexton-Deck
Michael D. Eddy Controller
Gaylene S. Adams Assistant Vice President &
Vice President Mortgage Loan Officer W. Samuel Davenport III
Loan Officer
Julie A. Andrews Jared E. Hoffmaster
Vice President & Senior Trust Officer Assistant Vice President & Rebecca R. Duke
Investment Officer Marketing Director
Jessica A. Handy
Vice President & Commercial Loan Jeffrey S. Holbrook Heather E. Eldridge
Officer Assistant Vice President & Trust Operations Officer
Commercial Loan Officer
Donna M. Hobday Tracy A. Richer
Vice President Barry R. Miller Trust Officer
Assistant Vice President &
Ginger J. Kesler Mortgage Loan Officer AnnMarie L. Sanders
Vice President Commercial Loan Officer
Vicki R. Morris
Ronald H. Uhl Assistant Vice President & Erik L. Schaeffer
Vice President Mortgage Loan Officer Trust Officer
David L. Wright Andrea J. Strong Kathy A. Tomson
Vice President Assistant Vice President & Mortgage Loan Officer
Teller Operations Officer
Century Financial Corporation
28
Banks and bank holding companies are subject to regulatory capital requirements administered by federal banking agencies. Capital adequacy guidelines, and additionally for banks, prompt corrective action regulations, involve quantitative measures of assets, liabilities, and certain off-balance sheet items calculated under regulatory accounting practices. Capital amounts and classifications are also subject to qualitative judgments by regulators. Failure to meet capital requirements can initiate regulatory action. The final rules implementing Basel Committee on Banking Supervision’s capital guidelines for U.S. banks (Basel III rules) became effective for the Corporation on January 1, 2015 with full compliance with all of the requirements being phased in over a multi-year schedule, and fully phased in by January 1, 2019. The net unrealized gain or loss on available for sale securities is not included in computing regulatory capital. The table below presents minimum reported capital adequacy information assuming full phase-in of these new requirements. Management believes as of December 31, 2018, the Corporation and Bank meet all capital adequacy requirements to which they are subject.
Prompt corrective action regulations provide five classifications: well capitalized, adequately capitalized, undercapitalized, significantly undercapitalized, and critically undercapitalized, although these terms are not used to represent overall financial condition. If adequately capitalized, regulatory approval is required to accept brokered deposits. If undercapitalized, capital distributions are limited, as is asset growth and expansion, and capital restoration plans are required. As of December 31, 2018 and 2017, the most recent regulatory notifications categorized the Bank as well capitalized under the regulatory framework for prompt corrective action. There are no conditions or events since that notification that management believes have changed the Bank’s category.
Banking regulations require maintaining certain capital levels and may limit the dividend paid by the Bank to the Corporation or by the Corporation to the shareholders.
Notes to Consolidated Financial Statements (continued)Century Financial Corporation
13. REGULATORY MATTERS Banks and bank holding companies are subject to regulatory capital requirements administered by federal bankingagencies. Capital adequacy guidelines, and additionally for banks, prompt corrective action regulations, involve quanti-tave measures of assets, liabilities, and certain off-balance sheet items calculated under regulatory accounting practices.Capital amounts and classifications are also subject to qualitative judgments by regulators. Failure to meet capital require-ments can initiate regulatory action. The final rules implementing Basel Committee on Banking Supervision's capitalguidelines for U.S. banks (Basel III rules) became effective for the Company on January 1, 2015 with full compliance withall of the requirements being phased in over a multi-year schedule, and fully phased in by January 1, 2019. The netunrealized gain or loss on available for sale securities is not included in computing regulatory capital. The table belowpresents minimum reported capital adequacy information assuming full phase-in of these new requirements. Manage-ment believes as of December 31, 2017, the Company and Bank meet all capital adequacy requirements to which they aresubject. Prompt corrective action regulations provide five classifications: well capitalized, adequately capitalized, undercapitalized,significantly undercapitalized, and critically undercapitalized, although these terms are not used to represent overall financial condition. If adequately capitalized, regulatory approval is required to accept brokered deposits. If undercapital-ized, capital distributions are limited, as is asset growth and expansion, and capital restoration plans are required. As ofDecember 31, 2017 and 2016, the most recent regulatory notifications categorized the Bank as well capitalized under theregulatory framework for prompt corrective action. There are no conditions or events since that notification that manage-ment believes have changed the Bank's category.
At December 31, the Bank's actual capital levels and minimum required levels, in thousands, approximated:
2017 Amount Ratio Amount Ratio Amount Ratio Total Capital (to risk weighted assets) $ 39,223 16.6% $ 24,812 10.5% $ 23,630 10.0% Tier 1 (Core) Capital (to risk weighted assets) 37,022 15.7% 20,086 8.5% 18,904 8.0% Common Tier 1 (CET1) 37,022 15.7% 16,541 7.0% 15,360 6.5% Tier 1 (Core) Capital (to average assets) 37,022 12.5% 11,826 4.0% 14,782 5.0%
2016 Total Capital (to risk weighted assets) $ 39,223 17.2% $ 23,899 10.5% $ 22,761 10.0% Tier 1 (Core) Capital (to risk weighted assets) 36,954 16.2% 19,347 8.5% 18,209 8.0% Common Tier 1 (CET1) 36,954 16.2% 15,933 7.0% 14,795 6.5% Tier 1 (Core) Capital (to average assets) 36,954 12.4% 11,938 4.0% 14,922 5.0%
Banking regulations require maintaining certain capital levels and may limit the dividend paid by the Bank to the Corpora-tion or by the Corporation to the shareholders.
Minimum required
Minimum requiredfor capital
adequacy purposesActual
to be wellcapitalized underprompt correctiveaction regulations
Notes to Consolidated Financial Statements (continued)Century Financial Corporation
13. REGULATORY MATTERS Banks and bank holding companies are subject to regulatory capital requirements administered by federal bankingagencies. Capital adequacy guidelines, and additionally for banks, prompt corrective action regulations, involve quanti-tave measures of assets, liabilities, and certain off-balance sheet items calculated under regulatory accounting practices.Capital amounts and classifications are also subject to qualitative judgments by regulators. Failure to meet capital require-ments can initiate regulatory action. The final rules implementing Basel Committee on Banking Supervision's capitalguidelines for U.S. banks (Basel III rules) became effective for the Company on January 1, 2015 with full compliance withall of the requirements being phased in over a multi-year schedule, and fully phased in by January 1, 2019. The netunrealized gain or loss on available for sale securities is not included in computing regulatory capital. The table belowpresents minimum reported capital adequacy information assuming full phase-in of these new requirements. Manage-ment believes as of December 31, 2018, the Company and Bank meet all capital adequacy requirements to which they aresubject. Prompt corrective action regulations provide five classifications: well capitalized, adequately capitalized, undercapitalized,significantly undercapitalized, and critically undercapitalized, although these terms are not used to represent overall financial condition. If adequately capitalized, regulatory approval is required to accept brokered deposits. If undercapital-ized, capital distributions are limited, as is asset growth and expansion, and capital restoration plans are required. As ofDecember 31, 2018 and 2017, the most recent regulatory notifications categorized the Bank as well capitalized under theregulatory framework for prompt corrective action. There are no conditions or events since that notification that manage-ment believes have changed the Bank's category.
At December 31, the Bank's actual capital levels and minimum required levels, in thousands, approximated:
2018 Amount Ratio Amount Ratio Amount Total Capital (to risk weighted assets) $ 41,887 16.7% $ 26,367 10.5% $ 25,111 Tier 1 (Core) Capital (to risk weighted assets) 39,312 15.7% 21,345 8.5% 20,089 Common Tier 1 (CET1) 39,312 15.7% 17,578 7.0% 16,322 Tier 1 (Core) Capital (to average assets) 39,312 13.1% 12,023 4.0% 15,028
2017 Total Capital (to risk weighted assets) $ 39,223 16.6% $ 24,812 10.5% $ 23,630 Tier 1 (Core) Capital (to risk weighted assets) 37,022 15.7% 20,086 8.5% 18,904 Common Tier 1 (CET1) 37,022 15.7% 16,541 7.0% 15,360 Tier 1 (Core) Capital (to average assets) 37,022 12.5% 11,826 4.0% 14,782
Banking regulations require maintaining certain capital levels and may limit the dividend paid by the Bank to the Corpora-tion or by the Corporation to the shareholders.
Actual
Minimum requiredfor capital
adequacy purposes
Minimum requiredto be well
capitalized underprompt correctiveaction regulations
Ratio10.0%8.0%6.5%5.0%
10.0%8.0%6.5%5.0%
Minimum requiredto be well
capitalized underprompt correctiveaction regulations

Notes to Consolidated Financial Statements (continued)
11. EMPLOYEE BENEFIT PLANS (Continued)
2014 2013 Service cost $ 32,916 0 Interest cost 275,415 247,613 Expected return on plan assets (313,154) (243,111) Amortization of net loss 178,643 260,041 Netperiodicbenefitcost 789,578 264,543
Net actuarial (gain) loss 968,221 (779,290) Amortization of prior service cost (178,643) (260,041) Total recognized in other comprehensive income 789,578 (1,039,331)Totalrecognizedinnetperiodicbenefitcostand other comprehensive income $ 963,398 $ (774,788)
Weightedaverageassumptionsusedtodeterminebenefitobligationsatyear-end: Discount rate 3.75% 4.50%
Weighted average assumptions used to determine net cost: Discount rate 4.50% 3.75% Expected rate of return on plan assets 6.50% 6.5%
ComponentsofNetPeriodicBenefitCostandotherAmountsRecognizedinOtherComprehensiveIncome:
Weighted Target Percentage of Average
Allocation Plan Assets at Year-End Rate of Return2015 2014 2013 2014
Equity securities 55% 63% 62% 10.51% Debt securities 40% 36% 36% 4.16% Cash and other 5% 1% 3% 0.13% Total 100% 100% 8.17%
The Bank expects to contribute approximately $8,000 to its pension plan in 2015.
Thefollowingbenefitpaymentsareexpectedtobepaid: 2015 $343,697 2016 306,153 2017 318,893 2018 344,690 2019 333,848 2020 - 2024 1,983,510
Amounts recognized in accumulated other comprehensive loss, before taxes, consisted of a net loss of $3,447,275 and $2,657,697 at December 31, 2014 and 2013, respectively.
The estimated net loss for the pension plan that will be amortized from accumulated other comprehensive loss into periodic benefitcostsduringtheyearendingDecember31,2015is$240,000.
The Bank’s overall investment strategy is to achieve a mix of approximately 55% of investments for long-term growth and 45% fornear-termbenefitpaymentswithawidediversificationofassettypes,fundstrategiesandfundmanagers.Equitysecuritiesprimarily include investments in common stocks and multi-class mutual funds. Debt securities include government agencies, investment grade global corporate bonds, and global high yield corporate bonds. Real estate investments are primarily held in REITSandadiversifiedmutualfund.Otherinvestmentsconsistofcertificatesofdepositandamoneymarketinstrument.
The expected rate of return on plan assets is based on management’s estimate of future long-term rates of return on similar assets and is consistent with historical returns on such assets.
Target asset allocation for 2015, allocations at year-end 2014 and 2013, and weighted average rate of return by asset class are as follows:
Century Financial Corporation
26
Capital to risk- weighted assets
Tier 1 capital Total Tier 1 to average assets
Well capitalized 10% 6% 5% Adequately capitalized 8% 4% 4% Under capitalized 6% 3% 3%
Minimum requiredto be well
Minimum required capitalized underfor capital prompt corrective
Actual adequacy purposes action regulations
2014 Amount Ratio Amount Ratio Amount Ratio Total capital (to risk weighted assets) $ 35,855 17.9% $ 16,022 8.0% $ 20,028 10.0%
Tier 1 capital (to risk weighted assets) 33,731 16.8% 8,011 4.0% 12,017 6.0%
Tier 1 capital (to average assets) 33,731 12.2% 11,066 4.0% 13,832 5.0%
2013 Total capital (to risk weighted assets) $ 34,500 18.0% $ 15,345 8.0% $ 19,181 10.0%
Tier 1 capital (to risk weighted assets) 32,094 16.7% 7,673 4.0% 11,509 6.0%
Tier 1 capital (to average assets) 32,094 12.2% 10,526 4.0% 13,158 5.0%
Century Financial Corporation
Directors
Officers
Eric H. Beckhusen Thomas G. Kramer Robert W. Shedd
Chairman & CEO, Executive Director, Northshore Asset Management
Century Bank and Trust ADAPT, Incorporated
Stanley R. Welch
Robert P. Brothers Caroline P. Lowe Chairman of the Board,
Attorney-at-Law Certified Public Accountant Bronson Plating Co.
Bruce S. A. Gosling, Kelly B. Murphy Eric J. Wynes
Certified Public Accountant, President, President,Norman & Paulsen, P.C. C. A. Murphy Oil Co. Century Bank and Trust
John D. Hutchinson
Attorney-at-Law
Century Bank and Trust
Eric H. Beckhusen Michael D. Eddy Heather E. Eldridge
Chairman & CEO Trust Operations Officer
Eric J. WynesJared E. Hoffmaster
Jessica A. Handy
PresidentAssistant Vice President &
Commercial Loan Officer
Investment OfficerDylan M. Foster Jeffrey S. Holbrook
Senior Vice PresidentBarry R. Miller
Commercial Loan Officer
Assistant Vice President &Gaylene S. AdamsMortgage Loan Officer
AnnMarie L. Sanders
Vice President Commercial Loan Officer
Vicki R. MorrisJulie A. AndrewsAssistant Vice President &
Andrea J. Strong
Vice President & Senior Trust Officer Teller Operations Officer
Donna M. HobdayDonna L. Penick
Kathy A. Tomson
Vice PresidentAuditor
Mortgage Loan Officer
Ginger J. KeslerKatherine L. Sexton-Deck
Adam M. Wright
Vice PresidentController
Commercial Loan Officer
Ronald H. UhlCorey L. CollinsVice PresidentDeposit Services Officer
David L. WrightW. Samuel Davenport IIIVice PresidentLoan Officer
Alicia K. ColeRebecca R. DukeAssistant Vice President &Marketing DirectorTrust Officer
Century Financial Corporation
Eric H. Beckhusen Eric J. Wynes
Chairman & CEO President
DirectorsCentury Financial Corporation
Century Financial Corporation and Century Bank and Trust
Officers
Mortgage Loan Officer
Assistant Vice President &
Mortgage Loan Officer
Century Financial Corporation
Century Bank and Trust
29
OfficersCentury Bank and Trust
Eric H. Beckhusen Alicia K. Cole Adam M. Wright
Chairman & CEO Assistant Vice President & Assistant Vice President &
Trust Officer Commercial Loan Officer
Eric J. Wynes
President Corey L. Collins Donna L. Penick
Assistant Vice President & Deposit Auditor
Dylan M. Foster Services Officer
Senior Vice President Katherine L. Sexton-Deck
Michael D. Eddy Controller
Gaylene S. Adams Assistant Vice President &
Vice President Mortgage Loan Officer W. Samuel Davenport III
Loan Officer
Julie A. Andrews Jared E. Hoffmaster
Vice President & Senior Trust Officer Assistant Vice President & Rebecca R. Duke
Investment Officer Marketing Director
Jessica A. Handy
Vice President & Commercial Loan Jeffrey S. Holbrook Heather E. Eldridge
Officer Assistant Vice President & Trust Operations Officer
Commercial Loan Officer
Donna M. Hobday Tracy A. Richer
Vice President Barry R. Miller Trust Officer
Assistant Vice President &
Ginger J. Kesler Mortgage Loan Officer AnnMarie L. Sanders
Vice President Commercial Loan Officer
Vicki R. Morris
Ronald H. Uhl Assistant Vice President & Erik L. Schaeffer
Vice President Mortgage Loan Officer Trust Officer
David L. Wright Andrea J. Strong Kathy A. Tomson
Vice President Assistant Vice President & Mortgage Loan Officer
Teller Operations Officer
Eric H. Beckhusen
Bruce S. A. Gosling William G. Pridgeon
Chairman & CEO,
Certified Public Accountant, Partner, Pridgeon Farms, LLC
Century Bank and Trust
Norman & Paulsen, P.C.
Eric J. Wynes
Robert P. Brothers
Thomas G. KramerPresident,
Attorney at Law,
Retired Executive Director,Century Bank and Trust
Brothers Law Office, PLLC
ADAPT, Incorporated
Jeffrey W. Budd
Caroline P. Lowe
CPA, Utility Director,
Certified Public Accountant,
Coldwater Board of Public Utilities
Caroline P. Lowe, CPA, PLC
James W. GordonCertified Public Accountant,James W. Gordon, CPA, P.C.
Eric H. Beckhusen
Adam M. Wright
Andrea J. StrongChairman & CEO
Vice President
Assistant Vice President &Teller Operations Officer
Eric J. Wynes
Alicia K. Cole
President
Assistant Vice President &
Jason C. Dozeman
Trust Officer
Commercial Loan OfficerDylan M. FosterSenior Vice President
Corey L. Collins
Heather E. Eldridge
Assistant Vice President &
Trust Operations OfficerRebecca S. Crabill
Commercial Loan Officer
Chief Financial Officer Alicia A. Finnerman
Michael D. Eddy
Mortgage Loan OfficerJulie A. Andrews
Assistant Vice President &
Vice President &
Mortgage Loan Officer
Sergio GomezMortgage Loan Officer
Jeffrey S. Holbrook
Jared E. HoffmasterVice President
Assistant Vice President &
Joshua D. Jones
Investment Officer
Mortgage Loan Officer
Ginger J. KeslerVice President
Vicki R. Morris
Tracy A. Richer
Assistant Vice President &
Trust Officer
Barry R. Miller
Mortgage Loan OfficerVice President
Ryan J. Saddler
Mashaun M. Schabloski
Cash Management Officer
Donna L. Penick
Assistant Vice President & Vice President & Auditor
Marketing Director
Erik L. SchaefferTrust Officer
AnnMarie L. SandersVice President
Kathy A. TomsonMortgage Loan Officer
Ronald H. UhlVice President
Eric H. Beckhusen Eric J. WynesChairman & CEO President
DirectorsCentury Financial Corporation and Century Bank and Trust
Century Bank and Trust
Century Financial Corporation
Officers
Senior Trust Officer
Notes to Consolidated Financial Statements (continued)
Fair Value of Plan Assets: Fair value is the exchange price that would be received for an asset in the principal or most advantageous market for the asset in an orderly transaction between market participants on the measurement date. TheCorporationusedthefollowingmethodsandsignificantassumptionstoestimatethefairvalueofeachtypeoffinancialinstru-ment: Equity, debt, and other securities: The fair values for investment securities are determined by quoted market prices, if available (Level1).Forsecuritieswherequotedpricesarenotavailable,fairvaluesarecalculatedbasedonmarketpricesofsimilarsecurities(Level2).Forsecuritieswherequotedpricesormarketpricesofsimilarsecuritiesarenotavailable,fairvaluesarecalculatedusingdiscountedcashflowsorothermarketindicators(Level3).DiscountedcashflowsarecalculatedusingspreadtoswapandLIBORcurves that are updated to incorporate loss severities, volatility, credit spread and optionality. During times when trading is more liquid, broker quotes are used (if available) to validate the model. Rating agency and industry research reports as well as defaults and deferrals on individual securities are reviewed and incorporated in to the calculations. The fair value of the plan assets at December 31, by asset class, is as follows:
at December 31, 2014 Using: at December 31, 2013 Using:Quoted Significant Quoted Significant
Prices in Active Other Significant Prices in Active Other SignificantMarkets for Observable Unobservable Markets for Observable Unobservable
Identical Assets Inputs Inputs Identical Assets Inputs Inputs(Level 1) (Level 2) (Level 3) (Level 1) (Level 2) (Level 3)
Plan assets Cash $ 68,410 $ 0 $ 0 $ 128,611 $ 0 $ 0
Equity securities U.S. large cap 2,371,548 0 0 2,181,557 0 0
U.S. mid cap 187,426 0 0 167,550 0 0
U.S. small cap 167,455 0 0 168,833 0 0
Preferred stock 153,964 0 0 135,337 0 0
International (developed) 161,381 0 0 206,143 0 0
International (emerging) 118,446 0 0 98,502 0 0
Debt securities U.S. government obligations 0 315,256 0 0 321,340 0
Certificatesofdeposit 0 473,261 0 0 458,583 0
Investment grade corporate bonds 673,157 0 0 653,680 0 0
High yield bonds 350,353 0 0 304,460 0 0
Specialty Precious Metals 57,200 0 0 58,400 0 0
Total plan assets $ 4,309,358 $ 788,517 $ 0 $ 4,103,073 $ 779,923 $ 0
11. EMPLOYEE BENEFIT PLANS (continued)
Employee Stock Ownership Plan (ESOP)AnESOPismaintainedforthebenefitofallqualifiedemployees.Annualmatchingcontributionsaremadeatthediscretionofthe Board of Directors. The contribution to the ESOP was $156,630 for 2014 and $131,828 for 2013.
12. FINANCIAL INSTRUMENTS WITH OFF-BALANCE-SHEET RISk Somefinancialinstrumentsareusedtomeetcustomerfinancingneedsandtoreduceexposuretointerestratechanges.Thesefinancialinstrumentsincludecommitmentstomakeloans,unusedlinesofcredit,andstandbylettersofcredit.Theseinvolve,tovarying degrees, credit and interest-rate risk in excess of the amount reported in the balance sheet.
Outstanding commitments to make loans and unused lines of credit totaled $31,822,000 and $29,235,000 at December 31, 2014 and 2013, respectively. Commitments under letters of credit were $1,597,000 and $1,868,000 at December 31, 2014 and 2013, respectively.
2014 2013 Service cost $ 32,916 0 Interest cost 275,415 247,613 Expected return on plan assets (313,154) (243,111) Amortization of net loss 178,643 260,041 Netperiodicbenefitcost 789,578 264,543
Net actuarial (gain) loss 968,221 (779,290) Amortization of prior service cost (178,643) (260,041) Total recognized in other comprehensive income 789,578 (1,039,331)Totalrecognizedinnetperiodicbenefitcostand other comprehensive income $ 963,398 $ (774,788)
Weightedaverageassumptionsusedtodeterminebenefitobligationsatyear-end: Discount rate 3.75% 4.50%
Weighted average assumptions used to determine net cost: Discount rate 4.50% 3.75% Expected rate of return on plan assets 6.50% 6.5%
Weighted Target Percentage of Average
Allocation Plan Assets at Year-End Rate of Return2015 2014 2013 2014
Equity securities 55% 63% 62% 10.51% Debt securities 40% 36% 36% 4.16% Cash and other 5% 1% 3% 0.13% Total 100% 100% 8.17%
Century Financial Corporation
27
Capital to risk- weighted assets
Tier 1 capital Total Tier 1 to average assets
Well capitalized 10% 6% 5% Adequately capitalized 8% 4% 4% Under capitalized 6% 3% 3%
Minimum requiredto be well
Minimum required capitalized underfor capital prompt corrective
Actual adequacy purposes action regulations
2014 Amount Ratio Amount Ratio Amount Ratio Total capital (to risk weighted assets) $ 35,855 17.9% $ 16,022 8.0% $ 20,028 10.0%
Tier 1 capital (to risk weighted assets) 33,731 16.8% 8,011 4.0% 12,017 6.0%
Tier 1 capital (to average assets) 33,731 12.2% 11,066 4.0% 13,832 5.0%
2013 Total capital (to risk weighted assets) $ 34,500 18.0% $ 15,345 8.0% $ 19,181 10.0%
Tier 1 capital (to risk weighted assets) 32,094 16.7% 7,673 4.0% 11,509 6.0%
Tier 1 capital (to average assets) 32,094 12.2% 10,526 4.0% 13,158 5.0%
Century Financial Corporation
Directors
Officers
Eric H. Beckhusen Thomas G. Kramer Robert W. Shedd
Chairman & CEO, Executive Director, Northshore Asset Management
Century Bank and Trust ADAPT, Incorporated
Stanley R. Welch
Robert P. Brothers Caroline P. Lowe Chairman of the Board,
Attorney-at-Law Certified Public Accountant Bronson Plating Co.
Bruce S. A. Gosling, Kelly B. Murphy Eric J. Wynes
Certified Public Accountant, President, President,Norman & Paulsen, P.C. C. A. Murphy Oil Co. Century Bank and Trust
John D. Hutchinson
Attorney-at-Law
Century Bank and Trust
Eric H. Beckhusen Michael D. Eddy Heather E. Eldridge
Chairman & CEO Trust Operations Officer
Eric J. WynesJared E. Hoffmaster
Jessica A. Handy
PresidentAssistant Vice President &
Commercial Loan Officer
Investment OfficerDylan M. Foster Jeffrey S. Holbrook
Senior Vice PresidentBarry R. Miller
Commercial Loan Officer
Assistant Vice President &Gaylene S. AdamsMortgage Loan Officer
AnnMarie L. Sanders
Vice President Commercial Loan Officer
Vicki R. MorrisJulie A. AndrewsAssistant Vice President &
Andrea J. Strong
Vice President & Senior Trust Officer Teller Operations Officer
Donna M. HobdayDonna L. Penick
Kathy A. Tomson
Vice PresidentAuditor
Mortgage Loan Officer
Ginger J. KeslerKatherine L. Sexton-Deck
Adam M. Wright
Vice PresidentController
Commercial Loan Officer
Ronald H. UhlCorey L. CollinsVice PresidentDeposit Services Officer
David L. WrightW. Samuel Davenport IIIVice PresidentLoan Officer
Alicia K. ColeRebecca R. DukeAssistant Vice President &Marketing DirectorTrust Officer
Century Financial Corporation
Eric H. Beckhusen Eric J. Wynes
Chairman & CEO President
DirectorsCentury Financial Corporation
Century Financial Corporation and Century Bank and Trust
Officers
Mortgage Loan Officer
Assistant Vice President &
Mortgage Loan Officer
Eric H. Beckhusen Thomas G. Kramer Robert W. Shedd
Chairman & CEO, Executive Director, Northshore Asset Management
Century Bank and Trust ADAPT, Incorporated
Stanley R. Welch
Robert P. Brothers Caroline P. Lowe Chairman of the Board,
Attorney-at-Law Certified Public Accountant Bronson Plating Co.
Bruce S. A. Gosling, Kelly B. Murphy Eric J. Wynes
Certified Public Accountant, President, President,Norman & Paulsen, P.C. C. A. Murphy Oil Co. Century Bank and Trust
John D. Hutchinson
Attorney-at-Law
Century Bank and Trust
Eric H. Beckhusen Michael D. Eddy Heather E. Eldridge
Chairman & CEO Trust Operations Officer
Eric J. WynesJared E. Hoffmaster
Jessica A. Handy
PresidentAssistant Vice President &
Commercial Loan Officer
Investment OfficerDylan M. Foster Jeffrey S. Holbrook
Senior Vice PresidentBarry R. Miller
Commercial Loan Officer
Assistant Vice President &Gaylene S. AdamsMortgage Loan Officer
AnnMarie L. Sanders
Vice President Commercial Loan Officer
Vicki R. MorrisJulie A. AndrewsAssistant Vice President &
Andrea J. Strong
Vice President & Senior Trust Officer Teller Operations Officer
Donna M. HobdayDonna L. Penick
Kathy A. Tomson
Vice PresidentAuditor
Mortgage Loan Officer
Ginger J. KeslerKatherine L. Sexton-Deck
Adam M. Wright
Vice PresidentController
Commercial Loan Officer
Ronald H. UhlCorey L. CollinsVice PresidentDeposit Services Officer
David L. WrightW. Samuel Davenport IIIVice PresidentLoan Officer
Alicia K. ColeRebecca R. DukeAssistant Vice President &Marketing DirectorTrust Officer
Century Financial Corporation
Eric H. Beckhusen Eric J. Wynes
Chairman & CEO President
DirectorsCentury Financial Corporation
Century Financial Corporation and Century Bank and Trust
Officers
Mortgage Loan Officer
Assistant Vice President &
Mortgage Loan Officer
Century Financial Corporation
Century Bank and Trust
29
OfficersCentury Bank and Trust
Eric H. Beckhusen Alicia K. Cole Adam M. Wright
Chairman & CEO Assistant Vice President & Assistant Vice President &
Trust Officer Commercial Loan Officer
Eric J. Wynes
President Corey L. Collins Donna L. Penick
Assistant Vice President & Deposit Auditor
Dylan M. Foster Services Officer
Senior Vice President Katherine L. Sexton-Deck
Michael D. Eddy Controller
Gaylene S. Adams Assistant Vice President &
Vice President Mortgage Loan Officer W. Samuel Davenport III
Loan Officer
Julie A. Andrews Jared E. Hoffmaster
Vice President & Senior Trust Officer Assistant Vice President & Rebecca R. Duke
Investment Officer Marketing Director
Jessica A. Handy
Vice President & Commercial Loan Jeffrey S. Holbrook Heather E. Eldridge
Officer Assistant Vice President & Trust Operations Officer
Commercial Loan Officer
Donna M. Hobday Tracy A. Richer
Vice President Barry R. Miller Trust Officer
Assistant Vice President &
Ginger J. Kesler Mortgage Loan Officer AnnMarie L. Sanders
Vice President Commercial Loan Officer
Vicki R. Morris
Ronald H. Uhl Assistant Vice President & Erik L. Schaeffer
Vice President Mortgage Loan Officer Trust Officer
David L. Wright Andrea J. Strong Kathy A. Tomson
Vice President Assistant Vice President & Mortgage Loan Officer
Teller Operations Officer
30
Century Financial Corporation
Office and ATM LocationsColdwater Main Office Bronson Office Nottawa Office
100 West Chicago Street 106 East Chicago Street 25985 M-86
Coldwater, Michigan 49036 Bronson, Michigan 49028 Nottawa, Michigan 49075
(517) 278-1500 (517) 369-2100 (269) 467-9615
Coldwater Auto Bank Office Quincy Office Sturgis Main Office
64 North Monroe Street 109 West Chicago Street 300 West Chicago Road
Coldwater, Michigan 49036 Quincy, Michigan 49082 Sturgis, Michigan 49091
(517) 278-1500 (517) 639-8800 (269) 651-5491
Coldwater East Office Reading Office Sturgis West Office
745 East Chicago Street 108 North Main Street 201 South Centerville Road
Coldwater, Michigan 49036 Reading, Michigan 49274 Sturgis, Michigan 49091
(517) 278-1500 (517) 283-2148 (269) 651-5491
Coldwater Fairfield Office Jonesville Loan Center Three Rivers Office
496 Marshall Street 859 Olds Road 1310 West Broadway
Coldwater, Michigan 49036 Jonesville, Michigan 49250 Three Rivers, Michigan 49093
(517) 278-1500 (517) 849-9010 (269) 273-3690
ATM Locations
Century Bank and Trust Century Bank and Trust Century Bank and Trust
Coldwater Main Office Bronson Office Three Rivers Office
100 West Chicago Street 106 East Chicago Street 1310 West Broadway
Coldwater, Michigan Bronson, Michigan Three Rivers, Michigan
Century Bank and Trust Century Bank and Trust Century Bank and Trust
AutoBank Drive-Thru Quincy Office West Branch
64 North Monroe Street 109 West Chicago Street 201 South Centerville Road
Coldwater, Michigan Quincy, Michigan Sturgis, Michigan
Century Bank and Trust Community Health Center Century Bank and Trust
East Branch 274 East Chicago Street Drive-Thru ATM
745 East Chicago Street Coldwater, Michigan 1031 North Nottawa Road
Coldwater, Michigan Sturgis, Michigan
Century Bank and Trust
Century Bank and Trust Reading Office
Fairfield Plaza 108 North Main Street
496 Marshall Street Reading, Michigan
Coldwater, Michigan
Coldwater Main Office Bronson Office Nottawa Office
100 West Chicago Street 106 East Chicago Street 25985 M-86
Coldwater, Michigan 49036 Bronson, Michigan 49028 Nottawa, Michigan 49075
(517) 278-1500 (517) 369-2100 (269) 467-9615
Coldwater Auto Bank Office Quincy Office Sturgis Main Office
64 North Monroe Street 109 West Chicago Street 300 West Chicago Road
Coldwater, Michigan 49036 Quincy, Michigan 49082 Sturgis, Michigan 49091
(517) 278-1500 (517) 639-8800 (269) 651-5491
Coldwater East Office Reading Office Sturgis West Office
745 East Chicago Street 108 North Main Street 201 South Centerville Road
Coldwater, Michigan 49036 Reading, Michigan 49274 Sturgis, Michigan 49091
(517) 278-1500 (517) 283-2148 (269) 651-5491
Coldwater Fairfield Office Jonesville Loan Center Three Rivers Office
496 Marshall Street 859 Olds Road 1310 West Broadway
Coldwater, Michigan 49036 Jonesville, Michigan 49250 Three Rivers, Michigan 49093
(517) 278-1500 (517) 849-9010 (269) 273-3690
ATM Locations
Century Bank and Trust Century Bank and Trust Century Bank and Trust
Coldwater Main Office Bronson Office Three Rivers Office
100 West Chicago Street 106 East Chicago Street 1310 West Broadway
Coldwater, Michigan Bronson, Michigan Three Rivers, Michigan
Century Bank and Trust Century Bank and Trust Century Bank and Trust
AutoBank Drive-Thru Quincy Office West Branch
64 North Monroe Street 109 West Chicago Street 201 South Centerville Road
Coldwater, Michigan Quincy, Michigan Sturgis, Michigan
Century Bank and Trust Community Health Center Century Bank and Trust
East Branch 274 East Chicago Street Drive-Thru ATM
745 East Chicago Street Coldwater, Michigan 1031 North Nottawa Road
Coldwater, Michigan Sturgis, Michigan
Century Bank and Trust
Century Bank and Trust Reading Office
Fairfield Plaza 108 North Main Street
496 Marshall Street Reading, Michigan
Coldwater, Michigan
Office Locations
Coldwater Main Office Quincy Office Sturgis Main Office100 West Chicago Street 109 West Chicago Street 300 West Chicago RoadColdwater, Michigan 49036 Quincy, Michigan 49082 Sturgis, Michigan 49091(517) 278-1500 (517) 639-8800 (269) 651-5491
Coldwater Auto Bank Drive-Thru Reading Office Sturgis West Office64 North Monroe Street 108 North Main Street 201 South Centerville RoadColdwater, Michigan 49036 Reading, Michigan 49274 Sturgis, Michigan 49091(517) 278-1500 (517) 283-2148 (269) 651-5491
Coldwater East Office Jonesville Loan Center Three Rivers Office745 East Chicago Street 859 Olds Road 1310 West BroadwayColdwater, Michigan 49036 Jonesville, Michigan 49250 Three Rivers, Michigan 49093(517) 278-1500 (517) 849-9010 (269) 273-3690
Bronson Office Nottawa Office106 East Chicago Street 25985 M-86Bronson, Michigan 49028 Nottawa, Michigan 49075(517) 369-2100 (269) 467-9615
ATM Locations
Century Bank and Trust Century Bank and Trust Century Bank and TrustColdwater Main Office ATM Bronson Office ATM Sturgis West Office ATM100 West Chicago Street 106 East Chicago Street 201 South Centerville RoadColdwater, Michigan Bronson, Michigan Sturgis, Michigan
Century Bank and Trust Century Bank and Trust Century Bank and Trust ATMColdwater AutoBank Drive-Thru ATM Quincy Office ATM Murphy Oil Gas Station64 North Monroe Street 109 West Chicago Street 1450 S Centerville RoadColdwater, Michigan Quincy, Michigan Sturgis, Michigan
Century Bank and Trust Century Bank and Trust Century Bank and Trust ATMColdwater East Office ATM Reading Office ATM Murphy Oil Gas Station745 East Chicago Street 108 North Main Street 2018 North Wayne StreetColdwater, Michigan Reading, Michigan Angola, Indiana
Century Bank and Trust Century Bank and TrustColdwater Fairfield ATM Three Rivers Main Office ATM496 Marshall Street 1310 West BroadwayColdwater, Michigan Three Rivers, Michigan
24 Hour Online Banking at CenturyBankandTrust.comToll Free (866) 680-2265
Office and ATM LocationsCentury Financial Corporation
Office Locations
Coldwater Main Office Quincy Office Sturgis Main Office100 West Chicago Street 109 West Chicago Street 300 West Chicago RoadColdwater, Michigan 49036 Quincy, Michigan 49082 Sturgis, Michigan 49091(517) 278-1500 (517) 639-8800 (269) 651-5491
Coldwater Auto Bank Drive-Thru Reading Office Sturgis West Office64 North Monroe Street 108 North Main Street 201 South Centerville RoadColdwater, Michigan 49036 Reading, Michigan 49274 Sturgis, Michigan 49091(517) 278-1500 (517) 283-2148 (269) 651-5491
Coldwater East Office Jonesville Loan Center Three Rivers Office745 East Chicago Street 859 Olds Road 1310 West BroadwayColdwater, Michigan 49036 Jonesville, Michigan 49250 Three Rivers, Michigan 49093(517) 278-1500 (517) 849-9010 (269) 273-3690
Bronson Office Nottawa Office106 East Chicago Street 25985 M-86Bronson, Michigan 49028 Nottawa, Michigan 49075(517) 369-2100 (269) 467-9615
ATM Locations
Century Bank and Trust Century Bank and Trust Century Bank and TrustColdwater Main Office ATM Bronson Office ATM Three Rivers Main Office ATM100 West Chicago Street 106 East Chicago Street 1310 West BroadwayColdwater, Michigan Bronson, Michigan Three Rivers, Michigan
Century Bank and Trust Century Bank and Trust Century Bank and TrustColdwater AutoBank Drive-Thru ATM Quincy Office ATM Sturgis West Office ATM64 North Monroe Street 109 West Chicago Street 201 South Centerville RoadColdwater, Michigan Quincy, Michigan Sturgis, Michigan
Century Bank and Trust Community Health Center Century Bank and Trust ATMColdwater East Office ATM Hospital Gift Shop ATM Murphy Oil Gas Station745 East Chicago Street 274 East Chicago Street 1450 S Centerville RoadColdwater, Michigan Coldwater, Michigan Sturgis, Michigan
Century Bank and Trust Century Bank and Trust Century Bank and Trust ATMColdwater Fairfield ATM Reading Office ATM Murphy Oil Gas Station496 Marshall Street 108 North Main Street 2018 North Wayne StreetColdwater, Michigan Reading, Michigan Angola, Indiana
24 Hour Online Banking at CenturyBankandTrust.comToll Free (866) 680-2265
Office and ATM LocationsCentury Financial Corporation

Company Profile
Financial Highlights 2
Message to Shareholders 3
Review of Performance and Operations 4
Report of Independent Auditors 5
Consolidated Balance Sheets 6
Consolidated Statements of Income 7
Consolidated Statements of Comprehensive Income 8
Consolidated Statements of Changes in Shareholders’ Equity 8
Consolidated Statements of Cash Flows 9
Notes to Consolidated Financial Statements 10
Directors 28
Officers 28
OfficeLocations 29
ATMLocations 29
F I N A N C I A L C O R P O R A T I O N
F I N A N C I A L C O R P O R A T I O N
Century Financial Corporation
Notes to Consolidated Financial Statements (continued)
12. FINANCIAL INSTRUMENTS WITH OFF-BALANCE-SHEET RISk (continued) Commitments to make loans are agreements to lend to a customer as long as there is no violation of any condition established in thecommitment,andgenerallyhavefixedexpirationdates.Standbylettersofcreditareconditionalcommitmentstoguaranteeacustomer’s performance to a third party. Exposure to credit loss if the other party does not perform is represented by the contractual amountoftheseitems.Collateralorothersecurityisnormallynotobtainedforthesefinancialinstrumentspriortotheiruse,andmany of the commitments are expected to expire without being used.
Capital to risk- weighted assets
Tier 1 capital Total Tier 1 to average assets
Well capitalized 10% 6% 5% Adequately capitalized 8% 4% 4% Under capitalized 6% 3% 3%
Minimum requiredto be well
Minimum required capitalized underfor capital prompt corrective
Actual adequacy purposes action regulations
2014 Amount Ratio Amount Ratio Amount Ratio Total capital (to risk weighted assets) $ 35,855 17.9% $ 16,022 8.0% $ 20,028 10.0%
Tier 1 capital (to risk weighted assets) 33,731 16.8% 8,011 4.0% 12,017 6.0%
Tier 1 capital (to average assets) 33,731 12.2% 11,066 4.0% 13,832 5.0%
2013 Total capital (to risk weighted assets) $ 34,500 18.0% $ 15,345 8.0% $ 19,181 10.0%
Tier 1 capital (to risk weighted assets) 32,094 16.7% 7,673 4.0% 11,509 6.0%
Tier 1 capital (to average assets) 32,094 12.2% 10,526 4.0% 13,158 5.0%
13. REGULATORY MATTERS Banks are subject to regulatory capital requirements administered by federal banking agencies. These prompt corrective action regulations involve quantitative measures of assets, liabilities, and certain off-balance-sheet items calculated under regulatory accountingpractices.Capitalamountsandclassificationsarealsosubjecttoqualitativejudgmentsbyregulators.Failuretomeetvarious requirements can initiate regulatory action. Management believes the Bank meets all the capital requirements to which it is subject at year-end 2014.
Prompt corrective action regulations provide five classifications: well capitalized, adequately capitalized, undercapitalized,significantlyundercapitalized,andcriticallyundercapitalized,althoughthesetermsarenotusedtorepresentoverallfinancialcondition.If adequately capitalized, regulatory approval is required to accept brokered deposits. If undercapitalized, capital distributions are limited, as is asset growth and expansion, and capital restoration plans are required. As of December 31, 2014 and 2013, the most recentregulatorynotificationscategorizedtheBankaswellcapitalizedundertheregulatoryframeworkforpromptcorrectiveaction.TherearenoconditionsoreventssincethatnotificationthatmanagementbelieveshavechangedtheBank’scategory.
At December 31, the Bank’s actual capital levels and minimum required levels, in thousands, approximated:
Banking regulations require maintaining certain capital levels and may limit the dividend paid by the Bank to the Corporation or by the Corporation to the shareholders.
Eric H. Beckhusen Thomas G. Kramer Robert W. Shedd
Chairman & CEO, Executive Director, Northshore Asset Management
Century Bank and Trust ADAPT, Incorporated
Stanley R. Welch
Robert P. Brothers Caroline P. Lowe Chairman of the Board,
Attorney-at-Law Certified Public Accountant Bronson Plating Co.
Bruce S. A. Gosling, Kelly B. Murphy Eric J. Wynes
Certified Public Accountant, President, President,Norman & Paulsen, P.C. C. A. Murphy Oil Co. Century Bank and Trust
John D. Hutchinson
Attorney-at-Law
Century Bank and Trust
Eric H. Beckhusen Michael D. Eddy Heather E. Eldridge
Chairman & CEO Trust Operations Officer
Eric J. WynesJared E. Hoffmaster
Jessica A. Handy
PresidentAssistant Vice President &
Commercial Loan Officer
Investment OfficerDylan M. Foster Jeffrey S. Holbrook
Senior Vice PresidentBarry R. Miller
Commercial Loan Officer
Assistant Vice President &Gaylene S. AdamsMortgage Loan Officer
AnnMarie L. Sanders
Vice President Commercial Loan Officer
Vicki R. MorrisJulie A. AndrewsAssistant Vice President &
Andrea J. Strong
Vice President & Senior Trust Officer Teller Operations Officer
Donna M. HobdayDonna L. Penick
Kathy A. Tomson
Vice PresidentAuditor
Mortgage Loan Officer
Ginger J. KeslerKatherine L. Sexton-Deck
Adam M. Wright
Vice PresidentController
Commercial Loan Officer
Ronald H. UhlCorey L. CollinsVice PresidentDeposit Services Officer
David L. WrightW. Samuel Davenport IIIVice PresidentLoan Officer
Alicia K. ColeRebecca R. DukeAssistant Vice President &Marketing DirectorTrust Officer
Century Financial Corporation
Eric H. Beckhusen Eric J. Wynes
Chairman & CEO President
DirectorsCentury Financial Corporation
Century Financial Corporation and Century Bank and Trust
Officers
Mortgage Loan Officer
Assistant Vice President &
Mortgage Loan Officer
Eric H. Beckhusen Thomas G. Kramer Robert W. Shedd
Chairman & CEO, Executive Director, Northshore Asset Management
Century Bank and Trust ADAPT, Incorporated
Stanley R. Welch
Robert P. Brothers Caroline P. Lowe Chairman of the Board,
Attorney-at-Law Certified Public Accountant Bronson Plating Co.
Bruce S. A. Gosling, Kelly B. Murphy Eric J. Wynes
Certified Public Accountant, President, President,Norman & Paulsen, P.C. C. A. Murphy Oil Co. Century Bank and Trust
John D. Hutchinson
Attorney-at-Law
Century Bank and Trust
Eric H. Beckhusen Michael D. Eddy Heather E. Eldridge
Chairman & CEO Trust Operations Officer
Eric J. WynesJared E. Hoffmaster
Jessica A. Handy
PresidentAssistant Vice President &
Commercial Loan Officer
Investment OfficerDylan M. Foster Jeffrey S. Holbrook
Senior Vice PresidentBarry R. Miller
Commercial Loan Officer
Assistant Vice President &Gaylene S. AdamsMortgage Loan Officer
AnnMarie L. Sanders
Vice President Commercial Loan Officer
Vicki R. MorrisJulie A. AndrewsAssistant Vice President &
Andrea J. Strong
Vice President & Senior Trust Officer Teller Operations Officer
Donna M. HobdayDonna L. Penick
Kathy A. Tomson
Vice PresidentAuditor
Mortgage Loan Officer
Ginger J. KeslerKatherine L. Sexton-Deck
Adam M. Wright
Vice PresidentController
Commercial Loan Officer
Ronald H. UhlCorey L. CollinsVice PresidentDeposit Services Officer
David L. WrightW. Samuel Davenport IIIVice PresidentLoan Officer
Alicia K. ColeRebecca R. DukeAssistant Vice President &Marketing DirectorTrust Officer
Century Financial Corporation
Eric H. Beckhusen Eric J. Wynes
Chairman & CEO President
DirectorsCentury Financial Corporation
Century Financial Corporation and Century Bank and Trust
Officers
Mortgage Loan Officer
Assistant Vice President &
Mortgage Loan Officer
OfficersCentury Bank and Trust
Eric H. Beckhusen Alicia K. Cole Adam M. Wright
Chairman & CEO Assistant Vice President & Assistant Vice President &
Trust Officer Commercial Loan Officer
Eric J. Wynes
President Corey L. Collins Donna L. Penick
Assistant Vice President & Deposit Auditor
Dylan M. Foster Services Officer
Senior Vice President Katherine L. Sexton-Deck
Michael D. Eddy Controller
Gaylene S. Adams Assistant Vice President &
Vice President Mortgage Loan Officer W. Samuel Davenport III
Loan Officer
Julie A. Andrews Jared E. Hoffmaster
Vice President & Senior Trust Officer Assistant Vice President & Rebecca R. Duke
Investment Officer Marketing Director
Jessica A. Handy
Vice President & Commercial Loan Jeffrey S. Holbrook Heather E. Eldridge
Officer Assistant Vice President & Trust Operations Officer
Commercial Loan Officer
Donna M. Hobday Tracy A. Richer
Vice President Barry R. Miller Trust Officer
Assistant Vice President &
Ginger J. Kesler Mortgage Loan Officer AnnMarie L. Sanders
Vice President Commercial Loan Officer
Vicki R. Morris
Ronald H. Uhl Assistant Vice President & Erik L. Schaeffer
Vice President Mortgage Loan Officer Trust Officer
David L. Wright Andrea J. Strong Kathy A. Tomson
Vice President Assistant Vice President & Mortgage Loan Officer
Teller Operations Officer
Century Financial Corporation
28
2018 HIGHLIGHTS
$75,000 +THROUGH SPONSORSHIPS AND DONATIONS
COMMUNITY SUPPORT1890YEAR CB&T WAS ESTABLISHED
11 ATMs
1 Loan Office
10 Branches
$315,567,775 TOTAL ASSETS
PRIMARY SERVICESLOANS
TRUST AND INVESTMENT MANAGEMENT GROUP
CHECKING AND SAVINGS
Business, Mortgage, Consumer
Business and Consumer
122 EMPLOYEES
BRANCH AND ATM LOCATIONS
21,026 +TOTAL DEPOSIT
ACCOUNTS
STOCK PERFORMANCE
$20.01
3.03%
Book Value per Share
Annual Dividend Return


ANNUAL REPORT2016
100 West Chicago StreetColdwater, Michigan 49036
Toll Free (866) 680-2265


