+ All Categories
Home > Documents > 2018 China Equity Market Automobile Outlook -...

2018 China Equity Market Automobile Outlook -...

Date post: 30-Jul-2018
Category:
Upload: trinhdung
View: 222 times
Download: 0 times
Share this document with a friend
23
This report is issued by Chuancai Securities Limited and must be read with the disclaimer and analyst certification in the appendix 2018 China Equity Market Automobile Outlook Equity Research Report Department Global Research Category In-depth Report Sector Automobile Rating Increase Date 2018/1/25 Analyst Li CHEN SAC Reg. NoS1100517060001 8610 - 66495901 [email protected] Peng WANG SAC Reg. NoS1100516120001 8621 - 68595118 [email protected] Hongxin SONG SAC Reg. No: S1100515060001 8610 - 66495639 [email protected] Contact Wenyi ZHOU SAC Reg. No: S1100117120006 8610 – 66495910 [email protected] Bo HUANG SAC Reg. No: S1100117080004 8621 – 68595119 [email protected] Research Division Beijing Floor 15, China Overseas International Center, 28 Pinganli West Street, Xicheng District,100034 Shanghai Floor 11, Hang Seng Building,1000 Lujiazui Ring Road, 200120 Shenzhen Floor 21, Duty-free Building, 6 Fuhua 1 st Road, Futian District, 518000 Chengdu Floor 17, Unit B, China Overseas International Center, China (Sichuan) Pilot-free Trade Zone, 610041 —— Chuancai Research 2018 Strategy Report (20180125) 2017 Review: lithium batteries and vehicle showed steady growth. As of December 27, 2017, the Shanghai Composite gained 5.55%, while the CSI 300 rose by 20.58%. The automobile sector dropped by 1.34%, outperformed by the average A-share market performance. Segment-wise, the vehicle segment performed well with an increase of 8.49%. Auto parts, auto service and other delivery equipment dropped by 3.84%, 12.99% and 26.10%, respectively. As for concept stocks, the new energy automotive segment fell by 12.60%, lithium battery rose by 9.13%, indicating that the medium-to-upper stream of new energy automotive industrial chain performed better than the whole vehicle segment. 2018: Opportunities remain for conventional vehicles. Because of the implementation of favorable policies for purchase of small- displacement vehicles, the demand for passenger vehicles have narrowed. There may be a zero growth in 2018. However, SUV sales maintained a growth rate of more than 15%, expanding market shares. With the rising trend for electric cars, new energy vehicles sales are expected to improve next year. Tightened shipping policy resulted in remarkable heavy truck sales in 2017. While sales growth might dip a little in 2018, the prosperity remains. New energy vehicles have great growth potential The development trend of new energy vehicles is irreversible. There are two underlying reasons: strong policy backup as well as new energy vehicles chasing traditional vehicles in performance and cost. The successful commercialization of Tesla models indicates that EVs have surpassed traditional cars in terms of performance, not to mention the cost of the new energy car is only 30% of that of a conventional car. The traditional automobile market is being challenged and the penetration rate of new energy vehicles will continue to enlarge. Maintain “Increase” ratingfocus on Tesla and CATL industrial chains. Tesla civilian “Model 3” started volume production in July 2017 with significant capacity ramp-up and more than 200,000 units expected to be produced and sold this year. In addition, in 2018 the Tesla localization project is expected to land, which will prompt related parts manufacturers to accelerate expansion. enterprises under CATL industrial chain is that those enterprises have strong certainty in the order. CATL has gradually developed into a leading name in battery, and built connection with a number of OEMs. In 2018 with the release of new auto models, its output will maintain rapid growth, and the upstream industry chain enterprises are expected to benefit. Risk reminder: risk related to policy change, risk related to production safety issues.
Transcript

This report is issued by Chuancai Securities Limited and must be read with the disclaimer and analyst certification in the appendix

2018 China Equity Market Automobile Outlook

Equity Research Report

Department । Global Research

Category । In-depth Report

Sector । Automobile

Rating । Increase

Date । 2018/1/25

Analyst

Li CHEN SAC Reg. No:S1100517060001

8610 - 66495901

[email protected]

Peng WANG SAC Reg. No:S1100516120001

8621 - 68595118

[email protected]

Hongxin SONG SAC Reg. No: S1100515060001

8610 - 66495639

[email protected]

Contact

Wenyi ZHOU SAC Reg. No: S1100117120006

8610 – 66495910

[email protected]

Bo HUANG SAC Reg. No: S1100117080004

8621 – 68595119

[email protected]

Research Division

Beijing Floor 15, China Overseas

International Center, 28

Pinganli West Street,

Xicheng District,100034

Shanghai Floor 11, Hang Seng

Building,1000 Lujiazui

Ring Road, 200120

Shenzhen Floor 21, Duty-free

Building, 6 Fuhua 1st Road,

Futian District, 518000

Chengdu Floor 17, Unit B, China

Overseas International

Center, China (Sichuan)

Pilot-free Trade Zone,

610041

—— Chuancai Research 2018 Strategy Report (20180125)

❖ 2017 Review: lithium batteries and vehicle showed steady growth.

As of December 27, 2017, the Shanghai Composite gained 5.55%, while the

CSI 300 rose by 20.58%. The automobile sector dropped by 1.34%,

outperformed by the average A-share market performance. Segment-wise,

the vehicle segment performed well with an increase of 8.49%. Auto parts,

auto service and other delivery equipment dropped by 3.84%, 12.99% and

26.10%, respectively. As for concept stocks, the new energy automotive

segment fell by 12.60%, lithium battery rose by 9.13%, indicating that the

medium-to-upper stream of new energy automotive industrial chain

performed better than the whole vehicle segment.

❖ 2018: Opportunities remain for conventional vehicles.

Because of the implementation of favorable policies for purchase of small-

displacement vehicles, the demand for passenger vehicles have narrowed.

There may be a zero growth in 2018. However, SUV sales maintained a growth

rate of more than 15%, expanding market shares. With the rising trend for

electric cars, new energy vehicles sales are expected to improve next year.

Tightened shipping policy resulted in remarkable heavy truck sales in 2017.

While sales growth might dip a little in 2018, the prosperity remains.

❖ New energy vehicles have great growth potential

The development trend of new energy vehicles is irreversible. There are two

underlying reasons: strong policy backup as well as new energy vehicles

chasing traditional vehicles in performance and cost. The successful

commercialization of Tesla models indicates that EVs have surpassed

traditional cars in terms of performance, not to mention the cost of the new

energy car is only 30% of that of a conventional car. The traditional

automobile market is being challenged and the penetration rate of new

energy vehicles will continue to enlarge.

❖ Maintain “Increase” rating:focus on Tesla and CATL industrial chains.

Tesla civilian “Model 3” started volume production in July 2017 with significant

capacity ramp-up and more than 200,000 units expected to be produced and

sold this year. In addition, in 2018 the Tesla localization project is expected to

land, which will prompt related parts manufacturers to accelerate expansion.

enterprises under CATL industrial chain is that those enterprises have strong

certainty in the order. CATL has gradually developed into a leading name in

battery, and built connection with a number of OEMs. In 2018 with the release

of new auto models, its output will maintain rapid growth, and the upstream

industry chain enterprises are expected to benefit.

Risk reminder: risk related to policy change, risk related to production safety

issues.

Chuancai Research

This report is issued by Chuancai Securities Limited and must be read with the disclaimer and analyst certification in the appendix

2/23

Table of Contents

I. 2017 Review: lithium batteries and vehicle showed steady growth .................................................... 4

II. 2018 Outlook: Focus on electric vehicles ......................................................................................................... 5

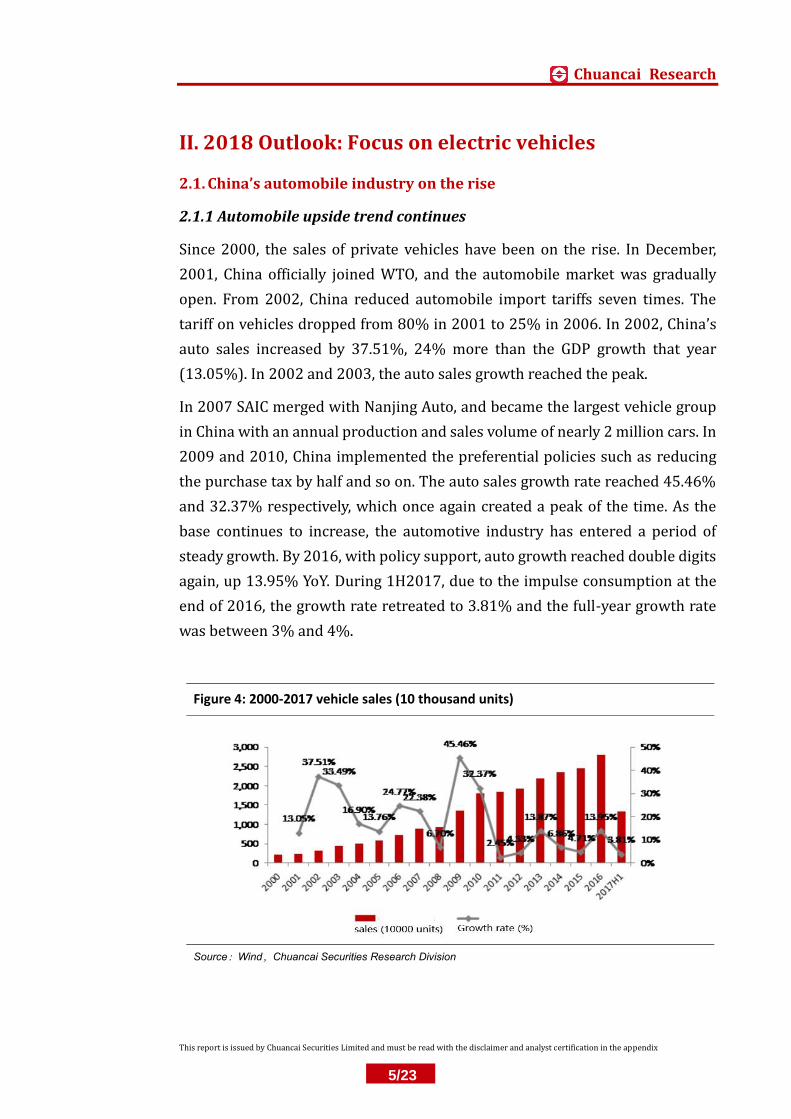
2.1. China’s automobile industry on the rise ................................................................................................. 5

2.1.1 Automobile upside trend continues ................................................................................................... 5

2.1.2 Vast market space for automobile ....................................................................................................... 6

2.1.3. National policy promoting structural change ................................................................................ 7

2.2. Differentiation of segment market ............................................................................................................ 7

2.2.2. SUV proportion on the rise .................................................................................................................... 9

2.2.3. Sales of bus on the rise ......................................................................................................................... 10

2.2.4. Heavy trucks prosperity remains .................................................................................................... 11

2.3. New energy vehicles enter a stage of high growth .......................................................................... 13

2.3.1. Policy direction from encouragement to limitation ............................................................. 13

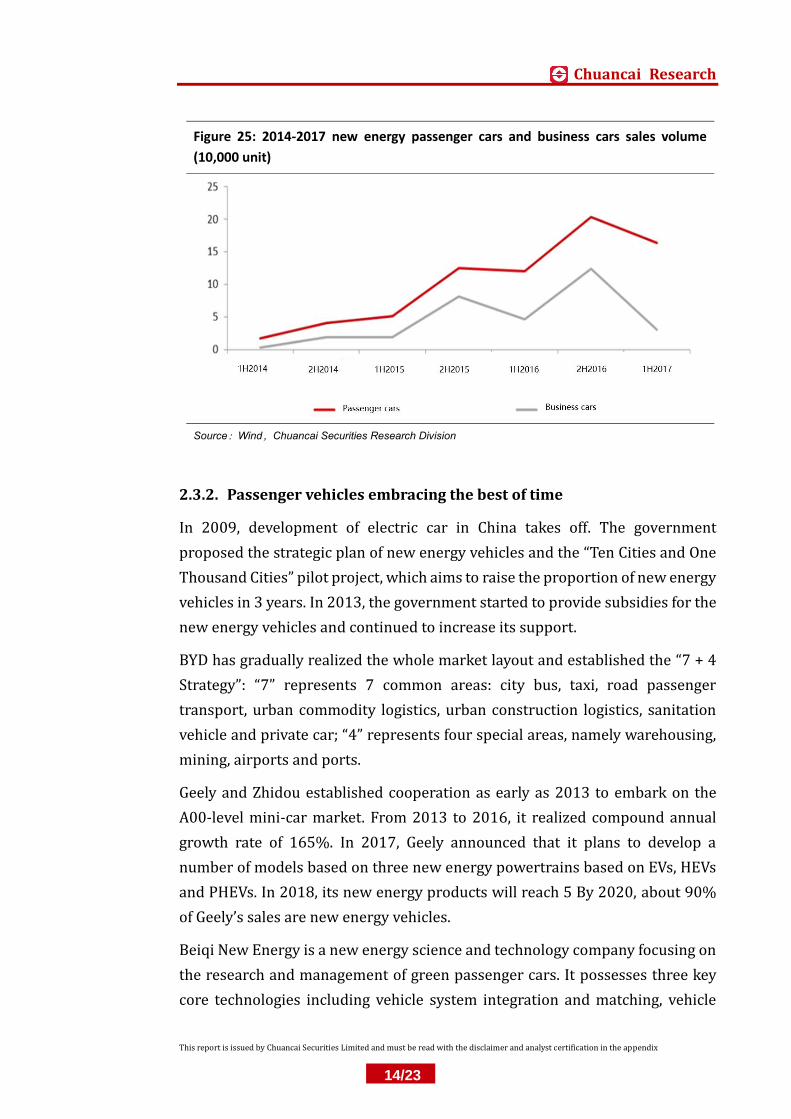
2.3.2. Passenger vehicles embracing the best of time ...................................................................... 14

III. 2018 Strategy: focus on new energy industrial chain ............................................................................ 15

3.1. The Tesla Industrial Chain ......................................................................................................................... 15

3.1.1. Tesla: history and background ....................................................................................................... 15

3.1.2. Model 3 2018 will see increased production capacity ........................................................ 16

3.1.3. The Tesla industrial chain ................................................................................................................ 17

3.2. The CATL industrial chain .......................................................................................................................... 17

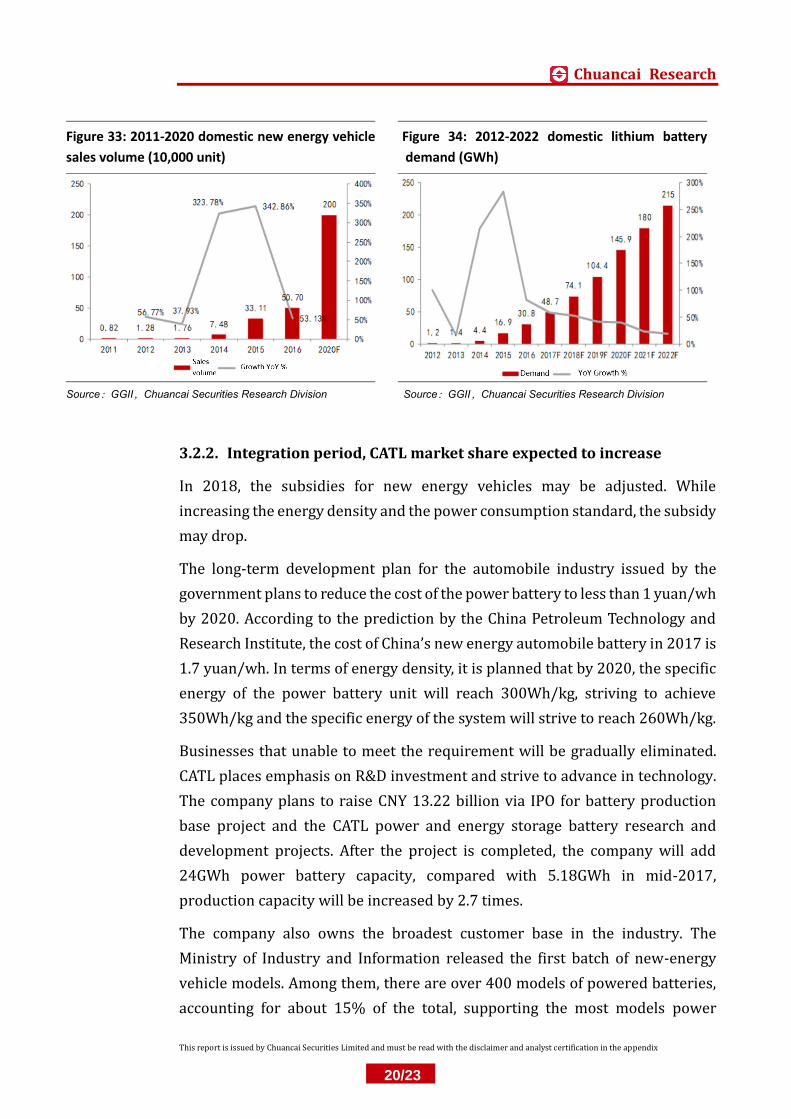
3.2.1. CATL:Rise of the power battery industrial leader ............................................................. 18

3.2.2. Integration period, CATL market share expected to increase .......................................... 20

3.2.3. Listed companies in the industrial chain .................................................................................. 21

Risk reminder .................................................................................................................................................................. 21

Chuancai Research

This report is issued by Chuancai Securities Limited and must be read with the disclaimer and analyst certification in the appendix

3/23

Table of Exhibits

FIGURE 1: AUTO OUTPERFORMED BY A-SHARE MARKET ........................................................................... 4

FIGURE 2:AUTO SECTOR DROPPED BY 1.34% ................................................................................................ 4

FIGURE 3:SECTOR RANKED 13/28 ...................................................................................................................... 4

FIGURE 4: 2000-2017 VEHICLE SALES (10 THOUSAND UNITS) ................................................................ 5

FIGURE 5: 2007-2016 VEHICLES/1000 PEOPLE (UNIT) ............................................................................... 6

FIGURE 6: AUTOMOBILE INDUSTRY ANNUAL REVENUE AS A PROPORTION OF GDP .................... 6

FIGURE 7: 2015-2017 SALES OF SELF-DEVELOPED NAMES (10,000 UNITS) ..................................... 8

FIGURE 8: SALES OF PASSENGER VEHICLES (10,000 UNITS) ..................................................................... 8

FIGURE 9: REVENUE OF 12 PASSENGER VEHICLE ENTERPRISES (CNY 0.1 BILLION)) ............... 8

FIGURE 10: NET PROFIT OF 12 PASSENGER VEHICLE ENTERPRISES (CNY 0.1 BILLION)) ....... 8

FIGURE 11: 1H16, 1H17 TOP 10 ENTERPRISES IN SALES REVENUE (10,000 UNITS) .................... 9

FIGURE 12: SEDAN SALES VOLUME (10,000 UNITS) .................................................................................... 10

FIGURE 13: PASSENGER CAR SALES VOLUME (10,000 UNITS) ............................................................... 10

FIGURE 14: SUV SALES VOLUME (10000 UNITS) ........................................................................................... 10

FIGURE 15: DIFFERENT SIZE SEDAN SALES VOLUME (10000 UNITS) ................................................ 10

FIGURE 16: HIGH SPEED RAIL WAY PASSENGER VOLUME (10,000 PERSONS) ............................... 11

FIGURE 17: HIGH SPEED RAIL WAY MILEAGE (KILOMETERS) ................................................................ 11

FIGURE 18: BUS SALES VOLUME (UNITS).......................................................................................................... 11

FIGURE 19: BUS SALES TOP 10 (100 THOUSANDS) ...................................................................................... 11

FIGURE 20: 2008-10M2017 HEAVY TRUCKS MONTHLY SALES VOLUME (10,000 UNITS) ......... 12

FIGURE 21: HEAVY TRUCKS SALES (UNIT) ....................................................................................................... 12

FIGURE 22: MEDIUM-SIZED TRUCK SALES (UNIT) ....................................................................................... 12

FIGURE 23: LIGHT TRUCK SALES VOLUME (UNIT) ....................................................................................... 13

FIGURE 24: MINI TRUCK SALES VOLUME (UNIT) .......................................................................................... 13

FIGURE 25: 2014-2017 NEW ENERGY PASSENGER CARS AND BUSINESS CARS SALES .............. 14

FIGURE 26: 2014-2017 NEW ENERGY VEHICLES MONTHLY SALES VOLUME (10,000 UNIT) .. 15

FIGURE 27: 2012-2016 NEW ENERGY VEHICLES ANNUAL SALES VOLUME (10,000 UNIT) ..... 15

FIGURE 28: 2014-2017 NEW ENERGY VEHICLES MONTHLY SALES VOLUME (UNIT).................. 17

FIGURE 29: NEW ENERGY VEHICLE ENTERPRISES SALES VOLUME (UNIT) .................................... 17

FIGURE 30: 2014-2017H1 REVENUE OF DIFFERENT PRODUCTS ......................................................... 18

FIGURE 31: 2016 POWER BATTERY MARKET SHARE (SALES) ............................................................... 19

FIGURE 32: 2H2017 POWER BATTERY OUTPUT RATIO ............................................................................. 19

FIGURE 33: 2011-2020 DOMESTIC NEW ENERGY VEHICLE SALES VOLUME (10,000 UNIT) ... 20

FIGURE 34: 2012-2022 DOMESTIC LITHIUM BATTERY DEMAND (GWH) ......................................... 20

TABLE 1: TESLA MODELS .......................................................................................................................................... 16

TABLE 2: 2016 POWER BATTERY SALES TOP 10 ENTERPRISES ............................................................ 19

TABLE 3: VEHICLE ENTERPRISES AND RECOMMENDED COMPANIES................................................ 21

Chuancai Research

This report is issued by Chuancai Securities Limited and must be read with the disclaimer and analyst certification in the appendix

4/23

I. 2017 Review: lithium batteries and vehicle showed steady

growth

As of December 27, 2017, the Shanghai Composite gained 5.55%, the CSI 300

rose by 20.58%. The automobile sector dropped by 1.34%, weaker than the

average performance of A-share market.

Figure 1: Auto outperformed by A-share market Figure 2:Auto sector dropped by 1.34%

Source:Wind,Chuancai Securities Research Division Source:Wind,Chuancai Securities Research Division

Segment-wise, the vehicle segment performed well with an increase of 8.49%.

Auto parts, auto service and other delivery equipment dropped by 3.84%,

12.99% and 26.10%, respectively. As for concept stocks, the new energy

automotive segment fell by 12.60%, lithium battery rose by 9.13%, indicating

that the medium-to-upper stream of new energy automotive industrial chain

performed better than the whole vehicle segment.

Figure 3:Sector ranked 13/28

Source:Wind,Chuancai Securities Research Division

Chuancai Research

This report is issued by Chuancai Securities Limited and must be read with the disclaimer and analyst certification in the appendix

5/23

II. 2018 Outlook: Focus on electric vehicles

2.1. China’s automobile industry on the rise

2.1.1 Automobile upside trend continues

Since 2000, the sales of private vehicles have been on the rise. In December,

2001, China officially joined WTO, and the automobile market was gradually

open. From 2002, China reduced automobile import tariffs seven times. The

tariff on vehicles dropped from 80% in 2001 to 25% in 2006. In 2002, China’s

auto sales increased by 37.51%, 24% more than the GDP growth that year

(13.05%). In 2002 and 2003, the auto sales growth reached the peak.

In 2007 SAIC merged with Nanjing Auto, and became the largest vehicle group

in China with an annual production and sales volume of nearly 2 million cars. In

2009 and 2010, China implemented the preferential policies such as reducing

the purchase tax by half and so on. The auto sales growth rate reached 45.46%

and 32.37% respectively, which once again created a peak of the time. As the

base continues to increase, the automotive industry has entered a period of

steady growth. By 2016, with policy support, auto growth reached double digits

again, up 13.95% YoY. During 1H2017, due to the impulse consumption at the

end of 2016, the growth rate retreated to 3.81% and the full-year growth rate

was between 3% and 4%.

Figure 4: 2000-2017 vehicle sales (10 thousand units)

Source:Wind,Chuancai Securities Research Division

Chuancai Research

This report is issued by Chuancai Securities Limited and must be read with the disclaimer and analyst certification in the appendix

6/23

2.1.2 Vast market space for automobile

The automobile development worldwide shows that the level of car ownership

in each country is closely related to their stages of economic development. In

the initial stage of economic development, the per capita automobile ownership

is relatively low. At this time, demand for automobiles is mainly reflected in the

demand for trucks and passenger cars. In the second stage, as economic growth

accelerates, demand for automobiles also grow rapidly. In the third stage, after

a certain period of rapid growth, the per capita income reached a certain level.

More private cars are owned by families and the per capita car ownership

increased vigorously. In the third stage, the auto market is likely to be saturated

after the car penetration rate reached a higher level. Then the demand elasticity

of the car is close to 1.

Currently, China is still in the second stage of economic development. The

number of vehicles owned/1000 persons is still below the global average, while

the revenue from the automobile industry as a percentage of GDP is still growing.

In this light, China’s auto industry is still expanding and the market potential is

still vast. With the gradual maturity of new energy vehicles, people’s travel

patterns, the development of the automotive industry will show structural

features.

Figure 5: 2007-2016 vehicles/1000 people (unit) Figure 6: automobile industry annual revenue as a

proportion of GDP(100 million)

Source:Wind,Chuancai Securities Research Division Source:Wind,Chuancai Securities Research Division

0

20

40

60

80

100

120

140

160

2007 2008 2009 2010 2011 2012 2013 2014 2015 2016

每千人保有量

0%

2%

4%

6%

8%

10%

12%

0

10000

20000

30000

40000

50000

60000

70000

80000

90000

行业收入 行业收入占GDP比重(右)

Chuancai Research

This report is issued by Chuancai Securities Limited and must be read with the disclaimer and analyst certification in the appendix

7/23

2.1.3. National policy promoting structural change

Since 2015, China have promulgated a series of policies on automobile industry,

pointing out the direction for China’s automobile development. On one hand, the

policies suggest that energy-saving and emission reduction are crucial to

traditional cars and the authority will gradually raise the standard. On the other,

the country is establishing a long-term mechanism to promote new energy

vehicles. It is estimated that the sales volume of new energy vehicles in 2017

will reach 700 thousand units, accounting for about 3% of the total sales volume

of automobiles nationwide and embark on a stage of rapid growth. Automobile

industry is going through fundamental structural change, while the traditional

car market keeps steady growth, the new energy vehicle is quickly expanding

the new market.

2.2. Differentiation of segment market

2.2.1 Sales of domestically-developed cars slowdown

In the year of 2015 and 2016, the sales of passenger cars in China were 8699

and 10504 thousand units, up 15.26%YoY and 20.75%YoY respectively, far

exceeding the growth of the total sales of automobiles (4.71% and 13.95%) in

China. In 1-10M of 2017, the sales volume of self-owned vehicles increased by

3.31%YoY, corresponding to the growth rate of the total sales volume of

automobiles, indicating that the growth of independent auto companies has

slowed down.

As for joint ventures and imported cars, South Korean vehicles saw the greatest

drop, with rapidly shrinking market shares; by introduction of new models and

expanding SUV market, the Japanese vehicle names rebounded. Imported cars

from other countries all witness declines to certain extent, where French names

slide in market shares.

Chuancai Research

This report is issued by Chuancai Securities Limited and must be read with the disclaimer and analyst certification in the appendix

8/23

Figure 7: 2015-2017 sales of self-developed names

(10,000 units) Figure 8: Sales of passenger vehicles (10,000 units)

Source:Wind,Chuancai Securities Research Division Source:Wind,Chuancai Securities Research Division

Figure 9: revenue of 12 passenger vehicle

enterprises (CNY 0.1 billion))

Figure 10: net profit of 12 passenger vehicle

enterprises (CNY 0.1 billion))

Source:Wind,Chuancai Securities Research Division Source:Wind,Chuancai Securities Research Division

In terms of manufacturers, in 1H17 among the top 10 manufacturers of

passenger vehicles, 7 were joint venture manufacturers. While sales of other

joint venture dropped to some degrees except for FAW Toyota and Dongfeng

Nissan. As for domestic brands, because of Bo Yue, the new imperial throne

sedan, Vision, Imperial GS and other hot models, Geely Automobile soared (up

76.4% YoY).

From the market share standpoint, FAW-Volkswagen, SAIC-Volkswagen, SAIC-

GM three joint venture manufacturers ranked top three, with sales of more than

700,000 units, followed by the SAIC-GM-Wuling and Geely Automobile.

Chuancai Research

This report is issued by Chuancai Securities Limited and must be read with the disclaimer and analyst certification in the appendix

9/23

Figure 11: 1H16, 1H17 Top 10 enterprises in sales revenue (10,000 units)

Source:Wind,Chuancai Securities Research Division

2.2.2. SUV proportion on the rise

The share of sedan in total passenger cars sales continued to decline from 2011

to 2017, with a cumulative decline of 32.8% in six and a half years. The MPV

share of sales reached the highest level of 10.7% in 1H16.

In 1-10M17, the total sales of passenger cars decreased by 1.82%YoY. In 2016,

the sales tax was only 3.77% higher than the same period of last year due to the

policy that reducing purchase tax by half. In 2015, the sales volume dropped by

5.48%YoY.

In 1-10M17, the sales of SUVs increased by 16.78%YoY, representing a

significant slowdown of over 40% from 2014/2015. However, the share of SUVs

in the passenger car market will continue to rise.

In the sedan market, the sales of large-sized and medium-sized vehicles

achieved positive growth YoY in 1H17 as compared with the same period of last

year with the number of 40,000 and 323,000, up 42.9%YoY and 27.2%YoY,

respectively. However other models showed a year-on-year decline, where 2.97

million and 446,000 were medium-sized cars and mini-cars respectively, down

14.8%YoY and 32.2%YoY respectively.

Chuancai Research

This report is issued by Chuancai Securities Limited and must be read with the disclaimer and analyst certification in the appendix

10/23

Figure 12: Sedan sales volume (10,000 units) Figure 13: Passenger car sales volume (10,000 units)

Source:Wind,Chuancai Securities Research Division Source:Wind,Chuancai Securities Research Division

Figure 14: SUV sales volume (10000 units) Figure 15: different size sedan sales volume (10000

units)

Source:Wind,Chuancai Securities Research Division Source:Wind,Chuancai Securities Research Division

2.2.3. Sales of bus on the rise

From 2008 to 2016, the business mileage of high-speed rail soared from 671.5

kilometers to 22,000 kilometers with an average CAGR of 54.68%. The

passenger traffic of high-speed rail increased from 7.34 million to 1,221 million

with a CAGR of 89.51%. Passenger car sales have been declining since 2015, but

sales for 1-10M17 decreased by 6.67% YoY, representing a decrease of 8.73%

compared to 2016.

In terms of sales, top 10 names are Baoding Changan, Jiangling Holdings and

Zhongtong Bus increased by 52.48%, 22.66% and 15.91% respectively over the

Chuancai Research

This report is issued by Chuancai Securities Limited and must be read with the disclaimer and analyst certification in the appendix

11/23

same period of the previous year. JMC held the first place in sales volume and

the gap with the second place continued to widen and its market share reached

18%.

Figure 16: High speed rail way passenger volume

(10,000 persons) Figure 17: High speed rail way mileage (kilometers)

Source:Wind,Chuancai Securities Research Division Source:Wind,Chuancai Securities Research Division

Figure 18: Bus sales volume (units) Figure 19: Bus sales top 10 (100 thousands)

Source:Wind,Chuancai Securities Research Division Source:Wind,Chuancai Securities Research Division

2.2.4. Heavy trucks prosperity remains

Since July 2017, all heavy trucks must comply with the emission standards set

out in the national emission reduction guidelines before they get registered. The

sales of heavy trucks peaked in 2010; given their usually 7 to 8 years of service

time, most heavy trucks purchased around 2010 have to be replaced. In 1-

10M2017 the sales volume of heavy trucks reached 960,000 units, an increase

of 71%YoY. While the growth rate may slow down a little bit in 2018, the

Chuancai Research

This report is issued by Chuancai Securities Limited and must be read with the disclaimer and analyst certification in the appendix

12/23

prosperity remains.

Figure 20: 2008-10M2017 heavy trucks monthly sales volume (10,000 units)

Source:Wind,Chuancai Securities Research Division

Driven by sales of heavy truck, in 1-10M17 the revenue increased by 21.30%YoY.

In addition, the sales volume of medium and light trucks increased by

15.36%YoY and 10.50%YoY, respectively. While the sales of micro-car decreased

by 4.09% as compared with the same period of last year.

Figure 21: Heavy trucks sales (unit) Figure 22: Medium-sized truck sales (unit)

Source:Wind,Chuancai Securities Research Division Source:Wind,Chuancai Securities Research Division

Chuancai Research

This report is issued by Chuancai Securities Limited and must be read with the disclaimer and analyst certification in the appendix

13/23

Figure 23: Light truck sales volume (unit) Figure 24: Mini truck sales volume (unit)

Source:Wind,Chuancai Securities Research Division Source:Wind,Chuancai Securities Research Division

2.3. New energy vehicles enter a stage of high growth

The development trend of new energy vehicles is irreversible. There are two

underlying reasons: strong policy backup as well as new energy vehicles chasing

traditional vehicles in performance and cost. The successful commercialization

of Tesla models indicates that EVs have surpassed traditional cars in terms of

performance, regardless of cost of the new energy car is only 30% of that of a

conventional car. The traditional automobile market is being challenged and the

penetration rate of new energy vehicles will continue to enlarge.

2.3.1. Policy direction from encouragement to limitation

The development of the new energy automobile industry is highly correlated

with national policy. By learning from the experience of Europe (primarily

restrictive policies) and the U.S. (mostly supportive policies), from 2009 to 2015

China implemented a series of restrictive industrial planning policies as well as

subsidy policies to encourage the development of the new energy sector.

After a short period of recession in 2016, the new energy auto segment resumed

its prosperity due to the release of policies that strives to foster the healthy

development of the industry. From 2014 to 2016, the sales volume of new

energy vehicles showed overall rapid growth. By the end of 2016, the CAGR of

passenger vehicles reached 135.41%.

Chuancai Research

This report is issued by Chuancai Securities Limited and must be read with the disclaimer and analyst certification in the appendix

14/23

Figure 25: 2014-2017 new energy passenger cars and business cars sales volume

(10,000 unit)

Source:Wind,Chuancai Securities Research Division

2.3.2. Passenger vehicles embracing the best of time

In 2009, development of electric car in China takes off. The government

proposed the strategic plan of new energy vehicles and the “Ten Cities and One

Thousand Cities” pilot project, which aims to raise the proportion of new energy

vehicles in 3 years. In 2013, the government started to provide subsidies for the

new energy vehicles and continued to increase its support.

BYD has gradually realized the whole market layout and established the “7 + 4

Strategy”: “7” represents 7 common areas: city bus, taxi, road passenger

transport, urban commodity logistics, urban construction logistics, sanitation

vehicle and private car; “4” represents four special areas, namely warehousing,

mining, airports and ports.

Geely and Zhidou established cooperation as early as 2013 to embark on the

A00-level mini-car market. From 2013 to 2016, it realized compound annual

growth rate of 165%. In 2017, Geely announced that it plans to develop a

number of models based on three new energy powertrains based on EVs, HEVs

and PHEVs. In 2018, its new energy products will reach 5 By 2020, about 90%

of Geely’s sales are new energy vehicles.

Beiqi New Energy is a new energy science and technology company focusing on

the research and management of green passenger cars. It possesses three key

core technologies including vehicle system integration and matching, vehicle

Chuancai Research

This report is issued by Chuancai Securities Limited and must be read with the disclaimer and analyst certification in the appendix

15/23

control system and electric drive system.

Top 10 Auto makers that prevailed in sales volume in 2016 have mapped out

ambitious goals in the fields of cars and SUVs. As of November 2017, sales of

new energy passenger cars exceeded 400,000 units. In the future, with favorable

policy on new energy taxis, service vehicles and business vehicles, we expect

that the growth of new energy passenger vehicles will exceed 50% in 2018.

Figure 26: 2014-2017 new energy vehicles monthly

sales volume (10,000 unit)

Figure 27: 2012-2016 new energy vehicles annual

sales volume (10,000 unit)

Source:Wind,Chuancai Securities Research Division Source:Wind,Chuancai Securities Research Division

III. 2018 Strategy: focus on new energy industrial chain

3.1. The Tesla Industrial Chain

The primary reason for recommending Tesla industrial chain is that its

downstream enterprises is not subject to subsidy reduction. Tesla civilian

“Model 3” will start volume production in July 2017 with significant capacity

ramp-up and more than 200,000 units expected to be produced and sold next

year. In addition, next year Tesla localization project is expected to land, which

will prompt related parts manufacturers to accelerate expansion.

3.1.1. Tesla: history and background

Founded in 2003, Tesla is an electric vehicle manufacturing company

headquartered in California in the U.S. The cutting-edge company is also

engaged in the design and development of solar panels and energy storage

equipment. Since its foundation, Tesla has focused on the development and

Chuancai Research

This report is issued by Chuancai Securities Limited and must be read with the disclaimer and analyst certification in the appendix

16/23

production of high-end electric vehicles. In 2008, it lunched the high-end

electric sports car Roadster, initiating a trend of electric vehicles. In 2012, Tesla's

luxury model, Model S, was officially launched to prove to the world that EVs

could outperform conventional luxury sedans.

In 2015, Tesla luanched the SUV model, which greatly enriched the Tesla product

line. With the volume production of Model 3, Tesla completed the “three-step”

strategy and the production of a highly cost-effective vehicle that could be

accepted by middle class households.

Table 1: Tesla Models

Roadster Model S Model X Model 3

Launch date Feb 2008 Nov 2011 Feb 2012 Apr 2016

Market positioning High end Medium-to-

high end

Medium-to-

high end

Low-to

medium end

Model Sports car Coupe SUV Sedan

Price($10,000) 10.9 7-12 8-12 3.5-4.4

Endurance

mileage(km)

320 410-530 380-470 345

Power battery type 18650 LCO 18650 NCA 18650 NCA 21700 NCA

0-100km/h (s) 3.7 2.5-5.5 2.9-6.0 5.2

Source:Internet open data,Chuancai Securities Research Division

3.1.2. Model 3 2018 will see increased production capacity

From 1-10M17, Tesla sold 78,000 vehicles, ranking the second worldwide after

BYD, accounting for 8.78% of the world’s total sales of new energy vehicles.

Recently, Tesla announced that the production of Model 3 will reach 5,000

vehicles a week by March 2018 and over 200,000 vehicles by 2018. We think

that the future of its supply chain is worth attention.

Chuancai Research

This report is issued by Chuancai Securities Limited and must be read with the disclaimer and analyst certification in the appendix

17/23

Figure 28: 2014-2017 new energy vehicles monthly

sales volume (unit)

Figure 29: new energy vehicle enterprises sales

volume (unit)

Source:Gasgoo,Chuancai Securities Research Division Source:Gasgoo,Chuancai Securities Research Division

3.1.3. The Tesla industrial chain

SANHUA INTELLIGENT CONTROLS (002050.SZ): Sanhua Automobile Co., Ltd.

has strong parts production capabilities and supports many companies such as

Tesla, Geely and Nio. The heat pump air conditioner has the core technology and

is suitable for use in new energy vehicles.

Hongfa Technology (600885.SH):HVDC relay market has developed rapidly,

the company’s products have entered the Tesla supply chain, and cooperation

with CATL. Low-voltage relay is expected to expand the high-end market.

LianChuang Electronic Technology (002036.SZ):Its car lens is applied in the

Model 3, becoming a new profit growth point; It build in depth cooperation with

the BOE in touch screen, which is expected to see volume growth.

Ningbo Huaxiang Electronic (002048.SZ): One of the reorganization targets

The United States NEC to Tesla supporting aluminum trim; involved in the

acquisition of Nissan's soft battery AESC company, hair force flexible battery

area; internal and external business steady growth, market share is expected to

further improve.

3.2. The CATL industrial chain

The reason for recommending enterprises under CATL industrial chain is that

those enterprises have strong certainty in the order. CATL has gradually

developed into a leading name in battery, and built connection with a number of

OEMs. In 2018 with the release of new auto models, its output will maintain

rapid growth, and the upstream industry chain enterprises are expected to

Chuancai Research

This report is issued by Chuancai Securities Limited and must be read with the disclaimer and analyst certification in the appendix

18/23

benefit. Putailai New Energy Technology (603659.SH), Tungsten (600549.SH),

GEM (002340.SZ), and Tinci Materials Technology (002709.SZ).

3.2.1. CATL:Rise of the power battery industrial leader

CATL is currently involved in the areas including new energy power battery

systems, energy storage battery systems and lithium battery recycling business.

From 2014 to 2016, the revenue was CNY 8.67 billion, CNY 5.703 billion and CNY

14.879 billion, respectively, with a CAGR of 314.31%. Net profit was 56 million

yuan, 951 million yuan and 3.089 billion yuan respectively, with a CAGR of

642.70%. The Company evenue mainly came from the sales of power battery

systems. In the first half of 2014-2017, its revenue accounted for more than 87%

of its revenue from its main business.

Figure 30: 2014-2017H1 revenue of different products

Source:company announcements,Chuancai Securities Research Division

From the sales perspective, in 2016 the company power battery system sales

6.80GWh, the third in the world, the second in the country, from the sales point

of view, the first in the country, the market share of 23.30%. In the first half of

2017, the sales volume was 3.51GWh, ranking first in the country.

Chuancai Research

This report is issued by Chuancai Securities Limited and must be read with the disclaimer and analyst certification in the appendix

19/23

Table 2: 2016 power battery sales top 10 enterprises

Ranking Enterprise Country Sales(GWh)

1 Panasonic Japan 7.20

2 BYD China 7.10

3 CATL China 6.80

4 OptimumNano China 3.20

5 LG South Korea 2.53

6 Guoxuan High-tech China 2.40

7 Lishen China 1.80

8 CBAK China 1.30

9 Samsung SDI South Korea 1.07

10 CALB China 0.70

Source:company announcement,Chuancai Securities Research Division

Figure 31: 2016 power battery market share (sales) Figure 32: 2H2017 power battery output ratio

Source:company announcement,Chuancai Research Source:GGII,Chuancai Research

In 2016, China sold 507,000 new-energy vehicles, up 53.13%YoY. In April

2017, the Ministry plans to sell 2 million units by 2020, a CAGR of 141%.

Automotive power lithium battery production was 30.8GWh, an increase of

82.2%. GGII predicts that China’s automotive lithium battery production will

reach 215GWh by 2022, a CAGR of 138% compared with that in 2016.

Chuancai Research

This report is issued by Chuancai Securities Limited and must be read with the disclaimer and analyst certification in the appendix

20/23

Figure 33: 2011-2020 domestic new energy vehicle

sales volume (10,000 unit)

Figure 34: 2012-2022 domestic lithium battery

demand (GWh)

Source:GGII,Chuancai Securities Research Division Source:GGII,Chuancai Securities Research Division

3.2.2. Integration period, CATL market share expected to increase

In 2018, the subsidies for new energy vehicles may be adjusted. While

increasing the energy density and the power consumption standard, the subsidy

may drop.

The long-term development plan for the automobile industry issued by the

government plans to reduce the cost of the power battery to less than 1 yuan/wh

by 2020. According to the prediction by the China Petroleum Technology and

Research Institute, the cost of China’s new energy automobile battery in 2017 is

1.7 yuan/wh. In terms of energy density, it is planned that by 2020, the specific

energy of the power battery unit will reach 300Wh/kg, striving to achieve

350Wh/kg and the specific energy of the system will strive to reach 260Wh/kg.

Businesses that unable to meet the requirement will be gradually eliminated.

CATL places emphasis on R&D investment and strive to advance in technology.

The company plans to raise CNY 13.22 billion via IPO for battery production

base project and the CATL power and energy storage battery research and

development projects. After the project is completed, the company will add

24GWh power battery capacity, compared with 5.18GWh in mid-2017,

production capacity will be increased by 2.7 times.

The company also owns the broadest customer base in the industry. The

Ministry of Industry and Information released the first batch of new-energy

vehicle models. Among them, there are over 400 models of powered batteries,

accounting for about 15% of the total, supporting the most models power

Chuancai Research

This report is issued by Chuancai Securities Limited and must be read with the disclaimer and analyst certification in the appendix

21/23

battery manufacturers. Domestic vehicle manufacturers with long-term

strategic cooperation include Yutong Group, SAIC, BAIC Group, Geely Group,

Fuqi Group, Hunan Zhonghua Automobile Co., Ltd., Dongfeng Group and

Changan Group. In addition, they have entered the world-class auto companies

such as BMW and Volkswagen Supply system.

3.2.3. Listed companies in the industrial chain

Table 3: Vehicle enterprises and recommended companies Ticker Name Closing

price (CNY)

Market value (CNY

100 mn)

EPS PE 2017E 2018E 2019E 2017E 2018E 2019E

600104.SH SAIC Motor 31.16 3,640.57 3.06 3.36 3.68 10.19 9.27 8.47

002594.SZ BYD 67.11 1,830.86 2.22 3.19 4.20 30.21 21.05 15.99

600066.SH YTCO 23.99 531.12 1.76 2.06 2.25 13.63 11.62 10.68

000957.SZ Zhongtong 11.59 68.72 0.70 1.08 1.24 16.58 10.70 9.31

600686.SH Xiamen King

Long Motor 13.03 79.06 0.58 0.77 0.92 22.34 16.82 14.23

601238.SH Guangzhou

auto 24.41 1,777.67 1.54 1.91 2.27 15.86 12.76 10.75

002050.SZ Sanhua

intelligent 18.10 383.78 0.56 0.69 0.82 32.09 26.36 21.97

600885.SH Hongfa Tech 42.20 224.49 1.41 1.78 2.20 29.97 23.75 19.17

002036.SZ Lianchuang 16.06 89.62 0.57 0.90 1.24 28.20 17.82 12.91

002048.SZ Ningbo

Electronics 23.81 126.20 1.43 1.76 2.17 16.61 13.49 11.00

603659.SH Putailai new

technology 59.04 255.47 1.20 1.65 2.18 49.19 35.81 27.07

600549.SH Tungsten 24.72 268.61 0.76 1.00 1.33 32.60 24.78 18.56

002340.SZ Gem 7.03 268.26 0.17 0.24 0.33 42.48 29.61 21.47

002709.SZ Tinci 46.20 156.93 1.19 1.71 2.25 39 27 21

Source:Wind,Chuancai Research (Closing price as of Dec 27,2017)

Risk reminder

Risk related to policy change, risk related to production safety issues.

Chuancai Research

This report is issued by Chuancai Securities Limited and must be read with the disclaimer and analyst certification in the appendix

22/23

Analyst Certification

I am conferred the Professional Quality of Securities Investment Consultant Industry by the Securities Association of China and have registered as the

Securities Analysts. I hereby issue this document independently and objectively with due diligence, professional and prudent research methods and

only legitimate information is used in this report. I hereby certify that the opinions expressed in this document accurately reflect my personal views

about the subject securities or issuers referred to herein. I have never been, am not, and will not be compensated directly or indirectly in any form for

the specific recommendations or opinions herein.

Explanation of Ratings

Explanation of stock ratings: “BUY” indicates analyst perceives absolute return of 30% or more over the next 6 months; “Increase” between 15%

and 30%, “Neutral” between -15% and 15%;“SELL” -15% and below.

Explanation of sector ratings: Analyst expects a sector rated “OVERWEIGHT” to outperform the market by 30% or more over the next 6 months,

“Increase” between 15% and 30%, “Neutral” to end up between -15% and +15%, and “UNDERWEIGHT” to fall behind the market by 15% or more,

over the next 6 months.

Important Disclaimer

This document has been issued by Chuancai Securities Limited for the information of its clients only. The Company will not regard unauthorized

recipients of this document as its clients. The document remains confidential unless publicly disclosed or authorized by the Company. Anyone who

receives the document by mistake should return and delete the document immediately and keep the information confidential.

Chuancai Securities Limited has based this document on information obtained from sources it believes to be reliable and publicly available, no

guarantee, representation or warranty is made as to its correctness, accuracy or completeness. The information herein reflects the opinions,

speculations and forecasts at the time of the document’s production and publication, and are subject to change without notice. At different periods,

Chuancai Securities Limited may release documents which are inconsistent with the opinions, speculations and forecasts contained herein. The price,

value and investment income of the securities or investment targets mentioned herein may move up and down. Chuancai Securities Limited makes no

guarantee that information included herein is the most up-to-date. In terms of analysis, comments or opinions produced by professionals (including

but not limited to salespeople, traders) from Chuancai Securities, which are based upon different speculations, research methods, updated information

and market performance, and are inconsistent with information herein, Chuancai Securities Limited has no obligation to provide updates for recipients

of this document.

Chuancai Securities Limited strives for objectivity and fairness of this document, but the opinions, conclusions and recommendations provided herein

are for investors’ reference only and shall not be construed as an offer, invitation or solicitation to buy or sell securities mentioned. Such opinions and

recommendations do not take into account individual investment objectives, financial situation and particular needs of the recipients of the document.

Under no circumstances shall the information contained herein or the opinions expressed herein constitute a personal recommendation to anyone.

According to the Product or Service Risk Level Assessment Management Approach of the Company, reports about listed companies’ value are rated

medium to low risk, while reports on micro-strategy, industrial research and others are rated low risk. Investors should consider their own particular

situations, understand and make wise use of the document and do not perceive it as the only factor for investment decision. And all investors are

advised to consult with their tax, accounting, or legal advisers regarding any potential investment.

Chuancai Securities Limited and/or analyst(s) of the document, within their knowledge, do not have conflict of interest that is prohibited by law with

securities and underlying assets mentioned in the document. Investors should be aware that Chuancai Securities Limited and/or its associated persons

may have a conflict of interest that could affect the objectivity of this document. Chuancai Securities Limited and the Relevant Parties may, to the extent

permitted by law, from time to time participate or invest in financing transactions with the securities of the company(ies) mentioned in this document,

provide services for or solicit business from such company(ies), and/or have a position or holding, or other material interest, or effect transactions, in

such securities or options thereon, or other investments related thereto. The investing businesses of Chuancai Securities Limited may make investment

decisions that are inconsistent with the recommendations and opinions expressed in this document.

Chuancai Securities Limited is not accountable for content materials from website addresses and links included in this document. Content from

webpage links does not constitutes a part of this document and website links are included solely for the purpose of recipients’ convenience. Recipients

of this document are responsible for the expenses and/or risks incurred by browsing these websites included herein.

Notices of this document (include but not limited to communications via phone call, text message, email, WeChat, Weibo, Blog, QQ, Video website,

Baidu Post Bar, Forum and BBS) are simply abstracts of the opinions expressed in this document. Investors should refer to the complete version of this

document in order for reference or usage.

Copyright of this report belongs to Chuancai Securities Limited. Any form of unauthorized distribution, reproduction, publication, release or quotation

is prohibited without Chuancai Securities Limited’s written permission. Authorized quotation and publication should be strictly used in places that

are permitted, with reference included as “Chuancai Securities Research Division”. Abridgement, modification and reference that are against the

original purpose of the document is prohibited. Any reproduction, redistribution and/or publishing of this document and/or any part of it without the

prior written consent of Chuancai Securities Limited are strictly prohibited.

Under no circumstance should this document replace recipients’ own independent investment judgement. Neither could the document reduce the

inherited risk of the related products and/or services, nor could it guarantee income from investment of any form. It is the recipient’s own

responsibility to evaluate investment risk, performance obligation and expenses related to financial products or services, and consequences thereof.

Chuancai Securities Limited has acquired “Securities Investment Consultation Qualification” conferred by China Securities Regulatory Commission,

reference No.11080000.

Chuancai Research

This report is issued by Chuancai Securities Limited and must be read with the disclaimer and analyst certification in the appendix

23/23

Chuancai Securities Limited

Established in 1988, Chuancai Securities Co., Ltd. was approved by the China Securities

Regulatory Commission and was the country’s first professional securities company

restructured from a government bonds intermediary agency. After 30 years of growth and

transformation, the company has now developed into a fully licensed securities company

jointly owned by China Huadian Capital Holdings Co., Ltd., Sichuan State-owned Assets

Operation and Management Administrator Co., Ltd., and other large Chinese enterprises with

strong capital.

Chuancai Research Division

Chuancai Securities Research Division has dedicated teams covering a wide range of markets

and issues including Macro Research, Industry Research, Equity Research, Financial

Engineering, Fixed-income Research and Global Market Research. Located in Beijing, Shanghai,

Shenzhen and Chengdu, our Research Division has four offices nationwide, multiple financial

market star analysts and the whole industry coverage. We are committed to providing

policymakers, institutional investors and enterprises with professional analysis, consulting,

research, expertise, conferences and other related services as well as wealth management and

other integrated solutions, with the goal of becoming a multi-channel, multi-level and all-round

mainstream brokerage research institute.

Global Market Research Department

Chuancai Securities Global Market Research Department is dedicated to providing global

investors with high-quality research and services based in China. For domestic investors, we

prepare the “selected global research” where we introduce in-depth analysis of world’s top

investment institutions to throw light upon key issues affecting the trend of China’s capital

market. We also incorporate international institutions’ judgment on China’s economy and

financial markets, research on industries as well as unique investment idea and framework for

domestic investors’ information. In addition, our research on the asset allocation of the world’s

major financial markets helps global investors to understand the macro-strategies, industries

and stocks in the Chinese market and provide global investors with coverage of China A-Shares,

Hong Kong and other Asia-Pacific markets, as well as expert meeting and industry research

services related to China’s A-share companies.


Recommended