22
ound_3 5 TRA Bank Name Lloyds Banking Group Plc LEI Code 549300PPXHEU2JF0AM85 Country Code GB Ll 2018 EU-wide Transparency Exercise

Round_3
Master_version_2015 TRA Templates 26102015Bank Name Lloyds Banking Group Plc
LEI Code 549300PPXHEU2JF0AM85
Country Code GB
Ll
2018 EU-wide Transparency Exercise

201712 201806
(mln EUR, %)As of 31/12/2017 As of 30/06/2018 COREP CODE REGULATION
A OWN FUNDS 50,338 51,447 C 01.00 (r010,c010) Articles 4(118) and 72 of CRR
A.1COMMON EQUITY TIER 1 CAPITAL (net of deductions and after applying
transitional adjustments)33,417 33,626 C 01.00 (r020,c010) Article 50 of CRR
A.1.1Capital instruments eligible as CET1 Capital (including share premium and net own capital
instruments)27,955 28,080 C 01.00 (r030,c010) Articles 26(1) points (a) and (b), 27 to 29, 36(1) point (f) and 42 of CRR
A.1.2 Retained earnings 7,694 7,460 C 01.00 (r130,c010) Articles 26(1) point (c), 26(2) and 36 (1) points (a) and (l) of CRR
A.1.3 Accumulated other comprehensive income -290 -323 C 01.00 (r180,c010) Articles 4(100), 26(1) point (d) and 36 (1) point (l) of CRR
A.1.4 Other Reserves 13,361 13,355 C 01.00 (r200,c010) Articles 4(117) and 26(1) point (e) of CRR
A.1.5 Funds for general banking risk 0 0 C 01.00 (r210,c010) Articles 4(112), 26(1) point (f) and 36 (1) point (l) of CRR
A.1.6 Minority interest given recognition in CET1 capital 0 0 C 01.00 (r230,c010) Article 84 of CRR
A.1.7 Adjustments to CET1 due to prudential filters -2,117 -1,786 C 01.00 (r250,c010) Articles 32 to 35 of and 36 (1) point (l) of CRR
A.1.8 (-) Intangible assets (including Goodwill) -3,343 -3,805 C 01.00 (r300,c010) + C 01.00 (r340,c010) Articles 4(113), 36(1) point (b) and 37 of CRR. Articles 4(115), 36(1) point (b) and 37 point (a)
of CCR
A.1.9(-) DTAs that rely on future profitability and do not arise from temporary differences net of
associated DTLs -3,668 -3,553 C 01.00 (r370,c010) Articles 36(1) point (c) and 38 of CRR
A.1.10 (-) IRB shortfall of credit risk adjustments to expected losses -561 -33 C 01.00 (r380,c010) Articles 36(1) point (d), 40 and 159 of CRR
A.1.11 (-) Defined benefit pension fund assets -610 -1,369 C 01.00 (r390,c010) Articles 4(109), 36(1) point (e) and 41 of CRR
A.1.12 (-) Reciprocal cross holdings in CET1 Capital 0 0 C 01.00 (r430,c010) Articles 4(122), 36(1) point (g) and 44 of CRR
A.1.13 (-) Excess deduction from AT1 items over AT1 Capital 0 0 C 01.00 (r440,c010) Article 36(1) point (j) of CRR
A.1.14 (-) Deductions related to assets which can alternatively be subject to a 1.250% risk weight -215 -213C 01.00 (r450,c010) + C 01.00 (r460,c010)
+ C 01.00 (r470,c010) + C 01.00
(r471,c010)+ C 01.00 (r472,c010)
Articles 4(36), 36(1) point (k) (i) and 89 to 91 of CRR; Articles 36(1) point (k) (ii), 243(1) point
(b), 244(1) point (b) and 258 of CRR; Articles 36(1) point k) (iii) and 379(3) of CRR; Articles
36(1) point k) (iv) and 153(8) of CRR and Articles 36(1) point k) (v) and 155(4) of CRR.
A.1.14.1 Of which: from securitisation positions (-) -215 -213 C 01.00 (r460,c010) Articles 36(1) point (k) (ii), 243(1) point (b), 244(1) point (b) and 258 of CRR
A.1.15(-) Holdings of CET1 capital instruments of financial sector entities where the institiution
does not have a significant investment0 0 C 01.00 (r480,c010) Articles 4(27), 36(1) point (h); 43 to 46, 49 (2) and (3) and 79 of CRR
A.1.16 (-) Deductible DTAs that rely on future profitability and arise from temporary differences 0 0 C 01.00 (r490,c010) Articles 36(1) point (c) and 38; Articles 48(1) point (a) and 48(2) of CRR
A.1.17(-) Holdings of CET1 capital instruments of financial sector entities where the institiution
has a significant investment-4,790 -4,781 C 01.00 (r500,c010) Articles 4(27); 36(1) point (i); 43, 45; 47; 48(1) point (b); 49(1) to (3) and 79 of CRR
A.1.18 (-) Amount exceding the 17.65% threshold 0 0 C 01.00 (r510,c010) Article 48 of CRR
A.1.19 (-) Additional deductions of CET1 Capital due to Article 3 CRR 0 0 C 01.00 (r524,c010) Article 3 CRR
A.1.20 CET1 capital elements or deductions - other 0 0 C 01.00 (r529,c010) -
A.1.21 Transitional adjustments 0 594 CA1 {1.1.1.6 + 1.1.1.8 + 1.1.1.26} -
A.1.21.1 Transitional adjustments due to grandfathered CET1 Capital instruments (+/-) 0 0 C 01.00 (r220,c010) Articles 483(1) to (3), and 484 to 487 of CRR
A.1.21.2 Transitional adjustments due to additional minority interests (+/-) 0 0 C 01.00 (r240,c010) Articles 479 and 480 of CRR
A.1.21.3 Other transitional adjustments to CET1 Capital (+/-) 0 594 C 01.00 (r520,c010) Articles 469 to 472, 478 and 481 of CRR
A.2 ADDITIONAL TIER 1 CAPITAL (net of deductions and after transitional adjustments) 7,531 6,974 C 01.00 (r530,c010) Article 61 of CRR
A.2.1 Additional Tier 1 Capital instruments 6,008 6,016 C 01.00 (r540,c010) + C 01.00 (r670,c010)
A.2.2 (-) Excess deduction from T2 items over T2 capital 0 0 C 01.00 (r720,c010)
A.2.3 Other Additional Tier 1 Capital components and deductions 0 0
C 01.00 (r690,c010) + C 01.00 (r700,c010)
+ C 01.00 (r710,c010) + C 01.00
(r740,c010) + C 01.00 (r744,c010) + C
01.00 (r748,c010)
A.2.4 Additional Tier 1 transitional adjustments 1,523 958C 01.00 (r660,c010) + C 01.00 (r680,c010)
+ C 01.00 (r730,c010)
A.3 TIER 1 CAPITAL (net of deductions and after transitional adjustments) 40,948 40,600 C 01.00 (r015,c010) Article 25 of CRR
A.4 TIER 2 CAPITAL (net of deductions and after transitional adjustments) 9,390 10,848 C 01.00 (r750,c010) Article 71 of CRR
A.4.1 Tier 2 Capital instruments 7,682 9,130 C 01.00 (r760,c010) + C 01.00 (r890,c010)
A.4.2 Other Tier 2 Capital components and deductions -3,154 -2,860
C 01.00 (r910,c010) + C 01.00 (r920,c010)
+ C 01.00 (r930,c010) + C 01.00
(r940,c010) + C 01.00 (r950,c010) + C
01.00 (r970,c010) + C 01.00 (r974,c010) +
C 01.00 (r978,c010)
A.4.3 Tier 2 transitional adjustments 4,862 4,578C 01.00 (r880,c010) + C 01.00 (r900,c010)
+ C 01.00 (r960,c010)
B TOTAL RISK EXPOSURE AMOUNT 237,728 237,785 C 02.00 (r010,c010) Articles 92(3), 95, 96 and 98 of CRR
B.1 Of which: Transitional adjustments included 0 264 C 05.01 (r010;c040)
C.1 COMMON EQUITY TIER 1 CAPITAL RATIO (transitional period) 14.06% 14.14% CA3 {1} -
C.2 TIER 1 CAPITAL RATIO (transitional period) 17.22% 17.07% CA3 {3} -
C.3 TOTAL CAPITAL RATIO (transitional period) 21.17% 21.64% CA3 {5} -
CET1 Capital
Fully loadedD COMMON EQUITY TIER 1 CAPITAL (fully loaded) 33,417 33,032
[A.1-A.1.13-A.1.21+MIN(A.2+A.1.13-
A.2.2-A.2.4+MIN(A.4+A.2.2-
A.4.3,0),0)]
-
CET1 RATIO (%)
Fully loaded1 E COMMON EQUITY TIER 1 CAPITAL RATIO (fully loaded) 14.06% 13.91% [D.1]/[B-B.1] -
F Adjustments to CET1 due to IFRS 9 transitional arrangements 594 C 05.01 (r440,c010)
F Adjustments to AT1 due to IFRS 9 transitional arrangements 0 C 05.01 (r440,c020)
F Adjustments to T2 due to IFRS 9 transitional arrangements -605 C 05.01 (r440,c030)
F Adjustments included in RWAs due to IFRS 9 transitional arrangements 264 C 05.01 (r440,c040)
(1)The fully loaded CET1 ratio is an estimate calculated based on bank’s supervisory reporting. Therefore, any capital instruments that are not eligible from a regulatory point of view at the reporting date are not taken into account in this calculation.
Fully loaded CET1 capital ratio estimation is based on the formulae stated in column “COREP CODE” – please note that this might lead to differences to fully loaded CET1 capital ratios published by the participating banks e.g. in their Pillar 3 disclosure
Memo items
2018 EU-wide Transparency Exercise
Capital
Lloyds Banking Group Plc
OWN FUNDS
Transitional period
OWN FUNDS
REQUIREMENTS
CAPITAL RATIOS (%)
Transitional period

201712 201806
(mln EUR, %)
As of
31/12/2017
As of
30/06/2018COREP CODE REGULATION
A.1 Tier 1 capital - transitional definition 40,948 40,600 C 47.00 (r320,c010)
A.2 Tier 1 capital - fully phased-in definition 39,425 39,641 C 47.00 (r310,c010)
B.1 Total leverage ratio exposures - using a transitional definition of Tier 1 capital 799,876 828,528 C 47.00 (r300,c010)
B.2 Total leverage ratio exposures - using a fully phased-in definition of Tier 1 capital 801,457 830,057 C 47.00 (r290,c010)
C.1 Leverage ratio - using a transitional definition of Tier 1 capital 5.1% 4.9% C 47.00 (r340,c010)
C.2 Leverage ratio - using a fully phased-in definition of Tier 1 capital 4.9% 4.8% C 47.00 (r330,c010)
2018 EU-wide Transparency ExerciseLeverage ratio
Lloyds Banking Group Plc
Article 429 of the CRR; Delegated Regulation (EU) 2015/62 of 10 October 2014 amending
CRR

201712 201806
(mln EUR)
As of 31/12/2017 as of 30/06/2018
Risk exposure amounts for credit risk 204,164 204,839
Risk exposure amount for securitisation and re-securitisations in the banking book 4,841 4,819
Risk exposure amount for contributions to the default fund of a CCP 483 613
Risk exposure amount Other credit risk 198,841 199,407
Risk exposure amount for position, foreign exchange and commodities (Market risk) 3,439 3,748
of which: Risk exposure amount for securitisation and re-securitisations in the trading book1 32 8
Risk exposure amount for Credit Valuation Adjustment 1,580 1,028
Risk exposure amount for operational risk 28,545 28,170
Other risk exposure amounts 0 0
Total Risk Exposure Amount 237,728 237,785
(1)
May include hedges, which are not securitisation positions, as per Article 338.3 of CRR
2018 EU-wide Transparency Exercise
Risk exposure amounts
Lloyds Banking Group Plc

201712 201806
(mln EUR)
Interest income 17,790 9,061
Of which debt securities income 1,127 445
Of which loans and advances income 16,650 8,606
Interest expenses 4,052 1,998
(Of which deposits expenses) 2,148 1,189
(Of which debt securities issued expenses) 271 42
(Expenses on share capital repayable on demand) 0 0
Dividend income 45 22
Net Fee and commission income 2,258 1,035
Gains or (-) losses on derecognition of financial assets and liabilities not measured at fair value through profit or loss, and of non financial
assets, net627 130
Gains or (-) losses on financial assets and liabilities held for trading, net 322 101
Gains or (-) losses on financial assets and liabilities at fair value through profit or loss, net 373 190
Gains or (-) losses from hedge accounting, net 49 1
Exchange differences [gain or (-) loss], net 239 411
Net other operating income /(expenses) 1,582 895
TOTAL OPERATING INCOME, NET 19,232 9,848
(Administrative expenses) 8,023 4,084
(Depreciation) 2,584 1,335
Modification gains or (-) losses, net n.a. 0
(Provisions or (-) reversal of provisions) 2,775 861
(Commitments and guarantees given) -11 -17
(Other provisions) 2,786 878
Of which pending legal issues and tax litigation1 2,786
Of which restructuring1 157
(Increases or (-) decreases of the fund for general banking risks, net)2 0 0
(Impairment or (-) reversal of impairment on financial assets not measured at fair value through profit or loss) 786 530
(Financial assets at fair value through other comprehensive income) n.a. -2
(Financial assets at amortised cost) n.a. 532
(Impairment or (-) reversal of impairment of investments in subsidaries, joint ventures and associates and on non-financial assets) 9 0
(of which Goodwill) 9 0
Negative goodwill recognised in profit or loss 0 0
Share of the profit or (-) loss of investments in subsidaries, joint ventures and associates 676 693
Profit or (-) loss from non-current assets and disposal groups classified as held for sale not qualifying as discontinued operations 0 0
PROFIT OR (-) LOSS BEFORE TAX FROM CONTINUING OPERATIONS 5,730 3,731
PROFIT OR (-) LOSS AFTER TAX FROM CONTINUING OPERATIONS 3,919 2,883
Profit or (-) loss after tax from discontinued operations 0 0
PROFIT OR (-) LOSS FOR THE YEAR 3,919 2,883
Of which attributable to owners of the parent 3,817 2,841 (1)
Information available only as of end of the year(2)
For IFRS compliance banks “zero” in cell “Increases or (-) decreases of the fund for general banking risks, net” must be read as “n.a.”
2018 EU-wide Transparency ExerciseP&L
Lloyds Banking Group Plc
As of 31/12/2017 As of 30/06/2018

201712 201806 201712 201712 201712 201712 201712 201712 201712 201712 201712 201712 201806 201806 201806 201806 201806 201806 201806 201806 201806 201806
As of 31/12/2017 As of 30/06/2018
(mln EUR)
MULTIPLICATION
FACTOR (mc) x
AVERAGE OF
PREVIOUS 60
WORKING DAYS
(VaRavg)
PREVIOUS
DAY (VaRt-1)
MULTIPLICATION
FACTOR (ms) x
AVERAGE OF
PREVIOUS 60
WORKING DAYS
(SVaRavg)
LATEST AVAILABLE
(SVaRt-1)
12 WEEKS
AVERAGE
MEASURE
LAST MEASURE FLOOR
12 WEEKS
AVERAGE
MEASURE
LAST
MEASURE
MULTIPLICATION
FACTOR (mc) x
AVERAGE OF
PREVIOUS 60
WORKING DAYS
(VaRavg)
PREVIOUS DAY
(VaRt-1)
MULTIPLICATION
FACTOR (ms) x
AVERAGE OF
PREVIOUS 60
WORKING DAYS
(SVaRavg)
LATEST
AVAILABLE (SVaRt-
1)
12 WEEKS
AVERAGE
MEASURE
LAST
MEASUREFLOOR
12 WEEKS
AVERAGE
MEASURE
LAST
MEASURE
Traded Debt Instruments 362 356 20 23 118 134 51 12 236 53
Of which: General risk 296 294 17 19 87 99 46 12 206 45
Of which: Specific risk 66 62 3 3 31 35 5 1 30 7
Equities 0 0 0 0 0 0 0 0 0 0
Of which: General risk 0 0 0 0 0 0 0 0 0 0
Of which: Specific risk 0 0 0 0 0 0 0 0 0 0
Foreign exchange risk 83 168 4 4 12 12 3 1 4 2
Commodities risk 0 0 0 0 0 0 0 0 0 0
Total 445 524 24 14 178 108 37 21 0 0 0 2,994 31 8 207 83 21 19 0 0 0 3,224
2018 EU-wide Transparency ExerciseMarket Risk
Lloyds Banking Group Plc
SA IM IM
TOTAL RISK EXPOSURE AMOUNT TOTAL RISK EXPOSURE AMOUNT
VaR (Memorandum item) STRESSED VaR (Memorandum item)
INCREMENTAL DEFAULT
AND MIGRATION RISK
CAPITAL CHARGE
STRESSED VaR (Memorandum item)
INCREMENTAL
DEFAULT AND
MIGRATION RISK
CAPITAL CHARGE
ALL PRICE RISKS CAPITAL
CHARGE FOR CTP
TOTAL RISK
EXPOSURE
AMOUNT
As of 31/12/2017 As of 30/06/2018
ALL PRICE RISKS CAPITAL
CHARGE FOR CTP
TOTAL RISK
EXPOSURE
AMOUNT
VaR (Memorandum item)

201712 201712 201712 201712 201806 201806 201806 201806
(mln EUR, %)
Central governments or central banks 131,256 107,861 1,918 118,502 99,666 1,743
Regional governments or local authorities 6 6 1 6 6 1
Public sector entities 46 24 24 46 24 24
Multilateral Development Banks 2,210 2,140 0 2,205 2,205 0
International Organisations 73 73 0 3,999 30 0
Institutions 35,407 9,832 244 44,512 17,326 422
Corporates 23,960 14,957 12,841 23,750 14,563 12,849
of which: SME 3,936 3,493 3,299 4,062 3,631 3,429
Retail 38,500 14,449 10,433 38,590 14,077 10,133
of which: SME 2,595 2,417 1,408 2,696 2,525 1,468
Secured by mortgages on immovable property 5,840 5,808 2,191 5,247 5,207 1,824
of which: SME 9 8 4 3 3 2
Exposures in default 1,162 766 862 372 1,119 799 899 306
Items associated with particularly high risk 0 0 0 0 0 0
Covered bonds 0 0 0 0 0 0
Claims on institutions and corporates with a ST credit assessment 0 0 0 0 0 0
Collective investments undertakings (CIU) 313 313 63 895 895 179
Equity 0 0 0 0 0 0
Securitisation 1,202 1,202 275 1,128 1,128 260
Other exposures 3,510 3,510 2,562 9,135 9,135 7,661
Standardised Total 243,486 160,942 31,413 527 249,135 165,059 35,996 713(1) Original exposure, unlike Exposure value, is reported before taking into account any effect due to credit conversion factors or credit risk mitigation techniques (e.g. substitution effects).
1 (mln EUR, %)
Central governments or central banks 108,589 90,993 1,909 96,331 78,397 1,739
Regional governments or local authorities 6 6 1 6 6 1
Public sector entities 46 24 24 46 24 24
Multilateral Development Banks 0 0 0 0 0 0
International Organisations 0 0 0 0 0 0
Institutions 34,990 9,719 214 41,469 16,443 359
Corporates 14,776 8,721 7,349 14,724 8,600 7,373
of which: SME 3,874 3,436 3,243 3,946 3,525 3,323
Retail 36,828 12,784 9,190 37,806 13,307 9,562
of which: SME 2,562 2,383 1,389 2,658 2,488 1,447
Secured by mortgages on immovable property 4,874 4,842 1,822 4,341 4,302 1,507
of which: SME 9 8 4 3 3 2
Exposures in default 910 643 703 261 939 709 784 225
Items associated with particularly high risk 0 0 0 0 0 0
Covered bonds 0 0 0 0 0 0
Claims on institutions and corporates with a ST credit assessment 0 0 0 0 0 0
Collective investments undertakings (CIU) 313 313 63 895 895 179
Equity 0 0 0 0 0 0
Securitisation
Other exposures 3,333 3,333 2,397 8,879 8,879 7,415
Standardised Total2
382 575(1) Original exposure, unlike Exposure value, is reported before taking into account any effect due to credit conversion factors or credit risk mitigation techniques (e.g. substitution effects). (2) Total value adjustments and provisions per country of counterparty excludes those for securistisation exposures, additional valuation adjustments (AVAs) and other own funds reductions related to the exposures, but includes general credit risk adjustments.
2 (mln EUR, %)
Central governments or central banks 0 0 0 0 0 0
Regional governments or local authorities 0 0 0 0 0 0
Public sector entities 0 0 0 0 0 0
Multilateral Development Banks 0 0 0 0 0 0
International Organisations 0 0 0 0 0 0
Institutions 288 30 20 607 593 51
Corporates 4,198 2,765 2,099 3,748 2,218 1,810
of which: SME 0 0 0 0 0 0
Retail 2 2 1 2 2 1
of which: SME 1 1 1 1 1 1
Secured by mortgages on immovable property 95 95 33 89 89 31
of which: SME 0 0 0 0 0 0
Exposures in default 9 6 6 3 8 7 7 2
Items associated with particularly high risk 0 0 0 0 0 0
Covered bonds 0 0 0 0 0 0
Claims on institutions and corporates with a ST credit assessment 0 0 0 0 0 0
Collective investments undertakings (CIU) 0 0 0 0 0 0
Equity 0 0 0 0 0 0
Securitisation
Other exposures 16 16 16 97 97 97
Standardised Total2
17 10(1) Original exposure, unlike Exposure value, is reported before taking into account any effect due to credit conversion factors or credit risk mitigation techniques (e.g. substitution effects). (2) Total value adjustments and provisions per country of counterparty excludes those for securistisation exposures, additional valuation adjustments (AVAs) and other own funds reductions related to the exposures, but includes general credit risk adjustments.
3 (mln EUR, %)
Central governments or central banks 13,766 13,774 0 18,040 18,048 0
Regional governments or local authorities 0 0 0 0 0 0
Public sector entities 0 0 0 0 0 0
Multilateral Development Banks 0 0 0 0 0 0
International Organisations 0 0 0 0 0 0
Institutions 18 18 4 31 31 6
Corporates 1,165 742 678 980 719 655
of which: SME 4 3 3 7 4 4
Retail 21 21 15 16 16 12
of which: SME 0 0 0 0 0 0
Secured by mortgages on immovable property 182 181 64 176 176 62
of which: SME 0 0 0 0 0 0
Exposures in default 0 0 1 0 0 0 0 0
Items associated with particularly high risk 0 0 0 0 0 0
Covered bonds 0 0 0 0 0 0
Claims on institutions and corporates with a ST credit assessment 0 0 0 0 0 0
Collective investments undertakings (CIU) 0 0 0 0 0 0
Equity 0 0 0 0 0 0
Securitisation
Other exposures 32 32 26 59 59 53
Standardised Total2
2 4(1) Original exposure, unlike Exposure value, is reported before taking into account any effect due to credit conversion factors or credit risk mitigation techniques (e.g. substitution effects). (2) Total value adjustments and provisions per country of counterparty excludes those for securistisation exposures, additional valuation adjustments (AVAs) and other own funds reductions related to the exposures, but includes general credit risk adjustments.
2018 EU-wide Transparency Exercise
Credit Risk - Standardised Approach
Lloyds Banking Group Plc
Standardised Approach
As of 31/12/2017 As of 30/06/2018
Risk exposure
amount
Value adjustments
and provisions
Consolidated data
Standardised Approach
As of 31/12/2017 As of 30/06/2018
Original Exposure1
Exposure Value1 Risk exposure
amount
Value adjustments
and provisionsOriginal Exposure
1 Exposure Value
1
Risk exposure
amount
Value adjustments
and provisions2
UNITED KINGDOM
Standardised Approach
As of 31/12/2017 As of 30/06/2018
Original Exposure1
Exposure Value1 Risk exposure
amount
Value adjustments
and provisions2 Original Exposure
1 Exposure Value
1
Risk exposure
amount
Value adjustments
and provisions2
UNITED STATES
Standardised Approach
As of 31/12/2017 As of 30/06/2018
Original Exposure1
Exposure Value1 Risk exposure
amount
Value adjustments
and provisions2 Original Exposure
1 Exposure Value
1
Risk exposure
amount
Value adjustments
and provisions2
NETHERLANDS
Original Exposure1
Exposure Value1 Risk exposure
amount
Value adjustments
and provisions2 Original Exposure
1 Exposure Value
1

201712 201712 201712 201712 201806 201806 201806 201806
2018 EU-wide Transparency Exercise
Credit Risk - Standardised Approach
Lloyds Banking Group Plc
Standardised Approach
4 (mln EUR, %)
Central governments or central banks 1 1 0 8 2 0
Regional governments or local authorities 0 0 0 0 0 0
Public sector entities 0 0 0 0 0 0
Multilateral Development Banks 0 0 0 0 0 0
International Organisations 0 0 0 0 0 0
Institutions 0 0 0 0 0 0
Corporates 93 83 83 76 67 66
of which: SME 9 8 8 1 1 1
Retail 911 908 681 0 0 0
of which: SME 0 0 0 0 0 0
Secured by mortgages on immovable property 10 10 4 9 9 3
of which: SME 0 0 0 0 0 0
Exposures in default 66 31 40 35 21 7 11 13
Items associated with particularly high risk 0 0 0 0 0 0
Covered bonds 0 0 0 0 0 0
Claims on institutions and corporates with a ST credit assessment 0 0 0 0 0 0
Collective investments undertakings (CIU) 0 0 0 0 0 0
Equity 0 0 0 0 0 0
Securitisation
Other exposures 18 18 18 0 0 0
Standardised Total2
38 13(1) Original exposure, unlike Exposure value, is reported before taking into account any effect due to credit conversion factors or credit risk mitigation techniques (e.g. substitution effects). (2) Total value adjustments and provisions per country of counterparty excludes those for securistisation exposures, additional valuation adjustments (AVAs) and other own funds reductions related to the exposures, but includes general credit risk adjustments.
5 (mln EUR, %)
Central governments or central banks 0 0 0 0 0 0
Regional governments or local authorities 0 0 0 0 0 0
Public sector entities 0 0 0 0 0 0
Multilateral Development Banks 0 0 0 0 0 0
International Organisations 0 0 0 0 0 0
Institutions 0 0 0 0 0 0
Corporates 114 98 98 134 125 125
of which: SME 0 0 0 0 0 0
Retail 0 0 0 0 0 0
of which: SME 0 0 0 0 0 0
Secured by mortgages on immovable property 1 1 0 1 1 0
of which: SME 0 0 0 0 0 0
Exposures in default 21 4 6 12 21 10 16 0
Items associated with particularly high risk 0 0 0 0 0 0
Covered bonds 0 0 0 0 0 0
Claims on institutions and corporates with a ST credit assessment 0 0 0 0 0 0
Collective investments undertakings (CIU) 0 0 0 0 0 0
Equity 0 0 0 0 0 0
Securitisation
Other exposures 0 0 0 0 0 0
Standardised Total2
13 0(1) Original exposure, unlike Exposure value, is reported before taking into account any effect due to credit conversion factors or credit risk mitigation techniques (e.g. substitution effects). (2) Total value adjustments and provisions per country of counterparty excludes those for securistisation exposures, additional valuation adjustments (AVAs) and other own funds reductions related to the exposures, but includes general credit risk adjustments.
6 (mln EUR, %)
Central governments or central banks 231 231 0 203 203 0
Regional governments or local authorities 0 0 0 0 0 0
Public sector entities 0 0 0 0 0 0
Multilateral Development Banks 0 0 0 0 0 0
International Organisations 0 0 0 0 0 0
Institutions 61 13 0 2,252 105 2
Corporates 57 42 42 63 45 45
of which: SME 1 0 0 1 0 0
Retail 0 0 0 0 0 0
of which: SME 0 0 0 0 0 0
Secured by mortgages on immovable property 12 12 4 11 11 4
of which: SME 0 0 0 0 0 0
Exposures in default 3 0 0 3 5 1 2 3
Items associated with particularly high risk 0 0 0 0 0 0
Covered bonds 0 0 0 0 0 0
Claims on institutions and corporates with a ST credit assessment 0 0 0 0 0 0
Collective investments undertakings (CIU) 0 0 0 0 0 0
Equity 0 0 0 0 0 0
Securitisation
Other exposures 0 0 0 0 0 0
Standardised Total2
3 3(1) Original exposure, unlike Exposure value, is reported before taking into account any effect due to credit conversion factors or credit risk mitigation techniques (e.g. substitution effects). (2) Total value adjustments and provisions per country of counterparty excludes those for securistisation exposures, additional valuation adjustments (AVAs) and other own funds reductions related to the exposures, but includes general credit risk adjustments.
7 (mln EUR, %)
Central governments or central banks 0 0 0 0 0 0
Regional governments or local authorities 0 0 0 0 0 0
Public sector entities 0 0 0 0 0 0
Multilateral Development Banks 0 0 0 0 0 0
International Organisations 0 0 0 0 0 0
Institutions 0 0 0 0 0 0
Corporates 0 0 0 0 0 0
of which: SME 0 0 0 0 0 0
Retail 0 0 0 0 0 0
of which: SME 0 0 0 0 0 0
Secured by mortgages on immovable property 0 0 0 0 0 0
of which: SME 0 0 0 0 0 0
Exposures in default 0 0 0 0 0 0 0 0
Items associated with particularly high risk 0 0 0 0 0 0
Covered bonds 0 0 0 0 0 0
Claims on institutions and corporates with a ST credit assessment 0 0 0 0 0 0
Collective investments undertakings (CIU) 0 0 0 0 0 0
Equity 0 0 0 0 0 0
Securitisation
Other exposures 0 0 0 0 0 0
Standardised Total2
0 0(1) Original exposure, unlike Exposure value, is reported before taking into account any effect due to credit conversion factors or credit risk mitigation techniques (e.g. substitution effects). (2) Total value adjustments and provisions per country of counterparty excludes those for securistisation exposures, additional valuation adjustments (AVAs) and other own funds reductions related to the exposures, but includes general credit risk adjustments.
Standardised Approach
As of 31/12/2017 As of 30/06/2018
Risk exposure
amount
Value adjustments
and provisions2
IRELAND
Standardised Approach
As of 31/12/2017 As of 30/06/2018
Original Exposure1
Exposure Value1 Risk exposure
amount
Value adjustments
and provisions2 Original Exposure
1 Exposure Value
1
Risk exposure
amount
Value adjustments
and provisions2
LUXEMBOURG
Standardised Approach
As of 31/12/2017 As of 30/06/2018
Original Exposure1
Exposure Value1 Risk exposure
amount
Value adjustments
and provisions2 Original Exposure
1 Exposure Value
1
Risk exposure
amount
Value adjustments
and provisions2
FRANCE
Standardised Approach
As of 31/12/2017 As of 30/06/2018
Original Exposure1
Exposure Value1 Risk exposure
amount
Value adjustments
and provisions2 Original Exposure
1 Exposure Value
1
Risk exposure
amount
Value adjustments
and provisions2
Country of
Counterpart 7
Original Exposure1
Exposure Value1 Risk exposure
amount
Value adjustments
and provisions2 Original Exposure
1 Exposure Value
1

201712 201712 201712 201712 201806 201806 201806 201806
2018 EU-wide Transparency Exercise
Credit Risk - Standardised Approach
Lloyds Banking Group Plc
Standardised Approach
8 (mln EUR, %)
Central governments or central banks 0 0 0 0 0 0
Regional governments or local authorities 0 0 0 0 0 0
Public sector entities 0 0 0 0 0 0
Multilateral Development Banks 0 0 0 0 0 0
International Organisations 0 0 0 0 0 0
Institutions 0 0 0 0 0 0
Corporates 0 0 0 0 0 0
of which: SME 0 0 0 0 0 0
Retail 0 0 0 0 0 0
of which: SME 0 0 0 0 0 0
Secured by mortgages on immovable property 0 0 0 0 0 0
of which: SME 0 0 0 0 0 0
Exposures in default 0 0 0 0 0 0 0 0
Items associated with particularly high risk 0 0 0 0 0 0
Covered bonds 0 0 0 0 0 0
Claims on institutions and corporates with a ST credit assessment 0 0 0 0 0 0
Collective investments undertakings (CIU) 0 0 0 0 0 0
Equity 0 0 0 0 0 0
Securitisation
Other exposures 0 0 0 0 0 0
Standardised Total2
0 0(1) Original exposure, unlike Exposure value, is reported before taking into account any effect due to credit conversion factors or credit risk mitigation techniques (e.g. substitution effects). (2) Total value adjustments and provisions per country of counterparty excludes those for securistisation exposures, additional valuation adjustments (AVAs) and other own funds reductions related to the exposures, but includes general credit risk adjustments.
9 (mln EUR, %)
Central governments or central banks 0 0 0 0 0 0
Regional governments or local authorities 0 0 0 0 0 0
Public sector entities 0 0 0 0 0 0
Multilateral Development Banks 0 0 0 0 0 0
International Organisations 0 0 0 0 0 0
Institutions 0 0 0 0 0 0
Corporates 0 0 0 0 0 0
of which: SME 0 0 0 0 0 0
Retail 0 0 0 0 0 0
of which: SME 0 0 0 0 0 0
Secured by mortgages on immovable property 0 0 0 0 0 0
of which: SME 0 0 0 0 0 0
Exposures in default 0 0 0 0 0 0 0 0
Items associated with particularly high risk 0 0 0 0 0 0
Covered bonds 0 0 0 0 0 0
Claims on institutions and corporates with a ST credit assessment 0 0 0 0 0 0
Collective investments undertakings (CIU) 0 0 0 0 0 0
Equity 0 0 0 0 0 0
Securitisation
Other exposures 0 0 0 0 0 0
Standardised Total2
0 0(1) Original exposure, unlike Exposure value, is reported before taking into account any effect due to credit conversion factors or credit risk mitigation techniques (e.g. substitution effects). (2) Total value adjustments and provisions per country of counterparty excludes those for securistisation exposures, additional valuation adjustments (AVAs) and other own funds reductions related to the exposures, but includes general credit risk adjustments.
10 (mln EUR, %)
Central governments or central banks 0 0 0 0 0 0
Regional governments or local authorities 0 0 0 0 0 0
Public sector entities 0 0 0 0 0 0
Multilateral Development Banks 0 0 0 0 0 0
International Organisations 0 0 0 0 0 0
Institutions 0 0 0 0 0 0
Corporates 0 0 0 0 0 0
of which: SME 0 0 0 0 0 0
Retail 0 0 0 0 0 0
of which: SME 0 0 0 0 0 0
Secured by mortgages on immovable property 0 0 0 0 0 0
of which: SME 0 0 0 0 0 0
Exposures in default 0 0 0 0 0 0 0 0
Items associated with particularly high risk 0 0 0 0 0 0
Covered bonds 0 0 0 0 0 0
Claims on institutions and corporates with a ST credit assessment 0 0 0 0 0 0
Collective investments undertakings (CIU) 0 0 0 0 0 0
Equity 0 0 0 0 0 0
Securitisation
Other exposures 0 0 0 0 0 0
Standardised Total2
0 0(1) Original exposure, unlike Exposure value, is reported before taking into account any effect due to credit conversion factors or credit risk mitigation techniques (e.g. substitution effects). (2) Total value adjustments and provisions per country of counterparty excludes those for securistisation exposures, additional valuation adjustments (AVAs) and other own funds reductions related to the exposures, but includes general credit risk adjustments.
Standardised Approach
As of 31/12/2017 As of 30/06/2018
Risk exposure
amount
Value adjustments
and provisions2
Country of
Counterpart 8
Standardised Approach
As of 31/12/2017 As of 30/06/2018
Original Exposure1
Exposure Value1 Risk exposure
amount
Value adjustments
and provisions2 Original Exposure
1 Exposure Value
1
Risk exposure
amount
Value adjustments
and provisions2
Country of
Counterpart 9
Standardised Approach
As of 31/12/2017 As of 30/06/2018
Original Exposure1
Exposure Value1 Risk exposure
amount
Value adjustments
and provisions2 Original Exposure
1 Exposure Value
1
Risk exposure
amount
Value adjustments
and provisions2
Country of
Counterpart 10
Original Exposure1
Exposure Value1 Risk exposure
amount
Value adjustments
and provisions2 Original Exposure
1 Exposure Value
1

201712 201712 201712 201712 201712 201712 201806 201806 201806 201806 201806 201806
(mln EUR, %)
Of which:
defaulted(2)
Of which:
defaulted
Of which:
defaulted
Of which:
defaulted
Central banks and central governments 41,983 0 21,087 1,644 0 0 38,374 0 23,934 1,553 0 0
Institutions 22,474 32 8,849 2,486 0 16 26,707 2 10,690 2,377 0 3
Corporates 222,339 2,319 123,916 69,673 0 1,361 221,476 2,101 124,574 69,578 0 1,562
Corporates - Of Which: Specialised Lending 22,512 0 21,062 15,616 0 419 22,130 411 20,660 15,373 0 431
Corporates - Of Which: SME 13,990 482 13,148 8,579 0 129 13,834 372 12,968 8,695 0 211
Retail 442,495 5,630 444,853 69,417 4,301 2,359 441,144 5,126 442,161 66,439 3,178 2,873
Retail - Secured on real estate property 361,122 4,600 376,857 41,436 2,975 1,764 357,883 4,133 373,562 37,590 1,852 1,673
Retail - Secured on real estate property - Of Which: SME 11,030 203 11,010 2,879 255 28 10,757 189 10,738 2,788 231 100
Retail - Secured on real estate property - Of Which: non-
SME350,092 4,397 365,847 38,557 2,720 1,735 347,126 3,944 362,824 34,802 1,620 1,573
Retail - Qualifying Revolving 58,856 451 45,406 12,558 620 283 59,775 442 45,052 13,130 617 573
Retail - Other Retail 22,517 580 22,591 15,423 706 313 23,486 552 23,546 15,719 709 627
Retail - Other Retail - Of Which: SME 2,480 244 2,479 1,778 109 18 2,468 234 2,468 1,792 103 80
Retail - Other Retail - Of Which: non-SME 20,037 336 20,111 13,645 596 295 21,018 318 21,079 13,927 606 547
Equity 7,602 0 7,602 17,871 0 7,321 0 7,321 16,982 0
Securitisation 28,917 28,917 4,566 1 27,633 27,633 4,559 0
Other non credit-obligation assets 6,612 6,744
IRB Total 172,269 168,231(1) Original exposure, unlike Exposure value, is reported before taking into account any effect due to credit conversion factors or credit risk mitigation techniques (e.g. substitution effects). (2) For corporate – specialised lending, original values reported in December 2017 at consolidated level include all specialised lending exposures, while the corresponding “of which defaulted” exclude those subject to the slotting criteria approach.
1 (mln EUR, %)
Of which:
defaulted
Of which:
defaulted
Of which:
defaulted
Of which:
defaulted
Central banks and central governments 1,890 0 62 2 0 0 2,152 0 28 1 0 0
Institutions 6,188 0 2,740 747 0 10 7,806 0 3,596 853 0 3
Corporates 147,437 2,150 92,211 56,549 0 1,256 157,244 1,998 93,448 57,561 0 1,476
Corporates - Of Which: Specialised Lending 1 0 1 0 0 0 17,850 337 16,742 12,660 0 379
Corporates - Of Which: SME 13,776 482 12,977 8,498 0 129 13,734 372 12,882 8,642 0 209
Retail 431,174 5,300 433,492 64,196 3,385 2,238 433,470 5,085 434,548 65,319 3,061 2,861
Retail - Secured on real estate property 349,867 4,269 365,562 36,232 2,059 1,642 350,279 4,092 366,020 36,488 1,735 1,661
Retail - Secured on real estate property - Of Which: SME 11,021 203 11,001 2,877 255 28 10,744 189 10,725 2,786 231 100
Retail - Secured on real estate property - Of Which: non-
SME338,846 4,066 354,561 33,355 1,804 1,614 339,535 3,904 355,296 33,702 1,504 1,561
Retail - Qualifying Revolving 58,856 451 45,406 12,558 620 283 59,775 442 45,052 13,130 617 573
Retail - Other Retail 22,451 580 22,524 15,406 706 313 23,415 552 23,475 15,701 709 627
Retail - Other Retail - Of Which: SME 2,479 244 2,479 1,778 109 18 2,468 234 2,467 1,792 103 80
Retail - Other Retail - Of Which: non-SME 19,972 336 20,046 13,628 596 295 20,948 318 21,008 13,909 606 547
Equity 7,154 0 7,154 16,483 0 0 6,849 0 6,849 15,490 0 0
Securitisation
Other non credit-obligation assets
IRB Total(1) Original exposure, unlike Exposure value, is reported before taking into account any effect due to credit conversion factors or credit risk mitigation techniques (e.g. substitution effects).
2 (mln EUR, %)
Of which:
defaulted
Of which:
defaulted
Of which:
defaulted
Of which:
defaulted
Central banks and central governments 19,689 0 19,689 1,579 0 0 32,480 0 23,592 1,536 0 0
Institutions 2,232 0 2,326 713 0 0 2,287 0 1,806 392 0 0
Corporates 25,381 78 13,273 5,066 0 49 25,755 33 13,754 4,816 0 41
Corporates - Of Which: Specialised Lending 0 0 0 0 0 0 530 20 468 392 0 25
Corporates - Of Which: SME 0 0 0 0 0 0 0 0 0 0 0 0
Retail 0 0 0 0 0 0 0 0 0 0 0 0
Retail - Secured on real estate property 0 0 0 0 0 0 0 0 0 0 0 0
Retail - Secured on real estate property - Of Which: SME 0 0 0 0 0 0 0 0 0 0 0 0
Retail - Secured on real estate property - Of Which: non-
SME0 0 0 0 0 0 0 0 0 0 0 0
Retail - Qualifying Revolving 0 0 0 0 0 0 0 0 0 0 0 0
Retail - Other Retail 0 0 0 0 0 0 0 0 0 0 0 0
Retail - Other Retail - Of Which: SME 0 0 0 0 0 0 0 0 0 0 0 0
Retail - Other Retail - Of Which: non-SME 0 0 0 0 0 0 0 0 0 0 0 0
Equity 233 0 233 835 0 0 270 0 270 983 0 0
Securitisation
Other non credit-obligation assets
IRB Total(1) Original exposure, unlike Exposure value, is reported before taking into account any effect due to credit conversion factors or credit risk mitigation techniques (e.g. substitution effects).
3 (mln EUR, %)
Of which:
defaulted
Of which:
defaulted
Of which:
defaulted
Of which:
defaulted
Central banks and central governments 0 0 0 0 0 0 0 0 0 0 0 0
Institutions 391 0 212 57 0 0 470 0 231 45 0 0
Corporates 643 4 396 245 0 5 489 4 284 126 0 5
Corporates - Of Which: Specialised Lending 0 0 0 0 0 0 67 4 66 43 0 4
Corporates - Of Which: SME 0 0 0 0 0 0 0 0 0 0 0 0
Retail 7,274 46 7,294 1,149 126 14 7,591 41 7,529 1,100 116 12
Retail - Secured on real estate property 7,274 46 7,294 1,149 126 14 7,591 41 7,529 1,100 116 12
Retail - Secured on real estate property - Of Which: SME 0 0 0 0 0 0 0 0 0 0 0 0
Retail - Secured on real estate property - Of Which: non-
SME7,274 46 7,294 1,149 126 14 7,591 41 7,529 1,100 116 12
Retail - Qualifying Revolving 0 0 0 0 0 0 0 0 0 0 0 0
Retail - Other Retail 0 0 0 0 0 0 0 0 0 0 0 0
Retail - Other Retail - Of Which: SME 0 0 0 0 0 0 0 0 0 0 0 0
Retail - Other Retail - Of Which: non-SME 0 0 0 0 0 0 0 0 0 0 0 0
Equity 0 0 0 0 0 0 0 0 0 0 0 0
Securitisation
Other non credit-obligation assets
IRB Total(1) Original exposure, unlike Exposure value, is reported before taking into account any effect due to credit conversion factors or credit risk mitigation techniques (e.g. substitution effects).
2018 EU-wide Transparency Exercise
Credit Risk - IRB Approach
Lloyds Banking Group Plc
IRB Approach
As of 31/12/2017 As of 30/06/2018
Risk exposure amount Value
adjustments
and
provisions
Consolidated data
IRB Approach
As of 31/12/2017 As of 30/06/2018
Original Exposure1
Exposure
Value1
Risk exposure amount Value
adjustments
and
provisions
Original Exposure1
Exposure
Value1
Risk exposure amount Value
adjustments
and
provisions
UNITED KINGDOM
IRB Approach
As of 31/12/2017 As of 30/06/2018
Original Exposure1
Exposure
Value1
Risk exposure amount Value
adjustments
and
provisions
Original Exposure1
Exposure
Value1
Risk exposure amount Value
adjustments
and
provisions
UNITED STATES
IRB Approach
As of 31/12/2017 As of 30/06/2018
Original Exposure1
Exposure
Value1
Risk exposure amount Value
adjustments
and
provisions
Original Exposure1
Exposure
Value1
Risk exposure amount Value
adjustments
and
provisions
NETHERLANDS
Original Exposure1
Exposure
Value1
Risk exposure amount Value
adjustments
and
provisions
Original Exposure1
Exposure
Value1

201712 201712 201712 201712 201712 201712 201806 201806 201806 201806 201806 201806
2018 EU-wide Transparency Exercise
Credit Risk - IRB Approach
Lloyds Banking Group Plc
4 (mln EUR, %)
Of which:
defaulted
Of which:
defaulted
Of which:
defaulted
Of which:
defaulted
Central banks and central governments 0 0 0 0 0 0 0 0 0 0 0 0
Institutions 28 0 5 3 0 0 26 0 4 3 0 0
Corporates 22,629 4 606 385 0 1 14,022 11 587 308 0 1
Corporates - Of Which: Specialised Lending 0 0 0 0 0 0 130 0 126 131 0 1
Corporates - Of Which: SME 0 0 0 0 0 0 0 0 0 0 0 0
Retail 3,972 284 3,992 4,053 790 107 1 0 1 0 0 0
Retail - Secured on real estate property 3,971 284 3,992 4,053 790 107 1 0 1 0 0 0
Retail - Secured on real estate property - Of Which: SME 1 0 1 0 0 0 1 0 1 0 0 0
Retail - Secured on real estate property - Of Which: non-
SME3,971 284 3,991 4,053 790 107 0 0 0 0 0 0
Retail - Qualifying Revolving 0 0 0 0 0 0 0 0 0 0 0 0
Retail - Other Retail 0 0 0 0 0 0 0 0 0 0 0 0
Retail - Other Retail - Of Which: SME 0 0 0 0 0 0 0 0 0 0 0 0
Retail - Other Retail - Of Which: non-SME 0 0 0 0 0 0 0 0 0 0 0 0
Equity 2 0 2 4 0 0 1 0 1 2 0 0
Securitisation
Other non credit-obligation assets
IRB Total(1) Original exposure, unlike Exposure value, is reported before taking into account any effect due to credit conversion factors or credit risk mitigation techniques (e.g. substitution effects).
5 (mln EUR, %)
Of which:
defaulted
Of which:
defaulted
Of which:
defaulted
Of which:
defaulted
Central banks and central governments 0 0 0 0 0 0 0 0 0 0 0 0
Institutions 1,686 0 196 9 0 0 2,277 0 228 11 0 0
Corporates 7,155 0 1,344 596 0 3 6,346 0 1,529 599 0 1
Corporates - Of Which: Specialised Lending 0 0 0 0 0 0 350 0 336 226 0 1
Corporates - Of Which: SME 0 0 0 0 0 0 0 0 0 0 0 0
Retail 0 0 0 0 0 0 0 0 0 0 0 0
Retail - Secured on real estate property 0 0 0 0 0 0 0 0 0 0 0 0
Retail - Secured on real estate property - Of Which: SME 0 0 0 0 0 0 0 0 0 0 0 0
Retail - Secured on real estate property - Of Which: non-
SME0 0 0 0 0 0 0 0 0 0 0 0
Retail - Qualifying Revolving 0 0 0 0 0 0 0 0 0 0 0 0
Retail - Other Retail 0 0 0 0 0 0 0 0 0 0 0 0
Retail - Other Retail - Of Which: SME 0 0 0 0 0 0 0 0 0 0 0 0
Retail - Other Retail - Of Which: non-SME 0 0 0 0 0 0 0 0 0 0 0 0
Equity 0 0 0 0 0 0 0 0 0 0 0 0
Securitisation
Other non credit-obligation assets
IRB Total(1) Original exposure, unlike Exposure value, is reported before taking into account any effect due to credit conversion factors or credit risk mitigation techniques (e.g. substitution effects).
6 (mln EUR, %)
Of which:
defaulted
Of which:
defaulted
Of which:
defaulted
Of which:
defaulted
Central banks and central governments 0 0 0 0 0 0 0 0 0 0 0 0
Institutions 2,493 0 624 233 0 6 1,846 0 675 251 0 0
Corporates 2,381 0 1,716 529 0 0 2,619 0 2,041 536 0 6
Corporates - Of Which: Specialised Lending 0 0 0 0 0 0 52 0 39 21 0 0
Corporates - Of Which: SME 0 0 0 0 0 0 0 0 0 0 0 0
Retail 0 0 0 0 0 0 0 0 0 0 0 0
Retail - Secured on real estate property 0 0 0 0 0 0 0 0 0 0 0 0
Retail - Secured on real estate property - Of Which: SME 0 0 0 0 0 0 0 0 0 0 0 0
Retail - Secured on real estate property - Of Which: non-
SME0 0 0 0 0 0 0 0 0 0 0 0
Retail - Qualifying Revolving 0 0 0 0 0 0 0 0 0 0 0 0
Retail - Other Retail 0 0 0 0 0 0 0 0 0 0 0 0
Retail - Other Retail - Of Which: SME 0 0 0 0 0 0 0 0 0 0 0 0
Retail - Other Retail - Of Which: non-SME 0 0 0 0 0 0 0 0 0 0 0 0
Equity 0 0 0 0 0 0 0 0 0 0 0 0
Securitisation
Other non credit-obligation assets
IRB Total(1) Original exposure, unlike Exposure value, is reported before taking into account any effect due to credit conversion factors or credit risk mitigation techniques (e.g. substitution effects).
7 (mln EUR, %)
Of which:
defaulted
Of which:
defaulted
Of which:
defaulted
Of which:
defaulted
Central banks and central governments 0 0 0 0 0 0 0 0 0 0 0 0
Institutions 0 0 0 0 0 0 0 0 0 0 0 0
Corporates 0 0 0 0 0 0 0 0 0 0 0 0
Corporates - Of Which: Specialised Lending 0 0 0 0 0 0 0 0 0 0 0 0
Corporates - Of Which: SME 0 0 0 0 0 0 0 0 0 0 0 0
Retail 0 0 0 0 0 0 0 0 0 0 0 0
Retail - Secured on real estate property 0 0 0 0 0 0 0 0 0 0 0 0
Retail - Secured on real estate property - Of Which: SME 0 0 0 0 0 0 0 0 0 0 0 0
Retail - Secured on real estate property - Of Which: non-
SME0 0 0 0 0 0 0 0 0 0 0 0
Retail - Qualifying Revolving 0 0 0 0 0 0 0 0 0 0 0 0
Retail - Other Retail 0 0 0 0 0 0 0 0 0 0 0 0
Retail - Other Retail - Of Which: SME 0 0 0 0 0 0 0 0 0 0 0 0
Retail - Other Retail - Of Which: non-SME 0 0 0 0 0 0 0 0 0 0 0 0
Equity 0 0 0 0 0 0 0 0 0 0 0 0
Securitisation
Other non credit-obligation assets
IRB Total(1) Original exposure, unlike Exposure value, is reported before taking into account any effect due to credit conversion factors or credit risk mitigation techniques (e.g. substitution effects).
IRB Approach
As of 31/12/2017 As of 30/06/2018
Risk exposure amount Value
adjustments
and
provisions
IRELAND
IRB Approach
As of 31/12/2017 As of 30/06/2018
Original Exposure1
Exposure
Value1
Risk exposure amount Value
adjustments
and
provisions
Original Exposure1
Exposure
Value1
Risk exposure amount Value
adjustments
and
provisions
LUXEMBOURG
IRB Approach
As of 31/12/2017 As of 30/06/2018
Original Exposure1
Exposure
Value1
Risk exposure amount Value
adjustments
and
provisions
Original Exposure1
Exposure
Value1
Risk exposure amount Value
adjustments
and
provisions
FRANCE
IRB Approach
As of 31/12/2017 As of 30/06/2018
Original Exposure1
Exposure
Value1
Risk exposure amount Value
adjustments
and
provisions
Original Exposure1
Exposure
Value1
Risk exposure amount Value
adjustments
and
provisions
Country of Counterpart 7
Original Exposure1
Exposure
Value1
Risk exposure amount Value
adjustments
and
provisions
Original Exposure1
Exposure
Value1

201712 201712 201712 201712 201712 201712 201806 201806 201806 201806 201806 201806
2018 EU-wide Transparency Exercise
Credit Risk - IRB Approach
Lloyds Banking Group Plc
8 (mln EUR, %)
Of which:
defaulted
Of which:
defaulted
Of which:
defaulted
Of which:
defaulted
Central banks and central governments 0 0 0 0 0 0 0 0 0 0 0 0
Institutions 0 0 0 0 0 0 0 0 0 0 0 0
Corporates 0 0 0 0 0 0 0 0 0 0 0 0
Corporates - Of Which: Specialised Lending 0 0 0 0 0 0 0 0 0 0 0 0
Corporates - Of Which: SME 0 0 0 0 0 0 0 0 0 0 0 0
Retail 0 0 0 0 0 0 0 0 0 0 0 0
Retail - Secured on real estate property 0 0 0 0 0 0 0 0 0 0 0 0
Retail - Secured on real estate property - Of Which: SME 0 0 0 0 0 0 0 0 0 0 0 0
Retail - Secured on real estate property - Of Which: non-
SME0 0 0 0 0 0 0 0 0 0 0 0
Retail - Qualifying Revolving 0 0 0 0 0 0 0 0 0 0 0 0
Retail - Other Retail 0 0 0 0 0 0 0 0 0 0 0 0
Retail - Other Retail - Of Which: SME 0 0 0 0 0 0 0 0 0 0 0 0
Retail - Other Retail - Of Which: non-SME 0 0 0 0 0 0 0 0 0 0 0 0
Equity 0 0 0 0 0 0 0 0 0 0 0 0
Securitisation
Other non credit-obligation assets
IRB Total(1) Original exposure, unlike Exposure value, is reported before taking into account any effect due to credit conversion factors or credit risk mitigation techniques (e.g. substitution effects).
9 (mln EUR, %)
Of which:
defaulted
Of which:
defaulted
Of which:
defaulted
Of which:
defaulted
Central banks and central governments 0 0 0 0 0 0 0 0 0 0 0 0
Institutions 0 0 0 0 0 0 0 0 0 0 0 0
Corporates 0 0 0 0 0 0 0 0 0 0 0 0
Corporates - Of Which: Specialised Lending 0 0 0 0 0 0 0 0 0 0 0 0
Corporates - Of Which: SME 0 0 0 0 0 0 0 0 0 0 0 0
Retail 0 0 0 0 0 0 0 0 0 0 0 0
Retail - Secured on real estate property 0 0 0 0 0 0 0 0 0 0 0 0
Retail - Secured on real estate property - Of Which: SME 0 0 0 0 0 0 0 0 0 0 0 0
Retail - Secured on real estate property - Of Which: non-
SME0 0 0 0 0 0 0 0 0 0 0 0
Retail - Qualifying Revolving 0 0 0 0 0 0 0 0 0 0 0 0
Retail - Other Retail 0 0 0 0 0 0 0 0 0 0 0 0
Retail - Other Retail - Of Which: SME 0 0 0 0 0 0 0 0 0 0 0 0
Retail - Other Retail - Of Which: non-SME 0 0 0 0 0 0 0 0 0 0 0 0
Equity 0 0 0 0 0 0 0 0 0 0 0 0
Securitisation
Other non credit-obligation assets
IRB Total(1) Original exposure, unlike Exposure value, is reported before taking into account any effect due to credit conversion factors or credit risk mitigation techniques (e.g. substitution effects).
10 (mln EUR, %)
Of which:
defaulted
Of which:
defaulted
Of which:
defaulted
Of which:
defaulted
Central banks and central governments 0 0 0 0 0 0 0 0 0 0 0 0
Institutions 0 0 0 0 0 0 0 0 0 0 0 0
Corporates 0 0 0 0 0 0 0 0 0 0 0 0
Corporates - Of Which: Specialised Lending 0 0 0 0 0 0 0 0 0 0 0 0
Corporates - Of Which: SME 0 0 0 0 0 0 0 0 0 0 0 0
Retail 0 0 0 0 0 0 0 0 0 0 0 0
Retail - Secured on real estate property 0 0 0 0 0 0 0 0 0 0 0 0
Retail - Secured on real estate property - Of Which: SME 0 0 0 0 0 0 0 0 0 0 0 0
Retail - Secured on real estate property - Of Which: non-
SME0 0 0 0 0 0 0 0 0 0 0 0
Retail - Qualifying Revolving 0 0 0 0 0 0 0 0 0 0 0 0
Retail - Other Retail 0 0 0 0 0 0 0 0 0 0 0 0
Retail - Other Retail - Of Which: SME 0 0 0 0 0 0 0 0 0 0 0 0
Retail - Other Retail - Of Which: non-SME 0 0 0 0 0 0 0 0 0 0 0 0
Equity 0 0 0 0 0 0 0 0 0 0 0 0
Securitisation
Other non credit-obligation assets
IRB Total(1) Original exposure, unlike Exposure value, is reported before taking into account any effect due to credit conversion factors or credit risk mitigation techniques (e.g. substitution effects).
IRB Approach
As of 31/12/2017 As of 30/06/2018
Risk exposure amount Value
adjustments
and
provisions
Country of Counterpart 8
IRB Approach
As of 31/12/2017 As of 30/06/2018
Original Exposure1
Exposure
Value1
Risk exposure amount Value
adjustments
and
provisions
Original Exposure1
Exposure
Value1
Risk exposure amount Value
adjustments
and
provisions
Country of Counterpart 9
IRB Approach
As of 31/12/2017 As of 30/06/2018
Original Exposure1
Exposure
Value1
Risk exposure amount Value
adjustments
and
provisions
Original Exposure1
Exposure
Value1
Risk exposure amount Value
adjustments
and
provisions
Country of Counterpart 10
Original Exposure1
Exposure
Value1
Risk exposure amount Value
adjustments
and
provisions
Original Exposure1
Exposure
Value1

201712 201712 201712 201712 201712 201712 201712 201712 201712 201712 201712 201712 201712 201712 201712 201712 201712 201712
2018 EU-wide Transparency Exercise
Sovereign Exposure
Lloyds Banking Group Plc
(mln EUR)
of which:
loans and
advances
of which:
debt
securities
of which:
Loans and
advances
of which:
Debt
securities
of which:
Loans and
advances
of which:
Debt
securities
of which:
Loans and
advances
of which:
Debt
securities
of which:
Loans and
advances
of which:
Debt
securities
of which:
Loans and
advances
of which:
Debt
securities
TOTAL - ALL COUNTRIES 51,687.7 1,478.8 50,208.9 11,067.5 0.0 11,067.5 20.8 0.0 20.8 39,120.5 0.0 39,120.5 1,478.8 1,478.8 0.0 0.0 0.0 0.0
Austria 0.0 0.0 0.0
Belgium 25.2 0.0 25.2
Bulgaria 0.0 0.0 0.0
Croatia 0.0 0.0 0.0
Cyprus 0.0 0.0 0.0
Czech Republic 0.0 0.0 0.0
Denmark 0.0 0.0 0.0
Estonia 0.0 0.0 0.0
Finland 17.3 0.0 17.3
France 172.2 0.0 172.2
Germany 186.1 0.0 186.1
Greece 0.0 0.0 0.0
Hungary 0.0 0.0 0.0
Ireland 0.0 0.0 0.0
Italy 0.0 0.0 0.0
Latvia 0.0 0.0 0.0
Lithuania 0.0 0.0 0.0
Luxembourg 0.0 0.0 0.0
Malta 0.0 0.0 0.0
Netherlands 0.0 0.0 0.0
Poland 0.0 0.0 0.0
Portugal 0.0 0.0 0.0
Romania 0.0 0.0 0.0
Slovakia 0.0 0.0 0.0
Slovenia 0.0 0.0 0.0
Spain 0.0 0.0 0.0
Sweden 347.8 0.0 347.8
United Kingdom 43,019.9 1,304.3 41,715.6
Iceland 0.0 0.0 0.0
Liechtenstein 0.0 0.0 0.0
Norway 0.0 0.0 0.0
Switzerland 0.0 0.0 0.0
Australia 0.0 0.0 0.0
Canada 83.7 0.0 83.7
China 0.0 0.0 0.0
Hong Kong 0.0 0.0 0.0
Japan 0.0 0.0 0.0
U.S. 7,660.8 0.0 7,660.8
Other advanced economies non EEA 0.0 0.0 0.0
Other Central and eastern Europe countries non EEA 0.0 0.0 0.0
Middle East 173.2 173.2 0.0
Latin America and the Caribbean 0.0 0.0 0.0
Africa 0.0 0.0 0.0
Others 1.3 1.3 0.0
Note:
Information disclosed in this template is sourced from FINREP templates F 20 and F 04.
The information reported covers all exposures to “General governments” as defined in paragraph 41 (b) of Annex V of ITS on Supervisory reporting: “central governments, state or regional governments, and local governments, including administrative bodies and non-commercial undertakings, but excluding public companies and private companies held by these administrations
that have a commercial activity (which shall be reported under “non-financial corporations”); social security funds; and international organisations, such as the European Community, the International Monetary Fund and the Bank for International Settlements.
Regions:
Other advanced non EEA: Israel, Korea, New Zealand, Russia, San Marino, Singapore and Taiwan.
Other CEE non EEA: Albania, Bosnia and Herzegovina, FYR Macedonia, Montenegro, Serbia and Turkey.
Middle East: Bahrain, Djibouti, Iran, Iraq, Jordan, Kuwait, Lebanon, Libya, Oman, Qatar, Saudi Arabia, Sudan, Syria, United Arab Emirates and Yemen.
(1) Includes "Trading financial assets" portfolio for banks reporting under GAAP(2) Includes "Non-trading non-derivative financial assets measured at fair value through profit or loss" portfolio for banks reporting under GAAP(3) Includes "Non-trading non-derivative financial assets measured at fair value to equity" portfolio for banks reporting under GAAP(4) Includes "Non-trading debt instruments measured at a cost-based method" and "Other non-trading non-derivative financial assets" portfolio for banks reporting under GAAP
Latin America: Argentina, Belize, Bolivia, Brazil, Chile, Colombia, Costa Rica, Dominica, Dominican Republic, Ecuador, El Salvador, Grenada, Guatemala, Guyana, Haiti, Honduras, Jamaica, Mexico, Nicaragua, Panama, Paraguay, Peru, St. Kitts and Nevis, St. Lucia, St. Vincent and the Grenadines, Suriname, Trinidad and Tobago, Uruguay, Venezuela,Antigua And Barbuda, Aruba, Bahamas, Barbados,
Cayman Islands, Cuba, French Guiana, Guadeloupe, Martinique, Puerto Rico, Saint Barthélemy, Turks And Caicos Islands, Virgin Islands (British), Virgin Islands (U.S. ).
Africa: Algeria, Egypt, Morocco, South Africa, Angola, Benin, Botswana, Burkina Faso, Burundi, Cameroon, Cape Verde, Central African Republic, Chad, Comoros, Congo, Congo, The Democratic Republic Of The, Côte D'Ivoire, Equatorial Guinea, Eritrea, Ethiopia, Gabon, Gambia, Ghana, Guinea, Guinea-Bissau, Kenya, Lesotho, Liberia, Madagascar, Malawi, Mali, Mauritius, Mauritania, Mozambique, Namibia,
Niger, Nigeria, Rwanda, Sao Tome And Principe, Senegal, Seychelles, Sierra Leone, South Sudan, Swaziland, Tanzania, United Republic Of, Togo, Uganda, Zambia, Zimbabwe and Tunisia.
As of 31/12/2017
Country / Region
Financial assets: Carrying Amount
Memo: breakdown by accounting portfolio
Held for
trading1
Designated at
fair value
through profit
or loss2
Available-for-
sale3
Loans and
Receivables4
Held-to-
maturity
investments

201806 201806 201806 201806 201806 201806 201806 201806 201806 201806 201806 201806 201806
2018 EU-wide Transparency Exercise
General governments exposures by country of the counterparty
Lloyds Banking Group Plc
(mln EUR)
[ 0 - 3M [ 0 0 0 0 0 0 0 0 0 0 0 0
[ 3M - 1Y [ 0 0 0 0 0 0 0 0 0 0 0 0
[ 1Y - 2Y [ 0 0 0 0 0 0 0 0 0 0 0 0
[ 2Y - 3Y [ 0 0 0 0 0 0 0 0 0 0 0 0
[3Y - 5Y [ 0 0 0 0 0 0 0 0 0 0 0 0
[5Y - 10Y [ 0 0 0 0 0 0 0 0 0 0 0 0
[10Y - more 0 0 0 0 0 0 0 0 0 0 0 0Total 0 0 0 0 0 0 0 0 0 0 0 0 0
[ 0 - 3M [ 0 0 0 0 0 0 0 0 0 0 0 0
[ 3M - 1Y [ 0 0 0 0 0 0 0 0 0 0 0 0
[ 1Y - 2Y [ 0 0 0 0 0 0 0 0 0 0 0 0
[ 2Y - 3Y [ 0 0 0 0 0 0 0 0 0 0 0 0
[3Y - 5Y [ 0 0 0 0 0 0 0 0 0 0 0 0
[5Y - 10Y [ 0 0 0 0 0 0 0 0 0 0 0 0
[10Y - more 0 0 0 0 0 0 0 0 0 0 0 0Total 0 0 0 0 0 0 0 0 0 0 0 0 0
[ 0 - 3M [ 0 0 0 0 0 0 0 0 0 0 0 0
[ 3M - 1Y [ 0 0 0 0 0 0 0 0 0 0 0 0
[ 1Y - 2Y [ 0 0 0 0 0 0 0 0 0 0 0 0
[ 2Y - 3Y [ 0 0 0 0 0 0 0 0 0 0 0 0
[3Y - 5Y [ 0 0 0 0 0 0 0 0 0 0 0 0
[5Y - 10Y [ 0 0 0 0 0 0 0 0 0 0 0 0
[10Y - more 0 0 0 0 0 0 0 0 0 0 0 0Total 0 0 0 0 0 0 0 0 0 0 0 0 0
[ 0 - 3M [ 0 0 0 0 0 0 0 0 0 0 0 0
[ 3M - 1Y [ 0 0 0 0 0 0 0 0 0 0 0 0
[ 1Y - 2Y [ 0 0 0 0 0 0 0 0 0 0 0 0
[ 2Y - 3Y [ 0 0 0 0 0 0 0 0 0 0 0 0
[3Y - 5Y [ 0 0 0 0 0 0 0 0 0 0 0 0
[5Y - 10Y [ 0 0 0 0 0 0 0 0 0 0 0 0
[10Y - more 0 0 0 0 0 0 0 0 0 0 0 0Total 0 0 0 0 0 0 0 0 0 0 0 0 0
[ 0 - 3M [ 0 0 0 0 0 0 0 0 0 0 0 0
[ 3M - 1Y [ 0 0 0 0 0 0 0 0 0 0 0 0
[ 1Y - 2Y [ 0 0 0 0 0 0 0 0 0 0 0 0
[ 2Y - 3Y [ 0 0 0 0 0 0 0 0 0 0 0 0
[3Y - 5Y [ 0 0 0 0 0 0 0 0 0 0 0 0
[5Y - 10Y [ 0 0 0 0 0 0 0 0 0 0 0 0
[10Y - more 0 0 0 0 0 0 0 0 0 0 0 0Total 0 0 0 0 0 0 0 0 0 0 0 0 0
[ 0 - 3M [ 0 0 0 0 0 0 0 0 0 0 0 0
[ 3M - 1Y [ 0 0 0 0 0 0 0 0 0 0 0 0
[ 1Y - 2Y [ 0 0 0 0 0 0 0 0 0 0 0 0
[ 2Y - 3Y [ 0 0 0 0 0 0 0 0 0 0 0 0
[3Y - 5Y [ 0 0 0 0 0 0 0 0 0 0 0 0
[5Y - 10Y [ 0 0 0 0 0 0 0 0 0 0 0 0
[10Y - more 0 0 0 0 0 0 0 0 0 0 0 0Total 0 0 0 0 0 0 0 0 0 0 0 0 0
[ 0 - 3M [ 0 0 0 0 0 0 0 0 0 0 0 0
[ 3M - 1Y [ 0 0 0 0 0 0 0 0 0 0 0 0
[ 1Y - 2Y [ 0 0 0 0 0 0 0 0 0 0 0 0
[ 2Y - 3Y [ 0 0 0 0 0 0 0 0 0 0 0 0
[3Y - 5Y [ 0 0 0 0 0 0 0 0 0 0 0 0
[5Y - 10Y [ 0 0 0 0 0 0 0 0 0 0 0 0
[10Y - more 0 0 0 0 0 0 0 0 0 0 0 0Total 0 0 0 0 0 0 0 0 0 0 0 0 0
As of 30/06/2018
Direct exposures
Risk weighted
exposure amount
On balance sheet Derivatives Off balance sheet
Off-balance sheet exposures
Nominal Provisions
Carrying amount
Derivatives with positive fair value Derivatives with negative fair value
of which: Financial assets
held for trading
of which: Financial assets
designated at fair value
through profit or loss
of which: Financial assets at
fair value through other
comprehensive income
of which: Financial assets at
amortised cost
Bulgaria
Residual Maturity Country / RegionTotal gross carrying amount of non-
derivative financial assets
Total carrying amount of
non-derivative financial
assets (net of short
positions)
Notional amount Carrying amount Notional amount
Austria
Belgium
Cyprus
Czech Republic
Denmark
Estonia

201806 201806 201806 201806 201806 201806 201806 201806 201806 201806 201806 201806 201806
2018 EU-wide Transparency Exercise
General governments exposures by country of the counterparty
Lloyds Banking Group Plc
(mln EUR)
As of 30/06/2018
Direct exposures
Risk weighted
exposure amount
On balance sheet Derivatives Off balance sheet
Off-balance sheet exposures
Nominal Provisions
Carrying amount
Derivatives with positive fair value Derivatives with negative fair value
of which: Financial assets
held for trading
of which: Financial assets
designated at fair value
through profit or loss
of which: Financial assets at
fair value through other
comprehensive income
of which: Financial assets at
amortised cost
Residual Maturity Country / RegionTotal gross carrying amount of non-
derivative financial assets
Total carrying amount of
non-derivative financial
assets (net of short
positions)
Notional amount Carrying amount Notional amount
Austria
[ 0 - 3M [ 0 0 0 0 0 0 0 0 0 0 0 0
[ 3M - 1Y [ 0 0 0 0 0 0 0 0 0 0 0 0
[ 1Y - 2Y [ 0 0 0 0 0 0 0 0 0 0 0 0
[ 2Y - 3Y [ 17 17 0 0 17 0 0 0 0 0 0 0
[3Y - 5Y [ 0 0 0 0 0 0 0 0 0 0 0 0
[5Y - 10Y [ 0 0 0 0 0 0 0 0 0 0 0 0
[10Y - more 0 0 0 0 0 0 0 0 0 0 0 0Total 17 17 0 0 17 0 0 0 0 0 0 0 0
[ 0 - 3M [ 0 0 0 0 0 0 0 0 0 0 0 0
[ 3M - 1Y [ 39 39 0 0 39 0 0 0 0 0 0 0
[ 1Y - 2Y [ 69 69 0 0 69 0 0 0 0 0 0 0
[ 2Y - 3Y [ 62 62 0 0 62 0 0 0 0 0 0 0
[3Y - 5Y [ 0 0 0 0 0 0 0 0 0 0 0 0
[5Y - 10Y [ 0 0 0 0 0 0 0 0 0 0 0 0
[10Y - more 0 0 0 0 0 0 0 0 0 0 0 0Total 169 169 0 0 169 0 0 0 0 0 0 0 0
[ 0 - 3M [ 20 20 0 0 20 0 0 0 0 0 0 0
[ 3M - 1Y [ 8 8 0 0 21 0 0 0 0 0 0 0
[ 1Y - 2Y [ 76 76 0 0 67 0 0 0 0 0 0 0
[ 2Y - 3Y [ 45 36 0 0 17 0 0 0 0 0 0 0
[3Y - 5Y [ 10 10 0 0 0 0 0 0 0 0 0 0
[5Y - 10Y [ 67 67 0 0 0 0 0 0 0 0 0 0
[10Y - more 1 -82 0 0 0 0 0 0 0 0 0 0Total 228 135 0 0 125 0 0 0 0 0 0 0 0
[ 0 - 3M [ 0 0 0 0 0 0 0 0 0 0 0 0
[ 3M - 1Y [ 0 0 0 0 0 0 0 0 0 0 0 0
[ 1Y - 2Y [ 0 0 0 0 0 0 0 0 0 0 0 0
[ 2Y - 3Y [ 0 0 0 0 0 0 0 0 0 0 0 0
[3Y - 5Y [ 0 0 0 0 0 0 0 0 0 0 0 0
[5Y - 10Y [ 0 0 0 0 0 0 0 0 0 0 0 0
[10Y - more 0 0 0 0 0 0 0 0 0 0 0 0Total 0 0 0 0 0 0 0 0 0 0 0 0 0
[ 0 - 3M [ 0 0 0 0 0 0 0 0 0 0 0 0
[ 3M - 1Y [ 0 0 0 0 0 0 0 0 0 0 0 0
[ 1Y - 2Y [ 0 0 0 0 0 0 0 0 0 0 0 0
[ 2Y - 3Y [ 0 0 0 0 0 0 0 0 0 0 0 0
[3Y - 5Y [ 0 0 0 0 0 0 0 0 0 0 0 0
[5Y - 10Y [ 0 0 0 0 0 0 0 0 0 0 0 0
[10Y - more 0 0 0 0 0 0 0 0 0 0 0 0Total 0 0 0 0 0 0 0 0 0 0 0 0 0
[ 0 - 3M [ 0 0 0 0 0 0 0 0 0 0 0 0
[ 3M - 1Y [ 0 0 0 0 0 0 0 0 0 0 0 0
[ 1Y - 2Y [ 0 0 0 0 0 0 0 0 0 0 0 0
[ 2Y - 3Y [ 0 0 0 0 0 0 0 0 0 0 0 0
[3Y - 5Y [ 0 0 0 0 0 0 0 0 0 0 0 0
[5Y - 10Y [ 0 0 0 0 0 0 0 0 0 0 0 0
[10Y - more 0 0 0 0 0 0 0 0 0 0 0 0Total 0 0 0 0 0 0 0 0 0 0 0 0 0
[ 0 - 3M [ 0 0 0 0 0 0 0 0 0 0 0 0
[ 3M - 1Y [ 0 0 0 0 0 0 0 0 0 0 0 0
[ 1Y - 2Y [ 0 0 0 0 0 0 0 0 0 0 0 0
[ 2Y - 3Y [ 0 0 0 0 0 0 0 0 0 0 0 0
[3Y - 5Y [ 0 0 0 0 0 0 0 0 0 0 0 0
[5Y - 10Y [ 0 0 0 0 0 0 0 0 0 0 0 0
[10Y - more 0 0 0 0 0 0 0 0 0 0 0 0Total 0 0 0 0 0 0 0 0 0 0 0 0 0
Finland
France
Germany
Croatia
Greece
Hungary
Ireland

201806 201806 201806 201806 201806 201806 201806 201806 201806 201806 201806 201806 201806
2018 EU-wide Transparency Exercise
General governments exposures by country of the counterparty
Lloyds Banking Group Plc
(mln EUR)
As of 30/06/2018
Direct exposures
Risk weighted
exposure amount
On balance sheet Derivatives Off balance sheet
Off-balance sheet exposures
Nominal Provisions
Carrying amount
Derivatives with positive fair value Derivatives with negative fair value
of which: Financial assets
held for trading
of which: Financial assets
designated at fair value
through profit or loss
of which: Financial assets at
fair value through other
comprehensive income
of which: Financial assets at
amortised cost
Residual Maturity Country / RegionTotal gross carrying amount of non-
derivative financial assets
Total carrying amount of
non-derivative financial
assets (net of short
positions)
Notional amount Carrying amount Notional amount
Austria
[ 0 - 3M [ 0 0 0 0 0 0 0 0 0 0 0 0
[ 3M - 1Y [ 0 0 0 0 0 0 0 0 0 0 0 0
[ 1Y - 2Y [ 0 0 0 0 0 0 0 0 0 0 0 0
[ 2Y - 3Y [ 0 0 0 0 0 0 0 0 0 0 0 0
[3Y - 5Y [ 0 0 0 0 0 0 0 0 0 0 0 0
[5Y - 10Y [ 0 0 0 0 0 0 0 0 0 0 0 0
[10Y - more 0 0 0 0 0 0 0 0 0 0 0 0Total 0 0 0 0 0 0 0 0 0 0 0 0 0
[ 0 - 3M [ 0 0 0 0 0 0 0 0 0 0 0 0
[ 3M - 1Y [ 0 0 0 0 0 0 0 0 0 0 0 0
[ 1Y - 2Y [ 0 0 0 0 0 0 0 0 0 0 0 0
[ 2Y - 3Y [ 0 0 0 0 0 0 0 0 0 0 0 0
[3Y - 5Y [ 0 0 0 0 0 0 0 0 0 0 0 0
[5Y - 10Y [ 0 0 0 0 0 0 0 0 0 0 0 0
[10Y - more 0 0 0 0 0 0 0 0 0 0 0 0Total 0 0 0 0 0 0 0 0 0 0 0 0 0
[ 0 - 3M [ 0 0 0 0 0 0 0 0 0 0 0 0
[ 3M - 1Y [ 0 0 0 0 0 0 0 0 0 0 0 0
[ 1Y - 2Y [ 0 0 0 0 0 0 0 0 0 0 0 0
[ 2Y - 3Y [ 0 0 0 0 0 0 0 0 0 0 0 0
[3Y - 5Y [ 0 0 0 0 0 0 0 0 0 0 0 0
[5Y - 10Y [ 0 0 0 0 0 0 0 0 0 0 0 0
[10Y - more 0 0 0 0 0 0 0 0 0 0 0 0Total 0 0 0 0 0 0 0 0 0 0 0 0 0
[ 0 - 3M [ 0 0 0 0 0 0 0 0 0 0 0 0
[ 3M - 1Y [ 0 0 0 0 0 0 0 0 0 0 0 0
[ 1Y - 2Y [ 0 0 0 0 0 0 0 0 0 0 0 0
[ 2Y - 3Y [ 0 0 0 0 0 0 0 0 0 0 0 0
[3Y - 5Y [ 0 0 0 0 0 0 0 0 0 0 0 0
[5Y - 10Y [ 0 0 0 0 0 0 0 0 0 0 0 0
[10Y - more 0 0 0 0 0 0 0 0 0 0 0 0Total 0 0 0 0 0 0 0 0 0 0 0 0 0
[ 0 - 3M [ 0 0 0 0 0 0 0 0 0 0 0 0
[ 3M - 1Y [ 0 0 0 0 0 0 0 0 0 0 0 0
[ 1Y - 2Y [ 0 0 0 0 0 0 0 0 0 0 0 0
[ 2Y - 3Y [ 0 0 0 0 0 0 0 0 0 0 0 0
[3Y - 5Y [ 0 0 0 0 0 0 0 0 0 0 0 0
[5Y - 10Y [ 0 0 0 0 0 0 0 0 0 0 0 0
[10Y - more 0 0 0 0 0 0 0 0 0 0 0 0Total 0 0 0 0 0 0 0 0 0 0 0 0 0
[ 0 - 3M [ 0 0 0 0 0 0 0 0 0 0 0 0
[ 3M - 1Y [ 0 0 0 0 0 0 0 0 0 0 0 0
[ 1Y - 2Y [ 0 0 0 0 0 0 0 0 0 0 0 0
[ 2Y - 3Y [ 0 0 0 0 0 0 0 0 0 0 0 0
[3Y - 5Y [ 0 0 0 0 0 0 0 0 0 0 0 0
[5Y - 10Y [ 0 0 0 0 0 0 0 0 0 0 0 0
[10Y - more 0 0 0 0 0 0 0 0 0 0 0 0Total 0 0 0 0 0 0 0 0 0 0 0 0 0
[ 0 - 3M [ 0 0 0 0 0 0 0 0 0 0 0 0
[ 3M - 1Y [ 0 0 0 0 0 0 0 0 0 0 0 0
[ 1Y - 2Y [ 0 0 0 0 0 0 0 0 0 0 0 0
[ 2Y - 3Y [ 0 0 0 0 0 0 0 0 0 0 0 0
[3Y - 5Y [ 0 0 0 0 0 0 0 0 0 0 0 0
[5Y - 10Y [ 0 0 0 0 0 0 0 0 0 0 0 0
[10Y - more 0 0 0 0 0 0 0 0 0 0 0 0Total 0 0 0 0 0 0 0 0 0 0 0 0 0
Italy
Latvia
Lithuania
Luxembourg
Malta
Netherlands
Poland

201806 201806 201806 201806 201806 201806 201806 201806 201806 201806 201806 201806 201806
2018 EU-wide Transparency Exercise
General governments exposures by country of the counterparty
Lloyds Banking Group Plc
(mln EUR)
As of 30/06/2018
Direct exposures
Risk weighted
exposure amount
On balance sheet Derivatives Off balance sheet
Off-balance sheet exposures
Nominal Provisions
Carrying amount
Derivatives with positive fair value Derivatives with negative fair value
of which: Financial assets
held for trading
of which: Financial assets
designated at fair value
through profit or loss
of which: Financial assets at
fair value through other
comprehensive income
of which: Financial assets at
amortised cost
Residual Maturity Country / RegionTotal gross carrying amount of non-
derivative financial assets
Total carrying amount of
non-derivative financial
assets (net of short
positions)
Notional amount Carrying amount Notional amount
Austria
[ 0 - 3M [ 0 0 0 0 0 0 0 0 0 0 0 0
[ 3M - 1Y [ 0 0 0 0 0 0 0 0 0 0 0 0
[ 1Y - 2Y [ 0 0 0 0 0 0 0 0 0 0 0 0
[ 2Y - 3Y [ 0 0 0 0 0 0 0 0 0 0 0 0
[3Y - 5Y [ 0 0 0 0 0 0 0 0 0 0 0 0
[5Y - 10Y [ 0 0 0 0 0 0 0 0 0 0 0 0
[10Y - more 0 0 0 0 0 0 0 0 0 0 0 0Total 0 0 0 0 0 0 0 0 0 0 0 0 0
[ 0 - 3M [ 0 0 0 0 0 0 0 0 0 0 0 0
[ 3M - 1Y [ 0 0 0 0 0 0 0 0 0 0 0 0
[ 1Y - 2Y [ 0 0 0 0 0 0 0 0 0 0 0 0
[ 2Y - 3Y [ 0 0 0 0 0 0 0 0 0 0 0 0
[3Y - 5Y [ 0 0 0 0 0 0 0 0 0 0 0 0
[5Y - 10Y [ 0 0 0 0 0 0 0 0 0 0 0 0
[10Y - more 0 0 0 0 0 0 0 0 0 0 0 0Total 0 0 0 0 0 0 0 0 0 0 0 0 0
[ 0 - 3M [ 0 0 0 0 0 0 0 0 0 0 0 0
[ 3M - 1Y [ 0 0 0 0 0 0 0 0 0 0 0 0
[ 1Y - 2Y [ 0 0 0 0 0 0 0 0 0 0 0 0
[ 2Y - 3Y [ 0 0 0 0 0 0 0 0 0 0 0 0
[3Y - 5Y [ 0 0 0 0 0 0 0 0 0 0 0 0
[5Y - 10Y [ 0 0 0 0 0 0 0 0 0 0 0 0
[10Y - more 0 0 0 0 0 0 0 0 0 0 0 0Total 0 0 0 0 0 0 0 0 0 0 0 0 0
[ 0 - 3M [ 0 0 0 0 0 0 0 0 0 0 0 0
[ 3M - 1Y [ 0 0 0 0 0 0 0 0 0 0 0 0
[ 1Y - 2Y [ 0 0 0 0 0 0 0 0 0 0 0 0
[ 2Y - 3Y [ 0 0 0 0 0 0 0 0 0 0 0 0
[3Y - 5Y [ 0 0 0 0 0 0 0 0 0 0 0 0
[5Y - 10Y [ 0 0 0 0 0 0 0 0 0 0 0 0
[10Y - more 0 0 0 0 0 0 0 0 0 0 0 0Total 0 0 0 0 0 0 0 0 0 0 0 0 0
[ 0 - 3M [ 0 0 0 0 0 0 0 0 0 0 0 0
[ 3M - 1Y [ 0 0 0 0 0 0 0 0 0 0 0 0
[ 1Y - 2Y [ 0 0 0 0 0 0 0 0 0 0 0 0
[ 2Y - 3Y [ 0 0 0 0 0 0 0 0 0 0 0 0
[3Y - 5Y [ 0 0 0 0 0 0 0 0 0 0 0 0
[5Y - 10Y [ 0 0 0 0 0 0 0 0 0 0 0 0
[10Y - more 0 0 0 0 0 0 0 0 0 0 0 0Total 0 0 0 0 0 0 0 0 0 0 0 0 0
[ 0 - 3M [ 12 12 0 0 12 0 0 0 0 0 0 0
[ 3M - 1Y [ 90 90 0 0 90 0 0 0 0 0 0 0
[ 1Y - 2Y [ 156 156 0 0 156 0 0 0 0 0 0 0
[ 2Y - 3Y [ 41 41 0 0 41 0 0 0 0 0 0 0
[3Y - 5Y [ 41 41 0 0 41 0 0 0 0 0 0 0
[5Y - 10Y [ 0 0 0 0 0 0 0 0 0 0 0 0
[10Y - more 0 0 0 0 0 0 0 0 0 0 0 0Total 340 340 0 0 340 0 0 0 0 0 0 0 0
[ 0 - 3M [ 978 978 0 0 979 0 0 0 0 0 0 0
[ 3M - 1Y [ 966 966 0 0 0 1,023 0 0 0 0 0 0
[ 1Y - 2Y [ 2,051 2,037 0 0 1,482 113 0 0 0 0 0 0
[ 2Y - 3Y [ 2,458 1,833 0 0 2,189 20 0 0 0 0 0 0
[3Y - 5Y [ 8,143 7,460 0 0 6,204 37 0 0 0 0 0 0
[5Y - 10Y [ 7,966 6,864 0 0 7,302 36 0 0 0 0 0 0
[10Y - more 10,287 9,823 0 0 1,164 42 0 0 0 0 0 0Total 32,848 29,961 0 0 19,321 1,270 0 0 0 0 0 0 0
Sweden
Portugal
Romania
Slovakia
Slovenia
Spain
United Kingdom
201806 201806 201806 201806 201806 201806 201806 201806 201806 201806 201806 201806 201806
2018 EU-wide Transparency Exercise
General governments exposures by country of the counterparty
Lloyds Banking Group Plc
(mln EUR)
As of 30/06/2018
Direct exposures
Risk weighted
exposure amount
On balance sheet Derivatives Off balance sheet
Off-balance sheet exposures
Nominal Provisions
Carrying amount
Derivatives with positive fair value Derivatives with negative fair value
of which: Financial assets
held for trading
of which: Financial assets
designated at fair value
through profit or loss
of which: Financial assets at
fair value through other
comprehensive income
of which: Financial assets at
amortised cost
Residual Maturity Country / RegionTotal gross carrying amount of non-
derivative financial assets
Total carrying amount of
non-derivative financial
assets (net of short
positions)
Notional amount Carrying amount Notional amount
Austria
[ 0 - 3M [ 0 0 0 0 0 0 0 0 0 0 0 0
[ 3M - 1Y [ 0 0 0 0 0 0 0 0 0 0 0 0
[ 1Y - 2Y [ 0 0 0 0 0 0 0 0 0 0 0 0
[ 2Y - 3Y [ 0 0 0 0 0 0 0 0 0 0 0 0
[3Y - 5Y [ 0 0 0 0 0 0 0 0 0 0 0 0
[5Y - 10Y [ 0 0 0 0 0 0 0 0 0 0 0 0
[10Y - more 0 0 0 0 0 0 0 0 0 0 0 0Total 0 0 0 0 0 0 0 0 0 0 0 0 0
[ 0 - 3M [ 0 0 0 0 0 0 0 0 0 0 0 0
[ 3M - 1Y [ 0 0 0 0 0 0 0 0 0 0 0 0
[ 1Y - 2Y [ 0 0 0 0 0 0 0 0 0 0 0 0
[ 2Y - 3Y [ 0 0 0 0 0 0 0 0 0 0 0 0
[3Y - 5Y [ 0 0 0 0 0 0 0 0 0 0 0 0
[5Y - 10Y [ 0 0 0 0 0 0 0 0 0 0 0 0
[10Y - more 0 0 0 0 0 0 0 0 0 0 0 0Total 0 0 0 0 0 0 0 0 0 0 0 0 0
[ 0 - 3M [ 0 0 0 0 0 0 0 0 0 0 0 0
[ 3M - 1Y [ 0 0 0 0 0 0 0 0 0 0 0 0
[ 1Y - 2Y [ 0 0 0 0 0 0 0 0 0 0 0 0
[ 2Y - 3Y [ 0 0 0 0 0 0 0 0 0 0 0 0
[3Y - 5Y [ 0 0 0 0 0 0 0 0 0 0 0 0
[5Y - 10Y [ 0 0 0 0 0 0 0 0 0 0 0 0
[10Y - more 0 0 0 0 0 0 0 0 0 0 0 0Total 0 0 0 0 0 0 0 0 0 0 0 0 0
[ 0 - 3M [ 0 0 0 0 0 0 0 0 0 0 0 0
[ 3M - 1Y [ 0 0 0 0 0 0 0 0 0 0 0 0
[ 1Y - 2Y [ 0 0 0 0 0 0 0 0 0 0 0 0
[ 2Y - 3Y [ 0 0 0 0 0 0 0 0 0 0 0 0
[3Y - 5Y [ 0 0 0 0 0 0 0 0 0 0 0 0
[5Y - 10Y [ 0 0 0 0 0 0 0 0 0 0 0 0
[10Y - more 0 0 0 0 0 0 0 0 0 0 0 0Total 0 0 0 0 0 0 0 0 0 0 0 0 0
[ 0 - 3M [ 0 0 0 0 0 0 0 0 0 0 0 0
[ 3M - 1Y [ 86 86 0 0 86 0 0 0 0 0 0 0
[ 1Y - 2Y [ 0 0 0 0 0 0 0 0 0 0 0 0
[ 2Y - 3Y [ 0 0 0 0 0 0 0 0 0 0 0 0
[3Y - 5Y [ 21 21 0 0 21 0 0 0 0 0 0 0
[5Y - 10Y [ 0 0 0 0 0 0 0 0 0 0 0 0
[10Y - more 0 0 0 0 0 0 0 0 0 0 0 0Total 106 106 0 0 106 0 0 0 0 0 0 0 0
[ 0 - 3M [ 0 0 0 0 0 0 0 0 0 0 0 0
[ 3M - 1Y [ 0 0 0 0 0 0 0 0 0 0 0 0
[ 1Y - 2Y [ 0 0 0 0 0 0 0 0 0 0 0 0
[ 2Y - 3Y [ 0 0 0 0 0 0 0 0 0 0 0 0
[3Y - 5Y [ 0 0 0 0 0 0 0 0 0 0 0 0
[5Y - 10Y [ 0 0 0 0 0 0 0 0 0 0 0 0
[10Y - more 0 0 0 0 0 0 0 0 0 0 0 0Total 0 0 0 0 0 0 0 0 0 0 0 0 0
[ 0 - 3M [ 0 0 0 0 0 0 0 0 0 0 0 0
[ 3M - 1Y [ 0 0 0 0 0 0 0 0 0 0 0 0
[ 1Y - 2Y [ 0 0 0 0 0 0 0 0 0 0 0 0
[ 2Y - 3Y [ 0 0 0 0 0 0 0 0 0 0 0 0
[3Y - 5Y [ 0 0 0 0 0 0 0 0 0 0 0 0
[5Y - 10Y [ 0 0 0 0 0 0 0 0 0 0 0 0
[10Y - more 0 0 0 0 0 0 0 0 0 0 0 0Total 0 0 0 0 0 0 0 0 0 0 0 0 0
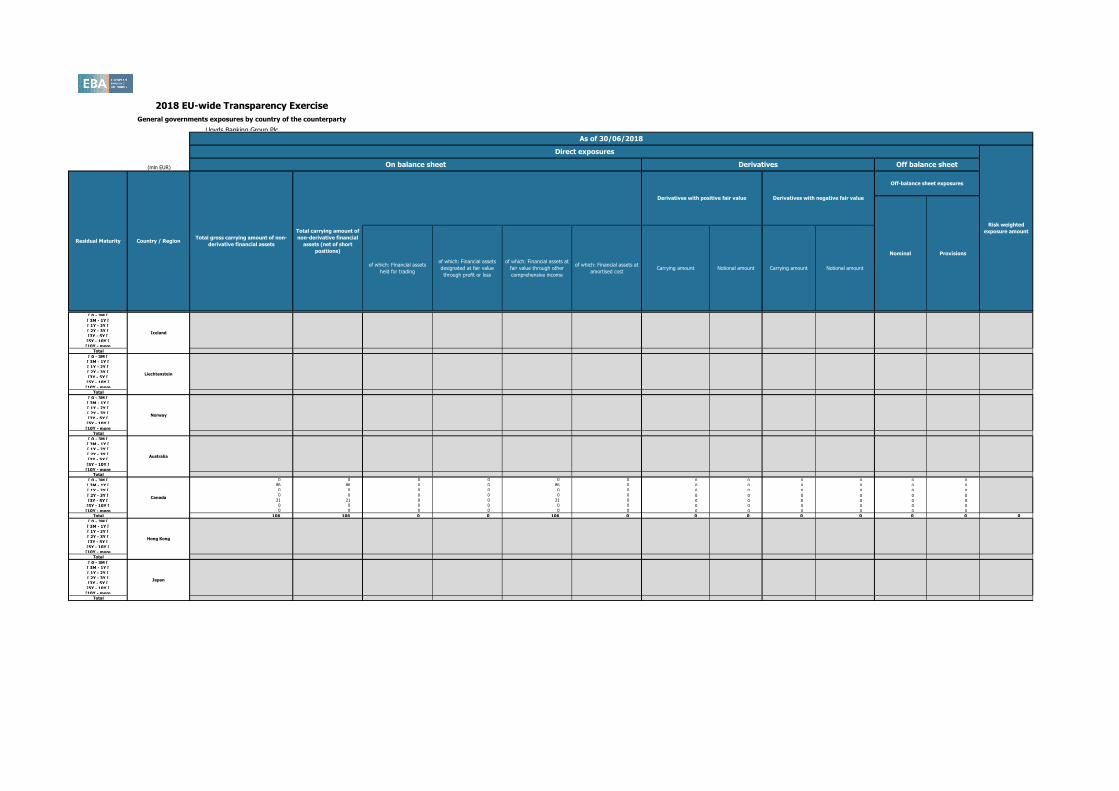
Iceland
Liechtenstein
Norway
Australia
Canada
Hong Kong
Japan

201806 201806 201806 201806 201806 201806 201806 201806 201806 201806 201806 201806 201806
2018 EU-wide Transparency Exercise
General governments exposures by country of the counterparty
Lloyds Banking Group Plc
(mln EUR)
As of 30/06/2018
Direct exposures
Risk weighted
exposure amount
On balance sheet Derivatives Off balance sheet
Off-balance sheet exposures
Nominal Provisions
Carrying amount
Derivatives with positive fair value Derivatives with negative fair value
of which: Financial assets
held for trading
of which: Financial assets
designated at fair value
through profit or loss
of which: Financial assets at
fair value through other
comprehensive income
of which: Financial assets at
amortised cost
Residual Maturity Country / RegionTotal gross carrying amount of non-
derivative financial assets
Total carrying amount of
non-derivative financial
assets (net of short
positions)
Notional amount Carrying amount Notional amount
Austria
[ 0 - 3M [ 103 103 0 0 103 0 0 0 0 0 0 0
[ 3M - 1Y [ 0 0 0 0 0 0 0 0 0 0 0 0
[ 1Y - 2Y [ 1,646 1,646 0 0 1,662 0 0 0 0 0 0 0
[ 2Y - 3Y [ 1,989 1,765 0 0 1,995 0 0 0 0 0 0 0
[3Y - 5Y [ 631 631 0 0 639 0 0 0 0 0 0 0
[5Y - 10Y [ 1,978 1,978 0 0 1,942 0 0 0 0 0 0 0
[10Y - more 2,715 2,636 0 0 2,718 0 0 0 0 0 0 0Total 9,061 8,758 0 0 9,059 0 0 0 0 0 0 0 0
[ 0 - 3M [ 0 0 0 0 0 0 0 0 0 0 0 0
[ 3M - 1Y [ 0 0 0 0 0 0 0 0 0 0 0 0
[ 1Y - 2Y [ 0 0 0 0 0 0 0 0 0 0 0 0
[ 2Y - 3Y [ 0 0 0 0 0 0 0 0 0 0 0 0
[3Y - 5Y [ 0 0 0 0 0 0 0 0 0 0 0 0
[5Y - 10Y [ 0 0 0 0 0 0 0 0 0 0 0 0
[10Y - more 0 0 0 0 0 0 0 0 0 0 0 0Total 0 0 0 0 0 0 0 0 0 0 0 0 0
[ 0 - 3M [ 0 0 0 0 0 0 0 0 0 0 0 0
[ 3M - 1Y [ 0 0 0 0 0 0 0 0 0 0 0 0
[ 1Y - 2Y [ 0 0 0 0 0 0 0 0 0 0 0 0
[ 2Y - 3Y [ 0 0 0 0 0 0 0 0 0 0 0 0
[3Y - 5Y [ 0 0 0 0 0 0 0 0 0 0 0 0
[5Y - 10Y [ 0 0 0 0 0 0 0 0 0 0 0 0
[10Y - more 0 0 0 0 0 0 0 0 0 0 0 0Total 0 0 0 0 0 0 0 0 0 0 0 0 0
[ 0 - 3M [ 0 0 0 0 0 0 0 0 0 0 0 0
[ 3M - 1Y [ 0 0 0 0 0 0 0 0 0 0 0 0
[ 1Y - 2Y [ 0 0 0 0 0 0 0 0 0 0 0 0
[ 2Y - 3Y [ 0 0 0 0 0 0 0 0 0 0 0 0
[3Y - 5Y [ 0 0 0 0 0 0 0 0 0 0 0 0
[5Y - 10Y [ 0 0 0 0 0 0 0 0 0 0 0 0
[10Y - more 0 0 0 0 0 0 0 0 0 0 0 0Total 0 0 0 0 0 0 0 0 0 0 0 0 0
[ 0 - 3M [ 0 0 0 0 0 0 0 0 0 0 0 0
[ 3M - 1Y [ 0 0 0 0 0 0 0 0 0 0 0 0
[ 1Y - 2Y [ 0 0 0 0 0 0 0 0 0 0 0 0
[ 2Y - 3Y [ 0 0 0 0 0 0 0 0 0 0 0 0
[3Y - 5Y [ 0 0 0 0 0 0 0 0 0 0 0 0
[5Y - 10Y [ 0 0 0 0 0 0 0 0 0 0 0 0
[10Y - more 0 0 0 0 0 0 0 0 0 0 0 0Total 0 0 0 0 0 0 0 0 0 0 0 0 0
[ 0 - 3M [ 0 0 0 0 0 0 0 0 0 0 0 0
[ 3M - 1Y [ 0 0 0 0 0 0 0 0 0 0 0 0
[ 1Y - 2Y [ 0 0 0 0 0 0 0 0 0 0 0 0
[ 2Y - 3Y [ 0 0 0 0 0 0 0 0 0 0 0 0
[3Y - 5Y [ 0 0 0 0 0 0 0 0 0 0 0 0
[5Y - 10Y [ 0 0 0 0 0 0 0 0 0 0 0 0
[10Y - more 0 0 0 0 0 0 0 0 0 0 0 0Total 0 0 0 0 0 0 0 0 0 0 0 0 0
[ 0 - 3M [ 0 0 0 0 0 0 0 0 0 0 0 0
[ 3M - 1Y [ 0 0 0 0 0 0 0 0 0 0 0 0
[ 1Y - 2Y [ 0 0 0 0 0 0 0 0 0 0 0 0
[ 2Y - 3Y [ 0 0 0 0 0 0 0 0 0 0 0 0
[3Y - 5Y [ 0 0 0 0 0 0 0 0 0 0 0 0
[5Y - 10Y [ 0 0 0 0 0 0 0 0 0 0 0 0
[10Y - more 0 0 0 0 0 0 0 0 0 0 0 0Total 0 0 0 0 0 0 0 0 0 0 0 0 0
Other advanced economies
non EEA
U.S.
China
Switzerland
Other Central and eastern
Europe countries non EEA
Middle East
Latin America and the
Caribbean

201806 201806 201806 201806 201806 201806 201806 201806 201806 201806 201806 201806 201806
2018 EU-wide Transparency Exercise
General governments exposures by country of the counterparty
Lloyds Banking Group Plc
(mln EUR)
As of 30/06/2018
Direct exposures
Risk weighted
exposure amount
On balance sheet Derivatives Off balance sheet
Off-balance sheet exposures
Nominal Provisions
Carrying amount
Derivatives with positive fair value Derivatives with negative fair value
of which: Financial assets
held for trading
of which: Financial assets
designated at fair value
through profit or loss
of which: Financial assets at
fair value through other
comprehensive income
of which: Financial assets at
amortised cost
Residual Maturity Country / RegionTotal gross carrying amount of non-
derivative financial assets
Total carrying amount of
non-derivative financial
assets (net of short
positions)
Notional amount Carrying amount Notional amount
Austria
[ 0 - 3M [ 0 0 0 0 0 0 0 0 0 0 0 0
[ 3M - 1Y [ 0 0 0 0 0 0 0 0 0 0 0 0
[ 1Y - 2Y [ 0 0 0 0 0 0 0 0 0 0 0 0
[ 2Y - 3Y [ 0 0 0 0 0 0 0 0 0 0 0 0
[3Y - 5Y [ 0 0 0 0 0 0 0 0 0 0 0 0
[5Y - 10Y [ 0 0 0 0 0 0 0 0 0 0 0 0
[10Y - more 0 0 0 0 0 0 0 0 0 0 0 0Total 0 0 0 0 0 0 0 0 0 0 0 0 0
[ 0 - 3M [ 0 0 0 0 0 0 0 0 0 0 0 0
[ 3M - 1Y [ 0 0 0 0 0 0 0 0 0 0 0 0
[ 1Y - 2Y [ 0 0 0 0 0 0 0 0 0 0 0 0
[ 2Y - 3Y [ 0 0 0 0 0 0 0 0 0 0 0 0
[3Y - 5Y [ 0 0 0 0 0 0 0 0 0 0 0 0
[5Y - 10Y [ 0 0 0 0 0 0 0 0 0 0 0 0
[10Y - more 0 0 0 0 0 0 0 0 0 0 0 0
Total 0 0 0 0 0 0 0 0 0 0 0 0 0
Notes and definitions
(2) The exposures reported cover only exposures to central, regional and local governments on immediate borrower basis, and do not include exposures to other counterparts with full or partial government guarantees
(3) The banks disclose the exposures in the "Financial assets held for trading" portfolio after offsetting the cash short positions having the same maturities.
(4) The exposures reported include the positions towards counterparts (other than sovereign) on sovereign credit risk (i.e. CDS, financial guarantees) booked in all the accounting portfolio (on-off balance sheet). Irrespective of the denomination and or accounting classification of the positions the economic substance over the form must be used as a criteria for the identification of the exposures to be included in this column. This item does not include exposures to counterparts (other than sovereign) with full or partial government guarantees by central, regional and local governments
Regions:
Other advanced non EEA: Israel, Korea, New Zealand, Russia, San Marino, Singapore and Taiwan.
Other CEE non EEA: Albania, Bosnia and Herzegovina, FYR Macedonia, Montenegro, Serbia and Turkey.
Middle East: Bahrain, Djibouti, Iran, Iraq, Jordan, Kuwait, Lebanon, Libya, Oman, Qatar, Saudi Arabia, Sudan, Syria, United Arab Emirates and Yemen.
(1) Information on sovereign exposures is only available for institutions that have sovereign exposures of at least 1% of total “Debt securities and loans receivables”. Country of breakdown is only available for institutions that hold non-domestic sovereign exposures of 10% or more compared to total
sovereign exposures. Where the latter threshold is not met, information is disclosed through the aggregate "Others".
(5) Residual countries not reported separately in the Transparency exercise
Latin America: Argentina, Belize, Bolivia, Brazil, Chile, Colombia, Costa Rica, Dominica, Dominican Republic, Ecuador, El Salvador, Grenada, Guatemala, Guyana, Haiti, Honduras, Jamaica, Mexico, Nicaragua, Panama, Paraguay, Peru, St. Kitts and Nevis, St. Lucia, St. Vincent and the Grenadines, Suriname, Trinidad and Tobago, Uruguay, Venezuela,Antigua And Barbuda, Aruba, Bahamas, Barbados, Cayman Islands, Cuba, French Guiana, Guadeloupe, Martinique, Puerto
Rico, Saint Barthélemy, Turks And Caicos Islands, Virgin Islands (British), Virgin Islands (U.S. ).
Africa: Algeria, Egypt, Morocco, South Africa, Angola, Benin, Botswana, Burkina Faso, Burundi, Cameroon, Cape Verde, Central African Republic, Chad, Comoros, Congo, Congo, The Democratic Republic Of The, Côte D'Ivoire, Equatorial Guinea, Eritrea, Ethiopia, Gabon, Gambia, Ghana, Guinea, Guinea-Bissau, Kenya, Lesotho, Liberia, Madagascar, Malawi, Mali, Mauritius, Mauritania, Mozambique, Namibia, Niger, Nigeria, Rwanda, Sao Tome And Principe, Senegal,
Seychelles, Sierra Leone, South Sudan, Swaziland, Tanzania, United Republic Of, Togo, Uganda, Zambia, Zimbabwe and Tunisia.
Africa
Others
Information disclosed in this template is sourced from COREP template C 33, introduced with the reporting framework 2.7, applicable for reports as of 31 march 2018.

201712 201712 201712 201712 201712 201712 201712 201806 201806 201806 201806 201806 201806 201806
(mln EUR)
Of which:
defaulted
Of which:
defaulted
Debt securities (including at amortised cost and fair value) 58,315 1,260 813 45 -624 430 0 46,377 1,647 409 38 24 355 0
Central banks 29 0 0 0 0 0 0 17 0 0 0 0 0 0
General governments 39,141 0 0 0 0 0 0 26,268 0 0 0 1 0 0
Credit institutions 3,706 0 0 0 0 0 0 3,706 0 0 0 0 0 0
Other financial corporations 12,868 0 18 9 -626 3 0 13,910 0 22 22 2 0 0
Non-financial corporations 2,571 1,260 795 37 2 427 0 2,476 1,647 387 16 21 355 0
Loans and advances(including at amortised cost and fair value) 593,331 2,351 14,530 9,010 546 1,934 10,175 615,444 2,242 12,995 8,383 1,724 1,725 9,756
Central banks 63,995 0 0 0 0 0 0 75,055 0 0 0 0 0 0
General governments 1,479 0 0 0 0 0 0 1,247 0 0 0 1 0 0
Credit institutions 4,801 0 37 32 0 0 0 7,410 0 5 3 1 0 0
Other financial corporations 41,130 0 504 504 21 143 9 54,555 1 59 59 57 26 7
Non-financial corporations 94,806 91 2,577 2,544 272 889 892 93,980 79 2,849 2,833 751 903 1,211
of which: small and medium-sized enterprises at amortised cost 35,959 44 948 931 119 89 470 38,449 47 900 890 364 68 831
Households 387,120 2,259 11,412 5,931 254 901 9,274 383,197 2,162 10,082 5,488 913 796 8,537
DEBT INSTRUMENTS other than HFT 651,647 3,611 15,343 9,056 -77 2,365 10,175 661,821 3,889 13,403 8,421 1,748 2,080 9,756
OFF-BALANCE SHEET EXPOSURES 150,039 405 293 0 0 0 166,577 433 318 277 3 0
(1) For the definition of non-performing exposures please refer to COMMISSION IMPLEMENTING REGULATION (EU) 2015/227 of 9 January 2015, ANNEX V, Part 2-Template related instructions, subtitle 29(2) Insitutions report here collective allowances for incurrred but not reported losses (instruments at amortised cost) and changes in fair value of performing exposures due to credit risk and provisions (instruments at fair value other than HFT)(3) Insitutions report here specific allowances for financial assets, individually and collectively estimated (instruments at amortised cost) and changes in fair value of NPE due to credit risk and provisions (instruments at fair value other than HFT)
Accumulated impairment,
accumulated changes in fair
value due to credit risk and
provisions4
2018 EU-wide Transparency ExercisePerforming and non-performing exposures
Lloyds Banking Group Plc
As of 31/12/2017 As of 30/06/2018
On non-
performing
exposures3
(4) For the on-balance sheet items, accumulated impairments and accumulated negative changes in fair value due to credit risk are disclosed with a positive sign if they are decreasing assets. Following this sign convention, information is disclosed with the opposite sign of what is reported according to the FINREP framework (templates F 18.00 / F 19.00), which follows a sign convention
based on a credit/debit convention, as explained in Annex V, Part 1 paragraphs 9 and 10 of Regulation (EU) No 680/2014 - ITS on Supervisory reporting. However, for the off-balance sheet instruments, the same item (‘Accumulated impairment, accumulated changes in fair value due to credit risk and provisions’) is disclosed consistently with the FINREP sign convention. This is because,
based on this sign convention, the provisions on off-balance sheet commitments are generally reported with a positive sign.
Collaterals and
financial
guarantees
received on non-
performing
exposures
Of which
performing but
past due >30
days and <=90
days
Of which non-performing1
On performing
exposures2
On non-
performing
exposures3
Of which
performing but
past due >30
days and <=90
days
Of which non-performing1
On performing
exposures2
Gross carrying amount
Accumulated impairment,
accumulated changes in fair
value due to credit risk and
provisions4
Collaterals and
financial
guarantees
received on non-
performing
exposures
Gross carrying amount

201712 201712 201712 201712 201712 201806 201806 201806 201806 201806
(mln EUR)
Debt securities (including at amortised cost and fair value) 45 45 29 29 0 38 38 16 0 0
Central banks 0 0 0 0 0 0 0 0 0 0
General governments 0 0 0 0 0 0 0 0 0 0
Credit institutions 0 0 0 0 0 0 0 0 0 0
Other financial corporations 9 9 3 3 0 22 22 0 0 0
Non-financial corporations 37 37 26 26 0 16 16 16 0 0
Loans and advances (including at amortised cost and fair value) 13,370 9,543 1,734 1,442 9,560 12,149 8,614 2,121 1,292 8,452
Central banks 0 0 0 0 0 0 0 0 0 0
General governments 0 0 0 0 0 0 0 0 0 0
Credit institutions 32 32 0 0 0 3 3 1 0 0
Other financial corporations 527 504 166 143 10 109 59 46 26 7
Non-financial corporations 3,505 2,526 1,113 872 1,486 3,738 2,804 1,630 886 1,211
of which: small and medium-sized enterprises at amortised cost 1,407 919 184 83 796 1,372 873 379 65 904
Households 9,306 6,482 455 426 8,064 8,299 5,749 443 381 7,234
DEBT INSTRUMENTS other than HFT 13,415 9,589 1,762 1,470 9,560 12,186 8,652 2,137 1,292 8,452
Loan commitments given 454 297 0 0 0 559 310 3 1 0
(1) For the definition of forborne exposures please refer to COMMISSION IMPLEMENTING REGULATION (EU) 2015/227 of 9 January 2015, ANNEX V, Part 2-Template related instructions, subtitle 30
2018 EU-wide Transparency ExerciseForborne exposures
Lloyds Banking Group Plc
As of 31/12/2017 As of 30/06/2018
(2) For the on-balance sheet items, accumulated impairments and accumulated negative changes in fair value due to credit risk are disclosed with a positive sign if they are decreasing assets. Following this sign convention, information is disclosed with the opposite sign of what is reported according to the FINREP framework (templates F 18.00 / F 19.00), which follows a sign convention based on a
credit/debit convention, as explained in Annex V, Part 1 paragraphs 9 and 10 of Regulation (EU) No 680/2014 - ITS on Supervisory reporting. However, for the off-balance sheet instruments, the same item (‘Accumulated impairment, accumulated changes in fair value due to credit risk and provisions’) is disclosed consistently with the FINREP sign convention. This is because, based on this sign convention,
the provisions on off-balance sheet commitments are generally reported with a positive sign.
Collateral and financial
guarantees received on
exposures with
forbearance measures
Of which non-
performing
exposures with
forbearance
measures
Of which on non-
performing
exposures with
forbearance
measures
Of which non-
performing
exposures with
forbearance
measures
Of which on non-
performing
exposures with
forbearance
measures
Gross carrying amount of exposures
with forbearance measures
Accumulated impairment, accumulated
changes in fair value due to credit risk and
provisions for exposures with forbearance
measures2
Collateral and financial
guarantees received on
exposures with
forbearance measures
Gross carrying amount of exposures
with forbearance measures
Accumulated impairment, accumulated
changes in fair value due to credit risk and
provisions for exposures with forbearance
measures2


![DEPARTMENT OF PUBLIC WORKS AND HIGHWAYS J]jj ~ OFFICE … · 2017. 1. 3. · l>D ~ •• 17~.('.~,.,- Guidelines and Procedures in the Recognition and Derecognition of Infrastructure](https://static.documents.pub/doc/80x56/607c25790bc20f75fe65c4b8/department-of-public-works-and-highways-jjj-office-2017-1-3-ld-aa.jpg)


